draft brown's creek impaired biota tmdl · brown’s creek watershed district (bcwd) in the...
TRANSCRIPT

Prepared by: Emmons & Olivier Resources, Inc.for the Washington Conservation District, Brown’s Creek Watershed District, and the Minnesota Pollution Control Agency
July 2010
DRAFT Brown’s Creek Impaired Biota TMDL
w a t e re c o l o g yc o m m u n i t y
wq-iw6-05b

TMDL Summary Table EPA/MPCA Required
Elements Summary TMDL Page #
Location Brown’s Creek Watershed District (BCWD) in the Upper Mississippi Basin in Washington County, Central MN 1
303(d) Listing Information
Describe the water body as it is identified on the State/Tribe’s 303(d) list: · Brown’s Creek; T30 R20W S18, west line to St Croix
River; river ID 07030005-520 · Impaired Beneficial Use(s) - Aquatic life · Indicator: Lack of a coldwater assemblage, turbidity · Target start/completion date: 2007/2009, 2010/2012 · Original listing year: 2008, 2010
1
Applicable Water Quality Standards/ Numeric Targets
Biota: narrative standard; the water body should support a coldwater fisheries assemblage TSS/turbidity: target concentration of 23 mg/L based on the TSS equivalent of the turbidity standard (10 NTU) in Brown’s Creek Temperature: No numeric standard; brown trout threat temperature (18.3°C or 65°F) was used as a numeric target
24
25
26
28
Loading Capacity (expressed as daily
load)
Under mid-range flow conditions: TSS: LC = 1,049 lbs TSS/day Thermal load: LC = 1,589 million KJ/day Critical condition is the summer when aquatic life activity and biomass production are at their highest
TSS: 39 Temp: 44
48
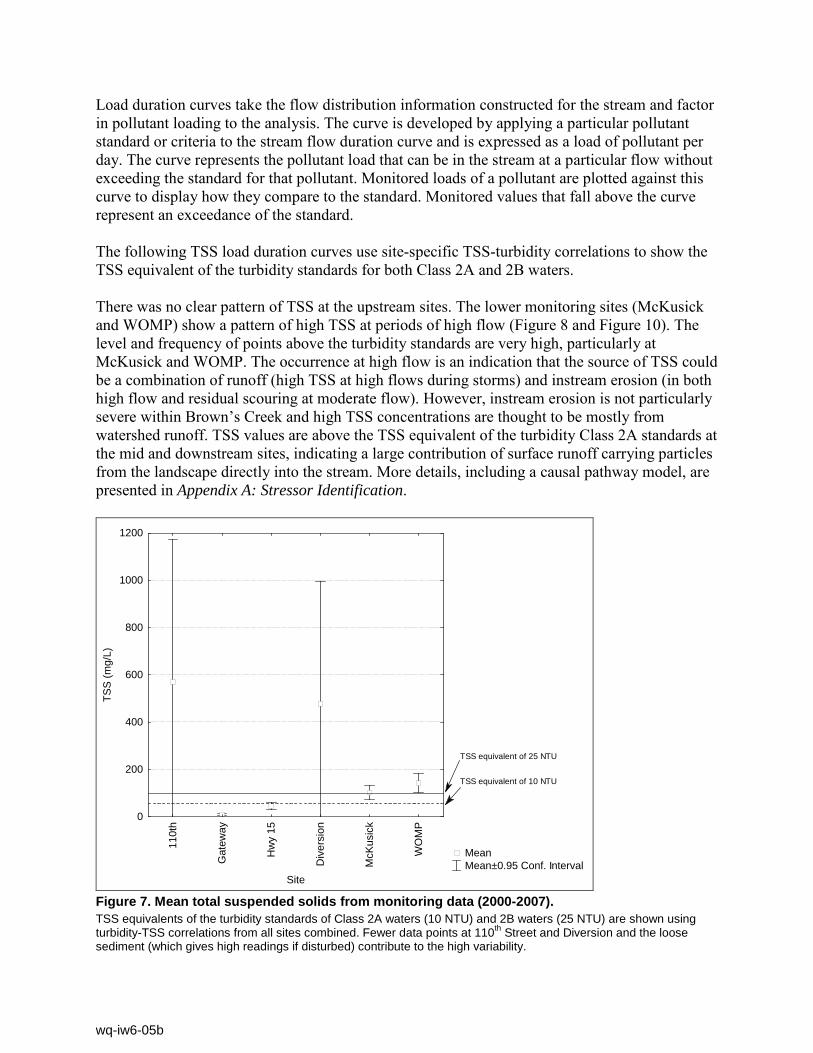
Wasteload Allocation Under mid-range flow conditions: TSS: WLA = 103 lbs TSS/day Thermal load: WLA = 32 million KJ/day
TSS: 39 Temp: 46
Load Allocation Under mid-range flow conditions: TSS: LA = 946 lbs TSS/day Thermal load: LA = 1,557 million KJ/day
TSS: 39 Temp: 46
Margin of Safety Implicit MOS: Use of load duration curves; BMP accounting; use of threat temperature 34
Seasonal Variation
The critical condition for aquatic organisms is the summer when the aquatic life activity and biomass production are at their highest levels. Assessing the biology during the summer months evaluates the biological performance during the most critical time of the year.
48
Reasonable Assurance
Summarize Reasonable Assurance BCWD Watershed Management Plan and Rules Municipal planning efforts NPDES regulated MS4s Funding programs
49
Monitoring Monitoring Plan included? yes 60
Implementation 1. Implementation Strategy included? yes 2. Cost estimate included? yes
54 59
Public Participation
· Public Comment period · Comments received? · Summary of other key elements of public participation
process
62
wq-iw6-05b

Technical Advisory Committee (TAC) Members Attendee and invitees at one of more of the TAC meetings included the following:
· Brown’s Creek Watershed District: o Karen Kill o Rick Vanzwol
· City of Grant o Dianne Hankee
· City of Hugo o Steve Duff
· City of Stillwater o Torry Kraftson o Shawn Sanders
· Emmons & Olivier Resources (Consultant) o Toben Lafrancois o Jason Naber o Gary Oberts o Andrea Plevan o Marcey Westrick
· Metropolitan Council o Jack Frost
· Minnesota Department of Natural Resources o Brian Nerbonne o Molly Shodeen o Nick Proulx
· Minnesota Pollution Control Agency o Craig Affeldt o Chandra Carter o Jeffrey Jasperson o Christopher Klucas o Kim Laing o Joe Magner o Amy Phillips o Anna Kerr
· National Park Service o Byron Karns
· St. Croix Research Station o Jim Almendinger
· University of Minnesota o Calvin Alexander o Scott Alexander o Len Ferrington, Jr. o Mark Green o Bruce Vondracek
· Washington Conservation District o Erik Anderson o Jessica Arendt o Jay Riggs o Travis Thiel
· Washington County o Amanda Strommer o Jessica Collin-Pilarski
wq-iw6-05b

Additional Subcontractors Len Ferrington, Jr.: University of Minnesota Department of Entomology Scott Alexander: University of Minnesota Department of Geology and Geophysics
wq-iw6-05b

Table of Contents Executive Summary .................................................................................................................................. vii 1. Identification of Water Body, Pollutant of Concern, Pollutant Sources, and Priority Ranking .. 1
A. 303(D) Listing ................................................................................................................................... 1 B. Background ...................................................................................................................................... 1
Watershed Description ......................................................................................................................... 2 Land Use .............................................................................................................................................. 5 Land Cover ........................................................................................................................................... 5 Soils .................................................................................................................................................... 10 Population ........................................................................................................................................... 12
C. Stressor Identification and Impairment Assessment ...................................................................... 12 Suspended Sediment ......................................................................................................................... 13 Temperature ....................................................................................................................................... 17 Copper ................................................................................................................................................ 21
2. Biological and Water Quality Standards and Goals ..................................................................... 24 A. Suspended Sediment ..................................................................................................................... 24 B. Turbidity ......................................................................................................................................... 25 C. Temperature ................................................................................................................................... 26 D. Copper............................................................................................................................................ 26
3. Loading Capacity and TMDL Allocations – Linking Water Quality, Physical Habitat, and Pollutant Sources ...................................................................................................................................... 29
A. Approach ........................................................................................................................................ 29 B. NPDES-Permitted Pollutant Sources ............................................................................................. 32 C. Margin of Safety ............................................................................................................................. 34 D. Suspended Sediment ..................................................................................................................... 34
TSS Sources ...................................................................................................................................... 35 TSS Loading Capacity ........................................................................................................................ 39 TSS Allocation Summary ................................................................................................................... 39
E. Temperature ................................................................................................................................... 42 Heat Load Sources ............................................................................................................................. 42 Heat Loading Capacity ....................................................................................................................... 44 Heat Allocation Summary ................................................................................................................... 46
F. Critical Conditions and Seasonal Variation .................................................................................... 48 4. Reasonable Assurances .................................................................................................................. 49
A. Brown’s Creek Watershed District Watershed Management Plan and Rules ............................... 49 BCWD 3rd Generation Watershed Management Plan ........................................................................ 49 BCWD Rules ...................................................................................................................................... 49
B. Municipal Planning Efforts ............................................................................................................. 51 C. NPDES Regulated MS4s ............................................................................................................... 51 D. Funding Programs .......................................................................................................................... 52
Watershed and Conservation District Projects and Programs ........................................................... 52 Section 319 Nonpoint Source Grants ................................................................................................. 52 Clean Water Legacy ........................................................................................................................... 53
5. Implementation Strategy ................................................................................................................. 54 A. Reduction of Algaecide and Fungicide Use ................................................................................... 55 B. Riparian Habitat Enhancement ...................................................................................................... 55 C. Stormwater Management ............................................................................................................... 56
Regulatory Controls ............................................................................................................................ 56 Urban Stormwater Retrofits ................................................................................................................ 57 Agricultural Best Management Practices ........................................................................................... 57 Wetland Restoration ........................................................................................................................... 58 Education ............................................................................................................................................ 58
D. Groundwater Management ............................................................................................................ 58 E. Cost Estimate ................................................................................................................................. 59
wq-iw6-05b

6. Monitoring Plan ................................................................................................................................ 60 7. Public Participation .......................................................................................................................... 62
A. TAC Meetings ................................................................................................................................ 62 Meeting summaries ............................................................................................................................ 62 TAC meeting invitees and attendees ................................................................................................. 64
B. Stakeholder/Public Input ................................................................................................................ 65 C. Public Comment Period ................................................................................................................. 65
8. References ........................................................................................................................................ 66 9. Appendices ....................................................................................................................................... 67 List of Figures Figure 1. Location of the Brown’s Creek Watershed and Monitoring Sites .................................................. 3 Figure 2. Contributing and Landlocked Drainage in the Brown’s Creek Watershed .................................... 4 Figure 3. Existing Land Use in the Brown’s Creek Watershed ..................................................................... 7 Figure 4. 2020 Land Use ............................................................................................................................... 8 Figure 5. Brown's Creek Watershed Land Cover ......................................................................................... 9 Figure 6. Hydrologic Soil Groups Map ........................................................................................................ 11 Figure 7. Mean total suspended solids from monitoring data (2000-2007). ............................................... 14 Figure 8. Load duration curves for TSS monitoring data at McKusick, 2000-2007. ................................... 15 Figure 9. Load duration curves for TSS monitoring data at McKusick, 2000-2007, partial representation of data ............................................................................................................................................................. 15 Figure 10. Load duration curves for TSS monitoring data at WOMP, 2000-2007. ..................................... 16 Figure 11. Load duration curves for TSS monitoring data at WOMP, 2000-2007, partial representation of data ............................................................................................................................................................. 16 Figure 12. Temperature (°C) in Brown's Creek, Highway 15, 2007 monitoring data. ................................. 18 Figure 13. Temperature (°C) in Brown's Creek, McKusick, 2007 monitoring data. .................................... 18 Figure 14. Frequency of 15 minute periods above brown trout threat temperature (65° F, 18° C) at Highway 15, Brown’s Creek, 2007. ............................................................................................................. 19 Figure 15. Frequency of 15 minute periods above brown trout threat temperature (65° F, 18° C) at McKusick, Brown’s Creek, 2007. ................................................................................................................ 19 Figure 16. Consecutive hours above brown trout threat temperature (18.3°C, 65°F) at Highway 15, Brown's Creek, 2007. .................................................................................................................................. 20 Figure 17. Consecutive hours above brown trout threat temperature (18.3°C, 65°F) at McKusick, Brown's Creek, 2007. ................................................................................................................................................ 20 Figure 18. Fish sampling data from 2008 showing counts of cold water fish (brown trout) and warm water fish (minnows and chub) from upstream (site 4, near Highway 15) to downstream (site 12, near the confluence with the St. Croix). .................................................................................................................... 21 Figure 19. Copper concentration monitoring data from WOMP, Brown's Creek, with hardness corrected standards..................................................................................................................................................... 22 Figure 20. Total copper water quality duration curve from WOMP, Brown’s Creek, with points above the hardness corrected standard indicated. ...................................................................................................... 23 Figure 21. TSS-turbidity relationship at McKusick ...................................................................................... 25 Figure 22. Flow duration interval, 2000-2007, WOMP ................................................................................ 30 Figure 24. Average Annual TSS Added Between Stations ......................................................................... 37 Figure 25. Existing Pollutant Removal Efficiency ....................................................................................... 38 Figure 26. TSS Reduction Goals to Meet TSS Standard ........................................................................... 41 Figure 27. Daily mean temperatures at all stations, 2007 .......................................................................... 43 Figure 28. August 2007 Temperature Exceedance, WOMP site ................................................................ 44 Figure 29. Heat Load Duration Curve, 2000-2007, WOMP site ................................................................. 45
wq-iw6-05b

List of Tables Table 1. Listing information ........................................................................................................................... 1 Table 2. Municipality areas within the Brown’s Creek watershed ................................................................. 2 Table 3. Brown’s Creek watershed land use summary ................................................................................ 5 Table 4. Hydrologic soil groups ................................................................................................................... 10 Table 5. Current population and population forecasts for cities within the Brown’s Creek Watershed. ..... 12 Table 6. Average hardness (mg/L) for water quality samples in Brown’s Creek. ....................................... 28 Table 7. Runoff volume distribution ............................................................................................................ 31 Table 8. NPDES permits within BCWD ....................................................................................................... 34 Table 9. P8 Results Along Brown’s Creek for an Average Year................................................................. 36 Table 10. TSS loading capacity .................................................................................................................. 39 Table 11. TSS Reductions Needed ............................................................................................................ 39 Table 12. TSS load and wasteload allocation summary ............................................................................. 40 Table 13. TSS percent reductions by municipality ...................................................................................... 40 Table 14. Heat loading capacity .................................................................................................................. 44 Table 15. Comparison of baseflow estimation methods for a truncated time period .................................. 46 Table 16. Baseflow Contributions by Flow Range ...................................................................................... 46 Table 17. Heat load and wasteload allocation summary ............................................................................ 47 Table 18. Thermal load percent reductions by municipality ........................................................................ 47 Table 19. Implementation actions ............................................................................................................... 55 Abbreviations BCWD Brown’s Creek Watershed District CADDIS Causal Analysis/Diagnosis Decision Information System DNR Minnesota Department of Natural Resources EPA U.S. Environmental Protection Agency IBI Index of biotic integrity MPCA Minnesota Pollution Control Agency SWPPP Stormwater Pollution Prevention Program/Plan TAC Technical advisory committee TSS Total suspended solids WCD Washington Conservation District WOMP Watershed outlet monitoring program
wq-iw6-05b

Executive Summary The Clean Water Act (CWA) Section 303 (d) mandates that the Minnesota Pollution Control Agency (MPCA) assess the condition of their aquatic resources to ensure the maintenance of both aquatic life and beneficial uses. Specific water bodies that fail to meet the aquatic life and beneficial uses criteria developed by states (in CWA 303 (d)) are submitted to the United States Environmental Protection Agency (U.S. EPA) under CWA Section 305 (b). Once water bodies are listed as impaired, stressors causing impairment must be identified, and remediation efforts, including development of total maximum daily loads (TMDLs) for identified pollutants, need to be initiated. Brown’s Creek is located in the Brown’s Creek Watershed District (BCWD) in the St. Croix River basin in eastern Minnesota. Brown’s Creek has an approximate 19,000-acre watershed that includes a significant portion of rural and agricultural areas. The watershed includes portions of the City of Stillwater, City of Oak Park Heights, City of Lake Elmo, City of Grant, City of Hugo, May Township, and Stillwater Township. This TMDL report addresses two impairments on the stretch of Brown’s Creek from Highway 15 to the St. Croix River (river ID 07030005-520); the reach is impaired for aquatic life due to a lack of a cold water fish assemblage and due to high turbidity. This reach is classified as a Class 2A stream. The TMDL study entailed analysis of existing data, intensive water quality and biological surveys of the creek, completion of the stressor identification process, watershed modeling, and the development of implementation strategies to meet the goals of the TMDLs. Through the stressor identification process, the primary stressors to the biota in the impaired reach of Brown’s Creek were identified as high suspended solids, high temperatures, and high copper concentrations. The TMDL is based on total suspended solids, which also serves as the surrogate measure for the turbidity impairment, and thermal load, which addresses the temperature stressor. Due to uncertainties related to the reliability of the copper monitoring data, copper loading allocations were not developed. The water quality targets for this TMDL are 23 mg/L TSS and 18.3°C (65°F). The average annual TSS load to the creek will need to be decreased by 74% to reach the target TSS concentration. The average thermal load will need to be decreased by 6%. Sediment and thermal load reductions will be achieved through a combination of stormwater management, riparian habitat enhancement, and groundwater management. Stormwater management will consist of a combination of regulatory controls, urban stormwater retrofits, agricultural best management practices, wetland restoration, and education.
wq-iw6-05b

1. Identification of Water Body, Pollutant of Concern, Pollutant Sources,
and Priority Ranking A. 303(D) L is ting
Table 1. Listing information
Name Description River ID Pollutant or Stressor
Affected Use
Year First
Listed
Target Start/ Completion
(reflects priority ranking)
CALM Category*
Brown’s Creek
T30 R20W S18, west line to St Croix River
07030005-520
Lack of a coldwater
assemblage
Aquatic life 2008 2007/2009 5A
Brown’s Creek
T30 R20W S18, west line to St Croix River
07030005-520 Turbidity Aquatic
life 2010 2010/2012 5A
*5A: Impaired by multiple pollutants and no TMDL study plans are approved by EPA
B . B ac kground
Brown’s Creek is located in the Brown’s Creek Watershed District (BCWD) in the St. Croix River basin in eastern Minnesota (Figure 1). Brown’s Creek was listed on the 303(d) list of impaired water bodies in 2002 for aquatic life impairment based on a low IBI for Class 2B1
Figure 1
streams. Since this initial listing, the stream segments have changed, the classification of some of the segments was changed, and additional impairments were added. This TMDL report addresses two impairments on the stretch of Brown’s Creek from Highway 15 to the St. Croix River (river ID 07030005-520); the reach is impaired for aquatic life due to a lack of a cold water fish assemblage and due to high turbidity ( ). This reach is currently classified as a Class 2A2
stream.
The Brown’s Creek watershed is within the watershed of Lake St. Croix and Lake Pepin, which are both on the 303(d) waters list for an aquatic life use impairment due to excessive nutrients. Although the Brown’s Creek TMDL does not directly address nutrients, practices implemented to address the Brown’s Creek TMDL will be aimed at reducing suspended sediment and reducing the volume of runoff delivered to the creek. These practices will also reduce nutrients delivered to downstream water bodies, thus making progress towards meeting the Lake St. Croix and Lake Pepin nutrient loading goals.
1 Class 2B waters are protected so as to permit cool or warm water fisheries, associated aquatic life, and their habitats (MN Rule 7050.0222, Subp. 3 and 4). 2 Class 2A waters are protected to permit the propagation and maintenance of a healthy community of cold water sport or commercial fish and associated aquatic life, and their habitats (MN Rule 7050.0222, Subp. 2).
wq-iw6-05b

Watershed Description
Brown’s Creek has an approximate 19,000-acre watershed that includes a significant portion of rural and agricultural areas. The watershed includes portions of the City of Stillwater, City of Oak Park Heights, City of Lake Elmo, City of Grant, City of Hugo, May Township, and Stillwater Township (Table 2). The lakes in Hugo and May Township form the headwaters of Brown’s Creek (Figure 1). The creek begins in May Township and flows south through the City of Grant, with much of this portion of the drainage-way consisting of broad, low-lying wetlands. Brown’s Creek continues through Stillwater Township and the City of Stillwater as a narrow meandering flowage with gentle side slopes transitioning to steep bluffs as it continues to the St. Croix River. Approximately 51 percent of the Brown’s Creek watershed flows regularly overland or is semi-landlocked. The remaining 49 percent is composed of landlocked basins producing no regular overland flows to Brown’s Creek (Figure 2). The subwatersheds identified (Figure 2) as landlocked under the 5-year event have their runoff diverted from the creek for rainfall events less than the 5-year storm; larger storms bypass this diversion structure and reach the creek. The subwatersheds identified as landlocked under the 100-year event were identified in previous BCWD hydrologic and hydraulic modeling studies and contribute stormwater to the creek under events larger than the 100-year storm. Table 2. Municipality areas within the Brown’s Creek watershed
Municipality Area (ac) Percent Area City of Stillwater 2,387 12.9% City of Oak Park Heights 384 2.1% City of Lake Elmo 260 1.4% City of Grant 9,218 49.8% City of Hugo 2,251 12.2% May Township 2,082 11.2% Stillwater Township 1,924 10.4% Baytown Twp 1 0.0% Total 18,507
wq-iw6-05b

Figure 1. Location of the Brown’s Creek Watershed and Monitoring Sites
wq-iw6-05b

Figure 2. Contributing and Landlocked Drainage in the Brown’s Creek Watershed
wq-iw6-05b

Land Use
Based on the Metropolitan Council’s 2005 Generalized Land Use Classification, the Brown’s Creek watershed consists of several land uses including airports, commercial, industrial, farmsteads, highways, residential, open water, parks and recreation, public, semi-public, and agriculture (Table 3). The upper part of the watershed contains mostly undeveloped, agricultural, and single family residential land uses, while the lower part of the watershed is more developed, with greater proportions of single family residential and other developed land uses (Figure 3). Table 3. Brown’s Creek watershed land use summary Data from Metropolitan Council’s 2005 Generalized Land Use Classification. See http://www.datafinder.org/metadata/landuse_2005.htm for metadata.
Land Use Classification Area (Acres) % Land Use
Agriculture 4,336 23.4% Farmstead 183 1% Golf Course 687 3.7% Industrial and Utility 53 0.3% Institutional 104 0.6% Major Highway* 89 0.5% Multifamily 55 0.3% Office 24 0.1% Park, Recreational, or Preserve 563 3.0 Retail and Other Commercial 312 1.7% Seasonal/Vacation 2 0.0% Single Family Attached 117 0.6% Single Family Detached 3,135 16.9% Undeveloped* 7,504 40.6% Water 1,343 7.3% Total 18,507 100.0% * Undeveloped: Land not currently used for any defined purpose that may or may not contain buildings or other structures or has no discernable use based on the aerial photos or available data. Undeveloped may include non-protected wetlands or lands currently under development. Major Highway: Major roadway strips of land or area, on which a vehicular rights-of-passage exists under the following conditions: all interstate highways; all 4-lane divided highways with rights-of-way of 200 feet or greater in width; or all 4-lane roads with a Metropolitan Council functional class designation of 'Principal Arterial' The scale of the projected land use (Regional Planned Land Use - Twin Cities Metropolitan Area) data set is much coarser than the existing land use (Figure 4), with the majority of the watershed classified as rural or large-lot residential. Large changes in the watershed are currently not expected, with the developed regions remaining relatively stable and the less developed areas not experiencing substantial growth.
Land Cover
The land cover within the watershed is highly variable with a mix of urban, forests, wetlands, grasslands, cropland and lakes. Figure 5 shows the Minnesota Land Cover Classification System (MLCCS) land covers for the watershed. The land cover within BCWD will gradually increase in imperviousness throughout the western portion of the watershed. The increase in impervious
wq-iw6-05b

surfaces in the eastern part of the watershed will likely not increase significantly, as the area is already heavily developed.
wq-iw6-05b

Figure 3. Existing Land Use in the Brown’s Creek Watershed (Generalized Land Use 2005 for the Twin Cities Metropolitan Area)
wq-iw6-05b

Figure 4. 2020 Land Use (Regional Planned Land Use for the Twin Cities Metropolitan Area)
wq-iw6-05b
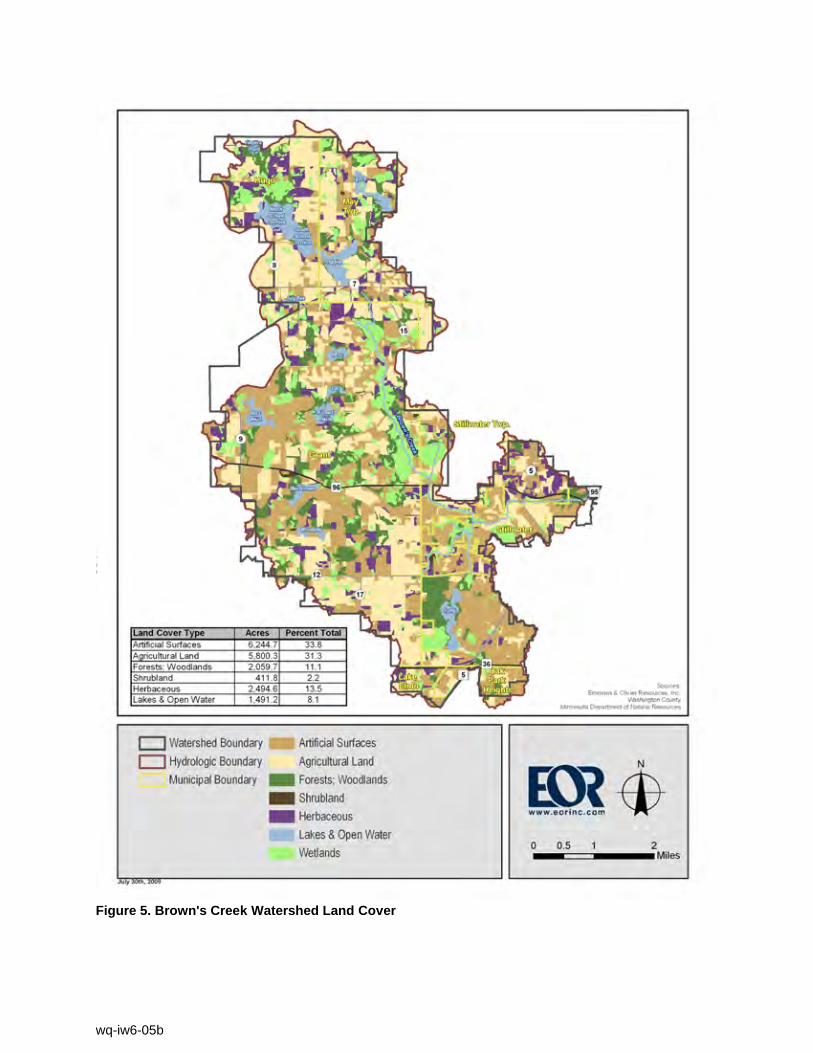
Figure 5. Brown's Creek Watershed Land Cover
wq-iw6-05b

Soils
Soils are classified into groups based upon the hydrologic characteristics of the soils (Figure 6). Soil hydrologic characteristics influence the amount of runoff generated for a given rainfall event. Vegetation, organic/mineral or physical composition, and slope all contribute to the runoff potential of a soil. There are four hydrologic soil groups: A, B, C, and D. Table 4 presents a description for each of the hydrologic soil groups and identifies the predominant soil type in the watershed for each group. Table 4. Hydrologic soil groups
Hydrologic Group Description Predominant Soil
Type in BCWD
A Soils having high infiltration rates when thoroughly wet (low runoff potential). Deep, well drained to excessively drained sand or gravelly sand.
Mahtomedi Loamy Sand
B Soils having a moderate infiltration rate when thoroughly wet. Moderately deep or deep, moderately well drained or well drained with moderate to moderately coarse texture.
Antigo Silt Loam
C Soils having a slow infiltration rate when thoroughly wet: soils have a layer that impedes the downward movement of water or soils of moderately fine texture or fine texture.
Ronneby Fine Sandy Loam
D
Soils having very slow rates of infiltration when thoroughly wet (high runoff potential): soils consist of clays with high shrink-swell potential; soils have a high permanent water table; soils that have a claypan or clay layer at or near the surface and soils that are shallow over nearly impervious material.
Seeleyville Muck
Urban Land Areas of development that are covered by asphalt, concrete and buildings.
Source: Soil Survey of Ramsey and Washington Counties, 1977
wq-iw6-05b

Figure 6. Hydrologic Soil Groups Map
wq-iw6-05b

Population
Population is expected to increase in the municipalities within the Brown’s Creek watershed, with greater percent increases projected to occur in the cities of Hugo and Lake Elmo (Table 5). However, the portions of Hugo and Lake Elmo that are projected to experience the high rates of population growth are not within the Brown’s Creek watershed. Table 5. Current population and population forecasts for cities within the Brown’s Creek Watershed.
Municipality Population % Increase
2000-2030 2000 2010 2020 2030
City of Stillwater 15,323 19,100 21,300 19,900 30%
City of Oak Park Heights 3,777 5,500 5,400 5,700 51%
Lake Elmo 6,863 9,952 18,403 24,000 250%
City of Grant 4,026 4,400 4,450 4,500 12%
City of Hugo 6,363 19,100 29,000 40,000 529%
May Township 2,928 3,200 3,600 4,000 37%
Stillwater Township 2,553 2,690 2,940 3,350 31% Data from the Metropolitan Council's 2030 Regional Development Framework - Revised Forecasts as of December 10, 2008. C . S tres s or Identific ation and Impairment As s es s ment
The first step in addressing a biotic impairment is the stressor identification process, an analysis to identify factors causing the impairment. Stressor identification is an important step that eventually helps target the most important causes of the problem. The stressor identification process for this study addressed the biotic impairment on the lower reach that is being addressed in this TMDL, in addition to two other biotic impairments on the upper reach. The upper reach (river ID 07030005-587: from 110th St. to Highway 15) is impaired due to a lack of a cold water fish assemblage and a low macroinvertebrate IBI. It is believed that these two impairments are due to natural causes and delisting of these two impairments is currently being pursued. Data gathered between 2000 and 2008 were compiled and analyzed by a group of experts from a wide range of sciences. This analysis was used to assess the factors leading to the biological impairments of Brown’s Creek. Monitoring data were evaluated against water quality standards, guidelines based on healthy streams, and the physiology of indicator organisms like insects and trout. Standards are set for certain parameters by the State of Minnesota to comply with the Clean Water Act. Guidelines are determined by experienced professionals and are tailored to specific ecological regions and problems. Finally, since the impairment designation for Brown’s Creek is biological, stressors are related to physiological tolerances of key organisms (particularly trout). Correlations, monitoring data, and models of causal pathways were compared to identify mechanisms that explain the biological impairment. All available evidence was investigated using the CADDIS (Causal Analysis/Diagnosis Decision Information System) system of the EPA. This process formalizes causal reasoning in a quantitative checklist that balances the
wq-iw6-05b
strength of evidence from a variety of sources and is a record of the reasoning behind the scientific analysis. In Brown’s Creek, multiple stressors interact with each other to produce conditions that deter the establishment of coldwater fish like trout and produce patterns of invertebrate species that indicate impairment. The stressors identified by the CADDIS process were high suspended sediment, high temperature, low dissolved oxygen, pulses of high copper concentrations, and habitat. Depending on the location in the stream, some stressors of Brown’s Creek are natural, others are caused directly by human actions, and some are indirect effects of changes on the landscape of the Brown’s Creek watershed. It was determined that the primary stressors impacting the two upstream (07030005-587) impairments – lack of coldwater assemblage and aquatic macroinvertebrate bio-assessments – are due to low dissolved oxygen and high temperature. These conditions are believed to be naturally occurring. The low dissolved oxygen is due to a strong input of groundwater into the stream and a natural lack of aeration of the stream flow due to a low gradient and wetland habitat that does not contain riffles. The high temperatures occur in areas that are slow moving with wider channels. A request is being made to the MPCA to remove these two impairments from the 303(d) list of impaired water bodies. The three primary stressors to the downstream impairment were suspended sediment, temperature, and copper. These stressors are most strongly related to the biological impairment and to other stressors (such that mitigating these stressors will positively impact the other secondary stressors). The complete process is documented in Appendix A: Stressor Identification. The TMDL is based on an analysis of these three primary stressors. Suspended Sediment
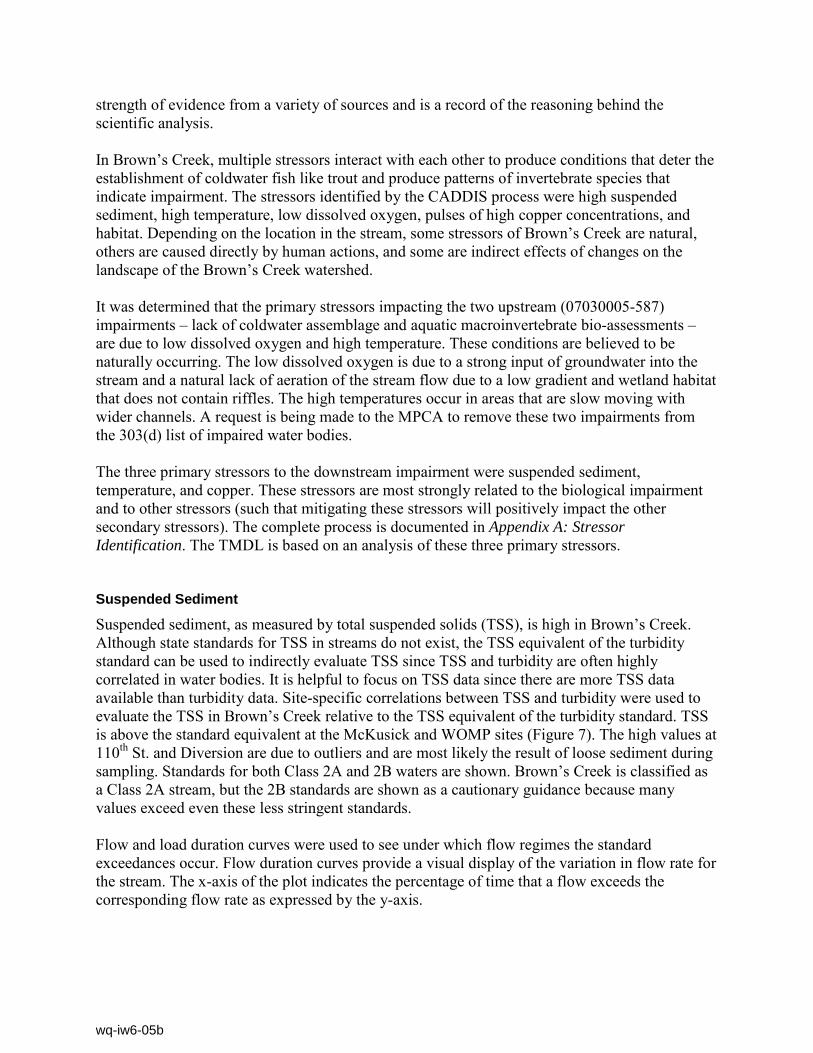
Suspended sediment, as measured by total suspended solids (TSS), is high in Brown’s Creek. Although state standards for TSS in streams do not exist, the TSS equivalent of the turbidity standard can be used to indirectly evaluate TSS since TSS and turbidity are often highly correlated in water bodies. It is helpful to focus on TSS data since there are more TSS data available than turbidity data. Site-specific correlations between TSS and turbidity were used to evaluate the TSS in Brown’s Creek relative to the TSS equivalent of the turbidity standard. TSS is above the standard equivalent at the McKusick and WOMP sites (Figure 7). The high values at 110th St. and Diversion are due to outliers and are most likely the result of loose sediment during sampling. Standards for both Class 2A and 2B waters are shown. Brown’s Creek is classified as a Class 2A stream, but the 2B standards are shown as a cautionary guidance because many values exceed even these less stringent standards. Flow and load duration curves were used to see under which flow regimes the standard exceedances occur. Flow duration curves provide a visual display of the variation in flow rate for the stream. The x-axis of the plot indicates the percentage of time that a flow exceeds the corresponding flow rate as expressed by the y-axis.
wq-iw6-05b
Load duration curves take the flow distribution information constructed for the stream and factor in pollutant loading to the analysis. The curve is developed by applying a particular pollutant standard or criteria to the stream flow duration curve and is expressed as a load of pollutant per day. The curve represents the pollutant load that can be in the stream at a particular flow without exceeding the standard for that pollutant. Monitored loads of a pollutant are plotted against this curve to display how they compare to the standard. Monitored values that fall above the curve represent an exceedance of the standard. The following TSS load duration curves use site-specific TSS-turbidity correlations to show the TSS equivalent of the turbidity standards for both Class 2A and 2B waters. There was no clear pattern of TSS at the upstream sites. The lower monitoring sites (McKusick and WOMP) show a pattern of high TSS at periods of high flow (Figure 8 and Figure 10). The level and frequency of points above the turbidity standards are very high, particularly at McKusick and WOMP. The occurrence at high flow is an indication that the source of TSS could be a combination of runoff (high TSS at high flows during storms) and instream erosion (in both high flow and residual scouring at moderate flow). However, instream erosion is not particularly severe within Brown’s Creek and high TSS concentrations are thought to be mostly from watershed runoff. TSS values are above the TSS equivalent of the turbidity Class 2A standards at the mid and downstream sites, indicating a large contribution of surface runoff carrying particles from the landscape directly into the stream. More details, including a causal pathway model, are presented in Appendix A: Stressor Identification.
Mean Mean±0.95 Conf. Interval
110t
h
Gat
eway
Hw
y 15
Div
ersi
on
McK
usic
k
WO
MP
Site
0
200
400
600
800
1000
1200
TSS
(mg/
L)
TSS equivalent of 25 NTU
TSS equivalent of 10 NTU
Figure 7. Mean total suspended solids from monitoring data (2000-2007). TSS equivalents of the turbidity standards of Class 2A waters (10 NTU) and 2B waters (25 NTU) are shown using turbidity-TSS correlations from all sites combined. Fewer data points at 110th Street and Diversion and the loose sediment (which gives high readings if disturbed) contribute to the high variability.
wq-iw6-05b

0
10,000
20,000
30,000
40,000
50,000
60,000
70,000
80,000
0 10 20 30 40 50 60 70 80 90 100
Flow Duration Interval
TSS
(lbs/
day)
TSS Equivalent of 2A Turbidity Standard
TSS Equivalent of 2B Turbidity Standard
TSS monitoring data 2000-2007
High Flow Moist Conditions Mid-range Flow Dry Conditions
Low Flow
Figure 8. Load duration curves for TSS monitoring data at McKusick, 2000-2007. TSS equivalents of both turbidity standards are shown (10 NTU for Class 2A water and 25 NTU for 2B water).
0
1,000
2,000
3,000
4,000
5,000
6,000
7,000
8,000
9,000
10,000
0 10 20 30 40 50 60 70 80 90 100
Flow Duration Interval
TSS
(lbs/
day)
TSS Equivalent of 2A Turbidity Standard
TSS Equivalent of 2B Turbidity Standard
TSS monitoring data 2000 2007
High Flow Moist Conditions Mid-range Flow Dry Conditions
Low Flow
Figure 9. Load duration curves for TSS monitoring data at McKusick, 2000-2007, partial representation of data Data identical to Figure 8 but zoomed in to show resolution at lower portion of x-axis.
wq-iw6-05b

0
10000
20000
30000
40000
50000
60000
70000
80000
0 10 20 30 40 50 60 70 80 90 100
Flow Duration Interval
TSS
(lbs/
day)
TSS Equivalent of 2A Turbidity StandardTSS Equivalent of 2B Turbidity StandardMonitoring Data 2000-2007
High Flow Moist Conditions Mid-range Flow Dry Conditions
Low Flow
Figure 10. Load duration curves for TSS monitoring data at WOMP, 2000-2007. TSS equivalents of both turbidity standards are shown (10 NTU for Class 2A water and 25 NTU for 2B water).
0
1,000
2,000
3,000
4,000
5,000
6,000
7,000
8,000
9,000
10,000
0 10 20 30 40 50 60 70 80 90 100
Flow Duration Interval
TSS
(lbs/
day)
TSS Equivalent of 2A Turbidity StandardTSS Equivalent of 2B Turbidity StandardMonitoring Data 2000-2007
High Flow Moist Conditions Mid-range Flow Dry Conditions
Low Flow
Figure 11. Load duration curves for TSS monitoring data at WOMP, 2000-2007, partial representation of data Data identical to Figure 10 but zoomed in to show resolution at lower portion of x-axis.
wq-iw6-05b

Temperature
Monitoring data (15-minute interval automated sampling) show that all sites on Brown’s Creek exceed brown trout threat temperatures at some point (see Figures 32 through 46 in Appendix A: Stressor Identification). Examples from midstream (Highway 15) and downstream (McKusick) are shown in Figure 12 and Figure 13. There is no numeric standard for temperature, but high temperatures were quantified with respect to the tolerance of brown trout, using both a threat temperature (18.3°C or 65°F) and a critical temperature (23.9°C or 75°F). Brown trout are sensitive to the frequency of high temperatures (which change trout behavior and have physiological impacts), the duration of these periods (longer durations increase the physiological stress), and the rate of change in temperature (the faster the change in temperature, the greater the degree of stress experienced by the fish). Frequency plots give a visual representation of the intensity of stressful temperature events (Figure 14 and Figure 15). A complete analysis of temperature including a model of causal pathways is included in Appendix A: Stressor Identification. Duration plots show consecutive hours above threat temperatures (Figure 16 and Figure 17). This quantifies the stress the fish are experiencing. Etiological and physiological effects can be observed in durations as low as 24 hours (Myrick et al. 1996). Fisheries biologists generally accept a period of 48 hours as significantly stressful and 72 hours as extremely stressful.
wq-iw6-05b

0
5
10
15
20
25
30
4/3/
2007
4/28
/200
7
5/23
/200
7
6/17
/200
7
7/12
/200
7
8/6/
2007
8/31
/200
7
9/25
/200
7
10/2
0/20
07
Date
Deg
rees
Cel
ciui
s
Monitoring Data, 2007 Brown Trout Threat Temp. Brown Trout Critical Temp.
Figure 12. Temperature (°C) in Brown's Creek, Highway 15, 2007 monitoring data.
0
5
10
15
20
25
30
3/29
/200
7
4/23
/200
7
5/18
/200
7
6/12
/200
7
7/7/
2007
8/1/
2007
8/26
/200
7
9/20
/200
7
10/1
5/20
07
Date
Deg
rees
Cel
cius
Monitoring Data, 2007 Brown Trout Critical Temp. Brown Trout Threat Temp.
Figure 13. Temperature (°C) in Brown's Creek, McKusick, 2007 monitoring data.
wq-iw6-05b

4/1/
2007
4/8/
2007
4/15
/200
7
4/22
/200
7
4/29
/200
7
5/6/
2007
5/13
/200
7
5/20
/200
7
5/27
/200
7
6/3/
2007
6/10
/200
7
6/17
/200
7
6/24
/200
7
7/1/
2007
7/8/
2007
7/15
/200
7
7/22
/200
7
7/29
/200
7
8/5/
2007
8/12
/200
7
8/19
/200
7
8/26
/200
7
9/2/
2007
9/9/
2007
9/16
/200
7
9/23
/200
7
9/30
/200
7
10/7
/200
7
10/1
4/20
07
10/2
1/20
07
10/2
8/20
07
Figure 14. Frequency of 15 minute periods above brown trout threat temperature (65° F, 18° C) at Highway 15, Brown’s Creek, 2007.
4/1/
2007
4/8/
2007
4/15
/200
7
4/22
/200
7
4/29
/200
7
5/6/
2007
5/13
/200
7
5/20
/200
7
5/27
/200
7
6/3/
2007
6/10
/200
7
6/17
/200
7
6/24
/200
7
7/1/
2007
7/8/
2007
7/15
/200
7
7/22
/200
7
7/29
/200
7
8/5/
2007
8/12
/200
7
8/19
/200
7
8/26
/200
7
9/2/
2007
9/9/
2007
9/16
/200
7
9/23
/200
7
9/30
/200
7
10/7
/200
7
10/1
4/20
07
10/2
1/20
07
10/2
8/20
07
Figure 15. Frequency of 15 minute periods above brown trout threat temperature (65° F, 18° C) at McKusick, Brown’s Creek, 2007.
wq-iw6-05b

0
12
24
36
48
60
72
84
96
108
120
132
144
156
4/1/
2007
4/8/
2007
4/15
/200
7
4/22
/200
7
4/29
/200
7
5/6/
2007
5/13
/200
7
5/20
/200
7
5/27
/200
7
6/3/
2007
6/10
/200
7
6/17
/200
7
6/24
/200
7
7/1/
2007
7/8/
2007
7/15
/200
7
7/22
/200
7
7/29
/200
7
8/5/
2007
8/12
/200
7
8/19
/200
7
8/26
/200
7
9/2/
2007
9/9/
2007
9/16
/200
7
9/23
/200
7
9/30
/200
7
10/7
/200
7
10/1
4/20
07
10/2
1/20
07
10/2
8/20
07
Date
Con
secu
tive
Hou
rs A
bove
18.
3°C
Figure 16. Consecutive hours above brown trout threat temperature (18.3°C, 65°F) at Highway 15, Brown's Creek, 2007.
0
12
24
36
48
60
72
84
96
108
120
132
144
156
4/1/
2007
4/8/
2007
4/15
/200
7
4/22
/200
7
4/29
/200
7
5/6/
2007
5/13
/200
7
5/20
/200
7
5/27
/200
7
6/3/
2007
6/10
/200
7
6/17
/200
7
6/24
/200
7
7/1/
2007
7/8/
2007
7/15
/200
7
7/22
/200
7
7/29
/200
7
8/5/
2007
8/12
/200
7
8/19
/200
7
8/26
/200
7
9/2/
2007
9/9/
2007
9/16
/200
7
9/23
/200
7
9/30
/200
7
10/7
/200
7
10/1
4/20
07
10/2
1/20
07
10/2
8/20
07
Date
Con
secu
tive
Hou
rs A
bove
18.
3°C
Figure 17. Consecutive hours above brown trout threat temperature (18.3°C, 65°F) at McKusick, Brown's Creek, 2007.
wq-iw6-05b

Investigation into the invertebrate communities shows that cold water adapted chironomids are found only at the downstream sites near WOMP (Dr. Len Ferrington, report to the BCWD TAC), particularly Diamesa, Odontomesa, and Prodiamesa. In most trout streams, these chironomids would also be common upstream and these organisms would be expected in Class 2A waters in this area. The most recent fish survey of Brown’s Creek (2008) shows a similar pattern. Warm water tolerant fishes (minnows and chub) are dominant at upstream sites, giving way to cold water fish (brown trout) at the downstream sites (Figure 18). The truly coldwater reaches also have fewer species and individuals of warm water tolerant species. The transition from warm water tolerant fish species to cold water species is striking. However, the brown trout are not establishing a stable population and are stocked yearly. The high temperatures found at the downstream sites where the trout are found indicate that even at these sites the frequency and duration of temperatures about the threat level is likely having an impact on the fish community. Although comparatively the downstream sites show a greater diversity of cold water adapted species than the upstream sites, the biotic community in the downstream reach is still experiencing high instream temperatures.
0
5
10
15
20
25
30
35
40
45
50
55
60
4 4a 5 7 9 10 10a 12
Fish sampling site, 2008
Indi
vidu
als Brown trout
Fathead and centralmud minnowsCreek chub
Figure 18. Fish sampling data from 2008 showing counts of cold water fish (brown trout) and warm water fish (minnows and chub) from upstream (site 4, near Highway 15) to downstream (site 12, near the confluence with the St. Croix). Copper
Copper is a trace element necessary for most life, but in higher concentrations it has both lethal and non-lethal impacts on biota, especially fish. Copper values exceeded standards at the two
wq-iw6-05b

downstream sites (McKusick and WOMP) with a few values above standards at Diversion. Data at the WOMP site show a range of copper concentrations, with even the copper final acute value being exceeded once (Figure 19). Exceedances occur most frequently under high flow conditions (Figure 20). Not all high copper concentrations shown on the water quality duration curves in Figure 20 are violations because they occur at time of high hardness, when the standard is higher. The data analysis suggests that high copper enters the stream from stormwater runoff, with exceedances correlated to residential land uses and golf courses. Likely sources are algaecides, herbicides, and fungicides used on lawns and in ponds. A complete analysis of copper including causal pathways is presented in Appendix A: Stressor Identification.
60 80 100 120 140 160 180 200 220 240
Hardness (mg/L)
0
10
20
30
40
50
60
70
80
90
Tota
l Cop
per (
µg/L
)
Chronic Standard
Maximum Standard
Final Acute Value
Figure 19. Copper concentration monitoring data from WOMP, Brown's Creek, with hardness corrected standards.
wq-iw6-05b

Flow Duration Interval
Tota
l Cop
per (
µg/L
)
0 20 40 60 80 1000
20
40
60
80
100
120
140Does not exceed standardExceeds chronic standardExceeds maximum standardExceeds final acute value
DryConditions
Mid-rangeFlow
LowFlow
HighFlow
MoistConditions
Figure 20. Total copper water quality duration curve from WOMP, Brown’s Creek, with points above the hardness corrected standard indicated. Note that the standard cannot be calculated for all points due to lack of hardness data; therefore some data points may exceed the standard even if not noted. After completion of the stressor identification report, it came to the attention of project staff that the copper monitoring data were not collected and analyzed according to approved EPA methods that the MPCA requires for assessment of impaired waters (EPA 1638 for sample collection and EPA 1669 for sample analysis). Since it is still a possibility that copper temporarily reaches high concentrations within Brown’s Creek, copper is still considered a stressor on the creek’s biota. However, TMDL allocations will not be set for copper since monitoring data using approved methods are needed before it is confirmed as a primary stressor and allocations are set. Focus will be on collecting monitoring data and implementing practices to reduce copper loads to the stream.
wq-iw6-05b

2. Biological and Water Quality Standards and Goals
Water quality standards can be either numeric or narrative. Numeric standards exist for impairments such as low dissolved oxygen, trace metals, chloride, pH, and turbidity, and they prescribe the qualities that surface waters should have in order to protect the beneficial uses of the water bodies. Numeric standards are specific to ecoregions and use-class of the water in question as defined by Minnesota Rules 7050.0140 and 7050.0220-0227. Subpart 3 of MN Rule 7050.0150 contains the state’s narrative standards, including the narrative standard for Class 2 waters that biotic TMDLs are based on:
The normal fishery and lower aquatic biota upon which it is dependent and the use thereof shall not be seriously impaired or endangered, the species composition shall not be altered materially, and the propagation or migration of the fish and other biota normally present shall not be prevented or hindered by the discharge of any sewage, industrial waste, or other wastes to the waters.
The impaired reach is classified as a Class 2A stream, protected “to permit the propagation and maintenance of a healthy community of cold water sport or commercial fish and associated aquatic life, and their habitats” (MN Rule 7050.0222, Subp. 2). The fish community in Browns Creek is characterized by a prevalence of highly tolerant warmwater species, no intolerant species, and poor representation of species indicative of coldwater habitats. These fish community attributes suggest a lack of a coldwater assemblage. The ultimate goal of this TMDL is to restore Brown’s Creek so that it can support a coldwater fisheries assemblage, including fewer highly tolerant warmwater species, a greater proportion of species intolerant to warmwater conditions, and a better representation of species indicative of coldwater habitats. For the purpose of a TMDL, the narrative standard must be translated into a numeric goal for which load-based allocations can be made. The Brown’s Creek Biotic TMDL is based on the three primary stressors identified to be causing the stream to not meet its designated use as a coldwater fisheries, as indicated by the lack of coldwater species assemblage on the downstream reach: suspended sediment, temperature, and copper. For each of these three stressors, numeric goals were selected (for TSS, thermal load, and copper, respectively). A. S us pended S ediment
TSS was selected to represent the amount of suspended sediment in the stream. Numeric state standards for TSS in streams do not exist. To translate the narrative standard into a numeric goal, a TSS equivalent of the turbidity standard was used to indirectly evaluate TSS since TSS and turbidity are often highly correlated in water bodies. It is helpful to focus on TSS data since there are more TSS data available than turbidity data. Turbidity, measured in NTUs (nephelometric turbidity units), is an index of total cloudiness of water including suspended sediments and solids, suspended organics, tannic acid and other
wq-iw6-05b

discoloring natural chemicals, and algae. The specific Class 2A water quality standard for turbidity set by the State of Minnesota is 10 NTU. Site-specific correlations between TSS and turbidity (measured with a Hach 2100N turbidity meter) were used to evaluate the TSS in Brown’s Creek relative to the TSS equivalent of the turbidity standard. This method of developing TSS equivalents as a measure of turbidity is supported by other work (Earhart 1984). Site-specific relationships between TSS and turbidity were developed at all monitoring sites. Of the two most downstream sites (the reach that is the focus of this TMDL), McKusick and WOMP, the relationship at McKusick was statistically significant and had a higher correlation coefficient (R2). The TSS-turbidity relationship at McKusick was therefore used to relate a TSS concentration with the turbidity standard. Using this relationship, 23 mg/L TSS corresponds to 10 NTU (Figure 21). 23 mg/L TSS was used as the water quality goal for the suspended sediment portion of the TMDL.
0 5 10 15 20 25 30 35 40
Turbidity (NTU)
0
20
40
60
80
100
120
TSS
(mg/
L)
TSS = -3.4635+(2.6697*turbidity)R2 = 0.99
10 NTU = 23 mg/L TSS
Figure 21. TSS-turbidity relationship at McKusick Two outliers (>1000 NTU) were removed to focus in on the relationship closer to 10 NTU. B . T urbidity
The Class 2A water quality standard for turbidity set by the State of Minnesota is 10 NTU. Since turbidity is an optic property of water and not a load-based pollutant, a load-based parameter needs to be used as a translator for the turbidity impairment. TSS was selected as the translator, and the TSS equivalent of the turbidity standard for Brown’s Creek, determined to be 23 mg/L
wq-iw6-05b

TSS (see above Section 2A), will be used for the water quality target for the turbidity impairment. C . T emperature
There is no numeric temperature standard for streams. The Minnesota state standard for thermal pollution in Class 2A streams is “no material increase” (7050.0222 Specific Water Quality Standards for Class 2 Waters of the State; Aquatic Life and Recreation). The guidelines used here reflect best professional judgment regarding harmful temperatures to biota. Brown trout threat temperature (18.3°C or 65°F) is defined as the point of physiological stress, reduced growth, and egg mortality. This value is based on an average of reported values for brown and brook trout (reviewed in McCullough 1999). Critical temperature (23.9°C or 75°F) is defined as the point at which direct mortality can be expected, a value also based on literature and expert advice (McCullough 1999; Jason Moeckel (MDNR), personal communication). Recent work in Minnesota and Wisconsin assesses empirical temperature ranges for trout and arrives at similar numbers to these guidelines (Wang et al. 2003a and 2003b). Trout are able to survive outside of the range chosen here but their ability to tolerate higher temperatures decreases over time (Wherly et al. 2007). Brook trout (native to Brown’s Creek) seem to have the same thermal tolerances as the stocked brown trout (ibid.). Taking these factors together, the range of threat and critical temperatures used for the analysis represents known biological impacts with a small safety margin built in. The analysis of biological impact of temperature in Brown’s Creek relies most heavily on the threat temperature. The failure of trout to establish a breeding population taken together with the absence of cold water fish and invertebrate species are evidence that the temperature impact has sustained effects on the biota, best captured through evaluation against the threat temperature (as opposed to the critical temperature). D. C opper
Copper is a naturally occurring metal, and in small amounts it is necessary for most organisms. In larger concentrations, copper is toxic. Copper is often a component of algaecides, fungicides, and herbicides because of its toxicity. In animals, copper has a variety of physiological effects when it occurs in high concentrations. For example, copper binds to ligands and interferes with waste removal from the blood or hemolymph, causing a variety of symptoms and ultimately death. Copper also has a number of sub-lethal effects on animal behavior that can dramatically lower growth and reproduction. The toxicity of copper is directly related to hardness and acidity. Natural background levels of copper depend on the geological substrate and soil acidity. In Minnesota, background copper levels are generally very low. Copper can be introduced into aquatic systems through a variety of pathways. Natural geological background can be a source of copper. Copper can also be brought in by atmospheric deposition when high levels of combustion, incomplete combustion, or other types of air pollution introduce copper into the atmosphere. Copper is also a component of brake pads, and copper dust from
wq-iw6-05b

braking has been identified as a major source in San Francisco (Engberg 1995). Copper dust from heavy braking can accumulate in streets and be washed into storm drains, entering aquatic systems in significant amounts. This source depends on heavy traffic on high-gradient roads and is unlikely to be a substantial source in Brown’s Creek due to lower road and traffic densities than those observed in San Francisco. The most common form of copper introduced into landscapes and aquatic systems are fungicides, herbicides, and algaecides. Lawn care by homeowners or industrial lawn services apply copper based fungicides and herbicides that are washed into streams by stormwater. Algaecides are commonly applied directly to home ponds, swimming pools, irrigation ponds, and both private and municipal park ponds. These sources can overflow in storms and introduce large pulses of copper into aquatic systems. Data (presented in Appendix A: Stressor Identification) support the identification of home and industrial algaecide and/or fungicide use in the Brown’s Creek watershed as the primary candidate source of copper. If instream copper concentrations do not decrease after these copper sources are addressed, further study should be completed to investigate the copper sources. Copper toxicity to animals and plants varies with its bio-availability, mediated primarily by pH and hardness. Minnesota state standards for copper toxicity (MN Rule 7050.0222, subp. 2) are corrected for hardness, and are numeric and defined at three levels. The chronic standard is the highest concentration that will not cause harmful effects with indefinite exposure:
CS: Cu (µg/L) shall not exceed: exp. (0.62[ln(total hardness, mg/L)]-0.570) (exp. is the natural antilogarithm (base e) of the expression in parentheses)
The maximum standard is intended to define the limit of immediate harmful effects from short term spikes in concentration. It is defined as:
MS: Cu (µg/L) shall not exceed: exp. (0.9422[ln(total hardness, mg/L)]-1.464) (exp. is the natural antilogarithm (base e) of the expression in parentheses)
The final acute value is equivalent to an LD50, the level of exposure that would kill half of the organisms exposed. This final acute value for copper is defined as:
FAV: Cu (µg/L) shall not exceed: exp. (0.9422[ln(total hardness, mg/L)]-0.7703) (exp. is the natural antilogarithm (base e) of the expression in parentheses)
The assessment of Brown’s Creek used the maximum standard value as the primary standard. The maximum standard is evaluated by the MPCA as a one-day average. Available copper monitoring points were sparse and not continuous. The chronic standard was exceeded most often (it is the lowest level) but requires continuous data for proper assessment. The final acute value was reached in a few monitoring cases, but is also inappropriate as a standard for Brown’s Creek because no large scale die-offs were observed. The nature of the data (short spikes of copper) and observed effects (inability of trout to establish) make the maximum standard value the most fitting value at this point.
wq-iw6-05b

Since the copper standard varies by hardness, a representative hardness was used to set the copper water quality goal. Since the high instream copper concentrations are from stormflow, the average instream hardness was used to calculate the copper water quality goal. Of the 166 water quality samples taken at all sites in Brown’s Creek between 4/11/2002 and 10/18/2007 that contained hardness data, 86 were recorded as storm flow samples. These samples averaged 124 mg/L hardness (Table 6). Baseflow sampling during the same interval indicates an average hardness of 190 mg/L in 68 samples. The WOMP site contained 43 of the 86 storm flow samples and had an average hardness of 120 mg/L. 125 mg/L hardness was used, which translates into a copper standard of 22 µg/L. Table 6. Average hardness (mg/L) for water quality samples in Brown’s Creek.
Site Baseflow Snowmelt Stormflow Average Diversion 173 109 130 Gateway 187 144 160 Headwaters/110th St 183 151 163 Hwy 15 176 109 143 McKusick 191 129 160 WOMP 197 145 120 154 Average 190 145 124 152 Dissolved copper is more toxic to aquatic life than particulate copper. Although the copper standard is presented in terms of total copper concentrations, it is to be applied to ambient waters as dissolved metal standards (MPCA 2007). The dissolved standard is estimated by multiplying the total standard by a conversion factor (0.960 in this case) to convert it to a dissolved standard, and then compared to dissolved ambient data. Since the data for Brown’s Creek are only for total copper and not for dissolved copper, the data analysis was completed with respect to the total copper standard. The likely copper sources identified in the stressor identification, algaecides and fungicides, are in the form of copper sulfate, which is dissolved. Copper dust from brake pads would be present in the particulate form.
wq-iw6-05b

3. Loading Capacity and TMDL Allocations – Linking Water Quality,
Physical Habitat, and Pollutant Sources This section describes the derivation of the assimilative capacity, or TMDL, for Brown’s Creek. The TMDL is the sum of the wasteload allocations (WLAs) for National Pollutant Discharge Elimination System (NPDES)-permitted sources and the load allocation (LA) for natural background and non-permitted sources in a watershed. After the assimilative capacity (TMDL) was calculated, it was apportioned among the WLAs and the LA. The primary stressors leading to the Brown’s Creek fish IBI impairment are suspended sediment, water temperature (high thermal load), and copper. TMDL allocations were set for suspended sediment and thermal load; allocations were not set for copper due to the uncertainty regarding the data collection and analysis methods used (see Section 1C: Copper). The loading capacity of Brown’s Creek for suspended sediment and thermal load was estimated separately, using the approaches described in this section. A. Approac h
The assimilative capacities of Brown’s Creek for the two identified pollutants – suspended sediment and temperature – were calculated using monitored flow data at the WOMP site3
Figure 22
and the water quality standard or goal described in Section 2: Biological and Water Quality Standards. The record of flow data from 2000 to 2007 includes a wide range of annual precipitation depths from 28.0 to 41.2 inches (University of Minnesota Climatology Working Group: Station ID 218037), representing both high and low flow conditions. The flow duration curve at the WOMP site was used to identify five flow intervals: high flow, moist conditions, mid-range flow, dry conditions, and low flow ( ). The midpoint of each interval was selected as the representative flow for that interval, and the assimilative capacity of the stream at that point was calculated by multiplying the flow by the water quality standard or goal (as a concentration).
3 The Brown's Creek WOMP rating curve, which is based on a permanent staff gauge, was used for flow calculation. A rating curve was developed by taking multiple cross sectional flow measurements for a wide range of stage values and setting up a relationship formula in order to calculate continuous flow for all stages. Twenty-four site visits were used to generate the rating curve. Automated stage and associated flow were recorded every 15 minutes using a continuous bubbler. The watershed size at the WOMP station is 9,051 acres.
wq-iw6-05b

0
10
20
30
40
50
60
70
80
90
0 10 20 30 40 50 60 70 80 90 100
Flow Duration Interval [%]
Flow
(cfs
)High Flow Moist Conditions Mid-range Flow Dry Conditions Low
Flow
Figure 22. Flow duration interval, 2000-2007, WOMP The assimilative capacity was then divided up among the WLAs and the LA. For the suspended sediment allocations, the entire load was assumed to be generated from the watershed; an instream component was not included. (Instream erosion is not particularly severe within Brown’s Creek and high TSS concentrations are thought to be mostly from watershed runoff.) The thermal loading allocations for the temperature TMDL include both a watershed and an instream component. The watershed load was first divided proportionally by the volume of runoff generated in each subwatershed. Many of the subwatersheds are landlocked or semi-landlocked and do not contribute equally to runoff that reaches the stream. Although these landlocked subwatersheds may not contribute annually to the stream, allocations need to be set to allow the discharge when it does occur. Since these landlocked and semi-landlocked subwatersheds are not the source of the chronic water quality impairment, pollutant reductions are not needed in these areas. However, loads from these subwatersheds are not allowed to increase. As defined in previous studies, three landlocked runoff categories were used to apportion the load: areas that contribute continuously (under any storm event that generates runoff), areas that begin to contribute under a 5-year or greater event, and areas that begin to contribute under a 100-year or greater event (Figure 2). The area that contributes only under a 5-year or greater event is due to the Long Lake diversion structure that routes most flows from Oak Park Heights and Lake Elmo away from the creek. The areas that are landlocked under the 100-year event were identified in previous Brown’s Creek hydrologic and hydraulic studies. These landlocked areas were defined through XP-SWMM modeling.
wq-iw6-05b

The volume of runoff from each of these areas was estimated from annual runoff values and design storm runoff equations presented in the MN Hydrology Guide, and the distribution of the volume of runoff from each of the categories was estimated based on the depth of runoff and subwatershed areas (Table 7). The runoff depth for the two types of landlocked areas is the runoff that would leave these areas and ultimately flow to the creek under the designated storm. These depths were estimated based on the MN Hydrology Guide runoff values and an examination of storage available in the landlocked basins. This method is a simple way to provide allocations to landlocked and semi-landlocked areas without the need for additional detailed hydrologic and hydraulic modeling. Table 7. Runoff volume distribution
Subwatershed Runoff Category
Depth of Runoff Contributing to
the Creek
Subwatershed Area (ac)
Annual Runoff Volume
Reaching the Creek (ac-ft)
% Volume of Runoff in Brown’s Creek Watershed
Contributes to Brown’s Creek continuously 7” every 1 year 9,402 5,485 97.4%
Contributes to Brown’s Creek under 5-yr or greater event
2.2” every 5 years 3,857 141 2.5%
Contributes to Brown’s Creek under 100-yr or greater event
1” every 100 years 5,263 4.4 0.1%
The assimilative capacity under each flow interval was then divided into the runoff categories using the percentages presented in Table 7. Within each runoff category, the available load was further divided up according to municipality, weighted by the amount of upland area in each municipality. The upland area was selected to represent the developable area (including areas already developed) in the watershed; it includes the total watershed area with the lake and wetland area subtracted out. Watershed loads within a municipality were evaluated using projected (2020) land use to determine the proportion of the watershed load that originates in areas that are regulated (or will be regulated) by the municipality’s MS4 permit, which will fall under the WLA for that municipality. These include portions of MS4 communities that are nonagricultural and that are projected to be served by stormwater conveyances by 2020 (e.g.,. residential, commercial, industrial). The remainder of the watershed (including agricultural and rural land uses) allocation falls under the LA. Therefore, the allocation for each municipality is split up into LA and WLA (Figure 23). Some municipalities that fall under MS4 regulation do not contain any land uses within the Brown’s Creek watershed that are regulated by the MS4 permit; these municipalities (the City of Grant and the City of Hugo) are not given a WLA.
wq-iw6-05b

Volume category: Continuous 5-Year 100-Year % volume and % allocation: 97.4% 2.5% 0.1%
The wasteload allocations for regulated construction stormwater were calculated based on the estimated area of the watershed under permitted construction activity over the past five years (2004 through 2008). Project areas of permits within Washington County were summed up and presented as an annual average percent (0.09%) of total county area. 0.09% of the total WLA was allocated for regulated construction stormwater. There are no existing regulated industrial stormwater sources within the watershed. A small portion of the TMDL, equal to the amount allocated for regulated construction stormwater (0.09% of the total WLA), was set aside for future permitted industrial stormwater sources. Because future land use is already factored into the WLA estimate and no new traditional permitted point sources are planned in the watershed, no portion of the allowable loading is being explicitly set aside as reserve capacity. B . NP DE S -P ermitted P ollutant S ourc es
The NPDES-permitted pollutant sources that exist within BCWD include regulated MS4 stormwater and construction stormwater (Table 8). In addition to the four currently regulated MS4 communities, the City of Oak Park Heights will likely come under regulation of the Phase II MS4 permit in the future. MS4s outside of urbanized areas with a population of at least 5,000 and discharging or having the potential to discharge to impaired waters are required to obtain an NPDES stormwater permit. The MPCA designates communities as regulated MS4s as populations hit the threshold of 5,000 and updated information is available from the U.S. Census Bureau. The City of Oak Park Heights is projected to have a population of at least 5,000 by the year 2020 (Metropolitan Council 2030 Regional Development Framework - Revised Forecasts as of December 10, 2008). All existing and future regulated MS4s are provided an individual WLA. Future point sources may be included in a WLA. 40 C.F.R. § 130.2(h) states that a WLA is “the portion of a receiving water's loading capacity that is allocated to one of its existing or future point sources of pollution.”
City A City B City C…
LA WLA LA WLA LA WLA
Divided by upland area
Divided by land use area
Figure 23. TMDL allocation schematic
wq-iw6-05b

If additional portions of regulated MS4 communities come under permit coverage in the future due to urban expansion and increased population densities, a portion of the LA will be shifted to the WLA. In the case of a load transfer, the LA will be converted to a load per unit area (e.g. lbs/acre) and the resulting WLA will be based on areal proportion. Since this would result in a change to the distribution of the TMDL between the LA and WLAs, the TMDL would be re-opened to accommodate these allocation shifts. The MPCA will make these allocation shifts. MS4 permits for road authorities apply to roads within the U.S. Census Bureau Urban Area. Although the Minnesota Department of Transportation (Mn/DOT) and Washington County both have roads within the Brown’s Creek watershed, the watershed is not within the U.S. Census Bureau Urban Area and therefore these state and county roads are currently not under permit coverage. Therefore, no WLA is assigned to them. If, in the future, the U.S. Census Bureau Urban Area extends into the watershed and these roads come under permit coverage, one of the following will occur: · If the road under question falls under an area currently covered by a WLA, a portion of the
WLA will be shifted from the municipality or township in which the roads occur. In the case of a load transfer, the WLA will be converted to a load per unit area (e.g. lbs/acre) and the resulting WLA for the roads will be based on their areal proportion. This would result in no change in the overall WLA for Brown’s Creek.
· If the road under question falls under an area currently covered by the LA, a portion of the LA will be shifted to the WLA. In the case of a load transfer, the LA will be converted to a load per unit area (e.g. lbs/acre) and the resulting WLA for the roads will be based on their areal proportion. Since this would result in a change to the distribution of the TMDL between the LA and WLAs, the TMDL would be re-opened to accommodate these allocation shifts.
These WLA and LA shifts will be made by the MPCA. The NPDES Stormwater Program requires that all construction activity disturbing areas equal to or greater than one acre of land must obtain a permit and create a stormwater pollution prevention plan (SWPPP) that outlines how runoff pollution from the construction site will be minimized during and after construction. The construction permit is valid for the duration of the construction activities. Current construction permits are not listed here because their duration is relatively short. Construction stormwater is provided one categorical WLA that includes all NPDES-permitted construction sites. There are no regulated industrial stormwater discharges within the Brown’s Creek watershed.
wq-iw6-05b

Table 8. NPDES permits within BCWD
Permit Type Name NPDES Permit # Comments
MS4 stormwater City of Grant MS400091 Mandatory MS4* MS4 stormwater City of Hugo MS400094 Mandatory MS4* MS4 stormwater City of Lake Elmo MS400098 Mandatory MS4
MS4 stormwater City of Oak Park Heights
No current permit
Future designated MS4; population exceeds 5,000 in 2020 projections
MS4 stormwater City of Stillwater MS400259 Designated MS4 Construction stormwater Various Various
*These municipalities are not given WLAs because they do not have any land uses regulated by the MS4 permit within the Brown’s Creek watershed. C . Margin of S afety
An implicit margin of safety was used for all of the TMDL equations. The approach taken, along with conservative assumptions, implicitly account for the uncertainty in predicting the loads to Brown’s Creek, the uncertainty in determining the fate and transport of the loads, and the uncertainty in how the stream responds to changes in loading. This implicit MOS is appropriate due to the following: · The use of flow duration curves to set the TMDL already accounts for variability of flow, in
that the TMDL is proportionally higher during high flow conditions and proportionally lower during low flow conditions. There is only a very small (but difficult to quantify) margin of error in the daily flow calculations that were used to develop the flow data set.
· The TMDL was calculated without taking into account the installation of many BMPs in the watershed. BMPs that were installed during the monitoring period 2000-2007 are partially accounted for in the load calculations, in that the BMP improvements are reflected in the monitoring data. BMPs installed since 2007 have not been accounted for in the reductions needed by each source. Not accounting for these most recent improvements creates a more conservative TMDL by using a time period when loading rates were higher than existing (2009).
· Trout are able to survive above the threat temperature (used in calculating the TMDL), but their ability to tolerate higher temperatures decreases over time. The use of the threat temperature instead of the critical temperature (higher than the threat temperature) represents known biological impacts with a small safety margin built in to the temperature allocations.
D. S us pended S ediment
Monitoring data were analyzed and a P8 model of the contributing area to the creek was created to identify high loading areas.
wq-iw6-05b

TSS Sources
The Brown’s Creek Stressor ID indicated that TSS is a primary stressor in Brown’s Creek. The stressor ID concluded that the TSS is mostly generated in the watershed and that instream erosion is likely not a substantial source. The most likely causes of high TSS in watershed runoff are landscape alterations in the watershed including high percentage of impervious surfaces and decreased bank vegetation that does not adequately filter the runoff. P8 was used to model the TSS within Brown’s Creek in support of the TMDL. P8 (Program for Predicting Polluting Particle Passage thru Pits, Puddles, & Ponds) is a model for predicting the generation and transport of stormwater runoff pollutants in urban watersheds. The model was developed to help identify areas where improved stormwater management will most benefit Brown’s Creek; the model will be used further in the implementation phase to quantify the impact the proposed BMPs will have on instream TSS concentrations. The model was created using data from the watershed district and inputs based on aerial photography. The model was calibrated to monitored flow and TSS at four sites along the creek. Further information regarding inputs, calibration, outputs, limitations, and recommendations can be found in Appendix B: P8 Modeling of Total Suspended Solids. This section describes modeling results based on an average precipitation year and are used to identify areas of concern. The figures here show a larger portion of the watershed as landlocked compared to Figure 2; this is because although these areas are not completely landlocked, they contribute negligibly to the average sediment loads reaching the creek, and are not included in the P8 model. The watersheds draining to the lower creek have poor removal of TSS and the upper portions have a higher removal of TSS (Figure 25). The catchment areas with poor pollutant removal (Figure 25) and high TSS production (Figure 4 in Appendix B: TSS Modeling) should be considered high priority for implementing BMPs to reduce TSS delivery to Brown’s Creek. The high rate of sediment delivery to the stream between CBC-11 and LBC-3 (Figure 4 in Appendix B: TSS Modeling) is primarily a factor of little ponding in these catchments. Table 9 presents P8 results from the locations within the creek shown in Figure 24. These results corroborate the results presented in Figure 25 and indicate the same areas where implementation activities should be focused.
wq-iw6-05b

Table 9. P8 Results Along Brown’s Creek for an Average Year
Creek Location (P8 Model Device Name)
Area Between Devices (acres)
Device Outflow
(TSS lbs/yr)
Device Outflow
(TSS lbs/ac-yr)
TSS added
between Stations (lbs/yr)
TSS added
between Stations
(lbs/ac-yr) LBC-6_out_WOMP 160 1,474,892 285 71,253 446 LBC-3_out 491 1,403,639 280 114,604 233 LBC-5a_out 462 1,289,036 285 377,101 815 CBC-16_out_McKusick 267 911,935 224 433,191 1,620 CBC-15_out 126 478,743 126 126,649 1,006 CBC-14_out 141 352,094 96 181,784 1,288 Stream-CBC13 338 170,310 48 134,786 399 HWY15-CBC11 1,280 35,524 11 14,393 11 Stream-CBC10 628 21,130 11 1,614 3 110th-UBC10a 1,286 19,517 15 19,517 15 Total 5,181 1,474,892
wq-iw6-05b

Figure 24. Average Annual TSS Added Between Stations
wq-iw6-05b

Figure 25. Existing Pollutant Removal Efficiency
wq-iw6-05b

TSS Loading Capacity
Flow monitoring data were used at the downstream station (WOMP) to calculate the creek’s TSS loading capacity (Table 10). Table 10. TSS loading capacity
Flow Range Flow Range Midpoint (cfs) TSS TMDL (lbs/day) @ 23 mg/L High 25.0 3,105 Moist 11.7 1,456 Mid 8.5 1,049 Dry 6.8 839 Low 5.5 684
The loading capacity is computed by multiplying the flow by the water quality goal, in this case 23 mg/L. This water quality goal is the TSS equivalent of the turbidity standard for Class 2A waters (10 NTU). See Section 2A: Biological and Water Quality Standards and Goals, Suspended Sediment for more details on the TSS water quality goal for Brown’s Creek. TSS Allocation Summary
The summary of allocations in Table 12 shows the LA and the individual WLAs for the five different flow regimes. The mean concentration of TSS from monitored data for 2000-2007 is 142 mg/L compared to the TSS goal of 23 mg/L. A loading rate goal was calculated based on average annual loading at the WOMP site from the P8 model, and the TSS goal of 23 mg/L multiplied by the median flow rate of 8.5 cfs divided by the modeled drainage area of 5,181 acres. The existing loading rate at WOMP is 285 lbs/acre-year, and the goal is 74 lbs/acre-year, necessitating an overall reduction in TSS loading of 1,093,191 lbs, or 74% (Table 11). Table 11. TSS Reductions Needed Existing load (lbs/ac-yr) 285 Goal load (lbs/ac-yr) 74 Magnitude of reduction (lbs/ac-yr) 211 Reduction needed 74% Contributing watershed area (ac) 5,181 Total TSS reduction needed (lbs/yr) 1,093,191 *2007 is the baseline year for this TMDL. Reductions presented in this table need to be met by BMPs installed after 2007.
Results of the P8 modeling were compared to the loading goal of 74 lbs/acre-year to estimate reductions needed on a catchment scale (Figure 26, see Appendix B. P8 Modeling of Total Suspended Solids for modeling details). These reductions are to be used as guidelines for implementation planning as they do not directly correspond to the TMDL allocations – the allocations were divided based on area and volume of runoff, and the reduction guidelines presented here only apply to those catchments that regularly contribute runoff to Brown’s Creek. Municipalities can use Figure 26 to target high priority subwatersheds.
wq-iw6-05b

Although most catchments fall short of the TSS goal, the results of the P8 modeling show that the majority of the TSS reduction needed is primarily in Stillwater. Upstream of CBC-13 the loading goal is being met, so all upstream areas have a 0% reduction goal. Additionally, some catchments downstream of CBC-13 are currently producing TSS below the loading goal; they were also given reduction goals of 0%. Catchments showing a reduction of 0% will not be allowed to increase loading in the future. Since Lake Elmo and Oak Park Heights are located in the landlocked and/or semi-landlocked subwatersheds, they are assigned a 0% reduction (Table 13). Loads from these areas are not allowed to increase. Loads within the City of Stillwater, in both the regulated and non-regulated areas, need to be reduced by approximately 74% on average. Table 12. TSS load and wasteload allocation summary
Source % Allocation
TMDL (lbs/day)
High Flows
Moist Conditions
Mid-Range Flows
Dry Conditions
Low Flows
81.3 - 17.5 cfs
17.5 - 9.7 cfs
9.7 - 7.6 cfs 7.6-5.9 cfs 5.9 -
0.0 cfs
LA 90.2% 2,800 1,313 946 757 617
WLA – Permitted stormwater MS4 or other source Permit #
Lake Elmo MS400098 0.035% 1.1 0.5 0.4 0.3 0.2
Oak Park Heights Future 0.22% 7.0 3.3 2.4 1.9 1.5
Stillwater MS400259 9.5% 296 139 100 80 65 Construction stormwater Various 0.01% 0.3 0.1 0.1 0.1 0.1
Industrial stormwater No current permitted sources 0.01% 0.3 0.1 0.1 0.1 0.1
Total 100% 3,105 1,456 1,049 839 684
Table 13. TSS percent reductions by municipality
Municipality TSS Percent Reduction to Meet Allocations Lake Elmo 0% Oak Park Heights 0% Stillwater 74%
wq-iw6-05b

Figure 26. TSS Reduction Goals to Meet TSS Standard Landlocked and semi-landlocked subwatersheds (outside of the modeled area) require a 0% reduction in TSS loads.
wq-iw6-05b

E . T emperature
Because temperature cannot directly be described as a load, the TMDL was calculated by using the amount of energy in the water at specific temperatures and flows. The total energy of flow is composed of three parts: the kinetic energy, the potential energy, and the internal energy. In Brown’s Creek and systems similar to it, the kinetic and potential energy are negligible compared to the internal energy and the analysis reduces to internal energy. To calculate the internal energy load the following equation was used:
E = hm.
where E is the energy flow rate in kilowatts (KW), .
m is the mass flow rate of the water in kilograms per second (kg/s), and h is the internal energy of water in kilojoules per kilogram (KJ/kg) (Cengal and Turner 2001). The internal energy of water in various states (based on both state and temperature) is available in most thermo-dynamic and thermal science text books. The internal energy load equation was used to calculate the energy flow rate at all flow rates and temperatures monitored in the period of record. This equation was also used to define the load duration curve by using the period of record flow rates and the internal energy of water (76.82 KJ/kg) at the threat temperature of 18.3°C (Figure 29). The TMDL and allocations were calculated in terms of the KJ per day that the stream can assimilate and maintain water temperatures below the brown trout threat temperature. These energy-based allocations are provided in order to express temperature as a load-based TMDL. The allocations themselves will be difficult to directly translate into implementation actions. The implementation strategy (Section 5) and implementation plan (to be completed) will prescribe implementation actions that target the sources of high temperatures identified in the stressor identification and in the following Heat Load Sources discussion. The implementation plan will provide a menu of implementation options that can be used. Permittees are required to comply with the established wasteload allocations, and the implementation plan will offer guidance that may be useful to MS4s when selecting BMPs to achieve the goals of the TMDL. An accounting of heat load sources and reductions based on energy units (KJ/day) will not be required. Heat Load Sources
Temperatures at all monitoring sites exceeded the brown trout threat temperature of (18.3°C or 65°F) at times during 2007, and the critical temperature (23.9°C or 75°F) was exceeded at 110th Street (Figure 27). The sources of high heat inputs are linked to decreased groundwater flows (as a proportion of flows in the creek) and lack of stream shading. Since groundwater is cooler than surface water in the summer months, decreased groundwater flows lead to higher surface water temperatures. Currently available studies of similar streams in Minnesota and Wisconsin support the conclusion that increased surface runoff from impervious surfaces is one of the primary mechanisms of temperature increase responsible for loss of cold water fish and invertebrate assemblages (Wang et al. 2003).
wq-iw6-05b

To further evaluate heat load sources (in addition to the analysis completed in the stressor identification), the 2007 monitoring year, trout threat temperatures, and climatological records were examined and the following observations were made. · Most temperature exceedances occur at high flows (Figure 29). · Stream water temperature is linked closely with air temperature and fluctuates greatly
diurnally. (Average daily fluctuation for 2007: winter = 0.5°C, spring = 5.0°C, summer = 4.1°C, fall = 1.5°C)
· The highest instream temperatures occur in the hours following brief afternoon thunderstorms on a hot sunny day (greatest exceedance 8/14/2007, Figure 28). During the storm stream temperatures decrease (as a result of decreasing air temperatures during the storm).
· Approximately 2.4 cfs of groundwater enters the stream between the McKusick and WOMP monitoring stations. (Average difference in 2007 baseflow based on baseflow separation using local minimum method.)
· During baseflow conditions, the WOMP station averages approximately 2°C cooler than McKusick. Under stormflows, the temperatures at all sites are very similar.
These observations suggest that the lack of shading upstream of the McKusick monitoring station and impervious surfaces in the watershed surrounding the downstream sites (increased stormflow: baseflow ratio at WOMP) are the primary sources of heat load to Brown’s Creek.
10
12
14
16
18
20
22
24
26
8-Apr-07 28-Apr-07 18-May-07 7-Jun-07 27-Jun-07 17-Jul-07 6-Aug-07 26-Aug-07 15-Sep-07 5-Oct-07
Date
Tem
pera
ture
, Dai
ly M
ean
(°C
)
110th Street Temperature (°C)Highway 15 Temperature (°C)McKusick Temperature (°C)WOMP Temperature (°C)
Critical Temperature
Threat Temperature
Figure 27. Daily mean temperatures at all stations, 2007
wq-iw6-05b

0
10
20
30
40
50
60
70
80
90
100
13-A
ug
14-A
ug
15-A
ug
16-A
ug
17-A
ug
18-A
ug
Flow
(cfs
)
15
16
17
18
19
20
21
22
23
24
25
Tem
pera
ture
(°C
)
Flow (cfs) Temperature (°C) Threat Temperature
Start of exceedence
End of 8/14 exceedence
Brief break in exceedence
Figure 28. August 2007 Temperature Exceedance, WOMP site Heat Loading Capacity
2000-2007 temperature and flow data at the WOMP station were used to calculate the TMDL. The maximum heat input was calculated for the range of flow rates by conducting an energy balance on the system to keep stream temperatures below the threat level (18.3°C or 65°F) for brown trout. The TMDL is shown for all flow ranges in Table 14 and the load duration curve is shown in Figure 29. Table 14. Heat loading capacity
Flow Range Flow Range Midpoint (cfs) Thermal TMDL (Million KJ/Day) High 25.0 4,697 Moist 11.7 2,203 Mid 8.5 1,589 Dry 6.8 1,270 Low 5.5 1,036
wq-iw6-05b

-
1,000
2,000
3,000
4,000
5,000
6,000
7,000
8,000
9,000
10,000
0 10 20 30 40 50 60 70 80 90 100
Flow Duration Interval
Hea
t Inp
ut (M
illio
n K
J)Threat Level (18.3°C) Maximum Daily Allowable Heat Input (Million KJ)Critical Level (23.9°C) Maximum Daily Allowable Heat Input (Million KJ)Daily Heat Input (Million KJ), Monitored
low flow
high flow
Figure 29. Heat Load Duration Curve, 2000-2007, WOMP site “Daily heat input, monitored” represents the observed daily heat input, based on monitored temperature and gauged flow. As indicated in Figure 29, TMDL exceedances occur more frequently at higher flows (stormwater dominant) than under low flow conditions (baseflow dominant). However, exceedances under low flow conditions do occur, caused by the water heating up within the stream itself. A lack of riparian vegetation along the stream channel and the open wetlands that the stream flows through in the upstream reaches can lead to these high temperatures under low flow conditions. The heat sources related to high temperatures under low flow conditions were considered part of the LA, more internal to the stream itself as opposed to originating in the watershed. The baseflow contribution during days when the threat level was exceeded was used to calculate the percent of the assimilative capacity to be assigned to the baseflow contribution portion of the LA. Baseflow separations were conducted using the three methods described in the USGS program Hydrograph Separation (HYSEP): the Fixed Interval (FI) Method, the Sliding Interval (SI) Method, and the Local Minimum (LM) Method. Each of these provides a numerical method to evaluate baseflow using monitored flow data. Generally, the methods all find the lowest flow within a specified time period and assign that value as the baseflow over the same period. Each method produced similar results for a sample time period (4/15/07-10/29/07) as shown in Table 15. The SI method was used for daily comparisons of baseflow and stormflows in the creek for the entire time span 2000-2007.
wq-iw6-05b

Table 15. Comparison of baseflow estimation methods for a truncated time period
Approach Flow Estimate (ac-ft)
Volume Baseflow FI 2,555 Volume Baseflow SI 2,557 Volume Baseflow LM 2,411 Total Flow April 15 - October 29, 2007 2,939 Average Baseflow 2,507
The baseflow contribution (as a percent of total daily flow) calculated during the threat level exceedances was averaged over each flow duration interval to define the percent of the LA attributed to baseflow sources (Table 16); the remaining portion of the flow (stormflow) represents the load allocated to the watershed sources (in both the WLA and LA). The percentages (in Table 16) were applied to the thermal assimilative capacity of the stream at each flow interval to distribute the thermal allocations to baseflow (LA) and stormflow (LA and WLA). The stormflow (watershed loading) allocations were further divided into regulated (WLA) and non-regulated (LA) according to the projected land use (approach described in Section 3.A). Table 16. Baseflow Contributions by Flow Range
Flow Regime
Flow Contribution High Moist Mid-Range Dry Low
Baseflow 36% 74% 84% 91% 94% Stormflow 64% 26% 16% 9% 6%
Heat Allocation Summary
The summary of allocations in Table 17 shows the LA and the individual WLAs for the five different flow regimes. The two LA categories are presented separately in order to provide information on the magnitude of LA available for each source. A reduction of 6% in thermal loading is needed across the entire watershed (and across all thermal sources). This is based on the difference between the allowed heat input (based on the threat temperature) and the average heat input observed during the 198 days when the threat temperature was exceeded (2000-2007). This needed reduction provides an estimate of the overall magnitude of the heat reductions needed; more detailed data analysis will be completed for the TMDL implementation plan. Since Lake Elmo and Oak Park Heights are located in the landlocked and/or semi-landlocked subwatersheds, they are assigned a 0% reduction (Table 18). Loads from these areas are not allowed to increase. As discussed above in the introduction to Section E: Temperature, to comply with the allocations, the entities that control heat loading into Brown’s Creek will be required to either implement the actions in the implementation plan or implement substitute actions that will reduce thermal loadings to the same extent. An accounting of heat load sources and reductions based on energy units (KJ/day) will not be required.
wq-iw6-05b
Table 17. Heat load and wasteload allocation summary
Source
TMDL (Million KJ/day)
High Flows Moist Conditions
Mid-Range Flows
Dry Conditions Low Flows
81.3 - 17.5 cfs 17.5 - 9.7 cfs 9.7 - 7.6 cfs 7.6-5.9 cfs 5.9 - 0.0 cfs
LA - Watershed 2,732 517 223 108 59
LA - Baseflow 1,668 1,630 1,342 1,150 970
WLA – Permitted stormwater MS4 or other source Permit #
Lake Elmo MS400098 1.1 0.20 0.09 0.04 0.023
Oak Park Heights Future 6.8 1.3 0.55 0.27 0.15
Stillwater MS400259 289 55 23.6 11.4 6.2 Construction stormwater Various 0.3 0.05 0.02 0.01 0.006
Industrial stormwater No current permitted sources
0.3 0.05 0.02 0.01 0.006
Total 4,697 2,203 1,589 1,270 1,036
Table 18. Thermal load percent reductions by municipality
Municipality Thermal Load Percent Reduction to Meet Allocations
Lake Elmo 0% Oak Park Heights 0% Stillwater 6%
wq-iw6-05b

F . C ritic al C onditions and S eas onal Variation
The critical condition for aquatic organisms is the summer when the aquatic life activity and biomass production are at their highest levels. Assessing the biology during the summer months evaluates the biological performance during the most critical time of the year. Summer is also when excessive high instream temperatures and reduced stream flows typically occur, leading to higher temperatures that can have a negative impact on organisms. MPCA’s biological, habitat, and water quality targets are set to be protective during critical periods, e.g., summer conditions. The IBI is a measure of aggregate annual conditions reflecting compounding factors over time, which inherently takes into account summer conditions. The use of this index reflects the collective seasonal effects on the biota. The measurement of these indices during the summer period reflects the biotic performance during critical conditions. The suspended sediment and temperature TMDLs are protective of the stream during all flow conditions since the allowable loadings are based on load duration curves and therefore vary according to flow. High instream temperatures also occur more frequently during the summer months, coinciding with the critical period for aquatic organisms. The TMDL addresses this through identifying implementation strategies that will address high temperatures that occur during the summer critical periods for aquatic organisms.
wq-iw6-05b

4. Reasonable Assurances
As part of an implementation strategy, reasonable assurances provide a level of confidence that the allocations in this TMDL will be implemented by federal, state, or local authorities. Implementation of the Brown’s Creek TMDL will be accomplished by both state and local action on many fronts. A. B rown’s C reek Waters hed Dis tric t Waters hed Management P lan and R ules
BCWD 3rd Generation Watershed Management Plan
The BCWD’s 3rd Generation Management Plan, approved in 2007, includes high priority projects and associated funding to implement a stream corridor plan and stream restoration projects. The development of the TMDL implementation plan will inform these plans and studies and enable implementation of improvements through an amended version of the watershed plan. The watershed plan includes a high priority implementation activity to prioritize and implement stream restoration projects/methods and capital improvements necessary to provide cost effective restoration of stream quality. The plan also includes various capital improvement projects including wetland restoration and retrofit projects that will help achieve the TMDL. BCWD intends to update their watershed management plan to include the allocations and loading goals prescribed in the TMDL. After their plan is updated, the individual cities will be required to update their surface water management plans to comply with the BCWD plan. BCWD Rules
In 2007, the BCWD revised their rules through an extensive public involvement process and incorporated seven years of experience applying and enforcing the previous version of their rules. These rules will from the basis of local regulatory controls to achieve improvements in water quality as summarized here:
· BCWD Stormwater Management Rule The recent (2007) revisions to the District’s stormwater management rule in large part are oriented toward preserving and restoring as much as possible the natural surface and groundwater systems and the dynamic equilibrium that the natural systems represent.
The BCWD Stormwater Rule imposes a number of requirements for stormwater management, all designed to address the negative impacts that land-altering activity has on stormwater flow patterns and stormwater quality. The goal of stormwater management is to mimic natural conditions, and the natural dynamic equilibrium, as much as possible to cause the least impact to downstream resources. The peak rate and volume control standards are set at a pre-settlement level that more closely
wq-iw6-05b

approaches the conditions that sustained the District’s resources in the past. The BCWD revised the most probable scenario from the 1.5- to the two-year recurrence interval for stormwater volume control in order to somewhat enhance resource protection. Also, related to stormwater calculations, the BCWD rules require that hydrologic estimates use curve numbers adjusted to reflect the impact of construction activities on the permeability of the soils under proposed site conditions. For disturbed areas, the rule requires applicants to use a curve number corresponding to the permeability class one class lower than the native soils.
The BCWD rule for water quality standard requires control of annual loading of phosphorus for proposed development and redevelopment. The loading-based standard was implemented to be consistent with the approach of the federal total maximum daily load program to determine loading reductions needed to achieve water quality use-based standards as well as to discourage the maximization of allowable runoff volume to achieve a concentration standard. This standard is consistent with the goal of the St. Croix Inter-Agency Water Resources Planning Team to reduce annual phosphorus loads to the St. Croix River by 20 percent from the defined baseline.
Given the biological importance of groundwater-dependent natural resources (GDNRs), the rarity of their unique landscape features, and their susceptibility to degradation from human activities, BCWD rules also include standards related to the protection of GDNRs. To address the thermal impacts associated with stormwater runoff, the GDNR rule (a) prohibits hard surface stormwater runoff or stormwater basin discharge directly to a GDNR; (b) prohibits siting a stormwater basin within either a GDNR buffer or the streamside or middle zone of a stream buffer; and (3) provides thermal pretreatment prior to discharging the two-year storm volume where infiltration is not feasible.
· BCWD Erosion and Sediment Control Rule
BCWD has adopted an erosion and sediment control rule that requires acceptable re-stabilization schedules on erosion control plans and has codified a standard in their rules to provide for consistency with the NPDES construction permit issued by the Minnesota Pollution Control Agency. Also contained in the BCWD’s erosion and sediment control rule is a standard for winter erosion control, emphasizing site stabilization prior to freeze-out as well as ensuring that all BMPs are inspected and in working order at the end of each work day to prevent the severe erosion problems that can occur with the combination melting snow and spring rains.
· BCWD Lake, Stream, and Wetland Buffers Rule
The functions and values of wetland buffers are numerous, and include water quality protection (erosion control; sediment, nutrient, biological and toxics removal; thermal protection; pH moderation), hydrologic event modification, groundwater interaction, aquatic and wildlife habitat protection, minimization of human impact, aesthetics/open space, recreation, and environmental education. The BCWD buffer rule was recently expanded to apply to all wetlands one acre and larger within the District as well as to cover GDNRs. Buffers, for water resources near land
wq-iw6-05b

undergoing subdivision, rezoning, or subject to special use permits, are required from 50 to 100 feet based on the predetermined resource function and value. Furthermore, the BCWD buffer rule institutes a requirement that if an area to be designated as buffer does not meet minimal standards for vegetative adequacy at the time the buffer is established, then the property owner may be required to submit and implement a planting plan establishing a reasonable level of native vegetation as stable vegetative community is essential to buffer function.
· BCWD Shoreline and Streambank Alterations Rule
A source of erosion, and subsequent reduction in downstream water quality, is the improper installation of shoreline and stream bank improvements. The BCWD rule for modifications to shorelines and streambanks limits alteration to instances where erosion is occurring or is likely to occur and encourages bioengineered methods to preserve and, wherever feasible, enhance the ecological integrity and natural appearance of these areas. The BCWD rule requires specific exhibits that must be included in any application for a shoreline or streambank installation that is to be hard armored, bioengineered or includes bioengineered elements to reduce the likelihood of additional sediment in the resources from this cause.
B . Munic ipal P lanning E fforts
Many cities and townships in the watershed recently completed their local comprehensive plan updates, which will guide land use decisions through 2030. The following list is an update of the status of the plans within the Brown’s Creek watershed: · City of Stillwater: 6-month review period ends June 14, 2009 · City of Hugo: 6-month review period ended Nov 5, 2008 · City of Lake Elmo: adopted August 16, 2005. · City of Grant: draft completed in July 2008 · Stillwater Township: draft completed in October 2008 · City of Oak Park Heights: in review process · May Township: in review process · Washington County: in review process · Washington Conservation District: Local water plans, associated with each city/township’s comprehensive plan, are required to be updated to be in compliance with the BCWD Watershed Plan. As the BCWD Plan is updated following completion of this TMDL, local water plans will need to be updated to address water quality improvement requirements. C . NP DE S R egulated MS 4s
There are four regulated MS4 communities in the study area – the Cities of Grant, Hugo, Lake Elmo, and Stillwater – each of which must have a stormwater pollution prevention program (SWPPP) in place for the management of their regulated stormwater discharges. The City of Oak
wq-iw6-05b

Park Heights is expected to become a regulated MS4 in the near future. May Township and Stillwater Township are the only entities within the watershed that are not regulated MS4 communities. Under the MS4 program, each permitted community must develop a SWPPP that lays out the ways in which the community will actively and effectively manage its stormwater. SWPPPs are required to incorporate the results of any approved TMDLs for regulated stormwater discharges within their area of jurisdiction, subject to review by the MPCA. The regulated MS4 communities must review the adequacy of their SWPPP to ensure that it meets the TMDL’s WLA set for stormwater sources. If the SWPPP from any of the cities does not meet the applicable requirements, schedules, and objectives of the TMDL, the city will be required to modify their SWPPP, as appropriate, within 18 months after the TMDL is approved by the U.S. EPA. EPA recognizes that multiple permit cycles will likely be necessary for stormwater sources to come into compliance with their WLAs. Compliance schedules will be required for regulated MS4s that will not achieve their WLA in the current permit cycle. There will be a new MS4 General Permit issued in 2011 that will likely change some of the requirements for regulated MS4s and their implementation of activities to address TMDLs. At this time, there is no draft language for that permit available; however, there are several work groups internally at the MPCA working on developing recommendations for the next generation of this permit. D. F unding P rograms
There are numerous funding sources available for implementation of water quality improvement projects and programs. The primary funding sources are identified within this section. Watershed and Conservation District Projects and Programs
The Brown’s Creek Watershed District currently runs a cost-share program for implementation of water quality best management practices. The BCWD also funds projects and programs through their Watershed Management Plan’s implementation program and Capital Improvement Plan. The Watershed Management Plan is updated at a minimum every 10 years. The WCD administers several state and federal funding programs that are also available to landowners to implement best management practices. The WCD currently runs a technical assistance and cost-share program for implementation of water quality BMPs (funded by Washington County and the state) and collaborates with the BCWD. The WCD can also provide technical assistance to landowners. The NRCS also provides technical assistance and runs a cost-share program. Section 319 Nonpoint Source Grants
Section 319 of the 1987 CWA created a national program to control and prevent nonpoint source pollution of the nation’s surface and ground water resources. The MPCA, Minnesota’s designated water quality agency, is responsible for administering the program in Minnesota. The Section 319 Implementation Grant program is designed to provide financial assistance to projects
wq-iw6-05b

that eliminate or reduce water quality impairments caused by nonpoint source pollution and prevent future nonpoint source pollution related impairments. A clear, strong rationale for project work is required for each award along with a match of local resources. This rationale directs Minnesota 319 awards to watersheds with state endorsed watershed plans and late stage TMDLs. Clean Water Legacy
The Minnesota Clean Water Legacy Amendment's goal is to protect, restore, and preserve the quality of Minnesota’s surface waters. Clean Water Legacy funding is available to implement projects that address impaired water bodies that have a completed TMDL report and implementation plan.
wq-iw6-05b

5. Implementation Strategy
This implementation strategy outlines the overall approach to achieve the LAs and WLAs set for TSS and thermal loading. Although allocations were not set for copper, the implementation strategy addresses copper loading to Brown’s Creek so that the creek will meet copper standards in the future. The strategies that follow will be defined in more detail in the implementation plan, to be developed in the near future. The MPCA requires the implementation plan to be completed within one year of EPA approval of the TMDL. Implementation actions designed to decrease TSS, copper, and thermal loadings to Brown’s Creek will translate into load reductions to downstream water bodies. Two downstream lakes, Lake St. Croix and Lake Pepin, are impaired for aquatic recreation due to excessive nutrients. It is estimated that the reductions needed for the Brown’s Creek TMDL will translate into a reduction of 5,160 pounds of phosphorus loading to downstream water bodies. This is based on the estimated reduction of TSS from existing conditions to the TSS goal of approximately 1,000,000 lbs/yr, and an average TP:TSS ratio (concentrations observed at WOMP, 2000-2007) of 0.00473. Habitat loss and fragmentation was identified as a secondary stressor to the biota; protection of this unique environment and water quality is necessary to ensure the creek’s ability to support a cold water fishery. Improperly designed stream crossings may be barriers to migration in certain instances. Water quality protection is needed to ensure that additional reaches of Brown’s Creek do not become impaired and to protect and improve the creek into the future. Protection strategies could include: · Stream restoration projects including meander restorations and in-stream habitat restoration · Implementing projects to reduce nutrient and other pollutant loads to the creek · Updating regulatory controls to address fish passage requirements · Other projects and programs that will protect and improve the habitat and water quality of
Brown’s Creek The challenge of implementing the TMDL will be to find acceptable methods that balance land use practices with biological needs of fish and macroinvertebrates. Regulated stormwater source loading limits will be achieved through updating SWPPPs to comply with the WLAs. Implementation of nonpoint source pollutant reductions may be achieved through non-regulatory and voluntary incentive programs. The implementation actions identified in Table 19 and discussed below will be evaluated and used to achieve these loading reductions for copper, TSS, and temperature. The water quality evaluation for Brown’s Creek was completed using data from 2000 through 2007. The estimated percent load reductions needed to meet the suspended sediment loading goals were based on the watershed model (P8), which was calibrated to data from 2006 and 2007. Practices implemented after 2007 will be considered to be part of the TMDL
wq-iw6-05b

implementation activities and can be applied to load reduction goals by MS4 permittees in their SWPPPs. Table 19. Implementation actions
Implementation Action Applicable Pollutant TSS Thermal Copper
Reduction of algaecide and fungicide use ü Riparian habitat enhancement ü ü Stormwater management: ü ü ü
Regulatory controls ü ü ü Urban stormwater retrofits ü ü ü Agricultural BMPs ü ü Wetland restoration ü Education ü ü ü
Groundwater management ü A. R educ tion of Algaec ide and F ungic ide Us e
The primary source of copper to Brown’s Creek has been identified as home and industrial algaecide and/or fungicide use in the Brown’s Creek watershed. Reduction of algaecide and fungicide use in the watershed is the primary implementation strategy to reduce copper loads to brown’s Creek. The following options exist for reducing the copper load to Brown’s Creek: · Initiate local education programs that limit use of copper sulfate-containing algaecides and
fungicides. · Investigate options for changes to existing state regulation of copper sulfate-containing
algaecides and fungicides. · Investigate alternative methods and treatment options B . R iparian Habitat E nhanc ement
Riparian buffer zones play an important role in stream ecosystems and provide numerous benefits. Recent literature reviews on riparian buffers suggest applying different riparian buffer widths to meet different riparian goals. In the case of Brown’s Creek, the primary goals for reestablishing buffers is the following: · Filter sediment and pollutants · Reduce the impacts of floods · Stabilize stream banks · Decrease water temperatures · Improve instream habitat The lower portions of Brown’s Creek provide suitable habitat conditions to support brown trout. A riparian restoration project through the golf course would provide additional brown trout
wq-iw6-05b

habitat. The project would consist of buffers, shading, and fluvial restoration. Projects that create critical habitat components such as deep pools, riffles, and refugia would create additional trout-supporting river reaches. Improperly designed stream crossings and/or the density of crossings can have devastating effects on the stability and health of a water course. The siting of additional crossings on Brown’s Creek and its tributaries should be discouraged. Design regulations that maintain stream stability, conveyance capacity, and the ability to transport, without adverse effect, the flows and detritus of its watershed should be adopted for new and replacement stream crossings. Existing stream crossings that are current barriers to migration, cause reach instability, and/or contain poor habitat conditions should be replaced, mitigated and/or modified (such as installing fish baffles). Priority should be given to the most detrimental crossings. Stream restoration projects should be identified and evaluated to determine their ability to improve habitat. C . S tormwater Management
Due to historic channelization and changes in land use over time, the hydrology of Brown’s Creek has been altered. This change in hydrology has had a profound effect on sediment, nutrients, oxygen, and instream habitat. Additional changes in hydrology will only exacerbate the current problems. Therefore, in order to protect the geomorphological and ecological integrity of Brown’s Creek and limit impacts to stream biota, stormwater discharge or hydrologic modifications that increase runoff rates or volumes into the creek should be minimized or avoided entirely. This will decrease TSS, thermal, and copper loading to the creek. Focus should be on implementing BMPs in those subwatersheds that are fully contributing to Brown’s Creek (see Figure 2). New district-wide rules were approved by BCWD in 2007 that focus on infiltration and volume control. Stormwater management practices that serve as thermal controls include stormwater pond shading, parking lot shading, infiltration, and non-solar heat collecting surfaces (such as concrete, non asphalt roofs). In addition, retrofitting stormwater management practices into already developed areas will decrease existing pollutant loads to Brown’s Creek. Implementation of agricultural BMPs such as grassed waterways and buffers will also serve to improve the quality of stormwater runoff. Regulatory Controls
Local Authorities The local authorities that exist within the Brown’s Creek watershed will play important roles in the implementation of loading reductions recommended in this TMDL. The Cities of Hugo, Grant, and Stillwater, May Township, Stillwater Township, and the BCWD, through zoning, planning or permitting have the ability to reduce pollutant loading, reduce stormwater runoff rates and volumes, preserve wetlands, and make riparian corridors a preferential land use in those areas. General Permit for Construction Site Stormwater One way to control storm water is through the issuance of general permits under the NPDES program. These permits are issued for construction activities and industrial activities, and are
wq-iw6-05b

issued to control stormwater that is discharged from a discrete conveyance, such as pipes or confined conduits. NPDES individual and general permits are issued to individuals, private entities, and local government entities. These permits function together to form a web of state and local authority under which stormwater is controlled. Loads from construction stormwater are considered to be a small percent of the total WLA and are difficult to quantify. Construction stormwater activities are therefore considered in compliance with provisions of the TMDL if they obtain a Construction General Permit under the NPDES program and properly select, install, and maintain all BMPs required under the permit, including any applicable additional BMPs required in Appendix A of the Construction General Permit for discharges to impaired waters, or meet local construction stormwater requirements if they are more restrictive than requirements of the State General Permit. General Permit for Industrial Stormwater Industrial stormwater activities are considered in compliance with provisions of the TMDL if they obtain an Industrial Stormwater General Permit or General Permit for Construction Sand and Gravel, Aggregate and Hot Mix Asphalt facilities (MNG49) under the NPDES program and properly select, install and maintain all BMPs required under the permit, or meet local industrial stormwater requirements if they are more restrictive than requirements of the permit. Phase II MS4 Permits for Local Jurisdictions Federal storm water regulations call for the issuance of Phase II NPDES (MS4) stormwater permits to smaller municipalities. All of the communities, with the exception of May Township, Stillwater Township, and the City of Oak Park Heights, are regulated under the current MS4 General Permit. The City of Oak Park Heights will likely come under regulation of the Phase II MS4 permit in the future. Within 18 months of EPA approval of the TMDL, the MS4 communities must review their SWPPP for compliance with the WLA and update their SWPPP if necessary. Urban Stormwater Retrofits
Urban stormwater retrofits such as stormwater ponding and biofiltration can be used within the developed portions of the watershed to reduce pollutant loads and assist in achieving the TMDL. Specific improvements should be identified for subwatersheds CBC-13, 14, 15, 16 and LBW-5a, 5b, 7b, and 8 (Figure 26) as these subwatersheds are contributing significantly to the TSS impairment in the creek. Existing cost-share programs are currently being implemented by the Brown’s Creek Watershed District and the Washington Conservation District. These programs provide cost-share incentives to public and private landowners to implement water quality BMPs. The BCWD also funds activities identified in their Watershed Management Plan’s Implementation Program which includes both structural and programmatic elements. Agricultural Best Management Practices
Within the lower watershed, current agricultural activities could be enhanced to provide water quality protection by implementation of agricultural best management practices. These could include installation of grassed waterways, buffers on perennial and intermittent stream channels, and conservation tillage. Cost-share, grants, and loan programs as well as technical assistance are
wq-iw6-05b

available through the WCD and NRCS to assist landowners with implementing these BMPs. In addition, opportunities for additional volume control practices should be identified in the upper watershed to enhance groundwater recharge with the goal of increasing baseflow in the stream. Wetland Restoration
Wetland restoration can also play an important role in reducing pollutant loads. The BCWD has identified drained and partially drained wetlands within their 3rd Generation Management Plan (Figure III-9). Wetland restoration projects that focus on restoring natural hydrology and vegetation, along with incorporating shading, have the potential to reduce pollutant loads. Education
Education programs should be developed or enhanced to provide information to private landowners as well as communities related to stream protection, water quality, and the TMDL. Educational efforts will include building awareness of water quality issues, specifically as they relate to Brown’s Creek and the impairment; marketing; citizen engagement; and trainings and workshops. D. G roundwater Management
The shallow and deep aquifers should be protected as described in the Brown’s Creek Third Generation Watershed Management Plan. The plan contains specific policies, goals, and implementation items that will ensure the protection of groundwater quality, recharge, supply, and dependent natural resources. Aquifer protection goals described in Brown’s Creek Third Generation Watershed Management Plan are to: · Establish controls to reduce the potential for transport of stormwater pollutants into
groundwater · Cooperate with the wellhead protection and source water assessment efforts of municipalities · Maintain the functionality of recharge areas within the district · Address the use of groundwater through groundwater appropriation standards · Maintain or improve the function and value of groundwater dependent natural resources
within the district. In addition, maintaining a constant supply of baseflow in Brown’s Creek is a critical life-supporting component of stream organisms. The preservation and restoration of open space in the Brown’s Creek groundwatershed will protect key recharge areas. Baseflow monitoring is conducted to evaluate the quantity of baseflow within the system. Typically baseflow is most closely monitored during summer conditions as it provides cool water during periods of low surface water runoff. Equally important however is the role baseflow plays in supporting aquatic organisms through winter periods. In contrast to cool summer baseflow, winter baseflow coming from groundwater sources is typically slightly warmer than surface runoff. Although limited winter data exist for Brown’s Creek, there is some evidence that winter baseflow volumes are low and may not create favorable over-wintering conditions for trout and macroinvertebrates.
wq-iw6-05b

E . C os t E s timate
The Clean Water Legacy Act requires that a TMDL include an overall approximation of the cost to implement a TMDL [MN Statutes 2007, section 114D.25]. Based on cost estimates made in 2004 by a state-level interagency working group that assessed restoration costs for several TMDLs, the initial estimate for implementing the Brown’s Creek impaired biota TMDL is approximately $1,000,000 to $2,000,000. This estimate will be refined when the more detailed implementation plan is developed.
wq-iw6-05b

6. Monitoring Plan
The following monitoring plan lays out the different types of monitoring that will need to be completed in order to track the progress of implementation activities associated with the Brown’s Creek biotic TMDL and of associated changes in water quality due to the management practices. Monitoring should occur after implementation activities are initiated in order to evaluate the effectiveness of the BMPs, and should continue throughout the implementation period until water quality standards are attained. BCWD is committed to continuing their monitoring program in which stream flow and water quality information is collected at multiple sites along Brown’s Creek. As part of the MPCA’s newly developed Watershed Approach to water quality monitoring, the Brown’s Creek watershed will be monitored during 2009 and then again in 2019 as part of a ten-year monitoring cycle. Two sites will be sampled once during the summer for both fish and invertebrate communities. The two sites are Stone Bridge (in between McKusick and WOMP, identified as site #10 of Figure 2 in Appendix A: Stressor Identification) and 110th Street. The following parameters should be incorporated into the overall monitoring plan: · Temperature: Temperature sensors should be stationed to most effectively capture the impact
of BMPs and should monitor temperature during critical storm events and low flow conditions.
· Copper, with hardness, and pH: Copper toxicity varies with both hardness and pH and therefore all three measures should be taken simultaneously. Data collection should involve collecting both total and dissolved copper ambient data. Having both fractions may provide confirmation regarding the source of the copper. The dissolved fraction should be taken so that the data can be compared to the appropriate dissolved copper standard conversion. Collection methods for copper sampling should EPA method 1669, and analytical methods should follow EPA method 1638.
· Total suspended solids: TSS should continue to be a part of the watershed district’s monitoring program.
· Total ammonia, with pH and temp: The concentration of unionized ammonia can be calculated from total ammonia concentration if both temperature and pH data from the same sample are available. Unionized ammonia is the form of ammonia that, in high concentrations, can be directly toxic to fish.
· Stream flow: In order to calculate pollutant loads and to evaluate water quality data with respect to hydrologic regime, continuous stream flow data should be taken at at least one site along Brown’s Creek.
· Fish community: The fish community should be monitored annually to evaluate the impact of management practices that are implemented to address the impairment. Since the trout population can vary annually, mostly due to the success of natural reproduction, annual
wq-iw6-05b

monitoring is needed to fully capture the condition of the fish community. The DNR and BCWD will cooperatively assess the fish community at multiple sites along Brown’s Creek. The focus of the monitoring will be the lower reach, where the natural habitat is more conducive to supporting trout. Since fish sampling can be somewhat disruptive to the fish community, attention will be paid to sampling timing and location. For example, if it is found that there is a breeding trout population in portions of the creek, disruption in this area would be minimized.
· Invertebrate community: The invertebrate community is a good indicator of the thermal environment and can be used to evaluate the habitat and food availability of cold water fish species. Basic invertebrate community monitoring is an important early warning system for detecting unanticipated impacts or changes to the biotic integrity of the stream. In addition to the invertebrate monitoring that will be conducted by the MPCA on a ten-year cycle, more intensive invertebrate monitoring should occur approximately every five years. The following are options for invertebrate monitoring in Brown’s Creek:
a) Intensive year-round monitoring of the invertebrate community, and more specifically the chironomid community, was conducted during 2008 to evaluate the distribution of invertebrates that have different tolerances to low DO, high temperature, and poor habitat quality. This type of monitoring can be used to track changes in the invertebrate community after the implementation of management activities. When results from this study are available, more specific recommendations for further monitoring may be made. This type of monitoring is highly specific and requires individuals that can complete the chironomid analyses.
b) If resources are not available for the highly specific chironomid monitoring, more traditional invertebrate monitoring should be completed. Monitoring should occur at several sites along Brown’s Creek and at least seasonally (once each during spring, summer, winter, and fall).
wq-iw6-05b

7. Public Participation
Public participation for the Brown’s Creek TMDL study consisted of multiple technical advisory committee (TAC), citizen advisory committee (CAC), and stakeholder input meetings. In addition to meetings, a 30-day public comment period will be provided. A. T AC Meetings
1. April 26, 2007 2. May 24, 2007 3. June 13, 2007 4. February 25, 2008 5. April, 28 2008 6. June 23, 2008 7. October 13, 2008 8. January 26, 2009
Meeting summaries
TAC #1: 1. BCWD Biological Impairment Overview 2. Overview of Stressor Identification Process 3. Stream Data Overview 4. Data Gaps & Preliminary Candidate Causes Discussion 5. Discussion of cold-warm water designation 6. Influence of wetlands on phosphorous and carbon
TAC #2: 1. Brown’s Creek Assessment Units 2. Delisting above 110th Street and Listing Extent Below – Effect on Current Workplan 3. Stream Reconnaissance and Other Field Assessments 4. MPCA Fish Survey Planning 5. Macroinvertebrate Assessment 6. Groundwater Analysis 7. Water Monitoring Update 8. Stressor Identification Discussion
TAC #3:
1. DNR Trout Stream Report and Discussion on impairment listing 2. Stream Recon and other Field Assessments 3. Fish Survey Update 4. Macroinvertebrate Assessment, Level of Identification for Temperature Transitions 5. Groundwater Analysis Update 6. Water Monitoring Update 7. Stressor ID and Phase 1 Report
wq-iw6-05b

TAC #4: 1. MPCA Update, Anticipating expanded listing and change in classification 2. TMDL Preparation Schedule 3. Macroinvertebrate Assessment Update, Tiers of Species, Quantification of Winter Ice 4. DNR Trout Stream Report on Sampling 5. MPCA Fish Survey Update, Scenario Developing that Upper Part as Warmwater and
Lower Part as Coldwater Fishery 6. Groundwater Analysis Update, Temperature Variation in Groundwater Contributions 7. Water Monitoring Locations
TAC #5:
1. Monitoring Location Map Presentation 2. Water Monitoring Installation Status, Report of Favorable Storm 3. Macroinvertebrate Assessment Update, Positive Sampling and Positive Landowners 4. DNR Activities Update, Trout Stocking, Beaver Trapping (3), Target Population
Discussion 5. MPCA Activities Update, Proposed More Fish Sampling Instead of Inverts and Focus on
Cold/Warm Boundary 6. Stressor Identification Discussion 7. CAC and Public Involvement Process Update 8. MPCA Stormwater Unit, Connection Between the MS4 Permit and TMDL Allocations
TAC #6:
1. Water Monitoring Update, Trout Observed Upstream of CR 15 2. DNR Activities Update, New Sampling Site Between Hwy 96 and Neal 3. MPCA Activities Update 4. Groundwater Analysis Update 5. Stream Assessment 6. CAC and Public Involvement Process Update 7. Macroinvertebrate Assessment Update, Surface and Groundwater System Strategies 8. Stressor Candidates, Stressor ID Causal Pathways 9. TMDL Modeling
TAC #7:
1. Water Monitoring Update/2009 Monitoring Plan 2. DNR Activities Update, Data Review from Electrofishing 3. MPCA Activities Update 4. Macroinvertebrate Assessment Report, Importance of Winter Biota in Coldwater
Fisheries 5. Groundwater Analysis Results, Three Groundwater Provinces in the Creek 6. Stream Assessment Results 7. Stressor ID Report Discussion, Multiple, Interacting Stressors (TSS, DO, Nitrogen) 8. TMDL Development, Empirical Data Adequate to Develop WLA/LA, Watershed Based
Approach 9. CAC and Public Involvement Next Steps
wq-iw6-05b

TAC #8: 1. WCD/BCWD Activities Update 2. St. Croix Basin TMDL Update 3. DNR Activities Update, Beaver Dam Removals 4. MPCA Activities Update, Watershed Sampling Project for the Lower St Croix 5. Macroinvertebrate Assessment Update 6. Groundwater Analysis Results, Groundwater Source, Age, and Characteristics
a. Delisting Implications b. Integration into Stressor ID c. Impact on TMDL Modeling and Load Allocations
7. TMDL Modeling, Temperature & P8 8. Primary Stressors Discussion 9. CAC and Public Involvement Discussion
TAC meeting invitees and attendees
Attendee and invitees at one of more of these meetings included the following: · Brown’s Creek Watershed District:
o Karen Kill o Rick Vanzwol
· City of Grant o Dianne Hankee
· City of Hugo o Steve Duff
· City of Stillwater o Torry Kraftson o Shawn Sanders
· Emmons & Olivier Resources (Consultant) o Toben Lafrancois o Jason Naber o Gary Oberts o Andrea Plevan o Marcey Westrick
· Metropolitan Council o Jack Frost
· Minnesota Department of Natural Resources o Brian Nerbonne o Molly Shodeen o Nick Proulx
· Minnesota Pollution Control Agency o Craig Affeldt o Chandra Carter o Jeffrey Jasperson o Christopher Klucas o Kim Laing o Joe Magner
wq-iw6-05b

o Anna Kerr · National Park Service
o Byron Karns · St. Croix Research Station
o Jim Almendinger · University of Minnesota
o Calvin Alexander o Scott Alexander o Len Ferrington, Jr. o Mark Green o Bruce Vondracek
· Washington Conservation District o Erik Anderson o Jessica Arendt o Jay Riggs o Travis Thiel
· Washington County o Amanda Strommer o Jessica Collin-Pilarski
B . S takeholder/P ublic Input
· May 1, 2007 public information letter · BCWD Citizen Advisory Committee (CAC) meetings at which Brown’s Creek TMDL was
discussed: May 15 and June 19, 2008. CAC members: q Norman Lee Busse, Stillwater Township q Tom Henderson, Stillwater q Sharon Schwartz, Grant q Bill Pelfrey, Grant q Paul Richtman, Stillwater q Karen Richtman, Stillwater q Dan Kalmon, Stillwater q Luanne Fogelson, Grant
· April 27, 2009 stakeholder meeting and public open house C . P ublic C omment P eriod
The public comment period for the Brown’s Creek Biotic TMDL took place from xxx through xxx (will be filled in after public comment period).
wq-iw6-05b

8. References
Cengal, Y.A., R. Turner. 2001. Fundamentals of Thermal-Fluid Science. Mcgraw-Hill Earhart, G.H. 1984. Monitoring total suspended solids using nephelometry. J. Env. Manag. 8(1):
81-86. Engberg, C.C. 1995. The Regulation and manufacture of brake pads: Feasibility of reformulation
to reduce the copper load to the San Francisco Bay. Report prepared for the Palo Alto Regional Water Quality Control Plant, July 1995.
McCullough, D.A. 1999. A review and synthesis of effects of alterations to the water
temperature regime on freshwater stages of salmonids, with special reference to Chinook salmon. US EPA document EPA 910-R-99-010. 279 pp.
MPCA 2007. Guidance Manual for Assessing the Quality of Minnesota Surface Waters for the
Determination of Impairment: 305(b) Report and 303(d) List. Minnesota Pollution Control Agency, Environmental Outcomes Division.
Myrick, C.A., J.J. Cech, Jr. 1996. The effects of elevated rearing temperatures and genetics on
trout bioenergetics. Applied Environmental Physiology of Fishes, Proc. Inter. Cong. Biol. Fishes, 14-18 July 1996. San Francisco State U., CA.
Wang, L., J. Lyons, P. Kanahel. 2003a. Impacts of urban land cover on trout streams in
Wisconsin and Minnesota. Trans. Am. Fish. Soc. 132: 825-839. Wang, L., J.Lyons, P. Rasmussen, P. Kanahel, P. Seelbach, T. Simon, M.Wiley, E. Baker, S.
Niemala, M. Stewart. 2003b. Influences of landscape and reach scale habitat on stream fish communities in the Northern Lakes and Forest ecoregion. Can. J. Fish and Aquat. Sci. 60:491-505.
Wherly, K.E., L. Wang. 2007. Field-based estimates of thermal tolerance limits for trout:
Incorporating exposure time and temperature fluctuation. Trans. Amer. Fish. Soc. 136: 365-374.
wq-iw6-05b

9. Appendices
Appendix A. Brown’s Creek Stressor Identification Posted online at: http://www.pca.state.mn.us/index.php?option=com_docman&task=doc_download&gid=10551&Itemid Appendix B. P8 Modeling of Total Suspended Solids
wq-iw6-05b

Brown’s Creek Impaired Biota TMDL
Appendix B: TSS Modeling
wq-iw6-05b

Appendix B: TSS Modeling A. P8 INTRODUCTION P8 was used to model the total suspended solids (TSS) within Brown’s Creek in support of the TMDL. Brown’s Creek has an approximate 19,000-acre watershed, including portions of the City of Stillwater, City of Oak Park Heights, City of Lake Elmo, City of Grant, City of Hugo, May Township, and Stillwater Township. The lakes in Hugo and May Township form the headwaters of Brown’s Creek. The creek begins in May Township and flows south through the City of Grant, with much of this portion of the drainage-way consisting of broad, low-lying wetlands. Brown’s Creek continues through Stillwater Township and the City of Stillwater as a narrow meandering flowage with gentle side slopes transitioning to steep bluffs as it continues to the St. Croix River. Approximately 72 percent of the BCWD flows regularly overland or is semi-landlocked. The remaining 28 percent is composed of landlocked basins producing no regular overland flows to Brown’s Creek. Purpose of Model
The P8 water quality modeling effort was undertaken for three primary reasons:
1) Expand on the Long Lake P8 model to create a district-wide model for general use. 2) Identify areas that improved stormwater management would most benefit the creek. 3) Quantify the changes necessary to meet TMDL allocations and loading goals.
Model Geographical Extents
Three different P8 computer models make up the entire BCWD district-wide model (Figure 1). They are divided based on contribution to the creek into a 1) contributing drainage area model, and 2) a landlocked area model. These models, along with 3) the Long Lake model created for the Long Lake drawdown feasibility project, encompass the entire district. The model completed as part of the TMDL project is the contributing drainage area model.
wq-iw6-05b

Figure 1 Geographical extents of the BCWD modeling areas showing major contributing drainage area subwatersheds.
wq-iw6-05b
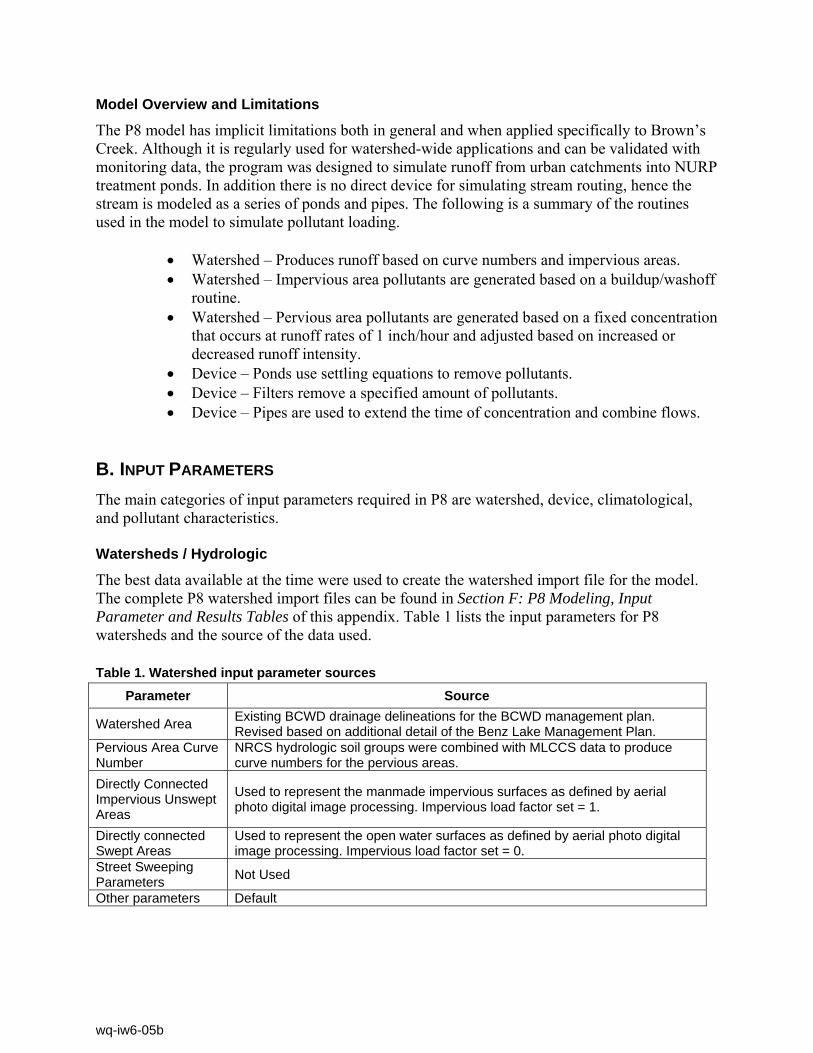
Model Overview and Limitations
The P8 model has implicit limitations both in general and when applied specifically to Brown’s Creek. Although it is regularly used for watershed-wide applications and can be validated with monitoring data, the program was designed to simulate runoff from urban catchments into NURP treatment ponds. In addition there is no direct device for simulating stream routing, hence the stream is modeled as a series of ponds and pipes. The following is a summary of the routines used in the model to simulate pollutant loading.
• Watershed – Produces runoff based on curve numbers and impervious areas. • Watershed – Impervious area pollutants are generated based on a buildup/washoff
routine. • Watershed – Pervious area pollutants are generated based on a fixed concentration
that occurs at runoff rates of 1 inch/hour and adjusted based on increased or decreased runoff intensity.
• Device – Ponds use settling equations to remove pollutants. • Device – Filters remove a specified amount of pollutants. • Device – Pipes are used to extend the time of concentration and combine flows.
B. INPUT PARAMETERS The main categories of input parameters required in P8 are watershed, device, climatological, and pollutant characteristics. Watersheds / Hydrologic
The best data available at the time were used to create the watershed import file for the model. The complete P8 watershed import files can be found in Section F: P8 Modeling, Input Parameter and Results Tables of this appendix. Table 1 lists the input parameters for P8 watersheds and the source of the data used. Table 1. Watershed input parameter sources
Parameter Source
Watershed Area Existing BCWD drainage delineations for the BCWD management plan. Revised based on additional detail of the Benz Lake Management Plan.
Pervious Area Curve Number
NRCS hydrologic soil groups were combined with MLCCS data to produce curve numbers for the pervious areas.
Directly Connected Impervious Unswept Areas
Used to represent the manmade impervious surfaces as defined by aerial photo digital image processing. Impervious load factor set = 1.
Directly connected Swept Areas
Used to represent the open water surfaces as defined by aerial photo digital image processing. Impervious load factor set = 0.
Street Sweeping Parameters Not Used
Other parameters Default
wq-iw6-05b

One of the most important inputs to hydrologic and water quality models is the impervious surface area in the watershed. Aerial photography was used to calculate the areas of roads, rooftops, and open water within the district (Figure 2). This technique has been used in other models and has been shown to be the most accurate method of automatic impervious cover generation. In water quality models it is particularly important to distinguish between manmade impervious and open water, because open water will be contributing to the stream inputs in a much different way than roads and rooftops. For this model, impervious surface areas were divided into manmade impervious and naturally occurring impervious using aerial photos and digital image processing. Impervious surface estimates were extracted from 2008 Farm Service Agency (FSA) 1-meter resolution aerial photography using digital image processing techniques. A supervised maximum likelihood classification using a sample priori probability was performed using 91 training samples representing urban, urban shadow, vegetation, vegetation shadow, and open water land cover types. Some urban and water features were burned into the classification manually to obtain a higher accuracy classification. Burned-in water features included polygon areas representing open water MLCCS codes. Some areas classified as urban were also manually burned into the classification using polygons created by heads up digitizing. After manual edits were finished, the final classification consisted of urban (100% impervious), vegetation (0% impervious), and water (100% impervious) land cover types. Percent impervious weighted averages per subwatershed were then extracted using a zonal statistics routine.
wq-iw6-05b

Figure 2. Impervious Coverage Based on 2008 Aerial Photo Analysis
wq-iw6-05b

Devices / Hydraulics
The pond geometry used in the P8 model was constructed based on the existing XP-SWMM model and the water surface areas calculated using digital image processing. A complete list of the device inputs including modeling notes and descriptions of inputs is located in Section F: P8 Modeling, Input Parameter and Results Tables of this appendix Climatology
For calibration, two stations were used for temperature and rainfall input, both available on the climatology data retrieval page of the University of Minnesota Climatology working group. The primary gauge is the Stillwater gauge 218037; the secondary gauge, used to fill gaps in the Stillwater data, was Forest Lake 212881. The Forest Lake data were used to replace one record. October 1, 1994 through September 30, 1995 was used as the analysis period that is representative of an average year. For more information on this time period climatology please see the Long Lake Feasibility Study (BCWD 2008). Pollutants
The only pollutant of concern for this investigation was total suspended solids (TSS). The default pollutant file, NURP50.p8p, was used for all analyses. TSS was calibrated as described in the calibration section of this report. Groundwater Flows
Groundwater flows are an important component of the water in Brown’s Creek. At the time that the P8 model was prepared, groundwater data were not conclusive regarding time of concentration, recharge/discharge areas, and shallow and deep groundwater aquifer components, and the groundwater component was not used. Therefore, the P8 model was calibrated to stormflows only. As groundwater information becomes available it will be possible to incorporate these processes into the P8 model. C. CALIBRATION AND VERIFICATION Volume and Flows
The first step to calibrating a water quality model is to calibrate the runoff volumes. Four stream monitoring stations were available to accomplish this goal. The data were reviewed compared to modeled flow data. The model was calibrated to recorded flows on Brown’s Creek at four stations throughout the district: 110th St., Highway 15, McKusick Road, and the WOMP station at Highway 96. Baseflow separation was conducted on the streamflow data and only stormflows were analyzed. As additional groundwater information becomes available, it will be possible to incorporate the data into P8 to create a more dynamic model.
wq-iw6-05b

Table 2. Volume calibration summary
Station Name Calibration Period Monitored Volume (ac-ft)
Modeled Volume (ac-ft)
110th St. 4/11/2007 – 10/30/2007 172 181
Highway 15 3/30/2006 – 10/31/2006, 3/26/2007 – 10/30/2007 1,374 1,462
McKusick Road
3/28/2006 – 10/31/2006, 4/15//2007 – 10/29/2007 1,801 1,706
WOMP 1/1/2006 – 12/30/2007 2,845 3,039 The GIS generated curve numbers were lowered by approximately 10% throughout the district, and the depressional storage in the large flat wetland complexes along the creek (UBC-10a, CBC-10, and CBC-11, see Figure 1) were increased from the default of 0.0 to 0.1 inches. No other model modifications were necessary to match flows for 2006-2007. Total Suspended Solids
The TSS in Brown’s Creek was calibrated at WOMP. The TSS scale factor was increased by 18 times; this is a standard calibration factor that increases the overall amount of sediment in runoff. Following the WOMP station calibration, the other station monitoring data were qualitatively compared to the modeled values to verify that the calibration encompassed the entire watershed. Table 3 is the summary of the calibrated model at the WOMP station. The comparison of TSS at 110th shows that concentrations are in general agreement, although the monitored TSS concentrations are higher than modeled in the late summer. This is likely due to algae in the upstream wetlands. Highway 15 modeled TSS matched monitored data well and had lower concentrations than at 110th. The late August increase was also apparent at this location. The model shows that there is a marked increase in TSS between Highway 15 and McKusick; this is to be expected as there is no ponding between these stations and a moderate amount of imperviousness. Table 3. Total suspended solids calibration summary at WOMP
Time Period P8
Modeled (lbs)
TSS Monitored [LOADEST distributed MLE] (lbs)
2-Year Load 2,700,895 2,777,647 2006 1,299,960 1,304,872 2007 1,400,936 1,469,776
LOAD ESTimator (LOADEST), developed by the USGS, was used for estimating the monitored TSS loads in streams and rivers. Given the time series of streamflow from the WOMP station and TSS sample concentrations throughout the period of record, LOADEST assisted in developing a regression model for the estimation of the daily constituent load. The formulated regression model was then used to provide mean load estimates, standard error, and 95% confidence intervals over the time period modeled in P8.
wq-iw6-05b

The Maximum Likelihood Estimation (MLE) method was chosen in LOADEST based on the calibration model errors (residuals) being normally distributed and uncensored. The WOMP input calibration file contained 114 sample concentrations with associated flow from 8/8/2000 to 9/30/2007. The estimation file to determine daily load was from the WOMP period of record (daily flow 8/4/2000 to 12/31/2007). LOADEST was run with the automatic model selection for best fit based on Akaike Information Criterion (AIC). Model # 8 from the preset regression models was chosen and displayed below. Ln(Load) = [a0 + a1 LnQ + a2 LnQ2 + a3 Sin(2π dtime) + a4 Cos(2 π dtime) + a5 dtime] Where: Load = constituent load [kg/d] LnQ = Ln(Q) - center of Ln(Q) dtime = decimal time - center of decimal time And: a0 a1 a2 a3 a4 a5 ---------------------------------------------------------------------- MLE 6.9344 3.3498 -0.5907 0.1394 -0.4553 0.1192 R-Squared: 68.74% D. VERIFICATION An important and often overlooked part of modeling is the verification process. This involves selecting a different time period than used in the calibration procedure and checking the model performance. Table 4 and Table 5 show the periods used for model verification. Based on these results it is reasonable to assume that the model will provide accurate results for time periods other than the calibration period. Table 4. Volume verification summary
Station Name Verification Period Monitored Volume (ac-ft)
Modeled Volume (ac-ft)
110th St. None - - Highway 15 3/23/2005 – 11/02/2005 1,052 902 McKusick Road 3/22/2005 – 11/02/2005 1,163 1,171 WOMP 1/25/2005 – 12/30/2005 1,800 1,689
Table 5. Total suspended solids verification summary for WOMP
Verification Period Modeled Load (lbs) Monitored Load [LOADEST distributed AMLE] (lbs)
1/25/2005 – 12/30/2005 1,660,844 1,502,151
wq-iw6-05b
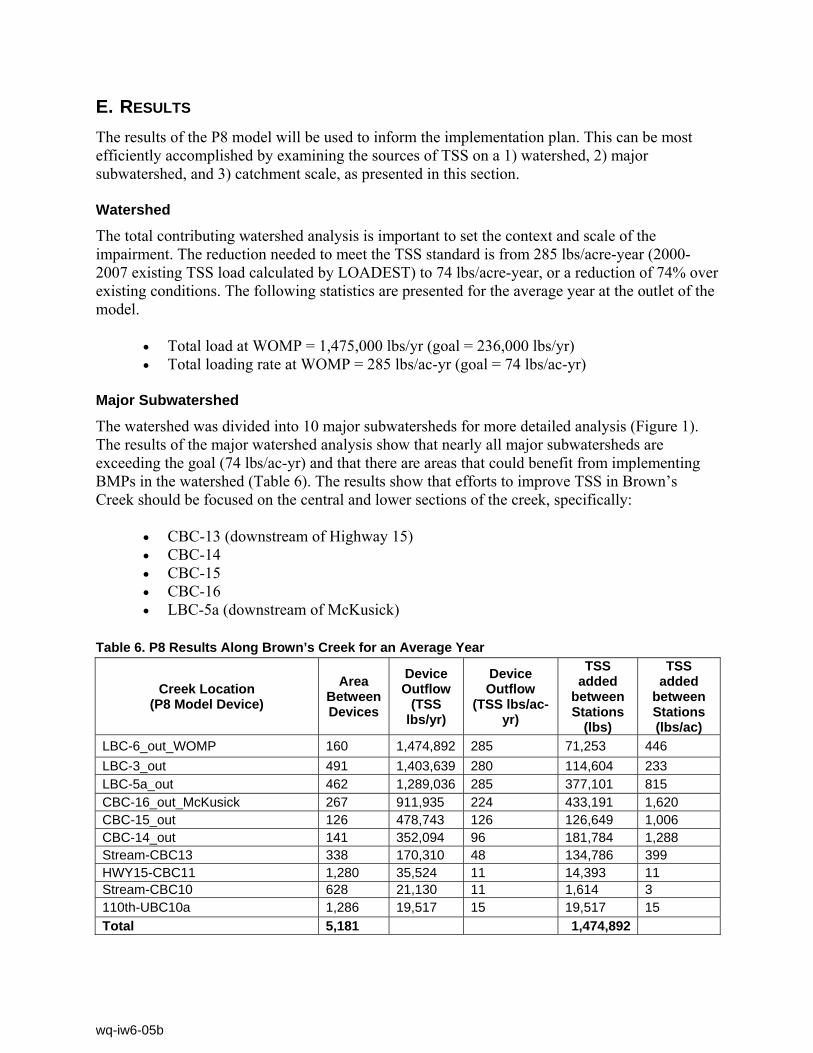
E. RESULTS The results of the P8 model will be used to inform the implementation plan. This can be most efficiently accomplished by examining the sources of TSS on a 1) watershed, 2) major subwatershed, and 3) catchment scale, as presented in this section. Watershed
The total contributing watershed analysis is important to set the context and scale of the impairment. The reduction needed to meet the TSS standard is from 285 lbs/acre-year (2000-2007 existing TSS load calculated by LOADEST) to 74 lbs/acre-year, or a reduction of 74% over existing conditions. The following statistics are presented for the average year at the outlet of the model.
• Total load at WOMP = 1,475,000 lbs/yr (goal = 236,000 lbs/yr) • Total loading rate at WOMP = 285 lbs/ac-yr (goal = 74 lbs/ac-yr)
Major Subwatershed
The watershed was divided into 10 major subwatersheds for more detailed analysis (Figure 1). The results of the major watershed analysis show that nearly all major subwatersheds are exceeding the goal (74 lbs/ac-yr) and that there are areas that could benefit from implementing BMPs in the watershed (Table 6). The results show that efforts to improve TSS in Brown’s Creek should be focused on the central and lower sections of the creek, specifically:
• CBC-13 (downstream of Highway 15) • CBC-14 • CBC-15 • CBC-16 • LBC-5a (downstream of McKusick)
Table 6. P8 Results Along Brown’s Creek for an Average Year
Creek Location (P8 Model Device)
Area Between Devices
Device Outflow
(TSS lbs/yr)
Device Outflow
(TSS lbs/ac-yr)
TSS added
between Stations
(lbs)
TSS added
between Stations (lbs/ac)
LBC-6_out_WOMP 160 1,474,892 285 71,253 446 LBC-3_out 491 1,403,639 280 114,604 233 LBC-5a_out 462 1,289,036 285 377,101 815 CBC-16_out_McKusick 267 911,935 224 433,191 1,620 CBC-15_out 126 478,743 126 126,649 1,006 CBC-14_out 141 352,094 96 181,784 1,288 Stream-CBC13 338 170,310 48 134,786 399 HWY15-CBC11 1,280 35,524 11 14,393 11 Stream-CBC10 628 21,130 11 1,614 3 110th-UBC10a 1,286 19,517 15 19,517 15 Total 5,181 1,474,892
wq-iw6-05b

Catchment
Figure 4 shows the 42 catchments used for the P8 modeling. Table 7 shows the loading by catchment. Of note is that the upper watershed is generating a significant amount of TSS but the buffering capacity of the open water in the upper watershed is mitigating this input before it can become a problem in the stream. Figure 3 shows which catchments are producing the majority of the TSS on an annual basis. This map shows total loads; therefore the larger catchments generally show higher loads than the smaller catchments. Figure 4 shows the same information normalized by catchment area.
Table 7. Catchment TSS Load Catchment Area (acres) TSS Loading Rate (lbs/yr-acre) CBC-10 628 351 CBC-11 581 373 CBC-12 101 935 CBC-13 337 551 CBC-14 141 1302 CBC-15 126 1088 CBC-16 267 1648 CBC-4 135 1090 CBC-7 59 193 CBC-8 402 839 LBC-1 118 859 LBC-10 56 1307 LBC-2 155 483 LBC-3 91 960 LBC-3a 19 16 LBC-3b 75 1071 LBC-3c 2 20 LBC-3d 5 254 LBC-3e 26 1446 LBC-4 77 842 LBC-5a 255 1434 LBC-5b 41 3294 LBC-5c 2 69 LBC-5d 5 24 LBC-5e 17 1492 LBC-6 78 1057 LBC-6a 26 1358 LBC-7a 39 735 LBC-7b 19 3880 LBC-8 6 2020 UBC-10a 744 532 UBC-6 93 852 UBC-7 115 530 UBC-8 262 480 UBC-9 71 764
wq-iw6-05b

Figure 3. TSS contribution by catchment for an average runoff year
wq-iw6-05b

Figure 4. TSS contribution by catchment for an average runoff year normalized by area
Brown’s Creek Impaired Biota TMDL – Appendix B: TSS Modeling 12 Emmons & Olivier Resources, Inc. wq-iw6-05b

F. P8 MODELING: INPUT PARAMETERS AND RESULTS TABLES
wq-iw6-05b

Watershed Device Name Out TypeDiameter or Length (ft) Coefficient Downstream Device
Particle Removal Factor
Bottom Elevation Bottom (ac)
Permanent Pool (ac)
Permanent Pool Volume (ac-ft)
Permanent Pool Infiltration Rate (in/hr)
Flood Pool (ac)
Flood Pool Volume (ac-ft)
Flood Pool Infiltration Rate (in/hr) SWMM Out
Modeling Notes
Direct Drainage Area
From XP-SWMM Model: Pipes and culverts described as equivalent orifaces, Wiers, open channels and natural sections described as weirs.
Diameter of orifices created by combining all culverts into an equivalent oriface by adjusting the area of the oriface. Default Routing from XP-SWMM
Initially set to 1, used for calibration Zero
Equal to 25% of the Permanent Pool Area
Total Area of water within the Direct Drainage Area. Based on Summer 2008 photography.
Assumes 4' Average Depth
Assumes zero as default, adjusted based on calibration
1.5 times the permanent pool volume
Assumes zero as default, adjusted based on calibration
XP-SWMM model reviewed and out information used to create equivalent out
CBC-10 CBC-10_out Orifice 8.6 0.6 CBC-11_out 1 0 11.1 44.4 177.6 0.00 66.6 266.4 0.00 See notes, TPM 12/19/2008CBC-11 CBC-11_out Orifice 6.6 0.6 CBC-13_out 1 0 8.3 33.3 133.2 0.00 50.0 199.8 0.00 See notes, TPM 12/19/2008CBC-12 CBC-12_out Orifice 1.0 0.6 CBC-11_out 1 0 1.6 6.4 25.6 0.00 9.6 38.3 0.00 See notes, TPM 12/19/2008CBC-13 CBC-13_out Orifice 7.8 0.6 CBC-14_out 1 0 0.7 2.9 11.6 0.00 4.3 17.4 0.00 See notes, TPM 12/19/2008CBC-14 CBC-14_out Orifice 11.1 0.6 CBC-15_out 1 0 0.7 2.7 10.8 0.00 4.1 16.2 0.00 See notes, TPM 12/19/2008CBC-15 CBC-15_out Orifice 8.4 0.6 CBC-16_out 1 0 0.4 1.4 5.7 0.00 2.1 8.5 0.00 See notes, TPM 12/19/2008CBC-16 CBC-16_out Orifice 11.1 0.6 LBC-5a_out 1 0 2.3 9.2 36.9 0.00 13.8 55.3 0.00 See notes, TPM 12/19/2008CBC-2 CBC-2_out Orifice 2.0 0.6 CBC-4_out 1 0 12.8 51.3 205.3 0.00 77.0 307.9 0.00 See notes, TPM 12/19/2008CBC-4 CBC-4_out Orifice 2.0 0.6 CBC-8_out 1 0 4.3 17.4 69.6 0.00 26.1 104.4 0.00 See notes, TPM 12/19/2008CBC-7 CBC-7_out Weir 10.0 3.3 CBC-8_out 1 0 0.3 1.3 5.2 0.00 1.9 7.8 0.00 See notes, TPM 12/19/2008CBC-8 CBC-8_out Orifice 3.0 0.6 CBC-11_out 1 0 2.2 8.7 34.9 0.00 13.1 52.4 0.00 See notes, TPM 12/19/2008GSL-10 GSL-10_out Orifice 1.5 0.6 GSL-11_out 1 0 0.1 0.4 1.7 0.00 0.6 2.5 0.00 See notes, TPM 12/19/2008GSL-11 GSL-11_out Weir 10.0 3.3 GSL-7_out 1 0 2.1 8.4 33.6 0.00 12.6 50.4 0.00 See notes, TPM 12/19/2008GSL-12 GSL-12_out Orifice 3.0 0.6 GSL-20_out 1 0 58.3 233.3 933.2 0.00 350.0 1399.8 0.00 See notes, TPM 12/19/2008GSL-17 GSL-17_out Weir 10.0 3.3 GSL-18_out 1 0 7.1 28.3 113.1 0.00 42.4 169.6 0.00 See notes, TPM 12/19/2008GSL-18 GSL-18_out Orifice 1.5 0.6 GSL-20_out 1 0 2.6 10.3 41.3 0.00 15.5 61.9 0.00 See notes, TPM 12/19/2008GSL-19 GSL-19_out Weir 10.0 3.3 GSL-20_out 1 0 2.3 9.2 36.9 0.00 13.8 55.3 0.00 See notes, TPM 12/19/2008GSL-20 GSL-20_out Orifice 1.0 0.6 UBC-10a_out 1 0 30.9 123.5 494.1 0.00 185.3 741.2 0.00 See notes, TPM 12/19/2008GSL-21 GSL-9_out Pipe Pipe Pipe No Structure, flows to GSL-9 1 0 1.1 4.5 18.0 0.00 6.7 27.0 0.00 See notes, TPM 12/19/2008 Device not modeled, pool storage combined with GSL-9GSL-22 GSL-9_out Pipe Pipe Pipe No Structure, flows to GSL-9 1 0 0.0 0.0 0.0 0.00 0.0 0.1 0.00 See notes, TPM 12/19/2008 Devices with Permanent Pool Volume <0.1 AC-FT modeled as pipes with TOC of 30 minutesGSL-4 GSL-4_out Orifice 1.5 0.6 GSL-7_out 1 0 4.5 18.2 72.7 0.00 27.3 109.1 0.00 See notes, TPM 12/19/2008GSL-5 GSL-5_out Orifice 1.5 0.6 GSL-7_out 1 0 1.9 7.5 29.8 0.00 11.2 44.7 0.00 See notes, TPM 12/19/2008GSL-6 GSL-6_out Weir 10 3 GSL-7_out 1 0 11.4 45.5 182.1 13.00 68.3 273.1 0.00 See notes, TPM 3/20/2008 Added later after it was discovered that it is contributing, not landlockedGSL-7 GSL-7_out Weir 10.0 3.3 GSL-12_out 1 0 19.0 75.9 303.5 0.00 113.8 455.2 0.00 See notes, TPM 12/19/2008GSL-8 GSL-8_out Weir 10.0 3.3 GSL-10_out 1 0 5.8 23.3 93.1 0.00 34.9 139.6 0.00 See notes, TPM 12/19/2008GSL-9 GSL-9_out Orifice 1.5 0.6 GSL-10_out 1 0 2.5 10.0 40.0 0.00 15.0 60.0 0.00 See notes, TPM 12/19/2008 Pool Volumes and areas include GSL-21.KPL-6 KPL-6_out Orifice 2.0 0.6 CBC-10_out 1 0 22.8 91.3 365.3 0.00 137.0 548.0 0.00 See notes, TPM 12/19/2008LBC-1 LBC-1_out Orifice 2.0 0.6 LBC-2_out 1 0 0.0 0.1 0.5 0.00 0.2 0.8 0.00 See notes, TPM 12/19/2008LBC-10 LBC-10_out Orifice 4.0 0.6 LBC-6_out 1 0 0.6 2.2 8.9 0.00 3.3 13.3 0.00 See notes, TPM 12/19/2008LBC-2 LBC-2_out Weir 10.0 3.3 LBC-3_out 1 0 0.1 0.2 0.9 0.00 0.3 1.3 0.00 See notes, TPM 12/19/2008LBC-3 LBC-3_out Weir 20.0 3.3 LBC-4_out 1 0 0.3 1.1 4.4 0.00 1.7 6.6 0.00 See notes, TPM 12/19/2008LBC-3a LBC-3a_out Orifice 5.5 0.6 LBC-3x_out 1 0 0.0 0.0 0.0 0.00 0.0 0.1 0.00 See notes, TPM 12/19/2008 Devices with Permanent Pool Volume <0.1 AC-FT modeled as pipes with TOC of 30 minutesLBC-3b LBC-3b_out Orifice 4.0 0.6 LBC-3_out 1 0 0.8 3.1 12.5 0.00 4.7 18.7 0.00 See notes, TPM 12/19/2008LBC-3c LBC-3c_out Orifice 3.9 0.6 LBC-3x_out 1 0 0.0 0.0 0.0 0.00 0.0 0.0 0.00 See notes, TPM 12/19/2008 Devices with Permanent Pool Volume <0.1 AC-FT modeled as pipes with TOC of 30 minutesLBC-3d LBC-3d_out Orifice 4.0 0.6 LBC-3x_out 1 0 0.0 0.0 0.1 0.00 0.0 0.1 0.00 See notes, TPM 12/19/2008 Devices with Permanent Pool Volume <0.1 AC-FT modeled as pipes with TOC of 30 minutesLBC-3e LBC-3e_out Orifice 4.0 0.6 LBC-3_out 1 0 0.0 0.1 0.4 0.00 0.1 0.5 0.00 See notes, TPM 12/19/2008LBC-4 LBC-4_out Orifice 1.5 0.6 LBC-5a_out 1 0 1.1 4.4 17.7 0.00 6.6 26.5 0.00 See notes, TPM 12/19/2008LBC-5a LBC-5a_out Weir 20.0 3.3 LBC-3_out 1 0 0.6 2.2 8.9 0.00 3.3 13.3 0.00 See notes, TPM 12/19/2008LBC-5b LBC-5b_out Orifice 3.0 0.6 LBC-5a_out 1 0 0.1 0.4 1.8 0.00 0.7 2.7 0.00 See notes, TPM 12/19/2008LBC-5c LBC-5c_out Orifice 2.0 0.6 LBC-5x_out 1 0 0.0 0.0 0.0 0.00 0.0 0.0 0.00 See notes, TPM 12/19/2008 Devices with Permanent Pool Volume <0.1 AC-FT modeled as pipes with TOC of 30 minutesLBC-5d LBC-5d_out Orifice 2.7 0.6 LBC-5x_out 1 0 0.0 0.0 0.0 0.00 0.0 0.0 0.00 See notes, TPM 12/19/2008 Devices with Permanent Pool Volume <0.1 AC-FT modeled as pipes with TOC of 30 minutesLBC-5e LBC-5e_out Orifice 3.0 0.6 LBC-5x_out 1 0 0.0 0.0 0.0 0.00 0.0 0.1 0.00 See notes, TPM 12/19/2008 Devices with Permanent Pool Volume <0.1 AC-FT modeled as pipes with TOC of 30 minutesLBC-6 LBC-6_out Weir 10.0 3.3 OUT 1 0 0.1 0.5 2.1 0.00 0.8 3.2 0.00 See notes, TPM 12/19/2008LBC-6a LBC-6a_out Orifice 4.0 0.6 LBC-6_out 1 0 0.0 0.1 0.4 0.00 0.2 0.6 0.00 See notes, TPM 12/19/2008 Permanent pool increased to 0.1 from 0.049LBC-7a LBC-7a_out Orifice 2.3 0.6 LBC-7b_out 1 0 2.6 10.3 41.1 0.00 15.4 61.7 0.00 See notes, TPM 12/19/2008LBC-7b LBC-7b_out Orifice 1.0 0.6 LBC-5a_out 1 0 0.0 0.2 0.7 0.00 0.3 1.0 0.00 See notes, TPM 12/19/2008LBC-8 LBC-8_out Orifice 3.0 0.6 LBC-7a_out 1 0 0.0 0.0 0.1 0.00 0.0 0.1 0.00 See notes, TPM 12/19/2008 Devices with Permanent Pool Volume <0.1 AC-FT modeled as pipes with TOC of 30 minutesUBC-10a UBC-10a_out Orifice 3.0 0.6 CBC-10_out 1 0 4.0 16.0 64.1 0.00 24.0 96.1 0.00 See notes, TPM 12/19/2008 UBC-10b-l are routed to 10a or 10x because they contain less than 0.1 ac-ft of storageUBC-6 UBC-6_out Orifice 2.0 0.6 UBC-10a_out 1 0 0.5 2.2 8.7 0.00 3.3 13.1 0.00 See notes, TPM 12/19/2008UBC-7 UBC-7_out Orifice 2.7 0.6 UBC-9_out 1 0 0.4 1.5 5.9 0.00 2.2 8.9 0.00 See notes, TPM 12/19/2008UBC-8 UBC-8_out Orifice 2.7 0.6 UBC-10a_out 1 0 2.2 8.6 34.4 0.00 12.9 51.6 0.00 See notes, TPM 12/19/2008UBC-9 UBC-9_out Orifice 3.0 0.6 UBC-10a_out 1 0 0.1 0.3 1.3 0.00 0.5 1.9 0.00 See notes, TPM 12/19/2008None LBC-3x_out Pipe Dummy pipe with 0.0 TOC to work around P8 device limitationsNone UBC-10x_out Pipe Dummy pipe with 0.0 TOC to work around P8 device limitationsNone LBC-5x_out Pipe Dummy pipe with 0.0 TOC to work around P8 device limitationsUBC-5a UBC-5a_out Orifice 1 0.6 UBC-5d_out 1 0 0.5 1.9 7.5 0.00 2.8 11.3 0.00 No structures surveyed, assume 12"UBC-5b UBC-5b_out Orifice 1 0.6 UBC-5d_out 1 0 0.1 0.4 1.7 0.00 0.6 2.6 0.00 No structures surveyed, assume 12"UBC-5c UBC-5c_out Orifice 1 0.6 UBC-5d_out 1 0 0.0 0.2 0.8 0.00 0.3 1.1 0.00 No structures surveyed, assume 12"UBC-5d UBC-5d_out Orifice 1 0.6 UBC-5e_out 1 0 1.2 4.6 18.5 0.00 6.9 27.7 0.00 No structures surveyed, assume 12"UBC-5e UBC-5e_out Orifice 1 0.6 UBC-5f_out 1 0 1.3 5.2 20.9 0.00 7.8 31.4 0.00 12" surveyedUBC-5f UBC-5f_out Weir 10 3.3 UBC-10a_out 1 0 9.6 38.6 154.3 0.00 57.9 231.4 0.00 See notes, TPM 12/19/2008
Contributing Area Device Inputs
wq-iw6-05b

Watershed Device Name Outlet Type Diameter or Length (ft) CoefficientDownstream Device
Particle Removal Factor
Bottom Elevation
Bottom (ac)
Permanent Pool (ac)
Permanent Pool Volume (ac-ft)
Permanent Pool Infiltration Rate (in/hr)
Flood Pool (ac)
Flood Pool Volume (ac-ft)
Flood Pool Infiltration Rate (in/hr) SWMM Outlet
Direct Drainage Area
From XP-SWMM Model: Pipes and culverts described as equivalent orifaces, Wiers, open channels and natural sections described as weirs.
Diameter of orifices created by combining all culverts into an equivalent oriface by adjusting the area of the oriface. Default Routing from XP-SWMM
Initially set to 1, used for calibration Zero
Equal to 25% of the Permanent Pool Area
Total Area of water within the Direct Drainage Area. Based on Summer 2008 photography.
Assumes 4' Average Depth
Assumes zero as default, adjusted based on calibration
1.5 times the permanent pool volume
Assumes zero as default, adjusted based on calibration
LBC-9 LBC-9_out NONE Infinite Infinite OUT 1 0 0.0 0.1 0.3 0.00 0.1 0.4 0.00 See notes, TPM 12/19/2008THPP-1 THPP-1_out Orifice 2.8 0.6 THPP-4_outlet 1 0 0.2 0.7 2.7 0.00 1.0 4.1 0.00 See notes, TPM 12/19/2008THPP-2 THPP-2_out Orifice 2.0 0.6 THPP-4_outlet 1 0 0.0 0.1 0.6 0.00 0.2 0.9 0.00 See notes, TPM 12/19/2008THPP-3 THPP-3_out Orifice 2.0 0.6 THPP-4_outlet 1 0 0.2 0.6 2.6 0.00 1.0 3.8 0.00 See notes, TPM 12/19/2008THPP-4 THPP-4_out Orifice 5.0 0.6 THPP-5_outlet 1 0 0.1 0.5 1.9 0.00 0.7 2.8 0.00 See notes, TPM 12/19/2008THPP-5 THPP-5_out Orifice 2.0 0.6 THPP-6_outlet 1 0 0.0 0.1 0.4 0.00 0.1 0.6 0.00 See notes, TPM 12/19/2008THPP-6 THPP-6_out Orifice 2.7 0.6 THPP-7_outlet 1 0 0.1 0.4 1.7 0.00 0.6 2.5 0.00 See notes, TPM 12/19/2008THPP-7 THPP-7_out Orifice 2.5 0.6 THPP-8_outlet 1 0 0.0 0.1 0.4 0.00 0.2 0.7 0.00 See notes, TPM 12/19/2008THPP-8 THPP-8_out Orifice 2.5 0.6 OUT 1 0 0.1 0.5 2.0 0.00 0.7 2.9 0.00 See notes, TPM 12/19/2008THPP-9 THPP-9_out Weir 10.0 3.3 THPP-7_outlet 1 0 0.0 0.1 0.5 0.00 0.2 0.8 0.00 See notes, TPM 12/19/2008CBC-1 CBC-1_out NONE Infinite Infinite OUT 1 0 1.4 5.6 22.4 1.00 8.4 33.6 0.00 See notes, TPM 3/20/2008CBC-3 CBC-3_out NONE Infinite Infinite OUT 1 0 2.6 10.5 41.9 2.00 15.7 62.9 0.00 See notes, TPM 3/20/2008CBC-5 CBC-5_out NONE Infinite Infinite OUT 1 0 1.7 6.7 26.7 3.00 10.0 40.0 0.00 See notes, TPM 3/20/2008CBC-6 CBC-6_out NONE Infinite Infinite OUT 1 0 2.4 9.6 38.3 4.00 14.3 57.4 0.00 See notes, TPM 3/20/2008CBC-9 CBC-9_out NONE Infinite Infinite OUT 1 0 8.4 33.4 133.8 5.00 50.2 200.6 0.00 See notes, TPM 3/20/2008GSL-1 GSL-1_out NONE Infinite Infinite OUT 1 0 1.7 7.0 27.8 6.00 10.4 41.7 0.00 See notes, TPM 3/20/2008GSL-13 GSL-13_out NONE Infinite Infinite OUT 1 0 7.7 30.7 122.7 7.00 46.0 184.0 0.00 See notes, TPM 3/20/2008GSL-14 GSL-14_out NONE Infinite Infinite OUT 1 0 21.2 84.7 338.9 8.00 127.1 508.4 0.00 See notes, TPM 3/20/2008GSL-15 GSL-15_out Weir 10 3.3 GSL-14_out 1 0 7.4 29.5 118.1 9.00 44.3 177.2 0.00 See notes, TPM 3/20/2008GSL-16 GSL-16_out NONE Infinite Infinite OUT 1 0 3.2 12.7 50.8 10.00 19.0 76.2 0.00 See notes, TPM 3/20/2008GSL-2 GSL-2_out NONE Infinite Infinite OUT 1 0 3.1 12.4 49.7 11.00 18.6 74.6 0.00 See notes, TPM 3/20/2008GSL-3 GSL-3_out NONE Infinite Infinite OUT 1 0 1.1 4.5 18.1 12.00 6.8 27.2 0.00 See notes, TPM 3/20/2008KPL-1 KPL-1_out NONE Infinite Infinite OUT 1 0 9.6 38.3 153.0 14.00 57.4 229.5 0.00 See notes, TPM 3/20/2008KPL-2 KPL-2_out NONE Infinite Infinite OUT 1 0 16.7 66.8 267.3 15.00 100.2 400.9 0.00 See notes, TPM 3/20/2008KPL-3 KPL-3_out NONE Infinite Infinite OUT 1 0 2.8 11.2 44.6 16.00 16.7 66.9 0.00 See notes, TPM 3/20/2008KPL-4 KPL-4_out Weir 10 3.3 KPL-5_out 1 0 4.5 18.1 72.4 17.00 27.1 108.6 0.00 See notes, TPM 3/20/2008KPL-5 KPL-5_out NONE Infinite Infinite OUT 1 0 6.4 25.5 101.8 18.00 38.2 152.8 0.00 See notes, TPM 3/20/2008KPL-7 KPL-7_out NONE Infinite Infinite OUT 1 0 7.1 28.3 113.2 19.00 42.5 169.8 0.00 See notes, TPM 3/20/2008UBC-1 UBC-1_out NONE Infinite Infinite OUT 1 0 5.3 21.2 85.0 20.00 31.9 127.4 0.00 See notes, TPM 3/20/2008UBC-2 UBC-2_out Orifice 1.25 0.6 UBC-3 1 0 2.9 11.5 46.0 21.00 17.3 69.0 0.00 See notes, TPM 3/20/2008UBC-3 UBC-3_out NONE Infinite Infinite OUT 1 0 3.3 13.1 52.6 22.00 19.7 78.9 0.00 See notes, TPM 3/20/2008UBC-4 UBC-4_out NONE Infinite Infinite OUT 1 0 0.0 0.1 0.4 23.00 0.1 0.6 0.00 See notes, TPM 3/20/2008WKL-1 WKL-1_out NONE Infinite Infinite OUT 1 0 2.4 9.4 37.7 24.00 14.1 56.5 0.00 See notes, TPM 3/20/2008WKL-2 WKL-2_out NONE Infinite Infinite OUT 1 0 5.3 21.2 84.7 25.00 31.8 127.0 0.00 See notes, TPM 3/20/2008WKL-3 WKL-3_out NONE Infinite Infinite OUT 1 0 11.1 44.4 177.5 26.00 66.6 266.3 0.00 See notes, TPM 3/20/2008WKL-4 WKL-4_out NONE Infinite Infinite OUT 1 0 5.8 23.4 93.5 27.00 35.1 140.3 0.00 See notes, TPM 3/20/2008
Landlocked Area Device Inputs
wq-iw6-05b

P8-V3.X BCWD ContributingWatershed InputDirectly Connected UnSwept Areas---> Directly Connected Swept Areas---> Street Sweeping Parameters -->
Total Pervious Indirect Pervious Depress Imperv Depress Imperv Start Stop SweepWatershed Area Outflow Percol Curve Imperv Load Imperv Storage Runoff Load Imperv Storage Runoff Load Date Date Sweep FreqLabel acres Device Device Number Fraction Factor Fraction inches Coef Factor Fraction inches Coef Factor MMDD MMDD Effic 1/weekCBC-10 627.9 CBC-10_out none 61 0 1 0.03 0.02 1 1 0.07 0.00 1 0 101 1231 0 0CBC-11 581.3 CBC-11_out none 70 0 1 0.04 0.02 1 1 0.06 0.00 1 0 101 1231 0 0CBC-12 101.1 CBC-12_out none 66 0 1 0.08 0.02 1 1 0.06 0.00 1 0 101 1231 0 0CBC-13 337.3 CBC-13_out none 74 0 1 0.04 0.02 1 1 0.01 0.00 1 0 101 1231 0 0CBC-14 141.0 CBC-14_out none 67 0 1 0.11 0.02 1 1 0.02 0.00 1 0 101 1231 0 0CBC-15 125.7 CBC-15_out none 70 0 1 0.09 0.02 1 1 0.01 0.00 1 0 101 1231 0 0CBC-16 267.2 CBC-16_out none 75 0 1 0.13 0.02 1 1 0.03 0.00 1 0 101 1231 0 0CBC-2 297.0 CBC-2_out none 60 0 1 0.06 0.02 1 1 0.17 0.00 1 0 101 1231 0 0CBC-4 135.4 CBC-4_out none 65 0 1 0.09 0.02 1 1 0.13 0.00 1 0 101 1231 0 0CBC-7 59.4 CBC-7_out none 60 0 1 0.02 0.02 1 1 0.02 0.00 1 0 101 1231 0 0CBC-8 402.0 CBC-8_out none 59 0 1 0.07 0.02 1 1 0.02 0.00 1 0 101 1231 0 0GSL-10 45.2 GSL-10_out none 70 0 1 0.03 0.02 1 1 0.01 0.00 1 0 101 1231 0 0GSL-11 102.9 GSL-11_out none 66 0 1 0.02 0.02 1 1 0.08 0.00 1 0 101 1231 0 0GSL-12 656.3 GSL-12_out none 64 0 1 0.02 0.02 1 1 0.36 0.00 1 0 101 1231 0 0GSL-17 140.0 GSL-17_out none 67 0 1 0.02 0.02 1 1 0.20 0.00 1 0 101 1231 0 0GSL-18 57.4 GSL-18_out none 66 0 1 0.05 0.02 1 1 0.18 0.00 1 0 101 1231 0 0GSL-19 165.6 GSL-19_out none 63 0 1 0.03 0.02 1 1 0.06 0.00 1 0 101 1231 0 0GSL-20 433.6 GSL-20_out none 65 0 1 0.04 0.02 1 1 0.28 0.00 1 0 101 1231 0 0GSL-21 51.1 GSL-21_out none 63 0 1 0.07 0.02 1 1 0.09 0.00 1 0 101 1231 0 0GSL-22 18.9 GSL-22_out none 66 0 1 0.09 0.02 1 1 0.00 0.00 1 0 101 1231 0 0GSL-4 93.4 GSL-4_out none 63 0 1 0.03 0.02 1 1 0.19 0.00 1 0 101 1231 0 0GSL-5 62.5 GSL-5_out none 62 0 1 0.03 0.02 1 1 0.12 0.00 1 0 101 1231 0 0GSL-6 199.7 GSL-6_out none 66 0 1 0.04 0.02 1 1 0.23 0.00 1 0 101 1231 0 0GSL-7 279.7 GSL-7_out none 62 0 1 0.03 0.02 1 1 0.27 0.00 1 0 101 1231 0 0GSL-8 151.0 GSL-8_out none 65 0 1 0.04 0.02 1 1 0.15 0.00 1 0 101 1231 0 0GSL-9 78.5 GSL-9_out none 65 0 1 0.07 0.02 1 1 0.07 0.00 1 0 101 1231 0 0KPL-6 483.2 KPL-6_out none 56 0 1 0.05 0.02 1 1 0.19 0.00 1 0 101 1231 0 0LBC-1 118.2 LBC-1_out none 63 0 1 0.07 0.02 1 1 0.00 0.00 1 0 101 1231 0 0LBC-10 55.7 LBC-10_out none 64 0 1 0.11 0.02 1 1 0.04 0.00 1 0 101 1231 0 0LBC-2 154.5 LBC-2_out none 62 0 1 0.04 0.02 1 1 0.00 0.00 1 0 101 1231 0 0LBC-3 90.9 LBC-3_out none 58 0 1 0.08 0.02 1 1 0.01 0.00 1 0 101 1231 0 0LBC-3a 19.2 LBC-3a_out none 59 0 1 0.00 0.02 1 1 0.00 0.00 1 0 101 1231 0 0LBC-3b 75.0 LBC-3b_out none 65 0 1 0.09 0.02 1 1 0.04 0.00 1 0 101 1231 0 0LBC-3c 1.9 LBC-3c_out none 49 0 1 0.00 0.02 1 1 0.00 0.00 1 0 101 1231 0 0LBC-3d 4.7 LBC-3d_out none 49 0 1 0.02 0.02 1 1 0.00 0.00 1 0 101 1231 0 0LBC-3e 26.4 LBC-3e_out none 57 0 1 0.12 0.02 1 1 0.00 0.00 1 0 101 1231 0 0LBC-4 76.7 LBC-4_out none 64 0 1 0.07 0.02 1 1 0.06 0.00 1 0 101 1231 0 0LBC-5a 254.6 LBC-5a_out none 65 0 1 0.12 0.02 1 1 0.01 0.00 1 0 101 1231 0 0LBC-5b 40.8 LBC-5b_out none 73 0 1 0.27 0.02 1 1 0.01 0.00 1 0 101 1231 0 0LBC-5c 2.4 LBC-5c_out none 56 0 1 0.01 0.02 1 1 0.00 0.00 1 0 101 1231 0 0LBC-5d 4.5 LBC-5d_out none 59 0 1 0.00 0.02 1 1 0.00 0.00 1 0 101 1231 0 0LBC-5e 17.0 LBC-5e_out none 65 0 1 0.12 0.02 1 1 0.00 0.00 1 0 101 1231 0 0LBC-6 78.2 LBC-6_out none 58 0 1 0.09 0.02 1 1 0.01 0.00 1 0 101 1231 0 0LBC-6a 25.8 LBC-6a_out none 58 0 1 0.11 0.02 1 1 0.00 0.00 1 0 101 1231 0 0LBC-7a 38.7 LBC-7a_out none 71 0 1 0.06 0.02 1 1 0.27 0.00 1 0 101 1231 0 0LBC-7b 19.2 LBC-7b_out none 71 0 1 0.31 0.02 1 1 0.01 0.00 1 0 101 1231 0 0LBC-8 6.4 LBC-8_out none 68 0 1 0.16 0.02 1 1 0.00 0.00 1 0 101 1231 0 0UBC-10a 690.5 UBC-10a_out none 66 0 1 0.04 0.02 1 1 0.02 0.00 1 0 101 1231 0 0UBC-10b 1.8 UBC-10b_out none 70 0 1 0.20 0.02 1 1 0.00 0.00 1 0 101 1231 0 0UBC-10c 2.4 UBC-10c_out none 64 0 1 0.19 0.02 1 1 0.02 0.00 1 0 101 1231 0 0UBC-10d 6.4 UBC-10d_out none 63 0 1 0.11 0.02 1 1 0.01 0.00 1 0 101 1231 0 0UBC-10e 2.4 UBC-10e_out none 66 0 1 0.19 0.02 1 1 0.00 0.00 1 0 101 1231 0 0UBC-10f 1.6 UBC-10f_out none 73 0 1 0.19 0.02 1 1 0.00 0.00 1 0 101 1231 0 0UBC-10g 2.3 UBC-10g_out none 67 0 1 0.15 0.02 1 1 0.00 0.00 1 0 101 1231 0 0UBC-10h 3.3 UBC-10h_out none 66 0 1 0.13 0.02 1 1 0.00 0.00 1 0 101 1231 0 0UBC-10i 4.0 UBC-10i_out none 64 0 1 0.07 0.02 1 1 0.01 0.00 1 0 101 1231 0 0UBC-10j 7.7 UBC-10j_out none 73 0 1 0.11 0.02 1 1 0.00 0.00 1 0 101 1231 0 0UBC-10l 21.5 UBC-10l_out none 65 0 1 0.02 0.02 1 1 0.00 0.00 1 0 101 1231 0 0UBC-5a 58.4 UBC-5_out none 61 0 1 0.04 0.02 1 1 0.03 0.00 1 0 101 1231 0 0UBC-5b 70.7 UBC-5_out none 63 0 1 0.02 0.02 1 1 0.01 0.00 1 0 101 1231 0 0UBC-5c 20.6 UBC-5_out none 67 0 1 0.09 0.02 1 1 0.01 0.00 1 0 101 1231 0 0UBC-5d 8.4 UBC-5_out none 71 0 1 0.04 0.02 1 1 0.55 0.00 1 0 101 1231 0 0UBC-5e 14.4 UBC-5_out none 60 0 1 0.07 0.02 1 1 0.36 0.00 1 0 101 1231 0 0UBC-5f 147.9 UBC-5_out none 63 0 1 0.05 0.02 1 1 0.26 0.00 1 0 101 1231 0 0UBC-6 93.4 UBC-6_out none 66 0 1 0.07 0.02 1 1 0.02 0.00 1 0 101 1231 0 0UBC-7 114.6 UBC-7_out none 67 0 1 0.04 0.02 1 1 0.01 0.00 1 0 101 1231 0 0UBC-8 262.4 UBC-8_out none 67 0 1 0.04 0.02 1 1 0.03 0.00 1 0 101 1231 0 0UBC-9 70.7 UBC-9_out none 70 0 1 0.06 0.02 1 1 0.00 0.00 1 0 101 1231 0 0
wq-iw6-05b

P8-V3.X BCWD LandlockedWatershed InputDirectly Connected UnSwept Areas---> Directly Connected Swept Areas---> Street Sweeping Parameters -->
Total Pervious Indirect Pervious Depress Imperv Depress Imperv Start Stop SweepWatershed Area Outflow Percol Curve Imperv Load Imperv Storage Runoff Load Imperv Storage Runoff Load Date Date Sweep FreqLabel acres Device Device Number Fraction Factor Fraction inches Coef Factor Fraction inches Coef Factor MMDD MMDD Effic 1/weekLBC-9 1.7 LBC-9_out none 67.0 0 1 0.20 0.02 1 1 0.04 0.00 1 0 101 1231 0 0THPP-1 281.0 THPP-1_out none 68.0 0 1 0.04 0.02 1 1 0.00 0.00 1 0 101 1231 0 0THPP-2 118.6 THPP-2_out none 67.0 0 1 0.06 0.02 1 1 0.00 0.00 1 0 101 1231 0 0THPP-3 144.7 THPP-3_out none 63.0 0 1 0.07 0.02 1 1 0.00 0.00 1 0 101 1231 0 0THPP-4 82.9 THPP-4_out none 67.0 0 1 0.12 0.02 1 1 0.01 0.00 1 0 101 1231 0 0THPP-5 19.4 THPP-5_out none 67.0 0 1 0.05 0.02 1 1 0.00 0.00 1 0 101 1231 0 0THPP-6 13.5 THPP-6_out none 63.0 0 1 0.02 0.02 1 1 0.03 0.00 1 0 101 1231 0 0THPP-7 16.5 THPP-7_out none 64.0 0 1 0.15 0.02 1 1 0.01 0.00 1 0 101 1231 0 0THPP-8 3.6 THPP-8_out none 46.0 0 1 0.00 0.02 1 1 0.14 0.00 1 0 101 1231 0 0THPP-9 2.8 THPP-9_out none 52.0 0 1 0.02 0.02 1 1 0.05 0.00 1 0 101 1231 0 0CBC-1 109.6 CBC-1_out none 50.0 0 1 0.03 0.02 1 1 0.05 0.00 1 0 101 1231 0 0CBC-3 76.4 CBC-3_out none 60.0 0 1 0.03 0.02 1 1 0.14 0.00 1 0 101 1231 0 0CBC-5 62.2 CBC-5_out none 51.0 0 1 0.05 0.02 1 1 0.11 0.00 1 0 101 1231 0 0CBC-6 104.7 CBC-6_out none 62.0 0 1 0.06 0.02 1 1 0.09 0.00 1 0 101 1231 0 0CBC-9 267.9 CBC-9_out none 64.0 0 1 0.04 0.02 1 1 0.12 0.00 1 0 101 1231 0 0GSL-1 85.6 GSL-1_out none 64.0 0 1 0.01 0.02 1 1 0.08 0.00 1 0 101 1231 0 0GSL-13 108.1 GSL-13_out none 63.0 0 1 0.02 0.02 1 1 0.28 0.00 1 0 101 1231 0 0GSL-14 245.9 GSL-14_out none 66.0 0 1 0.02 0.02 1 1 0.34 0.00 1 0 101 1231 0 0GSL-15 124.1 GSL-15_out none 68.0 0 1 0.05 0.02 1 1 0.24 0.00 1 0 101 1231 0 0GSL-16 30.6 GSL-16_out none 66.0 0 1 0.00 0.02 1 1 0.41 0.00 1 0 101 1231 0 0GSL-2 156.3 GSL-2_out none 66.0 0 1 0.02 0.02 1 1 0.08 0.00 1 0 101 1231 0 0GSL-3 39.6 GSL-3_out none 68.0 0 1 0.03 0.02 1 1 0.11 0.00 1 0 101 1231 0 0KPL-1 235.7 KPL-1_out none 59.0 0 1 0.06 0.02 1 1 0.16 0.00 1 0 101 1231 0 0KPL-2 419.2 KPL-2_out none 61.0 0 1 0.06 0.02 1 1 0.16 0.00 1 0 101 1231 0 0KPL-3 560.2 KPL-3_out none 60.0 0 1 0.11 0.02 1 1 0.02 0.00 1 0 101 1231 0 0KPL-4 126.7 KPL-4_out none 64.0 0 1 0.04 0.02 1 1 0.14 0.00 1 0 101 1231 0 0KPL-5 137.5 KPL-5_out none 56.0 0 1 0.06 0.02 1 1 0.19 0.00 1 0 101 1231 0 0KPL-7 190.1 KPL-7_out none 57.0 0 1 0.05 0.02 1 1 0.15 0.00 1 0 101 1231 0 0UBC-1 213.7 UBC-1_out none 68.0 0 1 0.05 0.02 1 1 0.10 0.00 1 0 101 1231 0 0UBC-2 111.4 UBC-2_out none 69.0 0 1 0.07 0.02 1 1 0.10 0.00 1 0 101 1231 0 0UBC-3 100.2 UBC-3_out none 65.0 0 1 0.02 0.02 1 1 0.13 0.00 1 0 101 1231 0 0UBC-4 46.8 UBC-4_out none 58.0 0 1 0.03 0.02 1 1 0.00 0.00 1 0 101 1231 0 0WKL-1 95.9 WKL-1_out none 58.0 0 1 0.10 0.02 1 1 0.10 0.00 1 0 101 1231 0 0WKL-2 205.3 WKL-2_out none 62.0 0 1 0.04 0.02 1 1 0.10 0.00 1 0 101 1231 0 0WKL-3 360.4 WKL-3_out none 59.0 0 1 0.05 0.02 1 1 0.12 0.00 1 0 101 1231 0 0WKL-4 318.2 WKL-4_out none 63.0 0 1 0.04 0.02 1 1 0.07 0.00 1 0 101 1231 0 0
wq-iw6-05b
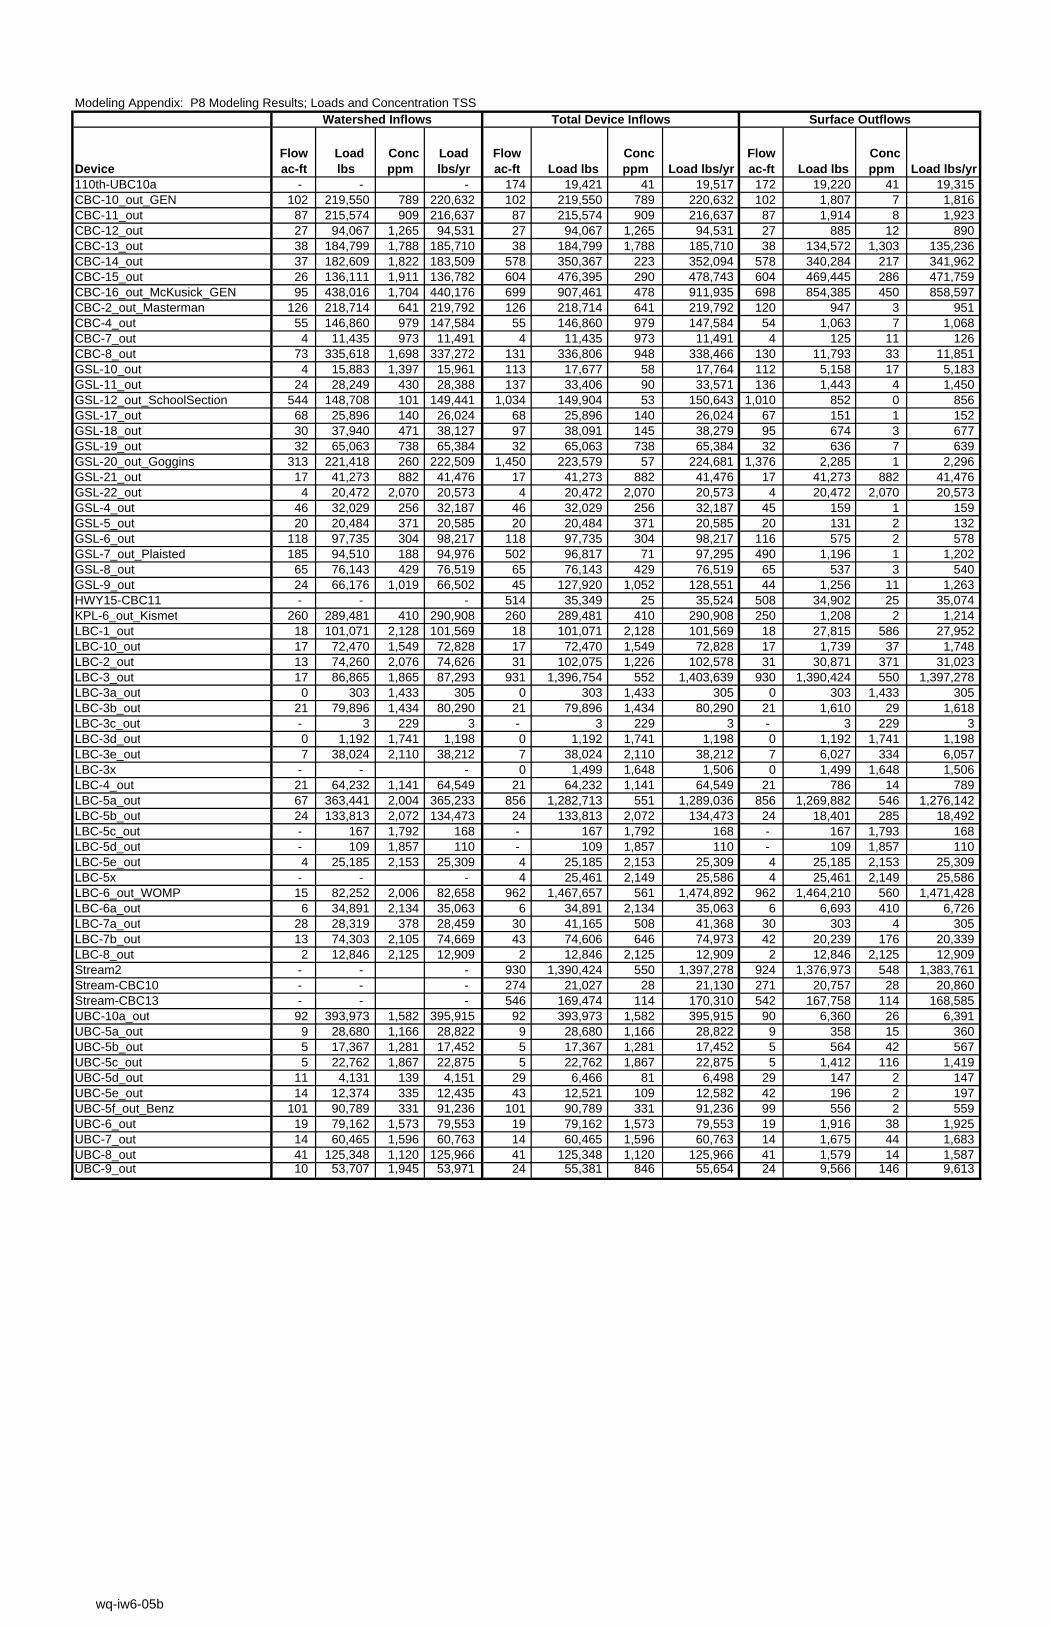
Modeling Appendix: P8 Modeling Results; Loads and Concentration TSSWatershed Inflows Total Device Inflows Surface Outflows
DeviceFlow ac-ft
Load lbs
Conc ppm
Load lbs/yr
Flow ac-ft Load lbs
Conc ppm Load lbs/yr
Flow ac-ft Load lbs
Conc ppm Load lbs/yr
110th-UBC10a - - - 174 19,421 41 19,517 172 19,220 41 19,315 CBC-10_out_GEN 102 219,550 789 220,632 102 219,550 789 220,632 102 1,807 7 1,816 CBC-11_out 87 215,574 909 216,637 87 215,574 909 216,637 87 1,914 8 1,923 CBC-12_out 27 94,067 1,265 94,531 27 94,067 1,265 94,531 27 885 12 890 CBC-13_out 38 184,799 1,788 185,710 38 184,799 1,788 185,710 38 134,572 1,303 135,236 CBC-14_out 37 182,609 1,822 183,509 578 350,367 223 352,094 578 340,284 217 341,962 CBC-15_out 26 136,111 1,911 136,782 604 476,395 290 478,743 604 469,445 286 471,759 CBC-16_out_McKusick_GEN 95 438,016 1,704 440,176 699 907,461 478 911,935 698 854,385 450 858,597 CBC-2_out_Masterman 126 218,714 641 219,792 126 218,714 641 219,792 120 947 3 951 CBC-4_out 55 146,860 979 147,584 55 146,860 979 147,584 54 1,063 7 1,068 CBC-7_out 4 11,435 973 11,491 4 11,435 973 11,491 4 125 11 126 CBC-8_out 73 335,618 1,698 337,272 131 336,806 948 338,466 130 11,793 33 11,851 GSL-10_out 4 15,883 1,397 15,961 113 17,677 58 17,764 112 5,158 17 5,183 GSL-11_out 24 28,249 430 28,388 137 33,406 90 33,571 136 1,443 4 1,450 GSL-12_out_SchoolSection 544 148,708 101 149,441 1,034 149,904 53 150,643 1,010 852 0 856 GSL-17_out 68 25,896 140 26,024 68 25,896 140 26,024 67 151 1 152 GSL-18_out 30 37,940 471 38,127 97 38,091 145 38,279 95 674 3 677 GSL-19_out 32 65,063 738 65,384 32 65,063 738 65,384 32 636 7 639 GSL-20_out_Goggins 313 221,418 260 222,509 1,450 223,579 57 224,681 1,376 2,285 1 2,296 GSL-21_out 17 41,273 882 41,476 17 41,273 882 41,476 17 41,273 882 41,476 GSL-22_out 4 20,472 2,070 20,573 4 20,472 2,070 20,573 4 20,472 2,070 20,573 GSL-4_out 46 32,029 256 32,187 46 32,029 256 32,187 45 159 1 159 GSL-5_out 20 20,484 371 20,585 20 20,484 371 20,585 20 131 2 132 GSL-6_out 118 97,735 304 98,217 118 97,735 304 98,217 116 575 2 578 GSL-7_out_Plaisted 185 94,510 188 94,976 502 96,817 71 97,295 490 1,196 1 1,202 GSL-8_out 65 76,143 429 76,519 65 76,143 429 76,519 65 537 3 540 GSL-9_out 24 66,176 1,019 66,502 45 127,920 1,052 128,551 44 1,256 11 1,263 HWY15-CBC11 - - - 514 35,349 25 35,524 508 34,902 25 35,074 KPL-6_out_Kismet 260 289,481 410 290,908 260 289,481 410 290,908 250 1,208 2 1,214 LBC-1_out 18 101,071 2,128 101,569 18 101,071 2,128 101,569 18 27,815 586 27,952 LBC-10_out 17 72,470 1,549 72,828 17 72,470 1,549 72,828 17 1,739 37 1,748 LBC-2_out 13 74,260 2,076 74,626 31 102,075 1,226 102,578 31 30,871 371 31,023 LBC-3_out 17 86,865 1,865 87,293 931 1,396,754 552 1,403,639 930 1,390,424 550 1,397,278 LBC-3a_out 0 303 1,433 305 0 303 1,433 305 0 303 1,433 305 LBC-3b_out 21 79,896 1,434 80,290 21 79,896 1,434 80,290 21 1,610 29 1,618 LBC-3c_out - 3 229 3 - 3 229 3 - 3 229 3 LBC-3d_out 0 1,192 1,741 1,198 0 1,192 1,741 1,198 0 1,192 1,741 1,198 LBC-3e_out 7 38,024 2,110 38,212 7 38,024 2,110 38,212 7 6,027 334 6,057 LBC-3x - - - 0 1,499 1,648 1,506 0 1,499 1,648 1,506 LBC-4_out 21 64,232 1,141 64,549 21 64,232 1,141 64,549 21 786 14 789 LBC-5a_out 67 363,441 2,004 365,233 856 1,282,713 551 1,289,036 856 1,269,882 546 1,276,142 LBC-5b_out 24 133,813 2,072 134,473 24 133,813 2,072 134,473 24 18,401 285 18,492 LBC-5c_out - 167 1,792 168 - 167 1,792 168 - 167 1,793 168 LBC-5d_out - 109 1,857 110 - 109 1,857 110 - 109 1,857 110 LBC-5e_out 4 25,185 2,153 25,309 4 25,185 2,153 25,309 4 25,185 2,153 25,309 LBC-5x - - - 4 25,461 2,149 25,586 4 25,461 2,149 25,586 LBC-6_out_WOMP 15 82,252 2,006 82,658 962 1,467,657 561 1,474,892 962 1,464,210 560 1,471,428 LBC-6a_out 6 34,891 2,134 35,063 6 34,891 2,134 35,063 6 6,693 410 6,726 LBC-7a_out 28 28,319 378 28,459 30 41,165 508 41,368 30 303 4 305 LBC-7b_out 13 74,303 2,105 74,669 43 74,606 646 74,973 42 20,239 176 20,339 LBC-8_out 2 12,846 2,125 12,909 2 12,846 2,125 12,909 2 12,846 2,125 12,909 Stream2 - - - 930 1,390,424 550 1,397,278 924 1,376,973 548 1,383,761 Stream-CBC10 - - - 274 21,027 28 21,130 271 20,757 28 20,860 Stream-CBC13 - - - 546 169,474 114 170,310 542 167,758 114 168,585 UBC-10a_out 92 393,973 1,582 395,915 92 393,973 1,582 395,915 90 6,360 26 6,391 UBC-5a_out 9 28,680 1,166 28,822 9 28,680 1,166 28,822 9 358 15 360 UBC-5b_out 5 17,367 1,281 17,452 5 17,367 1,281 17,452 5 564 42 567 UBC-5c_out 5 22,762 1,867 22,875 5 22,762 1,867 22,875 5 1,412 116 1,419 UBC-5d_out 11 4,131 139 4,151 29 6,466 81 6,498 29 147 2 147 UBC-5e_out 14 12,374 335 12,435 43 12,521 109 12,582 42 196 2 197 UBC-5f_out_Benz 101 90,789 331 91,236 101 90,789 331 91,236 99 556 2 559 UBC-6_out 19 79,162 1,573 79,553 19 79,162 1,573 79,553 19 1,916 38 1,925 UBC-7_out 14 60,465 1,596 60,763 14 60,465 1,596 60,763 14 1,675 44 1,683 UBC-8_out 41 125,348 1,120 125,966 41 125,348 1,120 125,966 41 1,579 14 1,587 UBC-9_out 10 53,707 1,945 53,971 24 55,381 846 55,654 24 9,566 146 9,613
wq-iw6-05b
