draft addendum iv - maine.gov iv to amendment 3 to the interstate fishery management plan for...
TRANSCRIPT
Addendum IV to Amendment 3 to the Interstate Fishery Management Plan for
American Lobster
ASMFC Vision: Healthy, self-sustaining populations for all Atlantic coast fish species or successful
restoration well in progress by the year 2015.
December 2003
Executive Summary 1. Introduction Addendum IV was initiated by the Lobster Management Board in June of 2003 to address four different issues: a proposal from the Area 3 LCMT; concern about stock conditions in Area 2; new information about vent selectivity; and a desire to change the interpretation of the most restrictive rule. 2. Changes in Vent Sizes Addendum III to Amendment 3 of the ASMFC ISFMP requires at least one rectangular escape vent per trap or at least two circular escape vents in Area 2, 3, 4, 5 and the Outer Cape by July of 2003. Under Addendum II these circular vents were required to be 2 ½ inches. This size of circular escape vent was determined by extrapolating from earlier selectivity studies on smaller vents. The Technical Committee reviewed a vent selectivity study completed by the Massachusetts Division of Marine Fisheries which generated selectivity curves for escape vents that correspond with the proposed increases in minimum legal size for American lobster. Based on this study, Addendum IV changes the circular vent size requirement from 2 ½ inches to 2 5/8 inches. In addition, vent sizes of 2 1/16" rectangular and 2 11/16" circular are required for those LCMA’s (LCMA 3, 2, OCC) that have scheduled increases to a 3 1/2" minimum legal CL. 3. Most Restrictive Rule In previous Addenda, the FMP for American lobster indicated that multiple area fishermen must comply with the most restrictive management measures of all areas fished including the smallest number of traps allocated to them for each of the areas fished. For example, an individual designates both Area 2 and 3 on his permit. The individual qualifies for 800 traps under Area 2 and through historical participation in Area 3 qualifies for 300 traps. Due to the most restrictive rule, they are limited to a total of 300 traps throughout Area 2 and 3. The original intention of the most restrictive rule was to allow multi-area fishermen to continue to fish in the areas they historically have while maintaining the conservation benefits unique to each area. However, an unintended consequence of implementing historical participation in some areas was to limit these multi-area fishermen to the number of traps they have been allocated in an area where they have a minimal history. Fishermen were either limited to this low number of traps or must drop that area from their permit. The most restrictive rule as a whole is necessary to maintain the conservation benefits for each area management plan. However, to address this outstanding issue, this Addendum applies the most restrictive rule on an area trap cap basis without regard to the individual’s allocation. Fishermen who designate multiple management areas on their permits are bound by the most restrictive management measures of those areas’ trap caps. They are allowed to fish the number of traps they are allocated in that most restrictive area.

4. Area 3 Management Measures The Area 3 LCMT proposal to the Board included both an increase in active trap reductions in Area 3 as well as a transferable trap program. The purpose of including a transferable trap plan, in conjunction with other conservation measures already recommended for implementation in Area 3, is to establish a program that helps to maintain conservation objectives necessary to sustain the lobster resource by passively reducing traps in the Area 3 fishery. It may also allow for economic profitability through flexibility, and support creative options for future business planning. Addendum IV includes a sliding scale trap reduction plan to increase active trap reductions by 10% (5% in each year, in 2007 and 2008, assuming no further delays in implementation). The rationale for this increase in active reductions of traps is to help ensure that the goal of reducing fishing mortality is addressed and the associated economic and biological benefits are realized. 5. Area 2 Management Measures In August of 2003, the Lobster Management Board asked the Technical Committee to advise the Board on the magnitude of problems in Area 2 as well as recommend an appropriate response. Board members expressed interest in TC review of trawl survey and sea sampling information to provide insight into the current situation of stock declines in Area 2 and to advise if the current Amendment and supporting addenda are sufficient to remedy the problem. The October 2002 Technical Committee report indicated that landings had declined, the area survey indices had declined, and the incidence of shell disease was increasing. There was a consensus among the TC that the current overfishing definition (F10%), in combination with the proposed management measures, were not sufficient to remedy the current stock declines observed in Area 2 and spawning stock biomass needed to be rebuilt. The Lobster TC recommended reducing fishing mortality in Area 2, reducing effort in Area 2, and continuing to work on a control rule that incorporates both f-based and biomass based reference points to offer better management advice to varying stock conditions. In February 2003, the Lobster Board took Emergency Action to increase the minimum gauge size for lobsters in Area 2 on an accelerated time scale and initiated action to rebuild the lobster stock in Area 2 in 2003 through Addendum IV. Addendum IV includes an interim benchmark goal based on survey information and a Total Allowable Landings to be used as a performance measure. This Addendum includes an effort control program and gauge increases for Area 2.
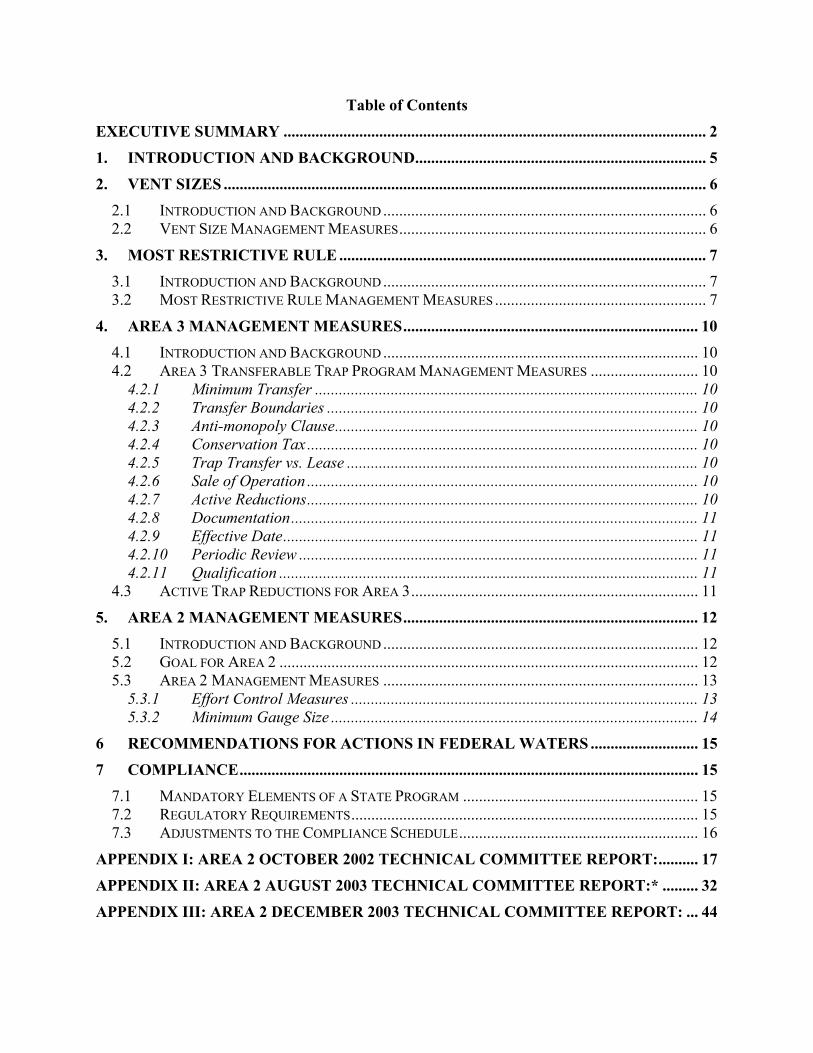
Table of Contents
EXECUTIVE SUMMARY .......................................................................................................... 2
1. INTRODUCTION AND BACKGROUND......................................................................... 5
2. VENT SIZES ......................................................................................................................... 6 2.1 INTRODUCTION AND BACKGROUND ................................................................................. 6 2.2 VENT SIZE MANAGEMENT MEASURES............................................................................. 6
3. MOST RESTRICTIVE RULE ............................................................................................ 7 3.1 INTRODUCTION AND BACKGROUND ................................................................................. 7 3.2 MOST RESTRICTIVE RULE MANAGEMENT MEASURES ..................................................... 7
4. AREA 3 MANAGEMENT MEASURES.......................................................................... 10 4.1 INTRODUCTION AND BACKGROUND ............................................................................... 10 4.2 AREA 3 TRANSFERABLE TRAP PROGRAM MANAGEMENT MEASURES ........................... 10
4.2.1 Minimum Transfer ................................................................................................ 10 4.2.2 Transfer Boundaries ............................................................................................. 10 4.2.3 Anti-monopoly Clause........................................................................................... 10 4.2.4 Conservation Tax .................................................................................................. 10 4.2.5 Trap Transfer vs. Lease ........................................................................................ 10 4.2.6 Sale of Operation .................................................................................................. 10 4.2.7 Active Reductions.................................................................................................. 10 4.2.8 Documentation...................................................................................................... 11 4.2.9 Effective Date........................................................................................................ 11 4.2.10 Periodic Review .................................................................................................... 11 4.2.11 Qualification ......................................................................................................... 11
4.3 ACTIVE TRAP REDUCTIONS FOR AREA 3........................................................................ 11
5. AREA 2 MANAGEMENT MEASURES.......................................................................... 12 5.1 INTRODUCTION AND BACKGROUND ............................................................................... 12 5.2 GOAL FOR AREA 2 ......................................................................................................... 12 5.3 AREA 2 MANAGEMENT MEASURES ............................................................................... 13
5.3.1 Effort Control Measures ....................................................................................... 13 5.3.2 Minimum Gauge Size ............................................................................................ 14
6 RECOMMENDATIONS FOR ACTIONS IN FEDERAL WATERS ........................... 15
7 COMPLIANCE................................................................................................................... 15 7.1 MANDATORY ELEMENTS OF A STATE PROGRAM ........................................................... 15 7.2 REGULATORY REQUIREMENTS....................................................................................... 15 7.3 ADJUSTMENTS TO THE COMPLIANCE SCHEDULE............................................................ 16
APPENDIX I: AREA 2 OCTOBER 2002 TECHNICAL COMMITTEE REPORT:.......... 17
APPENDIX II: AREA 2 AUGUST 2003 TECHNICAL COMMITTEE REPORT:* ......... 32
APPENDIX III: AREA 2 DECEMBER 2003 TECHNICAL COMMITTEE REPORT: ... 44

1. Introduction and Background Amendment 3 was approved in December 1997. Amendment 3 established a framework for area management, which includes industry participation through seven Lobster Conservation Management Teams (LCMT). The LCMT's were encouraged to develop a management program, which suits the needs of the area while meeting targets established in the plan. The Board adopted a three-phase approach to incorporate the LCMT recommendations, which involved three addenda to Amendment 3. Addendum I incorporated measures from the LCMT proposals directed at effort control. After consideration of the stock assessment and peer review results, the Board initiated the development of Addendum II in August 2000 to continue implementation of the 1998 LCMT proposals. Addendum III incorporates the alternative management measures presented to the Board for the purposes of meeting F10% by calendar year 2008.
Addendum IV was initiated by the Lobster Management Board in June of 2003 to address four different issues: a proposal from the Area 3 LCMT; concern about stock conditions in Area 2; new information about vent selectivity; and a desire to change the interpretation of the most restrictive rule.
For a detailed description of the coastwide requirements, prohibited actions, and other compliance measures that are applicable under Amendment 3, Addendum I, Addendum II and Addendum III, readers should refer to Fisheries Management Reports No. 29, 29a, 29b, and 29c of the Atlantic States Marine Fisheries Commission. Copies can be obtained via the Commission’s website at www.asmfc.org. The provisions in this section may be changed in order to meet the goal and objectives specified in Section 2 of Amendment 3. Any changes made to Addendum IV will be done via addendum under Section 3.6 of Amendment 3.

2. Vent Sizes
2.1 Introduction and Background Addendum III to Amendment 3 of the ASMFC FMP requires at least one rectangular escape vent per trap or at least two circular escape vents in Area 2, 3, 4, 5 and the Outer Cape by July of 2003. Under Addendum II these circular vents were required to be 2 ½ inches. This size of circular escape vent was determined by extrapolating from earlier selectivity studies on smaller vents. The Technical Committee reviewed a vent selectivity study recently completed by the Massachusetts Division of Marine Fisheries which generated selectivity curves for escape vents that correspond with the proposed increases in minimum legal size for American lobster. The lobster size selectivity of eight experimental lobster trap escape vents (4 rectangular and 4 circular) was investigated in both laboratory and sea sampling settings. Study results indicate that the previous recommendation for a circular vent size of 2 ½ inches is inappropriate and is not compatible with the 2 inch rectangular vent. The study also provided data to indicate a 2 1/16" rectangular and 2 11/16" circular as the appropriate vent sizes for a 3 1/2" minimum carapace length. These vents would maintain a similar conservation buffer, which maximizes escapement of sub-legal lobsters while minimizing escapement of legal lobsters at a 3 1/2" minimum carapace length. Based on this study, Addendum IV changes the circular vent size requirement from 2 ½ inches to 2 5/8 inches. In addition, vent sizes of 2 1/16" rectangular and 2 11/16" circular are required for those LCMA’s (LCMA 2, 3, and OCC) that have scheduled increases to a 3 1/2" minimum legal CL.
2.2 Vent Size Management Measures Each minimum gauge size has a corresponding rectangular and circular vent size. When a LCMA has an increase in the minimum gauge size, the corresponding vent size changes are required at the same time. For those areas that have already implemented a 3-3/8” minimum gauge size, the increase in circular vent size would be required by December 31, 2004. The changes and/or additions to previous ASMFC measures are highlighted in bold and italics.
Minimum Gauge Size Rectangular Vent Circular Vent 3-1/4” 1-15/16” x 5-3/4” 2-7/16” 3-3/8”* 2” x 5-3/4” 2-5/8” 3-1/2” 2-1/16” x5-3/4” 2-11/16”
* The Area 1 plan maintains a 3-1/4" minimum gauge size and adds a 2” x 5-3/4" rectangular vent and corresponding circular vent to be implemented in 2007 if necessary.

3. Most Restrictive Rule
3.1 Introduction and Background Previously, the FMP for American lobster indicated that multiple area fishermen must comply with the most restrictive management measures of all areas fished including the smallest number of traps allocated to them for each of the areas fished. For example, an individual designates both Area 2 and 3 on his permit. The individual qualifies for 800 traps under Area 2 and through historical participation in Area 3 qualifies for 300 traps. Due to the most restrictive rule, they are limited to a total of 300 traps throughout Area 2 and 3. The original intention of the most restrictive rule was to allow multi-area fishermen to continue to fish in the areas they historically have while maintaining the conservation benefits unique to each area. However, an unintended consequence of implementing historical participation in some areas had been to limit these multi-area fishermen to the number of traps they were allocated in an area where they have a minimal history. Fishermen were either limited to this low number of traps or must drop that area from their permit. In order to implement the most restrictive rule as outlined in previous Addenda and Amendments of the Interstate Fishery Management Plan for American Lobster, each state must be able to enforce all of the area regulations that their state’s fishermen are permitted in. For example, if fishermen in Rhode Island are permitted to fish in Area 1, 2, OCC, and 3, RI must be able to enforce all of those Area regulations. The most restrictive rule as a whole is necessary to maintain the conservation benefits for each area management plan. However, to address this outstanding issue, this Addendum changes the interpretation of the most restrictive rule.
3.2 Most Restrictive Rule Management Measures Addendum IV applies the most restrictive rule on an area trap cap basis without regard to the individual’s allocation. Fishermen who designate multiple management areas on their permits will be bound by the most restrictive management measures of those areas’ trap caps. They would be allowed to fish the number of traps they are allocated in that most restrictive area. The following examples are intended to clarify this.∗ Example 1: A lobster fisherman is permitted in both Area 2 and 3. This individual’s Area 2 allocation is 800 traps and based on historical participation their Area 3 allocation is 300 traps. The overall trap cap in Area 2 is 800 traps and the overall trap cap in Area 3 is 2600 traps.
Most Restrictive Rule Interpretation: The most restrictive rule compares the trap cap in each area (800 in Area 2 vs. 2600 in Area 3) and the fisherman is limited to the most restrictive trap cap. Therefore, this fisherman is limited to his Area 2 allocation of 800 traps; 300 of these could be fished in Area 3
∗ In each example, trap caps are outlined. In some LCMA’s, these trap caps will change due to active and passive reductions and this section should not be used to determine trap caps for these areas.

Example 2: A lobster fisherman is permitted in both Area 2 and 3. Their Area 2 allocation is 800 traps and based on historical participation his Area 3 allocation is 1200 traps. The overall trap cap in Area 2 is 800 traps and the overall trap cap in Area 3 is 2600 traps.
Most Restrictive Rule Interpretation: The most restrictive rule compares the trap cap in each area (800 in Area 2 vs. 2600 in Area 3) and the fisherman is limited to the most restrictive trap cap, which is 800 traps in Area 2. Therefore, this fisherman is limited to his Area 2 allocation of 800 traps to be fished in either area.
Example 3: A lobster fisherman is permitted in both Area 3 and 4. Based on historical participation, his Area 3 allocation is 1000 traps and based on historical participation his Area 4 allocation is 1200 traps. The overall trap cap in Area 3 is 2600 traps and the overall trap cap in Area 4 is 1440 traps.
Most Restrictive Rule Interpretation: The most restrictive rule compares the trap cap in each area (2600 in Area 3 vs. 1440 in Area 4) and the fisherman is limited to the most restrictive trap cap, which is 1440 in Area 4. Therefore, this fisherman is limited to his allocation in Area 4 of 1200 traps; 1000 of these can be fished in Area 3.
Example 4: A lobster fisherman is permitted in both Area 3 and 4. Based on historical participation, his Area 3 allocation is 1600 traps and based on historical participation his Area 4 allocation is 1000 traps. The overall trap cap in Area 3 is 2600 traps and the overall trap cap in Area 4 is 1440 traps.
Most Restrictive Rule Interpretation: The most restrictive rule compares the trap cap in each area (2600 in Area 3 vs. 1440 in Area 4) and the fisherman is limited to the most restrictive trap cap, which is 1440 in Area 4. Therefore, this fisherman is limited to his allocation in Area 4 of 1000 traps to be fished in either area.

Most Restrictive Rule
300
800
1200 1000
1200
1600
1000
800
0
500
1000
1500
2000
2500
3000
Area 2** Area 3* Area 2*** Area 3 Area 3* Area 4** Area 3 Area 4***
Example 1 Example 2 Example 3 Example 4
Area Trap Limits and Individual Trap Allocations
Trap
Lim
itsPotential Traps Individual's Allocation
* *This number of traps is allowed under the new Addendum IV proposal.
Total Bar = Trap Cap
* This number of traps is allowed under the status quo MRR.

4. Area 3 Management Measures
4.1 Introduction and Background This section includes both an increase in active trap reductions in Area 3 as well as a transferable trap program. The following management measures are only applicable to those who designate Area 3 on their permit.
4.2 Area 3 Transferable Trap Program Management Measures The Area 3 LCMT’s purpose of including a transferable trap plan within the Area 3 LCMT Lobster Plan, in conjunction with other conservation measures already recommended for implementation in Area 3, is to establish a program that helps to maintain conservation objectives necessary to sustain the lobster resource by passively reducing traps in the Area 3 fishery. It also may allow for economic profitability through flexibility, and supports creative options for future business planning. For this program, a transfer is defined by a change in ownership of a trap tag allocation or any portion thereof.
4.2.1 Minimum Transfer A transfer must be comprised of a minimum of 50 traps. A conservation tax will be subtracted from the total number of traps transferred.
4.2.2 Transfer Boundaries Trap tag transfers may occur only within the Area 3 boundaries.
4.2.3 Anti-monopoly Clause No single company or individual may own, or share ownership of, more than 5 qualified LCMA 3 federal permits. However, those individuals who have more than 5 permits in December 2003 may retain the number they had at that time but may not own or share ownership of any additional permits.
4.2.4 Conservation Tax A conservation tax (passive reduction) of 10% will be assessed for each transfer that equates to a purchaser owning up to 2100 traps. For all transfers where the transfer of trap tags result in a permit exceeding 2100 traps, those traps over 2100 will be taxed at 50%, up to the total trap cap of 2600. Any tax resulting in a fraction of a trap will be taxed at the next higher whole trap level.
4.2.5 Trap Transfer vs. Lease Trap tags may be transferred/sold/bought; leasing will not be permitted.
4.2.6 Sale of Operation The sale of a complete operation (permit and all associated trap tags) will be taxed at 10%. Any tax resulting in a fraction of a trap will be taxed at the next higher whole trap level.
4.2.7 Active Reductions Any active reductions will be judged according to the total number of trap tags allocated to each permit.

11
4.2.8 Documentation Notarized documentation with signatures of both parties (seller/purchaser) must be submitted to appropriate State(s)/Federal agencies prior to, or accompanying trap tag application.
4.2.9 Effective Date Transfers and new trap allocations will become effective with the issuance of new trap tags, at the beginning of the upcoming fishing year.
4.2.10 Periodic Review The Area 3 LCMT will periodically review the components of the transferable plan.
4.2.11 Qualification The purchase of qualified Area 3 traps, by an individual with a federal lobster permit, regardless of fishing history in Area 3, will automatically qualify the purchaser to fish that number of qualified Area 3 traps within LCMA 3, once trap tags are issued. Any qualified Area 3 lobster fisherman, whether through NMFS initial qualification process or through the purchase of historically qualified Area 3 traps, is subject to the Area 3 management measures as prescribed in Amendment 3 of the Interstate Fishery Management Plan for American Lobster, and all applicable Addenda. Newly qualified vessels, through transferred trap allocations, must designate Area 3 on its federal lobster permit in order for transfers to become effective.
4.3 Active Trap Reductions for Area 3 Addendum IV includes a sliding scale trap reduction plan to increase active trap reductions to 10% (5% in each year, in 2007 and 2008, assuming no further delays in implementation). The rationale for the proposed increase in active reductions of traps is to help ensure that the goal of reducing fishing mortality is addressed and the associated economic and biological benefits are realized. This reduction is hypothetical at this point because the actual population of Area 3 fishermen has yet to be determined. The application deadline for qualification is December 31, 2003 and will be administered by NMFS.

12
5. Area 2 Management Measures
5.1 Introduction and Background In August of 2003, the Lobster Management Board asked the Technical Committee to advise the Board on the magnitude of problems (e.g., significant reductions in landings, declining survey abundance, shell disease, and other influences on mortality) in Area 2 as well as recommend an appropriate response and associated timeline for response in that Area. Specifically Board members were interested in TC member’s analysis of the chronology and spatial extent of stock declines. Board members also expressed interest in TC review of trawl survey and sea sampling information to provide insight into the current situation of stock declines in Area 2 and to advise if the current Amendment and supporting addenda are sufficient to remedy the problem. The October 2002 Technical Committee report (see Appendix I) indicated that landings had declined, the area survey indices had declined, and the incidence of shell disease was increasing. There was a consensus among the TC that the current overfishing definition (F10%), in combination with the proposed management measures, were not sufficient to remedy the current stock declines observed in Area 2 and spawning stock biomass needed to be rebuilt. The Lobster TC recommended reducing fishing mortality in Area 2, reducing effort in Area 2, and continuing to work on a control rule that incorporates both f-based and biomass based reference points to offer better management advice to varying stock conditions. In February 2003, the Lobster Board took Emergency Action to increase the minimum gauge size for lobsters in Area 2 on an accelerated time scale and initiated action to rebuild the lobster stock in Area 2 in 2003 through Addendum IV. This Addendum includes a goal for Area 2, an effort control program, and minimum gauge increases.
5.2 Goal for Area 2 The Lobster Management Board indicated it wanted to rebuild the lobster stocks in Area 2. While the Modeling Subcommittee at the Commission is evaluating the reference points and lobster population dynamics models, the Board asked the Technical Committee to develop a strategy by which to rebuild the Area 2 resource including an interim benchmark goal based on survey information and a Total Allowable Landings estimate (Please see Appendix II for the full TC report recommending this TAL and interim benchmarks and Appendix III for an update of the TAL estimates). Interim Benchmarks: The median relative exploitation rate is the threshold not to be exceeded. Time series data show that relative exploitation rates above the median are associated with low survey abundance. Highest survey indices occurred when relative exploitation was below the 75th percentile. Thus, the relative exploitation rate should be at or below the 75th percentile of the 1983-2002 time series in order to rebuild the population. The relationships among the survey index, relative exploitation and landings are consistent with general fishery dynamics. This suggests that biological reference points, interim biological

13
targets, thresholds, and TAL can be derived from these data. In the absence of an updated assessment, the RI Fall survey index will be used to track stock conditions in LCMA 2 and the 1983-2002 median (3.39) will be the minimum abundance threshold. The survey abundance was stable from 1988 - 1992, which corresponds to the median. In the absence of comprehensive modeling work the TC cannot determine if the RI fall trawl survey time series median represents stock conditions consistent with a “rebuilt” resource. However, it is clear that “rebuilding” to the 75th percentile stock conditions represents a significant improvement to the current stock status in LCMA 2.
Proposed Abundance Threshold = Median = 3.39 Proposed Abundance Target = 75th Percentile = 4.10
Total Allowable Landings: In order to develop a Total Allowable Landings for Area 2 associated with rebuilding, the TC calculated the 75th percentile of the relative exploitation time series generated from the RI fall survey index and multiplied it by the RI fall survey index. Based on these calculations the TAL is 2.1 million pounds for Area 2. This TAL is intended to be a performance measure to gauge the effectiveness of the management program. This calculation assumes that stock abundance remains static in 2003. The TC chose the 75th percentile of relative exploitation because of the higher likelihood of stock rebuilding than that which may occur using the time series median or other less conservative metrics. Furthermore, the 75th percentile of relative exploitation also coincides historically with high stock abundance and high commercial landings.
5.3 Area 2 Management Measures Because the methods used to develop the following management measures are imprecise, the management program below is designed to be flexible. The Management Board will review the stock conditions in Area 2 on an annual basis and make revisions to the management program as needed.
5.3.1 Effort Control Measures Vessel Upgrade Provision: All vessels authorized to fish for lobster with traps in Area 2 shall be limited to a 15% increase in length. Qualification and Trap Allocations for Area 2 permit holders: There shall be no new Area 2 permits after December 31, 2003. In order to qualify for an Area 2 permit endorsement, a permit holder must document landings between September 1999 and August 2003. Landings during this period of 2000 pounds or more in any one year qualifies the permit holder for 800 traps; landings during this period of 1 – 1999 pounds in any one of these years qualifies the permit holder for 100 traps. Trap Limits and Transferability Permit Transfer and Associated Trap Allocation:
If a federal or state permit holder transfers their permit and based on their history were initially allocated 800 traps, the new permit holder is allocated 400 traps. Two hundred of these 400 traps are transferable unless the individual holds both a federal and state

14
license and/or the permit holder landed 4000 pounds of lobsters in any one of the three years preceding the transfer. If either of these provisions is met, all 400 traps are transferable.
If a federal and/or state permit holder transfers their permit and based on their history were initially allocated 100 traps, the new permit holder is allocated 50 traps and all 50 are transferable.
Trap Transfer Provisions Outside of a Permit Transfer:
Transfers and new trap allocations will become effective with the issuance of new trap tags, at the beginning of the upcoming fishing year. Notarized documentation with signatures of both parties (seller/purchaser) must be submitted to appropriate State(s)/Federal agencies prior to, or accompanying trap tag application. Only one transfer per permit holder will be allowed during the first three years.
A transfer must be comprised of a minimum of 50 traps and in units of 10 traps. The upgrading requirements will apply to the transfer; for example, a 20 foot vessel shall only transfer traps to a vessel under 23 feet.
Conservation Tax
A conservation tax of 20% will be applied to each transfer. In addition to this tax, the first transfer a permit holder participates in initiates an initial reduction in traps to 400 traps for 800 trap permit holders and 50 traps for 100 trap holders.
Maximum Allowable Traps:
Permit holders can buy traps from other fishermen to a maximum of 800 traps.
5.3.2 Minimum Gauge Size The minimum size for American lobster in management Area 2 shall be no lower than the carapace length identified in the following schedule. Carapace length is the straight-line measurement from the rear of the eye socket parallel to the centerline of the carapace to the posterior edge of the carapace. The carapace is the unsegmented body shell of the American lobster. July 1st is the deadline for implementing these minimum gauge sizes.
Area 2 2005 - 3 13/32” 2006 - 3 7/16”
2007 - 3 15/32” 2008 - 3 ½”

15
6 Recommendations for Actions in Federal Waters The Atlantic States Marine Fisheries Commission believes that the measures contained in Amendment #3 and Addenda I, II, III and IV are necessary to limit the expansion of effort into the lobster fishery, to rebuild egg production to recommended levels and to address stock declines. ASMFC recommends that the federal government promulgate all necessary regulations to implement the measures contained in Sections 2 – 5 of this document. Specifically, the ASMFC recommends that the Secretary of Commerce implement the measures included in the following sections:
2.2 Vent Size Management Measures 3.2 Most Restrictive Rule Management Measures 4.2 Transferable Trap Program for Area 3 4.3 Active Trap Reductions for Area 3 5.3 Area 2 Management Measures
7 Compliance
7.1 Mandatory Elements of a State Program To be considered in compliance with Addendum IV, all state programs must include a regime of restrictions on American lobster fisheries consistent with the requirements of the following sections:
2.2 Vent Size Management Measures 3.2 Most Restrictive Rule Management Measures 4.2 Transferable Trap Program for Area 3 4.3 Active Trap Reductions for Area 3 5.3 Area 2 Management Measures
Except that a state may propose an alternative management program under Section 3.5 of Amendment 3, which, if approved by the Board, may be implemented as an alternative regulatory requirements for compliance.
7.2 Regulatory Requirements Each state must submit its required American lobster regulatory program to the Commission through ASMFC staff for approval by the Board. A state may not adopt a less restrictive management program than contained in this Addendum, unless otherwise approved by the Board.

16
7.3 Adjustments to the Compliance Schedule State management programs must have regulations to implement the following Sections of Addendum IV by the dates indicated in order to be in compliance with Amendment 3 to the American Lobster Fishery Management Plan.
Management Measure Section Date 2.2 Vent Size Management Measures Dec 31, 2004* 3.2 Most Restrictive Rule Management Measures January 1, 2004 4.2 Transferable Trap Program for Area 3 To be determined in Addendum V 4.3 Active Trap Reductions for Area 3 To be determined in Addendum V 5.3 Area 2 Management Measures June 1, 2005 * This is the implementation date for those areas that have already increased the minimum gauge to 3 3/8. All other required increases in vent size are to occur when the minimum gauge size increases.

17
Appendix I: Area 2 October 2002 Technical Committee Report:
Technical Analysis of the Chronology and Spatial Extent of Area 2 Stock Declines ASMFC Lobster Technical Committee
October 2002
Work Task Description On August 26, 2002 the Lobster Management Board directed the Lobster Technical Committee (TC) to advise the Board on the magnitude of problems (e.g., significant reductions in landings, declining survey abundance, shell disease, and other influences on mortality) in Area 2 as well as recommend an appropriate response and associated timeline for response in that Area. Specifically Board members were interested in TC member’s analysis of the chronology and spatial extent of stock declines. Board members also expressed interest in TC review of trawl survey and sea sampling information to provide insight into the current situation of stock declines in Area 2 and to advise if the current Amendment and supporting addenda are sufficient to remedy the problem. Process for Technical Analysis and Development of Recommendations The Lobster Technical Committee convened and reviewed a presentation from the TC chair regarding the current stock declines in Area 2. The TC then reviewed the information and drafted recommendations to the Lobster Board. Summary of Technical Committee Discussions (See attached report) Technical Committee Finding(s)/Recommendation(s) There was a consensus among the TC that the current overfishing definition (F10%), in combination with the proposed management measures, are not sufficient to remedy the current stock declines observed in Area 2. The Lobster TC has the following recommendation: Rebuild Spawning Stock Biomass (SSB) as soon as possible:
a.) Reduce Fishing Mortality in Area 2. b.) Task LCMT 2 to develop a plan that immediately reduces system wide
effective effort to levels that are consistent with rebuilding SSB. Although the exact levels of reduction are yet undefined, reduction should begin while the Model Development Sub-Committee determines those levels.
c.) Develop a control rule that incorporates both F- based and biomass based
reference points to offer better management advice to respond to varying stock conditions.

18
Summary of Area 2 Stock Conditions Summary of Area 2 Trawl Survey Indices: The MA and RI fall trawl survey lobster abundance indices were separated by sex and broken down into three 11 mm length categories; Pre-recruits (59 – 70 mm), Recruits (71 – 82 mm), and Legals (83 + mm). MA Area 2 male survey indices have dropped substantially from higher levels observed in the late 1980’s and early 1990’s (Figure 1.) The male indices for pre-recruits, recruits, and legals respectively have remained below the time series mean for the last 5 years. The MA 2001 male survey indices were 67 %, 32 %, and 100 % below the time series mean for pre-recruits, recruits, and legals, respectively (Figure 5). MA Area 2 female survey indices have dropped substantially from higher levels observed in the late 1980’s and early 1990’s (Figure 2). The female indices for pre-recruits, recruits, and legals respectively have remained below the time series mean for 4 of the last 5 years. The MA 2001 female survey indices were 87 %, 100 %, and 42 % below the time series mean for pre-recruits, recruits, and legals respectively.
Figure 1. MA Area 2 Fall Trawl Survey Indices
0
0.1
0.2
0.3
0.4
0.5
0.6
0.7
0.8
0.9
1
1979 1980 1981 1982 1983 1984 1985 1986 1987 1988 1989 1990 1991 1992 1993 1994 1995 1996 1997 1998 1999 2000 2001
Year
Del
ta M
ean
# pe
r Tow
MA- 59-70 mmMA- 71-82 mmMA-83+
MALES

19
RI Area 2 male survey indices have dropped substantially from higher levels observed in the late 1980’s and early 1990’s (Figure 3). The RI 2001 male survey indices for Pre-recruits and recruits dropped precipitously between 1996 and 2000, and experienced a slight increase in 2001. The legal male index has declined steadily from the time series high in 1997. In 2001 the pre-recruit and recruit male indices were close to the time series mean, however the legal index was 54% below the time series mean.
RI Area 2 female survey indices have dropped substantially from higher levels observed in the late 1980’s and early 1990’s (Figure 4). The female indices for pre-recruits, and recruits have dropped precipitously since 1996. Legal female index has dropped as well, but not to the same degree as pre-recruit and recruits. The RI 2001 female survey indices were 74 %, 51 %, and 66 % below the time series mean for pre-recruits, recruits, and legals respectively.
Figure 2. MA Area 2 Fall Trawl Survey Trends
0
0.2
0.4
0.6
0.8
1
1.2
1.4
1.6
1.8
1979 1980 1981 1982 1983 1984 1985 1986 1987 1988 1989 1990 1991 1992 1993 1994 1995 1996 1997 1998 1999 2000 2001
Year
Del
ta M
ean
# pe
r Tow
MA- 59-70 mmMA- 71-82 mmMA-83+
FEMALES

20
Figure 3. RI Area 2 Fall Trawl Survey Trends
0
1
2
3
4
5
6
7
1979 1980 1981 1982 1983 1984 1985 1986 1987 1988 1989 1990 1991 1992 1993 1994 1995 1996 1997 1998 1999 2000 2001
Year
Mea
n #
per T
ow RI- 59-70 mmRI- 71-82 mmRI-83+
MALES

21
Figure 4. RI Area 2 Fall Trawl Survey Trends
0
0.5
1
1.5
2
2.5
3
3.5
4
4.5
5
1979 1980 1981 1982 1983 1984 1985 1986 1987 1988 1989 1990 1991 1992 1993 1994 1995 1996 1997 1998 1999 2000 2001
Year
Mea
n #
per T
ow
RI- 59-70 mmRI- 71-82 mmRI-83+
FEMALES
Figure 5. % Difference in 2001 Trawl Survey Indices From the Time Series Mean
-0.67
-0.32
-1.00
0.05
-0.01
-0.54
-0.87
-1.00
-0.42
-0.74
-0.51
-0.66
-1.20
-1.00
-0.80
-0.60
-0.40
-0.20
0.00
0.20
MA- 59-7
0 mm
MA- 71-8
2 mm
MA-83+
RI- 59-7
0 mm
RI- 71-8
2 mm
RI-83+
MalesFemales

22
Summary of RI and MA Area 2 Trap CPUE Trends: Area 2 Sub-Legal CPUE MA sub-legal CPUE shows increasing trend during 1984-1990, with a sharply decreasing trend during 1991-2001(Figure 6). 2001 MA sub-legal CPUE is the time-series low; and is 63% below the time-series mean. (Figure 9)
RI sub-legal CPUE shows a generally decreasing trend over the entire time-series and a constant decreasing trend during 1997-2001. 2001 RI sub-legal CPUE is the time-series low; and is 23% below the time-series mean. (Figure 9) Area 2 Legal CPUE The MA legal CPUE fluctuates over the time-series with a slight increasing trend (Figure 7). 2001 MA legal CPUE is the time-series high, but may be due to a shift in effort from Buzzard’s Bay out to more offshore areas just south of the Elizabeth Islands. In recent years (1997-2001) fishermen in Buzzard’s Bay have made this shift in an attempt to maintain catch rates. The 2001 MA legal CPUE is 37% above the time-series mean. (Figure 9) The RI legal CPUE shows general, moderate decreasing trend over the time-series, with a sharp decline during 1999-2001(Figure 7). 2001 RI legal CPUE is the time-series low; 43% below the time-series mean. (Figure 9)
Figure 6. Area 2 Catch per Trap Haul from Sea-sampling (Sub-legals)
0
0.5
1
1.5
2
2.5
3
3.5
4
4.5
1981 1982 1983 1984 1985 1986 1987 1988 1989 1990 1991 1992 1993 1994 1995 1996 1997 1998 1999 2000 2001
Year
CTH
AU
L
RI-Sublegal MA-Sublegal

23
Area 2 Ovigerous CPUE The MA ovigerous CPUE shows an increasing trend during 1981-1990; fluctuates widely without trend during 1991-1994; appears relatively flat and stable during 1995-2001 (Figure 8). MA time-series shows slight decreasing trend overall. 2001 MA ovigerous CPUE is 33% below the time-series mean. (Figure 9) The RI ovigerous CPUE is relatively stable and fluctuates without any apparent trend during 1991-1997; shows an increasing trend from 1997-1999; shows a decreasing trend from 1999-2001 (Figure 8). 2001 RI ovigerous CPUE is the second lowest in the time-series; 20% below the time-series mean. (Figure 9)
Figure 7. Area 2 Catch per Trap Haul from Sea-sampling (Legals)
0
0.2
0.4
0.6
0.8
1
1.2
1.4
1.6
1981 1982 1983 1984 1985 1986 1987 1988 1989 1990 1991 1992 1993 1994 1995 1996 1997 1998 1999 2000 2001Year
CTH
AU
L
RI LegalMA Legal
24
Figure 8. Area 2 Catch per Trap Haul from Sea-sampling (Ovigerous Females)
0
0.2
0.4
0.6
0.8
1
1.2
1.4
1.6
1981 1982 1983 1984 1985 1986 1987 1988 1989 1990 1991 1992 1993 1994 1995 1996 1997 1998 1999 2000 2001Year
CTH
AU
L
RI-Female Ovigerous MA-Female Ovigerous
Figure 9. Area 2 % Difference in 2001 CTHAUL from the Time Series Mean
-0.23
-0.63
-0.43
0.37
-0.33
-0.20
-0.80
-0.60
-0.40
-0.20
0.00
0.20
0.40
0.60
RI-Sublegal MA-Sublegal RI Legal MA Legal MA-Female Ovigerous RI-Female Ovigerous
25
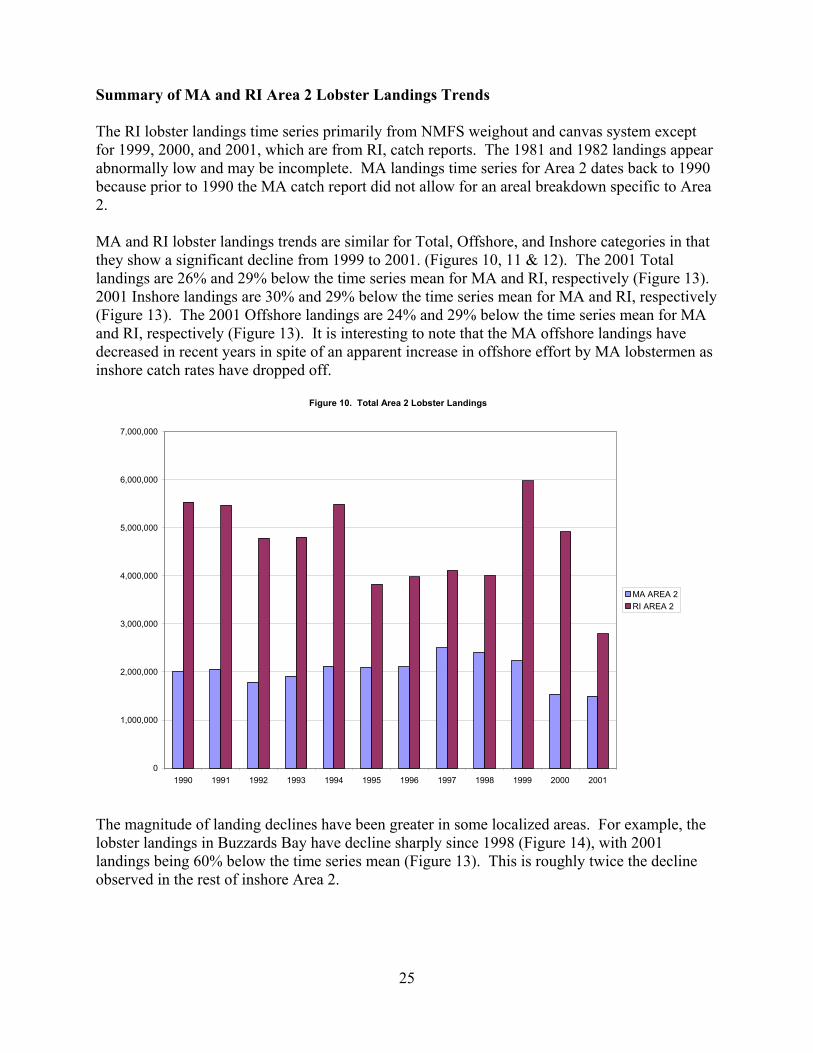
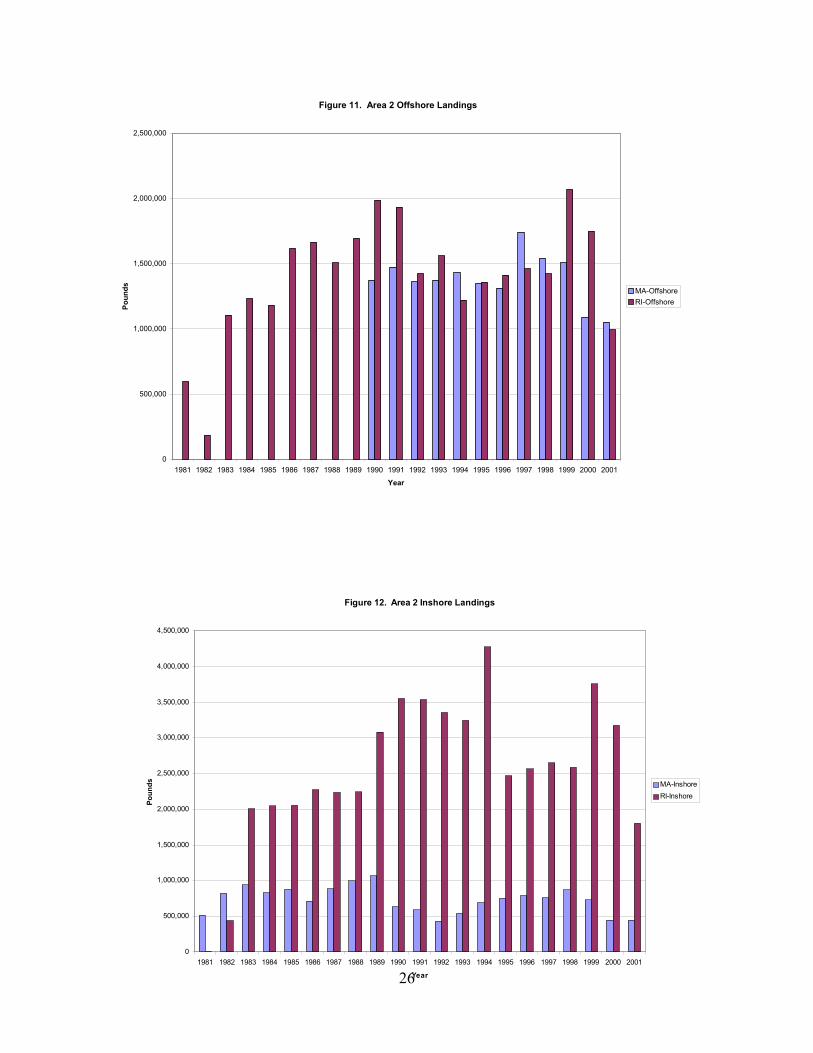
Summary of MA and RI Area 2 Lobster Landings Trends The RI lobster landings time series primarily from NMFS weighout and canvas system except for 1999, 2000, and 2001, which are from RI, catch reports. The 1981 and 1982 landings appear abnormally low and may be incomplete. MA landings time series for Area 2 dates back to 1990 because prior to 1990 the MA catch report did not allow for an areal breakdown specific to Area 2. MA and RI lobster landings trends are similar for Total, Offshore, and Inshore categories in that they show a significant decline from 1999 to 2001. (Figures 10, 11 & 12). The 2001 Total landings are 26% and 29% below the time series mean for MA and RI, respectively (Figure 13). 2001 Inshore landings are 30% and 29% below the time series mean for MA and RI, respectively (Figure 13). The 2001 Offshore landings are 24% and 29% below the time series mean for MA and RI, respectively (Figure 13). It is interesting to note that the MA offshore landings have decreased in recent years in spite of an apparent increase in offshore effort by MA lobstermen as inshore catch rates have dropped off.
The magnitude of landing declines have been greater in some localized areas. For example, the lobster landings in Buzzards Bay have decline sharply since 1998 (Figure 14), with 2001 landings being 60% below the time series mean (Figure 13). This is roughly twice the decline observed in the rest of inshore Area 2.
Figure 10. Total Area 2 Lobster Landings
0
1,000,000
2,000,000
3,000,000
4,000,000
5,000,000
6,000,000
7,000,000
1990 1991 1992 1993 1994 1995 1996 1997 1998 1999 2000 2001
MA AREA 2RI AREA 2
26
Figure 11. Area 2 Offshore Landings
0
500,000
1,000,000
1,500,000
2,000,000
2,500,000
1981 1982 1983 1984 1985 1986 1987 1988 1989 1990 1991 1992 1993 1994 1995 1996 1997 1998 1999 2000 2001
Year
Poun
ds MA-OffshoreRI-Offshore
Figure 12. Area 2 Inshore Landings
0
500,000
1,000,000
1,500,000
2,000,000
2,500,000
3,000,000
3,500,000
4,000,000
4,500,000
1981 1982 1983 1984 1985 1986 1987 1988 1989 1990 1991 1992 1993 1994 1995 1996 1997 1998 1999 2000 2001
Year
Poun
ds MA-InshoreRI-Inshore

27
Figure 13. % Difference in 2001 Area 2 Landings from the Time Series Mean
-0.60
-0.29
-0.24
-0.29
-0.38
-0.29
-0.26
-0.7
-0.6
-0.5
-0.4
-0.3
-0.2
-0.1
0MA TOTAL RI Total MA-Inshore RI-Inshore MA-Offshore RI-Offshore Buzzards Bay
Figure 14. Buzzards Bay (MA) Lobster Landings
0
50,000
100,000
150,000
200,000
250,000
300,000
350,000
400,000
450,000
500,000
1979
1980
1981
1982
1983
1984
1985
1986
1987
1988
1989
1990
1991
1992
1993
1994
1995
1996
1997
1998
1999
2000
2001
Year
Poun
ds
Buzzards Bay

28
Summary of MA and RI YOY Lobster Settlement Indices The RI lobster settlement index has varied widely but trended down since its inception in 1990 (Figure 15). The MA index started in 1995 near the low point in the RI time series, and has remained fairly steady but low. Without baseline data prior to 1990 it is impossible to determine how current settlement compares to historical levels.
Figure 15. Area 2 YOY Lobster Settlement Index
0.00
0.20
0.40
0.60
0.80
1.00
1.20
1.40
1.60
1990 1991 1992 1993 1994 1995 1996 1997 1998 1999 2000 2001 2002Year
Den
sity
(m2 )
RIMA

29
Summary of trends in the incidence of Shell Disease in Area 2 Subsequent to reported outbreaks of lobster shell disease in RI (1996) and MA (1997) state fisheries agencies that participate on the Lobster TC initiated a standard shell disease sampling protocol in June 2000 to monitor its prevalence. The prevalence of lobster shell disease in RI has increased steadily since monitoring began in 1996. In MA, shell disease levels were highest in 1998 and have declined since that time Figure 16). While the overall incidence of shell disease is fairly high in Area 2, there is no definitive work to date that relates shell disease to abnormal lobster mortality. At this time there is not sufficient information to characterize the impact of shell disease on the Area 2 lobster population.
Figure 16. Prevalence of Shell Disease in Area 2
0.0
5.0
10.0
15.0
20.0
25.0
30.0
35.0
40.0
45.0
50.0
1996 1997 1998 1999 2000 2001
Year
%
URI-TrapsURI-TrawlsRI-DEMMASS-SOUTH
30
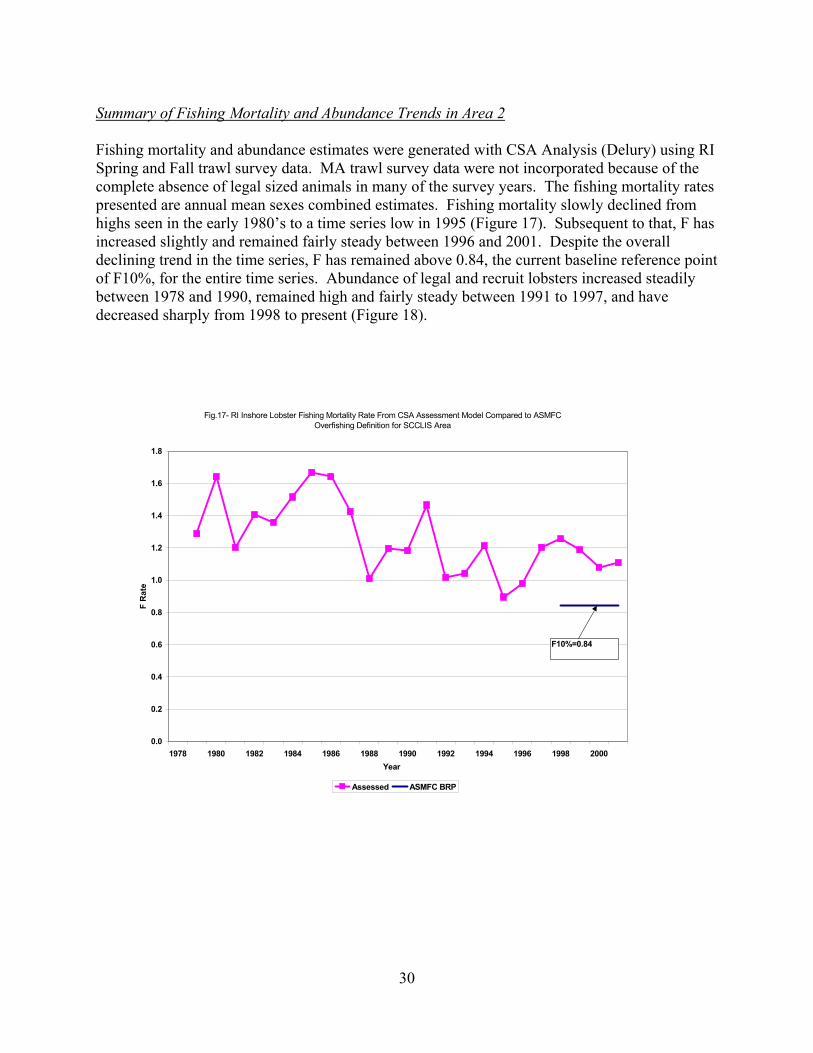
Summary of Fishing Mortality and Abundance Trends in Area 2 Fishing mortality and abundance estimates were generated with CSA Analysis (Delury) using RI Spring and Fall trawl survey data. MA trawl survey data were not incorporated because of the complete absence of legal sized animals in many of the survey years. The fishing mortality rates presented are annual mean sexes combined estimates. Fishing mortality slowly declined from highs seen in the early 1980’s to a time series low in 1995 (Figure 17). Subsequent to that, F has increased slightly and remained fairly steady between 1996 and 2001. Despite the overall declining trend in the time series, F has remained above 0.84, the current baseline reference point of F10%, for the entire time series. Abundance of legal and recruit lobsters increased steadily between 1978 and 1990, remained high and fairly steady between 1991 to 1997, and have decreased sharply from 1998 to present (Figure 18).
Fig.17- RI Inshore Lobster Fishing Mortality Rate From CSA Assessment Model Compared to ASMFC Overfishing Definition for SCCLIS Area
0.0
0.2
0.4
0.6
0.8
1.0
1.2
1.4
1.6
1.8
1978 1980 1982 1984 1986 1988 1990 1992 1994 1996 1998 2000Year
F R
ate
Assessed ASMFC BRP
F10%=0.84

31
The TC discussed additional information and analyses that may shed more light on the magnitude and extent of the decline of lobster stocks in Area 2. The following is a list of additional information that the TC plans to review at upcoming meetings;
*Examine environmental trends (especially temperature) over the same time frame.
*Breakdown of shell disease prevalence data by sex, size category, and egg status. *An analysis of CPUE trends broken down spatially (inshore and offshore) to note potential localized
effects. *Review information relative to the 1996 North Cape oil spill in Narragansett Bay. *Examination of landings, cpue, and trawl survey trends in Long Island Sound to determine if the decline is
limited to Area 2, or occurring in the entire SCCLIS stock unit.
*Examine the 1999 to 2001 mean of all indices to compare them with the time series means.
Fig. 18- RI Inshore Lobster Abundance From DeLury Assessment Model (Spring and Fall Average)
0.0
0.5
1.0
1.5
2.0
2.5
3.0
3.5
4.0
4.5
1978 1980 1982 1984 1986 1988 1990 1992 1994 1996 1998 2000
Year
Mill
ions
Lob
ster
s
Legals Recruits

32
Appendix II: Area 2 August 2003 Technical Committee Report:** Lobster Conservation Management Area 2
Goals and Management Measures ASMFC Technical Committee
August 2003
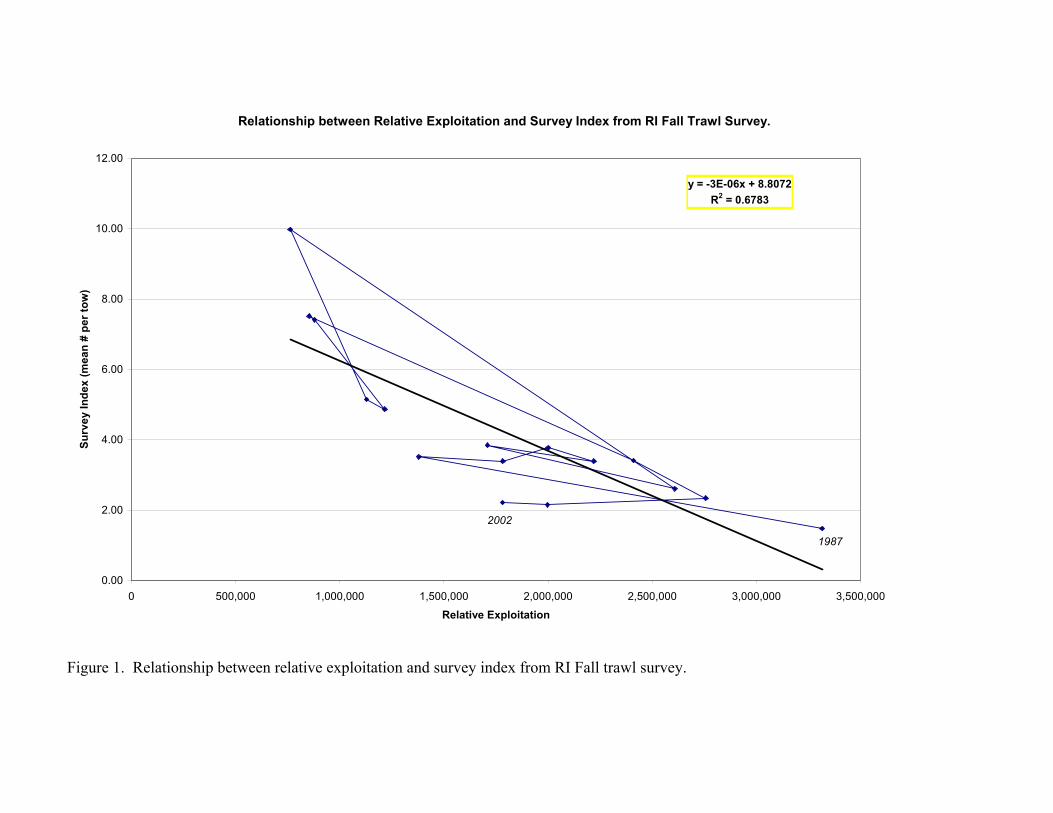
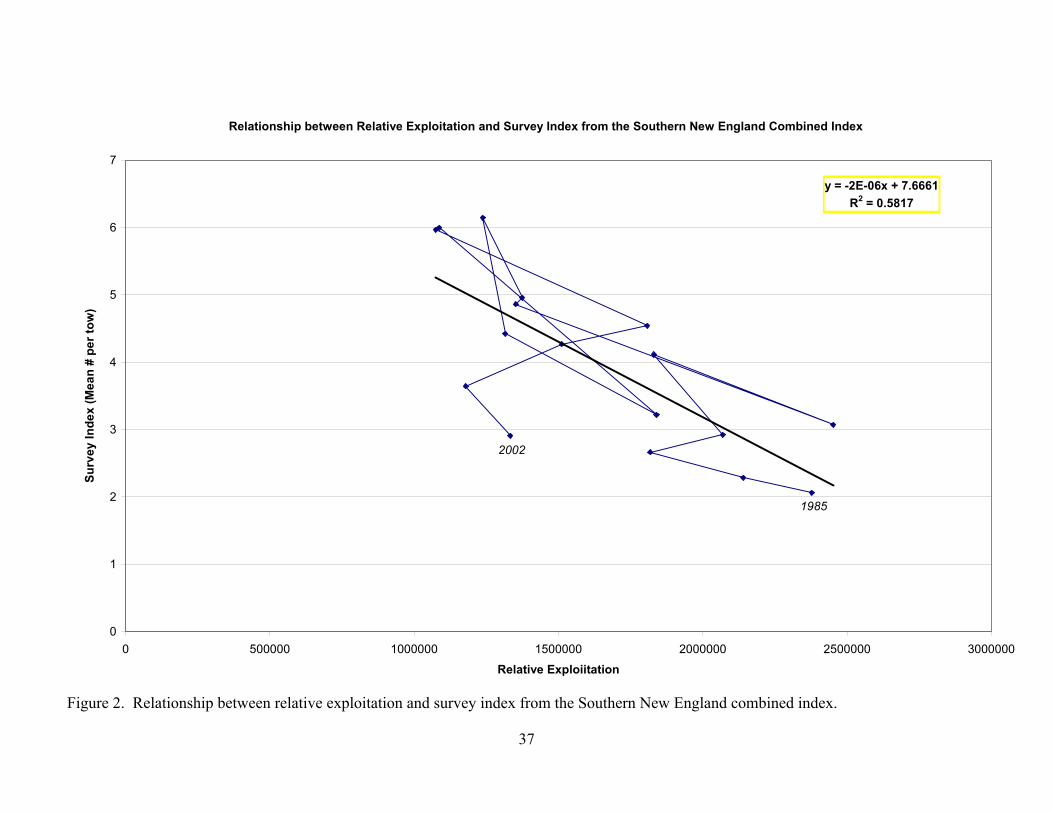
Work Task Description and Meetings: The Lobster Management Board through a memo from George Lapointe dated July 8, 2003 directed the Technical Committee to further develop both the goal for Area 2 as well as the management measures. The Board has indicated they would like to develop a management program in Area 2 that will allow for stock rebuilding and based on TC advice asked that fishery independent trawl surveys be used as an indicator of progress towards reaching the goal of rebuilding the lobster stock in Area 2. The Board requested using these surveys to monitor the status of the Area 2 lobster resource. The Board also requested an update and further review by the TC of the Total Allowable Landings estimates done by the Modeling Subcommittee this Spring. If possible, the TC was to make a recommendation for a TAL associated with rebuilding. The Board has also asked the Technical Committee to further develop all of the management measures included in the PDT options paper developed for the June Board meeting. These measures include effort control, seasonal closures, area closures, quotas, a moratorium, and traditional management measures. The Technical Committee met July 15 and 16 in Fairhaven MA and completed their work via conference calls on July 23 and August 8. Introduction: This TC report outlines recommendations from the TC on interim benchmarks and Total Allowable Landings, as well as the process used to develop these recommendations. It also includes specific recommendations on management measures for Area 2. Process for Determining Interim Benchmarks and Total Allowable Landings: The TC reviewed trends of recruit and full-recruit indices from the RI Fall trawl survey as well as a Southern New England combined index which included z-scored data from the MA Fall Trawl Survey, NMFS Fall Trawl Survey, RI Spring Trawl Survey, and Dominion Nuclear Annual Pot Sampling CPUE. Trends from the RI Fall Trawl Survey Index and the Southern New England Combined Index were compared to trends in relative exploitation (= landings in year t/survey index in year t-1) generated from each survey index respectively. Phase plots of survey index and relative exploitation (Figures 1 & 2) indicated a stronger relationship between RI survey index (r2 = 0.68) and relative exploitation than that of the Southern New England combined index (r2 = 0.58) and relative exploitation. Despite the risk of increased annual
* Only the portions of this TC report that apply to measures and goals adopted by the Management Board were included in this Addendum. For a full copy of this report, contact the ASMFC.

33
variability in a single survey index, the TC had more confidence in the RI fall survey index as an indicator of overall Area 2 stock conditions based on the results of this simple comparison. Further comprehensive analysis of the Southern New England combined index is warranted but was not possible due to time constraints. As an interim approach while the Modeling subcommittee develops recommendations for new reference points, the TC recommends using the RI Fall trawl survey index to track stock conditions in LCMA 2. Specifically, the TC suggests adopting the Rhode Island trawl fall index of legal and recruit (sexes combined, lobsters with carapace >72mm) to measure exploitable abundance. The survey index was not smoothed. Since the survey occurs in the fall and the recruits will molt to legal size in year t+1, the survey is considered an index of abundance on Jan 1 of the following year (year t+1). Relative exploitation was calculated as the ratio of total landings (lbs) in year t divided by the combined survey abundance index in year t-1. The relative exploitation rate provides a method for detecting patterns and trends in exploitation. This index provides no information on the magnitude of the fishing mortality rate and should not be compared to the F10% EPR reference point. Annual variation in survey indices due to sampling error and variation in availability will add noise to the relative exploitation index. The relative exploitation index should be used cautiously. Relationship between the RI trawl survey index and relative exploitation. A phase plot of RI trawl survey against relative exploitation (1983-2002) suggests a strong relationship between lobster abundance and exploitation (Figure 3), with a significant negative regression (R2 =0.55, slope = -1.2 *10-6, P<0.001). The lowest survey index occurred in years when relative exploitation was above 75th percentile. In contrast, the highest survey index values (above the 75th percentile) were associated with low relative exploitation indices (below the 25th percentile). The survey index remained relatively stable near the median (1988-1992) when relative exploitation was stable near or below the median relative exploitation. This dynamic is a typical population response to exploitation. This suggests that relative exploitation may be a useful proxy for detecting patterns and trends in exploitation rates. Range of likely values of relative exploitation in 2003. Relative exploitation in 2003 cannot be calculated because 2003 landings are as yet unavailable. The 2002 Survey index declined to 0.85. If landings in 2003 are in the range of 75% to 100% of what they were in 2002, relative exploitation will increase to above the 75th percentile. In order for relative exploitation to remain near the 2002 level, landings would have to decline by 55% in 2003, and for relative exploitation to be at or below the 25th percentile, as recommended by the TC, landings would have to drop by 71%. Relationship between RI trawl survey index and landings A phase plot of Area 2 landings (year t) against the RI trawl survey index (year t-1) indicates a relationship between landings and stock abundance index (Fig. 4). A regression between landings and stock abundance index was significant (R2=0.33, slope=317469, P<0.05). In addition to exploitable abundance, factors such as effort changes, improvements in catch efficiency, availability, regulatory changes in this and other fisheries, and market forces also influence landings.

34
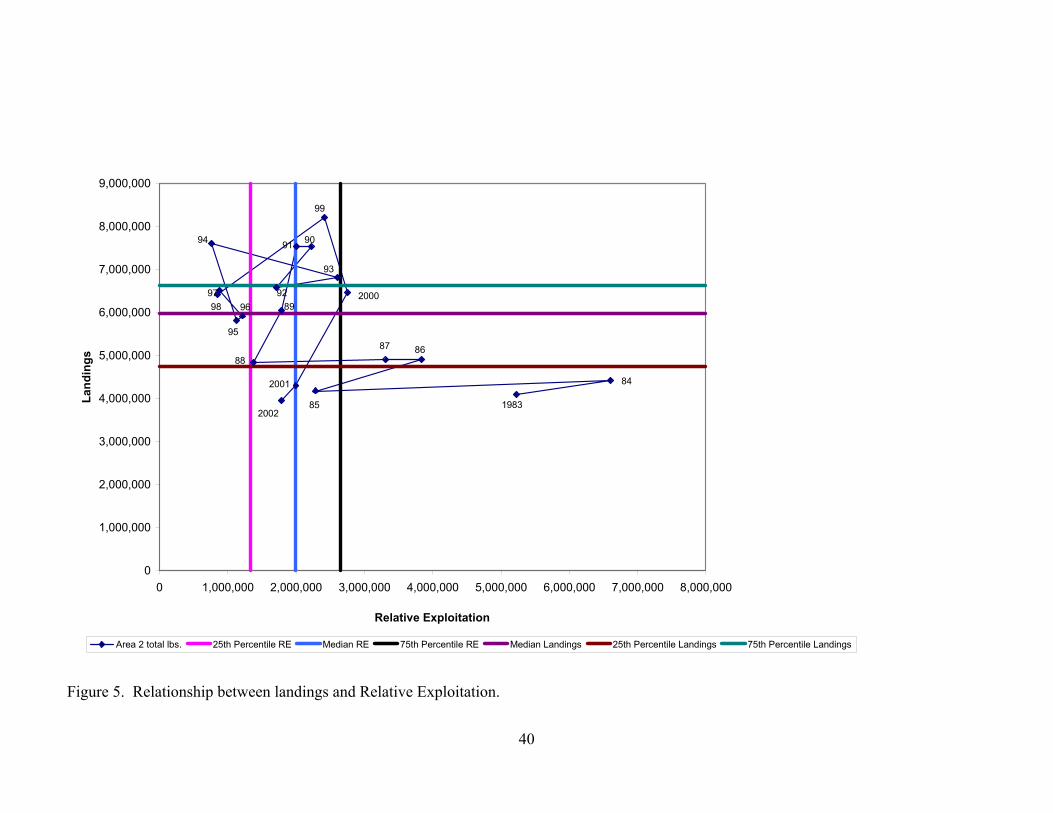
Relationship between landings and relative exploitation A phase plot of landings against relative exploitation (Figure 5) suggest that in general landings are higher when relative exploitation is near or below the median, and are generally lower when exploitation is above the median. A regression of landings on relative exploitation was not significant (R2=0.19, slope=-0.4, P=0.058). However, the pattern is consistent with expected behavior of landings relative to changes in exploitation rates. Technical Committee Recommendations: Interim Benchmarks: The Technical Committee recommends the median relative exploitation rate as a threshold not to be exceeded. Time series data show that relative exploitation rates above the median are associated with low survey abundance. Highest survey indices occurred when relative exploitation was below the 75th percentile. Thus, the Technical Committee recommends keeping relative exploitation rate at or below the 75th percentile of the 1983-2002 time series in order to rebuild the population (for a conceptual diagram of this approach see Appendix A) The relationships among the survey index, relative exploitation and landings are consistent with general fishery dynamics. This suggests that biological reference points, interim biological targets, thresholds, and TAC can be derived from these data. In the absence of an updated assessment, the TC recommends using the RI Fall survey index to track stock conditions in LCMA 2 and suggests the 1983-2002 median (3.39) as a minimum abundance threshold. The survey abundance was stable from 1988 - 1992, which corresponds to the median (Figure 6). In the absence of comprehensive modeling work the TC cannot determine if the RI fall trawl survey time series median represents stock conditions consistent with a “rebuilt” resource. However, it is clear that “rebuilding” to the 75th percentile stock conditions represents a significant improvement to the current stock status in LCMA 2.
Proposed Abundance Threshold = Median = 3.39 Proposed Abundance Target = 75th Percentile = 2.07
Total Allowable Landings: In order to develop a Total Allowable Landings for Area 2 associated with rebuilding the TC calculated the 75th percentile of the relative exploitation time series generated from the RI fall survey index and multiplied it by the 2002 RI fall survey index. Based on these calculations the TC recommends a TAL of 1.14 million pounds for Area 2 (Table 1). This calculation assumes that stock abundance remains static in 2003. The TC chose the 75th percentile of relative exploitation because of the higher likelihood of stock rebuilding than that which may occur using the time series median or other less conservative metrics. Furthermore, the 75th percentile of relative exploitation also coincides historically with high stock abundance and high commercial landings (Figure 5). In spite of the current management program, stock declines occurred in Area 2. For this reason the TC feels that a more conservative approach is warranted to better buffer against stock condition changes. The TC considered simply updating the modeling subcommittee work completed in January 2003, which used both the Collie Sissenwine and a biomass dynamic model to calculate a TAL, but chose this empirical method instead. The TC believes that more review of the biomass

35
dynamic model is needed prior to use in management decisions and are concerned about using either model on a management unit rather than stock unit basis. The empirical method used is more prone to large annual variability, however is likely to be more accurate when applied to a management area instead of a stock unit.
Relationship between Relative Exploitation and Survey Index from RI Fall Trawl Survey.
y = -3E-06x + 8.8072R2 = 0.6783
0.00
2.00
4.00
6.00
8.00
10.00
12.00
0 500,000 1,000,000 1,500,000 2,000,000 2,500,000 3,000,000 3,500,000Relative Exploitation
Surv
ey In
dex
(mea
n #
per t
ow)
1987
2002
Figure 1. Relationship between relative exploitation and survey index from RI Fall trawl survey.
37
Relationship between Relative Exploitation and Survey Index from the Southern New England Combined Index
y = -2E-06x + 7.6661R2 = 0.5817
0
1
2
3
4
5
6
7
0 500000 1000000 1500000 2000000 2500000 3000000Relative Exploiitation
Surv
ey In
dex
(Mea
n #
per t
ow)
1985
2002
Figure 2. Relationship between relative exploitation and survey index from the Southern New England combined index.

38
0.00
1.00
2.00
3.00
4.00
5.00
6.00
7.00
8.00
9.00
10.00
0 1,000,000 2,000,000 3,000,000 4,000,000 5,000,000 6,000,000 7,000,000 8,000,000Relative Exploitation
Surv
ey In
dex
(mea
n #
per t
ow)
Survey Index 25th Percentile Median RE Median Survey Index 75th Percentile Index 75th Percentile RE 25th Percentile Survey Index
20022000
99
98
97
9695
94
2001
93
9291
90
8988
87
86
85
8483
Figure 3. Relationship between Relative Exploitation and Survey Index from RI Fall Trawl Survey.

39
y = 317469x + 5E+06R2 = 0.3316
0
1,000,000
2,000,000
3,000,000
4,000,000
5,000,000
6,000,000
7,000,000
8,000,000
9,000,000
0.00 2.00 4.00 6.00 8.00 10.00Survey Index
Land
ings
(lbs
.)
landings Median Survey Index 25th Percentile Survey Index 75th Percentile Survey Index25th Percentile Landings Median Landings 75th Percentile Landings Linear (landings)
20021983
99
9897
9695
94
93
92
91 90
2000
200184
85
8687
88
89
Figure 4. Relationship between landings and Survey Index from RI Fall Trawl Survey.
40
0
1,000,000
2,000,000
3,000,000
4,000,000
5,000,000
6,000,000
7,000,000
8,000,000
9,000,000
0 1,000,000 2,000,000 3,000,000 4,000,000 5,000,000 6,000,000 7,000,000 8,000,000
Relative Exploitation
Land
ings
Area 2 total lbs. 25th Percentile RE Median RE 75th Percentile RE Median Landings 25th Percentile Landings 75th Percentile Landings
19832002
99
9897
96
95
94
93
92
91 90
2000
2001 84
85
868788
89
Figure 5. Relationship between landings and Relative Exploitation.
41
Area 2 Survey Index and Relative Exploitation
0
1,000,000
2,000,000
3,000,000
4,000,000
5,000,000
6,000,000
7,000,000
1983
1984
1985
1986
1987
1988
1989
1990
1991
1992
1993
1994
1995
1996
1997
1998
1999
2000
2001
2002
2003
Year
Rel
ativ
e Ex
plot
iatio
n
0.00
2.00
4.00
6.00
8.00
10.00
12.00
Mea
n N
umbe
r Per
Tow
Rel Exp Rel. Exp. 25th percentile Survey Index(recruits & full-recruits lagged 1 year) Survey Time series median
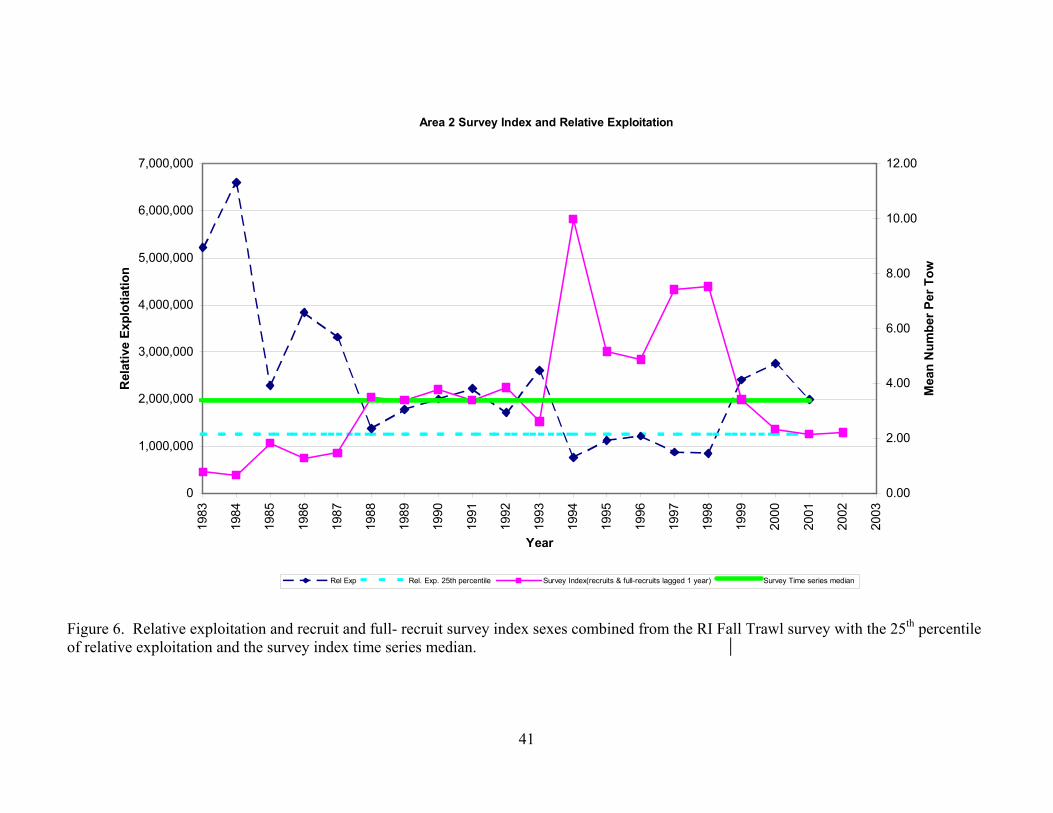
Figure 6. Relative exploitation and recruit and full- recruit survey index sexes combined from the RI Fall Trawl survey with the 25th percentile of relative exploitation and the survey index time series median.

Table 1. LCMA 2 landings, RI Fall Survey Index (recruit and full-recruit sexes combined), and relative exploitation with time series mean, median and 25th percentile. Calendar year Area 2 Total Landings (lbs.) RI Survey Index(recruits & full-
recruits lagged 1 year) Relative Exploitation
1983 4,093,379 0.78 5,220,7611984 4,420,527 0.67 6,598,3951985 4,174,158 1.83 2,285,2201986 4,904,022 1.28 3,841,4921987 4,897,490 1.48 3,315,0311988 4,844,451 3.51 1,380,1661989 6,048,534 3.39 1,782,5751990 7,538,149 3.77 2,000,3331991 7,527,213 3.39 2,220,1051992 6,573,257 3.85 1,708,8811993 6,811,604 2.61 2,608,3821994 7,612,096 9.98 762,4631995 5,820,550 5.15 1,129,6821996 5,918,448 4.87 1,216,1191997 6,516,418 7.41 879,2051998 6,412,980 7.52 852,8981999 8,207,475 3.40 2,410,7582000 6,455,748 2.34 2,757,1422001 4,294,226 2.15 1,997,3142002 3,946,455 2.21 1,782,270
Mean = 5,850,859 3.58 2,337,460Median = 5,983,491 3.39 1,998,82425th Percentile 4,738,470 2.07 1,339,15475 th Percentile 6,632,844 4.10 2,645,572
New TAL 1,138,281

Appendix A

44
Appendix III: Area 2 December 2003 Technical Committee Report:
Lobster Conservation Management Area 2 Updated TAL and Review of LCMT 2 August 2003 Proposal
ASMFC Technical Committee December 2003
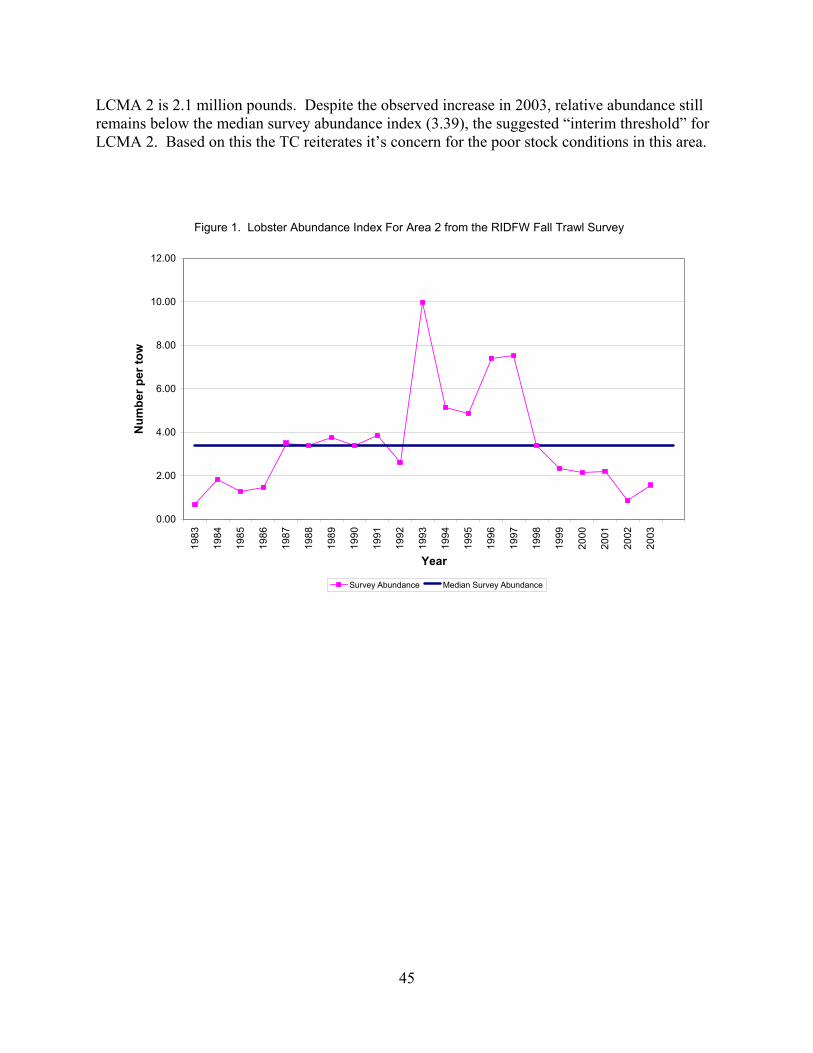
Work Task Description and Meetings: The Lobster Management Board has directed the Technical Committee to provide comment to the Board on the most recent LCMT 2 August 2003 Proposal, as well as update the Total Allowable Landings estimate for Area 2 with current data. Process: The Technical Committee met October 20 and 21 in Providence, RI to address these tasks. The TC critiqued the 2003 LCMT 2 Plan based on the probability that this plan would reduce the lobster harvest to a TAL of 2.1 million pounds, which is equivalent to 25th percentile of relative exploitation, the suggested “interim target”. Please see the August 2003 Technical Committee report for details on these interim target calculations. Findings/Recommendations: There was a consensus among the TC that the 2003 LCMT 2 Plan lacked conservation measures sufficient to rebuild the LCMA 2 lobster resource. The TC felt that none of the measures suggested by the LCMT would be effective at immediately reducing lobster harvest, which is critical to rebuilding lobster spawning stock biomass in LCMA 2. In light of the current poor stock condition in LCMA 2 the TC feels that much more aggressive management actions are necessary to rebuild the LCMA 2 lobster resource. Comments on LCMT 2 Plan: TC members felt that the qualification criteria of 1000 pounds to receive an 800 trap allocation was not stringent enough and would not effectively cap or reduce fishing effort on the short term. TC members indicated the proposal does not sufficiently address effort among current license holders and noted that the plan has the potential to allow a trap increase over current numbers. The TC noted the benefits of the 50% reduction upon initial permit transfer and the 20% conservation tax applied to trap transfers, although these measures would take considerable time for changes in effort to be realized. The TC commented that over a long time frame the plan had the potential to scale down the LCMA 2 trap numbers. In general, the TC believes that this plan could be a viable long-term solution to cap/reduce fishing effort to a yet to be determined level in LCMA 2, however is insufficient to address the immediate stock crisis that is occurring in this area. Update of LCMA 2 TAL/Stock Conditions: The 2003 RI trawl survey results indicate an increase in lobster relative abundance from 0.85 lobsters per tow in 2002 to 1.57 lobsters per tow in 2003 (Figure 1). Based on the 2003 survey index the TC estimates the updated TAL, related to the 25th percentile of relative exploitation, for
45
LCMA 2 is 2.1 million pounds. Despite the observed increase in 2003, relative abundance still remains below the median survey abundance index (3.39), the suggested “interim threshold” for LCMA 2. Based on this the TC reiterates it’s concern for the poor stock conditions in this area.
Figure 1. Lobster Abundance Index For Area 2 from the RIDFW Fall Trawl Survey
0.00
2.00
4.00
6.00
8.00
10.00
12.00
1983
1984
1985
1986
1987
1988
1989
1990
1991
1992
1993
1994
1995
1996
1997
1998
1999
2000
2001
2002
2003
Year
Num
ber p
er to
w
Survey Abundance Median Survey Abundance