dr. sutopo purwo nugroho - unocha · dr. sutopo purwo nugroho head of data, information and public...
TRANSCRIPT

3/25/2013
1
DR. Sutopo Purwo NugrohoHead of Data, Information and Public Relations BNPB
2013 POTENTIAL DISASTER,WEATHER MODIFICATION UPDATES,
AND WEATHER PREDICTION
• Disaster data in Indonesia year 2012 is 1,835 occurrences• Climax for disaster events was in January• No major disaster throughout 2012• 97% of disasters were hydrometeorology (typhoon, floods, landslides,
droughts, and tides)

3/25/2013
2
• Disaster impact: 481 deaths, 956,192 displacements, dan 54,626 homes damaged (10,998 heavy, 8,104 moderate, and 35,524 light).
• Percentage of disaster events in 2012:1. Typhoon (31%)
2. Floods (29%)
3. Landslides (16%)
4. Droughts (14%)
VICTIMS, HOUSING AND FACILITY DAMAGES CAUSED BY 2012 DISASTERS
Jenis Kejadian BencanaJumlah Kejadian
Bencana
Korban Kerusakan Rumah Sarana
Kesehatan Sarana
Peribadatan Sarana
PendidikanMeninggal danHilang
Menderita dan Mengungsi
Rusak BeratRusak
Sedang Rusak Ringan Terendam
Gempa Bumi 15 6 577 660 683 2,458 9 52 42
Gempa Bumi Dan Tsunami 1 11 - 5 - - -
Letusan Gunungapi 1 - 192 - - -
Tanah Longsor 291 119 7,153 463 193 698 904 4 14 19
Banjir Dan Tanah Longsor 51 29 64,984 1,037 341 1,048 35,146 1 5 9
Banjir 540 108 604,573 2,168 2,916 8,850 154,377 53 74 295
Kekeringan 264 - 233,167 - - -
Puting Beliung 562 44 34,381 6,122 3,779 21,754 130 21 61 95
Gelombang Pasang 29 1 9,191 325 166 601 158 1 12 14
Kecelakaan Transportasi 21 157 38 8 1 - - -
Kebakaran Lahan Dan Hutan 50 - 400 1 - 1 1
Konflik/Kerusuhan Sosial 10 6 1,536 214 26 109 - - -
Total 1,835 481 956,192 10,998 8,104 35,524 190,715 89 219 475
2013 Disaster Predictions

3/25/2013
3
Geological Disaster Prediction
1. Earthquake and Tsunami disasters cannot be predicted. They are instantenous.
2. Tsunamis are heavily affected by earthquakes (magnitude, depth, and source of the earthquake).
3. Volcano eruption cannot be predicted for long‐term. Few volcano eruption characteristics have changed. There are:a) 5 mounts with Alert Level III: Raung, Rokatenda, Lokon, Karang
etang, Ijen
b) 16 mounts with Alert Level II: Seulewah Agam, Ibu, Kerinci, Ili Lewotolo, Sangeangapi, Gamalama, Papandayan, Dukuno, Marapi, Sinabung, Bromo, Soputan, Semeru, Krakatau, Gamkonora, Talang
c) Lokon is estimated to still contain energy for eruption as what just occurred recently
Earthquake data: Engdahl 1964 - 2005
Indonesian Seismic-Tectonic Map
• Earthquake source: sub‐duction region and in‐land cecarian• There are 386 city/districts with 157 million lives living inhigh‐prone earthquake areas in Indonesia

3/25/2013
4
Location of Earthquakesthat cause Tsunami
Mentawai 2010
Aceh 2012
• Earthquake sources: subduction zones, beyond subduction, volcanoc eruption in thesea, and tsunami from outside Indonesian territory
• 172 tsunami occurred in Indonesia throughout year 1629‐2012• 233 city/districts in Indonesia with 5 million lives exist in tsunami‐prone areas
POSSIBILITY OF EARTHQUAKE SOURCES IN FUTURE
Professor Omer AYDAN of Tokai University, Japan
issued warning
Existed big seismic gapbetween tectonic zones 2007and 2005. Estimated magnitudecould be more than 8.7. Theearthquake will hit WestSumatra and possibility ofTsunami to hit Padang City isquite high.
GROUND SHAKING WILL NOT BE SIGNIFICANT BUT
FOLLOWED BY
TSUNAMI

3/25/2013
5
Simelue
Siberut - Kep. Batu
Pagai
Selat Sunda
Pantai Selatan Jateng
Selat Bali
SEISMIC GAPALONG SUBDUCTION ZONE BENIOFF-WADATI
SUMATERA-JAWA-BALI (earthquake records since 1964, update 11-09-2009)
Ade Edward/11/09/2009Sumber : www.csem-emsc.org
Seismic Gap : Regions within Benioff-Wadati
zone are center of earthquakes but earthquakes
had not occurred within the last decade.
This region has the highest change of higher earthquakes.
Every Seismic Gap regions has earthquake historical
records with damaging effects (Magnitude > 7 RS)
EARTHQUAKES CANNOT BE PREDICTED, BUT FORECASTS OF EARTHQUAKE CENTERS CAN BE DONE ACCURATELY WITH SEISMIC-GAP APPROACHES. ONLY LIMITATION IS THAT THE WHEN IT WILL OCCUR CANNOT BE ACCURATELY PREDICTED.
10
Sta. 01
Sta. 02
Sta. 03
Tsunami Model Product of Mega-Thrust Mentawai
Earthquake potential 8.9 SR, followed by tsunami 20-35 minutes
later in Padang City with 6‐10 meters height and 2‐5 km in‐land.
Exposed lives reach 1.3 million lives. Using worst scenario, estimated 39,321 lost of lives, 52,637 missing, and 103,225 wounded. Teluk Bayur sea-port, Minangkabau
airport and others destroyed.

3/25/2013
6
4 Programs in Masterplan:
1. Strengthening chain of tsunami early warning development of sirenes, information, earthquake detections, etc.
2. Development and increase of temporary evacuation locations shelter development, evacuation routes, beacons, socializations, etc.
3. Strengthening of preparedness capacity and DRR development of pusdalops, resilient villages, rules, drills, logistics, equipment, contingency plans, etc.
4. Development of autonomous disaster industries instrumentation industries, SME (Small and Medium Enterprise).Congestion in Medan-
Banda Aceh street, nearPunge bridge, Banda Aceh
11
Implementation of Tsunami DRR Masterplan
PRIORITY AREAS FOR TSUNAMI MASTERPLAN 2013 IMPLEMENTED
For year 2013• Priority in 51 city/districts• Budget Rp 1 trillion
For year 2014• Budget Rp 2.1 trillion

3/25/2013
7
Hydro‐meteorological Disaster Prediction1. Hydro‐meteorological disasters (floods, land‐slides, droughts, forest
hot‐spots and typhoons) will dominate 2013.
2. BMKG declared normal rainy season. Until May 2013 rain condition = normal (50%), El Nino (32%), La Nina (18%) Southeast Sulawesi, Florest and Lombok rainfall below normal (10‐15%).
3. Typhoon potentials until Maret‐April 2013.
4. Flood and landslide potentials until March 2013. Climax for floods and landslides January‐February 2013.
5. Cold lava flood potentials in Mount Merapi (77 million cubic meter), Gamalama, Bromo, Lokon and Soputan until March 2013.
6. Forest hot‐spots potentials throughout drought season in 8 provinces: North Sumatra, Riau, Jambi, South Sumatra, West Kalimantan, Middle Kalimantan, South Kalimantan and East Kalimantan.
7. Drought potentials throughout Agust‐October in Java, Bali, Flores and regions with water deficit.
Trend of Typhoon Disasters
• Trend of typhoons prone to increase each year • Future risks will increase along with the increase of global climate change
and anthropogenic• Typhoon early warning system is yet to be available, as such information
dissemination to the community is limited—BNPB, BMKG, and BPPT have begun discussions to seek solutions
1430
6547
84
122
166
350
402
447
562
0
100
200
300
400
500
600
2002 2003 2004 2005 2006 2007 2008 2009 2010 2011 2012

3/25/2013
8
Risk Map for Typhoons in Indonesia
• Trend for typhoons has increased. Throughout 2002‐2012 increase by40 folds.
• There are 115 million lives living in 404 city/districts that are inIndonesian moderate‐high typhoon prone areas
• The spread of high‐prone typhoons are along Western Sumatra, JavaCoast, Flores, Southern Sulawesi
• The typhoon‐prone areas cover cities and villages
Sumber : Dian T. Scidel, et all
75% of Atmosphere’s gases are in the troposphere ;N2 – 58%O2 – 15%CO2
H2O0,75%
ᔑ Global Warming!• Implication of the expansion of
Stratospheric circulation
• Distribution of ozone
Poorly understood
The rate of expansion :2° ‐ 4.8° latitude per 25 km

3/25/2013
9
Why typhoons are increasing?
Drop of evaporated water and the increase of Cumulonimbus clouds (from 13,000 feet to 18,000 feet) causing greater energy during down‐
draft process, which result in typhoons and extreme rains
Weather Modification

3/25/2013
10
Weather Modification Technolgoy is man‐made effort in controlling water resources in atmosphere to increase rainfall and reduce rainfall intensity on selected areas
minimize natural disaster caused by weather and climate by taking advantage the weather parameters
Purpose of weather modification

3/25/2013
11
• By seeding the clouds using seeder tool size of 10 – 100 μmwill increase efficiency of impact and cause the rain to fall earlier and faster
• If “jumping process” mechanism is applied to clouds in upwind areas (that will enter target area), those clouds will rain before entering target area. As such, “jumping process mechanism” will reduce rainfall in target area.
• If we include smooth seeding materials into newly developed clouds, these material will absorb water vapors and develop tiny grains that will compete with existing cloud vapor grains. This method will prevent the development of cloud (competition mechanism)
Weather Modification Technology competition methodology (seeding with seeding materials <2 μm in targeted area)

3/25/2013
12
POSKO Pondok Cabe dan CurugGBG MenaraGBGPosmet
Weather Modification Technology to Reduce Rainfall That Cause Floods in Jakarta
Jumping Process
Weather modification in Jakarta and surrounding throughout 26 January – 27 February 2013 had reduced rainfall. How much reduction in rainfall is being
researched

3/25/2013
13
Cloud Seeding Aircraft , South Africa
Example of launching of powdery agents from SU‐30 seeding aircraft , Rusia
Olympic organizers fired a barrage of 1,110 rockets into the evening
sky to make sure the 2008 Olympic opening ceremony was
precipitation-free.
Cloud seeding in China is conducted by anti-air gun turret and rockets aimed at the clouds. Even during the opening of Olimpic 2008, 1,100 rocket were shot to ensure no rain during the event
3/25/2013
14
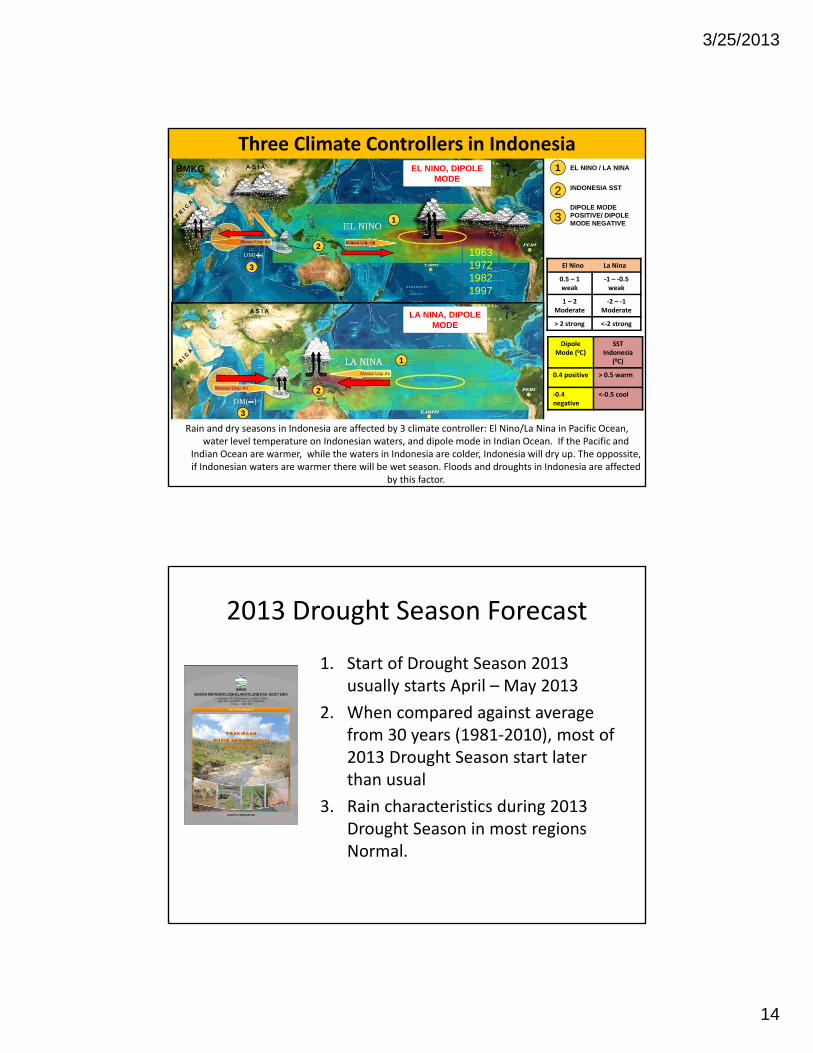
EL NINO / LA NINA
INDONESIA SST
A S I A
A S I A
1
2
3DIPOLE MODE POSITIVE/ DIPOLE MODE NEGATIVE1
2
1
3
2
BMKG
Dipole Mode (0C)
SST Indonesia
(0C)
0.4 positive > 0.5 warm
‐0.4 negative
<‐0.5 cool
El Nino La Nina
0.5 – 1 weak
‐1 – ‐0.5 weak
1 – 2 Moderate
‐2 – ‐1Moderate
> 2 strong <‐2 strong
1963197219821997
3
EL NINO, DIPOLE MODE
LA NINA, DIPOLE MODE
27
Three Climate Controllers in Indonesia
Rain and dry seasons in Indonesia are affected by 3 climate controller: El Nino/La Nina in Pacific Ocean, water level temperature on Indonesian waters, and dipole mode in Indian Ocean. If the Pacific and
Indian Ocean are warmer, while the waters in Indonesia are colder, Indonesia will dry up. The oppossite, if Indonesian waters are warmer there will be wet season. Floods and droughts in Indonesia are affected
by this factor.
2013 Drought Season Forecast
1. Start of Drought Season 2013 usually starts April – May 2013
2. When compared against average from 30 years (1981‐2010), most of 2013 Drought Season start later than usual
3. Rain characteristics during 2013 Drought Season in most regions Normal.
3/25/2013
15
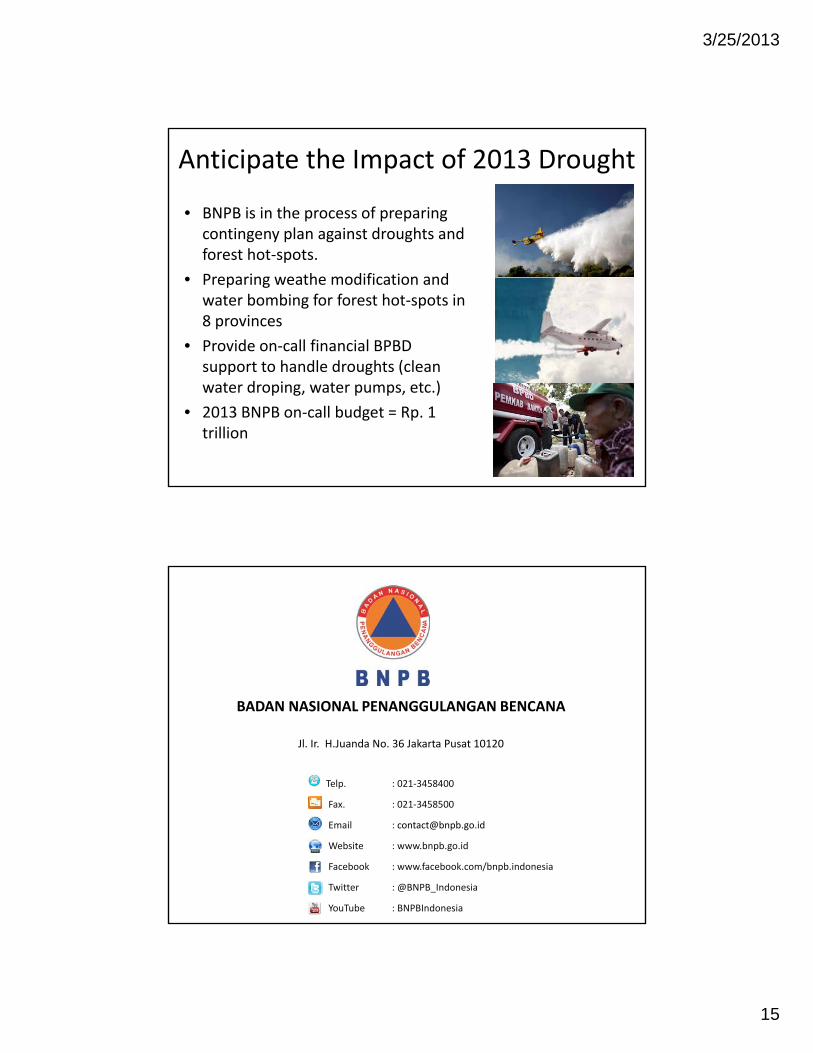
Anticipate the Impact of 2013 Drought
• BNPB is in the process of preparing contingeny plan against droughts and forest hot‐spots.
• Preparing weathe modification and water bombing for forest hot‐spots in 8 provinces
• Provide on‐call financial BPBD support to handle droughts (clean water droping, water pumps, etc.)
• 2013 BNPB on‐call budget = Rp. 1 trillion
BADAN NASIONAL PENANGGULANGAN BENCANA
Jl. Ir. H.Juanda No. 36 Jakarta Pusat 10120
Telp. : 021‐3458400
Fax. : 021‐3458500
Email : [email protected]
Website : www.bnpb.go.id
Facebook : www.facebook.com/bnpb.indonesia
Twitter : @BNPB_Indonesia
YouTube : BNPBIndonesia