dr. stacy dr. stacy sechrist sechrist -...
TRANSCRIPT

��
Preliminary Evaluation ResultsPreliminary Evaluation ResultsPreliminary Evaluation ResultsPreliminary Evaluation Results
Dr. Stacy Dr. Stacy Dr. Stacy Dr. Stacy SechristSechristSechristSechristUniversity of North Carolina at Greensboro, USUniversity of North Carolina at Greensboro, USUniversity of North Carolina at Greensboro, USUniversity of North Carolina at Greensboro, US
Suggested citation: Sechrist, S. M. & Weil, J. D. (2014, June). The High Point OFDVI: Preliminary Evaluation Results. In D. K.
Kennedy (Chair), Using Focused Deterrence to Combat Domestic Violence. Symposium presented at the John Jay College of
Criminal Justice International Conference: The Rule of Law in an Era of Change: Security, Social Justice, and Inclusive
Governance, Athens, Greece.
� Is offender behavior changing?
o According to DV victim interviews, they stated, “I just want the violence to stop.”
o Offender recidivism = subsequent DV-related arrest
o DV arrests: changes over time
� Is victim harm decreasing?
o Harm = reported injuries from DV arrest reports & homicides
� What will the effect of the strategy be on law enforcement resources?
o More of an exploratory question that will be important for replication
o Resources = calls for service impact
o Changes over time: pre- vs post-implementation
� For crime trend data, we must examine month-over-month trends due to seasonal variations known to be associated with crime
0%
5%
10%
15%
20%
25%
1997 1998 1999 2000 2001 2002 2003 2004 2005 2006 2007 2008 2009 2010 2011 2012 Jun-13
Year of First DV ArrestYear of First DV ArrestYear of First DV ArrestYear of First DV Arrest
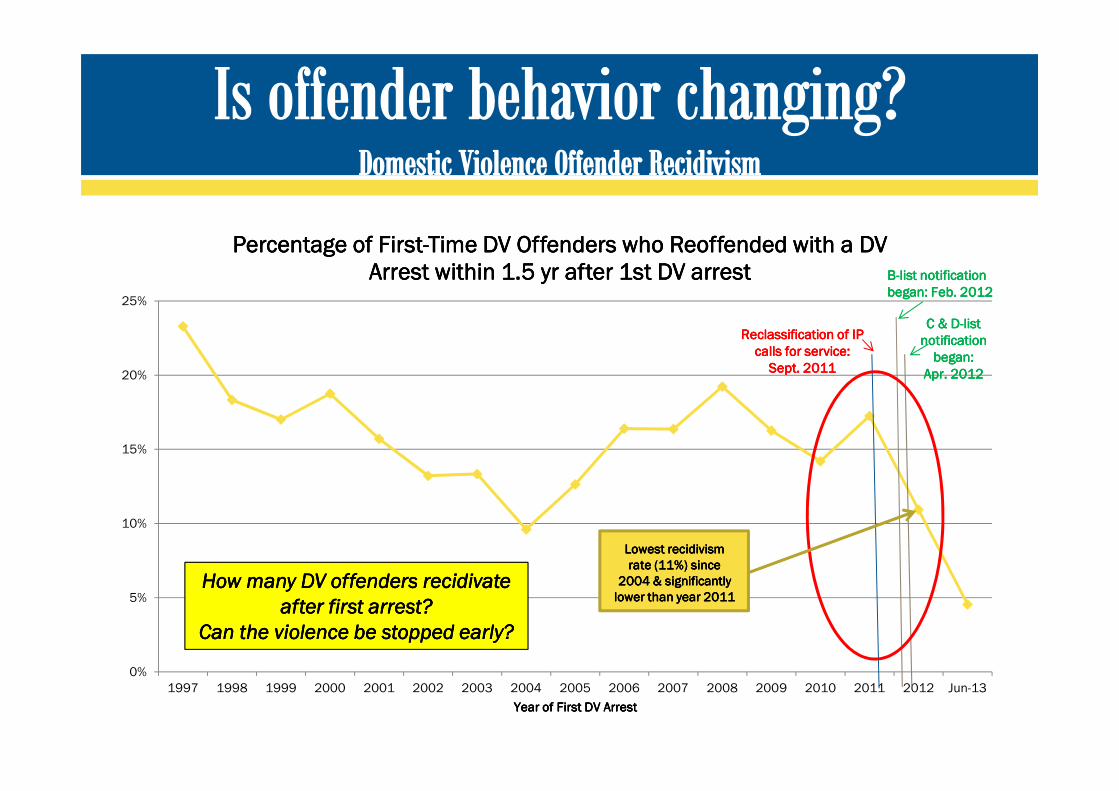
Percentage of Percentage of Percentage of Percentage of FirstFirstFirstFirst----Time DV Offenders Time DV Offenders Time DV Offenders Time DV Offenders who Reoffended with a DV who Reoffended with a DV who Reoffended with a DV who Reoffended with a DV Arrest Arrest Arrest Arrest within within within within 1.5 1.5 1.5 1.5 yryryryr after 1st DV arrestafter 1st DV arrestafter 1st DV arrestafter 1st DV arrest
Reclassification of IP Reclassification of IP Reclassification of IP Reclassification of IP
calls for service: calls for service: calls for service: calls for service:
Sept.Sept.Sept.Sept. 2011201120112011
BBBB----list notification list notification list notification list notification
began:began:began:began: Feb. 2012Feb. 2012Feb. 2012Feb. 2012
C & DC & DC & DC & D----list list list list
notification notification notification notification
began: began: began: began:
Apr. 2012Apr. 2012Apr. 2012Apr. 2012
How many DV offenders recidivate How many DV offenders recidivate How many DV offenders recidivate How many DV offenders recidivate
after first arrest? after first arrest? after first arrest? after first arrest?
Can the violence be stopped early?Can the violence be stopped early?Can the violence be stopped early?Can the violence be stopped early?
Lowest recidivism Lowest recidivism Lowest recidivism Lowest recidivism
rate (11%) since rate (11%) since rate (11%) since rate (11%) since
2004 & significantly 2004 & significantly 2004 & significantly 2004 & significantly
lower than year 2011lower than year 2011lower than year 2011lower than year 2011
0
100
200
300
400
500
600
700
800
900
A list B list C list D list
# o
f o
ffe
nd
ers
# o
f o
ffe
nd
ers
# o
f o
ffe
nd
ers
# o
f o
ffe
nd
ers
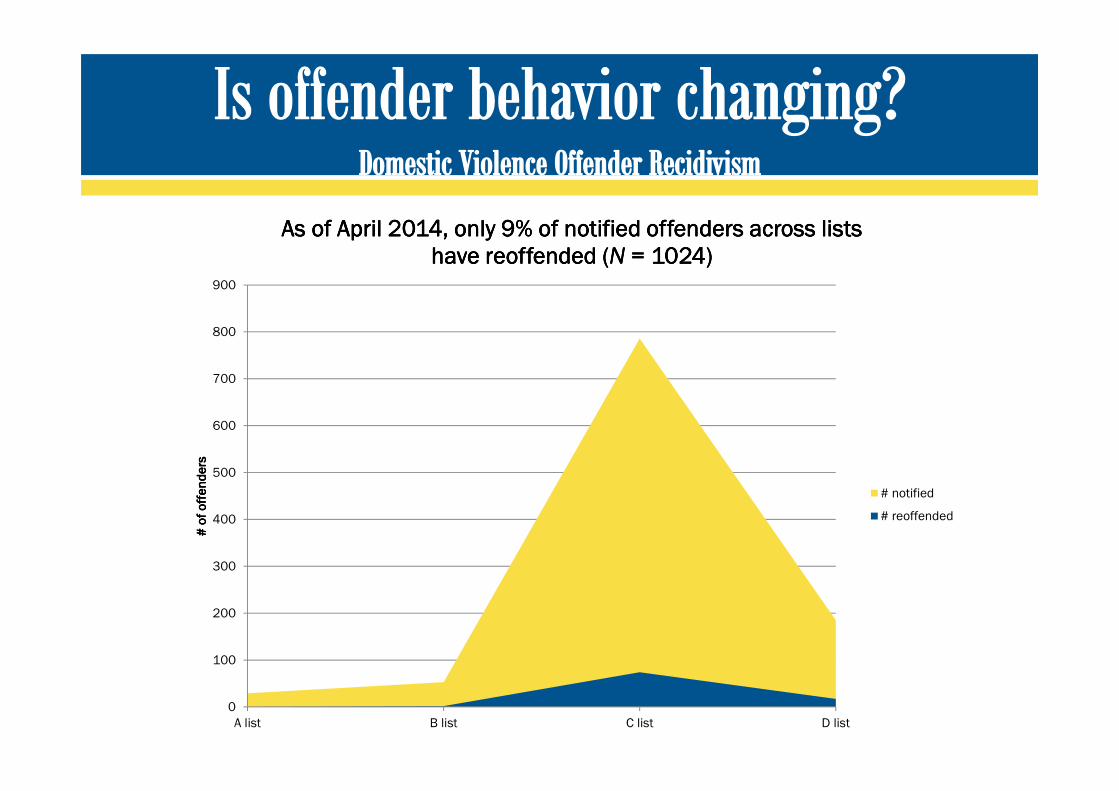
As of April 2014, only 9% of notified offenders across lists As of April 2014, only 9% of notified offenders across lists As of April 2014, only 9% of notified offenders across lists As of April 2014, only 9% of notified offenders across lists have reoffended (have reoffended (have reoffended (have reoffended (NNNN = 1024)= 1024)= 1024)= 1024)
# notified
# reoffended
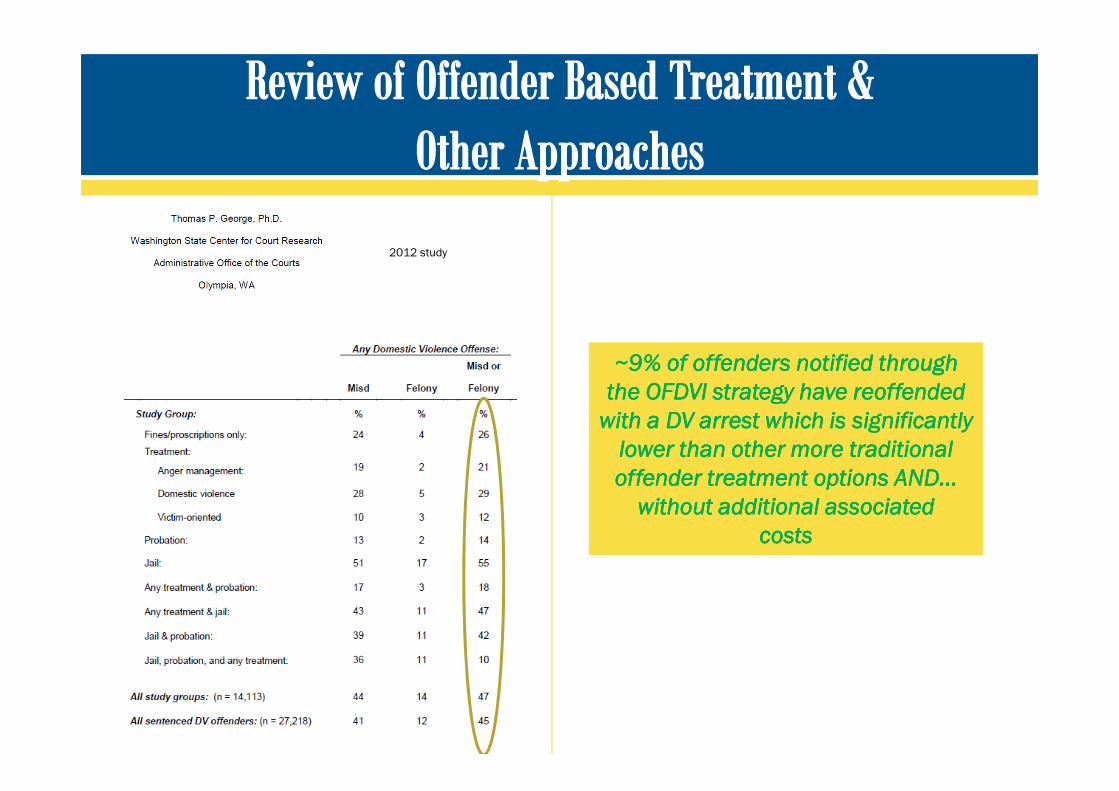
2012 study
~9% of offenders notified through ~9% of offenders notified through ~9% of offenders notified through ~9% of offenders notified through
the OFDVI strategy have reoffended the OFDVI strategy have reoffended the OFDVI strategy have reoffended the OFDVI strategy have reoffended
with a DV arrest which is significantly with a DV arrest which is significantly with a DV arrest which is significantly with a DV arrest which is significantly
lower than other more traditional lower than other more traditional lower than other more traditional lower than other more traditional
offender treatment options AND… offender treatment options AND… offender treatment options AND… offender treatment options AND…
without additional without additional without additional without additional associatedassociatedassociatedassociated
costscostscostscosts
0
20
40
60
80
100
120
140
160
180
200
Jan Feb Mar Apr May Jun Jul Aug Sep Oct Nov Dec
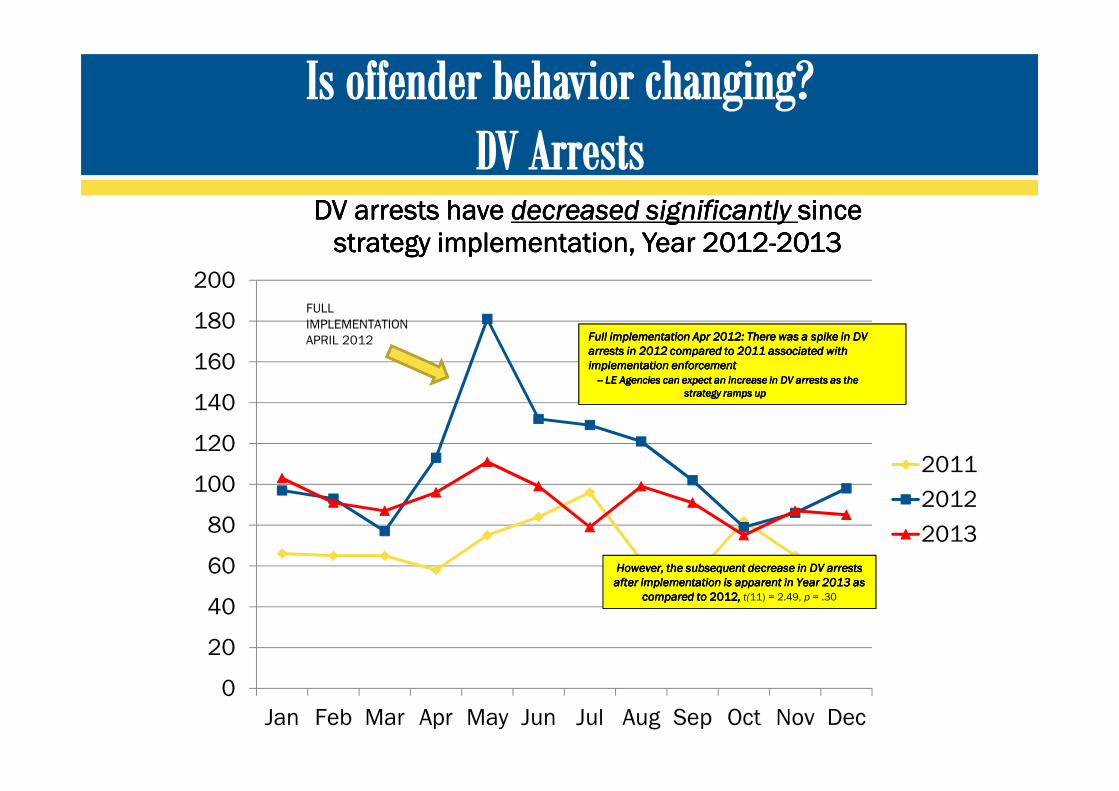
DV arrests have DV arrests have DV arrests have DV arrests have decreased significantly decreased significantly decreased significantly decreased significantly since since since since strategy implementation, Year 2012strategy implementation, Year 2012strategy implementation, Year 2012strategy implementation, Year 2012----2013201320132013
2011
2012
2013
FULL
IMPLEMENTATION
APRIL 2012 Full implementation Apr 2012: There was a spike in DV Full implementation Apr 2012: There was a spike in DV Full implementation Apr 2012: There was a spike in DV Full implementation Apr 2012: There was a spike in DV
arrests in 2012 compared to 2011 associated with arrests in 2012 compared to 2011 associated with arrests in 2012 compared to 2011 associated with arrests in 2012 compared to 2011 associated with
implementation enforcementimplementation enforcementimplementation enforcementimplementation enforcement
-------- LE Agencies can expect an increase in DV arrests as the LE Agencies can expect an increase in DV arrests as the LE Agencies can expect an increase in DV arrests as the LE Agencies can expect an increase in DV arrests as the
strategy ramps upstrategy ramps upstrategy ramps upstrategy ramps up
However, the subsequent decrease in DV arrests However, the subsequent decrease in DV arrests However, the subsequent decrease in DV arrests However, the subsequent decrease in DV arrests
after implementation is apparent in Year 2013 as after implementation is apparent in Year 2013 as after implementation is apparent in Year 2013 as after implementation is apparent in Year 2013 as
compared to compared to compared to compared to 2012201220122012, , , , t(11) = 2.49, p = .30

Results to date for Year 2014 show a continued decrease Results to date for Year 2014 show a continued decrease Results to date for Year 2014 show a continued decrease Results to date for Year 2014 show a continued decrease
in DV arrests as compared to previous years .in DV arrests as compared to previous years .in DV arrests as compared to previous years .in DV arrests as compared to previous years .
There has been an average of There has been an average of There has been an average of There has been an average of 83.5 arrests per month YTD 83.5 arrests per month YTD 83.5 arrests per month YTD 83.5 arrests per month YTD
in 2014in 2014in 2014in 2014 as compared to the same timeframe (Janas compared to the same timeframe (Janas compared to the same timeframe (Janas compared to the same timeframe (Jan----Apr) of Apr) of Apr) of Apr) of
2012 (m = 95) and 2013 (m = 94.25)2012 (m = 95) and 2013 (m = 94.25)2012 (m = 95) and 2013 (m = 94.25)2012 (m = 95) and 2013 (m = 94.25)
0
20
40
60
80
100
120
140
160
180
200
Jan Feb Mar Apr May Jun Jul Aug Sep Oct Nov Dec
DV arrests have continued to DV arrests have continued to DV arrests have continued to DV arrests have continued to decreasedecreasedecreasedecrease into into into into Year 2014Year 2014Year 2014Year 2014
2012
2013
2014
0
5
10
15
20
25
30
35
40
45
50
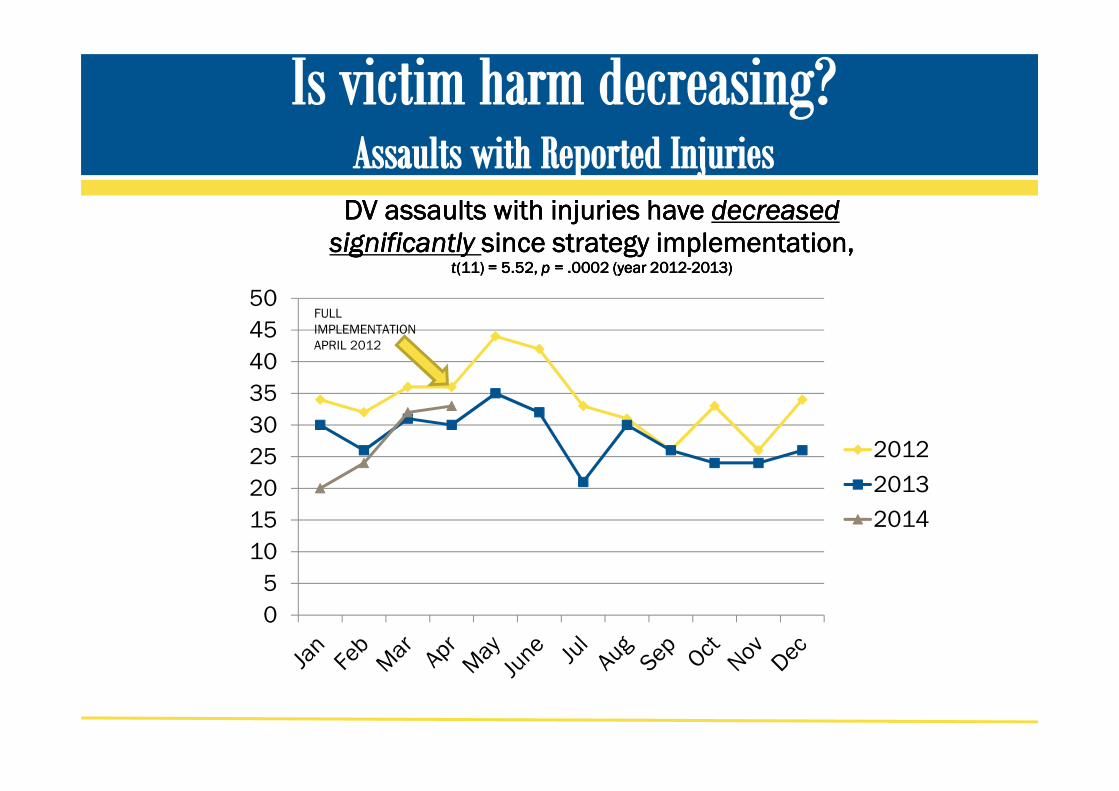
DV assaults with injuries have DV assaults with injuries have DV assaults with injuries have DV assaults with injuries have decreased decreased decreased decreased significantly significantly significantly significantly since strategy implementation, since strategy implementation, since strategy implementation, since strategy implementation,
tttt(11) = 5.52, (11) = 5.52, (11) = 5.52, (11) = 5.52, p = p = p = p = .0002 (year 2012.0002 (year 2012.0002 (year 2012.0002 (year 2012----2013)2013)2013)2013)
2012
2013
2014
FULL
IMPLEMENTATION
APRIL 2012
0
200
400
600
800
1000
1200
1400
2011 2012 2013
To
tal #
of
arr
ests
re
pre
se
nte
dTo
tal #
of
arr
ests
re
pre
se
nte
dTo
tal #
of
arr
ests
re
pre
se
nte
dTo
tal #
of
arr
ests
re
pre
se
nte
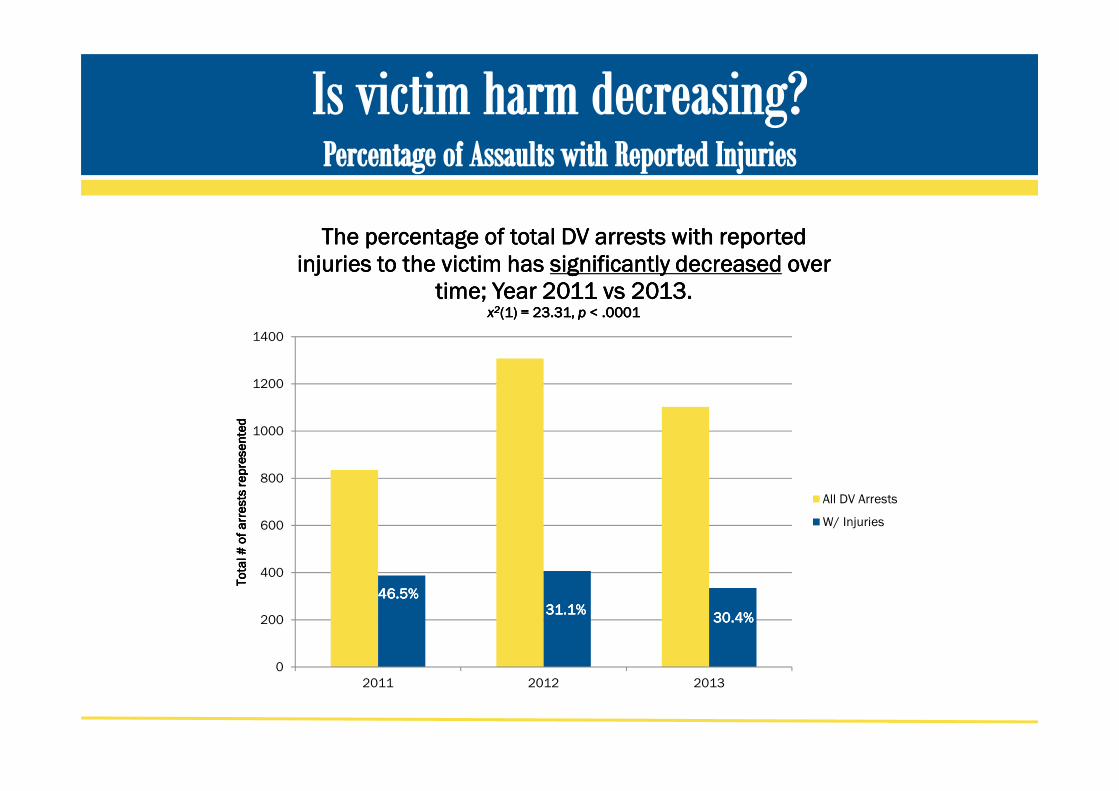
dThe percentage of total DV arrests The percentage of total DV arrests The percentage of total DV arrests The percentage of total DV arrests with reported with reported with reported with reported
injuries to the victim has injuries to the victim has injuries to the victim has injuries to the victim has significantly significantly significantly significantly decreaseddecreaseddecreaseddecreased over over over over time; Year 2011 time; Year 2011 time; Year 2011 time; Year 2011 vsvsvsvs 2013.2013.2013.2013.
xxxx2222(1) = 23.31, (1) = 23.31, (1) = 23.31, (1) = 23.31, pppp < .0001< .0001< .0001< .0001
All DV Arrests
W/ Injuries
46.5%46.5%46.5%46.5%31.1%31.1%31.1%31.1%
30.4%30.4%30.4%30.4%
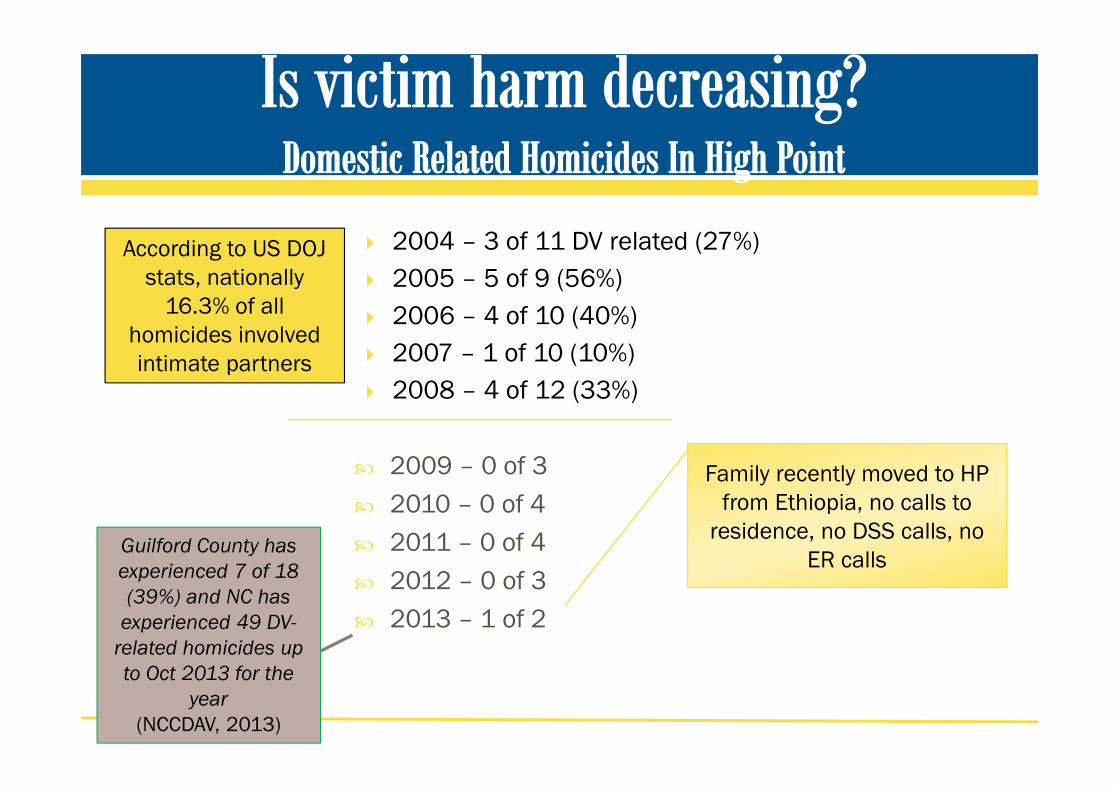
� 2009 – 0 of 3
� 2010 – 0 of 4
� 2011 – 0 of 4
� 2012 – 0 of 3
� 2013 – 1 of 2
� 2004 – 3 of 11 DV related (27%)
� 2005 – 5 of 9 (56%)
� 2006 – 4 of 10 (40%)
� 2007 – 1 of 10 (10%)
� 2008 – 4 of 12 (33%)
Family recently moved to HP
from Ethiopia, no calls to
residence, no DSS calls, no
ER calls
According to US DOJ
stats, nationally
16.3% of all
homicides involved
intimate partners
Guilford County has
experienced 7 of 18
(39%) and NC has
experienced 49 DV-
related homicides up
to Oct 2013 for the
year
(NCCDAV, 2013)
0
50
100
150
200
250
Jan Feb Mar Apr May June Jul Aug Sep Oct Nov Dec
# o
f D
VIP
ca
lls f
or
se
rvic
e#
of
DV
IP c
alls f
or
se
rvic
e#
of
DV
IP c
alls f
or
se
rvic
e#
of
DV
IP c
alls f
or
se
rvic
e
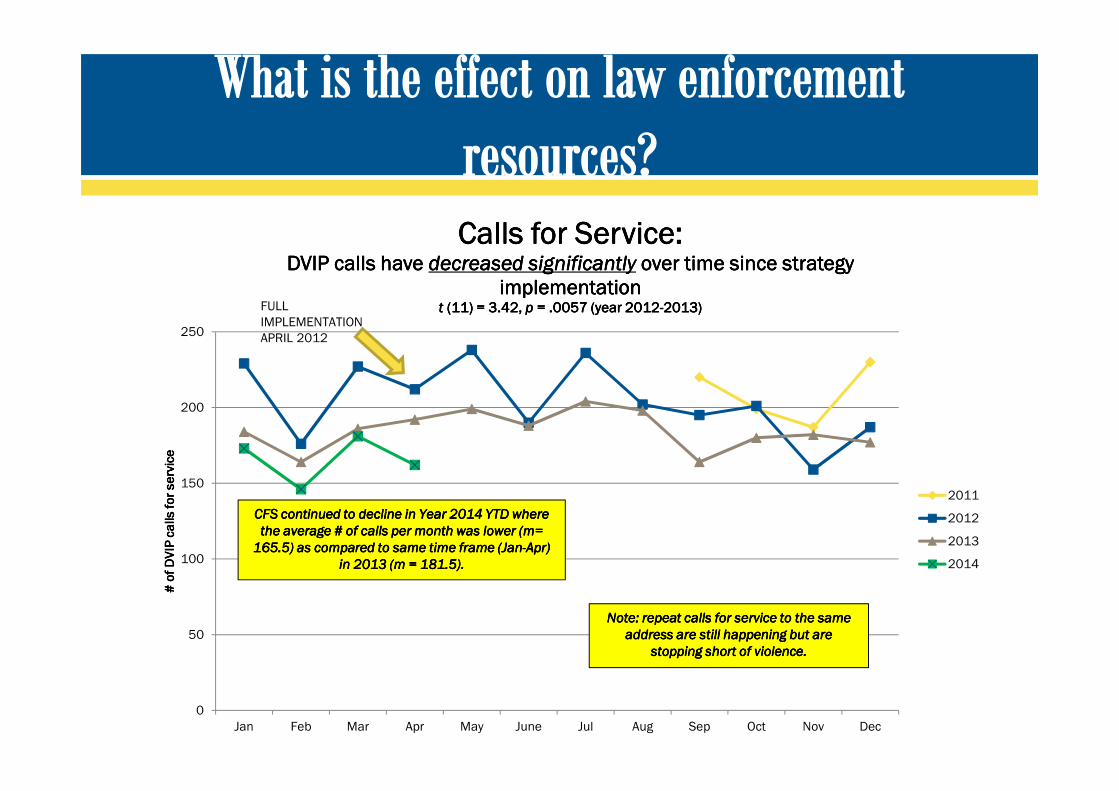
Calls for Service: Calls for Service: Calls for Service: Calls for Service: DVIP calls have DVIP calls have DVIP calls have DVIP calls have decreased significantlydecreased significantlydecreased significantlydecreased significantly over time since strategy over time since strategy over time since strategy over time since strategy
implementationimplementationimplementationimplementationt t t t (11) = 3.42, (11) = 3.42, (11) = 3.42, (11) = 3.42, pppp = .0057 (year 2012= .0057 (year 2012= .0057 (year 2012= .0057 (year 2012----2013)2013)2013)2013)
2011
2012
2013
2014
FULL
IMPLEMENTATION
APRIL 2012
CFS continued to decline in Year 2014 YTD where CFS continued to decline in Year 2014 YTD where CFS continued to decline in Year 2014 YTD where CFS continued to decline in Year 2014 YTD where
the average # of calls per month was lower (m= the average # of calls per month was lower (m= the average # of calls per month was lower (m= the average # of calls per month was lower (m=
165.5) as compared to same time frame (Jan165.5) as compared to same time frame (Jan165.5) as compared to same time frame (Jan165.5) as compared to same time frame (Jan----Apr) Apr) Apr) Apr)
in 2013 (m = 181.5).in 2013 (m = 181.5).in 2013 (m = 181.5).in 2013 (m = 181.5).
Note: repeat calls for service to the same Note: repeat calls for service to the same Note: repeat calls for service to the same Note: repeat calls for service to the same
address are still happening but are address are still happening but are address are still happening but are address are still happening but are
stopping short of violence.stopping short of violence.stopping short of violence.stopping short of violence.
0
50
100
150
200
250
Sep-Dec Jan-Apr
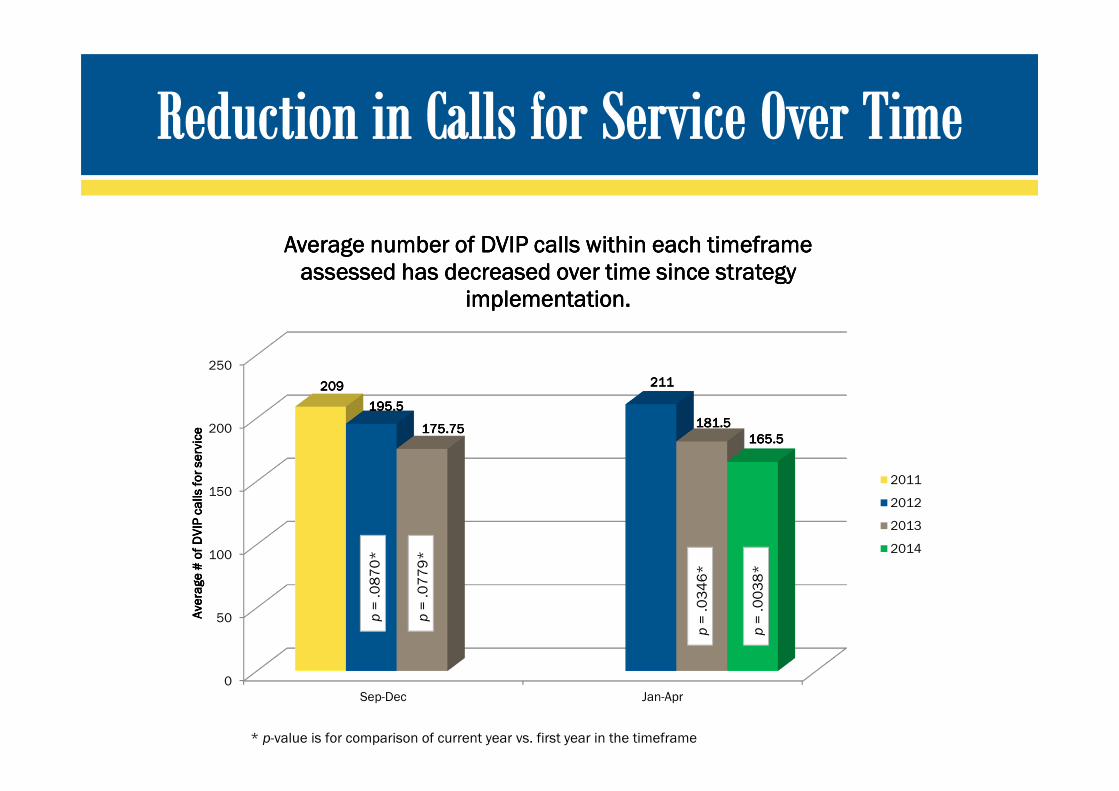
209209209209
195.5195.5195.5195.5
211211211211
175.75175.75175.75175.75 181.5181.5181.5181.5
165.5165.5165.5165.5
Ave
rage
# o
f D
VIP
ca
lls f
or
se
rvic
eA
vera
ge
# o
f D
VIP
ca
lls f
or
se
rvic
eA
vera
ge
# o
f D
VIP
ca
lls f
or
se
rvic
eA
vera
ge
# o
f D
VIP
ca
lls f
or
se
rvic
e
Average number of DVIP calls within each timeframe Average number of DVIP calls within each timeframe Average number of DVIP calls within each timeframe Average number of DVIP calls within each timeframe assessed has decreased over time since strategy assessed has decreased over time since strategy assessed has decreased over time since strategy assessed has decreased over time since strategy
implementation. implementation. implementation. implementation.
2011
2012
2013
2014
p=
.0
03
8*
p=
.0
87
0*
p=
.0
77
9*
p=
.0
34
6*
* p-value is for comparison of current year vs. first year in the timeframe
0
200
400
600
800
1000
1200
1400
First time Repeat No arrest Arrest
Calls for service Outcome of repeatcall
2012
2013
0%
10%
20%
30%
40%
50%
60%
70%
80%
90%
First time Repeat No arrest Arrest
Calls for service Outcome of repeat call
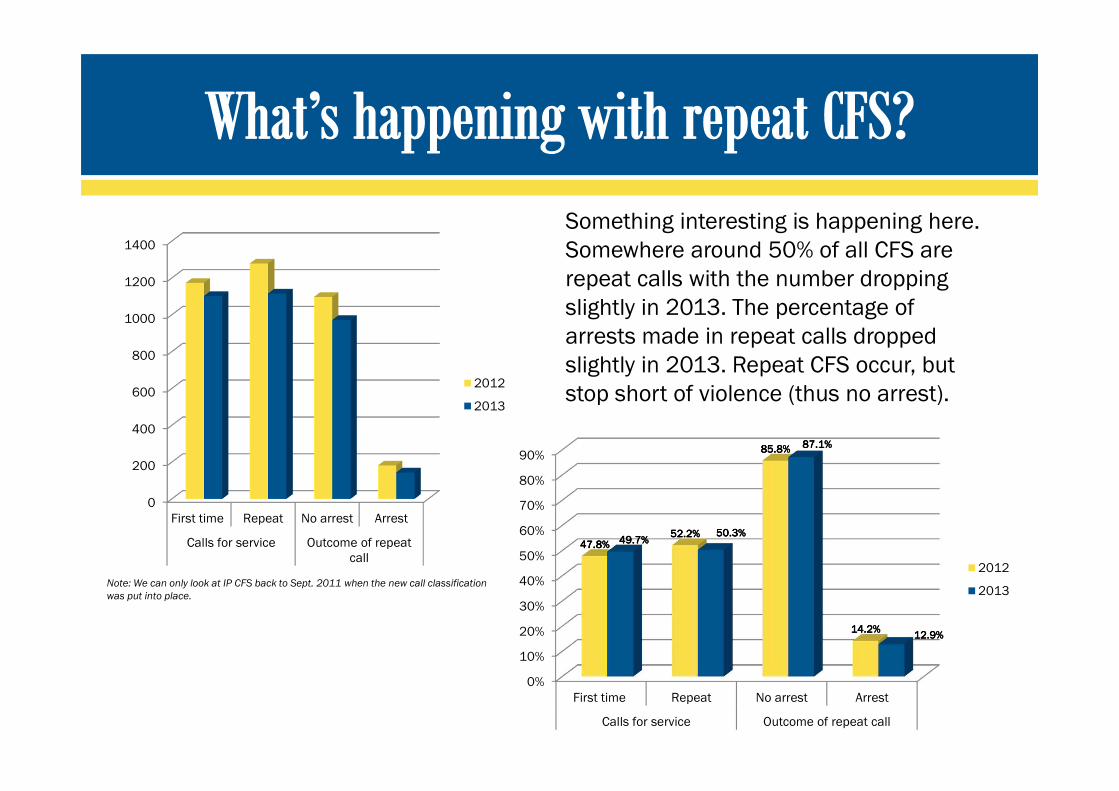
47.8%47.8%47.8%47.8%52.2%52.2%52.2%52.2%
85.8%85.8%85.8%85.8%
14.2%14.2%14.2%14.2%
49.7%49.7%49.7%49.7%50.3%50.3%50.3%50.3%
87.1%87.1%87.1%87.1%
12.9%12.9%12.9%12.9%
2012
2013
Something interesting is happening here.
Somewhere around 50% of all CFS are
repeat calls with the number dropping
slightly in 2013. The percentage of
arrests made in repeat calls dropped
slightly in 2013. Repeat CFS occur, but
stop short of violence (thus no arrest).
Note: We can only look at IP CFS back to Sept. 2011 when the new call classification
was put into place.
� Domestic violence offender behavior can be changed by…
o Stripping their anonymity and putting them on notice
o Creating swift, certain, and predictable consequences for offending
o Allowing them to make a rational choice as to whether to reoffend
o All without any additional harm to victims
� Changing offender behavior will decrease victim injuries &
deaths and increase victim use of services
� Leading to a huge savings in terms of less reliance on…
o Law enforcement resources
o Traditional responses to DV offenders (incarceration, treatment programs,
anger management, etc.)

��
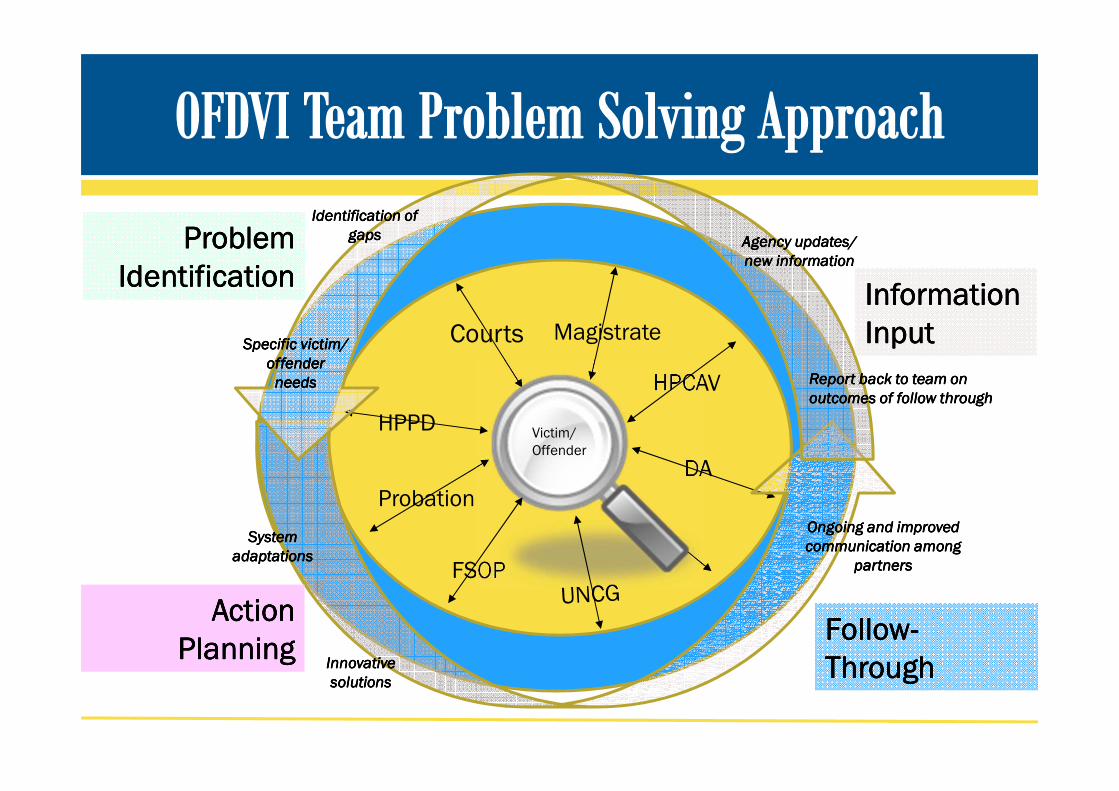
V/OHPPD
FSOP
HPCAV
DA
Probation
MagistrateCourts
Victim/
Offender
System System System System
adaptationsadaptationsadaptationsadaptations
Innovative Innovative Innovative Innovative
solutionssolutionssolutionssolutions
Identification of Identification of Identification of Identification of
gapsgapsgapsgaps Agency updates/Agency updates/Agency updates/Agency updates/
new informationnew informationnew informationnew information
Action Action Action Action
PlanningPlanningPlanningPlanning
Report back to team on Report back to team on Report back to team on Report back to team on
outcomes of follow throughoutcomes of follow throughoutcomes of follow throughoutcomes of follow through
Information Information Information Information
InputInputInputInput
ProblemProblemProblemProblem
IdentificationIdentificationIdentificationIdentification
Specific victim/Specific victim/Specific victim/Specific victim/
offenderoffenderoffenderoffender
needsneedsneedsneeds
FollowFollowFollowFollow----
ThroughThroughThroughThrough
OOOOngoing and improved ngoing and improved ngoing and improved ngoing and improved
communication among communication among communication among communication among
partnerspartnerspartnerspartners
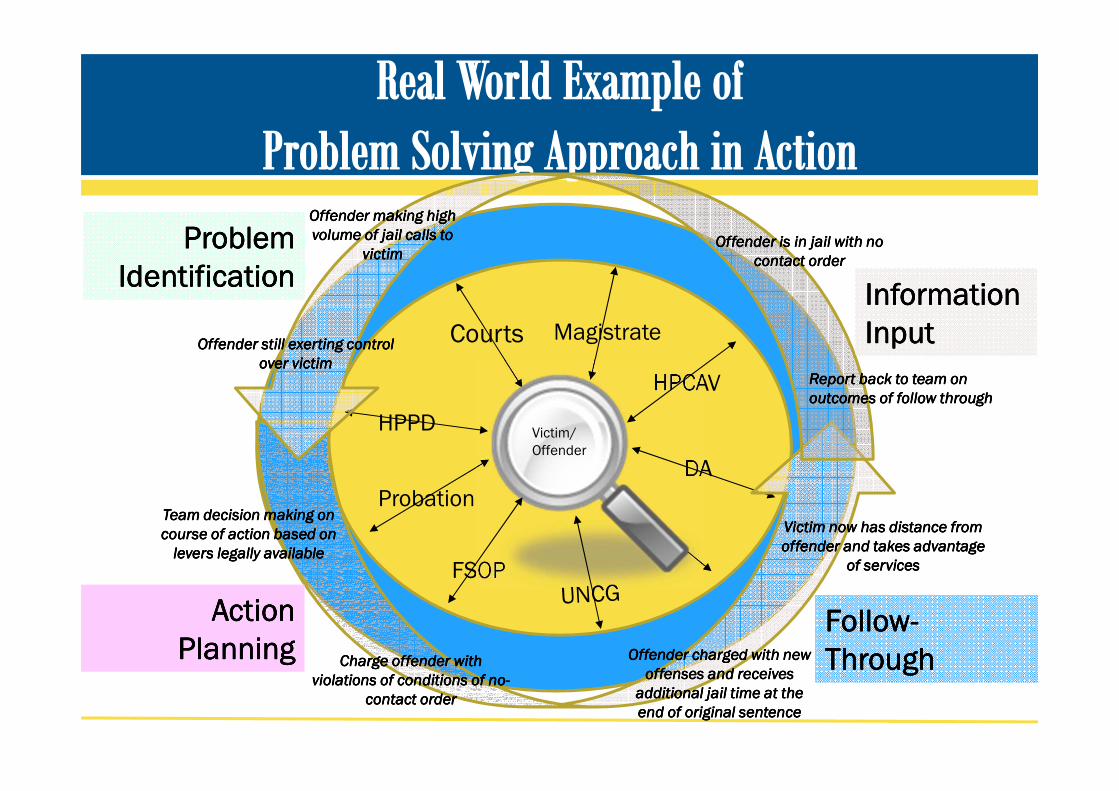
V/OHPPD
FSOP
HPCAV
DA
Probation
MagistrateCourts
Victim/
Offender
Team decision making on Team decision making on Team decision making on Team decision making on
course of action based on course of action based on course of action based on course of action based on
levers legally availablelevers legally availablelevers legally availablelevers legally available
Charge offender with Charge offender with Charge offender with Charge offender with
violations of conditions of noviolations of conditions of noviolations of conditions of noviolations of conditions of no----
contact ordercontact ordercontact ordercontact order
Offender making high Offender making high Offender making high Offender making high
volume of jail calls to volume of jail calls to volume of jail calls to volume of jail calls to
victimvictimvictimvictimOffender is in jail with no Offender is in jail with no Offender is in jail with no Offender is in jail with no
contact ordercontact ordercontact ordercontact order
Action Action Action Action
PlanningPlanningPlanningPlanning
Report back to team on Report back to team on Report back to team on Report back to team on
outcomes of follow throughoutcomes of follow throughoutcomes of follow throughoutcomes of follow through
Information Information Information Information
InputInputInputInput
ProblemProblemProblemProblem
IdentificationIdentificationIdentificationIdentification
Offender still exerting control Offender still exerting control Offender still exerting control Offender still exerting control
over victimover victimover victimover victim
FollowFollowFollowFollow----
ThroughThroughThroughThrough
Victim now has distance from Victim now has distance from Victim now has distance from Victim now has distance from
offender and takes advantage offender and takes advantage offender and takes advantage offender and takes advantage
of servicesof servicesof servicesof services
Offender charged with new Offender charged with new Offender charged with new Offender charged with new
offenses and receives offenses and receives offenses and receives offenses and receives
additional jail time at the additional jail time at the additional jail time at the additional jail time at the
end of original sentenceend of original sentenceend of original sentenceend of original sentence
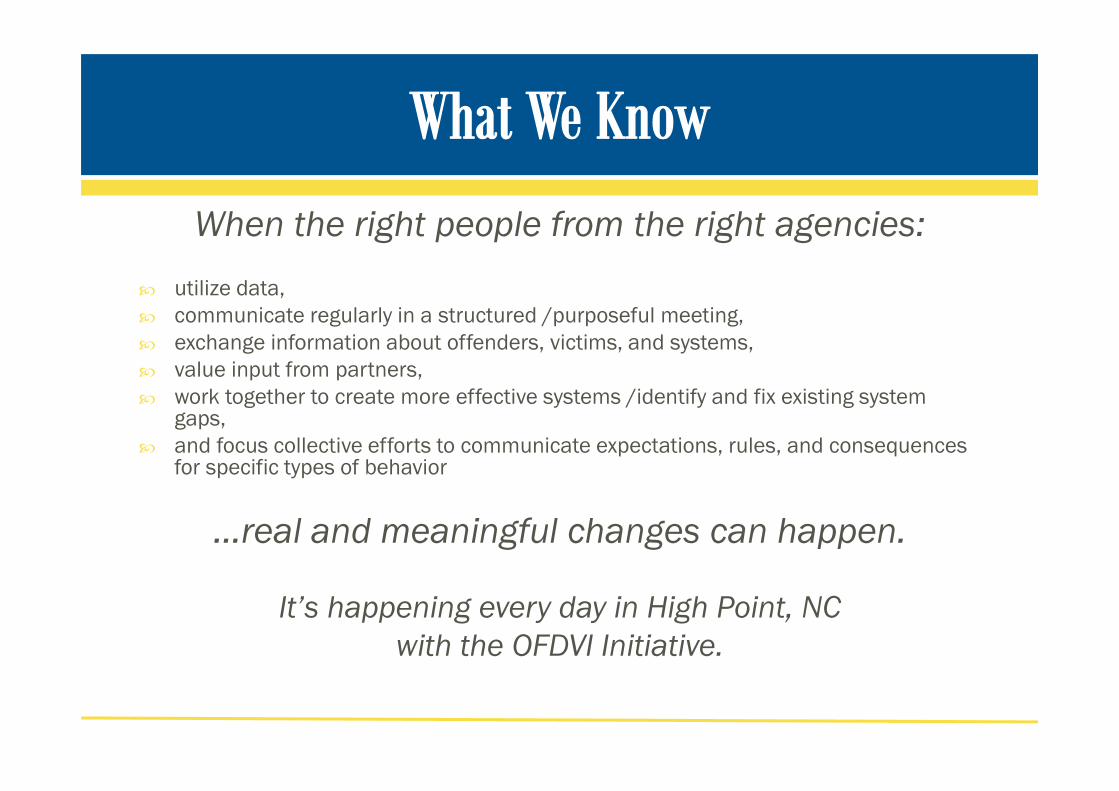
When the right people from the right agencies:
� utilize data,
� communicate regularly in a structured /purposeful meeting,
� exchange information about offenders, victims, and systems,
� value input from partners,
� work together to create more effective systems /identify and fix existing system gaps,
� and focus collective efforts to communicate expectations, rules, and consequences for specific types of behavior
…real and meaningful changes can happen.
It’s happening every day in High Point, NC
with the OFDVI Initiative.
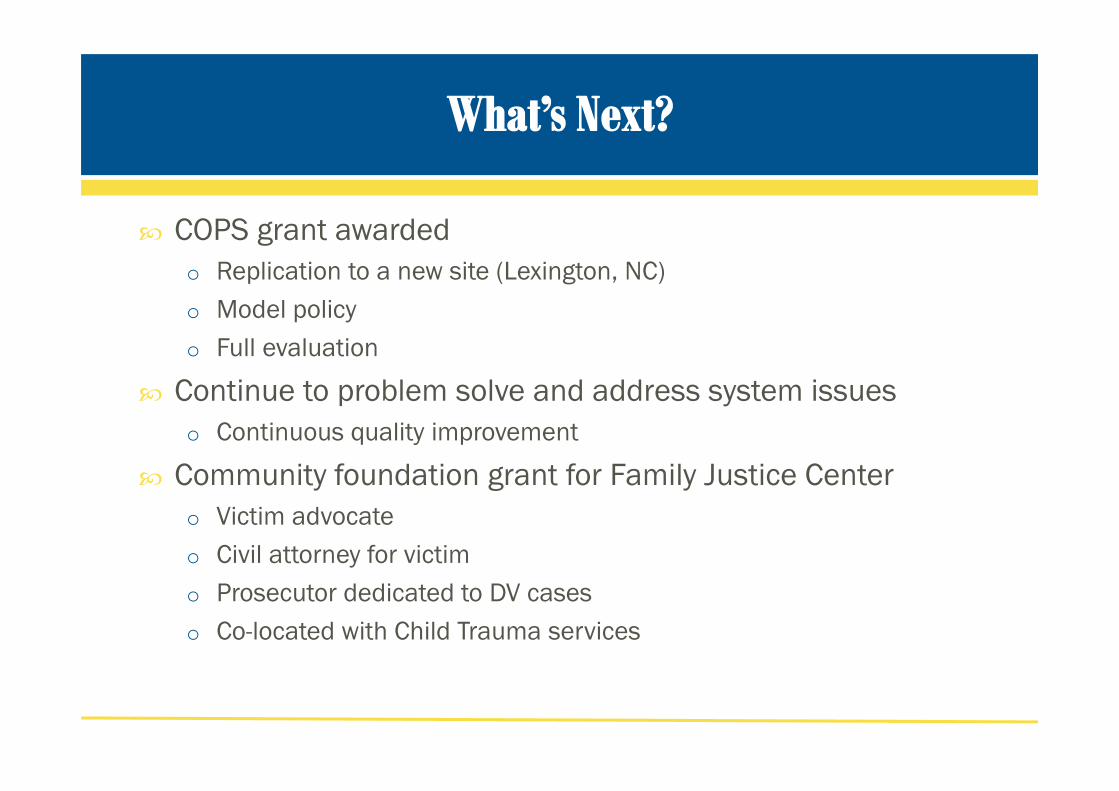
� COPS grant awarded
o Replication to a new site (Lexington, NC)
o Model policy
o Full evaluation
� Continue to problem solve and address system issues
o Continuous quality improvement
� Community foundation grant for Family Justice Center
o Victim advocate
o Civil attorney for victim
o Prosecutor dedicated to DV cases
o Co-located with Child Trauma services