dr emma vaux march 2012
TRANSCRIPT

PDSA: Plan Do Study Act
Dr Emma Vaux
March 2012

Quality Improvement
“Health Care Quality Improvement is a broad range of activities of varying degrees of complexity and methodological and statistical rigor through which health care providers develop, implement and assess small-scale interventions and identify those that work well and implement them more broadly in order to improve clinical practice.”
Mary Ann Bailey, The Hastings Center
Improving quality is about making healthcare
more safe, effective, patient centred, timely, efficient and equitable.
The Health Foundation
Improving quality is about making healthcare
more safe, effective, patient centred, timely, efficient and equitable.
The Health Foundation

The Improvement Guide, API, 2009.
A MODEL FOR LEARNING AND CHANGE
When you combine
the 3 questions with the…
…the Model
for Improvement.
PDSA cycle,
you get…

PLAN
DO
ACT
STUDY
PDSA Cycle(Source: Quality Improvement Tools & Techniques)
This template designed to help instruct, construct and present an improvement project
� Set goals based
on service/patient
needs
� Implement
� Analyse what
happened
� Make sure
improvement is
permanent
PLAN
DO
STUDY
ACT

D S A
What conditions indicated the need for
the project?
� ‘The way it is is in the way’
� So what conditions precipitate the project?
� Who or what areas are affected?
� Who decides to do something about it?
PDSA Cycle
OverviewP

PLAN
What is the Aim Statement?
� Answers ‘What are you trying to achieve?’
� Increase/decrease something?
� Is it SMART: Single-focused, measurable,
action-oriented, realistic, and timely?
PDSA Cycle
OverviewD S A

What is the Problem?
� Characterise the problem
� What causes are explored?
PDSA Cycle
OverviewPLAN D S A

How do you know it is a problem?
� How will I measure the baseline?
� What analysis and data indicated which
cause(s) were the problem?
PDSA Cycle
OverviewPLAN D S A

So, what is the Solution?
� Does it cover short and long term term?
� Does it consider up and downstream?
PDSA Cycle
OverviewPLAN D S A

What is the plan for successful
implementation?
� Who, what, why, when?
PDCA Cycle
OverviewPLAN D S A

What is the plan for successful
implementation?
– How will I set a target?
– How and when will I measure my progress?
PDSA Cycle
OverviewPLAN D S A

What is the plan for successful
implementation?
– Predictions : What do you expect to see and
why?
– What consequences may there be?
– Could the change make something worse?
PDSA Cycle
OverviewD S APLAN

How did the implementation proceed?
– Carry out the change or test and record what
happened
– Use a run chart to record the pattern of data
– Document problems and unexpected
observations
– Begin analysis of data
PDSA Cycle
OverviewP DO S A

STUDYP A
What was the Post-Measure?
� During and after implementation, find out what
happened.
� Was the actual outcome close to the planned
target?
� Did something not work out as planned?
� What were lessons learned that might help
out in the future projects?
PDSA Cycle
OverviewD

ACTP S
What measures and procedures are in
place to assure the solution remains
effective?
PDSA Cycle
OverviewD
•What modifications are needed?
•Are we ready to make another change?
•Outline plan for the next cycle
•Keep refining the change until it is ready for
broader implementation and embed in every
day practice

QI – need for iterative testing


Use of run charts to track changes
Perla R. BMJ Qual Saf 2011; 20: 46-51
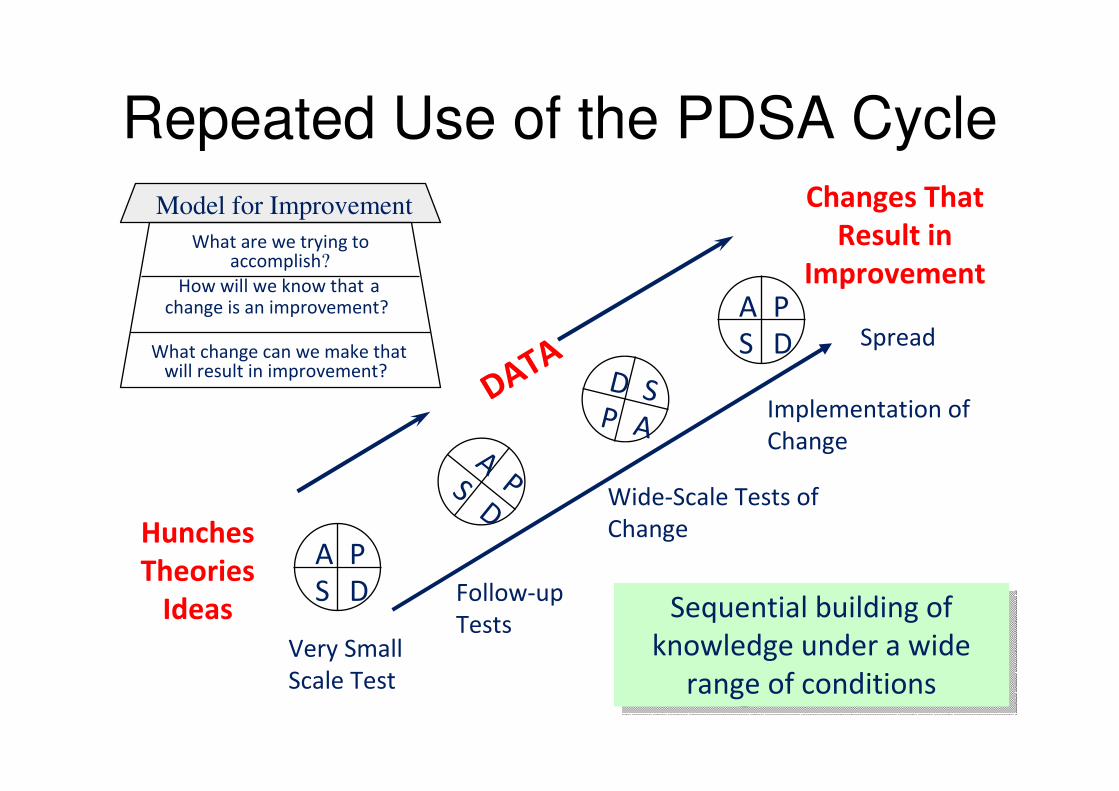
Repeated Use of the PDSA Cycle
Hunches
Theories
Ideas
Changes That
Result in
Improvement
A P
S D
APS
D
A P
S D
D SP A
DATA
Very Small
Scale Test
Follow-up
Tests
Wide-Scale Tests of
Change
Implementation of
Change
What are we trying toaccomplish?
How will we know that achange is an improvement?
What change can we make thatwill result in improvement?
Model for Improvement
Spread
Sequential building of
knowledge under a wide
range of conditions
Sequential building of
knowledge under a wide
range of conditions

A worked example


Measurement?
28

‘30 degrees prevents the wheeze’
Is Hospital Acquired
Pneumonia inevitable?

Hospital Acquired Pneumonia
Respiratory infection that occurs over 48 hours after admission to hospital
Affects 0.5% to 1.0% of inpatients
Identified as the most common healthcare-associated infection contributing to death
Estimated to increase hospital stay by 7–9 days
Gross P, Neu H, Aswapokee P et al (1980) American Journal of Medicine,68:219–23.
Masterton R. et al ( 2008) Journal of Antimicrobial Chemotherapy, 62, 5–34

The Model for Improvement
1. Implement interventions from Saving Lives 2006 ventilator associated care bundle relevant to HAP2. Use QI methodology at the frontline to make a visible change
What change can we make that will result in an improvement?
1. Incidence of HAP has been reduced on these wards2. Embed new skills in QI methodology and demonstrate learning and development
How do we know a change is an improvement?
1. Reduce the incidence of HAP by 50% over a six month period in 8 adult wards2. Engage junior doctors, nurses and AHPs in quality improvement methodology
What are we trying to accomplish?

PDSA CYCLE 1: The size of the
problem
IMPLEMENT PROCESS FOR
FIRST CHANGE
ACT
8 weeks – 97 patients with
diagnosis HAP
Average 12 /week on 8 wards
STUDY
Weekly case note review 8 wardsDO
Baseline measurement on 8 wardsPLAN
weeks

PDSA CYCLE 2
IMPLEMENT FIRST CHANGE
ACT
Feedback – verbal and written
STUDY
Written information
Face to face
Patient information
DO
Engagement of all staff on 8 pilot wards
Engagement of patients
PLAN
Bed head at 30 degrees

PDSA CYCLE 3
Intervention 1: Bed head at 30
degrees
Learning
•Gimmick spreads the word
•Beds move!
•Face to face approach makes all
the difference in sustaining an
approach
•Nurses embraced approach most
readily
Learning
•Gimmick spreads the word
•Beds move!
•Face to face approach makes all
the difference in sustaining an
approach
•Nurses embraced approach most
readily

PDSA cycle 3
Intervention 1: Balancing Measures
Pressure Ulcers
No increase in pressure ulcers in 8
pilot wards
0.005% (45/8508) = number of
exceptions documented

0
2
4
6
8
10
12
14
16
18
1 2 3 4 5 6 7 8 9 10 11 12 13 14 15 16 17
Nu
mb
er
of
pati
en
ts w
ith
HA
PBed heads raised to 30
degrees at week 9
(17Dec)
HAP on 8 wards
Runchart

PDSA Cycle 4: Intervention 2: Improve oral hygiene
0.2 % Chlorhexidine mouthwash after cleaning teeth twice daily
Single ward
Learning
- Drug chart – ease of administration, audit - Junior doctor engagement in prescribing- Roll out – care of elderly – dementia patients
Learning
- Drug chart – ease of administration, audit - Junior doctor engagement in prescribing- Roll out – care of elderly – dementia patients

HAP on 8 wards
0
2
4
6
8
10
12
14
16
18
1 2 3 4 5 6 7 8 9 10 11 12 13 14 15 16 17 18 19 20 21 22 23 24 25 26 27 28 29 30 31 32 33 34 35 36 37 38 39 40
Week
Nu
mb
er
of
pati
en
ts w
ith
HA
P
Total on 8 wards Mean
Bed heads raised to 30
degrees at week 9
(17Dec)
Oral hygiene measures
Victoria Ward week 25 (8Apr)
Oral hygiene measures
across 8 wards week 29
(6May)
PDSA cycle 5: Roll out to pilot
wards

Trust roll outPDSA cycle 6

PDSA cycle 7
Evidence base
versus QI
methodology
Learning
Different knowledge base
Symbiosis of approach
PDSA as a bridging strategy between action and caution
Learning
Different knowledge base
Symbiosis of approach
PDSA as a bridging strategy between action and caution

Two patients limp into two different medical clinics with the same complaint. Both have trouble walking and appear to require a hipreplacement. The first patient is examined within the hour, is x-rayed the same day and has a time booked for surgery the following week.
The second sees his family doctor after waiting a week for an appointment, then waits eighteen weeks to see a specialist, then gets an X-ray, which isn't reviewed for another month and finally has his surgery scheduled for a year from then.
Why the different treatment for the two patients?
The first is a Golden Retriever. The second is a Senior Citizen.

Takes an average of 17 years for research findings to be adopted into clinical practice
health care lacks an information infrastructure that connects the research establishment to the front line of health care delivery
Practical information about the challenges of implementation and considerations regarding start up and sustainability are usually absent.
Balas EA, Boren SA. Managing clinical knowledge for health care improvement. Yrbk of Med Informatics 2000; 65-70

Parachute use to prevent death and major trauma related to gravitational challenge: systematic review of randomised controlled
trialsGordon C S Smith, Jill P Pell. BMJ 2003;327;1459-1461
• Aim: To determine whether
parachutes are effective in preventing major trauma related to
gravitational challenge.
• Design: Systematic review of
randomised controlled trials
• Results: Our search strategy did
not find any randomised controlled
trials of the parachute.

Gordon C S Smith, Jill P Pell. BMJ 2003;327;1459-1461
Conclusion:
• As with many interventions intended to prevent ill health, the effectiveness of parachutes has not been subjected to rigorous evaluation by using randomised controlled trials.
• Advocates of evidence based medicine have criticised the adoption of interventions evaluated by using only observational data.
• We think that everyone might benefit if the most radical protagonists of evidence based medicine organised and participated in a double blind, randomised, placebo controlled, crossover trial of the parachute

PDSA cycle 8: Roll out Trust
wide 12th August 2011
Learning
Gimmicks to get started
Ongoing monitoring
Stickers on drug charts
Challenge of measurement
Learning
Gimmicks to get started
Ongoing monitoring
Stickers on drug charts
Challenge of measurement
HAP on 8 wards
0
2
4
6
8
10
12
14
16
18
1 2 3 4 5 6 7 8 9 10 11 12 13 14 15 16 17 18 19 20 21 22 23 24 25 26 27 28 29 30 31 32 33 34 35 36 37 38 39 40 41 42 43 44 45 46 47 48 49 50
Week
Nu
mb
er
of
pati
en
ts w
ith
HA
P
Total on 8 wards Mean
Bed heads raised to 30
degrees at week 9 (17Dec) Oral hygiene
measures Victoria
Ward week 25 (8Apr) Oral hygiene
measures across 8
wards week 29
(6May)
Trust w ide roll out
w eek 43 (12 Aug)

Cost savings
1. Financial cost
2. Human cost

We have achieved our aim and
made a real difference!

We have made a real
difference!“It is tremendously rewarding
to see that you have contributed to a project that has actually made our hospital a safer place for our patients”
“It gives an opportunity to get experience in how you implement change”
“It has let me see QI from a different perspective and as a clinician I am going to be more receptive to changes”

LEARNING TO MAKE A DIFFERENCE PILOT PROJECT
ANXIETY AND DEPRESSION IN ACUTE
STROKE PATIENTS
Dr Olivia Walker ST2
THE OBJECTIVE
• To develop a local protocol that can be used to screen all acute stroke patients for anxiety and depression.

PROJECT AIM (1)
• 100% of stroke patients should have a Signs of Depression Scale (SDSS) completed within 5 days of admission.
• 100% of patients will have a repeat SDSS completed in the MDT after 2-3 weeks.

PROJECT AIM (2)
• If anxiety/depression is suggested using the SDSS 100% of patients should then have an appropriate anxiety and depression score documented in the notes.

PROJECT AIM (3)
• 100% of patient’s identified with anxiety and/or depression will be referred to the neuropsychologist.

CHANGE 1
• The identification of an appropriate anxiety and depression tool which can be implemented in
the RBH acute stroke unit.
• Discussion with the neuropsychologist identified 2 suitable assessments:
– Hospital Anxiety and Depression Scale
(HADS)
– Numeric Graphic Rating Scale (NGRS)

• Base line - Initial review of 20 stroke patient’s notes on the unit, in one particular day, using my pro forma.
• Assessing each patient using either the HADS or the NGRS in the stroke unit on one particular day.
• Need specific guidelines/flow chart to identify which scale to use.
• Completing the scales is time consuming, therefore a briefer assessment initially would be useful.
• Need additional scale for patients with aphasia/dysphasia.
• Patients with cognitive impairment need assistance with completing a scale.
• What I Tested • Outcomes

CHANGE 2
� The identification of additional scales
– The Signs of Depression Scale
– HADS
– NGRS or the DISCs Scale
– The Stroke Aphasic Depression Questionnaire
�The development of a flow chart

• I reviewed the notes of
20 patients on the acute stroke unit 1
month after the implementation of the
flow chart.
• All stroke patients
should have an SDSS documented in the
notes by the OT’s, within 5 days of
admission to the acute stroke unit.
• Poor completion of the SDSS within 5 days of admission.
• Barriers identified following discussion with OT’s -
– Not part of their routine assessments and therefore can be forgotten.
– Having the SDSS printed on white paper doesn’t highlight it resulting in it often being overlooked.
• What I tested • Outcomes

CHANGE 3
• The SDSS is included in the initial patient assessment by the OT’s.
• The SDSS is printed on yellow paper.
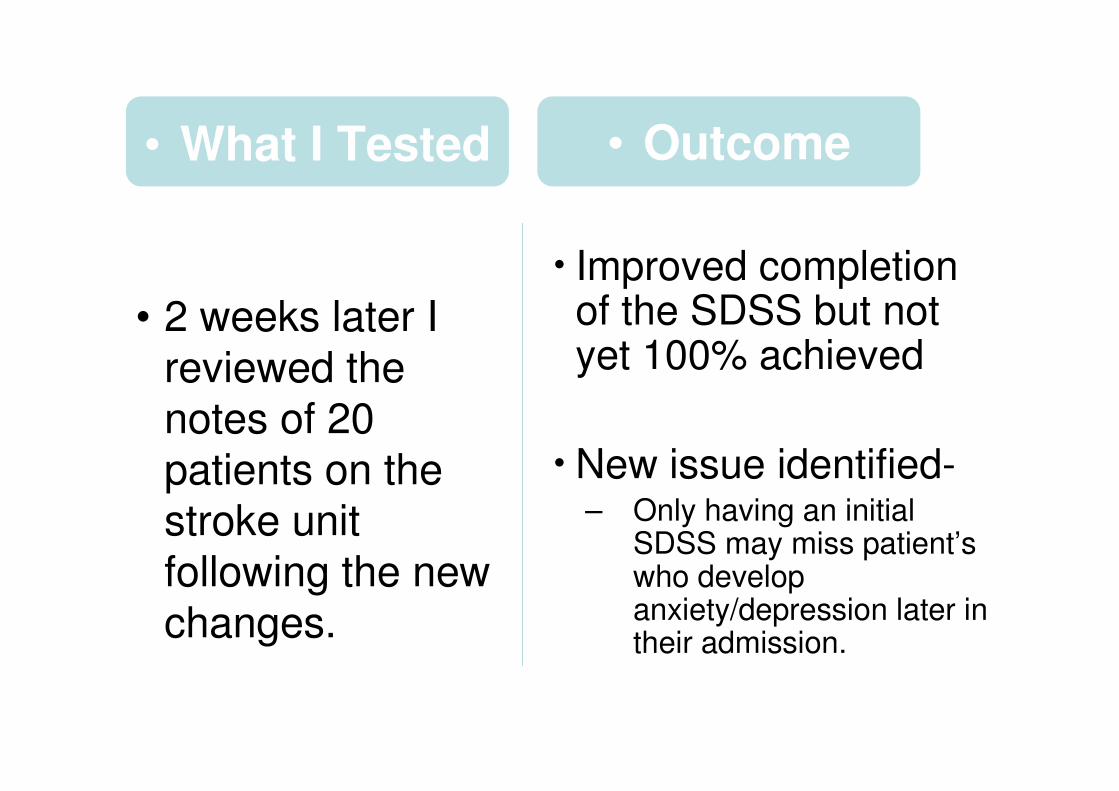
• 2 weeks later I reviewed the notes of 20 patients on the stroke unit following the new changes.
• Improved completion of the SDSS but not yet 100% achieved
•New issue identified-– Only having an initial
SDSS may miss patient’s who develop anxiety/depression later in their admission.
• What I Tested • Outcome
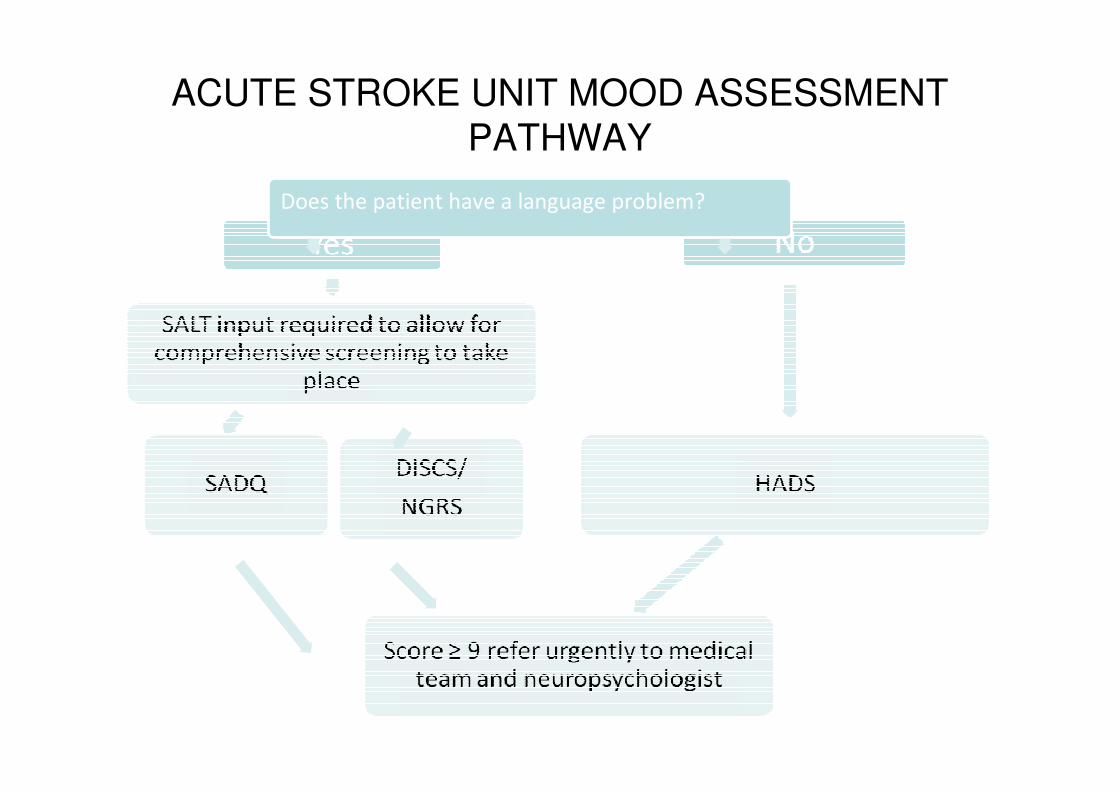
ACUTE STROKE UNIT MOOD ASSESSMENT
PATHWAY
Does the patient have a language problem?

A RUN CHART TO DEMONSTRATE THE CHANGE OVER TIME SINCE THE INTRODUCTION OF THE SDSS
Modified Flow Chart Introduced
SSDS printed on yellow paper
SDSS Introduced

THE DIFFERENCES MADE
• An MDT approach to tackling anxiety and
depression in acute stroke patients.
• The RBH Stroke Unit is now compliant
with the NICE Guidelines and the
biannual RCP National Sentinel Stroke
Audit.
• The new assessment tool identifies
patients who may have previously
remained undetected.

Top Tips
Think about your objective: what is it that you
want to accomplish?
• Be clear in your aim – test it with your supervisor
• Think of a change that you can make that might
result in improvement
• Think of something that you have come across
which is of poor quality or affects patient safety
or experience or is a waste of time
• Start small and keep it simple

Top tips
Be organised: Plan your time• Use a progress template to help chart progress with your
Project
Who will you ask to help you?• Part of a group?
• Regular check-ins with your supervisor• Think about what resources you might need
• Think about what other support and who else you might need for the project’ in addition to your supervisor
• Remember the wider multi-disciplinary team and how you might need to engage them
• Has everyone been told who needs to be?

Top tips
Now try making a change and evaluate it: did it work?
• make sure you know what to measure to know that a change is an improvement
• The measuring process should be straightforward to do so there is no doubting the improvements made
• If it works, build on the improvement – eg include other doctors, try it on more patients, do it for more than one day, use it on more than one ward

Top tips
Document your project: what have you learned?
• Be clear about what was learnt
• Be clear about what worked and what didn’t
• Incorporate suggestions from all those involved to avoid a feeling of the project being imposed on them
• Record your results on a run chart so you can see the changes taking place over time
Work shop
The consultants have been summoned to an urgent meeting. They are informed current length of stay is too long. Some initial analysis has been done and the main delay has been identified as timely completion of the electronic discharge/TTO letter.

Work shop
• Your consultant thinks this is an opportunity for a QI project and asks you to think how discharge can be made more timely.
• How are you going to approach this?