dr. east 9/10/2015 1. continental mapping activity used robinson projection … 7 continents...
TRANSCRIPT

1
WHAT IS GEOGRAPHY?Dr. East 9/10/2015

2
Continental Mapping Activity Used Robinson Projection … 7 Continents standard but
debatable….what a continent contains is based on perspective
Greenland
D.C. and VA below
China
Main Islands of UK
IraqNile
River
NYour Legend
Here
NORTH & CENTRAL AMERICA
SOUTH AMERICA
AFRICA
EUROPE
AUSTRALIA
ANTARCTICA
ASIA
Prime Meridian
Equator
Tropic of Capricorn
Tropic of Cancer
Arctic Circle
Antarctic Circle

3
Best & Worst: Which Side? Why?
China?N. Korea?Syria?Sweden?Finland?U.S.?Brazil?Cuba?Guatemala?

4
Most Populous Places
http://www.census.gov/popclock/print.php?component=counter

5
Armed Conflicts Around the Worldhttp://conflictmap.org/#

6
What is Geography? Geography = (literally geo-graphy “earth writing” or
geographica “earth description”) is the study of variation in the world’s human and physical environments
text book def. -“ the study of the distribution and interaction of physical and human features on the earth”.
Geographers examine how people use “space” It is a spatial science (not spelled spacial or special!) Asks what is where, how/why did it get there? & How does
the thing that’s there effect things elsewhere? We will examine both phenomenon (things, people, flows,
etc.) and processes that explain how/why these phenomena (plural version of phenomenon) vary or are spatially distributed across the surface of the earth.

7
Five Themes of Geography 1 – Location – Where is it?
Absolute location (think geo - coordinates) Ex. Latitude/Longitude Ex. State Plane Coordinate Systems
Relative location (think, places, etc. as they are situated nearby, adjacent or next to something else…it’s North of here, etc.)
2 – Place – What is it like? A unique type of area, has landmarks,
has something different about it that distinguishes it from elsewhere Give me an example of a place
Places have
special meaning!

Absolute Location of Washington-Lee High
School N 38.89 = Latitude (south latitudes denoted with – sign when no direction noted)
W 77.11 = Longitude (west latitudes denoted with – sign when no direction)
What is the school’s relative location? 8

9
3 – Region – How places are similar or different?
Region = collection or grouping of places with similar unifying
characteristics ; may have many similarities that set it apart for other
large areas
Compared to a region, a place is smaller
Regions can be defined in many ways:
Maybe similar geology (Mountainous)
Maybe similar economically (mostly agricultural)
Maybe similar linguistically (all speak Spanish)
Maybe similar ethno-religiously (all Muslim or Arabic ancestry)
Question? What kind of place is Arlington? In which region(s) does it lie?
Question? Describe the three kinds of regions.
1) formal,
2) functional,
3) perceptual

10
Examples of Regions

11
4 - Human Environment Interaction
Refers to how people relate to their
physical world
Often focus here is human-related
environmental problems
5 – Movement (or flow or mobility
over distances )
Refers to questions about the flow of
goods, ideas, people, things, etc.
between places and regions
What kinds of flows or movements
can you think of?
On a daily basis, what kinds of flows
happen between Stuarts Draft and
other places?

12
Study of Geography is Divided into various sub-disciplines
So what kinds of things do you think Geographers study here?

13
What work do Geographers do?
Cartographers – make maps (map making)
Work for city governments - city planners use
maps, etc.
plan bus routes,
decide which new neighborhoods should be incorporated
into town,
planning new locations for water and sewer lines,
locating new schools and school bus routes, etc.
determine voting districts

14
Environmental and Physical Scientists
Studying plant or animal distributions
Studying weather patterns, like tornados, or forecasting rain
Studying areas at risk for earthquakes
Examining pollutions sources (like how pesticides get into
groundwater)
Locate flood prone portions of towns
Track down the source of diseases
Sociologists
Use geographic data to discuss cultural regions
Identify poverty ridden areas, wealthy areas, locations of
homelessness, etc.

15
What these people have is a well-developed Geographical Imagination!
Definition: the capacity to understand changing patterns, changing processes, and changing relationships among people, places, and regions.
16
Part II: Mental Maps and Geographer’s Tools

17
They also have good Mental Maps
Used to help you through your day by getting you to school, home, etc.
Giving Directions to your house or getting them to go somewhere
Help you understand where things are happening in the world
Rarely are perfect but can be improved on.
Things that are more important, or closer to your heart, mind, pocketbook are typically more prominent in your mental geographical landscape

18
Mental Maps Cont.

19
Actual Arlington (Google Earth)

20
Geographer’s Tools
Globes = 3D models of the world, Model of way the earth looks from space
Maps = visual two-dimensional (2D) representations of portions of the earth Dimensions refers to number of coordinates it takes
to locate something – Location on a line has one dimension, one x coordinate location on a sphere or surface has two dimensions, one
x and one y coordinate, like latitude and longitude location on a cube or object with height and volume like
a point on a mountain needs three, one x, one y, and one z Ex. lat./long./elevation (z) describes exact point on
mountain somewhere on earth

21
Map Distortions and Projections (Maps Cont.)
Since maps are only 2D they are generalizations and they are designed to emphasize only certain things Distortions = inaccuracies like compression or
exaggeration, or altered shapes, etc. … are a basic part of maps since no 3D object can be accurately displayed in only 2D Think S.A.D.D.
Shape, Area, Distance, or Direction distortions Cartographers select map projections (a way of
showing the curved earth on a flat map) that display the earth in a manner that distorts the least amount of information about the subject they want to map

22
The human face on four different projections
© ODT, Inc. www.odtmaps.org/link.htm#stm
Robinson
Mercator
Sinusoidal
Mollweide

23
Maps use geo-coordinates – aka grid systems – to indicate absolute locations
Example: Latitude and Longitude Locations give the EXACT location of a place on earth. Both are described in terms of degrees, minutes, seconds i. Latitude: – aka parallels that go around the earth
i. Aka parallels, go around the earth like cake layers
ii. degrees are either North or South of equator (indicated by N or S or sometimes by “-” before number indicated south of equator location)
ii. Longitude is Long - aka meridians that circle the earth and intersect at the poles like orange wedges
Measured in degrees either east to west of the prime meridian (0 degree line)… places west are typically noted with a W or with a “-” before the number to indicate a western location; Places East with an E
Finding Location on a Map (Maps Cont.)

24
• Latitude Lines , >= 90 °• Go all the way around the earth • Important Latitude Lines
• Equator – 0°• North Pole – 90° N• South Pole – 90° S• Tropic of Cancer – 23½° N, • Sun’s most northerly location 6/21
• Tropic of Capricorn – 23½° S,• Sun’s most southerly location 12/21
• Arctic Circle – 66½° N northern polar region• Antarctic Circle – 66½° S southern polar region
Longitude Lines, >=180°
They only go ½ way around the earth.
Important Longitude lines• Prime Meridian
(aka the Greenwich Meridian) – 0°
• International Date Line - 180°
25
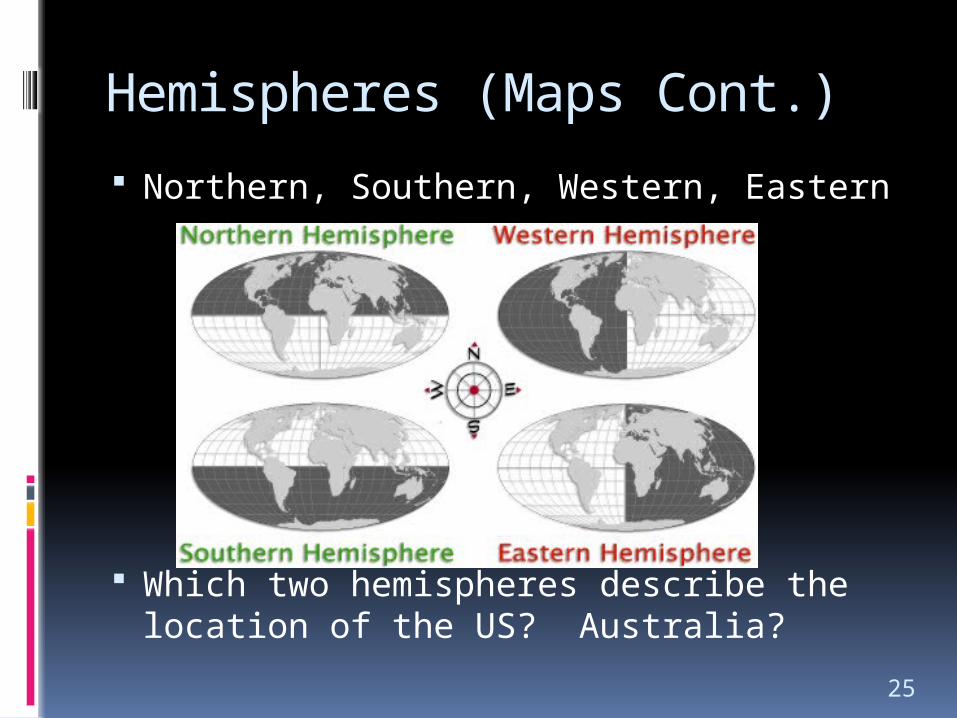
Hemispheres (Maps Cont.)
Northern, Southern, Western, Eastern
Which two hemispheres describe the location of the US? Australia?

26
Using and Reading a Map (Maps Cont.)
Look for the map scale Shows you how the map
relates to real life Bar scales , Ex.
Ratio scales Ex. 1” = 500 miles Ex. 1: 25,000 (unit less,
could be 1” = 25,000 inches; or 1 cm = 25,000 cm.)

27
Small VS Large Scale cont.
On a map of the same dimension a• Smaller
ratio scale will mean less detail (you cover more surface area on this map)
• Larger ratio scale will mean more detail (you cover less surface area on this map)

28
Elements of a Map (Maps Cont.) Look for the compass rose or
north arrow This will give your direction and
orientation Up is not always North!
Look for magnetic declination (only shown on some maps) This tells you the difference
between actual magnetic north and true north according to map
Examine the map legend Explains how and what real
world things symbols, lines, and colors represent on the map

29
Legends convey map information.
1. Symbols (It’s the key to the code)
2. Color can show changes in elevation, vegetation or help you know water from land.
3. Lines can be used to show rivers, roads, railroads, canals, or many other things.
4. Political Boundaries are usually indicated with a bold black line.
5. Contour lines are used to show changes in elevation on a topographic map. Lines that are closer together indicate steeper slopes. Contour lines spaced farther apart indicate gradual slopes.

30
Three Types of Maps General Purpose, Reference or Navigational
Maps 1) Political Maps show state or country
boundaries 2) Physical maps show physical features, like
mountains, rivers, lakes, etc. Topographic maps are a type of physical map
2) Thematic Maps Used to convey information about specific
themes (weather, population density, slope, etc.)
3) Mental Maps – unique to individuals, how they mentally organize their surroundings

31
Examples of Thematic Maps Choropleth Population Distribution
Downtown LA
Tract Location Quotient Values0.0 to 0.50.5 to 1.51.5 to 2.02.0 & UP
Places of Concentration for White/Mexican Households
- 1990 Urbanized Areas LA CMSA - Ventura
CountyLos Angeles
County San Bernardino
County
Riverside
County
Orange
County
San Diego
County

32
White/Mexican Places of Highest Concentration Overlain on Places of Concentration for Mexican Co-Ethnic
Households
- 1990 Urbanized Areas LA CMSA -
Ventura
County
Los Angeles
County San Bernardino
County
Riverside
CountyOrange
County
San Diego
County
Downtown LA
Tract Location Quotient Values
White/Mexican LQ Values, 2.0 & Up (4.03 max.)
Mexican Co-ethnic LQ Values, 1.5 to 2.0Mexican Co-ethnic LQ Values, 2.0 & Up (9.89 max.)
Ex. Thematic Maps (cont. 1)

33
Ex. Thematic Maps (cont. 2)
China, Population Density, Dot Map 1 dot = 50,000 people

34
Ex. Thematic Maps (cont. 3)

35
Ex. Thematic Maps (cont. 4)

36
Ex. Thematic Cartograms Mapping based on theme not
location of land area.

37
Other Geographic Tools Photographs – pictures of places, things on the planet
… ex. aerial photos from planes GPS – global positioning systems – uses satellites to
help you figure out your absolute location on earth Ex. Onstar technology in vehicles; Tremble GPS used by
hikers and hunters Satellite Imagery (images) – compilations of pixels of
digital data obtained from sensors carried in satellites. It includes collecting data both in the visible (reflectance values) and non-visible (like heat waves) portions of the electromagnetic spectrum. Ex. multispectral scanner carried in Landsat satellites.
Orbits more than 100 miles above the earth’s surface Ex. GOES – Geostationary Operational Environment
Satellite – a weather satellite

38
Landsat view of Washington, D.C. (highly urbanized areas shown in blue)

39
Primary Sources Interviews with people in the know Surveys – questionnaires given by
researchers to select groups of people
Field work – going someplace, observing, and taking notes
People’s journals and travelogues Ex. Lewis & Clark journals
Secondary sources Census Data – Ex. US Decennial
Census Using other peoples surveys
Diagrams Ex. floodplain diagram below

40
Charts & Graphs & Scatter Graphs

41
Geographic Information Systems (GIS) databases

42
In a GIS database, each mapped information layer here corresponds to a data table (think MS Excel table) Ex. map of customer
layer – table includes names and street addresses of customers
Ex. street layer – names and types of streets
Ex. parcels – maybe tax maps of owned property
Ex. elevation – areas of elevation levels created from aerial photos or satellites
Ex. land use – areas of similar land uses created from satellite images, aerial photos, etc.