dr. bao-luo ma research scientist – crop physiology
DESCRIPTION
Nitrogen Use Efficiency Workshop Canopy Reflectance Signatures: Developing a C rop Need-Based Indicator for Sidedress Application of N Fertilizer to Canola. Dr. Bao-Luo Ma Research Scientist – Crop Physiology Eastern Cereal and Oilseed Research Centre (ECORC), Ottawa, ON - PowerPoint PPT PresentationTRANSCRIPT

Nitrogen Use Efficiency Workshop
Canopy Reflectance Signatures: Developing a Crop Need-Based Indicator for Sidedress
Application of N Fertilizer to Canola
Dr. Bao-Luo Ma
Research Scientist – Crop Physiology
Eastern Cereal and Oilseed Research Centre (ECORC), Ottawa, ON
613-759-1521, [email protected]
Canada
Introduction
• Canola:• Is the important source of edible oil after soybean• < 2% erucic acid in oil and <30 µmoles glucosinolates g-1
canola meal. • Rapeseed: 25-45% erucic acid and 50-100 µmoles
glucosinolates
• Becoming an important crop in the Eastern Canada:• canola offers growers a good return• an excellent rotation crop/alternative crop• operation of TRT has brought canola growers closer to
a crushing and refinery plant• canola acres are poised for significant growth

Challenge for growers and industry
• Ensure a stable supply of high quality oilseed• Improve canola productivity • Cultivar more resilient to climate variability• Adoption of best management practices• Minimizing negative impacts on environment• Nutrient management, key to increase yield
and oil content • Need tools for best nutrient management

Soil Sampling Grid Sampling a 52 Acre Field
1 sample every 2.5 acres21 samples per field
1 sample every 0.625 acres83 samples per field
1 sample every 0.156 acres333 samples per field
The large spatial variability reduces the effectiveness of using soil N as a tool for fertilizer recommendation for improved NUE.
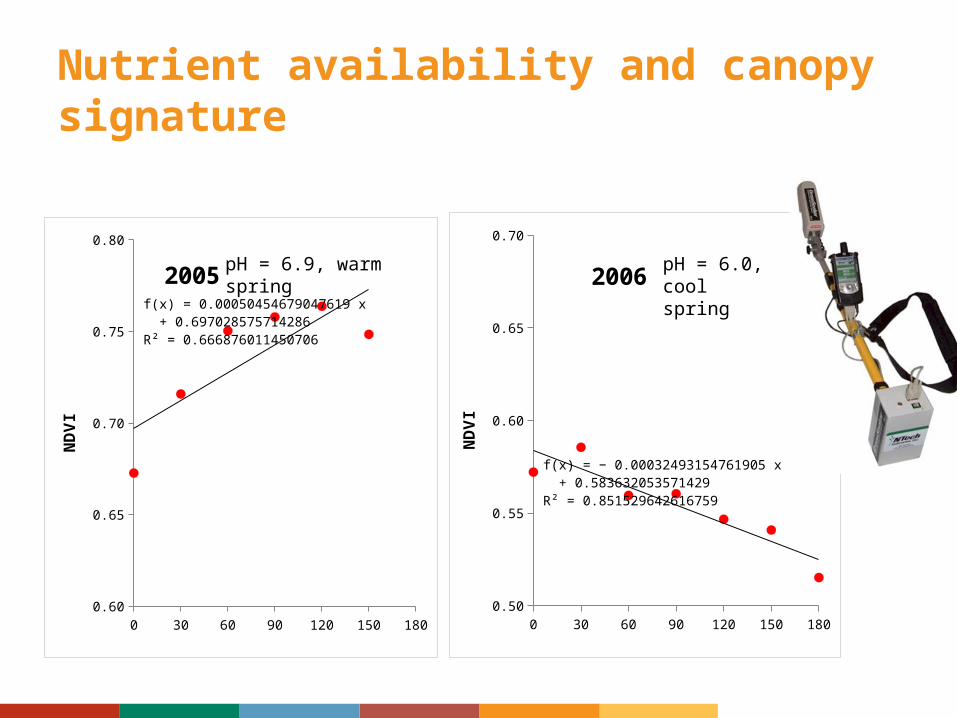
Nutrient availability and canopy signature
0 30 60 90 120 150 1800.60
0.65
0.70
0.75
0.80
f(x) = 0.000504546790476191 x + 0.697028575714286R² = 0.666876011450706
2005
ND
VI
0 30 60 90 120 150 1800.50
0.55
0.60
0.65
0.70
f(x) = − 0.000324931547619047 x + 0.583632053571429R² = 0.851529642616759
2006
ND
VI
pH = 6.9, warm spring pH = 6.0, cool spring

Crop response to soil pH• Most field crops grow best in soils with slightly acid
reaction (pH 7.0 – 6.5)
• Almost all plant nutrients are available in optimal for plant growth
• pH < 6.0, likely deficient in Mg, Ca, K
• Strongly acid soil (pH < 5.0, Al, Fe, Mn toxicity)
• pH >7.0, Fe, Mn, Zn, Cu unavailable for plant growth

Objectives
Build knowledge of oilseed crop for Eastern Canada
• Develop a crop need-based indicator to be used for canola recommendations;
• Develop nutrient best management practices for growing canola in eastern Canada

Materials and Methods

Experimental Locations
1) Central Experimental Farm, Ottawa, ON (2011, 2012, 2013)
2) North Bay, ON (2012, 2013)
3) Guelph, ON (2012, 2013)
4) Two sites in QC
5) One site in NB
6) One site in NS

Experimental Design
A field experiment with combinations of preplant and sidedress N fertilizer as urea, was arranged in a RCB design with 4 replications in each site-year.
• Preplant: 0, 50, 100, 150, 200 kg N ha-1
• Sidedress: 50+50, 50+100, 50+150 kg N ha-1
• Hybrid: Bayer InVigor 5440 (LL) (in 2011 & 2012), InVigor 5440 and L150 (2013)
• In all site-years, research plot experiments
• In North Bay, a 50 ac field with preplant fertilizer strips and a plot study also nested in the field in 2013
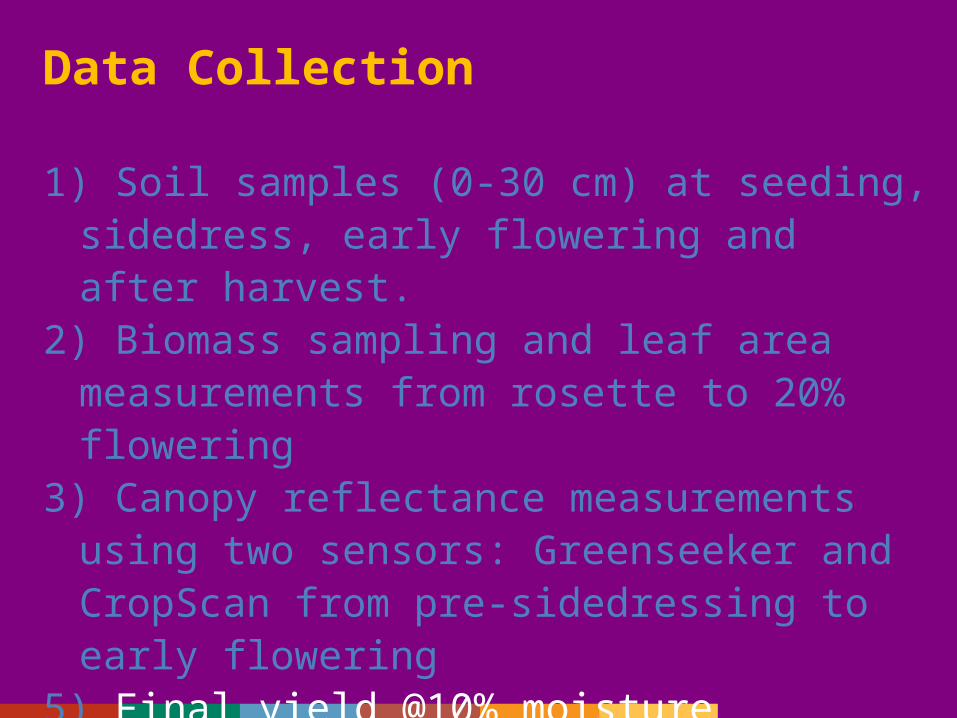
Data Collection
1) Soil samples (0-30 cm) at seeding, sidedress, early flowering and after harvest.
2) Biomass sampling and leaf area measurements from rosette to 20% flowering
3) Canopy reflectance measurements using two sensors: Greenseeker and CropScan from pre-sidedressing to early flowering
5) Final yield @10% moisture6) Yield components7) Straw and grain N concentrations

Results

conola-treatment-4
conola-treatment-1
conola-treatment-3
conola-treatment-2
conola-treatment-2
conola-treatment-2 conola-treatment-3
conola-treatment-1
conola-treatment-4
conola-treatment-4
conola-treatment-1
conola-treatment-3
conola-strip-9
conola-strip-8
conola-strip-7
conola-strip-1
conola-strip-11
conola-strip-10
conola-strip-12
conola-strip-2
conola-strip-4
conola-strip-5
conola-strip-6
conola-strip-3
0 100 20050 Meters
Canola
±48 mx 290 m(157 feet x 951 feet)
48 mx 400 m (157 feet x 1312 feet)
48 mx 290 m
48 mx 290 m
48 mx 290 m
48 mx 290 m
48 mx 400 m
48 mx 400 m
48 mx 400 m
48 mx 400 m
48 mx 400 m
48 mx 400 m
North Bay field demonstration plots
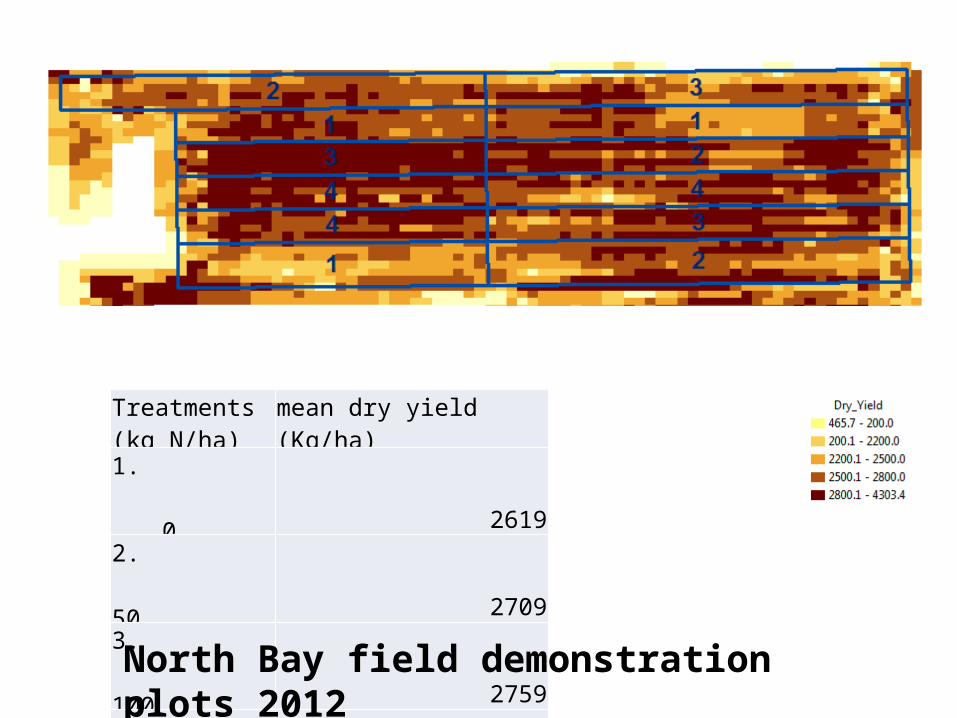
Mean calculated from yield map based on strips
Treatments (kg N/ha) mean dry yield (Kg/ha)1. 0 26192. 50 27093. 100 27594. 150 2771
North Bay field demonstration plots 2012

0 20 40 60 80 100 120 140 160 180 2000.30
0.35
0.40
0.45
0.50
0.55
f(x) = − 0.00000547413371 x² + 0.0008140241 x + 0.49224879743R² = 0.509338022385675
f(x) = − 0.00000223619057 x² + 0.00029151813 x + 0.43495304514R² = 0.788897064687071N
DVI
Jun 10
0 20 40 60 80 100 120 140 160 180 2000.60
0.65
0.70
0.75
0.80
f(x) = − 0.00000835 x² + 0.0017065 x + 0.66805R² = 0.979927072891164
f(x) = − 0.00000319285714 x² + 0.00058407143 x + 0.65323571429R² = 0.374320164364229
ND
VI
Jun 13
0 20 40 60 80 100 120 140 160 180 2000.65
0.70
0.75
0.80f(x) = − 0.00000438571429 x² + 0.00105014286 x + 0.73362142857R² = 0.914104168568959f(x) = − 0.00000519285714 x² + 0.00114207143 x + 0.71343571429R² = 0.909891156462585
ND
VI
Jun 17
0 20 40 60 80 100 120 140 160 180 2000.60
0.65
0.70
0.75
0.80
f(x) = − 0.0000056785714 x² + 0.0013982143 x + 0.6919071429R² = 0.898519785972393f(x) = − 0.0000081714286 x² + 0.0020172857 x + 0.6434428571R² = 0.941650243073888
ND
VI
Jun 21
0 20 40 60 80 100 120 140 160 180 2000.65
0.70
0.75
0.80
f(x) = − 0.00000091428629 x² + 0.0003468573 x + 0.7440285686R² = 0.805895516421257
f(x) = − 0.0000034666671 x² + 0.0011320001 x + 0.6953333303R² = 0.88593726927437
ND
VIJun 25
2013 Ottawa Plot Exp.Seeding: May 6Sidedress: June 14pH = 6.3
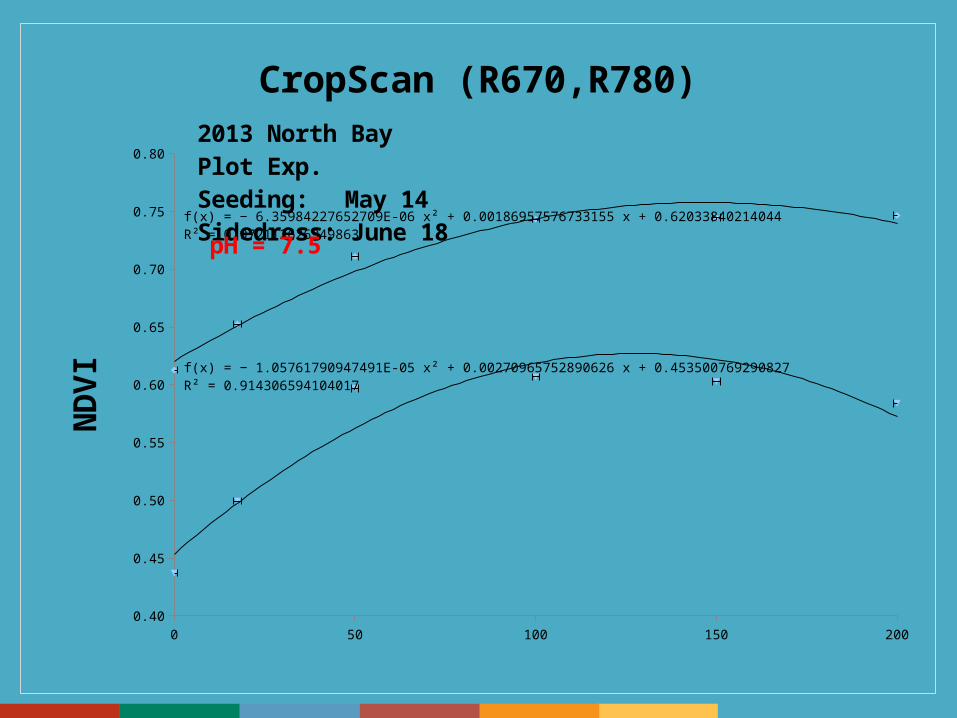
0 50 100 150 2000.40
0.45
0.50
0.55
0.60
0.65
0.70
0.75
0.80
f(x) = − 1.05761790947491E-05 x² + 0.00270965752890626 x + 0.453500769290827R² = 0.914306594104017
f(x) = − 6.35984227652709E-06 x² + 0.00186957576733155 x + 0.62033840214044R² = 0.972112626949863
CropScan (R670,R780)N
DVI
2013 North Bay Plot Exp.Seeding: May 14Sidedress: June 18
pH = 7.5
0 1 2 3 4 5 6 7 8 90.62
0.64
0.66
0.68
0.7
0.72
0.74
0.76
0.78
0.8
0.82
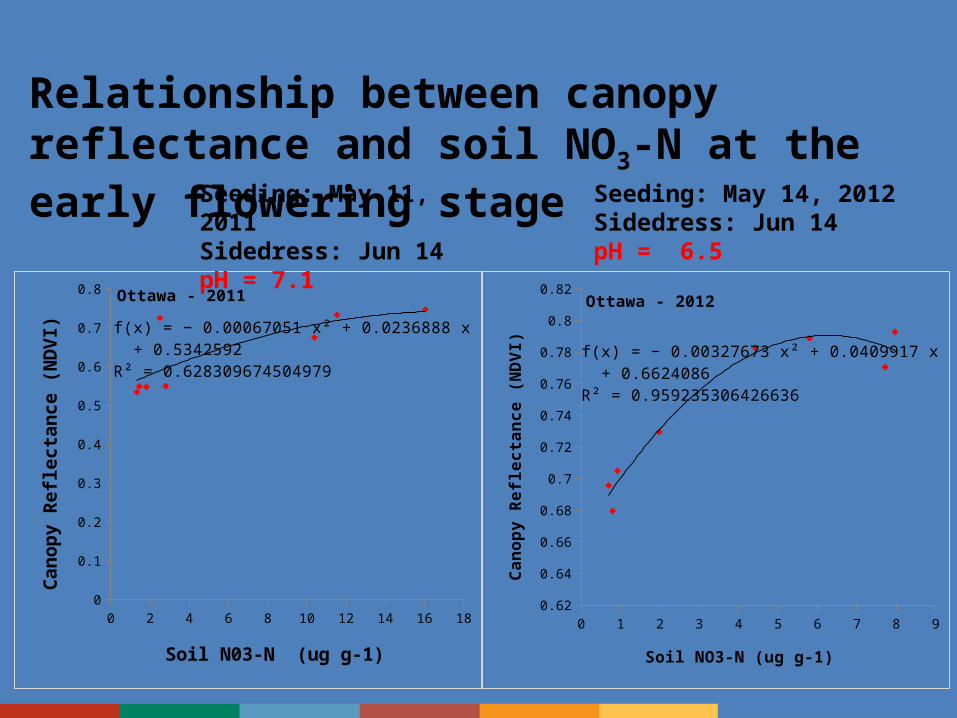
f(x) = − 0.00327673253 x² + 0.04099165388 x + 0.66240863275R² = 0.959235306426636
Soil NO3-N (ug g-1)
Ca
no
py
Re
fle
cta
nc
e (
ND
VI)
Ottawa - 2012
0 2 4 6 8 10 12 14 16 180
0.1
0.2
0.3
0.4
0.5
0.6
0.7
0.8
f(x) = − 0.00067050954 x² + 0.02368880007 x + 0.53425923854R² = 0.628309674504979
Soil N03-N (ug g-1)
Ca
no
py
Re
fle
cta
nc
e (
ND
VI)
Ottawa - 2011
Relationship between canopy reflectance and soil NO3-N at the early flowering stage
Seeding: May 11, 2011Sidedress: Jun 14pH = 7.1
Seeding: May 14, 2012Sidedress: Jun 14pH = 6.5
0.4 0.45 0.5 0.55 0.6 0.65 0.7 0.751000
1200
1400
1600
1800
2000
2200
2400
2600
2800
3000
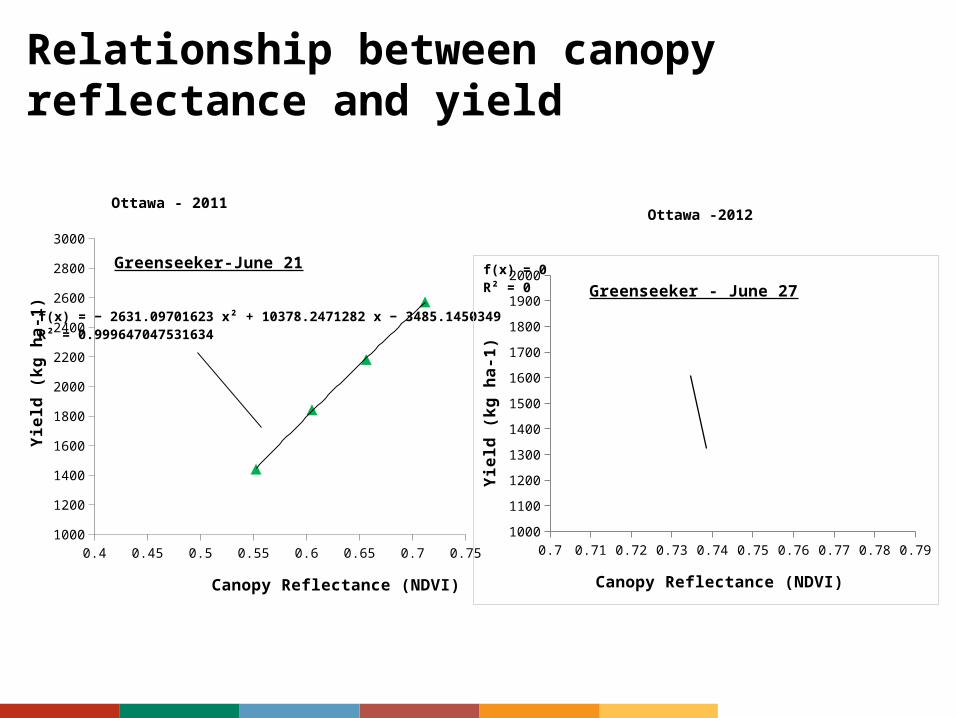
f(x) = − 2631.09701622599 x² + 10378.2471281689 x − 3485.14503490147R² = 0.999647047531634
Canopy Reflectance (NDVI)
Yie
ld (k
g h
a-1)
Greenseeker-June 21
Ottawa - 2011
Relationship between canopy reflectance and yield
Ottawa -2012
0.7 0.71 0.72 0.73 0.74 0.75 0.76 0.77 0.78 0.791000
1100
1200
1300
1400
1500
1600
1700
1800
1900
2000f(x) = 0R² = 0
Canopy Reflectance (NDVI)
Yiel
d (k
g ha
-1)
Greenseeker - June 27
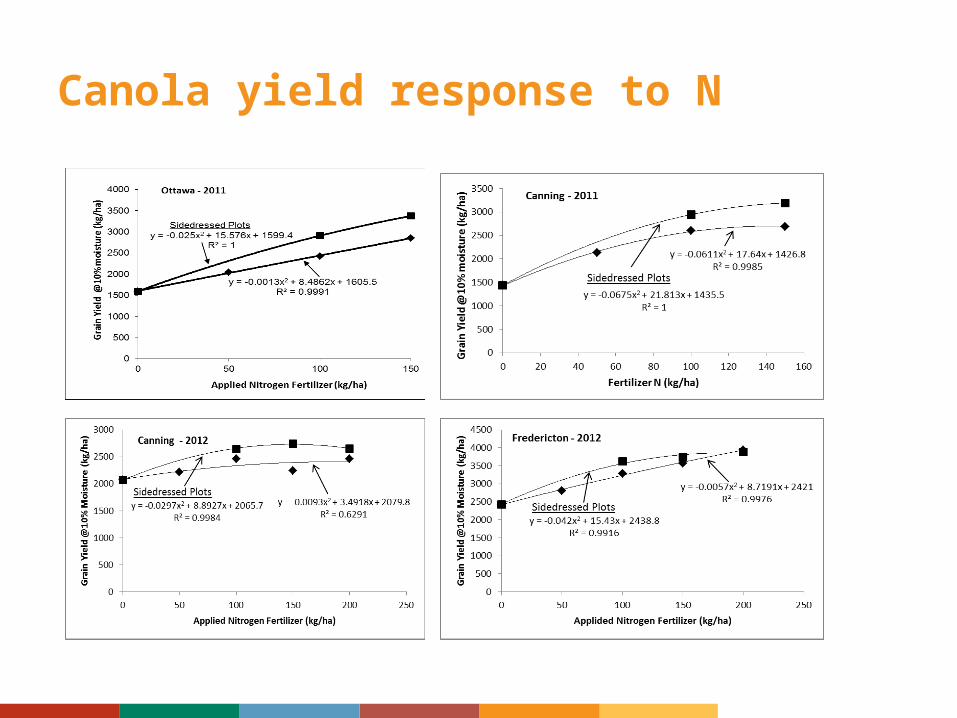
Canola yield response to N

Conclusions• Canola seed yield responded to N fertilizer
positively, more so with sidedress application;• For each kg N ha-1, seed yield increased by 9.7 for
preplant application, by 13.7 kg ha-1 for sidedress;• Drought severely affected canola response to N;• There was a close relationship between NDVI and
soil NO3-N, between NDVI and seed yield;
• Canopy reflectance expressed as NDVI delineated N treatments at sidedress stage;
• Reflectance signatures were affected by soil conditions such as low pH, cool temperatures;

Conclusions (cont’d)• There is a small window for sidedress, but late
delineation of N effects by NDVI is a big challenge;• It is possible to estimate N requirement by measuring
canopy reflectance. • Multi-site, multi-year data are needed to account for
environmental extremes, spatial and temporal variability, and to derive NDVI – N rate algorithms;
• Need to examine the balance between N:S and the optimum range of other nutrients;
• Variable rate application of N using precision technology will play an important role.

Acknowledgements• ECODA: Rory Francis, Etienne
Tardiff, Don Smith• Professional: D. Smith, C.
Caldwell, P. Scott, A. Vanasse, H. Earl, J. Shang
• Technical support staff and students