dp eurasia n.v. · 11 65 24 20 50 47 domino's pizza pizza hut little caesar's burger king...
TRANSCRIPT
Interim Results for the Period
ended 30 June 2017
DP Eurasia N.V.

2
This Presentation is not an offer to buy or sell any securities. Save where otherwise indicated, the Company is the source of the
content of this Presentation and, accordingly, although care has been taken to ensure that the facts stated in this Presentation are
accurate and that the opinions expressed are fair and reasonable, no representation, warranty or undertaking, express or implied, is
made by any of the Company, any of its directors, officers, employees, affiliates, advisors, shareholders or representatives as to,
and no reliance should be placed on, the fairness, accuracy, completeness or correctness of the information or the opinions
contained herein. Neither the Company nor any of its directors, officers, employees, affiliates, advisors or representatives shall have
any liability whatsoever (in negligence or otherwise) for any loss howsoever arising from any use of this Presentation or its contents
or otherwise arising in connection with the Presentation.
Certain statements in this Presentation are not historical facts and are “forward looking” statements. These forward-looking
statements can be identified by the use of forward-looking terminology, including the terms “believes”, “estimates”, “anticipates”,
“expects”, “intends”, “plans”, “may”, “will” or “should” or, in each case, their negative or other variations or comparable terminology.
None of the Company, its directors, officers, employees, affiliates, advisors, shareholders or representatives intend or have any
duty or obligation to supplement, amend, update or revise any of the forward-looking statements contained in this Presentation or to
update or to keep current any other information contained in this Presentation. The information and opinions contained in this
Presentation are provided as at the date of this Presentation and are subject to change without notice. As a result, you are
cautioned not to place undue reliance on such forward looking statements.
Disclaimer

3
Aslan Saranga
Chief Executive Officer
Selim Kender
Chief Strategy Officer and Head of Investor Relations
Presentation Team

SECTION 1
Overview
5
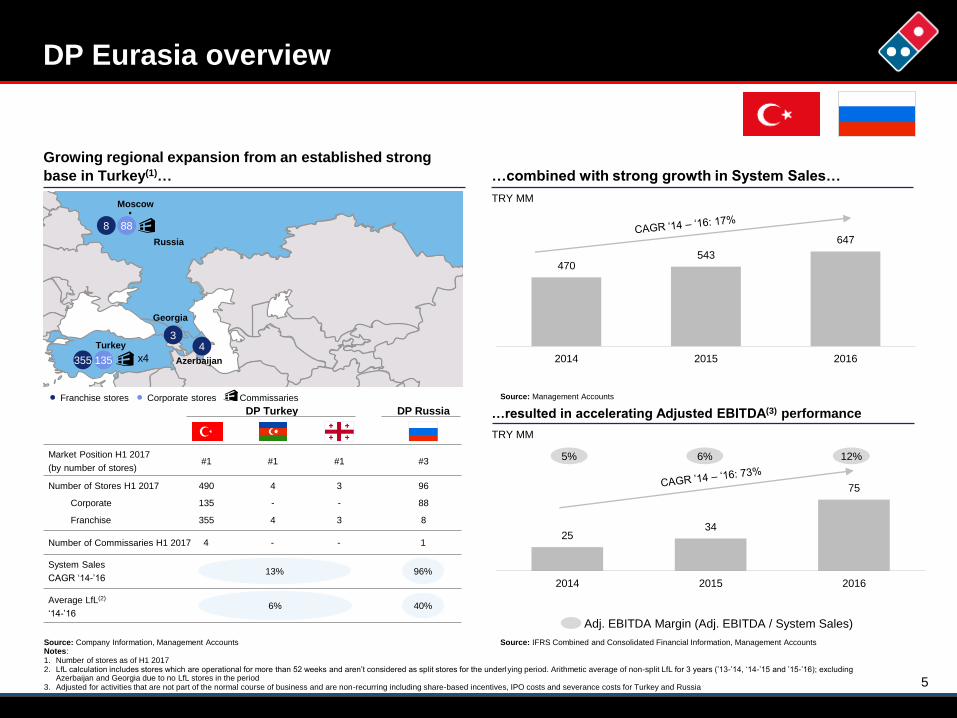
DP Eurasia overview
Growing regional expansion from an established strong
base in Turkey(1)…
DP Russia
Market Position H1 2017
(by number of stores)
Number of Stores H1 2017
#1 #1 #3
Corporate
Franchise
System Sales
CAGR ‘14-’16
490 96
135 88
355 8
Average LfL(2)
‘14-’16
DP Turkey
#1
4
-
4
3
-
3
13%
6%
Number of Commissaries H1 2017 4 1- -
96%
40%
Turkey
Russia
Georgia
Azerbaijan
Moscow
88
355 135
34
x4
8
Commissaries Franchise stores Corporate stores
…combined with strong growth in System Sales…
Adj. EBITDA Margin (Adj. EBITDA / System Sales)
TRY MM
…resulted in accelerating Adjusted EBITDA(3) performance
TRY MM
Source: Company Information, Management AccountsNotes:1. Number of stores as of H1 20172. LfL calculation includes stores which are operational for more than 52 weeks and aren’t considered as split stores for the underlying period. Arithmetic average of non-split LfL for 3 years (’13-’14, ‘14-’15 and ’15-’16); excluding
Azerbaijan and Georgia due to no LfL stores in the period3. Adjusted for activities that are not part of the normal course of business and are non-recurring including share-based incentives, IPO costs and severance costs for Turkey and Russia
Source: IFRS Combined and Consolidated Financial Information, Management Accounts
Source: Management Accounts
470543
647
2014 2015 2016
2534
75
2014 2015 2016
5% 6% 12%

6
H1 2017 Highlights
- - -
AUG JUN
6.9% 31.3% 602 593
LIKE-FOR-LIKE GROWTH
38.5%
REVENUE
TRY 289.8 m
STORE COUNT
SYSTEM SALES Adjusted EBITDA
TRY 398.5 m TRY 39.4 m
26.4%
TRY 30.0 m
29.0%
CAPEX

SECTION 2
Operational Review

8
370 432 466 495 498
1319
4372 104
80103
130160
219289
383451
509567
2007 2008 2009 2010 2011 2012 2013 2014 2015 2016 Aug 2017
DP RussiaDP Turkey
Store count growth
…with Russia surpassing 100 in less than 4 years
# of stores at period end
Source: Company Information
500th store in Turkey imminent...
# of stores at period end
# of stores at period end
Continuous and significant store rollout
Source: Company Information Source: Company Information
+23+27
+30+59
+70
+94+68
+58+58
462488
463490 490
400
500
600
2015 2016 H1 2016 H1 2017 Aug 2017
4372
45
96 104
0
50
100
150
2015 2016 H1 2016 H1 2017 Aug 2017
602
+35
+26 +27 +29
+51

9
Like-for-like performance
18%
7%
33%
7%
Online Total
H1 2016 H1 2017
225%
59%85%
31%
Online Total
H1 2016 H1 2017
Turkey Russia
System sales LfL growth, %
LfL performance in line with guidance
Source: Company Information

10
Online channel
48%
32%
63%
42%
Delivery Total
H1 2016 H1 2017
39%
25%
46%
30%
Delivery Total
H1 2016 H1 2017
Online system sales, %
Share of online ordering growing healthily
40%
25%
50%
33%
Delivery Total
H1 2016 H1 2017
Source: Company Information
Turkey Russia
Group

11
65
2420
50 47
Domino'sPizza
PizzaHut
LittleCaesar's
BurgerKing
McDonald's
85.6
H1 2017
93.2
H1 2017
Why do consumers choose DP Eurasia?
Attractive pricing vs competitors in Turkey
and Russia with high value for money
Value for money?
% of affirmative respondents
4033
28
Domino's Pizza Pizza Hut Papa John's
Value for money?(1)
% of affirmative respondents
Delivery on Time, % Delivery on Time, %
RussiaTurkey
Innovation – New Products
Quick delivery times all year round in Turkey and
Russia, despite the challenging weather conditions
Market positioning
I II
III
Source: Ipsos Connect Brand Health and Ad Tracking,Feb/Mar 2017
Source: Company Information
Source: Company Information
Notes:1. The figures are representing only Moscow
Source: "Russian OHD market and dining habits" consumer survey in 2016 conducted by Ipsos
Chicken popcorn Cold chocolate bites Greek salad Caesar salad

SECTION 3
Financial Results
13
31
39
H1 2016 H1 2017
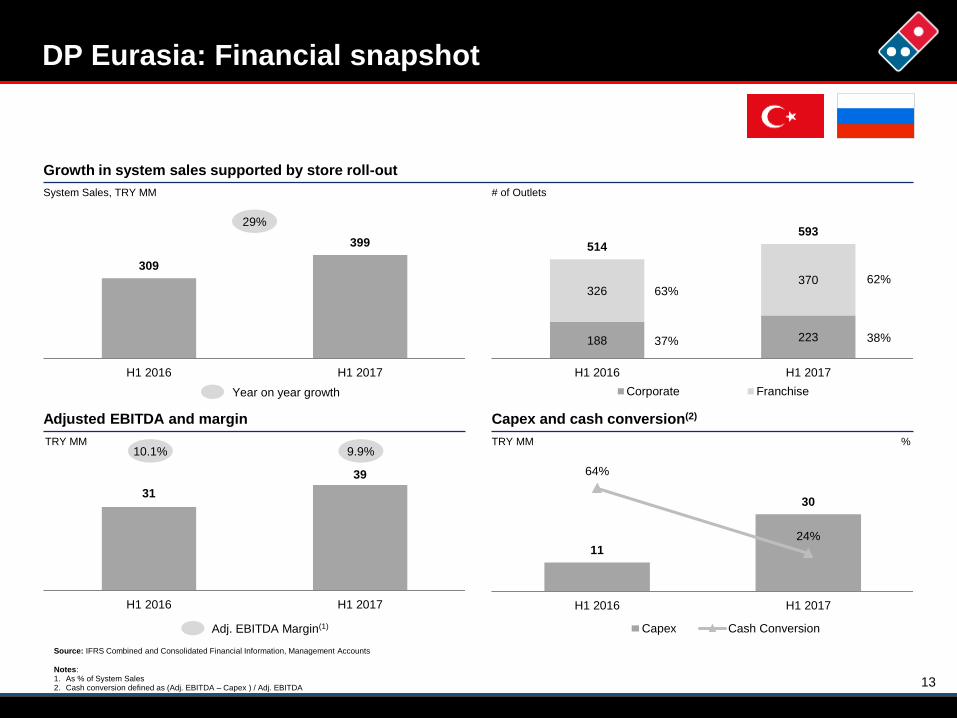
309
399
H1 2016 H1 2017
Year on year growth
188 223
326370
514
593
H1 2016 H1 2017
Corporate Franchise
DP Eurasia: Financial snapshot
System Sales, TRY MM
11
30
64%
24%
H1 2016 H1 2017
Capex Cash Conversion
TRY MM %
63%
37%
# of Outlets
29%
TRY MM
Growth in system sales supported by store roll-out
Adjusted EBITDA and margin Capex and cash conversion(2)
Source: IFRS Combined and Consolidated Financial Information, Management Accounts
Notes:1. As % of System Sales2. Cash conversion defined as (Adj. EBITDA – Capex ) / Adj. EBITDA
10.1%
Adj. EBITDA Margin(1)
9.9%
62%
38%

14
DP Turkey: Financial snapshot(1)
29
34
H1 2016 H1 2017
279 308
H1 2016 H1 2017
Year on year growth
143 135
320 355
463 490
H1 2016 H1 2017
Corporate Franchise
System Sales, TRY MM
TRY MM %
69%
31%
# of Outlets
11%
TRY MM
System Sales
Adjusted EBITDA and margin Capex and cash conversion(4)
Source: IFRS Combined and Consolidated Financial Information, Management Accounts
Notes:1. Including contributions from Azerbaijan and Georgia2. Turkey only
10.5%
Adj. EBITDA Margin(3)
11.1%
72%
28%
Store count(2)
3. As % of System Sales4. Cash conversion defined as (Adj. EBITDA – Capex ) / Adj. EBITDA
611
78%68%
H1 2016 H1 2017
Capex Cash Conversion

15
DP Russia: Financial snapshot
25
H1 2016 H1 2017
30
91
H1 2016 H1 2017
Year on year growth
88
8
45
96
H1 2016 H1 2017
Corporate Franchise
System Sales, TRY MM
TRY MM
# of Outlets
200%
TRY MM
System Sales
Adjusted EBITDA Capex
Source: IFRS Combined and Consolidated Financial Information, Management Accounts
Notes:1. As % of System Sales
5.9%
Adj. EBITDA Margin(1)
5.6%
8%
92%
Store count
5
19
H1 2016 H1 2017

16
65%
35%
TRY EUR
Cash flow generation and debt profile
Notes:1. Adjusted for activities that are not part of the normal course of business and are non-recurring including share-based incentives, IPO costs and severance costs for Turkey and Russia2. Adjusted net debt is calculated as sum of short-term borrowings and long-term borrowings, less cash and cash equivalents and adjusted for non-recurring items including long term deposit for loan guarantee and delay in
collection/payment day coinciding on a weekend
31 39
(11)(30)
20 9
H1 2016 H1 2017
Adj. EBITDA Capex Adj. EBITDA - Capex Cash Conversion
146 171
53 47
200217
1.9x 2.0x
2016 H1 2017
Adj. Net Debt Gross Debt
TRY MM TRY MM
Cash flow generation
DP Eurasia’s debt profile by currency DP Eurasia’s debt profile by segment
Source: IFRS Combined and Consolidated Financial Information
Debt profile of DP Eurasia
64% 24%
(1) Adj. Net Debt / Adj. EBITDA LTM(2) (1)(2)
28%
68%
5%
TRY EUR RUB
8%
92%
RUB EUR
H1 2017 Russian Gross Debt
TRY 124 MM
H1 2017 Turkish Gross Debt
TRY 93 MM
H1 2017 Gross Debt
TRY 217 MM
75% Hedged
via EUR
deposit
17
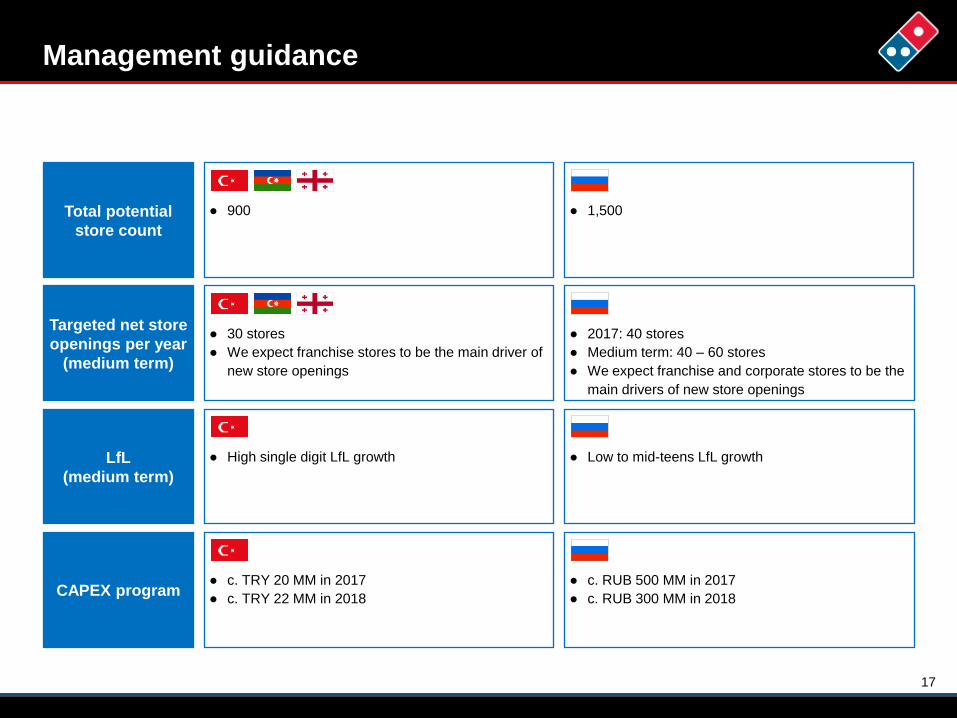
Management guidance
Total potential
store count
Targeted net store
openings per year
(medium term)
LfL
(medium term)
CAPEX program
● 900 ● 1,500
● High single digit LfL growth ● Low to mid-teens LfL growth
● 30 stores
● We expect franchise stores to be the main driver of
new store openings
● 2017: 40 stores
● Medium term: 40 – 60 stores
● We expect franchise and corporate stores to be the
main drivers of new store openings
● c. TRY 20 MM in 2017
● c. TRY 22 MM in 2018
● c. RUB 500 MM in 2017
● c. RUB 300 MM in 2018

SECTION 4
Conclusion

19
Conclusion
Source: Company Information
• Solid topline and profitability growth
o System Sales: 29.0%
o Adjusted EBITDA: 26.4%
• LfL growth in line with guidance
• Online share increasing: ~ 50% of delivery
• Milestone store openings achieved in August
o Group: exceeded 600
o Russia: exceeded 100

APPENDIX
21
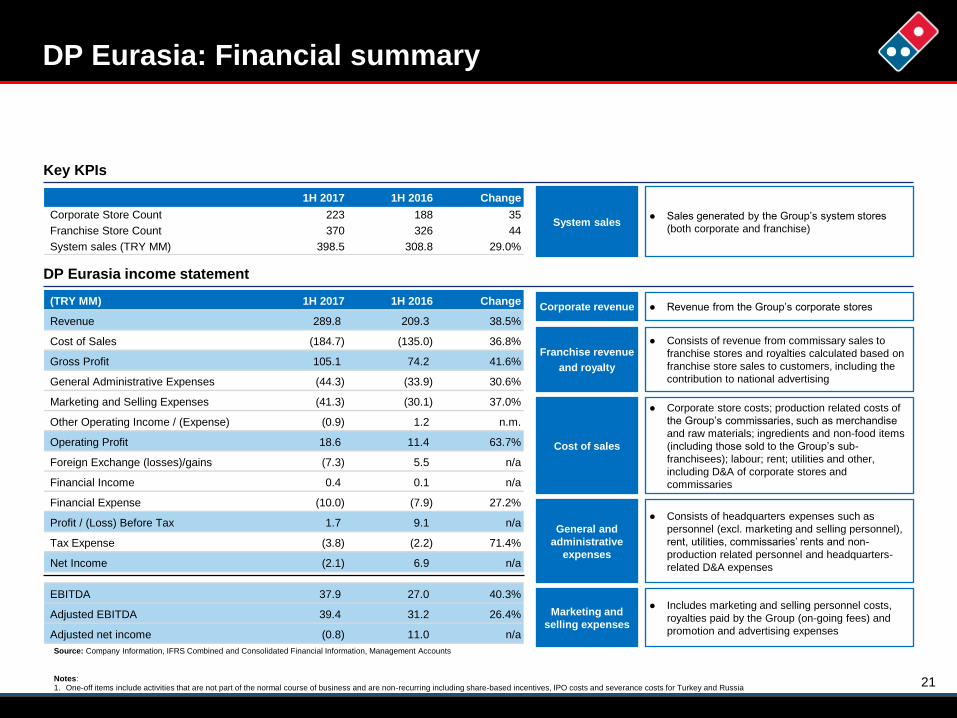
DP Eurasia: Financial summary
Key KPIs
DP Eurasia income statement
System sales● Sales generated by the Group’s system stores
(both corporate and franchise)
Corporate revenue ● Revenue from the Group’s corporate stores
Franchise revenue
and royalty
● Consists of revenue from commissary sales to
franchise stores and royalties calculated based on
franchise store sales to customers, including the
contribution to national advertising
Cost of sales
● Corporate store costs; production related costs of
the Group’s commissaries, such as merchandise
and raw materials; ingredients and non-food items
(including those sold to the Group’s sub-
franchisees); labour; rent; utilities and other,
including D&A of corporate stores and
commissaries
General and
administrative
expenses
● Consists of headquarters expenses such as
personnel (excl. marketing and selling personnel),
rent, utilities, commissaries’ rents and non-
production related personnel and headquarters-
related D&A expenses
Marketing and
selling expenses
● Includes marketing and selling personnel costs,
royalties paid by the Group (on-going fees) and
promotion and advertising expenses
Source: Company Information, IFRS Combined and Consolidated Financial Information, Management Accounts
Notes:1. One-off items include activities that are not part of the normal course of business and are non-recurring including share-based incentives, IPO costs and severance costs for Turkey and Russia
1H 2017 1H 2016 Change
Corporate Store Count 223 188 35
Franchise Store Count 370 326 44
System sales (TRY MM) 398.5 308.8 29.0%
(TRY MM) 1H 2017 1H 2016 Change
Revenue 289.8 209.3 38.5%
Cost of Sales (184.7) (135.0) 36.8%
Gross Profit 105.1 74.2 41.6%
General Administrative Expenses (44.3) (33.9) 30.6%
Marketing and Selling Expenses (41.3) (30.1) 37.0%
Other Operating Income / (Expense) (0.9) 1.2 n.m.
Operating Profit 18.6 11.4 63.7%
Foreign Exchange (losses)/gains (7.3) 5.5 n/a
Financial Income 0.4 0.1 n/a
Financial Expense (10.0) (7.9) 27.2%
Profit / (Loss) Before Tax 1.7 9.1 n/a
Tax Expense (3.8) (2.2) 71.4%
Net Income (2.1) 6.9 n/a
EBITDA 37.9 27.0 40.3%
Adjusted EBITDA 39.4 31.2 26.4%
Adjusted net income (0.8) 11.0 n/a

22
DP Eurasia: Revenue & Expense Breakdown
Notes:1. One-off items include activities that are not part of the normal course of business and are non-recurring including share-based incentives, IPO costs and severance costs for Turkey and Russia
(TRY MM) 1H 2017 1H 2016 Change 1H 2017 1H 2016
System sales 398.5 308.8 29%
Corporate 173.8 117.9 48% as a % of system sales 43.6% 38.2%
Franchise 224.7 190.9 18% as a % of system sales 56.4% 61.8%
1H 2017 1H 2016 Change 1H 2017 1H 2016
Revenue 289.8 209.3 38%
Corporate 173.8 117.9 48% as a % of revenue 60.0% 56.3%
Franchise 103.4 85.2 21% as a % of revenue 35.7% 40.7%
Other revenue 12.5 6.2 102% as a % of revenue 4.3% 3.0%
Cost of Sales (184.7) (135.0) 37%
Cost of Food/Non-Food/Transportation (100.5) (76.4) 32% as a % of system sales 25.2% 24.7%
Corporate Store Expenses (70.5) (46.8) 51% as a % of corporate system sales 40.5% 39.7%
Depreciation and Amortization (13.7) (11.8) 16%
Gross Profit 105.1 74.2 42% as a % of system sales 26.4% 24.0%
General Administrative Expenses (44.3) (33.9) 31%
Overhead (Including Commisary) (38.6) (26.1) 48%
of w hich one-off (1.4) (0.2)
Overhead (excluding one-offs) (37.2) (25.9) 44% as a % of system sales 9.3% 8.4%
Share based incentives (0.1) (4.0) n/a
Depreciation and Amortization (5.6) (3.8) 46%
Marketing and Selling Expenses (41.3) (30.1) 37%
Marketing and Advertising (23.0) (16.3) 41% as a % of system sales 5.8% 5.3%
Corporate Store Local Marketing (2.5) (1.9) 31% as a % of corporate system sales 1.5% 1.6%
Royalty (15.8) (11.9) 32% as a % of system sales 4.0% 3.9%
Other Operating Income / (Expense) (0.9) 1.2 n/a
Operating Profit 18.6 11.4 64%

23
(TRY MM) 1H 2017 1H 2016
System Sales 308.0 278.7
Operating profit 19.4 11.8
D&A 13.5 13.6
EBITDA 32.8 25.4
Non-recurring (income)/expenses 1.5 4.0
Adjusted EBITDA 34.3 29.4
% of system sales 11.1% 10.5%
Adjusted EBIT 20.8 15.8
% of system sales 6.8% 5.7%
Capital expenditures 11.0 6.5
Cash conversion 67.9% 78.0%
(TRY MM) 1H 2017 1H 2016
System Sales 398.5 308.8
Operating profit 18.6 11.4
D&A 19.3 15.6
EBITDA 37.9 27.0
Non-recurring (income)/expenses 1.5 4.2
Adjusted EBITDA 39.4 31.2
% of system sales 9.9% 10.1%
Adjusted EBIT 20.1 15.5
% of system sales 5.0% 5.0%
Capital expenditures 30.0 11.2
Cash conversion 23.7% 64.2%
(TRY MM) 1H 2017 1H 2016
System Sales 90.5 30.1
Operating profit (0.8) (0.4)
D&A 5.8 2.0
EBITDA 5.0 1.6
Non-recurring (income)/expenses 0.0 0.2
Adjusted EBITDA 5.1 1.8
% of system sales 5.6% 5.9%
Adjusted EBIT (0.7) (0.2)
% of system sales -0.8% -0.8%
Capital expenditures 19.0 4.7
Cash conversion n.m. n.m.
Adjusted EBITDA and Net Debt calculation
DP Turkey DP Russia
DP Eurasia
Notes:1. Excludes income and expenses which are not part of normal course of business and are non-recurring items
(TRY MM) 1H 2017 2016
Short term bank borrowings 113.4 115.9
Short-term portions of long-term financial lease borrowings 3.9 3.0
Long-term bank borrowings 91.6 73.3
Long-term financial lease borrowings 8.5 7.3
Total borrowings 217.5 199.5
Cash and cash equivalents 21.6 19.5
Net debt 195.9 180.0
Non-recurring items
Long term deposit for loan guarantee (25.0) (23.2)
Adjusting delay in collection/payment day coinciding on a
weekend- (10.4)
Adjusted net debt 170.9 146.4

24
Exchange Rates
Source: Company Information
Currency Period End Period Average Period End Period Average
EUR/TRY 4.003 3.931 3.204 3.256
RUB/TRY 0.059 0.062 0.045 0.041
EUR/RUB 67.499 62.719 71.210 78.367
Currency Period End Period Average Period End Period Average
EUR/TRY 3.710 3.338 3.178 3.019
RUB/TRY 0.057 0.045 0.040 0.045
EUR/RUB 63.811 74.231 79.697 67.777
Period ended 30 June
2017 2016
Year ended 31 December
2016 2015
25
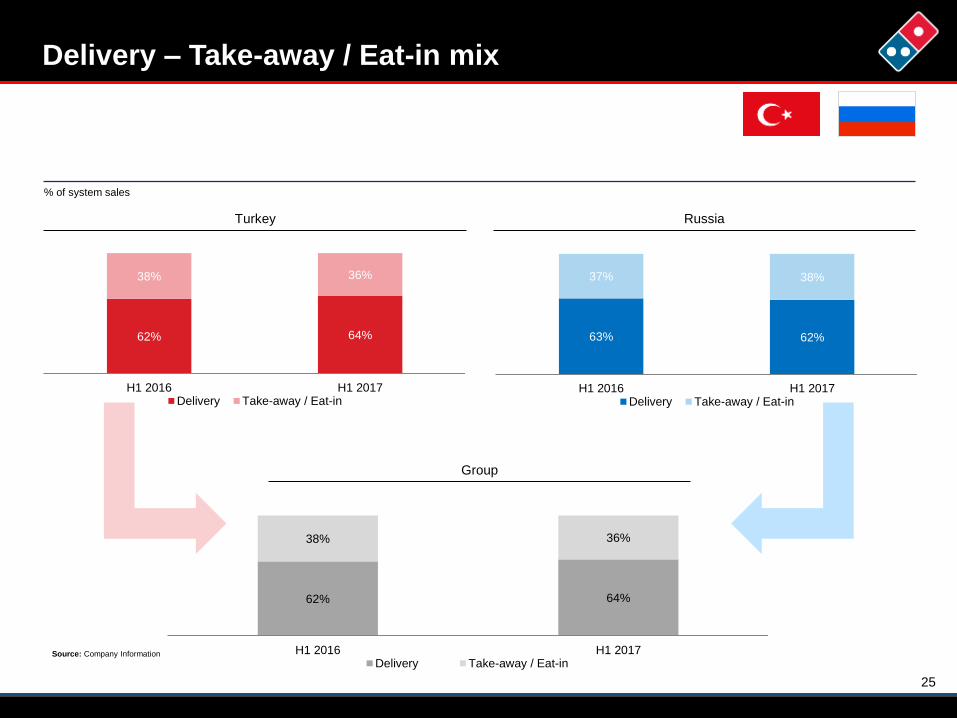
Delivery – Take-away / Eat-in mix
% of system sales
Source: Company Information
Turkey Russia
Group
62% 64%
38% 36%
H1 2016 H1 2017Delivery Take-away / Eat-in
62% 64%
38% 36%
H1 2016 H1 2017Delivery Take-away / Eat-in
63% 62%
37% 38%
H1 2016 H1 2017Delivery Take-away / Eat-in