downtown olympia market analysis
TRANSCRIPT

8/17/2019 Downtown Olympia Market Analysis
http://slidepdf.com/reader/full/downtown-olympia-market-analysis 1/71
OLYMPIA DOWNTOWN STRATEGY
MARKET ANALYSIS
PREPARED FOR :
CITY OF OLYMPIA ANDMAKERS ARCHITECTURE AND URBAN DESIGN
PREPARED BY:
PROPERTY COUNSELORS
MARCH 2016

8/17/2019 Downtown Olympia Market Analysis
http://slidepdf.com/reader/full/downtown-olympia-market-analysis 2/71
OLYMPIA DOWNTOWN STRATEGY MARKET ANALYSIS
PROPERTY COUNSELORS PAGE 1
TABLE OF CONTENTS Table of Contents ................................................................................................................ 1
I. Introduction and Summary ............................................................................................. 3
Introduction ..................................................................................................................... 3
Summary ......................................................................................................................... 4
Economic and Demographic Overview ...................................................................... 4
District Profile ............................................................................................................. 4
Demand for Retail ....................................................................................................... 5
Demand for Office ...................................................................................................... 5
Demand for Residential .............................................................................................. 6
Demand for Lodging ................................................................................................... 7
Summary of Potential Demand ................................................................................... 7
II. Economic and Demographic Overview ......................................................................... 9
Employment .................................................................................................................... 9
Population ..................................................................................................................... 17
Visitor Industry ............................................................................................................. 21
III. Downtown Profile ....................................................................................................... 23
Land Use ....................................................................................................................... 23
Population ..................................................................................................................... 25
Housing ......................................................................................................................... 26
Business Mix ................................................................................................................. 27
Taxable Sales and Business Performance ..................................................................... 29
Perceptions .................................................................................................................... 30

8/17/2019 Downtown Olympia Market Analysis
http://slidepdf.com/reader/full/downtown-olympia-market-analysis 3/71
OLYMPIA DOWNTOWN STRATEGY MARKET ANALYSIS
PROPERTY COUNSELORS PAGE 2
IV. Demand for Retail....................................................................................................... 32
Current Retail Demand ................................................................................................. 32
Existing Development ................................................................................................... 35
Neighborhood Scale Retail ....................................................................................... 39
Cinema/Entertainment .............................................................................................. 39
Specialty Retail ......................................................................................................... 39
Retail Rental Rates ........................................................................................................ 40
Potential Retail Demand ............................................................................................... 42
V. Demand for Office ...................................................................................................... 47
Historical Office Market Activity ................................................................................. 47
Existing and Planned Office Space ............................................................................... 48
Existing Buildings ..................................................................................................... 48
Planned Buildings ..................................................................................................... 49
Potential Office Development....................................................................................... 50
VI. Demand for Residential .............................................................................................. 53
Overview ....................................................................................................................... 53
Rental Market................................................................................................................ 55
Market Area Statistics ............................................................................................... 55
Existing Apartments.................................................................................................. 56
Condominium Market ................................................................................................... 59
Potential Residential Demand ....................................................................................... 62
VII. Demand for Lodging ................................................................................................. 64
Regional Market Performance ...................................................................................... 64
Existing Hotels .............................................................................................................. 67
Potential Lodging Demand ........................................................................................... 68

8/17/2019 Downtown Olympia Market Analysis
http://slidepdf.com/reader/full/downtown-olympia-market-analysis 4/71
OLYMPIA DOWNTOWN STRATEGY MARKET ANALYSIS
PROPERTY COUNSELORS PAGE 3
I. INTRODUCTION AND SUMMARY
INTRODUCTION
Olympia is the capitol city of Washington State and enjoys a stable workforce with anengaged and educated community. Its historic downtown has a dramatic natural settingand a variety of living, shopping, and entertainment experiences. Over the past twentyyears, Downtown has benefitted from over $150 million in investment in publicinfrastructure and amenities. The City is looking to capitalize on that investment byadopting a Downtown Strategy that will provide a plan for achieving the vision forDowntown. The Strategy will set priority actions for the next five to six years, illustratedesired design elements and future conditions, guide City budgets, work plans and partnerships, and help to market downtown.
In order to identify realistic economic opportunities for Downtown, the Strategy includesa market analysis for potential uses that could be supported over the next 20 years. Theanalysis will provide a basis for identifying physical improvements to Downtown, as wellas conditions that will support private investment. All of these elements will become partof the overall strategy for the future.
This report documents the results of the market analysis for potential uses. It is organizedinto seven sections.
I. Introduction and Summary
II. Economic and Demographic Overview
III. Downtown Profile
IV. Demand for Retail
V. Demand for Office
VI. Demand for Residential
VII. Demand for Lodging
The major findings and conclusions of the analysis are summarized in the remainder ofthis section.

8/17/2019 Downtown Olympia Market Analysis
http://slidepdf.com/reader/full/downtown-olympia-market-analysis 5/71
OLYMPIA DOWNTOWN STRATEGY MARKET ANALYSIS
PROPERTY COUNSELORS PAGE 4
SUMMARY
ECONOMIC AND DEMOGRAPHIC OVERVIEW
Government is the largest category of employment in Thurston County with 34% of total
wage and salary employment. State employment has grown since 2011 to reach a total ofover 25,000 full and part-time workers. Olympia’s share of State workers in ThurstonCounty has fallen from 66% 1998 to 52% in 2011.
Olympia is the largest of the three major cities in Thurston County. The averagehousehold size in Olympia is lower than in the other two cities; the median age is higher;and the median income is lower. The population in Olympia is projected to increase by17,390 over the next 20 years. The City’s Comprehensive Plan calls for 25% of thatincrease to occur in Downtown Olympia.
The visitor industry in Thurston County is comparable in terms of number of employees
to the wholesale or manufacturing sectors. Olympia is easily accessible within the region by automobile, and offers several park, recreation and museum attractions.
DISTRICT PROFILE
The Downtown Strategy Area is defined as the area west of Plum Street, north of 11th SWand 14th SW, west of Capitol Lake, north to include the Port of Olympia property. Thearea includes approximately 500 acres of land. The area includes over seven millionsquare feet of buildings as determined by a recent inventory by the City. The amount of building area is equally distributed among ground floor uses and all upper floors. Officeis the most prominent use, followed by residential and retail. Much of the retail space islocated on the ground floor. Most of the residential and office space is on upper floors.
The total population of Downtown in 2010 was approximately 1,800, an increase of 21%over the previous decade. The area south of Legion Way has a greater population thanthe area to the north, and grew at a faster rate over the decade. The area to the north has asignificantly higher median age, lower household size and lower median income. Overallthere are 931 units of low and moderate income housing units (both subsidized and lowcost) and 714 market rate units. The latter number includes 299 units currently underconstruction. The number of units under construction represents almost 20% of the totalnumber of units Downtown. These units represent a significant shift in the balance between low and moderate income and market rate units.
The largest single category of business in terms of square feet is restaurants. Including bars and coffee shops/bakeries, the food service cluster represents one-third of total retailand restaurant space downtown. General retail and boutiques is the second largest singlecategory. Together with furniture, apparel, art, antiques, books, and jewelry, specialtyretail makes up almost 30% of total space. There is only one grocery store and no stand-alone drug store. Downtown taxable sales represent only 4.6% of city-wide retail tradeand 21% of selected services. Downtown has the largest shares of city-wide sales for
8/17/2019 Downtown Olympia Market Analysis
http://slidepdf.com/reader/full/downtown-olympia-market-analysis 6/71
OLYMPIA DOWNTOWN STRATEGY MARKET ANALYSIS
PROPERTY COUNSELORS PAGE 5
Non-store Retailers, Personal Services, Miscellaneous Retailers,Arts/Entertainment/Recreation, and Foods Services.
DEMAND FOR R ETAIL
Total taxable retail sales in Olympia grew from $1.10 billion in 2004 to $1.24 billion in2014, an annual average growth rate of 1.2 percent, well below the rate of inflation forthe period of approximately 2.4%. Retail trade grew at .8% percent while the selectedservices grew at 3.4 percent. Automobiles, Food Services, General Merchandise, andBuilding Materials were the largest sectors. The fastest growing sectors city-wide wereE-commerce, Arts and Entertainment, Drug Stores and Convenience Stores.
Downtown Olympia currently has a business mix typical of a lifestyle retail center withmultiple tenants in the food service, entertainment, furnishings, apparel andmiscellaneous retail. It is distinct from the regional shopping centers in West Olympiaand Lacey, and the many neighborhood and community scale centers that provide moreconvenience type goods that shoppers seek on a frequent basis. The asking rents forseveral established retail buildings in Olympia typically fall in the range of $15 to $20 per square foot. There are many buildings with rents below these levels, particularly inDowntown Olympia. Such rents provide opportunities for new businesses to becomeestablished and grow over time.
The total potential increase in sales is estimated to be $152 million annually by 2035, anincrease of approximately 100% over the period. Capture of regional growth representsthe largest share if this increase, followed closely by increased downtown capture inselected sectors, and increased sales to Downtown residents. The sectors with the largest potential increase are Food Services, Food and Beverage, Miscellaneous Retail, andApparel and Accessories. Increased sales of this magnitude would support an additional
650,000 square feet of retail space, an increase of approximately two-thirds over thecurrent inventory.
DEMAND FOR OFFICE
State-occupied space represented 51 percent of all office space in the County in 2014.The actual percentage was undoubtedly higher, as the total square feet includes vacantspace, and space that may serve some retail uses. The State-occupied buildings includemost of the larger office buildings, while much of the non-State space is in smaller buildings. The amount of State leased space declined dramatically between 2010 and2014. Accordingly, the amount of Non-State space increased dramatically, but the
amount of occupied space has not kept pace. The estimated office vacancy isapproximately 10%, and the vacant space represents approximately eight to ten yearsabsorption at historic rates.
The highest office rents in Olympia are in the higher amenity buildings with water viewsDowntown. None of these buildings were built in the past ten years. The newest majoroffice building in downtown Olympia is the Washington State Employees Credit Union

8/17/2019 Downtown Olympia Market Analysis
http://slidepdf.com/reader/full/downtown-olympia-market-analysis 7/71
OLYMPIA DOWNTOWN STRATEGY MARKET ANALYSIS
PROPERTY COUNSELORS PAGE 6
building on Union Street, but this building is owner – occupied. There are very few new private office projects in the County. The State-owned 1063 Building is underconstruction on the capitol campus. Thurston County is considering possible relocationof its administrative buildings in West Olympia above Capitol Lake, with DowntownOlympia a possible location.
Office using employment in Olympia is projected to grow by 5,357 between 2014 and2040. Office using employment in Thurston County is projected to grow by 16,748 between 2014 and 2040. This growth would support an additional 41,000 square feeteach year in Olympia and 124,000 square feet in the county as a whole. At this rate itwould require approximately eight years to fill the existing vacant office space county-wide. However, with conversion of some buildings to residential or other uses, and withthe lack of any new Class A office space developed in Olympia over the past decade,there will be support for new development in Olympia sometime sooner than that eightyear horizon.
DEMAND FOR R ESIDENTIAL Multifamily development is relatively common in Olympia, with multifamilyrepresenting 40% of total units in 2015. Over the past 15 years, 44% of the net increasein units in Olympia was in multifamily units. Olympia has a current vacancy rate (as ofSeptember 2015) of 3.6 percent, higher than the other cities, but lower than the 5.0 percent target rate for a typical market. Units built since 2010 in Olympia have a slightlylower average vacancy. Olympia’s average rents are lower than the average for the
county as a whole. This can be partly attributed the older inventory in the city.Considering only units built since 2010, rents are much higher in Olympia. Generally, prevailing rents of $1.00 to $1.40 per square foot are less than the rents necessary tosupport the cost of new construction of midrise buildings with structured parking.However, the 123 4th building under construction has asking rents of $2.00 per squarefoot or more, levels that will support such construction.
The average home values for condominiums/coops in Olympia are estimated by Zillow to be $196,000 compared to $254,000 for all homes. Condominium/coop values droppedfrom a peak of $241,000 in 2007, to a low of $175,000 in 2012, before returning to thecurrent value. Of the units currently for sale many are in projects built just prior to therecession. Most of the units for sale are townhouse units. The most expensive unitsgenerally range in size from 1,500 to 2,000 square feet. On a per square foot basis, thehighest priced units are just over $200. However, many of the new townhouse units arefor sale for approximately $150 per square foot. Generally, condominium sales have
begun to increase and prices have stabilized, but the current prices are still well below the prices necessary to justify new investment.
The City targets that approximately one-quarter of the projected increase in City population over the next 20 years will locate Downtown. This increase would represent2,500 to 3,500 additional housing units depending on the average household size. Thedistribution of new units by type will be based on the likely household composition and
8/17/2019 Downtown Olympia Market Analysis
http://slidepdf.com/reader/full/downtown-olympia-market-analysis 8/71
OLYMPIA DOWNTOWN STRATEGY MARKET ANALYSIS
PROPERTY COUNSELORS PAGE 7
income levels of new residents. Family households with children under 18 are morelikely to choose a townhouse. Family households without children, and with higherincomes are more likely to choose a midrise unit. Non-family households, with moderateincomes are more likely to choose a lowrise unit. The projected demand by unit typeover the twenty year period is:
Townhouses 590 to 830 units
Lowrise (2-3 stories) 690 to 970 units
Midrise (4-5 stories) 1,220 to 1,700 units
Total 2,500 to 3,500 units
DEMAND FOR LODGING
The lodging industry suffered major shocks over the last decade. Activity in all
jurisdictions in the County declined with the general economy in 2008, but has recoveredstrongly since then. Olympia captures the largest share of lodging activity, followed byLacey.
There are over 2,000 guestrooms in the Olympia market area, with 36% in Lacey, 34% inOlympia, and 26% in Tumwater. Of the major hotels, only two are full-service hotels. Inaddition, only eight have significant amounts of meeting space. The Towne Place Suiteson Capitol Way in Olympia opened in January 2016 after a major renovation. TheTumwater La Quinta opened in 2015. A Hampton Inn and Suites is scheduled to openwith 126 rooms at 4301 Martin Way in Olympia in June 2016. A 118 room HiltonGarden Inn is under construction on Henderson Boulevard in Olympia. A MarriottCourtyard is proposed for an adjacent site.
Real growth in hotel performance reflects growth in room nights and growth in averagedaily room rate above inflation. The historical real growth rate was 2.3% between 1994and 2015, a very challenging period for the industry. Future growth is assumed at 2.5%to 3.5%. The City’s current share of county-wide room revenue was 46% in 2015 downfrom 51%% in 2003. Olympia should be able to maintain that share and even increase itsomewhat based on likely enhancements to Downtown. The number of supportable newhotel rooms in the study area over the next 20 years is projected to range from 138 to311. A portion of the new rooms are likely to be limited service rooms. But it isimportant that at least one full service hotel be included in order to diversify the marketsegmentation and reinforce Downtown as the center of the local lodging and
entertainment sector.
SUMMARY OF POTENTIAL DEMAND
The projected demand for increased development in Downtown Olympia is summarizedin Table I-1.
8/17/2019 Downtown Olympia Market Analysis
http://slidepdf.com/reader/full/downtown-olympia-market-analysis 9/71
OLYMPIA DOWNTOWN STRATEGY MARKET ANALYSIS
PROPERTY COUNSELORS PAGE 8
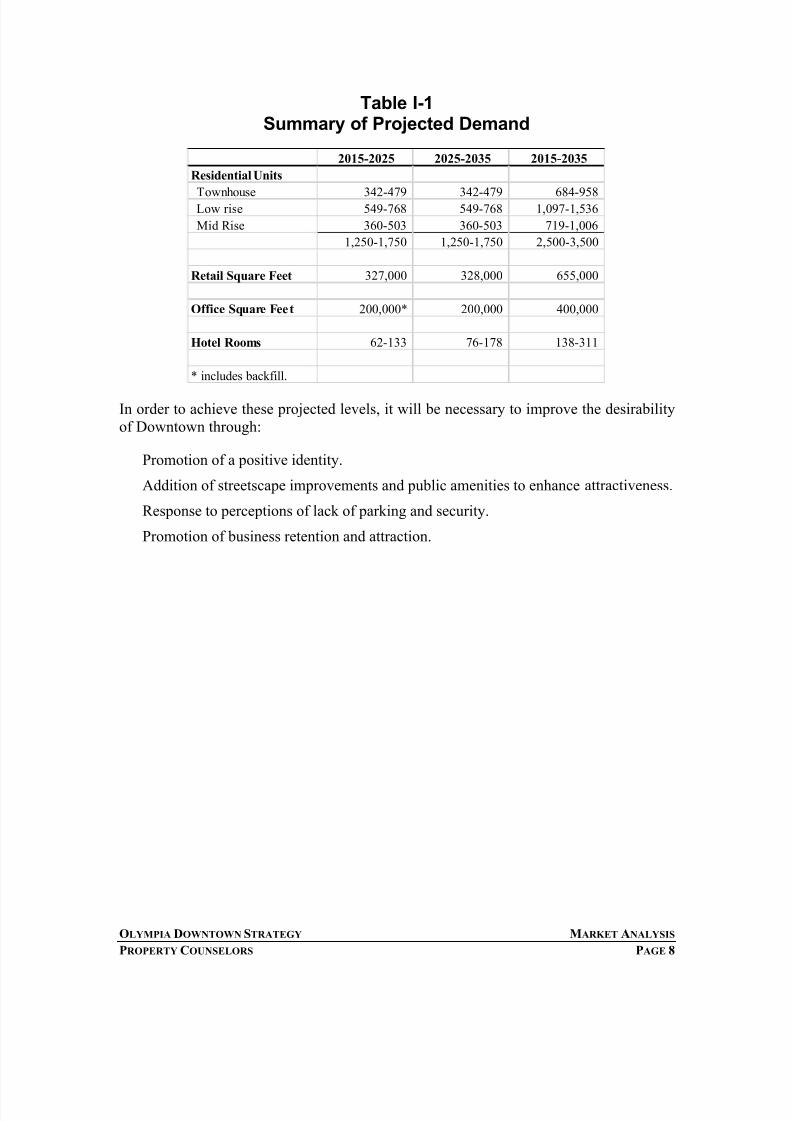
Table I-1Summary of Projected Demand
In order to achieve these projected levels, it will be necessary to improve the desirabilityof Downtown through:
Promotion of a positive identity.
Addition of streetscape improvements and public amenities to enhance attractiveness.
Response to perceptions of lack of parking and security.
Promotion of business retention and attraction.
2015-2025 2025-2035 2015-2035
Residential Units
Townhouse 342-479 342-479 684-958 Low rise 549-768 549-768 1,097-1,536
Mid Rise 360-503 360-503 719-1,006
1,250-1,750 1,250-1,750 2,500-3,500
Retail Square Feet 327,000 328,000 655,000
Office Square Feet 200,000* 200,000 400,000
Hotel Rooms 62-133 76-178 138-311
* includes backfill.

8/17/2019 Downtown Olympia Market Analysis
http://slidepdf.com/reader/full/downtown-olympia-market-analysis 10/71
OLYMPIA DOWNTOWN STRATEGY MARKET ANALYSIS
PROPERTY COUNSELORS PAGE 9
II. ECONOMIC AND DEMOGRAPHIC
OVERVIEW The physical and economic characteristics of Olympia and Thurston County will affectDowntown Olympia’s potential for a range of uses. These attributes are discussed in thissection in terms of:
EmploymentPopulationPopulation CharacteristicsVisitor Activity
EMPLOYMENT
Government dominates employment in Thurston County. As shown in Table II-1 on thenext page, government represents approximately 34 percent of total employment withinthe County. The State is the single largest employer in the County. State employment inThurston County exceeded 25,000 in 2014, after a decline to below 20,000 in 2004, andto 21,000 in 2011, as shown in Figure II-1.
Figure II-1
Source: WA Office of Financial Management, Thurston Regional Planning Council
0
5,000
10,000
15,000
20,000
25,000
30,000
1 9 7 5
1 9 8 0
1 9 8 5
1 9 9 0
1 9 9 1
1 9 9 2
1 9 9 3
1 9 9 4
1 9 9 5
1 9 9 6
1 9 9 7
1 9 9 8
1 9 9 9
2 0 0 0
2 0 0 1
2 0 0 2
2 0 0 3
2 0 0 4
2 0 0 5
2 0 0 6
2 0 0 7
2 0 0 8
2 0 0 9
2 0 1 0
2 0 1 1
2 0 1 2
2 0 1 3
2 0 1 4
Thurston County State Employment
Trends 1975 to 2014Full-time and Part-time

8/17/2019 Downtown Olympia Market Analysis
http://slidepdf.com/reader/full/downtown-olympia-market-analysis 11/71
OLYMPIA DOWNTOWN STRATEGY MARKET ANALYSIS
PROPERTY COUNSELORS PAGE 10

8/17/2019 Downtown Olympia Market Analysis
http://slidepdf.com/reader/full/downtown-olympia-market-analysis 12/71
OLYMPIA DOWNTOWN STRATEGY MARKET ANALYSIS
PROPERTY COUNSELORS PAGE 11
Table II-1
Thurston County Covered Employment by Sector – 2005-2014
Source: Washington State Employment Security Department, Quarterly Covered Employmentand Wage Report.
As shown in Table II-1, the average wage for covered employment in Thurston Countywas $45,000 in 2014. The sectors with the highest average wages were Wholesale Trade,Utilities, Management of Companies and Enterprises, and Finance and Insurance.
The share of State employment located in Olympia declined from 66% in 1998 to 50%currently as shown in Table II-3. The State dispersed many of its functions over this period, but has since begun to concentrate them again in Olympia.
2005 2010 2014
Avg.
Ann. Gr.
Avg. Wage
2014Agriculture, forestry, fishing and hunting 1,647 1,369 1,541 -0.7% $35,725
Mining 59 35 31 -6.9% $53,783
Utilities 213 169 170 -2.5% $84,354
Construction 4,425 3,274 3,894 -1.4% $47,173
Manufacturing 3,139 2,986 3,162 0.1% $48,471
Wholesale trade 2,255 2,689 3,067 3.5% $87,897
Retail trade 10,510 11,075 11,842 1.3% $28,134
Transportation and warehousing 1,693 1,642 2,146 2.7% $36,650
Information 947 991 918 -0.3% $58,450
Finance and insurance 2,688 2,158 2,452 -1.0% $62,324
Real estate and rental and leasing 1,304 1,272 1,233 -0.6% $32,953Professional and technical services 2,741 3,241 3,592 3.0% $58,503
Management of companies and enterprises 486 663 724 4.5% $67,198
Administrative and waste services 3,813 3,316 5,216 3.5% $28,865
Educational services 1,168 1,271 1,848 5.2% $39,308
Health care and social assistance 9,745 11,582 13,286 3.5% $43,082
Arts, entertainment, and recreation 1,018 1,189 1,175 1.6% $19,388
Accommodation and food services 6,595 7,519 7,991 2.2% $16,659
Other services, except public administration 3,993 4,433 3,377 -1.8% $33,855
GOVERNMENT 35,375 35,867 35,435 0.0% $55,904
Total 93,814 96,741 103,100 1.1% $45,026

8/17/2019 Downtown Olympia Market Analysis
http://slidepdf.com/reader/full/downtown-olympia-market-analysis 13/71
OLYMPIA DOWNTOWN STRATEGY MARKET ANALYSIS
PROPERTY COUNSELORS PAGE 12
Table II-2State Employment Distribution Trends
12003 employment numbers allocated to 2005 locations.
Source: Washington State Departments of Employment Security and General Administration; TRPC.
1994 1998 2003 2008 2010 2014
Employment
Lacey & UGA 2,620 2,570 3,550 3,150 2,906 2,359
Olympia & UGA 12,300 14,260 12,040 12,210 12,337 12,036
Tumwater & UGA 4,120 3,720 6,030 7,970 7,936 7,613
Other Locations in Thurston 790 1,200 1,210 1,210 1,097 1,109
Total 19,830 21,750 22,830 24,540 24,276 23,117
% of Total
Lacey & UGA 13% 12% 16% 13% 12% 10%
Olympia & UGA 62% 66% 53% 50% 51% 52%
Tumwater & UGA 21% 17% 26% 32% 33% 33%
Other Locations in Thurston 4% 6% 5% 5% 5% 5%
Total 100% 100% 100% 100% 100% 100%

8/17/2019 Downtown Olympia Market Analysis
http://slidepdf.com/reader/full/downtown-olympia-market-analysis 14/71
OLYMPIA DOWNTOWN STRATEGY MARKET ANALYSIS
PROPERTY COUNSELORS PAGE 13
The largest non-government employers are shown in Table II-2. The figures show thatemployment in the area is dominated by institutions and retailers.
Table II-3Thurston County
Largest Non-Government Employers - 2014
No. of
Employees
Providence St. Peter Hospital 1,600Walmart Supercenter (3 locations) 1,023South Sound Community College 780
Xerox 650Capitol Medical Center 600Macy’s 600 Nisqually Red Wing Casino 600Lucky Eagle Casino 600Weyerhaeuser Company (3 locations) 565YMCA (2 locations) 551Evergreen State College 550Great Wolf Lodge 500WA Employees Credit Union 499Panorama 450
Costco (2 location) 420B Marlen Ear Nose Throat Center 400Titus Will Chevrolet Buick GMC Cadillac 400Maple Lane School 320Cabela’s 300Twinstar Credit 300Home Depot 295
Source: Thurston Economic Development Commission
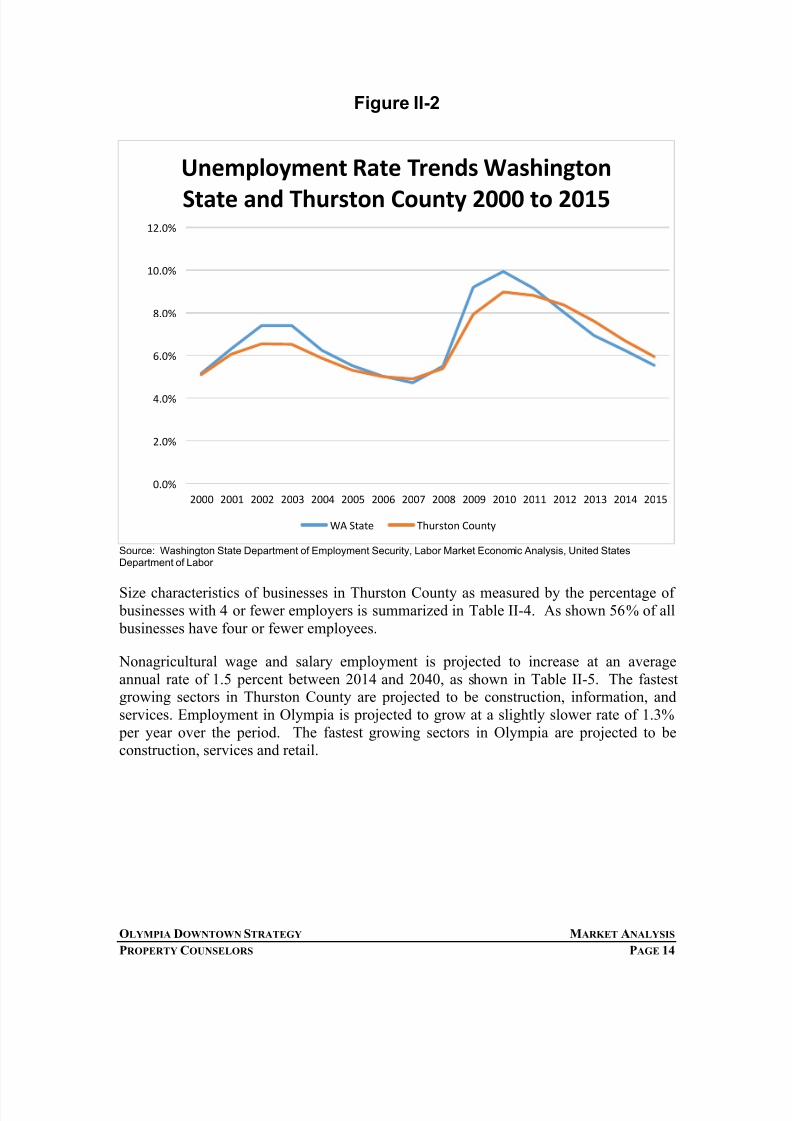
Thurston County’s economy is somewhat stable, comparable to the State as a whole. Asshown in Figure II-2, the county unemployment rate has been higher than the rate for the
State over the last four years, but was lower than the rate for the State in ten of the previous eleven years. The current rate is 5.9 percent, compared to the rate of 5.5 percentfor the State as a whole.
8/17/2019 Downtown Olympia Market Analysis
http://slidepdf.com/reader/full/downtown-olympia-market-analysis 15/71
OLYMPIA DOWNTOWN STRATEGY MARKET ANALYSIS
PROPERTY COUNSELORS PAGE 14
Figure II-2
Source: Washington State Department of Employment Security, Labor Market Economic Analysis, United StatesDepartment of Labor
Size characteristics of businesses in Thurston County as measured by the percentage of businesses with 4 or fewer employers is summarized in Table II-4. As shown 56% of all businesses have four or fewer employees.
Nonagricultural wage and salary employment is projected to increase at an averageannual rate of 1.5 percent between 2014 and 2040, as shown in Table II-5. The fastestgrowing sectors in Thurston County are projected to be construction, information, andservices. Employment in Olympia is projected to grow at a slightly slower rate of 1.3% per year over the period. The fastest growing sectors in Olympia are projected to beconstruction, services and retail.
0.0%
2.0%
4.0%
6.0%
8.0%
10.0%
12.0%
2000 2001 2002 2003 2004 2005 2006 2007 2008 2009 2010 2011 2012 2013 2014 2015
Unemployment Rate Trends Washington
State and Thurston County 2000 to 2015
WA State Thurston County

8/17/2019 Downtown Olympia Market Analysis
http://slidepdf.com/reader/full/downtown-olympia-market-analysis 16/71
OLYMPIA DOWNTOWN STRATEGY MARKET ANALYSIS
PROPERTY COUNSELORS PAGE 15
Table II-4Business Size Statistics Thurston County
Establishments
Establishments
with 1-4
Employees
% of Total
EstablishmentsAgriculture, forestry, fishing and hunting 53 35 66%
Mining 5 3 60%
Utilities 11 7 64%
Construction 676 488 72%
Manufacturing 170 87 51%
Wholesale trade 202 108 53%
Retail trade 776 321 41%
Transportation and warehousing 125 76 61%
Information 89 40 45%
Finance and insurance 333 194 58%
Real estate and rental and leasing 316 252 80%Professional and technical services 627 440 70%
Management of companies and enterprises 19 11 58%
Administrative and waste services 300 199 66%
Educational services 82 40 49%
Health care and social assistance 792 388 49%
Arts, entertainment, and recreation 88 42 48%
Accommodation and food services 542 167 31%
Other services, except public administration 618 372 60%
Industries not Classified 16 16 100%
Total 5,840 3,286 56%
Source: US Census, County Business Patterns, Property Counselors

8/17/2019 Downtown Olympia Market Analysis
http://slidepdf.com/reader/full/downtown-olympia-market-analysis 17/71
OLYMPIA DOWNTOWN STRATEGY MARKET ANALYSIS
PROPERTY COUNSELORS PAGE 16
Table II-5Thurston County and Olympia
Total Non-Agriculture Covered Employment Projections
Source: Thurston Regional Planning Council (TRPC), 2012
The military is an important sector in Thurston County. Although there are no majorfacilities in the county, Joint Base Lewis and McCord (JBLM) to the north in PierceCounty has a strong impact on residential and commercial demand. As shown in TableII-6, Thurston County houses 5,250 active duty military personnel. Thurston Countyoffers an attractive relatively affordable housing opportunity for service people and their
Olympia
Total Employment
2014 2040
Change
2014-
2040
Average
Annual
Change
Resources 115 115 - 0.0%
Construction 1,260 3,405 2,145 3.9%
Manufacturing 870 885 15 0.1%
Transportation Com 530 695 165 1.0%
Wholesale Trade 755 830 75 0.4%
Retail Trade 6,560 8,740 2,180 1.1%
Information 710 930 220 1.0%
FIRE 3,695 4,605 910 0.9%Services 9,890 15,865 5,975 1.8%
Government/Educati 28,955 38,880 9,925 1.1%
Total 53,340 74,950 21,610 1.3%
Thurston CountyTotal Employment
2014 2040
Change
2014-
2040
Average
Annual
Change
Resources 2,905 2,875 (30) 0.0%
Construction 6,195 13,000 6,805 2.9%
Manufacturing 3,240 3,630 390 0.4%
Transportation Com 3,160 4,185 1,025 1.1%
Wholesale Trade 3,680 4,280 600 0.6%
Retail Trade 15,010 21,505 6,495 1.4%
Information 1,270 2,050 780 1.9%
FIRE 9,825 13,210 3,385 1.1%
Services 26,820 43,985 17,165 1.9%
Government 61,825 90,990 29,165 1.5%
Total 133,930 199,710 65,780 1.5%

8/17/2019 Downtown Olympia Market Analysis
http://slidepdf.com/reader/full/downtown-olympia-market-analysis 18/71
OLYMPIA DOWNTOWN STRATEGY MARKET ANALYSIS
PROPERTY COUNSELORS PAGE 17
families stationed at JBLM. A community survey prepared for JBLM offered severalrelevant findings:
59% of active duty personnel living off-base are married and/or have children.
70% of respondents plan to remain in the region for their next deployment.
45% of off-base respondents transitioning out of military in next five years wouldlike to remain in the region.
These households have needs for housing and commercial and public services.
Table II-6Resident Active Duty Military Personnel
2000 to 2011
Source: Office of Financial Management, Population Trends 2012.
POPULATION
Population within Thurston County has grown at the rate of 2.0 percent per year since1990, a rate greater than that of the State as a whole and adjacent counties over the same period. Generally the counties at the periphery of the urbanized area around the Seattlemetropolitan area are experiencing the fastest growth rates. Seventy seven percent of thenet change in population in the County between 1990 and 2010 was due to net migrationas opposed to natural increases. Since 2010, the rate of in migration has slowed, but 63%of net growth has come from net migration. The County is an attractive destination forhouseholds looking to relocate.
2000 2010 2011 2012
Pierce 16,647 23,905 24,829 28,113 Kitsap 10,624 13,627 13,328 13,989
Island 6,208 6,471 6,186 6,451
Spokane 3,103 4,219 4,956 4,960
Thurston 1,979 4,241 4,452 5,250
King 1,977 2,688 2,861 2,861
Snohomish 4,662 5,110 5,213 5,245
Other 2,710 3,485 3,569 3,604
Washington State 47,910 63,746 65,394 70,473

8/17/2019 Downtown Olympia Market Analysis
http://slidepdf.com/reader/full/downtown-olympia-market-analysis 19/71
OLYMPIA DOWNTOWN STRATEGY MARKET ANALYSIS
PROPERTY COUNSELORS PAGE 18
Table II-7Population Growth Trends
Thurston and Adjacent Counties
Source: Washington State Office of Financial Management
Avg. AnnualGrowth
1990 2000 2010 2015 1990 - 2015
State of Washington 4,866,663 5,894,121 6,724,540 7,061,410 1.5%
Thurston 161,238 207,355 252,264 267,410 2.0%
Grays Harbor 64,175 67,194 72,797 73,110 0.5%
Lewis 59,358 68,600 75,455 76,660 1.0%
Mason 38,341 49,405 60,699 62,200 2.0%
Pierce 586,203 700,820 795,225 830,120 1.4%
King 1,507,319 1,737,034 1,931,249 2,052,800 1.2%
8/17/2019 Downtown Olympia Market Analysis
http://slidepdf.com/reader/full/downtown-olympia-market-analysis 20/71
OLYMPIA DOWNTOWN STRATEGY MARKET ANALYSIS
PROPERTY COUNSELORS PAGE 19
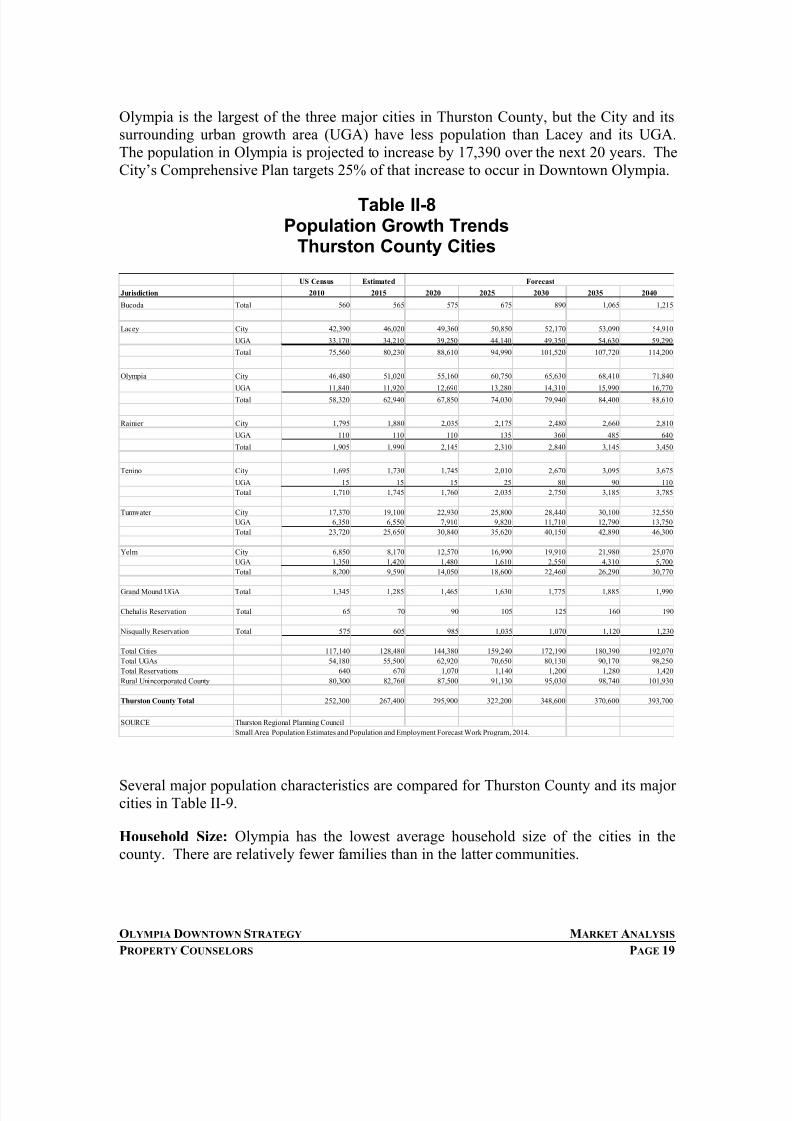
Olympia is the largest of the three major cities in Thurston County, but the City and itssurrounding urban growth area (UGA) have less population than Lacey and its UGA.The population in Olympia is projected to increase by 17,390 over the next 20 years. TheCity’s Comprehensive Plan targets 25% of that increase to occur in Downtown Olympia.
Table II-8Population Growth Trends
Thurston County Cities
Several major population characteristics are compared for Thurston County and its majorcities in Table II-9.
Household Size: Olympia has the lowest average household size of the cities in thecounty. There are relatively fewer families than in the latter communities.
US Census Estimated
Jurisdiction 2010 2015 2020 2025 2030 2035 2040
Bucoda Total 560 565 575 675 890 1,065 1,215
Lacey City 42,390 46,020 49,360 50,850 52,170 53,090 54,910
UGA 33,170 34,210 39,250 44,140 49,350 54,630 59,290
Total 75,560 80,230 88,610 94,990 101,520 107,720 114,200
Olympia City 46,480 51,020 55,160 60,750 65,630 68,410 71,840
UGA 11,840 11,920 12,690 13,280 14,310 15,990 16,770
Total 58,320 62,940 67,850 74,030 79,940 84,400 88,610
Rainier City 1,795 1,880 2,035 2,175 2,480 2,660 2,810
UGA 110 110 110 135 360 485 640
Total 1,905 1,990 2,145 2,310 2,840 3,145 3,450
Tenino City 1,695 1,730 1,745 2,010 2,670 3,095 3,675
UGA 15 15 15 25 80 90 110
Total 1,710 1,745 1,760 2,035 2,750 3,185 3,785
Tumwater City 17,370 19,100 22,930 25,800 28,440 30,100 32,550
UGA 6,350 6,550 7,910 9,820 11,710 12,790 13,750
Total 23,720 25,650 30,840 35,620 40,150 42,890 46,300
Yelm City 6,850 8,170 12,570 16,990 19,910 21,980 25,070
UGA 1,350 1,420 1,480 1,610 2,550 4,310 5,700
Total 8,200 9,590 14,050 18,600 22,460 26,290 30,770
Grand Mound UGA Total 1,345 1,285 1,465 1,630 1,775 1,885 1,990
Chehalis Reservation Total 65 70 90 105 125 160 190
Nisqually Reservation Total 575 605 985 1,035 1,070 1,120 1,230
Total Cities 117,140 128,480 144,380 159,240 172,190 180,390 192,070
Total UGAs 54,180 55,500 62,920 70,650 80,130 90,170 98,250
Total Reservations 640 670 1,070 1,140 1,200 1,280 1,420
Rural Unincorporated County 80,300 82,760 87,500 91,130 95,030 98,740 101,930
Thurston County Total 252,300 267,400 295,900 322,200 348,600 370,600 393,700
SOURCE Thurston Regional Planning Council
Small Area Population Estimates and Population and Employment Forecast Work Program, 2014.
Forecast
8/17/2019 Downtown Olympia Market Analysis
http://slidepdf.com/reader/full/downtown-olympia-market-analysis 21/71
OLYMPIA DOWNTOWN STRATEGY MARKET ANALYSIS
PROPERTY COUNSELORS PAGE 20
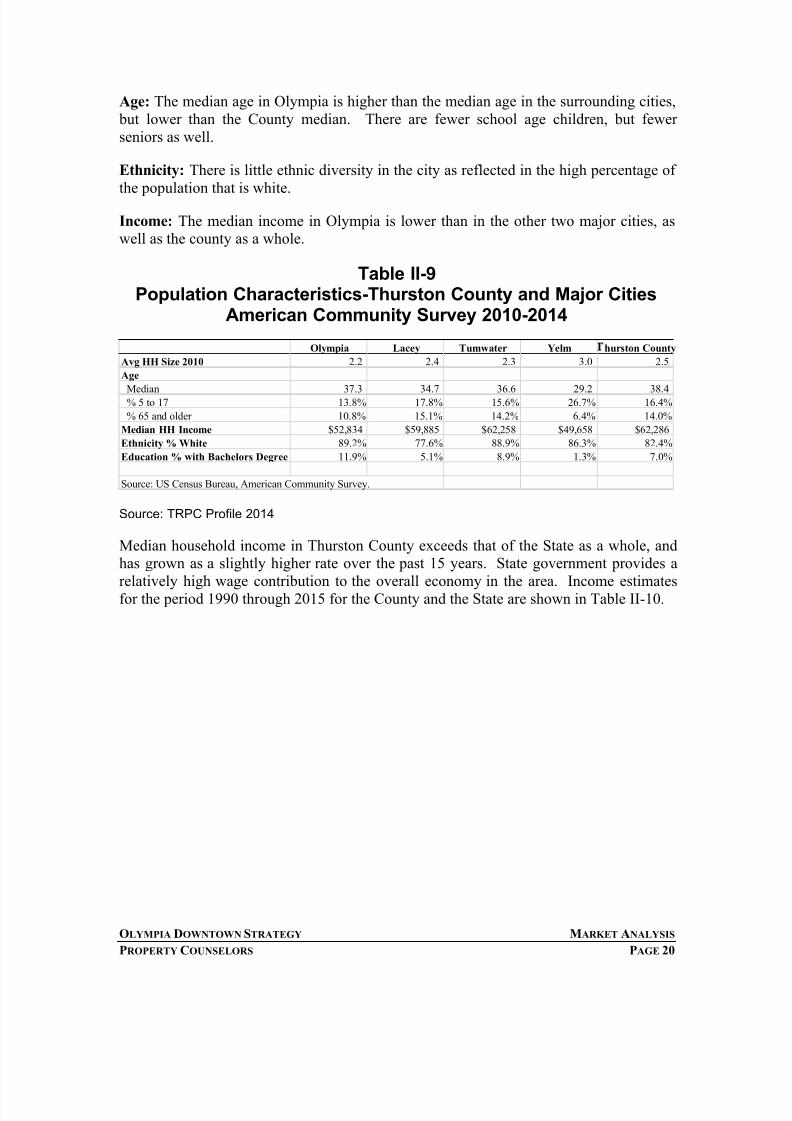
Age: The median age in Olympia is higher than the median age in the surrounding cities, but lower than the County median. There are fewer school age children, but fewerseniors as well.
Ethnicity: There is little ethnic diversity in the city as reflected in the high percentage ofthe population that is white.
Income: The median income in Olympia is lower than in the other two major cities, aswell as the county as a whole.
Table II-9Population Characteristics-Thurston County and Major Cities
American Community Survey 2010-2014
Source: TRPC Profile 2014
Median household income in Thurston County exceeds that of the State as a whole, andhas grown as a slightly higher rate over the past 15 years. State government provides arelatively high wage contribution to the overall economy in the area. Income estimatesfor the period 1990 through 2015 for the County and the State are shown in Table II-10.
Olympia Lacey Tumwater Yelm hurston County
Avg HH Size 2010 2.2 2.4 2.3 3.0 2.5
Age
Median 37.3 34.7 36.6 29.2 38.4 % 5 to 17 13.8% 17.8% 15.6% 26.7% 16.4%
% 65 and older 10.8% 15.1% 14.2% 6.4% 14.0%
Median HH Income $52,834 $59,885 $62,258 $49,658 $62,286
Ethnicity % White 89.2% 77.6% 88.9% 86.3% 82.4%
Education % with Bachelors Degree 11.9% 5.1% 8.9% 1.3% 7.0%
Source: US Census Bureau, American Community Survey.

8/17/2019 Downtown Olympia Market Analysis
http://slidepdf.com/reader/full/downtown-olympia-market-analysis 22/71
OLYMPIA DOWNTOWN STRATEGY MARKET ANALYSIS
PROPERTY COUNSELORS PAGE 21
Table II-10Median Household Income Growth
* Preliminary estimate. ** Projection.Source: Washington State Office of Financial Management Forecasting
Considering only the period 2008 to 2015, the median household income in ThurstonCounty is estimated to have grown at only 1.0% per year, slightly above the rate of .9% per year for the State.
VISITOR INDUSTRY
The visitor industry is Thurston County is represented by a broad spectrum of businesses,activities and attractions. The make-up of the industry is shown in Table II-11.
Table II-11Thurston County Travel Impacts – 2009
Visitor SpendingAccommodations $35,400,000
Food and Food Service 70,600,000Food Stores 14,000,000Transportation 64,900,000Arts Entertainment and Recreation 33,400,000Retail Sales 37,200,000
Total $255,500,000Source: Dean Runyon Associates, Washington State Travel
Impacts 1991 – 2009
Washington Thurston County
2000 $44,120 $48,457
2001 $45,761 $50,885
2002 $46,039 $51,111
2003 $46,967 $51,243
2004 $49,585 $52,043
2005 $50,004 $54,914
2006 $53,522 $57,985
2007 $56,141 $60,576
2008 $57,858 $63,009
2009 $55,458 $60,978
2010 $54,888 $60,038
2011 $55,500 $60,621
2012 $56,444 $62,0092013 $57,284 $63,408
2014 * $60,153 $65,288
2015 ** $62,108 $66,993
Avg. Ann. Growth 2.3% 2.2%

8/17/2019 Downtown Olympia Market Analysis
http://slidepdf.com/reader/full/downtown-olympia-market-analysis 23/71
OLYMPIA DOWNTOWN STRATEGY MARKET ANALYSIS
PROPERTY COUNSELORS PAGE 22
Employment in the visitor industry is estimated to be 2,850 in 2009, similar in size to thewholesale or manufacturing sectors.
Thurston County has the ninth highest level of total visitor spending among the State’s 39
counties. On a per capita basis, however, Thurston County ranks 34 out of the 39counties.
Thurston County offers a wide variety of natural, cultural and historical attractionsincluding:
Museums and Historical Attractions
Parks Trails and Nature Preserves
Recreational Facilities including Marinas
Shops and Stores
Indoor Recreation and Entertainment
Farmers Market and Wineries
Various Performing Arts Organizations and Venues
Community Festivals and Events
Several of the attractions provide estimates of the total amount of visitation each year.
The Olympia Farmers Market reports that they serve over 400,000 visitors each
year over their 152 day season.
The Olympia Hands on Children’s Museum reported 298,797 visitors in 2015, ofwhich 119,229 were from outside Thurston County.
The Olympia Arts Alliance reported that in 2009, four performing artsorganizations in Downtown Olympia (Washington Center for the PerformingArts, State Theater operated by Harlequin Productions, Capitol Theater operated by Olympia Film Society, and Capitol Playhouse (since replaced by OlympiaFamily Theater) attracted 167,000 patrons.

8/17/2019 Downtown Olympia Market Analysis
http://slidepdf.com/reader/full/downtown-olympia-market-analysis 24/71
FINAL DRAFT: APRIL 25 2016
OLYMPIA DOWNTOWN STRATEGY MARKET ANALYSIS
PROPERTY COUNSELORS PAGE 23
III. DOWNTOWN PROFILE The characteristics of Downtown Olympia and the surrounding area provide anunderstanding of how the area currently performs and a starting point for identifying
future opportunities.
LAND USE Downtown Olympia is defined for the purposes of the Downtown Strategy as the areawest Plum Street, north of 11th SW and 14th SW, west of Capitol Lake, and north toinclude the Port of Olympia property (see Figure III-1 on the following page). The areaincludes approximately 500 acres of land.
The area includes over seven million square feet of buildings as determined by a recentinventory by the City. The amount of building area is equally distributed among groundfloor uses and upper floors.
Table III-1Land Use by Type-Commercial Core
Source: City of Olympia, Economic Development and Land Use Inventory.
Office is the most prominent use, followed by residential and retail. Much of the retailspace is located on the ground floor. Most of the residential and office space is on upperfloors.
Ground Floor Upper Floor Total
Retail 910,619 179,738 1,090,357
Office 903,024 1,877,536 2,780,561
Arts/Culture 77,352 94,123 171,475
Lodging 79,897 186,647 266,544
Residential 511,478 810,079 1,321,557
Industrial 647,940 56,038 703,978
Religious 76,240 51,995 128,236 Blight 70,409 35,441 105,850
Vacant 213,806 236,743 450,549
Total 3,490,766 3,528,340 7,019,107

8/17/2019 Downtown Olympia Market Analysis
http://slidepdf.com/reader/full/downtown-olympia-market-analysis 25/71
OLYMPIA DOWNTOWN STRATEGY MARKET ANALYSIS
PROPERTY COUNSELORS PAGE 24
Figure III-1

8/17/2019 Downtown Olympia Market Analysis
http://slidepdf.com/reader/full/downtown-olympia-market-analysis 26/71
OLYMPIA DOWNTOWN STRATEGY MARKET ANALYSIS
PROPERTY COUNSELORS PAGE 25
POPULATION
The Downtown area encompasses two census block groups as defined by the US CensusBureau. Block Group 1 of Census Tract 101 is defined as the area north of Legion, andBlock Group 2 of Tract 101 is the area south of Legion. (See Figure III-2.) Population
characteristics for the two block groups according to the 2010 census is summarized inTable III-2
Table III-2Population Characteristics Downtown Block Groups
Census Tract 101
As shown the total population of downtown in 2010 was approximately 1,800, anincrease of 21% over the previous decade. Block Group 2 has the greater population ofthe two, and grew at a faster rate over the decade. Block Group 1 has a significantlyhigher median age, lower household size and lower median income.
Block Group 1 Block Group 2 Total
(no. of Legion) (so. of Legion)
Population
2000 667 809 1,476
2010 774 1,005 1,779
% Growth 16% 24% 21%
Characteristics 2010
Median Age 57.1 32.6
% Male 43.3% 56.1%
Avg. HH size 1.18 1.42
Median Income $14,319 $31,994

8/17/2019 Downtown Olympia Market Analysis
http://slidepdf.com/reader/full/downtown-olympia-market-analysis 27/71
OLYMPIA DOWNTOWN STRATEGY MARKET ANALYSIS
PROPERTY COUNSELORS PAGE 26
Figure III-2Downtown Block Groups 1 and 2 Census Tract 101
HOUSING
There is a mix of subsidized and market rate housing in Downtown Olympia. Figure III-2 provides a summary of the number of units of units by type. Overall there are 931 unitsof low and moderate income units (both subsidized and low cost) and 714 market rateunits. The latter number includes 299 units currently under construction. The number of
units under construction represents almost 20% of the total units downtown. These unitsrepresent a significant shift in the balance between low and moderate income and marketrate units.

8/17/2019 Downtown Olympia Market Analysis
http://slidepdf.com/reader/full/downtown-olympia-market-analysis 28/71
OLYMPIA DOWNTOWN STRATEGY MARKET ANALYSIS
PROPERTY COUNSELORS PAGE 27
Figure III-2
BUSINESS MIX The land use inventory also provides information on the mix of businesses by type. Thedistribution is summarized in Figure III-3. The largest single cluster in terms of squarefeet is restaurants. Including bars and coffee shops/bakeries, the food service clusterrepresents one-third of total retail space downtown. General retail and boutiques is thesecond largest single category. Together with furniture, apparel, art, antiques, books, and jewelry, specialty retail makes up almost 30% of total space. There is only one grocerystore and no stand-alone drug store.
721
210
261
66
88
299
-
100
200
300
400
500
600
700
800
900
1,000
Low Moderate Income Market Rate
Downtown Housing Inventory-by Type and
Cost Level
Directly Subsidized Unsubsidized Low Cost
Existing Market Rate Multifamily Existing Market Rate Single Family
Live-aboard Marina Under Construction-Market Rate

8/17/2019 Downtown Olympia Market Analysis
http://slidepdf.com/reader/full/downtown-olympia-market-analysis 29/71
OLYMPIA DOWNTOWN STRATEGY MARKET ANALYSIS
PROPERTY COUNSELORS PAGE 28
Figure III-3

8/17/2019 Downtown Olympia Market Analysis
http://slidepdf.com/reader/full/downtown-olympia-market-analysis 30/71
OLYMPIA DOWNTOWN STRATEGY MARKET ANALYSIS
PROPERTY COUNSELORS PAGE 29
TAXABLE SALES AND BUSINESS PERFORMANCE
Economic activity downtown can also be expressed in terms of taxable sales. Whilethere are many sectors whose activities aren’t subject to the retail sales tax, retail tradeand many services are. Table III-3 summarizes the levels of taxable retail sales for
Downtown Olympia and the City as a whole in 2014. The figures were derived fromCity data. Sectors were combined as necessary to meet the non-disclosure requirementthat data not be shown for categories with fewer than three businesses.
Table III-3Downtown and Olympia Sales Tax Collections 2014
Source: City of Olympia Finance Department
The largest sectors in Downtown are Food Services and Drinking Places, MiscellaneousRetail, and Food and Beverage combined with Convenience Stores. Table III-4 also
shows Downtown sales as a share of city-wide sales. Downtown sales represented only4.6% of city-wide retail trade and 21% of selected services. Downtown has the largestshares for Nonstore Retailers, Personal Services, Miscellaneous Retailers,Arts/Entertainment/Recreation, and Foods Services.
Sales Tax
Downtown
2014
Sales Tax
Olympia 2014 Share
Retail Trade
441 Motor Vehicle and Parts Dealers 47,970 3,845,786 1.2%442 Furniture and Home Furnishings Stores 23,834 274,614 8.7%
443 Electronics and Appliance Stores 4,871 279,663 1.7%
444 Building Material and Garden Equipment and Supplies Dealers 12,867 685,589 1.9%
445/447 Food and Beverage and Convenience Stores 93,515 640,466 14.6%
446 Health and Personal Care Stores 1,835 237,676 0.8%
448 Clothing and Clothing Accessories Stores 40,737 600,773 6.8%
451 Sporting Goods, Hobby, Musical Instrument, and Book Stores 43,545 446,065 9.8%
452 General Merchandise Stores 2 1,392,572 0.0%
453 Miscellaneous Store Retailers 131,937 513,649 25.7%
454 Nonstore Retailers 7,992 21,043 38.0%
Subtotal Retail Trade 409,106 8,937,895 4.6%
Selected Services
711/712/7 Arts Entertainment and Recreation 11,418 51,292 22.3%
722 Food Services and Drinking Places 406,601 1,826,605 22.3%811 Repair and Maintenance 46,900 310,013 15.1%
812 Personal and Laundry Services 14,848 52,047 28.5%
Subtotal Selected Services 479,767 2,239,957 21.4%
Total Retail Trade and Selected Services 888,873 11,177,852 8.0%
Other Services 73,187 891,418 8.2%
Other Sectors 328,842 1,546,930 21.3%
Total 1,290,902 13,616,199 9.5%

8/17/2019 Downtown Olympia Market Analysis
http://slidepdf.com/reader/full/downtown-olympia-market-analysis 31/71
OLYMPIA DOWNTOWN STRATEGY MARKET ANALYSIS
PROPERTY COUNSELORS PAGE 30
Business performance can also be measured as sales efficiency or sales per square foot of building area. Table III-4 summarizes sales efficiency by business sector.
Table III-4Downtown Business Sales Performance
Source: Property Counselors
The overall performance for retail trade and selected services is $147 per square foot.This figure is lower than the $200 average for shopping centers, it is higher than the $100average for older downtown areas. The figures for individual sectors vary greatly. In
some cases the results may be due to inconsistencies between the building classificationsand sales classifications.
PERCEPTIONS The Thurston County Economic Development Council conducted a survey of downtownOlympia businesses as part of a business outreach program. 104 businesses completedthe survey out of 465 targeted businesses, a response rate of 22.4%. The responding businesses represented a cross section of retail, office, food and entertainment, industrialand personal service businesses. The results were summarized in an Executive Summarythat provides extensive information on business performance and business perceptions.
The results are further summarized below.
Businesses identified their primary markets as 35% local (within 10 mile radius),50% regional, and 19% national or international.
69% of businesses indicated their business were either emerging or growing, 30%as growing and 5% as declining.
Sales
Downtown
2014
Taxable /
Gross Sales
Gross Sales
Downtown
2014
Downtown
Sq. Ft.
Sales per
Square Foot
Retail Trade
441 Motor Ve hicle and Pa rts Dea le rs 5,710,725 7 8.6% 7,266,762 -
442 Furni tu re and Home Furnishings Stores 2 ,837 ,375 9 0.9% 3,122,270 60,531 $52
443 Elec tronics and Applia nce Stores 579,911 80.8% 717,981
444 Building Material and Garden Equipment and Supplies Dealers 1,531,796 9 3.5% 1,638,534 30,423 $54
445/447 Food and Beverage and Convenience Stores 11,132,764 46,653,547 40,712 $1,146
446 Health and Personal Care Stores 218,487 29.3% 744,947
448 Clo thing and Clothing Accessories Stores 4 ,849 ,696 8 2.5% 5,880,154 40,741 $144
451 Sporting Goods, Hobby, Musical Instrument, and Book Stores 5,183,960 8 5.3% 6,079,198 20,820 $292
452 General Merchandise Stores 200 46.1% 433 -
453 Misce llaneous Store Re ta ile rs 15,706,765 74 .2% 21,178,388 236,705 $89
454 Nonstore Retailers 951,374 5 1.6% 1,843,767 -
Subtotal Retail Trade 48,703,054 54 .6% 95,125,981 470,644 $202
Selected Services711/712/713 Arts Entertainment and Recreation 1,359,252 1,468,903 112,649 $13
722 Food Services and Drinking Places 48,404,898 96 .7% 50,069,715 345,313 $145
811 Repair and Maintenance 5,583,383 8 3.1% 6,721,266 87,703 $77
812 Personal and Laundry Services 1,767,588 9 1.2% 1,938,347 39,496 $49
Subtotal Selected Services 57,115,121 60,198,231 585,161 $103
Total Retail Trade and Selected Services 105,818,175 155,324,213 1,055,806 $147
Other Services 8,712,790
Other Sectors 39,147,812
Total 153,678,777

8/17/2019 Downtown Olympia Market Analysis
http://slidepdf.com/reader/full/downtown-olympia-market-analysis 32/71
OLYMPIA DOWNTOWN STRATEGY MARKET ANALYSIS
PROPERTY COUNSELORS PAGE 31
63% of businesses identified their sales as growing, 30% as stable, and 6% asdeclining.
15% of businesses own their buildings, while 85% lease.
30% of businesses plan to expand in the next three years.
The aspects of Downtown that work well for businesses are: high visibility, foottraffic, and being part of the downtown community.
The aspects of Downtown that do not work well are availability of parking, perception of safety and security, homelessness and vagrancy, open drug abuseand refuse, and overall cleanliness.
The types of businesses or uses that respondents would like to see locate indowntown include another local grocer, pharmacy, small electronics,artisan/craft/and boutiques shops, service related businesses, and communityswim pool.

8/17/2019 Downtown Olympia Market Analysis
http://slidepdf.com/reader/full/downtown-olympia-market-analysis 33/71
OLYMPIA DOWNTOWN STRATEGY MARKET ANALYSIS
PROPERTY COUNSELORS PAGE 32
IV. DEMAND FOR R ETAIL Downtown offers the potential to serve both the local residents and employees, and thelarger regional market area. The potential demand for retail development at the site is
presented in three subsections:
Current Retail DemandExisting DevelopmentPotential Retail Demand
CURRENT R ETAIL DEMAND
The best available measure of retail demand is taxable retail sales data collected by theState of Washington. Table IV-1 summarizes the trends in taxable retail sales for retailtrade and selected services in Olympia. The selected services are those that are typically
provided in a retail environment. As shown, total taxable retail sales in these sectorsgrew from $1.10 billion in 2004 to $1.24 billion in 2014, an annual average growth rateof 1.2 percent, well below the rate of inflation for the period of approximately 2.4%.Retail trade grew at .8% percent while the selected services grew at 3.4 percent.Automobiles, Food Services, General Merchandise, and Building Materials were thelargest sectors. The fastest growing sectors were E-commerce, Arts and Entertainment,Drug Stores and Convenience Stores.
Retail trends differed in other cities in the county. Trends in total retail trade and selectedservices are shown for the major cities and the remainder of the county in Figure IV-1.As shown Olympia lost retail sales over the period 2007 to 2009, but has shown steady
growth since then.

8/17/2019 Downtown Olympia Market Analysis
http://slidepdf.com/reader/full/downtown-olympia-market-analysis 34/71
FINAL DRAFT: APRIL 25 2016
OLYMPIA DOWNTOWN STRATEGY MARKET ANALYSIS
PROPERTY COUNSELORS PAGE 33
Table IV-1
Taxable Retail Sales TrendsOlympia
Source: Washington State Department of RevenueProperty Counselors
2004 2005 2006 2007 2008 2009 2010 2011 2012 2013 2014 Avg. Ann. Gr.
Industry
Motor Vehicles & Parts $ 33 4,1 84,0 19 $ 351 ,47 6,74 9 $ 34 3,7 56,0 30 $ 337 ,56 7, 27 2 $2 67 ,2 36 ,78 2 $ 23 5, 69 7,5 20 $2 56 ,6 84 ,89 4 $ 27 1,4 78,5 93 $ 304 ,32 3, 95 4 $3 28 ,7 01 ,9 67 $ 37 1, 91 0,8 15 1 .1 %
Furniture & Home Furnishing 24,507,600 35,541,361 39,634,525 41,574,055 36,928,897 34,637,345 35,319,884 33,549,589 35,533,426 35,362,334 36,095,927 3.9%
Electronics & Appliances 72,595,249 79,495,578 77,268,493 80,839,803 88,431,808 63,004,500 55,312,327 60,604,858 57,069,519 69,749,924 61,019,061 -1.7%
Building Materials, Garden Equip & Supplies 134,626,184 136,740,045 134,345,199 125,336,208 95,588,126 80,555,134 80,054,154 77,577,382 80,903,031 84,419,192 86,216,885 -4.4%
Food & Beverage Stores 49,729,231 51,032,810 52,621,210 52,573,980 52,299,345 53,927,317 59,428,780 56,715,141 56,746,798 58,964,927 65,054,962 2.7%
Drug/health Stores 18,462,403 19,693,125 18,678,117 20,335,353 19,794,341 23,550,523 25,227,709 24,981,988 26,122,721 26,384,421 28,794,965 4.5%
Gas Stations & Convenience Stores W/pumps 10,489,160 13,450,035 15,281,715 15,432,881 13,987,134 13,657,175 14,874,798 15,492,849 15,977,718 16,371,473 15,880,531 4.2%
Apparel & Accessories 56,019,262 54,394,280 59,454,023 73,893,464 66,225,379 61,087,123 65,258,919 64,494,892 69,484,897 73,969,832 73,292,699 2.7%
Sporting Goods, Toys, Book & Music Stores 52,124,313 52,084,761 52,957,677 57,408,988 56,084,270 50,847,703 55,184,196 54,782,175 53,199,949 51,750,058 54,718,098 0.5%
General Merchandise Stores 95,335,628 99,887,852 104,870,816 101,577,020 100,166,570 107,196,316 106,160,408 103,599,669 95,814,649 95,979,775 96,104,047 0.1%
E-commerce & Mail Order 5,968,855 8,347,477 8,350,875 10,691,458 12,217,820 14,669,997 17,550,716 18,756,713 22,019,348 24,402,269 25,491,014 15.6%
Miscellaneous Retailers 68,887,486 89,875,466 94,161,179 98,387,790 101,011,089 90,976,305 87,884,265 86,620,307 82,764,128 88,433,325 83,462,168 1.9%
Total Retail Trade 922,929,390 992,019,539 1,001,379,859 1,015,618,272 909,971,561 829,806,958 858,941,052 868,654,156 899,960,138 954,489,497 998,041,172 0.8%
Arts, Entertainment & Recreation 6,712,626 6,739,644 6,973,363 8,380,497 10,431,736 9,050,194 8,859,202 9,270,156 8,445,722 12,131,130 13,331,271 7.1%
Accommodations 14,320,785 15,085,717 16,828,804 18,250,629 16,843,492 14,919,207 14,355,135 14,180,212 15,014,124 14,939,151 16,917,118 1.7%
Food Services 113,868,343 117,703,669 122,747,291 135,480,673 135,960,117 131,888,951 132,950,136 133,095,535 142,989,862 153,138,492 164,381,733 3.7%
Repair & Maintenance 33,670,197 49,674,623 62,905,197 74,714,380 53,339,225 39,984,952 38,959,651 39,942,428 39,856,991 39,588,668 40,745,346 1.9%
Personal Services 7,045,847 7,401,964 8,116,412 8,166,885 8,683,118 8,555,331 8,170,301 8,622,753 9,573,721 9,463,095 9,864,785 3.4%
Subtotal Selected Services 175,617,798 196,605,617 217,571,067 244,993,064 225,257,688 204,398,635 203,294,425 205,111,084 215,880,420 229,260,536 245,240,253 3.4%
Total Retail Trade and Selected Services 1 ,098 ,547 ,188 1 ,188 ,625 ,156 1 ,218 ,950 ,926 1 ,260 ,611 ,336 1 ,135 ,229 ,249 1 ,034 ,205 ,593 1 ,062 ,235 ,475 1 ,073 ,765 ,240 1 ,115 ,840 ,558 1 ,183 ,750 ,033 1 ,243 ,281 ,425 1 .2%

8/17/2019 Downtown Olympia Market Analysis
http://slidepdf.com/reader/full/downtown-olympia-market-analysis 35/71
FINAL DRAFT: APRIL 25 2016
OLYMPIA DOWNTOWN STRATEGY MARKET ANALYSIS
PROPERTY COUNSELORS PAGE 34
Figure IV-1
Source: Washington State Department of RevenueProperty Counselors
$0
$200,000,000
$400,000,000
$600,000,000
$800,000,000
$1,000,000,000
$1,200,000,000
$1,400,000,000
2004 2005 2006 2007 2008 2009 2010 2011 2012 2013 2014
Taxable Sales Trends by City 2004-2014Retail Trade and Selected Services
Tumwater Lacey Olympia Other Thurston

8/17/2019 Downtown Olympia Market Analysis
http://slidepdf.com/reader/full/downtown-olympia-market-analysis 36/71
OLYMPIA DOWNTOWN STRATEGY MARKET ANALYSIS
PROPERTY COUNSELORS PAGE 35
EXISTING DEVELOPMENT
Retail development has become a highly segmented product, based on types of goods andgeographic features of market areas. Table IV-2 on the following page provides a
description of several types of shopping centers. Of the ten types shown in the table, theneighborhood, community and strip shopping centers serve local market areas of fewerthan 100,000 people, while the remaining types serve larger regional market areas. Themajor retail developments are described by type below.
R EGIONAL R ETAIL
There are two regional shopping centers in Thurston County, as shown in Table IV-3.Both centers offer 600,000 square feet or more in gross leasable area. Both feature a mixof national and regional tenants. Capital Mall is a true regional shopping center with atenant mix that mirrors that found in a Lifestyle Center. It offers many of the popular
national apparel retailers such as American Eagle, Eddie Bauer, The Gap, Old Navy,Zumiez, and Victoria’s Secret. It also offers popular Mac Store and REI outlets, as wellas the 14-screen Century Cinema. There are additional large retailers such as Target onadjacent sites.
South Sound Center was converted to a Power Center in 2001 with the enclosed interior portion of the mall replaced by large retailers.
There are three other concentrations of big box retailers in the County.
Littlerock Road in Tumwater. Several large format retailers have located inTumwater west of I-5 including Fred Meyer, Costco, Home Depot, and Walmart.
Hawk’s Prairie. This area at the Marvin Road exit from I-5 in Lacy has attractedCostco, Walmart, Cabela’s, Big Five and Harley Davidson.
Martin Way in Olympia. This area offers a Lowe’s Home Improvement Center and
a Hobby Lobby and Tractor Supply in a former K-Mart store.

8/17/2019 Downtown Olympia Market Analysis
http://slidepdf.com/reader/full/downtown-olympia-market-analysis 37/71
OLYMPIA DOWNTOWN STRATEGY MARKET ANALYSIS
PROPERTY COUNSELORS PAGE 36
Table IV-2Types of Shopping Centers
Neighborhood Shopping Center Lifestyle Center Anchors Supermarket and drug store Anchors Restaurants, furnishings, apparelNumber of Stores 10-40 stores Number of Stores 50 – 100Total Retail Space 30,000-100,000 square feet Total Retail Space 250,000 - 400,000Site Area 3-10 acres Site Area 10 – 50Market Area Population 10,000-30,000 people Market Area Population 250,000 – 500,000Market Area Radius 1-3 miles Market Area Radius 12 – 50 miles
Community Shopping Center Off-Price Center
Anchors Junior department or discount store Anchors Off-price/discount storeNumber of Stores 25-80 stores Number of Stores 20-60 storesTotal Retail Space 100,000-450,000 square feet Total Retail Space 100,000-500,000 square feetSite Area 10-30 acres Site Area 5-15 acresMarket Area Population 30,000-75,000 people Market Area Population 80,000-250,000 peopleMarket Area Radius 3-8 miles Market Area Radius 6-15 miles
Regional Shopping Center Specialty Center Anchors 1 or 2 full-line department stores Anchors Specialty/theme retailer(s)Number of Stores 50-100 stores Number of Stores varies widelyTotal Retail Space 300,000-750,000 square feet Total Retail Space varies widelySite Area 30-50 acres Site Area varies widelyMarket Area Population 100,000-250,000 people Market Area Population varies widelyMarket Area Radius 8-15 miles Market Area Radius varies widely
Super-Regional Shopping Center Outlet Center Anchors 3 or more full-line department stores Anchors Manufacturer’s outlet stores Number of Stores 100-300 stores Number of Stores 30-100 storesTotal Retail Space 600,000-2,000,000 square feet Total Retail Space 200,000-800,000 square feet
Site Area 40-100 acres Site Area 5-50 acresMarket Area Population 250,000-600,000 people Market Area Population 200,000-600,000 peopleMarket Area Radius 12-50 miles Market Area Radius over 50 miles
Strip Retail Center Power Center Anchors Convenience grocery AnchorsNumber of Stores 3-20 stores Number of Stores 10-20 stores (mainly large retailers)Total Retail Space 10,000-30,000 square feet Total Retail Space 250,000-800,000 square feetSite Area 1-3 acres Site Area 20-50 acresMarket Area Population under 20,000 people Market Area Population 250,000-500,000 peopleMarket Area Radius under 2 miles Market Area Radius 12-50 miles
Sources: Urban Land Institute, Dollars and Cents of Shopping CentersProperty Counselors

8/17/2019 Downtown Olympia Market Analysis
http://slidepdf.com/reader/full/downtown-olympia-market-analysis 38/71
OLYMPIA DOWNTOWN STRATEGY MARKET ANALYSIS
PROPERTY COUNSELORS PAGE 37

8/17/2019 Downtown Olympia Market Analysis
http://slidepdf.com/reader/full/downtown-olympia-market-analysis 39/71
OLYMPIA DOWNTOWN STRATEGY MARKET ANALYSIS
PROPERTY COUNSELORS PAGE 38
Table IV-3Regional Shopping Centers in Thurston County
Name Location Sq. Ft. Year Built Total Stores Anchors Other Major Tenants
Westfield Capital Mall West Olympia 770,000 19782006expansion
120 Macy’s JC PenneyCenturyCinemaTJ Maxx(future)
American EagleBed Bath and BeyondBest BuyChico’s Coldwater CreekEddie BauerFoot LockerForever 21The GapGNCHollisterMac StoreOld NavyREITalbotsVictoria’s Secret Walking CompanyZumiez
South Sound Center Lacey 595,000 19662003
39 TargetSearsKohl’s
Marshal’s PetSmart
Applebee’s Carl’s Jr. Famous Footwear
HallmarkMerle NormanRadio ShackRed WingRite AidSkippersTaco BellVerizon
Source: Property Counselors

8/17/2019 Downtown Olympia Market Analysis
http://slidepdf.com/reader/full/downtown-olympia-market-analysis 40/71
OLYMPIA DOWNTOWN STRATEGY MARKET ANALYSIS
PROPERTY COUNSELORS PAGE 39
NEIGHBORHOOD SCALE R ETAIL
Neighborhood scale retail is typically anchored by a supermarket and drugstore, withvarious smaller convenience retail outlets. There are ten grocery stores in Olympia.
Safeway 3215 Harrison4280 Martin Way
Bayview ThriftwayRalph’s Thriftway
516 4 Avenue W.1908 4th Avenue E.
Trader Joe’s 1530 Black LakeGrocery Outlet 2100 Harrison NWHaggen
Olympia Food Coop
1313 Cooper Point Rd.3520 Pacific Ave.921 Rogers St. NW3111 Pacific Ave. SE.
There are other grocery chains with stores in the region: QFC in Lacey, Albertsons inTumwater, Fred Meyer in Tumwater and Lacey, and Walmart in Tumwater, Lacey, andYelm.
There are two stand-alone drugstores in Olympia: Walgreens and Rite-Aid, both onCooper Point Road. There are also pharmacy departments in many of the grocery storesand medical centers.
CINEMA/ENTERTAINMENT
Thurston County is currently served by three major multiscreen theaters: the 16 screen
Regal Cinema on Martin Way, the 14 screen Century Cinema at Capital Mall and theeight screen Yelm Cinemas at Prairie Park. The Capitol Theater in downtown Olympiaincludes a single screen and is run by the Olympia Film Society. Based on the nationalaverage of .13 screens per 1,000 population, Thurston County could support a total of 33screens. The existing 39 screens exceed this number.
There are three major performance venues in Downtown Olympia, the 1,000 seatWashington Performing Arts Center, and the State Theater with the Harlequin Players,and the Olympia Family Theater. The three provide live theater, music, and dance performances. Several downtown bars offer live music and entertainment as well.
The Great Wolf Lodge offers a family entertainment center as part of a convention hotelin Grand Mound. The development offers a water park, arcade and fitness center.
SPECIALTY R ETAIL
Downtown Olympia serves as a specialty retail district. Food service is the most stronglyrepresented with a range from fine dining restaurants to small ethnic restaurants. Further,
8/17/2019 Downtown Olympia Market Analysis
http://slidepdf.com/reader/full/downtown-olympia-market-analysis 41/71
OLYMPIA DOWNTOWN STRATEGY MARKET ANALYSIS
PROPERTY COUNSELORS PAGE 40
the Farmers Market provides food services during the times it is open. The Marketattracts over 400,000 visitors each year. There are several galleries and design businesses. The galleries and related businesses are the focus of the Art Walk events heldtwice each year. There are major furniture stores offering a broad inventory of goods.There are specialty retailers including books, outdoor equipment, and apparel stores. The
businesses are located in a variety of settings including historic buildings, new multi-use buildings, and venues along the Olympia waterfront. Neither Tumwater nor Laceycurrently offers a specialty retail concentration comparable to downtown Olympia.
R ETAIL R ENTAL R ATES
Prevailing retail rents vary with location, and building age/condition. Table IV-4summarizes current asking rents for selected properties in Olympia. The highest rents arein newer buildings, with some exceeding $20 per square foot. The highest rents shownare in a proposed building such as 340 SE Cleveland or in West Olympia. Several proposed or new buildings are being marketed in Lacey. Rents in these buildings are
generally in the range of $22 to $27 per square foot per month. These rents reflect therates necessary to recover the investment in new buildings.
The asking rents for several established retail buildings typically fall in the range of $15to $20 per square foot. There are many buildings with rents below these levels, particularly in Downtown Olympia. Such rents provide opportunities for new businessesto become established and grow over time.

8/17/2019 Downtown Olympia Market Analysis
http://slidepdf.com/reader/full/downtown-olympia-market-analysis 42/71
OLYMPIA DOWNTOWN STRATEGY MARKET ANALYSIS
PROPERTY COUNSELORS PAGE 41
Table IV-4Selected Retail Rents in Thurston County
* Rents are /sq. ft. / yr.
Source: Commercial Brokers Association, Property Counselors
Address Total Sq. Ft. v ailable Sq. F Asking Rent Expenses*
112 State 112 State 4,400 4,400 $12-15 Mod Gr.
116 Legion 116 Legion Mixed Use 2,200 $12 Fully Serv.
225 State St. 225 State Street 7,200 5,600 $10.25 Mod Gr.
340 SE Cleveland (proposed) 340 SE Cleveland 13,032 13,032 $18-22 NNN
500 Capitol Way S. 500 Capitol Way S. 7,089 1,900 $19 NNN
521 Building 521 Capitol Way 10,800 10,800 $16 NNN
825 Legion 825 Legion 6,229 6,229 $14-15 Mod Gr.
826 Union 826 Union 6,200 1,120 $20 NNN
Black Lake Village 2615 Capitol Mall 45,842 8,259 $16 NNN
Capitol Square 2703 Capitol Mall 19,343 3,713 $9.50 NNN
Capitol Theater 204 5th 14,796 1,057 $12.50 NNN
Capitol Village shopping 400 Cooper Pt. 158,486 14,411 18 NNN
Carnegie Building 620 Franklin 10,000 10,000 $18 NNN
Condos at Cooper Point 405 Cooper Pt. 7,887 2,628 $18 NNN
Cooper Point Pavilion 1500 Cooper Pt. 90,600 14,958 $18-24 NNNCooper Point Village 345 Building 345 Cooper Pt. 6,992 1,300 $24 NNN
Cooper Point Village Building 3 315 Cooper Pt. 6,992 1,139 $24 NNN
Corner Shops 200 Division 14,624 4,507 $13 NNN
Grocery Outlet 3100 Harrison 51,300 4,919 $16 NNN
Johnson Center 3530 Martin Way Mixed Use 2,225 $12 Mod Gr.
JV Health Foods 3720 Pacific 3,832 1,700 $16-20 NNN
Kenwood Plaza 6790 Martin Way 12,000 9,380 $18 NNN
Martin Way Plaza 2837 Martin Way 23,673 2,925 $15 NNN
NAPA Building 1319 Fones Way 8,000 8,000 $12 Fully Serv.
Olympia Press 109 State 27,000 23,533 $6.98-25.50 NNN
Olympia Square 3315 Pacific 168,209 19,554 $15-19 NNN
Parkwood Plaza 3330 Pacific 14,700 6,684 $17 NNN
Sherwin Williams Plaza 3959 Martin Way 16,542 2,000 $19 NNNStadium Plaza 3700 Martin Way 19,248 4,505 $14.50 NNN
Swantown Boatworks 700 Marine 20,910 3,000 $12 NNN
Toyota of Olympia 2225 Carriage 40,000 40,000 $18 NNN
West Olympia Shopping Center 1001 Cooper Pt. 51,029 3,723 $45 NNN
Westgate 2411 Harrison 10,931 1,200 $16 NNN
Westside Mini Mall 2101 Harrison 13,683 4,569 $13.82 NNN
* NNN-Tenant pays expenses. Modified Gross-Landlord pays taxes and insurance.

8/17/2019 Downtown Olympia Market Analysis
http://slidepdf.com/reader/full/downtown-olympia-market-analysis 43/71
OLYMPIA DOWNTOWN STRATEGY MARKET ANALYSIS
PROPERTY COUNSELORS PAGE 42
POTENTIAL R ETAIL DEMAND
Future retail opportunities reflect the convergence of consumer needs and retailer
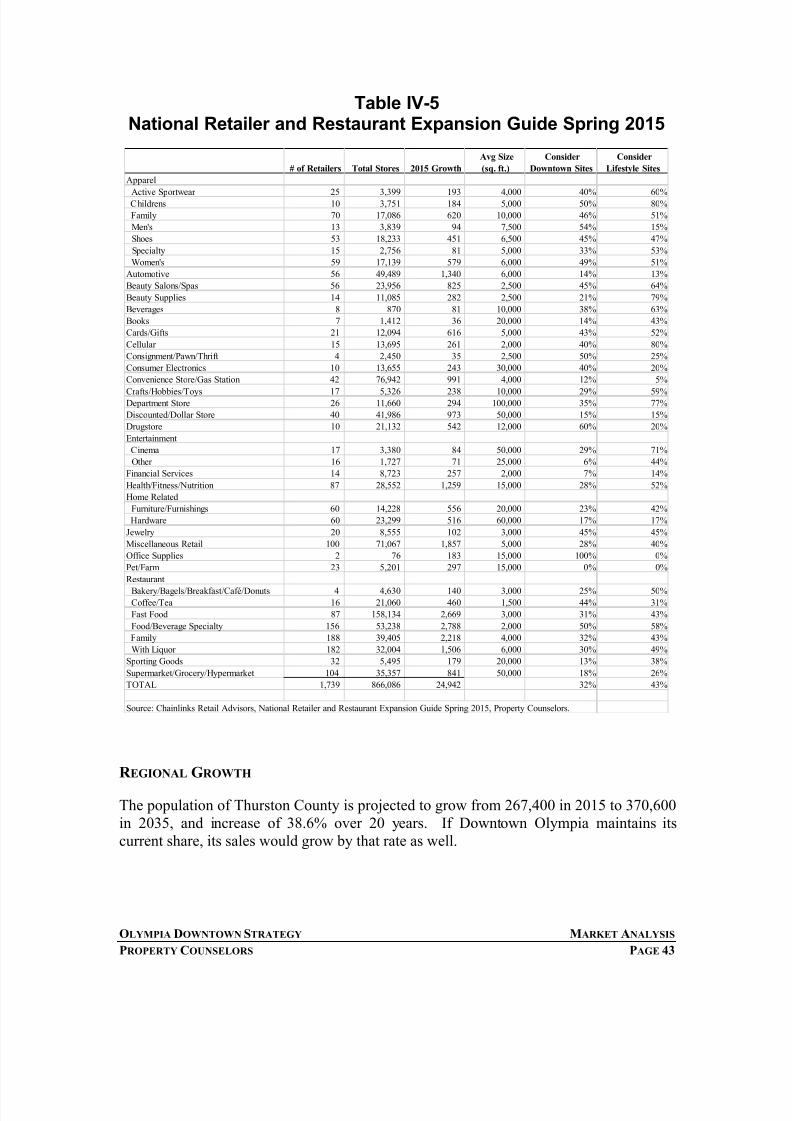
expectations. Opportunities will include growth in existing clusters and new businessesto fill existing gaps. Downtown is in the middle of a regional trade area comprisingThurston, Mason, Lewis and Grays Harbor counties, with a total trade area population ofalmost 500,000. As described earlier, there are existing retail centers that serve some ofthe needs of this regional trade area. Downtown Olympia has strength in several sectorsthat reflect the typical tenant mix of a Lifestyle retail center: furniture, apparel, foodservices and miscellaneous retail. Table IV-5 provides a summary of expansionexpectations for retailers in various retail categories. These expectations arerepresentative of the needs and requirements of major established retailers. They also provide a starting point for identifying retail opportunities in Downtown Olympia.
The information in the table represents the results of surveys by Chainlinks RetailAdvisors for 1,700 retailers with 870,000 stores. The retailers shown expect to add25,000 new stores in 2015. In many cases the retailers are looking for sites in traditionalretail centers. In many cases they are interested in downtown sites or lifestyle centers.The final columns in the table indicate the percentage of retailers in each category thatare interested in those locations. The categories that show the most interest in Downtownsites are apparel, automotive, cards/gifts, cellular, consignment, consumer electronics,drugstore, jewelry, office supply, and restaurants. The categories with the most interestin lifestyle centers are Apparel, beauty, cards/gifts, consumer electronics, crafts,department store, cinema, health, furniture, jewelry, miscellaneous retail, and restaurants.These sectors represent potential growth sectors for Downtown Olympia.
Growth in demand for retail in Downtown will come from three sources: growth in theregional market, increase in capture in selected segments, and additional spending bydowntown residents.
8/17/2019 Downtown Olympia Market Analysis
http://slidepdf.com/reader/full/downtown-olympia-market-analysis 44/71
OLYMPIA DOWNTOWN STRATEGY MARKET ANALYSIS
PROPERTY COUNSELORS PAGE 43
Table IV-5National Retailer and Restaurant Expansion Guide Spring 2015
R EGIONAL GROWTH
The population of Thurston County is projected to grow from 267,400 in 2015 to 370,600in 2035, and increase of 38.6% over 20 years. If Downtown Olympia maintains itscurrent share, its sales would grow by that rate as well.
# of Retailers Total Stores 2015 Growth
Avg Size
(sq. ft.)
Consider
Downtown Sites
Consider
Lifestyle Sites
Apparel
Active Sportwear 25 3,399 193 4,000 40% 60% Childrens 10 3,751 184 5,000 50% 80%
Family 70 17,086 620 10,000 46% 51%
Men's 13 3,839 94 7,500 54% 15%
Shoes 53 18,233 451 6,500 45% 47%
Specialty 15 2,756 81 5,000 33% 53%
Women's 59 17,139 579 6,000 49% 51%
Automotive 56 49,489 1,340 6,000 14% 13%
Beauty Salons/Spas 56 23,956 825 2,500 45% 64%
Beauty Supplies 14 11,085 282 2,500 21% 79%
Beverages 8 870 81 10,000 38% 63%
Books 7 1,412 36 20,000 14% 43%
Cards/Gifts 21 12,094 616 5,000 43% 52%
Cellular 15 13,695 261 2,000 40% 80%
Consignment/Pawn/Thrift 4 2,450 35 2,500 50% 25%
Consumer Electronics 10 13,655 243 30,000 40% 20%
Convenience Store/Gas Station 42 76,942 991 4,000 12% 5%
Crafts/Hobbies/Toys 17 5,326 238 10,000 29% 59%Department Store 26 11,660 294 100,000 35% 77%
Discounted/Dollar Store 40 41,986 973 50,000 15% 15%
Drugstore 10 21,132 542 12,000 60% 20%
Entertainment
Cinema 17 3,380 84 50,000 29% 71%
Other 16 1,727 71 25,000 6% 44%
Financial Services 14 8,723 257 2,000 7% 14%
Health/Fitness/Nutrition 87 28,552 1,259 15,000 28% 52%
Home Related
Furniture/Furnishings 60 14,228 556 20,000 23% 42%
Hardware 60 23,299 516 60,000 17% 17%
Jewelry 20 8,555 102 3,000 45% 45%
Miscellaneous Retail 100 71,067 1,857 5,000 28% 40%
Office Supplies 2 76 183 15,000 100% 0%
Pet/Farm 23 5,201 297 15,000 0% 0%
Restaurant
Bakery/Bagels/Breakfast/Café/Donuts 4 4,630 140 3,000 25% 50% Coffee/Tea 16 21,060 460 1,500 44% 31%
Fast Food 87 158,134 2,669 3,000 31% 43%
Food/Beverage Specialty 156 53,238 2,788 2,000 50% 58%
Family 188 39,405 2,218 4,000 32% 43%
With Liquor 182 32,004 1,506 6,000 30% 49%
Sporting Goods 32 5,495 179 20,000 13% 38%
Supermarket/Grocery/Hypermarket 104 35,357 841 50,000 18% 26%
TOTAL 1,739 866,086 24,942 32% 43%
Source: Chainlinks Retail Advisors, National Retailer and Restaurant Expansion Guide Spring 2015, Property Counselors.
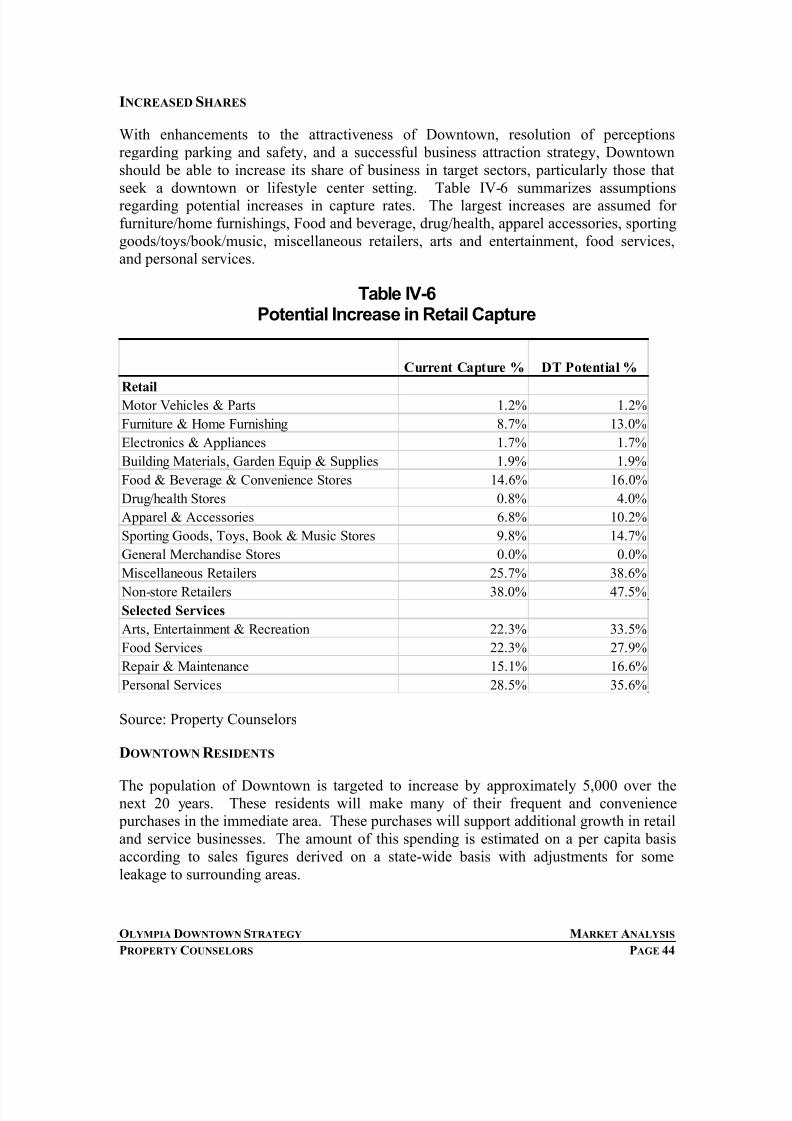
8/17/2019 Downtown Olympia Market Analysis
http://slidepdf.com/reader/full/downtown-olympia-market-analysis 45/71
OLYMPIA DOWNTOWN STRATEGY MARKET ANALYSIS
PROPERTY COUNSELORS PAGE 44
INCREASED SHARES
With enhancements to the attractiveness of Downtown, resolution of perceptionsregarding parking and safety, and a successful business attraction strategy, Downtownshould be able to increase its share of business in target sectors, particularly those thatseek a downtown or lifestyle center setting. Table IV-6 summarizes assumptionsregarding potential increases in capture rates. The largest increases are assumed forfurniture/home furnishings, Food and beverage, drug/health, apparel accessories, sportinggoods/toys/book/music, miscellaneous retailers, arts and entertainment, food services,and personal services.
Table IV-6 Potential Increase in Retail Capture
Source: Property Counselors
DOWNTOWN R ESIDENTS
The population of Downtown is targeted to increase by approximately 5,000 over thenext 20 years. These residents will make many of their frequent and convenience purchases in the immediate area. These purchases will support additional growth in retailand service businesses. The amount of this spending is estimated on a per capita basisaccording to sales figures derived on a state-wide basis with adjustments for someleakage to surrounding areas.
Current Capture % DT Potential %
RetailMotor Vehicles & Parts 1.2% 1.2%
Furniture & Home Furnishing 8.7% 13.0%
Electronics & Appliances 1.7% 1.7%
Building Materials, Garden Equip & Supplies 1.9% 1.9%
Food & Beverage & Convenience Stores 14.6% 16.0%
Drug/health Stores 0.8% 4.0%
Apparel & Accessories 6.8% 10.2%
Sporting Goods, Toys, Book & Music Stores 9.8% 14.7%
General Merchandise Stores 0.0% 0.0%
Miscellaneous Retailers 25.7% 38.6%
Non-store Retailers 38.0% 47.5%Selected Services
Arts, Entertainment & Recreation 22.3% 33.5%
Food Services 22.3% 27.9%
Repair & Maintenance 15.1% 16.6%
Personal Services 28.5% 35.6%

8/17/2019 Downtown Olympia Market Analysis
http://slidepdf.com/reader/full/downtown-olympia-market-analysis 46/71
OLYMPIA DOWNTOWN STRATEGY MARKET ANALYSIS
PROPERTY COUNSELORS PAGE 45
Table IV-7 presents the results of application of these factors. As shown, the total potential increase in sales is $152 million annually by 2035, an increase of approximately
100% over the period. Capture of regional growth represents the largest share if thisincrease, followed closely by increased downtown capture, as summarized in Figure IV-2. The sectors with the largest potential increase are Food Services, Food and Beverage,Miscellaneous Retail, and Apparel and Accessories.
Figure IV-2
Source: Property Counselors
Increased sales of this magnitude would support an additional 650,000 square feet ofretail space, an increase of approximately two-thirds over the current inventory.
Food & Beverage Stores $1,648
Drug/health Stores 909
Gas Stations & Convenience Stores W/pumps
Apparel & Accessories 749
Sporting Goods, Toys, Book & Music Stores 410
General Merchandise StoresE-commerce & Mail Order
Miscellaneous Retailers 1,148
Arts, Entertainment & Recreation 205
Food Services 1,791
Repair & Maintenance
Personal Services 170
Total $7,030
Distribution of Potential
Growth by Source
Regional Growth Increased DT Capture Downtown Residents

8/17/2019 Downtown Olympia Market Analysis
http://slidepdf.com/reader/full/downtown-olympia-market-analysis 47/71
OLYMPIA DOWNTOWN STRATEGY MARKET ANALYSIS
PROPERTY COUNSELORS PAGE 46
Table IV-7Projected Downtown Retail Demand
Source: Property Counselors
2014 Gross Sales Regional Growth
Increased DT
Capture
Downtown
Residents
Total Potential
Increase
Potential SF @
$200/SF*
Retail
Motor Vehicles & Parts $7,266,762 $2,804,970 - - $2,804,970 14,025
Furniture & Home Furnishing 3,122,270 1,205,196 2,154,445 - 3,359,641 16,798 Electronics & Appliances 717,981 277,141 - - 277,141 1,386
Building Materials, Garden Equip & Supplies 1,638,534 632,474 - - 632,474 3,162
Food & Beverage & Convenience Stores 46,653,547 18,008,269 6,194,962 8,238,750 32,441,981 64,884
Drug/health Stores 744,947 287,550 4,315,979 4,545,000 9,148,529 45,743
Apparel & Accessories 5,880,154 2,269,740 4,109,483 3,745,000 10,124,223 50,621
Sporting Goods, Toys, Book & Music Stores 6,079,198 2,346,571 4,261,965 2,050,000 8,658,536 43,293
General Merchandise Stores 433 167 - - 167 1
Miscellaneous Retailers 21,178,388 8,174,858 14,757,409 5,740,000 28,672,267 143,361
Non-store Retailers 1,843,767 711,694 640,708 - 1,352,402
Subtotal Retail Trade 95,125,981 36,718,629 36,434,951 24,318,750 97,472,330 383,274
Selected Services
Arts, Entertainment & Recreation 1,468,903 566,997 1,027,967 1,024,129 2,619,092 13,095
Food Services 50,069,715 19,326,910 17,583,218 8,956,290 45,866,417 229,332
Repair & Maintenance 6,721,266 2,594,409 906,083 - 3,500,492 17,502
Personal Services 1,938,347 748,202 666,047 849,286 2,263,534 11,318
Subtotal Selected Services 60,198,231 23,236,517 20,183,314 10,829,704 54,249,535 271,248
Total Retail and Selected Services $155,324,213 $59,955,146 $56,618,266 $35,148,454 $151,721,866 654,521
* Except Food and Beverage Stores estimated at $500 per square foot.

8/17/2019 Downtown Olympia Market Analysis
http://slidepdf.com/reader/full/downtown-olympia-market-analysis 48/71
OLYMPIA DOWNTOWN STRATEGY MARKET ANALYSIS
PROPERTY COUNSELORS PAGE 47
V. DEMAND FOR OFFICE The analysis of the market for office development is presented in this section in terms of:
Historical Office Market ActivityExisting and Planned Office SpacePotential Office Demand
HISTORICAL OFFICE MARKET ACTIVITY
Given the major role that state government plays in the local economy, it is not surprisingthat the local office market is dominated by State-occupied space. Table V-1 provides arough measure of the State’s influence in the year 2014. The total office space estimatewas derived by Thurston Regional Planning Council from Assessor data. As shown,
State-occupied space at that time represented 51 percent of all office space in the County.The actual percentage was undoubtedly higher, as the total square feet includes vacantspace, and space that may serve some retail uses. The State-occupied buildings includemost of the larger office buildings, while much of the non-State space is in smaller buildings.
Table V-1Office Space in Thurston County – 2014
(square feet)
Source: State Facilities ReportThurston Regional PlanningProperty Counselors
The total figures can be compared to numbers for the year 2000.
Olympia Lacey Tumwater Other TotalState Leased 1,596,000 331,000 1,444,000 (5,000) 3,366,000
State Owned 2,947,000 326,000 534,000 43,000 3,850,000
Subtotal State 4,543,000 657,000 1,978,000 38,000 7,216,000
Non-State 3,007,000 2,183,000 1,190,000 591,000 6,971,000
Total 7,550,000 2,840,000 3,168,000 629,000 14,187,000

8/17/2019 Downtown Olympia Market Analysis
http://slidepdf.com/reader/full/downtown-olympia-market-analysis 49/71
OLYMPIA DOWNTOWN STRATEGY MARKET ANALYSIS
PROPERTY COUNSELORS PAGE 48
Table V-2Office Space in Thurston County Growth 2000 to 2014
(square feet)
Source: State Facilities ReportThurston Regional Planning CouncilProperty Counselors
As shown, the amount of State leased space declined dramatically between 2010 and2014. Accordingly, the amount of Non-State space increased dramatically, but theamount of occupied space has not kept pace. The estimated office vacancy is
approximately 10%, and the vacant space represents approximately eight to ten yearsabsorption at historic rates.
EXISTING AND PLANNED OFFICE SPACE
EXISTING BUILDINGS
Current market conditions in Olympia are suggested by vacancy rates and prevailingrents in major buildings. Table V-3 summarizes conditions in selected major buildings inDowntown.
2000 2010 2014 Change 2000-10 Change 2010-14
State Leased 2,763,000 4,241,000 3,366,000 1,478,000 (875,000) State Owned 3,152,000 4,087,000 3,850,000 935,000 (237,000)
Subtotal State 5,915,000 8,328,000 7,216,000 2,413,000 (1,112,000)
Non-State 5,558,000 5,520,000 6,971,000 (38,000) 1,451,000
Total 11,473,000 13,848,000 14,187,000 2,375,000 339,000

8/17/2019 Downtown Olympia Market Analysis
http://slidepdf.com/reader/full/downtown-olympia-market-analysis 50/71
OLYMPIA DOWNTOWN STRATEGY MARKET ANALYSIS
PROPERTY COUNSELORS PAGE 49
Table V-3Downtown Olympia Office Buildings
Source: Commercial Brokers AssociationProperty Counselors
The highest rents are in the Market Place, Grange Building, Smythe Landing, PercivalPlaza, 521 Union, 324 West Bay, 1115 West Bay, 1050 Capitol, Boardwalk Building,and Market Center. Generally, these are the higher amenity buildings with water views. None of these buildings was built in the past ten years. The newest major office buildingin downtown Olympia is the Washington State Employees Credit Union building onUnion Street, but this building is owner – occupied.
PLANNED BUILDINGS
There are very few new private office projects in the County. The State-owned 1063Building is under construction on the capitol campus. Thurston County is considering possible relocation of its administrative buildings in West Olympia above Capitol Lake,with Downtown Olympia a possible location.
Address Total Sq. Ft. Available Sq. Ft. Asking Rent Expenses
825 Legion 825 Legion 6,229 6,229 $19 Mod. Gr.
Market Place 724 Columbia 49,000 6,613 $21-28 Full Serv.
Grange Building 924 Capitol 17,293 1,242 $18-25 Full Serv.Smythe Landing 1801 West Bay 23,557 7,441 $23-25 Full Serv.
Percival Plaza 606 Columbia 70,000 11,434 $22-24 Full Serv.
521 Union 521 Union 3,502 160 $22.50 Full Serv.
324 West Bay 324 West Bay 15,929 728 $22 Full Serv.
1115 West Bay 1115 West Bay 23,802 7,692 $19.50-21.50 Full Serv.
1050 Capitol 1050 Capitol 800 440 $21.13 Full Serv.
Boardwalk Building 525 Columbia 12,500 569 $21 Full Serv.
IBM Building (formerl 410 11th SE 18,000 620 $18.90 Mod. Gr.
Legion Square 402 Legion 16,856 2,000 $14.50 Mod. Gr.
404 Legion 16,704 5,000 $18.50 Mod. Gr.
406 Legion 16,704 2,000 $17-18.50 Mod. Gr.
Evergreen Plaza 711 Capitol 87,000 16,490 $15.75-17.50 Full Serv.
7th Avenue Building 319 7th 18,546 1,642 $16 Full Serv.
Davis Williams 906 Columbia 70,000 18,756 $16 Full Serv.
Mottman Building 101 Capitol 19,200 3,885 $15.50 Full Serv.
825 Legion 825 Legion 6,229 6,229 $14.50 Mod. Gr.
Adams Building 1310 Jefferson 23,715 3,000 $14.50 Mod. Gr.
Republic Building 505 Union 32,000 14,380 $14 Full Serv.
KMB Design 828 7th 2,600 2,600 $13.82 Full Serv.
Capitol Theater 204 5th 14,796 482 $11.83 Mod. Gr.
Market Center 111 Market 45,687 3,003 $20 Full Serv.
WSECU 400 Union 5,942 110
* Fully Services-Landlord pays expenses. Modified Gross-Landlord pays taxes and insurance.
8/17/2019 Downtown Olympia Market Analysis
http://slidepdf.com/reader/full/downtown-olympia-market-analysis 51/71
OLYMPIA DOWNTOWN STRATEGY MARKET ANALYSIS
PROPERTY COUNSELORS PAGE 50
The State of Washington has several established policies regarding development andleasing of office space:
Ownership of buildings is considered to be more cost effective to the State overthe long term. In the short term, lack of availability of funding to develop or
purchase office space may dictate lease of space.
The State is interested in procuring investment grade property with a 50 year life,whether through private lease development or State development of buildings.
The State is promoting consolidation of its functions to maximize efficiency ofagency operations. As leases of small space expire, the State is seeking torelocate functions into larger related concentrations.
The State has identified, in conjunction with local governments, PreferredDevelopment Areas (PDAs) for owned space and Preferred Leasing Areas (PLAs)for leased space. The PDAs and PLAs are similar in geographic scope and
include Downtown Olympia, the Town Center area of Tumwater, and the area between St. Martins College and the Lacey retail core.
The State can procure office space through purchase, lease, or development. For property that the State owns or intends to own in the future, a specified publicworks process must be pursued. A private property can be purchased or lease purchased through a one or two step process. Under the one step process, theState can advertise for a site and building simultaneously. Under the two step process, the State can advertise for a site, and advertise separately for a leasedevelopment project on the selected site.
The State has no additional project or leases at this time.
POTENTIAL OFFICE DEVELOPMENT
Non-State office demand in Thurston County is composed predominantly of smallertenants in the professional service, finance, insurance, and real estate industries. Themarket can be further characterized in three segments:
Firms and individuals doing business with the State and seeking proximity to theState Capitol Campus.
Firms and individuals providing services to other businesses and locating nearcommercial concentrations.
Firms providing services to local households.
The need for office space in all three categories is related to the amount of employmentgrowth in certain office using sectors. Table V-4 summarizes employment trends in

8/17/2019 Downtown Olympia Market Analysis
http://slidepdf.com/reader/full/downtown-olympia-market-analysis 52/71
OLYMPIA DOWNTOWN STRATEGY MARKET ANALYSIS
PROPERTY COUNSELORS PAGE 51
those sectors for the City of Olympia and Thurston County. Office using sectors includecommunications, finance, insurance and real estate, and services. Office-usingemployment can be estimated as certain percentages of total employment in each sector.Office using employment in Olympia is projected to grow by 5,357 between 2014 and2040. Office using employment in Thurston County is projected to grow by 16,748
between 2014 and 2040. This growth would support an additional 41,000 square feeteach year in Olympia and 124,000 square feet in the county as a whole. At this rate itwould require approximately eight years to fill the existing vacant office space county-wide. However, with conversion of some buildings to residential or other uses, and withthe lack of any new Class A office space developed in Olympia over the past decade,there will be support for new development in Olympia sometime sooner than the eightyear horizon.
Table V-4Projected Office Absorption Based on Employment
Olympia and Thurston County
Source: Thurston Regional Planning Council 2012, Property Counselors
Long-term, Downtown should be able to capture 50% or more of the new officedevelopment supportable within the city.
Olympia
Total Employment
2014 2040
Change 2014
2040
Office
Employment
Change 2014
2040
Avg. Ann.
Change 2014
Sq. ft.@ 200
/Employee
Avg. Ann.
Change 2014-
Resources 115 115 - - - - -
Construction 1,260 3,405 2,145 10% 215 8 42,900 1,650
Manufacturing 870 885 15 - - - -
Transportation Communications 530 695 165 75% 124 5 24,750 952
Wholesale Trade 755 830 75 - - - -
Retail Trade 6,560 8,740 2,180 - - - -
Information 710 930 220 75% 165 6 33,000 1,269
FIRE 3,695 4,605 910 100% 910 35 182,000 7,000
Services 9,890 15,865 5,975 66% 3,944 152 788,700 30,335
Government/Education/Tribal 28,955 38,880 9,925 - - - -
Total 53,340 74,950 21,610 5,357 206 1,071,350 41,206
Thurston CountyTotal Employment
2014 2040
Change 2014
2040
Office
Employment
as %
Change 2014
2040
Avg. Ann.
Change 2014
2040
Sq. ft.@ 200
/Employee
2014-2040
Avg. Ann.
Change 2014-
2040
Resources 2,905 2,875 (30) - - - -
Construction 6,195 13,000 6,805 10% 681 25 136,100 5,041
Manufacturing 3,240 3,630 390 - - - -
Transportation Communications 3,160 4,185 1,025 75% 769 28 153,750 5,694
Wholesale Trade 3,680 4,280 600 - - - -
Retail Trade 15,010 21,505 6,495 - - - -
Information 1,270 2,050 780 75% 585 22 117,000 4,333
FIRE 9,825 13,210 3,385 100% 3,385 125 677,000 25,074
Services 26,820 43,985 17,165 66% 11,329 420 2,265,780 83,918
Government 61,825 90,990 29,165 - - - -
Total 133,930 199,710 65,780 16,748 620 3,349,630 124,060
Office Employment Sq. Ft.
Office Employment Sq. Ft.
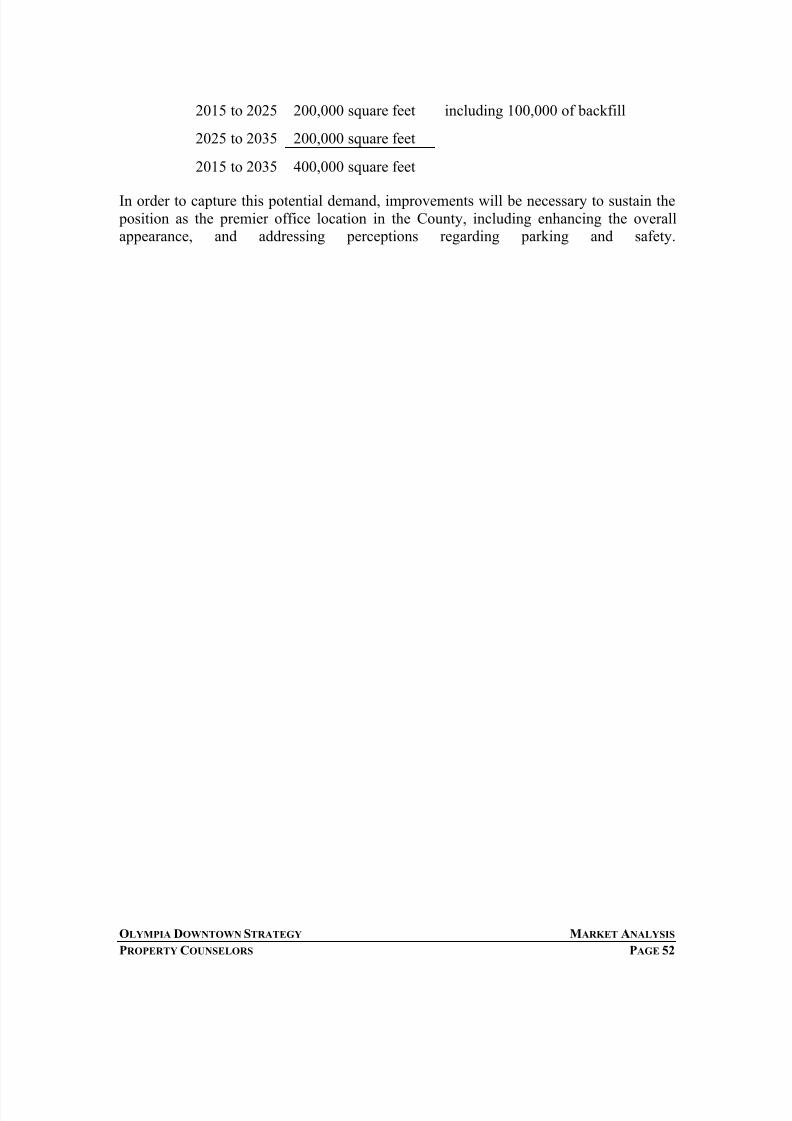
8/17/2019 Downtown Olympia Market Analysis
http://slidepdf.com/reader/full/downtown-olympia-market-analysis 53/71
OLYMPIA DOWNTOWN STRATEGY MARKET ANALYSIS
PROPERTY COUNSELORS PAGE 52
2015 to 2025 200,000 square feet including 100,000 of backfill
2025 to 2035 200,000 square feet
2015 to 2035 400,000 square feet
In order to capture this potential demand, improvements will be necessary to sustain the position as the premier office location in the County, including enhancing the overallappearance, and addressing perceptions regarding parking and safety.
8/17/2019 Downtown Olympia Market Analysis
http://slidepdf.com/reader/full/downtown-olympia-market-analysis 54/71
OLYMPIA DOWNTOWN STRATEGY MARKET ANALYSIS
PROPERTY COUNSELORS PAGE 53
VI. DEMAND FOR R ESIDENTIAL Residential development is an important component of a balanced urban neighborhood.
It is not only a potential use in Downtown in its own right, but it also has the potential tosupport commercial uses in the area as well. Multifamily residential demand isconsidered in this section in terms of:
OverviewApartment MarketCondominium MarketPotential Residential Demand
OVERVIEW
The multifamily residential development demand in Olympia is only one segment of the
overall housing inventory in the City. Table VI-1 summarizes the make-up of thehousing inventory in the City and County as of the year 2015.
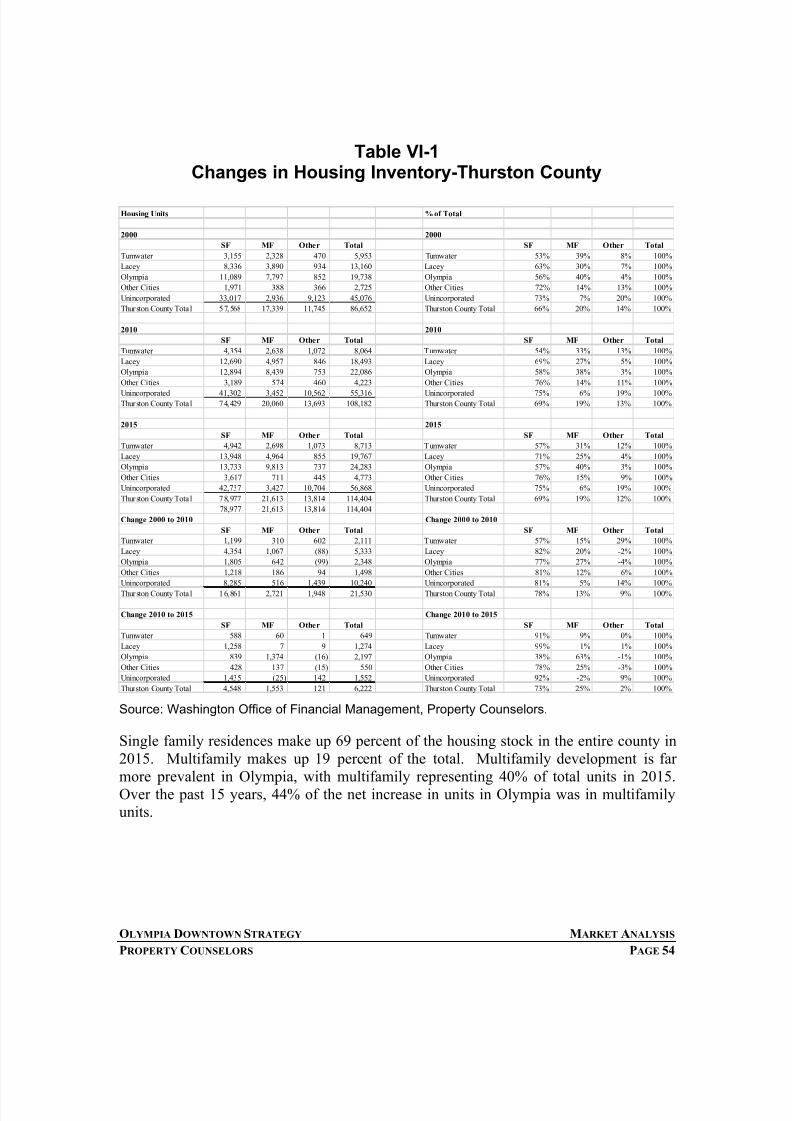
8/17/2019 Downtown Olympia Market Analysis
http://slidepdf.com/reader/full/downtown-olympia-market-analysis 55/71
OLYMPIA DOWNTOWN STRATEGY MARKET ANALYSIS
PROPERTY COUNSELORS PAGE 54
Table VI-1Changes in Housing Inventory-Thurston County
Source: Washington Office of Financial Management, Property Counselors.
Single family residences make up 69 percent of the housing stock in the entire county in2015. Multifamily makes up 19 percent of the total. Multifamily development is farmore prevalent in Olympia, with multifamily representing 40% of total units in 2015.Over the past 15 years, 44% of the net increase in units in Olympia was in multifamilyunits.
Housing Units % of Total
2000 2000
SF MF Other Total SF MF Other Total
Tumwater 3,155 2,328 470 5,953 Tumwater 53% 39% 8% 100%
Lacey 8,336 3,890 934 13,160 Lacey 63% 30% 7% 100%
Olympia 11,089 7,797 852 19,738 Olympia 56% 40% 4% 100%
Other Cities 1,971 388 366 2,725 Other Cities 72% 14% 13% 100%
Unincorporated 33,017 2,936 9,123 45,076 Unincorporated 73% 7% 20% 100%
Thurston County Tota l 57,568 17,339 11,745 86,652 Thurston County Total 66% 20% 14% 100%
2010 2010
SF MF Other Total SF MF Other Total
Tumwater 4,354 2,638 1,072 8,064 Tumwater 54% 33% 13% 100%
Lacey 12,690 4,957 846 18,493 Lacey 69% 27% 5% 100%
Olympia 12,894 8,439 753 22,086 Olympia 58% 38% 3% 100%
Other Cities 3,189 574 460 4,223 Other Cities 76% 14% 11% 100%
Unincorporated 41,302 3,452 10,562 55,316 Unincorporated 75% 6% 19% 100%Thurston County Tota l 74,429 20,060 13,693 108,182 Thurston County Total 69% 19% 13% 100%
2015 2015
SF MF Other Total SF MF Other Total
Tumwater 4,942 2,698 1,073 8,713 Tumwater 57% 31% 12% 100%
Lacey 13,948 4,964 855 19,767 Lacey 71% 25% 4% 100%
Olympia 13,733 9,813 737 24,283 Olympia 57% 40% 3% 100%
Other Cities 3,617 711 445 4,773 Other Cities 76% 15% 9% 100%
Unincorporated 42,737 3,427 10,704 56,868 Unincorporated 75% 6% 19% 100%
Thurston County Tota l 78,977 21,613 13,814 114,404 Thurston County Total 69% 19% 12% 100%
78,977 21,613 13,814 114,404
Change 2000 to 2010 Change 2000 to 2010
SF MF Other Total SF MF Other Total
Tumwater 1,199 310 602 2,111 Tumwater 57% 15% 29% 100%
Lacey 4,354 1,067 (88) 5,333 Lacey 82% 20% -2% 100%
Olympia 1,805 642 (99) 2,348 Olympia 77% 27% -4% 100%
Other Cities 1,218 186 94 1,498 Other Cities 81% 12% 6% 100%
Unincorporated 8,285 516 1,439 10,240 Unincorporated 81% 5% 14% 100%
Thurston County Tota l 16,861 2,721 1,948 21,530 Thurston County Total 78% 13% 9% 100%
Change 2010 to 2015 Change 2010 to 2015
SF MF Other Total SF MF Other Total
Tumwater 588 60 1 649 Tumwater 91% 9% 0% 100%
Lacey 1,258 7 9 1,274 Lacey 99% 1% 1% 100%
Olympia 839 1,374 (16) 2,197 Olympia 38% 63% -1% 100%
Other Cities 428 137 (15) 550 Other Cities 78% 25% -3% 100%
Unincorporated 1,435 (25) 142 1,552 Unincorporated 92% -2% 9% 100%
Thurston County Total 4,548 1,553 121 6,222 Thurston County Total 73% 25% 2% 100%

8/17/2019 Downtown Olympia Market Analysis
http://slidepdf.com/reader/full/downtown-olympia-market-analysis 56/71
OLYMPIA DOWNTOWN STRATEGY MARKET ANALYSIS
PROPERTY COUNSELORS PAGE 55
R ENTAL MARKET
Rental apartments are one broad segment of the multifamily housing market. Current andhistorical vacancy and rental rates provide a measure of the strength of the existingmarket as well as an indication of possible future market performance.
MARKET AREA STATISTICS
Market conditions in the Olympia area are reported semi-annually in the ApartmentVacancy Report by Dupre and Scott. Current and historical conditions are summarized inTable VI-2.
Table VI-2Thurston County
Apartment Statistics
Olympia
Olympia
2010 and
Newer Tumwater Lacey
Thurston
County
Vacancy Rate
All 3.6% 3.4% 3.4% 3.0% 3.0%
Studio 2.2% 12.5% 2.2%
1 BR 4.0% 5.2% 2.9% 2.5% 3.3%
2 BR/1 Ba. 2.6% 2.2% 3.3% 3.1% 2.8%
2 BR/2Ba. 3.9% 2.4% 4.1% 4.0% 3.9%
3 BR/2 Ba. 4.1% 0.0% 3.4% 3.0% 3.6%Average Monthly Rent
All $944 $1,256 $974 $875 $933
Studio 719 1,066 692
1 BR 830 1,178 848 765 813
2 BR/1 Ba. 906 1,305 891 910 906
2 BR/2Ba. 1,092 1,304 1,075 999 1,069
3 BR/2 Ba. 1,120 1,321 1,243 1,192 1,170
Monthly Rent /sq. ft.
All $1.10 $1.40 $1.11 $1.09 $1.10
Studio 1.78 2.14 1.66
1 BR 1.23 1.74 1.20 1.21 1.22
2 BR/1 Ba. 1.07 1.48 1.08 1.05 1.07
2 BR/2Ba. 1.05 1.20 1.07 0.99 1.04
3 BR/2 Ba. 0.94 1.07 1.02 1.00 0.97
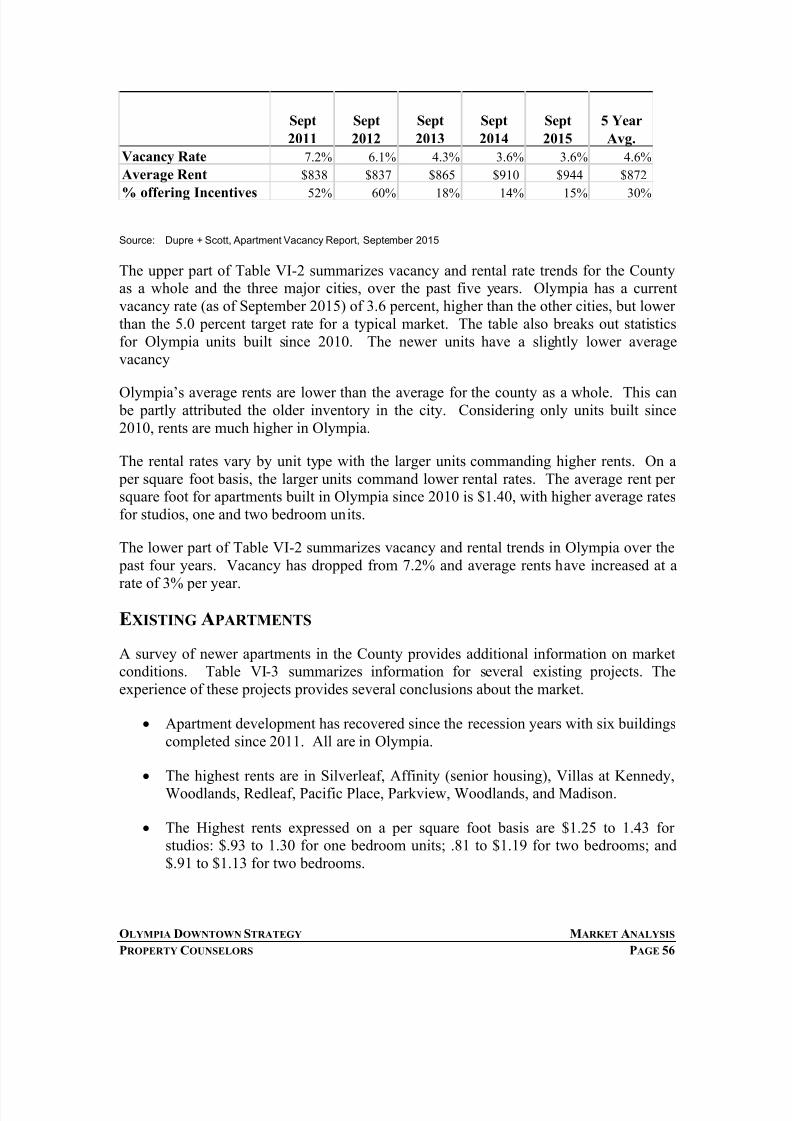
8/17/2019 Downtown Olympia Market Analysis
http://slidepdf.com/reader/full/downtown-olympia-market-analysis 57/71
OLYMPIA DOWNTOWN STRATEGY MARKET ANALYSIS
PROPERTY COUNSELORS PAGE 56
Source: Dupre + Scott, Apartment Vacancy Report, September 2015
The upper part of Table VI-2 summarizes vacancy and rental rate trends for the Countyas a whole and the three major cities, over the past five years. Olympia has a currentvacancy rate (as of September 2015) of 3.6 percent, higher than the other cities, but lowerthan the 5.0 percent target rate for a typical market. The table also breaks out statisticsfor Olympia units built since 2010. The newer units have a slightly lower averagevacancy
Olympia’s average rents are lower than the average for the county as a whole. This can be partly attributed the older inventory in the city. Considering only units built since2010, rents are much higher in Olympia.
The rental rates vary by unit type with the larger units commanding higher rents. On a per square foot basis, the larger units command lower rental rates. The average rent persquare foot for apartments built in Olympia since 2010 is $1.40, with higher average ratesfor studios, one and two bedroom units.
The lower part of Table VI-2 summarizes vacancy and rental trends in Olympia over the past four years. Vacancy has dropped from 7.2% and average rents have increased at a
rate of 3% per year.
EXISTING APARTMENTS
A survey of newer apartments in the County provides additional information on marketconditions. Table VI-3 summarizes information for several existing projects. Theexperience of these projects provides several conclusions about the market.
Apartment development has recovered since the recession years with six buildingscompleted since 2011. All are in Olympia.
The highest rents are in Silverleaf, Affinity (senior housing), Villas at Kennedy,Woodlands, Redleaf, Pacific Place, Parkview, Woodlands, and Madison.
The Highest rents expressed on a per square foot basis are $1.25 to 1.43 forstudios: $.93 to 1.30 for one bedroom units; .81 to $1.19 for two bedrooms; and$.91 to $1.13 for two bedrooms.
Sept
2011
Sept
2012
Sept
2013
Sept
2014
Sept
2015
5 Year
Avg.
Vacancy Rate 7.2% 6.1% 4.3% 3.6% 3.6% 4.6%
Average Rent $838 $837 $865 $910 $944 $872
% offering Incentives 52% 60% 18% 14% 15% 30%

8/17/2019 Downtown Olympia Market Analysis
http://slidepdf.com/reader/full/downtown-olympia-market-analysis 58/71
OLYMPIA DOWNTOWN STRATEGY MARKET ANALYSIS
PROPERTY COUNSELORS PAGE 57
With the exception of the Capitol Steps project with underground parking, all the buildings offer carports or partially covered parking. The buildings are generally two tothree stories. The prevailing rents are at levels that can support development for this product.

8/17/2019 Downtown Olympia Market Analysis
http://slidepdf.com/reader/full/downtown-olympia-market-analysis 59/71
OLYMPIA DOWNTOWN STRATEGY MARKET ANALYSIS
PROPERTY COUNSELORS PAGE 58
Table VI-3
Selected Thurston County Apartments
Source: ForRent.com, Property Counselors
# of
Name Address City Year Built Units Studio 1 BR 2 BR 3 BR Studio 1 BR 2 BR 3 BR Features
Abbey Road 9320 Windsor Ln Lacey 2004 162 823-881 991-1,283 $955-$1,046 $1,175 1,2.3,4,5
Affinity 4701 7th SW Olympia 2014 170 495 595 794-922 $1,100-$1,210 $1,300-$1,470 $1,500-1,795 1,2,3,4 Senior
Alpine Village 301 T St. SW Tumwater 450 518-608 730 1000 $625 $675 $840 $1,050 3,4
Breckenridge Heights 1923 B ittany Tumwater 1994 250 800-910 1030 1145 $750-$870 $900-$1,030 $1,050-$1,000 1,2,3,4,5
Capitol Heights 1221 Mottman Tumwater 1990 115 801 976-1,021 1,221 $845 $975-$1,030 $1,050-$1,100 1,3,4,5
Capitol Steps 623 Eastside Olympia 2005 26 558-627 694-781 $835 $860-895
Copper Trail 701 Alta NW Olympia 2015 238 703 832-972 1,101 $799 $949 $1,087 1,2,3,4,5
Country Club Villas 3625 Yelm Hwy Olympia 2007 64 956 1,156 $1,040-$1,050 $1,170-$1,180 3,4
Dakota Place 6205 Pacific Olympia 2006 156 728 1,074 $925-$930 $1,099 1,2,3,4
Hearthstone 215 Pinehurst Tumwater 2005/2007 133 681-788 919-960 1,084-1,101 $925 $1,220 $1,235-$1,385 2,3,4
Heritage Park 1818 Evergeen Park Olympia 1972 120 295-325 450-650 635-725 1,200 $650-$699 $799-$899 $980-$1,149 $1,150-$1,200 2
Larc 3600 Forestbrook Wy. Olympia 2014 141 535-762 724-774 $782-$798 $913-$947 2,3,4 Senior
Madison 105 Newberry Olympia 2007 192 723-826 1,022-1,180 $1,030-$1,113 $1,122-$1,368 1,2,3,4
Pacific Place 748 Sutter Lane SE Lacey 2009 59 771-1,026 1,177 $1,120-$1,320 $1,465 2,3,4,5
Parkview 4523 Briggs Dr. Olympia 2012 72 788 1,083 1,243 $1,025-$1,255 $1,225-$1,255 $1,365-$1,405 4,5
Polo Club 3425 Polo Club Lane Olympia 2009 127 967 1,110 $1,208-$1,292 $1,453 1,2,3,4,5
Red Leaf 1330 Fones Rd. Olympia 2011 56 1,345-1,467 1,842 $1,249-$1,399 $1,495
Regency 1521 McDaniel Lacey 2005 66 956 1,100-1,160 $920-$940
Rock Maple 3000 Cardinal Dr. Olympia 2004 113 853 1,126 $935-$970 $1,200 1,2,3,4
Silverleaf 4520 Hendersopn Olympia 2014 200 504-511 634-857 $899-$920 $1,395-$1,495 2,4
Sommers Manor 4000 57th Trail Olympia 2007 40 1,008 $1,295 3,4,5
Tabula Rasa 1978 Trosper Rd. Tumwater 2008 117 802 1,102-1,154 1,298-1,411 $1,050 $1,275 $1,400
Tribeca 1700 Kempton SE Olympia 2010 79 745 967-985 1,274 $900-$925 $1,045-$1,200 $1,385-$1,420 2,3,4,5
Villas at Kennedy 1978 Trosper Rd. Tumwater 2008 119 802-896 1,115-1,154 1411 $969-$1,419 $1,770-$2,140 $2,279-$2,479 1,2,3,4,5
Woodlands I & 2 800 Yauger Way Olympia 2012 224 875-903 1,180-1,194 $1,039-$1,145 $1,179-$1,299 1,2,3
Yauger Park Villas 322 Lachman SW 2010 80 1,209-1,264 $1,607-$1,912 2,3,4
6th Ave. Place 4410 6th Ave. Lacey 2008 103 554-910 870-979 1,192-1,298 $835-$980 $1,045-$1,065 $1,275-$1,315 1,4,5
8 Hundred West 800 Alta Olympia 2015 101 979-1,022 $1,165-$1,695 1,3,4
Unit Size Rent

8/17/2019 Downtown Olympia Market Analysis
http://slidepdf.com/reader/full/downtown-olympia-market-analysis 60/71
OLYMPIA DOWNTOWN STRATEGY MARKET ANALYSIS
PROPERTY COUNSELORS PAGE 59
CONDOMINIUM MARKET
Condominiums are multifamily residential units available for sale. Sales prices for allhousing in Thurston County fell rapidly during the recession, but have regained some of
the lost value since that time as shown in Figure VI-1. Average home values in Olympiavary by neighborhood as follows. South Capitol neighborhood immediately south ofDowntown has the highest average value, according to Zillow.
Figure VI-1
Source: Thurston Regional Planning Council, Northwest Multiple Listing Service.
South Capitol $332,400
Cain Road $314,400
Northwest $233,700
Northeast $225,600
South Westside $215,000
Eastside $207,900
-
50,000
100,000
150,000
200,000
250,000
300,000
350,000
2000 2001 2002 2003 2004 2005 2006 2007 2008 2009 2010 2011 2012 2013 2014
Olympia Area Home Sales Median Sale
Price by City
Olympia Lacey Tumwater

8/17/2019 Downtown Olympia Market Analysis
http://slidepdf.com/reader/full/downtown-olympia-market-analysis 61/71
OLYMPIA DOWNTOWN STRATEGY MARKET ANALYSIS
PROPERTY COUNSELORS PAGE 60
The average home values for condominiums/coops in Olympia are estimated by Zillow to be $196,000 compared to $254,000 for all homes. Condominium/coop values droppedfrom a peak of $241,000 in 2007, to a low of $175,000 in 2012, before returning to thecurrent value. The average value for all homes dropped from a peak of $262,000 in 2007to a low of $210,000 in 2007 before returning to the current value. On a percentage basis, condos dropped 27% on average, while homes dropped only 20%. Condominiumcoop values are currently lower relative to home prices than in either 2007 or 2012.
The asking price and unit characteristics of condominium units for sale in December2015 are summarized in Table VI-4.
Of the units shown, many are in projects built just prior to the recession. 1018Capitol Way S. was built in 2010. Several new townhouse projects have been built in the past year in Lacey.
Most of the units for sale are townhouse units. The most expensive flats are on
East Bay Drive immediately west of downtown and offer water and mountainviews.
The most expensive units generally range in size from 1,500 to 2,000 square feet.
On a per square foot basis, the highest priced units are just over $200. However,many of the new townhouse units are for sale for approximately $150 per squarefoot.
Generally, condominium sales have begun to increase and prices stabilized, but thecurrent prices are still well below the prices necessary to justify new investment. Further,developers are discouraged from condominium development by construction liability
laws and the threat of homeowner association lawsuits.

8/17/2019 Downtown Olympia Market Analysis
http://slidepdf.com/reader/full/downtown-olympia-market-analysis 62/71
OLYMPIA DOWNTOWN STRATEGY MARKET ANALYSIS
PROPERTY COUNSELORS PA
Table VI-4Thurston County
Selected Condominiums for Sale December 2015
Address City Year Built Sq. Ft.
Bedrooms/
Baths Type Asking Price
700 Sherman St. Olympia 1988 1,664 3/2 Flats $350,000
1018 Capitol Way S. Olympia 2010 1,113 2/1.75 Flats $285,000
3415 Wagon Wheel Olympia 2005 2,336 3/2.5 Townhouse $259,500
900 East Bay A405 Olympia 1988 1,482 2/1.75 Flats $252,500
920 East Bay D201 Olympia 1989 1,502 2/2 Flats $245,000
904 East Bay B207 Olympia 1979 1,482 2/1.75 Flats $234,900
1604 Craig Road Olympia 2013 1,588 3/2.25 Townhouse $224,900
2740 10th Ct. Olympia 2007 1,794 3/2.5 Townhouse $219,900
508 Bungalow Olympia 2006 1,315 2/2.5 Townhouse $192,500
3542 Surrey Olympia 2006 1,320 2/2.5 Townhouse $177,900
1710 Evergreen Park Lane Olympia 1972 1,727 3/2.5 Townhouse $175,000
3355 Simmons Mill Ct Olympia 2004 1,505 2/2.5 Townhouse $129,900
1801 Evergreen Ct. #18 Olympia 1971 1,344 3/2.5 Townhouse $125,000
1417 Evergreen Park Dr #104 Olympia 2008 996 2/1.75 Flats $125,000
3506 Pifer #13 Olympia 1962 952 2/1 Co-op $100,000
3506 Pifer #14 Olympia 1962 952 2/1 Co-op $99,000
1417 Evergreen Park Dr Olympia 2008 996 2/1.75 Flats $95,000
2300 9th SW Olympia 1974 896 2/1.5 Flats $87,500
4144 Cameron Ln. #22 Lacey 1,820 2/2.5 Townhouse $289,950
4150 Cameron Ln. #23 Lacey 1,664 3/2 Townhouse $284,950
3951 Jett Lane #56 Lacey 1,820 3/2.5 Flats $274,950
3947 Jett Ln. #57 Lacey 1,664 2/2.5 Flats $259,950
6637 Riviera Ct. SE Lacey 1,629 2/2.5 Flats $249,000
7117 Spence Lacey 2015 1,836 3/2.25 Townhouse $234,900
7105 Spence Lacey 2015 1,836 3/2.25 Townhouse $231,900
7109 Spence Lacey 2015 1,836 3/2.25 Townhouse $228,900
7115 Spence Lacey 2015 1,836 3/2.25 Townhouse $224,900
7107 Spence Lacey 2015 1,836 3/2.25 Townhouse $224,900
7340 33rd NE Lacey 2008 2,200 3/2.25 Townhouse $217,900
6600 Rudell Rd. Lacey 2008 1,342 2/2.5 Townhouse $209,900
2347 48th Ave.SW #B Tumwater 1999 2,876 2/2.5 Townhouse $349,900
3445 Simmons Mill SW Tumwater 2003 1,724 3/2 Flats $192,500
3694 Simmons Mill SW Tumwater 2002 1,850 3/2.5 Townhouse $129,950
3350 Simmons Mill SW Tumwater 2000 1,505 2/2.5 Townhouse $129,900
220 Israel Rd. Tumwater 1987 900 2/1.75 Flats $80,000
1500 Lake Park Dr. Tumwater 1975 1,292 2/1.5 Flats $75,900
Source: Windermere Real Estate, December, 2015.
8/17/2019 Downtown Olympia Market Analysis
http://slidepdf.com/reader/full/downtown-olympia-market-analysis 63/71
FINAL DRAFT: APRIL 25 2016
OLYMPIA DOWNTOWN STRATEGY MARKET ANALYSIS
PROPERTY COUNSELORS PAGE 62
POTENTIAL R ESIDENTIAL DEMAND
The city expects that approximately one-quarter of the projected increase in City population over the next 20 years will locate Downtown. This increase would represent
2,500 to 3,500 additional housing units depending on the average household size. At oneend of the range, an average size of 2.0 persons per household is slightly below theaverage for the entire city in 2010. At the other end, an average size of 1.5 is slightly below the average for the area of Downtown south of Legion in 2010. The projecteddistribution of new units for townhouse, lowrise (2-3 stories), and midrise (4-6 stories) isshown in Table VI-5. The distribution is based on the likely household composition andincome levels of new residents. As shown in the first columns of the table, the householddistribution in 2010 was 24% family households with children under 18, 28% familyhouseholds without children under 18, and 49% nonfamily households. The medianincome level for each segment is derived from census data as well. The distribution byunit type for each household segment is based on the following:
Family households with children under 18 are more likely to choose a townhouse.
Family households without children, and with higher incomes are more likely tochoose a midrise unit.
Non-family households, with moderate incomes are more likely to choose a lowriseunit.
As shown in the table, the projected demand by unit type over the twenty year period is:
Townhouses 684 to 958 units
Lowrise (2-3 stories) 1,097 to 1,536 units
Midrise (4-5stories) 719 to 1,006 units
Total 2,500 to 3,500 units
The townhouse units will likely be a mix of units for sale and for rent. The lowrise andmidrise units will be predominately for rent at least in the foreseeable future. As rentsrise, there will be more interest in condominiums. Developers will be more inclined torespond to that interest if laws are changed to limit liability for construction defects.

8/17/2019 Downtown Olympia Market Analysis
http://slidepdf.com/reader/full/downtown-olympia-market-analysis 64/71
FINAL DRAFT: APRIL 25 2016
OLYMPIA DOWNTOWN STRATEGY MARKET ANALYSIS
PROPERTY COUNSELORS PAGE 63
Table VI-5Projected Downtown Housing Growth
2015 to 2035
Source: Property Counselors
Smaller Average Household Size
House holds 2010 % of Total Me d. Inc. Townhouse Lowrise Midrise Total
Family Households w/ Childen under 18 4,908 23.6% $76,467 496 248 83 827
Family Households w/o Childen under 18 5,764 27.8% $83,271 292 97 583 972
Non-Family Households 10,089 48.6% $35,438 170 1,191 340 1,701
Total 20,761 100.0% 958 1,536 1,006 3,500
Larger Average Household Size
House holds 2010 % of Total Me d. Inc. Townhouse Lowrise Midrise Total
Family Households w/ Childen under 18 4,908 23.6% $76,467 355 177 59 591
Family Households w/o Childen under 18 5,764 27.8% $83,271 208 69 416 694
Non-Family Households 10,089 48.6% $35,438 121 850 243 1,215
Total 20,761 100.0% 684 1,097 719 2,500

8/17/2019 Downtown Olympia Market Analysis
http://slidepdf.com/reader/full/downtown-olympia-market-analysis 65/71
FINAL DRAFT: APRIL 25 2016
OLYMPIA DOWNTOWN STRATEGY MARKET ANALYSIS
PROPERTY COUNSELORS PAGE 64
VII. DEMAND FOR LODGING Lodging can support other businesses, at the same time that it is supported by other uses
and the visitor industry. Potential demand is presented in this section in terms of:Regional Market PerformanceExisting HotelsPotential Lodging Demand
R EGIONAL MARKET PERFORMANCE The lodging market in Thurston County has been somewhat stable in the past year. Assummarized in Table VII-1, average occupancy was unchanged at 60%, a level below thetarget rate to attract new entrants to the market. At the same time, the average room rateincreased at a rate of 3.2%, a rate above the rate of inflation.
Table VII-1Thurston County Hotel Market Performance
2013 2014 % Change
Room Occupancy 60% 60% 0.0%
Average Room Rate $95 $98 3.2%
Revenue per Available Room $58 $59 2.1%
Source: Kidder Mathews Real Estate Market Review
Performance at the city level can be derived from hotel/motel tax data. A tax of 2% ofroom revenues is collected by the State (as part of the retail sales tax) and distributed tocities and counties. A 2% special tax is also imposed by local cities and the County. Taxrevenues are proportional to room revenues. Changes in tax collections for individualcities and the County are shown in Figure VII-1. Revenues in all jurisdictions declinedwith the general economy in 2008, but have recovered strongly since then. Olympiacaptures the largest share of lodging activity, followed by Lacey.

8/17/2019 Downtown Olympia Market Analysis
http://slidepdf.com/reader/full/downtown-olympia-market-analysis 66/71
FINAL DRAFT: APRIL 25 2016
OLYMPIA DOWNTOWN STRATEGY MARKET ANALYSIS
PROPERTY COUNSELORS PAGE 65
Figure VII-1
Travelers in the Olympia market area can be categorized into four primary segments:government travelers, commercial travelers, groups, and tourists and other transients.The market segmentation at individual hotels varies, based on the facilities and servicesoffered at the properties. The largest demand in local hotels comes from the commercial
market segment with approximately one-third of the total market share, while group andleisure demand command a similar area market share at approximately 25% each.Government demand accounts for the balance of demand. The legislative session has alarge effect on Olympia area occupancy during the first quarter of every year.
Corporate or commercial travelers are those conducting business in the area. Lodgingdemand for the commercial travelers market segment is generated by commercial,industrial, and retail activity throughout the Thurston County area. Commercial demandtypically occurs Monday through Thursday and is characterized by short lengths of stay.Weekend rates are typically lower during the winter season and increase to levels abovecommercial rates during the high-tourist season. Commercial activity takes place year-
round, however most facilities in the area prefer to reserve the summer season for guests paying non-discounted rates and staying for longer periods. In general, this marketsegment chooses its lodging facilities based on room rate structure, quality, andamenities, location, and the availability of restaurants and other support services.
The group meetings market is comprised of associations, conventions, and businessmeetings which utilize blocks of guestrooms in addition to banquet and meeting rooms

8/17/2019 Downtown Olympia Market Analysis
http://slidepdf.com/reader/full/downtown-olympia-market-analysis 67/71
FINAL DRAFT: APRIL 25 2016
OLYMPIA DOWNTOWN STRATEGY MARKET ANALYSIS
PROPERTY COUNSELORS PAGE 66
and is comprised of associations, conventions, trade shows, small business meetings,family retreats, and weddings. Group demand is generally offered discounted rates,depending upon the group size and the season during which they are accommodated.Discounted group rates are also limited primarily to the shoulder seasons, due to thestronger occupancies experienced by the hotels in the competitive supply during the
summer months. The development of the group segment is critical, however, in assuringa facility’s long-term success, since group business tends to be heaviest in spring and fall,while it tends to be displaced during the summer months for higher rated leisure demand.
Leisure travelers are those travelers visiting attractions in the area or visiting family andfriends. Demand derived from this segment has the highest incidence of doubleoccupancy among the market segments. Tourists typically pay the full rack rate, howeverthey occasionally receive discounts for coupons or tour packages. Tour groups areconsidered to be part of the leisure traveler market. Leisure demand tends to be strongestin the summer months of June through August.
Government travelers, which represent a larger than average segment of demand in the
Olympia market area, consist of government employees doing business in the statecapital. Lobbyists and many individuals who are not government employees but areinvolved in government-related work also frequently receive the per diem governmentrate. The peak period for government travel is in the months of January and Februaryduring even-numbered years and from January through March during odd-numberedyears. The current government per diem is approximately $99 for lodging and $69 forfood. The per diem rate for lodging approximately equal to the average daily rate shownin Table VII-1, reflecting the impact of government travel on the local lodging market.
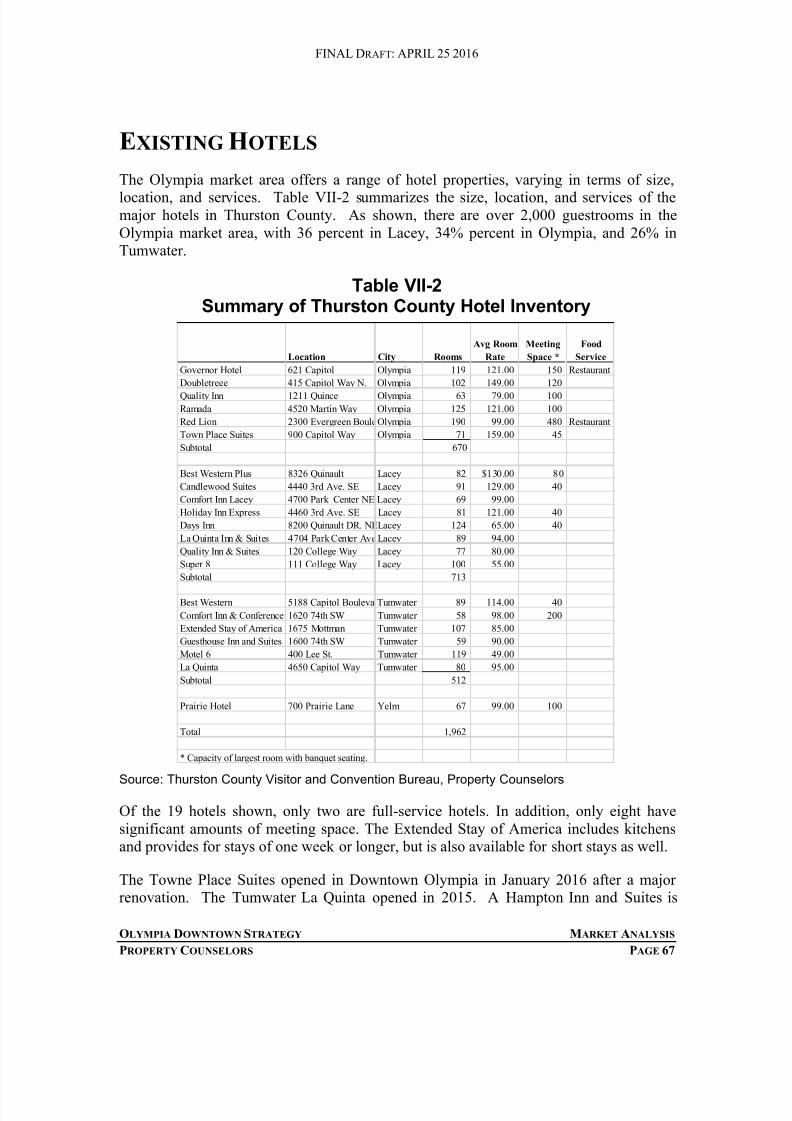
8/17/2019 Downtown Olympia Market Analysis
http://slidepdf.com/reader/full/downtown-olympia-market-analysis 68/71
FINAL DRAFT: APRIL 25 2016
OLYMPIA DOWNTOWN STRATEGY MARKET ANALYSIS
PROPERTY COUNSELORS PAGE 67
EXISTING HOTELS
The Olympia market area offers a range of hotel properties, varying in terms of size,
location, and services. Table VII-2 summarizes the size, location, and services of themajor hotels in Thurston County. As shown, there are over 2,000 guestrooms in theOlympia market area, with 36 percent in Lacey, 34% percent in Olympia, and 26% inTumwater.
Table VII-2Summary of Thurston County Hotel Inventory
Source: Thurston County Visitor and Convention Bureau, Property Counselors
Of the 19 hotels shown, only two are full-service hotels. In addition, only eight havesignificant amounts of meeting space. The Extended Stay of America includes kitchensand provides for stays of one week or longer, but is also available for short stays as well.
The Towne Place Suites opened in Downtown Olympia in January 2016 after a majorrenovation. The Tumwater La Quinta opened in 2015. A Hampton Inn and Suites is
Location City Rooms
Avg Room
Rate
Meeting
Space *
Food
Service
Governor Hotel 621 Capitol Olympia 119 121.00 150 Restaurant
Doubletreee 415 Capitol Way N. Olympia 102 149.00 120
Quality Inn 1211 Quince Olympia 63 79.00 100
Ramada 4520 Martin Way Olympia 125 121.00 100
Red Lion 2300 Evergreen BouleOlympia 190 99.00 480 Restaurant
Town Place Suites 900 Capitol Way Olympia 71 159.00 45
Subtotal 670
Best Western Plus 8326 Quinault Lacey 82 $130.00 80
Candlewood Suites 4440 3rd Ave. SE Lacey 91 129.00 40
Comfort Inn Lacey 4700 Park Center NE Lacey 69 99.00
Holiday Inn Express 4460 3rd Ave. SE Lacey 81 121.00 40
Days Inn 8200 Quinault DR. NELacey 124 65.00 40
La Quinta Inn & Suites 4704 Park Center Ave Lacey 89 94.00
Quality Inn & Suites 120 College Way Lacey 77 80.00
Super 8 111 College Way Lacey 100 55.00
Subtotal 713
Best Western 5188 Capitol Bouleva Tumwater 89 114.00 40
Comfort Inn & Conference 1620 74th SW Tumwater 58 98.00 200
Extended Stay of America 1675 Mottman Tumwater 107 85.00
Guesthouse Inn and Suites 1600 74th SW Tumwater 59 90.00
Motel 6 400 Lee St. Tumwater 119 49.00
La Quinta 4650 Capitol Way Tumwater 80 95.00
Subtotal 512
Prairie Hotel 700 Prairie Lane Yelm 67 99.00 100
Total 1,962
* Capacity of largest room with banquet seating.
8/17/2019 Downtown Olympia Market Analysis
http://slidepdf.com/reader/full/downtown-olympia-market-analysis 69/71
FINAL DRAFT: APRIL 25 2016
OLYMPIA DOWNTOWN STRATEGY MARKET ANALYSIS
PROPERTY COUNSELORS PAGE 68
scheduled to open with 126 rooms at 4301 Martin Way in Olympia in June 2016. A 118room Hilton Garden Inn is under construction on Henderson Boulevard in Olympia. AMarriott Courtyard is proposed for an adjacent site.
In addition to the hotels shown in the table, the Great Wolf Lodge is a major attraction inthe area, providing meeting space and recreational facilities. The Lodge is orientedtoward families and includes 317 all-suite guestrooms, 30,000 square feet of meetingspace, a 50,000 square foot indoor water park, arcade, spa, and fitness center on a threeand a half-acre parcel of land. The Great Wolf Lodge is owned by the Chehalis Tribe,which also owns the Lucky Eagle Casino. The development is approximately 20 minutesoutside of Olympia in Grand Mound, Washington.
POTENTIAL LODGING DEMAND Future demand for lodging facilities in the study area will depend upon the continuedrecovery and future growth of the tr avel industry, and the area’s competitive position.
Table VII-3 summarizes the assumptions and projections for supportable future hoteldevelopment in the study area. Projections are made in a range for base and high demandconditions.
Real growth in hotel performance reflects growth in room nights and growth in ADRabove inflation. The historical real growth rate was 2.3% between 1994 and 2015, a verychallenging period for the industry. Future growth is assumed at 2.5% to 3.5%. TheCity’s current share of county-wide room revenue was 46% in 2015 down from 51%% in2003. Olympia should be able to maintain that share and even increase it somewhat based on likely enhancements to Downtown. In the high growth projection, that share is projected to grow to 50%, still below its historical high. The Downtown’s share ofOlympia hotel activity should hold steady or grow if it can be reinforced as the lodging
and entertainment center for the city.As shown in Table VII-3, the number of supportable new hotel rooms in the study areaover the next 20 years is projected to range from 138 to 311. A portion of the new roomsare likely to be limited service rooms. But it is important that at least one full servicehotel be included in order to increase the diversify market segmentation and reinforceDowntown as the center of the local lodging and entertainment sector.

8/17/2019 Downtown Olympia Market Analysis
http://slidepdf.com/reader/full/downtown-olympia-market-analysis 70/71
FINAL DRAFT: APRIL 25 2016
OLYMPIA DOWNTOWN STRATEGY MARKET ANALYSIS
PROPERTY COUNSELORS PAGE 69
Table VIl-3Projected Hotel Demand
2015 to 2035
Source: Property Counselors
Baseline Projection2015 2025 2035
Real Growth Rate
2015-2025 2.0%
2025 to 2035 2.0%
City Share 45.0% 45.0% 45.0%
Downtown Share 45% 45% 45%
Thurston County
Projected Tax 715,025 871,612 1,062,490
Projected Room Revenue 35,751,259 43,580,585 53,124,490
Olympia 16,088,067 19,611,263 23,906,021
Downtown 7,239,630 8,825,069 10,757,709
Avg Room Rev. $25,500 $25,500 $25,500
Supportable Rooms 284 346 422
Increase 62 76
High Projection
2015 2025 2035
Real Growth Rate
2011-2021 3.0%
2021 to 2031 3.0%
City Share 50.0% 50.0% 50.0%
Downtown Share 55% 55% 55%
Thurston County
Projected Tax 715,025 960,934 1,291,415
Projected Room Revenue 35,751,259 48,046,703 64,570,751
Olympia 17,875,630 24,023,351 32,285,375
Downtown 9,831,596 13,212,843 17,756,956
Avg Room Rev. $25,500 $25,500 $25,500
Supportable Rooms 386 518 696
Increase 133 178
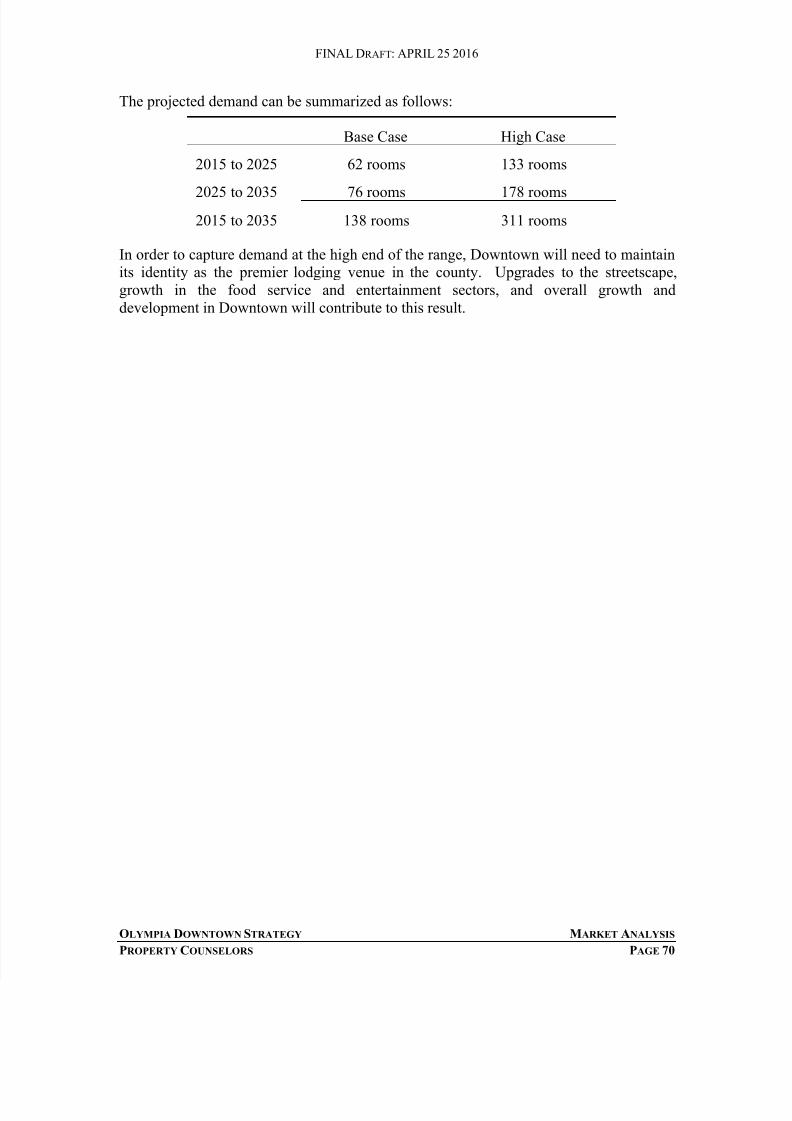
8/17/2019 Downtown Olympia Market Analysis
http://slidepdf.com/reader/full/downtown-olympia-market-analysis 71/71
FINAL DRAFT: APRIL 25 2016
The projected demand can be summarized as follows:
Base Case High Case
2015 to 2025 62 rooms 133 rooms
2025 to 2035 76 rooms 178 rooms2015 to 2035 138 rooms 311 rooms
In order to capture demand at the high end of the range, Downtown will need to maintainits identity as the premier lodging venue in the county. Upgrades to the streetscape,growth in the food service and entertainment sectors, and overall growth anddevelopment in Downtown will contribute to this result.