downstream gas industry - ministry of energy and energy …€¦ · 3.1 urea production ... figure...
TRANSCRIPT
Tower C
International
Waterfront Centre
1 Wrightson Road
Port of Spain
Republic of Trinidad
and Tobago
www.energy.gov.tt
DOWNSTREAM GAS INDUSTRY
ANNUAL REPORT 2011

DISCLAIMER
The Ministry of Energy & Energy Affairs (MEEA) does not accept responsibility for the
accuracy, correctness or completeness of the contents of this report and shall not be
liable for any loss or damage that may be a consequence of direct or indirect use of, or
reliance on, the publication.
ii
Table of Contents
1. OVERVIEW OF THE DOWNSTREAM GAS INDUSTRY 2011 ........................................................ 5
2. AMMONIA ........................................................................................................................... 8
2.1 Ammonia Production .................................................................................................................. 9
2.2 Ammonia Export ......................................................................................................................... 9
2.3 Ammonia Market Perspective (2011) ....................................................................................... 10
2.4 Ammonia Market Outlook (2012) ............................................................................................. 12
2.5 Ammonia Market Outlook (Beyond 2012) ................................................................................ 13
3. UREA .................................................................................................................................. 15
3.1 Urea Production ........................................................................................................................ 15
3.2 Urea Export ............................................................................................................................... 16
3.3 Urea Market Perspective (2011) ............................................................................................... 16
3.4 Urea Market Outlook (2012) ..................................................................................................... 18
4. METHANOL ........................................................................................................................ 19
4.1 Methanol Production ................................................................................................................ 20
4.2 Methanol Export ....................................................................................................................... 20
4.3 Methanol Market Perspective (2011) ....................................................................................... 21
4.4 Methanol Market Outlook (2012) ............................................................................................. 22
4.4 Methanol Market Outlook (Beyond 2012) ................................................................................ 23
5. UREA-AMMONIUM NITRATE (UAN) .................................................................................... 24
5.1 UAN Production ........................................................................................................................ 24
5.2 UAN Export ................................................................................................................................ 24
5.3 UAN Market Perspective ........................................................................................................... 25
6. MELAMINE ......................................................................................................................... 27
6.1 Melamine Production................................................................................................................ 27
6.2 Melamine Export ....................................................................................................................... 27
6.3 Melamine Market Perspective .................................................................................................. 29

iii
7. NATURAL GAS LIQUIDS [from PPGPL] .................................................................................. 30
7.1 NGL Production ......................................................................................................................... 30
7.2 NGL Export ................................................................................................................................ 31
8. IRON AND STEEL PRODUCTS AND CEMENT .......................................................................... 34
9. PROPOSED DOWNSTREAM GAS PROJECTS .......................................................................... 36
10. REFERENCES ....................................................................................................................... 37
List of Tables
Table 1: Petrochemical Production 2010-11 .......................................................................................... 7
Table 2: Petrochemical Exports 2010-11 ................................................................................................ 7
Table 3: Petrochemical Prices 2010-11 ................................................................................................... 7
Table 4: Annual Methanol Capacity additions and timing .................................................................... 21
Table 5: NGL Production 2010-11 ......................................................................................................... 30
Table 6: NGL Exports 2010-11 ............................................................................................................... 31
Table 7: Direct Reduced Iron Production and Export 2010-11 ............................................................. 34
Table 8: Billets Production and Export 2010-11 ................................................................................... 34
Table 9: Wire Rods Production and Export 2010-11 ............................................................................. 35
Table 10: Cement Production and Export 2010-11 .............................................................................. 35
Table 11: Upcoming Downstream Gas Projects .................................................................................... 36

iv
List of Figures
Figure 1: Natural Gas Usage by Sector in Trinidad and Tobago 2011 ..................................................... 6
Figure 2: Ammonia Usage ....................................................................................................................... 8
Figure 3: Ammonia Production and Export 2007-2011 .......................................................................... 8
Figure 4: World Nitrogen Supply/Demand Balance 2008-2012 ........................................................... 11
Figure 5: Ammonia Prices 2010-11 ....................................................................................................... 12
Figure 6: Urea Production and Export 2007-2011 ................................................................................ 15
Figure 7: World Urea Supply/Demand Balance 2008-2012 .................................................................. 16
Figure 8: Urea Prices 2010-11 ............................................................................................................... 17
Figure 9: Global Additions in Urea Capacity ......................................................................................... 18
Figure 10: Methanol Consumer Derivatives for 2010 ........................................................................... 19
Figure 11: Methanol Production and Export 2007-2011 ...................................................................... 20
Figure 12: Methanol Prices 2010-12 ..................................................................................................... 22
Figure 13: UAN Production and Export 2010-2011 .............................................................................. 24
Figure 14: UAN Demand 2009 .............................................................................................................. 25
Figure 15: UAN Export Destinations 2010 ............................................................................................ 26
Figure 16: Urea Ammonium Nitrate (UAN) Prices 2010-11 .................................................................. 26
Figure 17: Melamine Production and Export 2010-2011...................................................................... 27
Figure 18: Melamine Export Destinations 2010 ................................................................................... 28
Figure 19: Melamine Prices 2010-11 .................................................................................................... 28
Figure 20: NGL Production 2007-2011 .................................................................................................. 30
Figure 21: NGL Exports 2007-2011 ....................................................................................................... 32
Figure 22: Billets and Wire Rods Prices 2006-2011 .............................................................................. 35
5
1. OVERVIEW OF THE DOWNSTREAM GAS INDUSTRY 2011
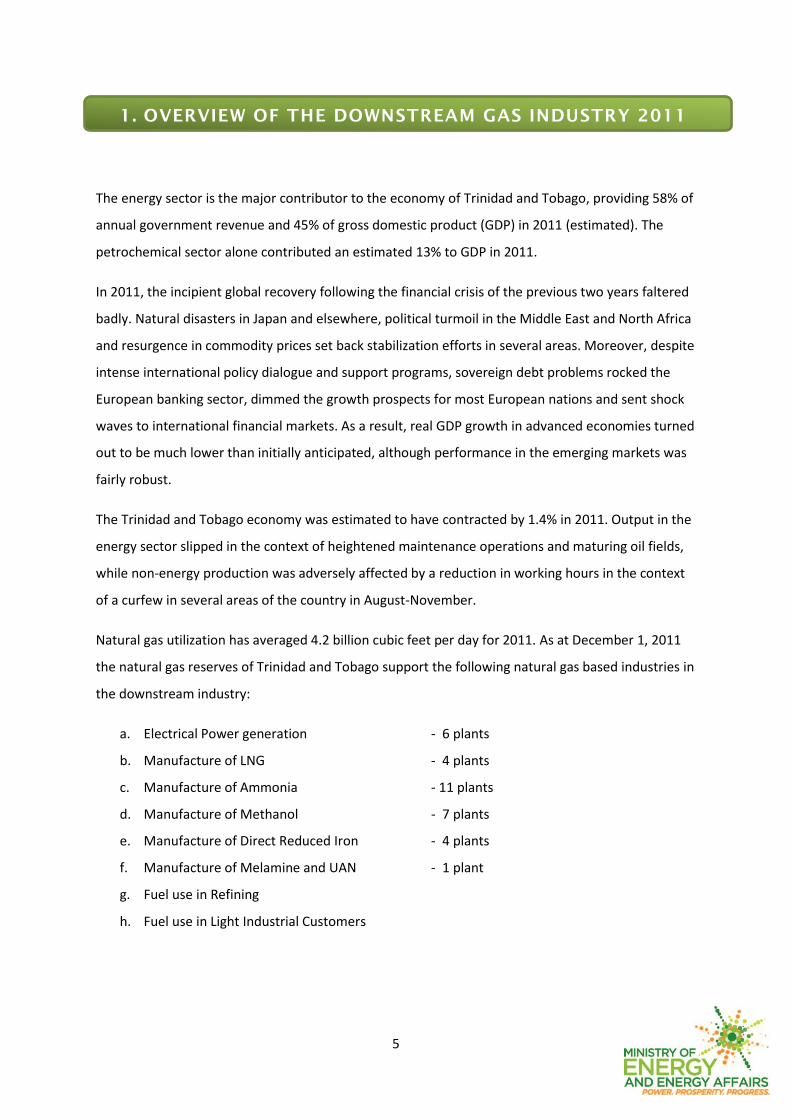
The energy sector is the major contributor to the economy of Trinidad and Tobago, providing 58% of
annual government revenue and 45% of gross domestic product (GDP) in 2011 (estimated). The
petrochemical sector alone contributed an estimated 13% to GDP in 2011.
In 2011, the incipient global recovery following the financial crisis of the previous two years faltered
badly. Natural disasters in Japan and elsewhere, political turmoil in the Middle East and North Africa
and resurgence in commodity prices set back stabilization efforts in several areas. Moreover, despite
intense international policy dialogue and support programs, sovereign debt problems rocked the
European banking sector, dimmed the growth prospects for most European nations and sent shock
waves to international financial markets. As a result, real GDP growth in advanced economies turned
out to be much lower than initially anticipated, although performance in the emerging markets was
fairly robust.
The Trinidad and Tobago economy was estimated to have contracted by 1.4% in 2011. Output in the
energy sector slipped in the context of heightened maintenance operations and maturing oil fields,
while non-energy production was adversely affected by a reduction in working hours in the context
of a curfew in several areas of the country in August-November.
Natural gas utilization has averaged 4.2 billion cubic feet per day for 2011. As at December 1, 2011
the natural gas reserves of Trinidad and Tobago support the following natural gas based industries in
the downstream industry:
a. Electrical Power generation - 6 plants
b. Manufacture of LNG - 4 plants
c. Manufacture of Ammonia - 11 plants
d. Manufacture of Methanol - 7 plants
e. Manufacture of Direct Reduced Iron - 4 plants
f. Manufacture of Melamine and UAN - 1 plant
g. Fuel use in Refining
h. Fuel use in Light Industrial Customers
6
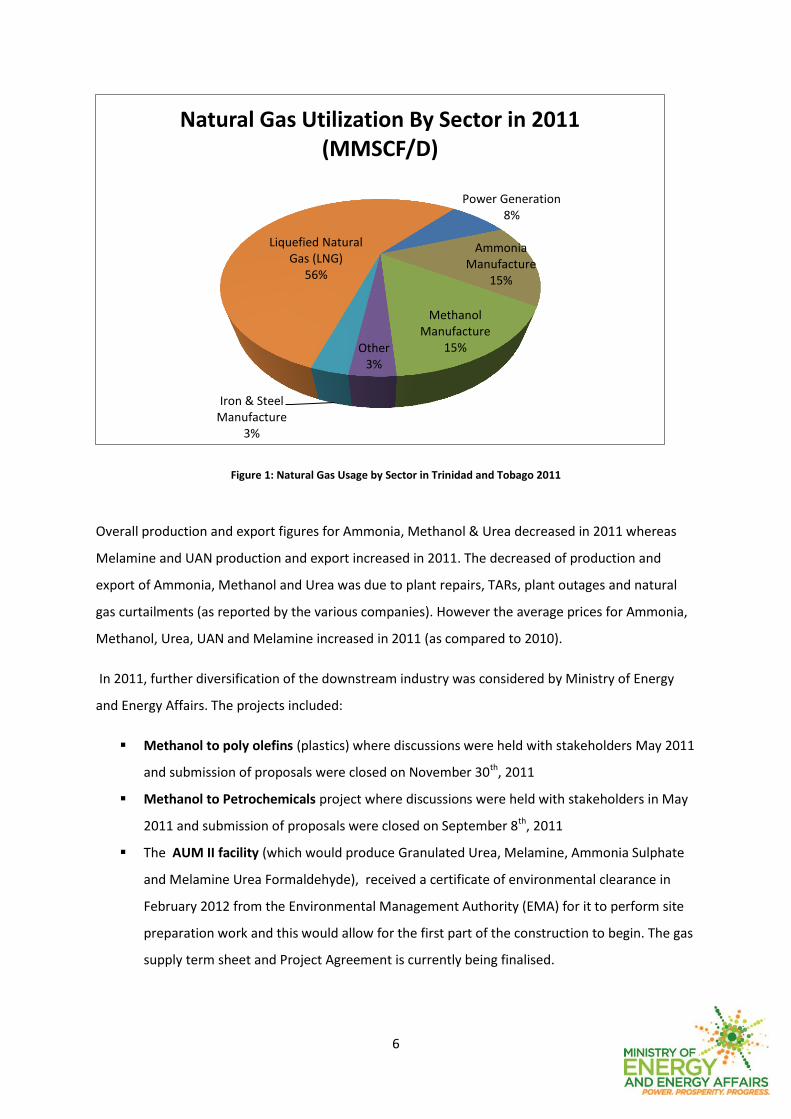
Figure 1: Natural Gas Usage by Sector in Trinidad and Tobago 2011
Overall production and export figures for Ammonia, Methanol & Urea decreased in 2011 whereas
Melamine and UAN production and export increased in 2011. The decreased of production and
export of Ammonia, Methanol and Urea was due to plant repairs, TARs, plant outages and natural
gas curtailments (as reported by the various companies). However the average prices for Ammonia,
Methanol, Urea, UAN and Melamine increased in 2011 (as compared to 2010).
In 2011, further diversification of the downstream industry was considered by Ministry of Energy
and Energy Affairs. The projects included:
Methanol to poly olefins (plastics) where discussions were held with stakeholders May 2011
and submission of proposals were closed on November 30th, 2011
Methanol to Petrochemicals project where discussions were held with stakeholders in May
2011 and submission of proposals were closed on September 8th, 2011
The AUM II facility (which would produce Granulated Urea, Melamine, Ammonia Sulphate
and Melamine Urea Formaldehyde), received a certificate of environmental clearance in
February 2012 from the Environmental Management Authority (EMA) for it to perform site
preparation work and this would allow for the first part of the construction to begin. The gas
supply term sheet and Project Agreement is currently being finalised.
Power Generation 8%
Ammonia Manufacture
15%
Methanol Manufacture
15% Other 3%
Iron & Steel Manufacture
3%
Liquefied Natural Gas (LNG)
56%
Natural Gas Utilization By Sector in 2011 (MMSCF/D)

7
Production
Table 1: Petrochemical Production 2010-11
Export
Table 2: Petrochemical Exports 2010-11
Petrochemical Export / MT
2010 2011
Ammonia 5,254,926 4,669,908
Methanol 5,978,154 5,793,082
Urea 675,711 647,737
UAN 1,194,300 1,509,289
Melamine 13,262 40,805
Price
Table 3: Petrochemical Prices 2010-11
Petrochemical Location Price ($US/MT)
2010 2011
Ammonia Caribbean 361.58 535.64
Methanol US Gulf 328.16 370.08
Urea Caribbean 301.66 426.83
UAN US Gulf 243.34 351.73
Melamine US Gulf 2201.42 2305.83
Petrochemical Production / MT
2010 2011
Ammonia 5,553,242 5,133,860
Methanol 5,932,232 5,902,313
Urea 708,760 625,742
UAN 1,277,839 1,437,713
Melamine 14,345 39,784

8
2. AMMONIA
Ammonia demand is primarily driven by urea consumption, which is mainly a function of fertiliser
demand.
Figure 2: Ammonia Usage (Chemsystems, 2010)
Figure 3: Ammonia Production and Export 2007-2011 (million MT)
Urea Fertilizer 45%
Urea Industrial 10%
Other Industrial
10%
Ammonium Phosphates
5%
Direct Application
3%
Ammonium Nitrates
7%
Other Fertilizers
20%
Global Ammonia Consumption
4.00
4.20
4.40
4.60
4.80
5.00
5.20
5.40
5.60
5.80
2007 2008 2009 2010 2011
Ammonia Production and Export / million MT (2007-2011)
Ammonia Production Ammonia Export
9
2.1 Ammonia Production
The total ammonia production from the eleven ammonia plants (including the new ammonia plant
of the AUM complex) for the period 2011 was 5.13 million metric tonnes (MT). This represented an
8.17% decrease from 2010 which had a total production of 5.5 million MT.
2.2 Ammonia Export
Total ammonia exports from the eleven ammonia plants (with production from AUM diverted into
the export streams of CNC & N2000 ammonia plants) for the period 2011 was 4.67 million MT. This
represented a 12.5% decrease from 2010 which had a total export of 5.25 million MT.
Main ammonia export destinations1 for 2011:
North America- USA, Mexico, El Salvador
Europe- Belgium
South America- Chile, Colombia
Africa- Morocco
The average Caribbean Spot FOB price for ammonia from 2011 was 535.64 $US/MT, while during
2010 the average price was 361.58 $US/MT, as reported in the Fertilizer Market Bulletin.
1 2011 data submitted by CNC, N2K and PLNL

10
2.3 Ammonia Market Perspective (2011)
The ammonia market in 2011 was characterized by a demand-driven rally and widespread
production cutbacks, which created tight supply/demand balance with firm prices prevailing globally
(CRU, 2011). In response to tight market conditions and attractive grain prices, farmers increased the
planted area and crop productivity (Heffer & Prud’homme, 2011).
Agricultural markets remain strong, driven by a disappointing US harvest and robust food and fuel
demand. World fertiliser demand grew firmly and achieved full recovery for all nutrients in 2011/12.
Global fertiliser demand is estimated to have increased by 6.2% in 2010/11 to 173 million MT. This
strong growth was triggered by the sharp rebound of economic activity and tight agricultural
commodity markets (Heffer & Prud’homme, 2011).
Two new ammonia plants were commissioned this year:
Ma’aden Phosphate Company (MPC) (Ras Azzour) – 1.1 million metric tonnes per year
(MTPY)
Qatar Fertiliser Company (QAFCO V) – 3.8 million MTPY
The majority of this ammonia capacity is specifically intended for further processing into
diammonium phosphate (DAP) at Ras Azzour and urea at QAFCO V.
The start-up of a large-scale Ma’aden ammonia plant in Q1 2011 was eagerly absorbed by the
market adding no relief to the persistent market tightness and climbing prices. QAFCO V started-up
on August 30, 2011, making the Qatar Fertiliser Company the largest single-site producer of
ammonia and urea in the world. The plant ran at 80-85% capacity till September 8, 2011. The plant
shut down because of equipment failure, major problems with the boiler. It then restarted on
January 26, 2012, with the urea line scheduled to start up shortly. On February 8, 2012 the Qafco V
line went down again.
The success of the shale gas development in North America made the re-start of another two
ammonia plants in the U.S.A. possible (CRU, 2011).

11
Figure 4: World Nitrogen Supply/Demand Balance 2008-2012 (Heffer & Prud’homme, 2011)
Global nutrient supply in 2011 continued to recover from the depressed levels in 2008. Fertiliser
demand was firm in North and Latin America, South Asia and Central Europe, while recovering in
Eastern Europe and Central Asia. The rate of growth is seen as slowing down in East and West Asia
and West Europe.
The main developments in international trade have included a rather static level of imports for
nearly all products, firm import demand in South Asia and Latin America, and a recovery of fertilizer
demand and imports in North America and East Asia. As in the past two years, China’s export tariffs
continue to impact the global trade of urea and DAP. A reduction of exports from China has created
sales opportunities for other exporting countries. However, China has exported a significant tonnage
of nitrogen and phosphate to India and South-East Asia.
From the geographical angle, the market leader for ammonia is China with Asia-Pacific
demonstrating large-scale growth rates. Other important market participants include several
countries of Eastern Europe – Russia, Ukraine, and Croatia.
Trinidad and Tobago has contributed 59% of U.S. ammonia imports over the period 2007-10.
115
120
125
130
135
140
145
2008 2009 2010 2011e 2012e
World Nitrogen Supply/Demand Balance
Supply Demand

12
Figure 5: Ammonia Prices 2010-11
Prices have reflected the overall growth in the market and strong demand. Only in December have
ammonia prices have fallen abruptly by 14% after a general sharp increase over the past four
months. This is because of an oversupply in the market coupled with a reduction in demand. This
reduction in demand extends worldwide with the sharpest declines seen in Europe. The fall-off in
demand has been attributed to the unsustainable sharp rises in prices over the past year as the
market continues to recover from the all-time low in 2008. This, in turn, has contributed to a
relatively lesser drop in downstream ammonia products such as urea and urea ammonium nitrate
(UAN).
2.4 Ammonia Market Outlook (2012)
The global ammonia market looks set to remain firm through 2012. New capacity is due to come on
stream over the year but downstream demand is also rising. Prices are likely to remain at historically
high levels as a result.
Two new ammonia plants (1.8 million MTPY) are expected to be commissioned this year:
Algeria: Orascom Construction Industries (OCI) (Sorfert) – 0.8 million MTPY [Q1 2012]
Egypt: Misr Fertilizer Production Company (MOPCO) – 1.0 million MTPY [Q2 2012]
0.00
100.00
200.00
300.00
400.00
500.00
600.00
700.00
800.00
$U
S/M
etr
ic T
on
ne
Ammonia Prices 2010-11
CARIBBEAN SPOT FOB US GULF SPOT C&F NW EUROPE SPOT DUTY PAID

13
At the same time, around 1.3 million MT of merchant availability will be lost to captive downstream
urea and phosphates production and there will be another 0.5 million MT of increased requirements
from existing buyers (Clarke, 2011).
The demand on the global ammonia market is boosting due to impressive growth tempo of such
new-age technologies and markets as biofuels, NOs emissions, NPK/NP, AdBlue, etc. The global
ammonia market is therefore on the expansion track and is projected to reach up to 170 million MT
in four-year time (Merchant Research & Consulting, Ltd, 2012).
China is the largest market and consumes almost one-third of the world’s ammonia. Although it is
the largest global producer, it uses virtually all that it produces and is not a significant factor in world
trade.
World fertiliser demand is expected to rise steadily in 2011/12 to a record 178 million MT. Current
high agricultural commodity prices are boosting fertiliser demand in market-oriented economies as
farmers try to optimize yields. If prices remain high in 2012, farmers will likely maintain higher
nitrogen application rates, as in 2011, and limit phosphorus and potassium.
2.5 Ammonia Market Outlook (Beyond 2012)
Several companies have announced plans to build new ammonia plants in Africa, Brazil, Brunei,
China, India, Indonesia, Malaysia, and Turkmenistan, which would add about 6.7 million MT of
annual production capacity within the next two to four years. The largest growth in ammonia
production is in Africa and Brazil (Apodaca, 2012).
According to the International Fertilizer Industry Association (IFA) 2011, global ammonia capacity
will increase by 20% to 224.1 million MTPY by 2014. Only a fraction of the overall net capacity
increase will be as merchant ammonia supply since the majority of these projects are associated
with increases in downstream capacity for urea and processed phosphates.
The bulk of the growth will be in China, Middle East, Latin America and Africa. The main additions to
capacity would occur in East Asia (China and Vietnam), Africa (Algeria and Egypt), West Asia (Qatar,
Iran and Saudi Arabia) and South Asia (India and Pakistan). Therefore, the higher rates of urea
consumption growth are in regions where agriculture remains a major sector in national economies
(such as South America, Central and Eastern Europe and Asia).

14
In the medium term, the positive agricultural outlook is expected to stimulate fertilizer demand.
World demand is projected to be 188.3 million MT in 2014/15.
Forecasts to 2012/13 are highly speculative due to the depressed economic context in advanced
economies, which could possibly deteriorate in 2012, dampening world economic activity.
Agricultural commodity prices remain attractive but are highly volatile. Consequently, global
fertiliser demand in 2012/13 would continue to grow, but at a more moderate rate than in 2011/12.
15
3. UREA
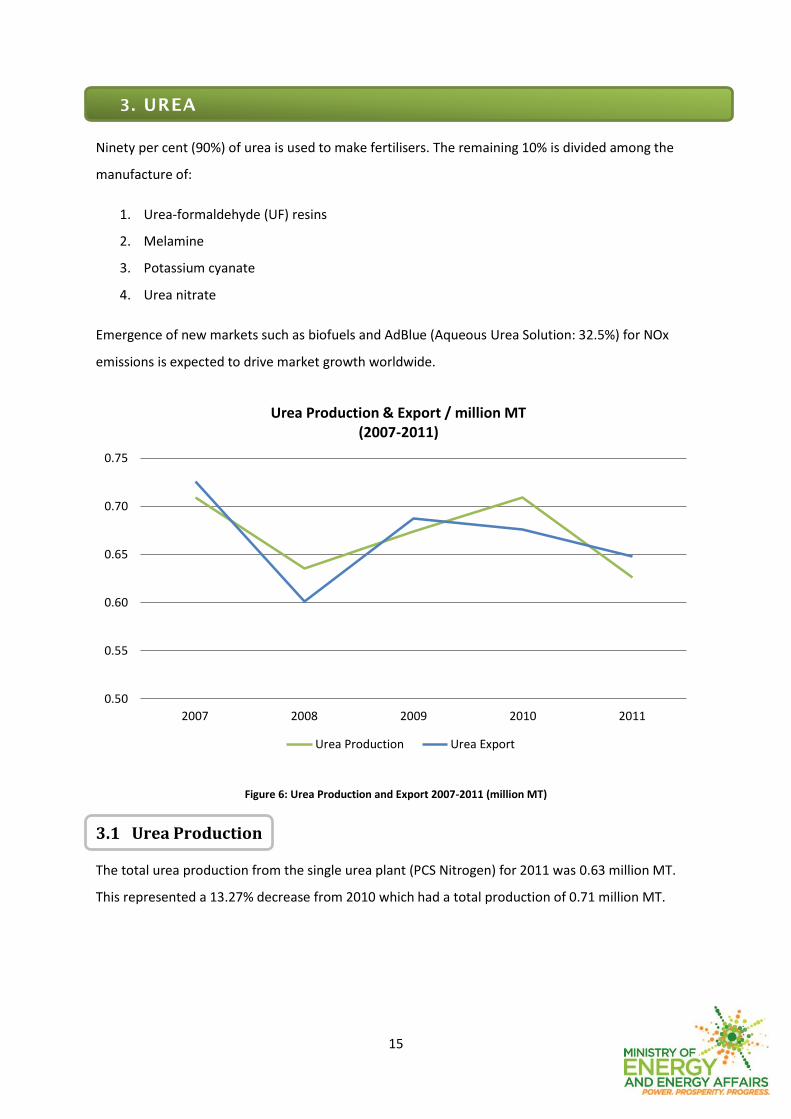
Ninety per cent (90%) of urea is used to make fertilisers. The remaining 10% is divided among the
manufacture of:
1. Urea-formaldehyde (UF) resins
2. Melamine
3. Potassium cyanate
4. Urea nitrate
Emergence of new markets such as biofuels and AdBlue (Aqueous Urea Solution: 32.5%) for NOx
emissions is expected to drive market growth worldwide.
Figure 6: Urea Production and Export 2007-2011 (million MT)
3.1 Urea Production
The total urea production from the single urea plant (PCS Nitrogen) for 2011 was 0.63 million MT.
This represented a 13.27% decrease from 2010 which had a total production of 0.71 million MT.
0.50
0.55
0.60
0.65
0.70
0.75
2007 2008 2009 2010 2011
Urea Production & Export / million MT (2007-2011)
Urea Production Urea Export
16
3.2 Urea Export
Total urea exports from the single urea plant (PCS Nitrogen) for the 2011 was 0.65 million MT. This
represented a 4.32% decrease from 2010 which had a total export of 0.68 million MT.
The average Caribbean price for urea for 2011 was 426.83 $US/MT while in 2010, the price was
301.66 $US/MT as reported in the Fertilizer Market Bulletin publication.
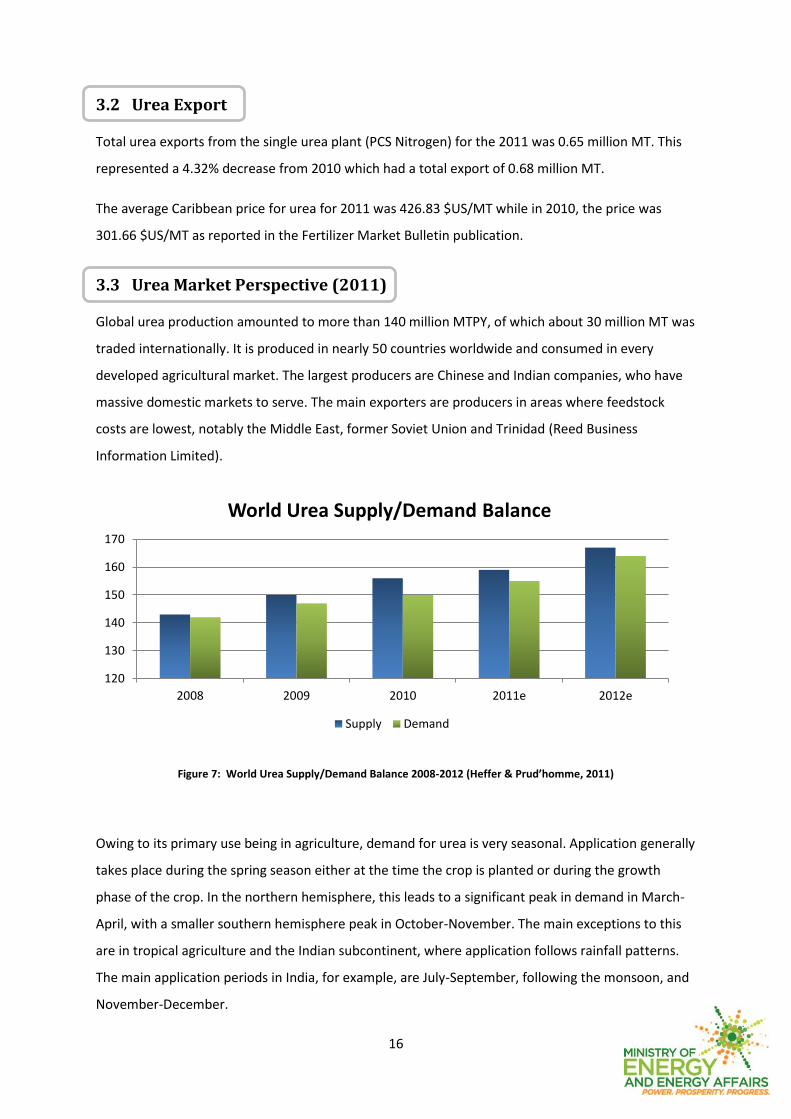
3.3 Urea Market Perspective (2011)
Global urea production amounted to more than 140 million MTPY, of which about 30 million MT was
traded internationally. It is produced in nearly 50 countries worldwide and consumed in every
developed agricultural market. The largest producers are Chinese and Indian companies, who have
massive domestic markets to serve. The main exporters are producers in areas where feedstock
costs are lowest, notably the Middle East, former Soviet Union and Trinidad (Reed Business
Information Limited).
Figure 7: World Urea Supply/Demand Balance 2008-2012 (Heffer & Prud’homme, 2011)
Owing to its primary use being in agriculture, demand for urea is very seasonal. Application generally
takes place during the spring season either at the time the crop is planted or during the growth
phase of the crop. In the northern hemisphere, this leads to a significant peak in demand in March-
April, with a smaller southern hemisphere peak in October-November. The main exceptions to this
are in tropical agriculture and the Indian subcontinent, where application follows rainfall patterns.
The main application periods in India, for example, are July-September, following the monsoon, and
November-December.
120
130
140
150
160
170
2008 2009 2010 2011e 2012e
World Urea Supply/Demand Balance
Supply Demand
17
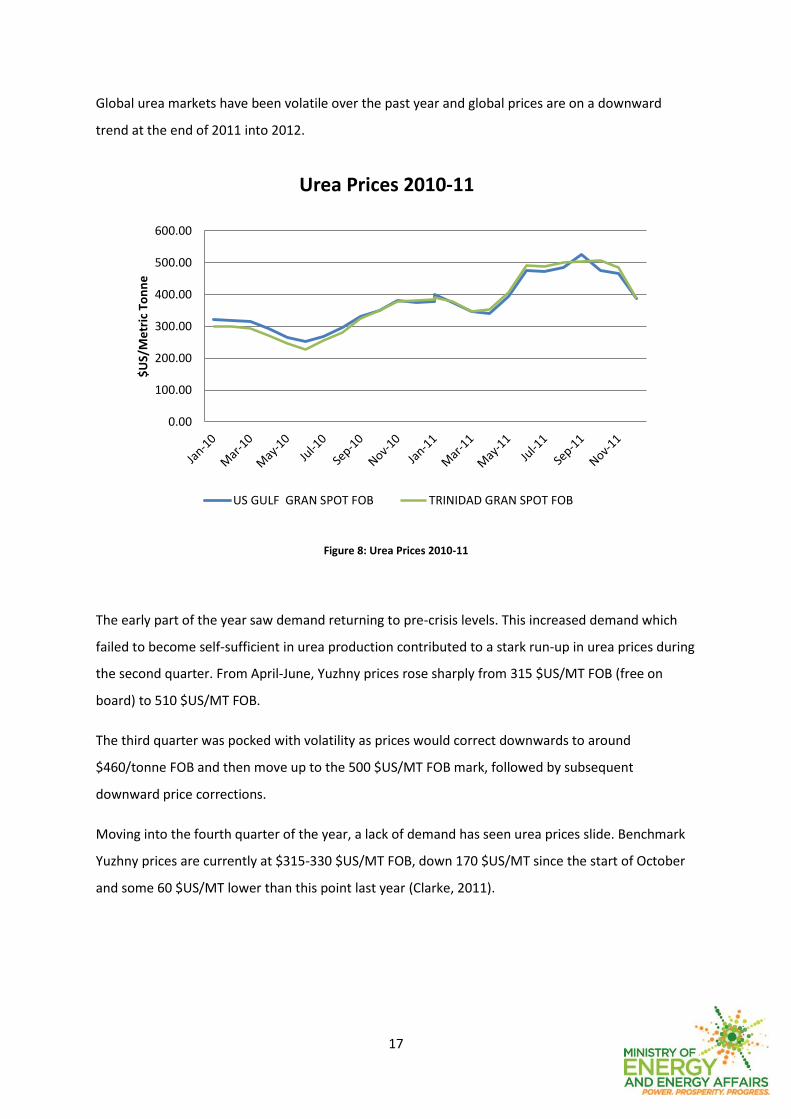
Global urea markets have been volatile over the past year and global prices are on a downward
trend at the end of 2011 into 2012.
Figure 8: Urea Prices 2010-11
The early part of the year saw demand returning to pre-crisis levels. This increased demand which
failed to become self-sufficient in urea production contributed to a stark run-up in urea prices during
the second quarter. From April-June, Yuzhny prices rose sharply from 315 $US/MT FOB (free on
board) to 510 $US/MT FOB.
The third quarter was pocked with volatility as prices would correct downwards to around
$460/tonne FOB and then move up to the 500 $US/MT FOB mark, followed by subsequent
downward price corrections.
Moving into the fourth quarter of the year, a lack of demand has seen urea prices slide. Benchmark
Yuzhny prices are currently at $315-330 $US/MT FOB, down 170 $US/MT since the start of October
and some 60 $US/MT lower than this point last year (Clarke, 2011).
0.00
100.00
200.00
300.00
400.00
500.00
600.00
$U
S/M
etr
ic T
on
ne
Urea Prices 2010-11
US GULF GRAN SPOT FOB TRINIDAD GRAN SPOT FOB

18
3.4 Urea Market Outlook (2012)
The global economic situation is causing some uncertainty in fertiliser pricing, dampening trade in
general. Increasing demand for food, however, maintains an underlying upward pressure on prices
which is likely to continue until fertiliser supply exceeds demand by a safe margin.
Urea prices are not expected to drop to the post-crisis low of $205/MT FOB seen in December 2008,
but the short term prospects for price improvement do not look favourable. Effectively, northern
hemisphere spring demand will play the largest role in price determination late in the first quarter of
2012 and into the second.
But by the end of 2012, an expected additional 4 million MT of annual granular urea capacity is due
to come online and the market will be oversupplied, which will help keep prices at lower levels than
seen over the past year.
Qafco is scheduled to start up its 1.3 million MTPY Qafco V urea plant in February 2012 and then a
second 1.3 million MTPY Qafco VI plant in Q4 2012. Additionally, in Algeria, Sorfert is due to start up
a 1.1-1.2 million MTPY plant in Q1 2012, and MOPCO in Egypt is due to start two 660,000 MTPY
plants in the second half of the year. Additional capacity is also due on-stream in Vietnam and
Venezuela.
While there may be some delays to these projects, it is clear that the urea market looks to be
moving into an oversupply situation in the next few years.
Figure 9: Global Additions in Urea Capacity (excluding China) (PotashCorp, 2010)
0
1
2
3
4
5
2010 2011F 2012F 2013F 2014F
Global Urea Capacity Additions
Iran Qatar UAE Algeria Egypt Pakistan Venezuela Other

19
4. METHANOL
Figure 10: Methanol Consumer Derivatives for 2010 (CMAI, 2010)
Smaller methanol derivatives include:
Dimethyl Terephthalate (DMT)
Methyl methacrylate (MMA)
Chloromethane
Methylamines
Glycol Methyl ethers
Fuel
New uses of methanol are also expected to grow with increased methanol consumption for use in
methanol to olefins/methanol to propylene plants.
Formaldehyde 31%
Gasoline/Fuels 15%
MTBE/TAME 12%
Acetic Acid 11%
Other 31%
Global Methanol Derivatives (2010)

20
Figure 11: Methanol Production and Export 2007-2011 (million MT)
4.1 Methanol Production
The total methanol production from the seven methanol plants in 2011 was 5.90 million MT.
This represented a 0.51 % decrease from 2010 which had a total production of 5.93 million
MT.
4.2 Methanol Export
Total methanol exports from the seven methanol plants for 2011 amounted to 5.79 MT. This
represented a 3.19 % decrease from 2010 which had a total export of 5.98 MT.
Main methanol export destinations2 for 2011:
North America- USA, Canada, Mexico, Panama
Europe- Belgium, Greece, Spain, France, Italy, Netherlands, Portugal
South America- Peru, Chile, Colombia
Asia- South Korea
The average US Gulf price for methanol for 2011 was 370.08 $US/MT, while during 2010 the
average price was 328.16 $US/MT, as reported in the IHS Methanol Market Reports.
2 2011 data only submitted by Methanex
5.00
5.20
5.40
5.60
5.80
6.00
6.20
6.40
2007 2008 2009 2010 2011
Methanol Production & Export/ million MT (2007-2011)
Methanol Production Methanol Export
21
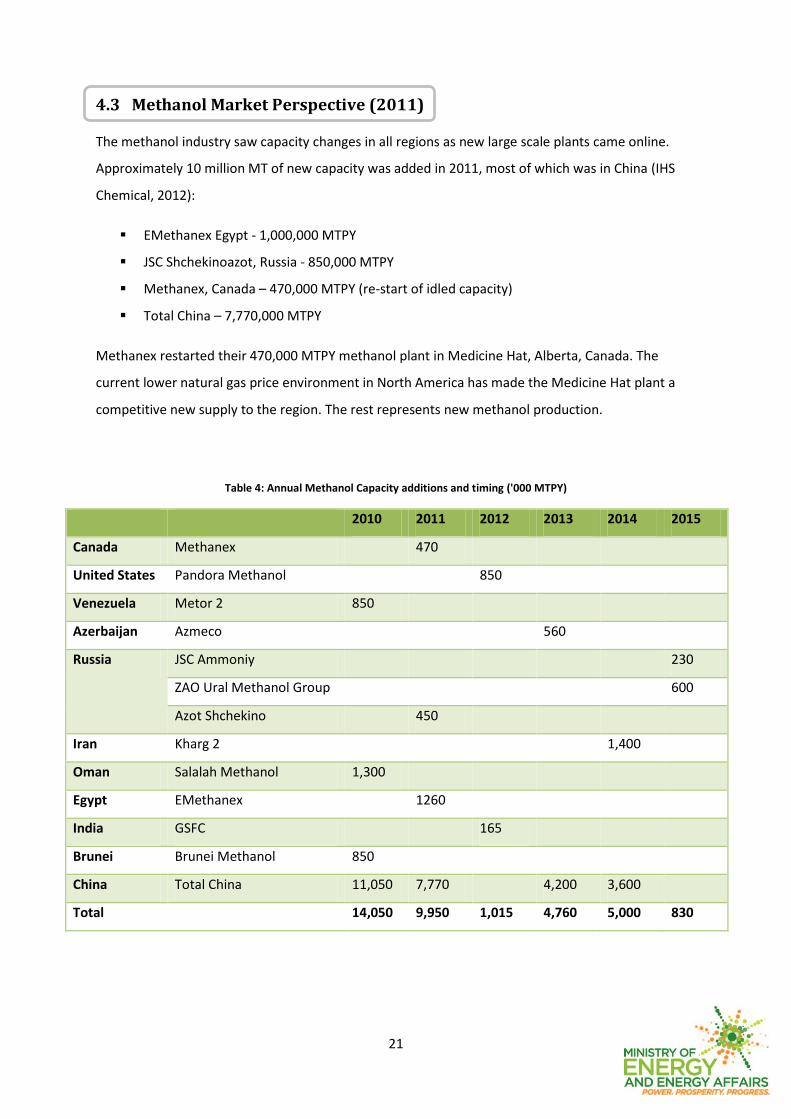
4.3 Methanol Market Perspective (2011)
The methanol industry saw capacity changes in all regions as new large scale plants came online.
Approximately 10 million MT of new capacity was added in 2011, most of which was in China (IHS
Chemical, 2012):
EMethanex Egypt - 1,000,000 MTPY
JSC Shchekinoazot, Russia - 850,000 MTPY
Methanex, Canada – 470,000 MTPY (re-start of idled capacity)
Total China – 7,770,000 MTPY
Methanex restarted their 470,000 MTPY methanol plant in Medicine Hat, Alberta, Canada. The
current lower natural gas price environment in North America has made the Medicine Hat plant a
competitive new supply to the region. The rest represents new methanol production.
Table 4: Annual Methanol Capacity additions and timing ('000 MTPY)
2010 2011 2012 2013 2014 2015
Canada Methanex 470
United States Pandora Methanol 850
Venezuela Metor 2 850
Azerbaijan Azmeco 560
Russia JSC Ammoniy 230
ZAO Ural Methanol Group 600
Azot Shchekino 450
Iran Kharg 2 1,400
Oman Salalah Methanol 1,300
Egypt EMethanex 1260
India GSFC 165
Brunei Brunei Methanol 850
China Total China 11,050 7,770 4,200 3,600
Total 14,050 9,950 1,015 4,760 5,000 830
22
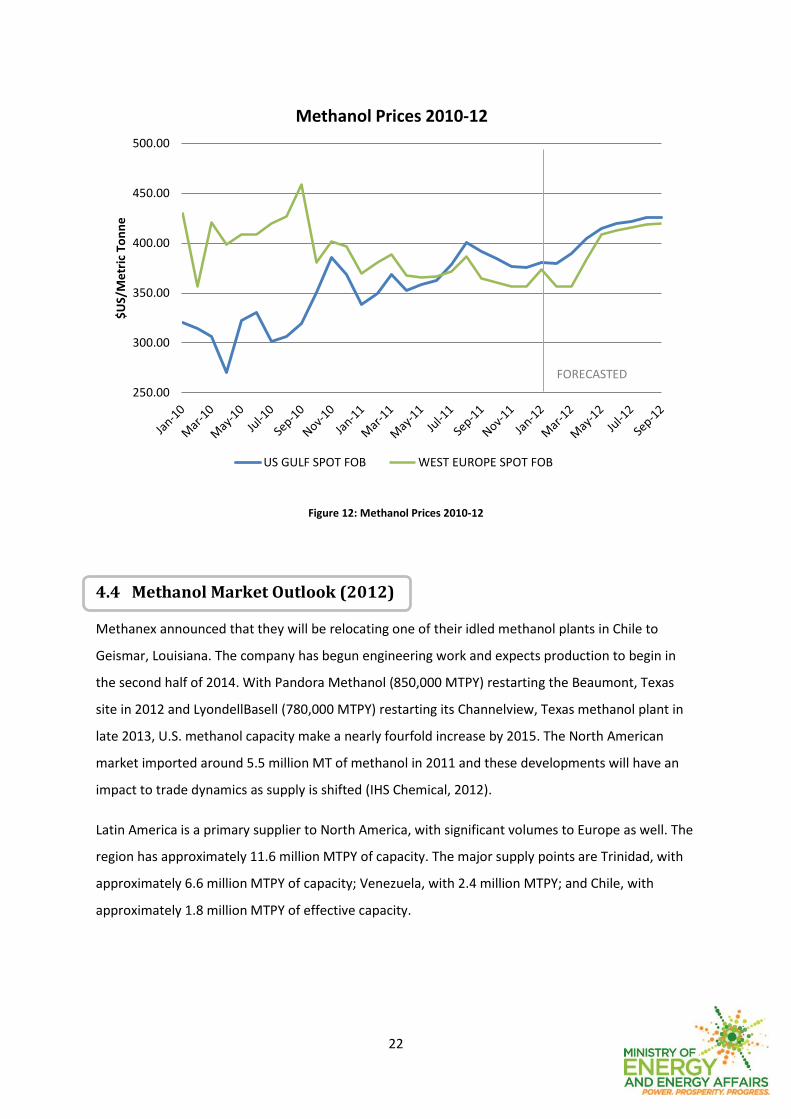
Figure 12: Methanol Prices 2010-12
4.4 Methanol Market Outlook (2012)
Methanex announced that they will be relocating one of their idled methanol plants in Chile to
Geismar, Louisiana. The company has begun engineering work and expects production to begin in
the second half of 2014. With Pandora Methanol (850,000 MTPY) restarting the Beaumont, Texas
site in 2012 and LyondellBasell (780,000 MTPY) restarting its Channelview, Texas methanol plant in
late 2013, U.S. methanol capacity make a nearly fourfold increase by 2015. The North American
market imported around 5.5 million MT of methanol in 2011 and these developments will have an
impact to trade dynamics as supply is shifted (IHS Chemical, 2012).
Latin America is a primary supplier to North America, with significant volumes to Europe as well. The
region has approximately 11.6 million MTPY of capacity. The major supply points are Trinidad, with
approximately 6.6 million MTPY of capacity; Venezuela, with 2.4 million MTPY; and Chile, with
approximately 1.8 million MTPY of effective capacity.
250.00
300.00
350.00
400.00
450.00
500.00
$U
S/M
etr
ic T
on
ne
Methanol Prices 2010-12
US GULF SPOT FOB WEST EUROPE SPOT FOB
FORECASTED
23
4.4 Methanol Market Outlook (Beyond 2012)
Thus from 2010 to 2015, North American capacity will grow by 2.9 million MT, a near fourfold
increase. Meanwhile from 2010 to 2015, North American domestic demand is expected to grow by
around 670,000 MT, meaning that the capacity additions far exceed demand growth and a large
volume of imports will not be needed due to this growth in capacity. With domestic capacity running
at 85% on average, in effect we will see the region shift from a situation in which imports represent
around 95% of domestic demand to a market in which imports represent around 58% of domestic
demand. On a volume basis this means that around 2 million MT less methanol will be sent to North
America in 2015 when compared to 2010.
China will restructure its methanol industry in the next five years with improvements in energy
conversion rates, rationalization of uncompetitive assets, and controls on new builds. In derivatives,
China will encourage strategic new sectors in specialties, new energy feedstocks, and biopharma.
The Methanol-to-Olefins (MTO) and Methanol-to-Propylene (MTP) will receive emphasis with
production in resource-rich regions. MTO/MTP is fast emerging with yet unknown implications to
the merchant methanol market, growing from nothing in 2009 to 20.1 million MT of demand in
2016. With some of the MTO/MTP plants sourcing from the merchant market and many plants
sourcing merchant material (with up to 2 million MT methanol demand rates) during extended start-
ups, this has a dramatic impact on merchant methanol.
There are no further capacity additions in the Middle East apart from Iran due to gas availability
issues. Iran has 14 methanol projects under consideration totalling 4 million MT forecasted to come
on-stream by the end of 2016. However, the November 2011 sanctions targeting the petrochemical
industry are likely to delay these projects. There is little demand growth in West Europe through to
2016 averaging just 2.5%. Africa is set to become the new Middle East with ever increasing
quantities of gas being discovered in Ghana, Mozambique, Nigeria and Tanzania and the likelihood
of further capacity being added in Algeria and Egypt. Projects totalling 9.6 million MT have been
identified but unlikely to be on-stream until after 2016.

24
5. UREA-AMMONIUM NITRATE (UAN)
Urea-ammonium nitrate (UAN) is made by dissolving urea and ammonium nitrate in water. This
results an aqueous solution usually containing 28% nitrogen by weight (a more concentrated
product containing 32% is also available in some locations). Liquid UAN solution is popular because
of the versatility of a liquid source, as well as widespread availability.
UAN can be applied more uniformly than non-liquid forms of fertilizer. It can be mixed with
herbicides, pesticides, and other nutrients, permitting farmers to reduce costs by applying several
materials simultaneously rather than making several separate applications.
Figure 13: UAN Production and Export 2010*-2011 (million MT)
*UAN export commenced February 2010
5.1 UAN Production
The total UAN production from the AUM I complex for the period 2011 was 1.44 million MT. This
represented an 11% increase from 2010 which had a total production of 1.28 million MT.
5.2 UAN Export
The total UAN exported from the AUM I complex for 2011 was 1.51 million MT. This represented a
20% increase from 2010 which had a total export of 1.19 million MT.
The average NOLA Gran Spot FOB price for UAN for 2011 was 351.73 $US/MT, while during 2010 the
average price was 243.34 $US/MT, as reported in the Fertilizer Market Bulletin. The average Rouen
1.00
1.10
1.20
1.30
1.40
1.50
1.60
2010 2011
UAN Production & Export/ million MT (2010-2011)
UAN Production UAN Export
25
Gran Spot FOB price for UAN for 2011 was 237.44 € EURO/MT, while during 2010 the average price
was 176.07 € EURO/MT, as reported in the Fertilizer Market Bulletin.
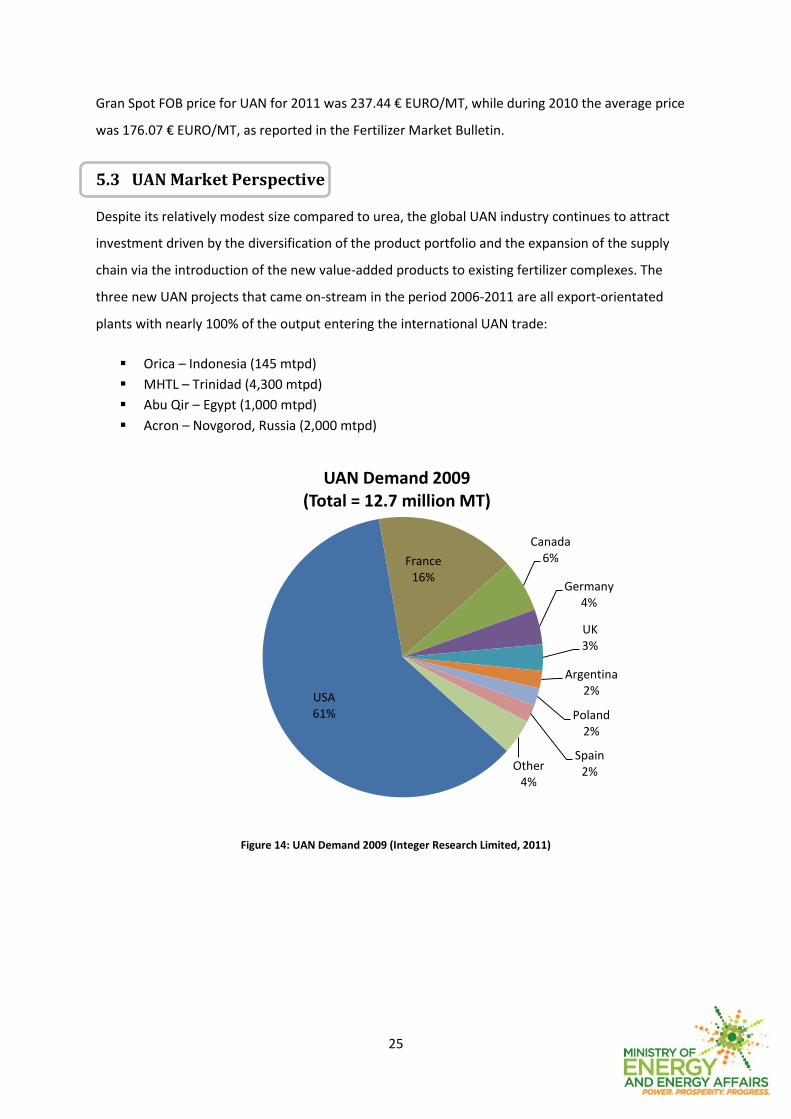
5.3 UAN Market Perspective
Despite its relatively modest size compared to urea, the global UAN industry continues to attract
investment driven by the diversification of the product portfolio and the expansion of the supply
chain via the introduction of the new value-added products to existing fertilizer complexes. The
three new UAN projects that came on-stream in the period 2006-2011 are all export-orientated
plants with nearly 100% of the output entering the international UAN trade:
Orica – Indonesia (145 mtpd)
MHTL – Trinidad (4,300 mtpd)
Abu Qir – Egypt (1,000 mtpd)
Acron – Novgorod, Russia (2,000 mtpd)
Figure 14: UAN Demand 2009 (Integer Research Limited, 2011)
USA 61%
France 16%
Canada 6%
Germany 4%
UK 3%
Argentina 2%
Poland 2%
Spain 2% Other
4%
UAN Demand 2009 (Total = 12.7 million MT)

26
Figure 15: UAN Export Destinations 2010
Figure 16: Urea Ammonium Nitrate (UAN) Prices 2010-11
USA 41%
Argentina 29%
France 26%
Germany 2%
Argentina 2%
UAN Export Destinations 2010 Total = 1.2 million MT
0.00
50.00
100.00
150.00
200.00
250.00
300.00
0.00
50.00
100.00
150.00
200.00
250.00
300.00
350.00
400.00
Euro
/Me
tric
To
nn
e
$U
S/M
etr
ic T
on
ne
Urea Ammonium Nitrate (UAN) Prices 2010-11
US SPOT FOB EUROPE SPOT FOB

27
6. MELAMINE
Melamine is used in a wide range of applications and is primarily produced in Europe, Asia and North
America. The chemical is used in laminates, surface coatings, flame resistant materials, textiles and
moulding compounds. Demand for melamine between 2011 and 2015 is expected to grow at 3%-5%
across the world.
Figure 17: Melamine Production and Export 2010*-2011 (MT)
*Melamine production commenced May 2010 and export began June 2010
6.1 Melamine Production
The total Melamine production from the AUM I complex for the period 2011 was 39,784 MT. This
represented a 63.94% increase from 2010 which had a total production of 14,345 MT.
6.2 Melamine Export
The total Melamine exported from the AUM I complex for 2011 was 40,805 MT. This represented a
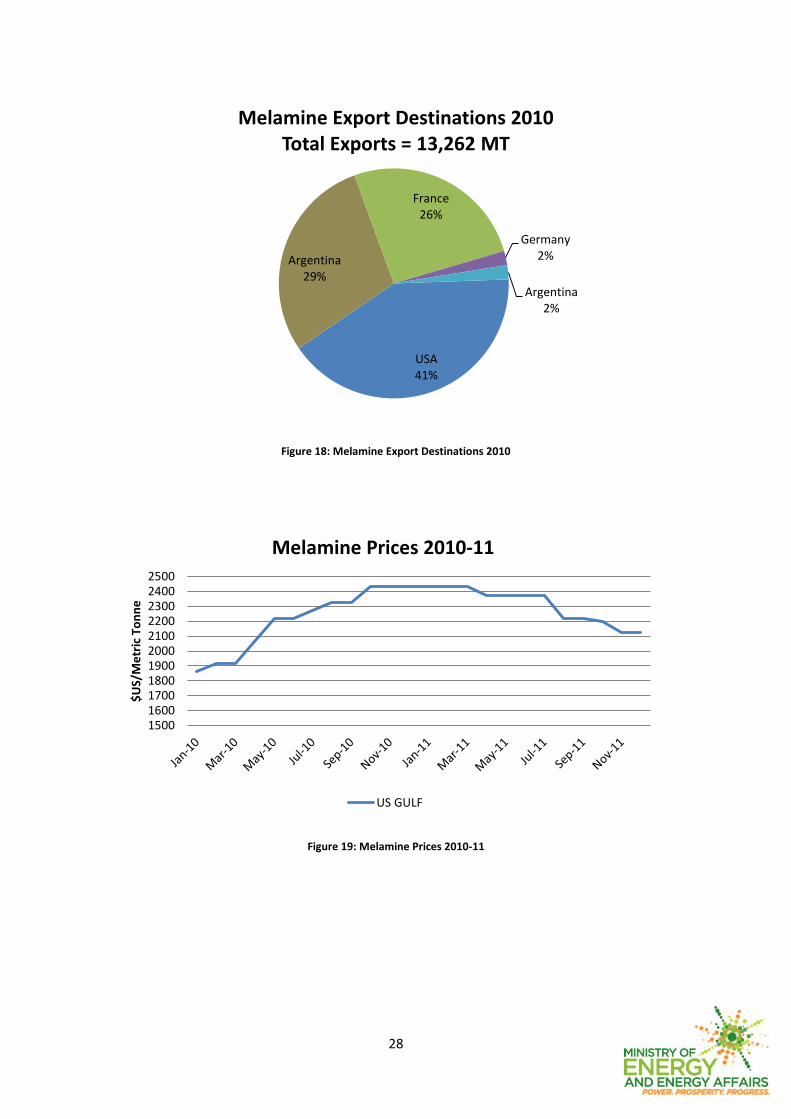
67.5% increase from 2010 which had a total production of 13,262 MT.
The average US Gulf price for melamine for 2011 was 2305.83 $US/MT, while during 2010 the
average price was 2201.42 $US/MT.
0
10000
20000
30000
40000
50000
2010 2011
Melamine Production & Export / MT (2010-2011)
Melamine Production Melamine Export
28
Figure 18: Melamine Export Destinations 2010
Figure 19: Melamine Prices 2010-11
USA 41%
Argentina 29%
France 26%
Germany 2%
Argentina 2%
Melamine Export Destinations 2010 Total Exports = 13,262 MT
15001600170018001900200021002200230024002500
$U
S/M
etr
ic T
on
ne
Melamine Prices 2010-11
US GULF

29
6.3 Melamine Market Perspective
The current world market for melamine is tight. Supplies constricted in early 2010, as world
consumption accelerated in response to recovering economies. Factors behind the tightness in
supply include production outages, low inventories, increased world consumption and the fact that
melamine production from capacity commissioned in mid-2010 did not contribute significantly to
world supply.
China is the largest single participant in the melamine market, accounting for 39% of world
consumption in 2010; it accounted for 53%, 46% and 26% of world capacity, production and exports,
respectively, in 2010. This trend is expected to continue during 2012–2015, as significant growth in
Chinese consumption will result in the commissioning of additional capacity and increased
production. Europe is the second-largest melamine market, accounting for nearly 32% of world
consumption in 2010.
World consumption of melamine is expected to be robust during 2012–2015; average annual growth
is expected to be 3–5% in most regions. China, Central and South America, the Middle East, and
Central and Eastern Europe are expected to exhibit rapid demand growth.
China is forecast to experience the fastest growth rates (around 8%) and volume increases in
melamine consumption during 2010–2015. However, China's share of exports is expected to decline
as a result of increased domestic consumption, competition from other sources of supply including
Qatar and Trinidad, and increased regionalization of supply, in which many consuming regions are
likely to source melamine locally.
During 2010–2015, melamine consumption in Europe is forecast to grow at an average annual rate
of almost 4%. Growth in Central and Eastern Europe is expected at almost 8%, largely the result of
increased production of laminates and wood adhesives; consumption growth in Western Europe is
forecast at a more moderate rate of 3.0% during 2010–2015. Other Asian countries, excluding Japan,
are expected to show large volume increases during 2010–2015, at an average annual growth rate of
4.4%.
Overall economic performance will continue to be the best indicator of future demand for
melamine. Demand in most downstream markets is greatly influenced by general economic
conditions. As a result, demand largely follows the patterns of the leading world economies. The
major end-use markets include construction/remodelling, automotive production and original
equipment manufacture (OEM).

30
7. NATURAL GAS LIQUIDS3 [from PPGPL]
7.1 NGL Production
Table 5: NGL Production 2010-11
Production/ million BBL
2010 2011
Propane 6.32 5.84
Butane 4.76 4.51
Natural Gasoline 6.14 5.69
Figure 20: NGL Production 2007-2011 (bbl)
Propane
The total propane production in 2011 was 5.84 million bbl. This represented an 8.27%
decrease from 2010 which had a total production of 6.32 million bbl.
3 PPGPL production & export of commercial grade NGLs of particular specifications (not National NGL
production)
3.00
3.50
4.00
4.50
5.00
5.50
6.00
6.50
2007 2008 2009 2010 2011
NGL Production/ BBL (2007- 2012)
Propane Butane Natural Gasoline
31
Butane
The total butane production in 2011 was 4.51 million bbl. This represented a 5.43%
decrease from 2010 which had a total production of 4.76 million bbl.
Natural Gasoline
The total natural gasoline production in 2011 was 5.69 million bbl. This represented a 7.95%
decrease from 2010 which had a total production of 6.14 million bbl.
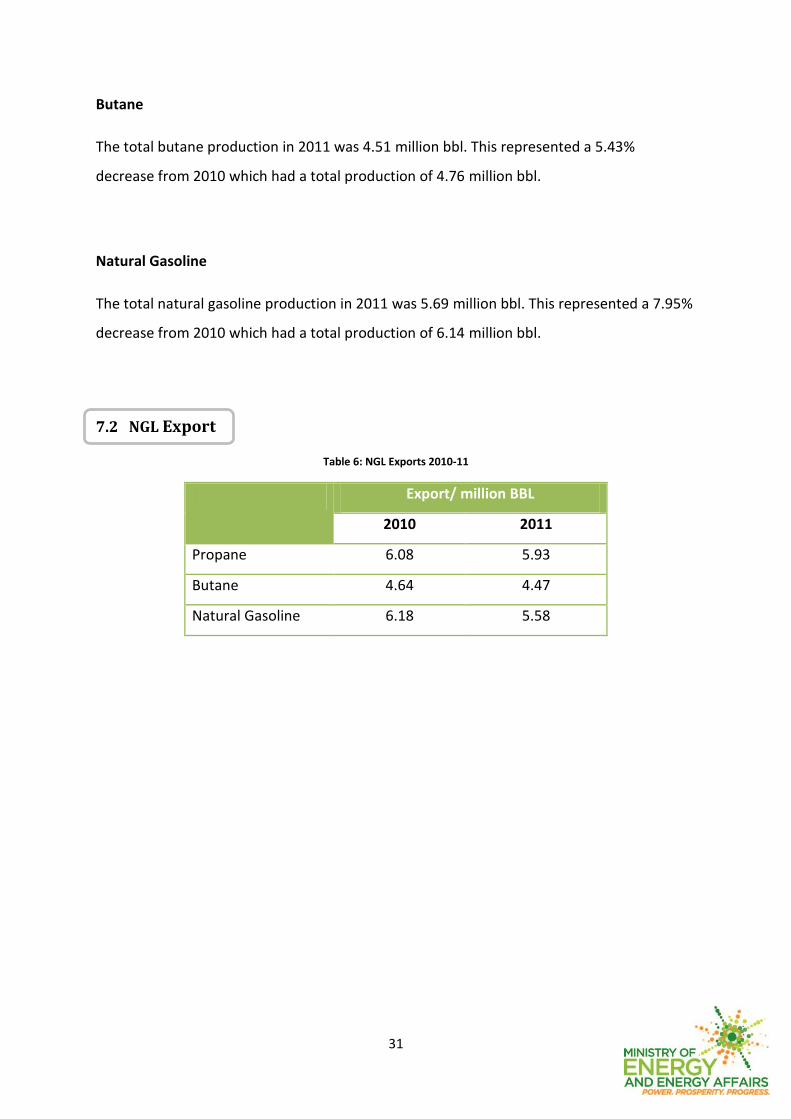
7.2 NGL Export
Table 6: NGL Exports 2010-11
Export/ million BBL
2010 2011
Propane 6.08 5.93
Butane 4.64 4.47
Natural Gasoline 6.18 5.58

32
Figure 21: NGL Exports 2007-2011 (bbl)
Propane
The total propane exported in 2011 was 5.77 million bbl. This represented a 5.49% decrease
from 2010 which had a total export of 6.08 million bbl.
The average price for propane for 2011 was 1.47 $US/US gallon while during 2010 the
average price was 1.16 $US/gallon, as reported in the PPGPL Shipping Reports.
Butane
The total butane exported in 2011 was 4.39 million bbl. This represented a 5.64% decrease
from 2010 which had a total export of 4.64 million bbl.
The average price for butane for 2011 was 1.86 $US/gallon while during 2010 the average
price was 1.50 $US/gallon, as reported in the PPGPL Shipping Reports.
3.00
3.50
4.00
4.50
5.00
5.50
6.00
6.50
2007 2008 2009 2010 2011
NGL Exports/ BBL (2007-2012)
Propane Butane Natural Gasoline
33
Natural Gasoline
The total natural gasoline exported in 2011 was 5.51 million bbl. This represented a 12.11%
decrease from 2010 which had a total export of 6.18 million bbl.
The average price for natural gasoline for 2011 was 2.34 $US/gallon while during 2010 the
average price was 1.78 $US/gallon, as reported in the PPGPL Shipping Reports.
Main PPGPL export destinations for 2011
Caribbean - Antigua, Anguilla, Aruba, Bahamas, Barbados, Bermuda, Cayman Islands,
Colombia, Costa Rica, Dominica, Dominican Republic, Eastern Caribbean, Grand Cayman,
Grenada, Guadeloupe , Guyana , Haiti, Jamaica, Martinique, Montserrat, Panama, Puerto
Rico, St. Kitts & Nevis, St. Lucia, St. Maarten , St. Vincent, Tortola.
South & Central America - French Guiana, Suriname, Uruguay, Mexico.
Other Regions - West Africa, Senegal, Europe.

34
8. IRON AND STEEL PRODUCTS AND CEMENT
Iron and steel markets displayed increased activity in 2011. Billet and wire rod prices rose in 2011 by
19.9% and 15.4%, respectively, compared to 2010. The average billet price (for Latin America) was
US$648.76 per tonne during 2011 while the price of wire rods averaged US$710.13 per tonne. A
weaker tone prevailed in the iron and steel market following the Japanese earthquake and political
instability in the Middle East. By mid-year however, upward momentum returned as prices were
driven by increasing raw material costs and, to a lesser extent, strengthening demand. Markets grew
weaker by the fourth quarter as higher prices began to push buyers out of the market (Central Bank
of Trinidad and Tobago, 2012).
Available data for the local iron and steel industry suggest improved activity in 2011. During January
to September 2011, billet production increased by 3.2% while wire rod production expanded by
19.1%. Direct Reduced Iron (DRI) production remained relatively unchanged from levels in 2010. In
late 2011 however, ArcelorMittal Point Lisas Limited temporarily sent home 30 workers, citing
reduced demand for its DRI. The company indicated that it expected to resume normal operating
rates in January 2012 (Central Bank of Trinidad and Tobago, 2012).
Table 7: Direct Reduced Iron Production and Export 2010-11
Direct Reduced Iron (‘000 MT)
2010 2011 (Jan-Sep)
Production 1,752 1,409
Export 1,003 824
Own Consumption 603 469
Table 8: Billets Production and Export 2010-11
Billets (‘000 MT)
2010 2011 (Jan-Sep)
Production 572 467
Export 151 94
Local Sales 27 30
Own Consumption 285 336

35
Table 9: Wire Rods Production and Export 2010-11
Wire Rods (‘000 MT)
2010 2011 (Jan-Sep)
Production 361 320
Export 317 272
Local Sales 28 25
Table 10: Cement Production and Export 2010-11
Cement (‘000 MT)
2010 2011 (Jan-Sep)
Production 791 600
Local Sales 548 401
Exports 245 198
Figure 22: Billets and Wire Rods Prices 2006-2011 (Central Bank of Trinidad and Tobago, 2012)
0
200
400
600
800
1,000
1,200
1,400
2006 2007 2008 2009 2010 2011 (JAN-SEP)
$U
S/M
etr
ic T
on
ne
Billets and Wire Rods Prices 2006-2011
Billets Wire Rods
36
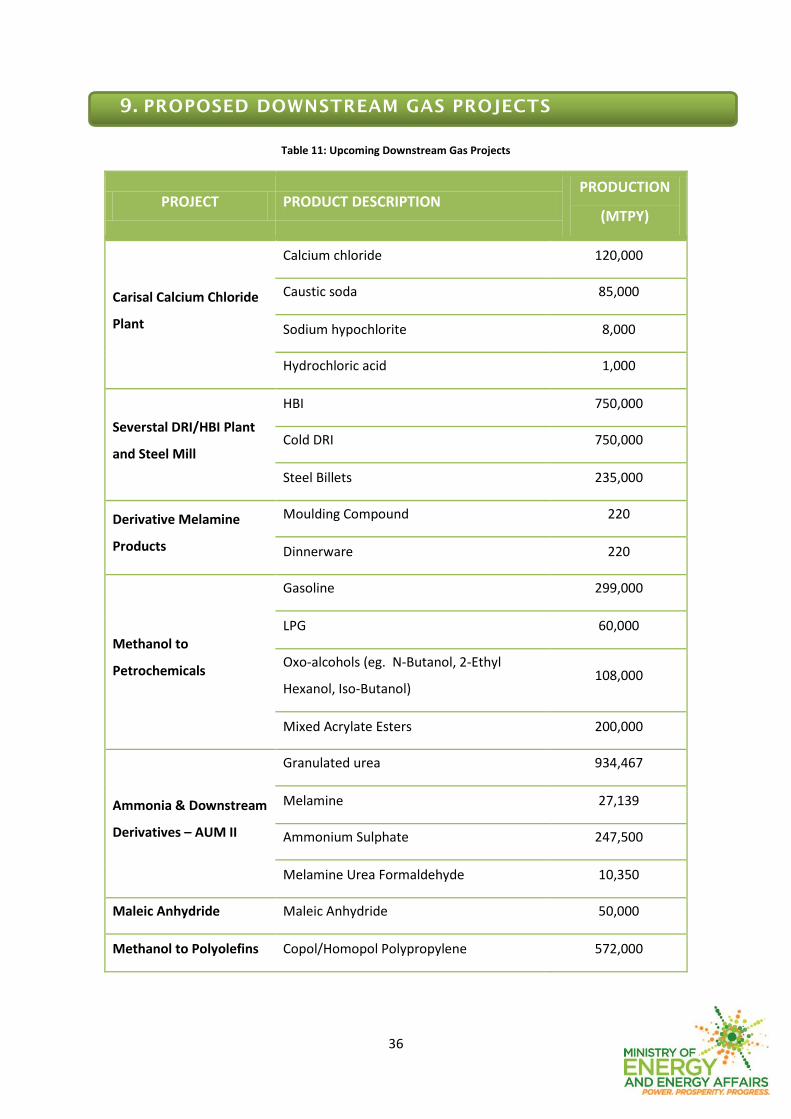
9. PROPOSED DOWNSTREAM GAS PROJECTS
Table 11: Upcoming Downstream Gas Projects
PROJECT PRODUCT DESCRIPTION PRODUCTION
(MTPY)
Carisal Calcium Chloride
Plant
Calcium chloride 120,000
Caustic soda 85,000
Sodium hypochlorite 8,000
Hydrochloric acid 1,000
Severstal DRI/HBI Plant
and Steel Mill
HBI 750,000
Cold DRI 750,000
Steel Billets 235,000
Derivative Melamine
Products
Moulding Compound 220
Dinnerware 220
Methanol to
Petrochemicals
Gasoline 299,000
LPG 60,000
Oxo-alcohols (eg. N-Butanol, 2-Ethyl
Hexanol, Iso-Butanol) 108,000
Mixed Acrylate Esters 200,000
Ammonia & Downstream
Derivatives – AUM II
Granulated urea 934,467
Melamine 27,139
Ammonium Sulphate 247,500
Melamine Urea Formaldehyde 10,350
Maleic Anhydride Maleic Anhydride 50,000
Methanol to Polyolefins Copol/Homopol Polypropylene 572,000

37
10. REFERENCES
Apodaca, L. E. (2012). Mineral Commodity Summary: Nitrogen (Fixed) - Ammonia. United States
Geological Survey.
Central Bank of Trinidad and Tobago. (2012). 2011 Annual Economic Survey. Port-of-Spain.
Clarke, R. (2011, December 23). ICIS news. Retrieved February 1, 2012, from
http://www.icis.com/Articles/2011/12/23/9519152/outlook-12-fertilizer-market-gloomy-
into-2012-on-weak-demand.html
CRU. (2011). Ammonia Ten Year Outlook.
Heffer, P., & Prud’homme, M. (2011). Short-Term Fertilizer Outlook 2011-2012. Paris: International
Fertilizer Industry Association.
IHS Chemical. (2012). Global Methanol Market Advisory Service.
Integer Research Limited. (2011, August 9). Retrieved 2012, from http://www.integer-
research.com/2011/fertilizers-chemicals/news/uan-trinidad-caribbean-exports/
Merchant Research & Consulting, Ltd. (2012). Ammonia: 2012 World Market Outlook and Forecast
up to 2017.
Reed Business Information Limited. (n.d.). ICIS. Retrieved February 3, 2012, from
http://www.icis.com/chemicals/urea/price-reporting-methodology/