downstream effects of stream flow diversion on channel ... · downstream effects of stream flow...
TRANSCRIPT

EARTH SURFACE PROCESSES AND LANDFORMSEarth Surf. Process. Landforms 40, 586–598 (2015)Copyright © 2014 John Wiley & Sons, Ltd.Published online 4 October 2014 in Wiley Online Library(wileyonlinelibrary.com) DOI: 10.1002/esp.3651
Downstream effects of stream flow diversion onchannel characteristics and riparian vegetation inthe Colorado Rocky Mountains, USASimeon T. Caskey,1 Tyanna S. Blaschak,2 Ellen Wohl,3* Elizabeth Schnackenberg,4 David M. Merritt5 and Kathleen A. Dwire61 Medicine Bow National Forest, Laramie, WY, USA2 Lassen National Forest, Susanville, CA, USA3 Department of Geosciences, Colorado State University, Fort Collins, CO, USA4 Routt National Forest, Steamboat Springs, CO, USA5 USDA Forest Service, NRRC, Fort Collins, CO, USA6 Rocky Mountain Research Station, Fort Collins, CO, USA
Received 1 May 2014; Revised 9 September 2014; Accepted 11 September 2014
*Correspondence to: Ellen Wohl, Department of Geosciences, Colorado State University, Fort Collins, CO 80523-1482, USA. E-mail: [email protected]
ABSTRACT: Flow diversions are widespread and numerous throughout the semi-arid mountains of the western United States. Di-versions vary greatly in their structure and ability to divert water, but can alter the magnitude and duration of base and peak flows,depending upon their size and management. Channel geometry and riparian plant communities have adapted to unique hydrologicand geomorphic conditions existing in the areas subject to fluvial processes. We use geomorphic and vegetation data from low-gradient (≤3%) streams in the Rocky Mountains of north-central Colorado to assess potential effects of diversion. Data were collectedat 37 reaches, including 16 paired upstream and downstream reaches and five unpaired reaches. Channel geometry data were de-rived from surveys of bankfull channel dimensions and substrate. Vegetation was sampled using a line-point intercept method alongtransects oriented perpendicular to the channel, with a total of 100 sampling points per reach. Elevation above and distance from thechannel were measured at each vegetation sampling point to analyze differences in lateral and vertical zonation of plant communi-ties between upstream and downstream reaches.Geomorphic data were analyzed using mixed effects models. Bankfull width, depth, and cross-sectional area decreased down-
stream from diversions. Vegetation data were analyzed using biological diversity metrics, richness, evenness and diversity, as wellas multivariate community analysis. Evenness increased downstream from diversions, through reduced frequency of wetland indica-tor species and increased frequency of upland indicator species. Probability of occurrence for upland species downstream of adiversion increases at a greater rate beginning around 0·5m above active channel. The results suggest that channel morphologyand riparian plant communities along low-gradient reaches in montane environments in the Colorado Rocky Mountains areimpacted by diversion-induced flow alteration, with the net effect of simplifying and narrowing the channel and homogenizingand terrestrializing riparian plant communities. Copyright © 2014 John Wiley & Sons, Ltd.
KEYWORDS: diversion; riparian vegetation; channel geometry; Colorado; flow regulation
Introduction
Diversion involves removing water from a stream for consump-tive use such as agricultural irrigation. Although some flow maybe returned to the stream downstream from the point of diver-sion, some length of the stream typically has less flow as aresult of the diversion. Diversions are common in streamsflowing through arid and semi-arid environments, but arebecoming more widespread even in wetter climates as humanpopulation density and intensive, off-channel consumptiveuses of water continue to grow. Relative to flow regulation asso-ciated with dams, however, remarkably few studies have exam-ined the effects of diversion on river ecosystems.To date, studies examining the impacts of diversions have
focused primarily on the effects on in-channel geometry and
aquatic biota. These studies have demonstrated that diversions:reduce the cross-sectional area of flow (McKay and King,2006); reduce channel width by allowing encroachment ofriparian vegetation (Ryan, 1997); result in morphological sim-plification of the channel (Stamp and Schmidt, 2006); increasethe abundance of patches of fine sediment and low-velocityhabitats (Baker et al., 2011); alter water chemistry (Kagawa,1992); and reduce the richness, abundance and diversity ofmacroinvertebrate functional feeding groups (Englund andMalmqvist, 1996; Rader and Belish, 1999; McIntosh et al.,2002; McCarthy, 2008). Among the studies that have examinedthe effects of diversions on riparian vegetation, results havebeen mixed. Some studies have found effects in the form of re-duced tree growth rates (Stromberg and Patten, 1990), reducedstomatal conductance and water potential (Smith et al., 1991),

587EFFECTS OF FLOW DIVERSION IN COLORADO ROCKY MOUNTAINS
or reduced stem diameters (Bohn and King, 2000) downstreamfrom diversions, whereas others have not observed effects fromdiversions (Harris et al., 1987).Part of the difficulty in quantifying the effects of diversions is
that, unlike many dams, detailed hydrologic records of diver-sion operation are typically not kept, particularly in small chan-nels. The legal right to divert water from a stream typicallyspecifies the maximum quantity that can be diverted each yearbetween specified start and end dates. The structures used todivert water are quite diverse, however, with respect to the pro-portion of total flow that the structure is capable of divertingand the design of the structure. Some structures completelyblock flow downstream from the structure, whereas othersallow some flow to bypass the diversion. Some structuresdivert water at all times; others divert water only during peakflows. The variability in what is permitted and the quantity ofwater actually diverted is a function of the availability of waterand the actions of the diverter. In many cases, structuresdesigned to block all downstream flow can be opened to allowbypass flows. Consequently, studies investigating the down-stream effects of diversions using data from numerous streamsare typically constrained in the ability to detect and quantifychanges to the natural or historic flow regime.Several of the studies examining the effects of diversions
have been conducted in the arid and semi-arid portions of thewestern United States, a region with more than a century-longhistory of diversion. Many of these diversions occur relativelyhigh in the drainage basin of snowmelt-fed river networks, withwater diverted at high elevations being sent via ditch andtunnel to lower elevation agricultural and municipal areas. Aprimary finding of previous work on diverted streams in thewestern United States is that, within mountainous river net-works, low-gradient channel segments are more likely to ex-hibit statistically significant geomorphic changes in responseto diversions than are higher gradient channels (Wesche et al.,1988; Ryan, 1997; Baker et al., 2011). Low-gradient channelstypically have cobble to sand substrate and pool-riffle bedformsthat respond more readily to changes in water and sedimentsupply than do the coarser substrate and step-pool bedformsof nearby higher gradient channel segments (Montgomery andBuffington, 1997; Ryan, 1997).This study focuses on these lower gradient segments of
mountainous river networks on the Routt National Forest (NF)of Colorado, USA. There are currently 921 flow diversionswithin the boundaries of this national forest (CDSS, 2012),which encompasses an area of 5200 km2. This high spatial den-sity of diversions exemplifies water use across the National For-est lands of the western United States. Also exemplary for theregion is the desire of resource managers to better understandwhether there are thresholds beyond which diversions causesignificant alterations to stream morphology and/or ripariancommunities. The ability to identify stream segments sensitiveto diversions could be used to prioritize protection and restora-tion of these segments, particularly in the context of ongoing re-quests to permit additional diversions on National Forest lands.Consequently, we focused on the low-gradient stream seg-ments most likely to respond to diversions. We examinedcharacteristics of channel geometry and riparian vegetation toidentify which components of the river ecosystem respond toflow diversion, and how these components varied as a resultof diversion. The structures that create diversions on thesestreams are typically some type of head gate (<2m tall) thatcan be lowered or raised to control water movement into thediversion ditch.The primary objectives of this research are to: (1) investigate
the extent to which existing flow diversions have altered chan-nel characteristics and riparian plant communities on streams
Copyright © 2014 John Wiley & Sons, Ltd.
in the Routt NF, and (2) identify environmental variables thatare most sensitive to flow diversions. We address these objec-tives by testing three hypotheses. (Hypothesis 1, H1) Channelswith flow diversions exhibit significantly different channelgeometry than channels without diversions. The assumptionunderlying this hypothesis is that reduced flow magnitudesalter sediment transport capacity, resulting in changes tocross-sectional geometry, channel gradient, planform geometry,or channel substrate. (Hypothesis 2, H2) Riparian vegetationcommunity composition (richness, abundance, heterogeneity,evenness) differs significantly upstream and downstream fromdiversion sites. The rationale underlying this hypothesis is thatriparian plant communities are controlled by hydrogeomorphicprocesses (Naiman and Décamps, 1997; Bendix and Hupp,2000; Amoros and Bornette, 2002). Diversions typically reducepeak and base flows, potentially causing streams to lose waterto groundwater, as well as decreasing overbank flows, associ-ated infiltration, and riparian water tables. Therefore, riparianspecies requiring greater soil moisture than upland species willbe particularly affected by diversions. A secondary hypothesisrelated to riparian vegetation is: (Hypothesis 3, H3) Significantdifferences exist in riparian species composition upstream anddownstream from diversions with respect to lateral and verticalzonation of species relative to the active channel.
The methods we used to characterize channel morphologyare similar to those used in previous studies and in most studiesof channel form. The methods used to characterize riparianvegetation community composition are original to this study,but could be applied to any riparian community. Similarly,the methods and results of this study are applicable to anyrelatively small (third-order or smaller) river subject to flowdiversion. Our finding that riparian vegetation communitiesare significantly affected by diversions will likely apply to manyother arid and semi-arid regions where streamflow, floodplaininundation, and riparian water tables strongly influence ripar-ian vegetation community structure.
Study Area
Data were collected in the Routt NF in northern Colorado(Fig. 1). The Routt NF includes more than 5200 km2 spreadacross three mountain ranges and spanning elevations of1900 to 3950m on both sides of the continental divide. Lithologyis spatially variable and includes Precambrian-age metamorphicand granitic basement rocks in the Park and Gore Ranges. In theRabbit Ears Range and Elkhead and Flattop Mountains, volcanicbasalts create the high points and are underlain by Jurassic toCretaceous-age sandstone, shale, and conglomerate (Hail,1968). Pleistocene valley glaciers extended down to 2300m onthe western slope of the continental divide and 2600m on theeastern slope (Atwood, 1937), leaving locally well-developedglacial troughs. Valley geometry varies longitudinally from high-gradient (>9%), laterally confined valleys to lower gradient(<3%), relatively unconfined valley segments.
Mean annual precipitation varies from 64 to 125 cm, butaverages 93 cm across the study areas. Hydrographs are rela-tively consistent between individual study basins, with a snow-melt peak between mid-May and mid-June and secondarypeaks from summer convective storms. Drainage area at thestudy reaches averaged 23 km2 (Table I). None of the creeksare gaged.
Upland conifer forests throughout the study area consist pri-marily of pine (Pinus contorta), spruce (Picea engelmannii), fir(Abies lasiocarpa), Douglas-fir (Pseudotsuga menziesii), andaspen (Populus tremuloides). Riparian vegetation communities in-clude five groups: coniferous-dominated forests and woodlands;
Earth Surf. Process. Landforms, Vol. 40, 586–598 (2015)

Figure 1. Location map showing the extent of the Routt National Forest (NF) (lighter gray shading) within Colorado (inset at lower right). Studyreaches indicated by black dots.
588 S. T. CASKEY ET AL.
deciduous-dominated woodlands; willow (Salix spp.)-dominateddeciduous shrublands; non-willow-dominated deciduousshrublands; and herbaceous wetlands (Kettler and McMullen,1996). Willow-dominated deciduous shrublands are most com-mon at our study reaches because this group prefers the low-gradient alluvial stream reaches that we selected for analysis.Many of the alluvial valley segments in the study area have indi-cations of past or present beaver (Castor canadensis) activity in theform of beaver dams and anastomosing channel networks formedin association with beaver dams.The structure type, maintenance, and details of diversion op-
erations vary widely among the study sites and may influencethe effects of the structure on stream channels and biota. Somestructures include concrete head gates able to divert all flow. Atother sites, peripheral structures built of wood or concrete uti-lize rock weirs and tarps to direct flow, occupy the channelmargins, and only have the capacity to divert a moderate por-tion of any flow on the stream. Observations during the fieldseasons suggest that some structures are maintained multipletimes each season, whereas others appear to be unrepairedfor years at a time. Many of the structures are associated witha water right more than a century old, and associated recordsof maintenance and timing or magnitude of water withdrawalare infrequent or completely absent. All of the structures arerelatively small (<2m tall) and used for local irrigation pur-poses during the summer growing season. Because interannual
Copyright © 2014 John Wiley & Sons, Ltd.
variability in precipitation is relatively high, the absolute vol-ume of water and the proportion of total flow diverted eachyear vary substantially. The inability to quantify the effects ofdiversions on flow regime at the study reaches constitutes amajor limitation of this study.
Methods
Selection of study reaches
Because this study focused on lower gradient, response reaches,we targeted single-thread, straight and meandering, alluvialchannels on low to moderate gradient (<3%) valley segments.These study reaches had pool-riffle or plane-bed morphology,were underlain by sedimentary bedrock or glacial deposits, andwere typically at middle elevations (2325–2825m). Channelsubstrate varied from coarse sand (1mm) to small cobble(64–90mm), with a median size of coarse gravel (32–45mm).Reaches were chosen based on (i) stream gradient (<3%), (ii)lateral valley confinement (partly confined, with valley-bottomwidth 2–10 times channel width; unconfined, with valley-bottomwidth> 10 times channel width) and (iii) diversion characteristics(amount of flow diverted, date of diversion construction, timingof water extraction, currently operational), as recorded onColorado’s Decision Support System (CDSS) website. Reaches
Earth Surf. Process. Landforms, Vol. 40, 586–598 (2015)
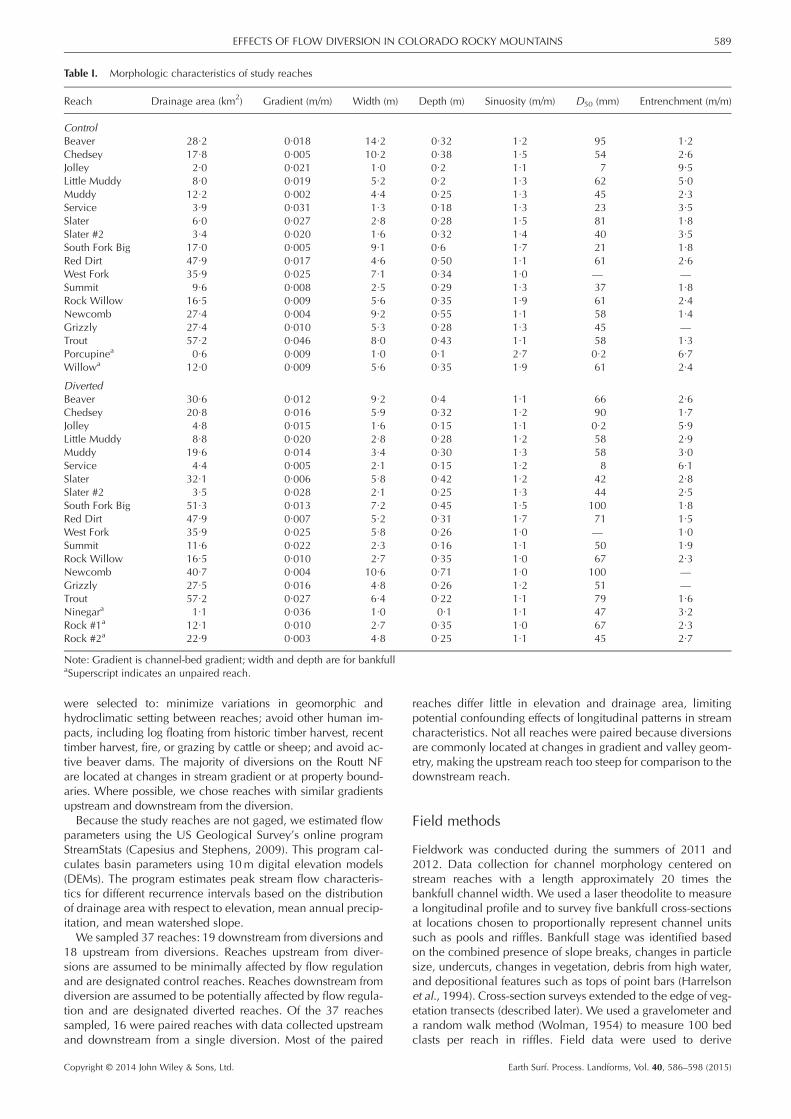
Table I. Morphologic characteristics of study reaches
Reach Drainage area (km2) Gradient (m/m) Width (m) Depth (m) Sinuosity (m/m) D50 (mm) Entrenchment (m/m)
ControlBeaver 28·2 0·018 14·2 0·32 1·2 95 1·2Chedsey 17·8 0·005 10·2 0·38 1·5 54 2·6Jolley 2·0 0·021 1·0 0·2 1·1 7 9·5Little Muddy 8·0 0·019 5·2 0·2 1·3 62 5·0Muddy 12·2 0·002 4·4 0·25 1·3 45 2·3Service 3·9 0·031 1·3 0·18 1·3 23 3·5Slater 6·0 0·027 2·8 0·28 1·5 81 1·8Slater #2 3·4 0·020 1·6 0·32 1·4 40 3·5South Fork Big 17·0 0·005 9·1 0·6 1·7 21 1·8Red Dirt 47·9 0·017 4·6 0·50 1·1 61 2·6West Fork 35·9 0·025 7·1 0·34 1·0 — —Summit 9·6 0·008 2·5 0·29 1·3 37 1·8Rock Willow 16·5 0·009 5·6 0·35 1·9 61 2·4Newcomb 27·4 0·004 9·2 0·55 1·1 58 1·4Grizzly 27·4 0·010 5·3 0·28 1·3 45 —Trout 57·2 0·046 8·0 0·43 1·1 58 1·3Porcupinea 0·6 0·009 1·0 0·1 2·7 0·2 6·7Willowa 12·0 0·009 5·6 0·35 1·9 61 2·4
DivertedBeaver 30·6 0·012 9·2 0·4 1·1 66 2·6Chedsey 20·8 0·016 5·9 0·32 1·2 90 1·7Jolley 4·8 0·015 1·6 0·15 1·1 0·2 5·9Little Muddy 8·8 0·020 2·8 0·28 1·2 58 2·9Muddy 19·6 0·014 3·4 0·30 1·3 58 3·0Service 4·4 0·005 2·1 0·15 1·2 8 6·1Slater 32·1 0·006 5·8 0·42 1·2 42 2·8Slater #2 3·5 0·028 2·1 0·25 1·3 44 2·5South Fork Big 51·3 0·013 7·2 0·45 1·5 100 1·8Red Dirt 47·9 0·007 5·2 0·31 1·7 71 1·5West Fork 35·9 0·025 5·8 0·26 1·0 — 1·0Summit 11·6 0·022 2·3 0·16 1·1 50 1·9Rock Willow 16·5 0·010 2·7 0·35 1·0 67 2·3Newcomb 40·7 0·004 10·6 0·71 1·0 100 —Grizzly 27·5 0·016 4·8 0·26 1·2 51 —Trout 57·2 0·027 6·4 0·22 1·1 79 1·6Ninegara 1·1 0·036 1·0 0·1 1·1 47 3·2Rock #1a 12·1 0·010 2·7 0·35 1·0 67 2·3Rock #2a 22·9 0·003 4·8 0·25 1·1 45 2·7
Note: Gradient is channel-bed gradient; width and depth are for bankfullaSuperscript indicates an unpaired reach.
589EFFECTS OF FLOW DIVERSION IN COLORADO ROCKY MOUNTAINS
were selected to: minimize variations in geomorphic andhydroclimatic setting between reaches; avoid other human im-pacts, including log floating from historic timber harvest, recenttimber harvest, fire, or grazing by cattle or sheep; and avoid ac-tive beaver dams. The majority of diversions on the Routt NFare located at changes in stream gradient or at property bound-aries. Where possible, we chose reaches with similar gradientsupstream and downstream from the diversion.Because the study reaches are not gaged, we estimated flow
parameters using the US Geological Survey’s online programStreamStats (Capesius and Stephens, 2009). This program cal-culates basin parameters using 10m digital elevation models(DEMs). The program estimates peak stream flow characteris-tics for different recurrence intervals based on the distributionof drainage area with respect to elevation, mean annual precip-itation, and mean watershed slope.We sampled 37 reaches: 19 downstream from diversions and
18 upstream from diversions. Reaches upstream from diver-sions are assumed to be minimally affected by flow regulationand are designated control reaches. Reaches downstream fromdiversion are assumed to be potentially affected by flow regula-tion and are designated diverted reaches. Of the 37 reachessampled, 16 were paired reaches with data collected upstreamand downstream from a single diversion. Most of the paired
Copyright © 2014 John Wiley & Sons, Ltd.
reaches differ little in elevation and drainage area, limitingpotential confounding effects of longitudinal patterns in streamcharacteristics. Not all reaches were paired because diversionsare commonly located at changes in gradient and valley geom-etry, making the upstream reach too steep for comparison to thedownstream reach.
Field methods
Fieldwork was conducted during the summers of 2011 and2012. Data collection for channel morphology centered onstream reaches with a length approximately 20 times thebankfull channel width. We used a laser theodolite to measurea longitudinal profile and to survey five bankfull cross-sectionsat locations chosen to proportionally represent channel unitssuch as pools and riffles. Bankfull stage was identified basedon the combined presence of slope breaks, changes in particlesize, undercuts, changes in vegetation, debris from high water,and depositional features such as tops of point bars (Harrelsonet al., 1994). Cross-section surveys extended to the edge of veg-etation transects (described later). We used a gravelometer anda random walk method (Wolman, 1954) to measure 100 bedclasts per reach in riffles. Field data were used to derive
Earth Surf. Process. Landforms, Vol. 40, 586–598 (2015)

590 S. T. CASKEY ET AL.
bankfull width, average depth, width/depth, cross-sectionalarea, bed D50, channel gradient, sinuosity, and entrenchment,defined as the ratio of flood-prone width to bankfull width,where flood-prone width is derived from an elevation twicethe bankfull depth (Rosgen, 1994).We characterized riparian vegetation starting at the active
channel edges using a line-point intercept method to samplealong transects perpendicular to flow spaced at regular inter-vals. For each study reach, we established 10 transects, with10 evenly spaced sampling points along each transect,resulting in 100 sample points per study reach. Transects ex-tended twice the channel width on either side of the channel,with a minimum distance of 5m and a maximum distance of10m to ensure adequate representation of the riparian commu-nity. A laser pointer mounted on a pole was aligned directly overeach sampling point. Each plant touched by the laser was re-corded and then moved out of the way until ground cover wasreached. Each plant sampled was identified to species in the fieldwhen possible, or collected for later identification. Each species(or taxon) was assigned to a USFWSWetlands Indicator Category(Lichvar et al., 2012). Each vegetation sampling point was associ-ated with a field-identified geomorphic surface (i.e. depositionalbar, secondary channel, floodplain, or terrace). Distance fromand elevation above bankfull stage were also recorded for eachvegetation sampling point.
Data analysis
All statistical analyses were checked for compliance withassumptions associated with the test. Paired tests were usedunless otherwise noted. Biological diversity metrics utilizing apaired Student’s t-test were evaluated for normality using theShapiro–Wilk test and transformed if necessary to assure com-pliance with statistical assumptions. If transformations werenot successful in normalizing the data, the Wilcoxon–Signedrank test for paired, non-parametric data was implemented.All statistical analyses were completed in R, unless otherwisenoted (R Development Core Team, 2011).For channel morphology, response variables tested included
D50, bankfull width, average bankfull depth, width/depth ratio,cross-sectional area, sinuosity, channel gradient, and entrench-ment. Predictor variables included valley slope, valley width,lithology, drainage area, dominant riparian vegetation type,and group (control or diverted). To test H1, two sets of mixedeffects models were developed, with the response variablestested separately in each model. One set accounted for boththe control reaches with a paired diverted reach and the controlreaches without a paired reach. The second mixed effectsmodel took the uneven pairing into account as the mixed ef-fect, as well as using valley type factors, lithology, and vegeta-tion as different treatments. Univariate mixed effects modelswere run using the GLIMMIX procedure in SAS to compareeach response variable between diverted and control groups.We determined that the univariate mixed effects model wasthe best approach, because there were not enough data to sup-port using a multivariate or MANOVA-type analysis method(Blaschak, 2012). Results from the mixed model analyses wereevaluated using p-values and associated least-squared meanestimates, which compare the diverted and control groups byusing the estimated differences between their means.For riparian vegetation, we conducted community-level
analyses and population-level analyses focused on individualspecies to test H2. For community-level analyses, we examinedone set of metrics commonly used for biological diversity(richness, evenness) and another set for vegetation compositionanalysis. For biodiversity, we considered species richness, which
Copyright © 2014 John Wiley & Sons, Ltd.
is the total number of species occurring within a given samplingunit. We also examined two diversity indices, the Shannon indexand the Simpson index (Pielou, 1969, 1977; Smith and Wilson,1996; Krebs, 1999; Magurran, 2004). Additionally, total abun-dance of species was calculated by totaling the number of all‘hits’ sampled at a study reach, and compared using a pairedStudent’s t-test. Species abundance distributions are anothermethod to understand diversity and differences betweensampling units, or communities. Two commonly employedexamples are species accumulation curves (SAC), whichgenerally compare the species richness of data sets (Magurran,2004), and rank/abundance models, capturing richness andevenness/dominance within the sampling unit (Kent, 2011).
For vegetation composition analyses, we used analysis ofsimilarity (ANOSIM; Clarke, 1993), multi-response permutationprocedures (MRPP; Mielke and Berry, 2001), and permuta-tional multivariate analysis of variance (function adonis) inR-Cran to test for significant differences in species compositionbetween groups of samples. To test the differences in groupmeans, we used the Vegan function adonis, a non-parametric,multivariate, permutational analysis of variance based on dis-tance matrices (Anderson, 2001; Oksanen, 2011). We also ex-amined the homogeneity of groups through the betadisperfunction, and then used analysis of variance to test the modelfit (Anderson et al., 2006). Decision to reject the null was basedupon α=0.05.
For population-level analyses, we used a chi-square analysisto compare frequency of occurrence of individual speciesupstream and downstream from diversion. Each point wasconsidered an observation, and the total number of observa-tions where a species was present was divided by the numberof observations where a species was absent. A significancelevel of 0.01 was used with a Bonferonni correction (Sokaland Rohlf, 1994).
We assigned each species to a Wetland Indicator Category(Lichvar et al., 2012), which is a qualitative ecological classifi-cation that categorizes plant species based on occurrence inwetlands. Obligate species (OBL) almost always occur in wet-lands. Facultative wetland (FACW) species usually occur inwetlands and are associated with near-channel, seasonally-flooded environments. We used the OBL and FACW speciesas indicators of hydric, moist conditions, and as evidence ofgeomorphic settings where soil is saturated through seasonalflooding, typical of functioning riparian environments. On theopposite side of the indicator spectrum are facultative upland(FACU) species, commonly occurring on drier, mesic soils,and Upland (UPL) species, most frequently occurring in non-wetlands, in soils that are mesic to xeric. We used the FACUand UPL species as indicators of geomorphic settings that aredisconnected from the channel, or at least not subject to sea-sonal flooding. FAC species occur in both wetlands and non-wetlands. We then used the richness, diversity, abundance,and composition metrics to analyze the species classified asOBL or FACW, comparing control to diverted reaches. Weexamined the species classified as UPL or FACU and comparedthe control to the diverted reaches using the same metrics.
To test for differences in vegetation above and away from thestream (H3), we assigned topographical coordinates to eachvegetation sampling point by interpolating based on knownpoints from the survey. We stratified the data by creating binsof elevation at 0.25m intervals up to 1·5m above the activechannel. Diversity metrics were tested for difference betweenupstream and downstream from diversions. We used relativeabundance for all diversity metrics to avoid bias, rather thanabsolute abundance. The number of points in each topograph-ical zone between upstream and downstream was similar, withmagnitude being close to 10% difference. Similarly, zones of
Earth Surf. Process. Landforms, Vol. 40, 586–598 (2015)

A
Line
ar m
easu
re (
m)
Are
al m
easu
re (
m2 )
0
2
4
6
8
10
12
14
16
5.8 4.90.3 0.3 2.1 1.8
control diverted
control diverted
control diverted
bankfull width bankfull depth cross-sectional area
B
ty
1.6
1.8
2.0
591EFFECTS OF FLOW DIVERSION IN COLORADO ROCKY MOUNTAINS
lateral distance away from the active channel at every 0·5m re-sulted in six zones up to 3m away from the channel. In addi-tion to diversity analysis, these lateral and vertical zones wereused to test for community composition differences usingANOSIM, MRPP, and adonis. Chi-square analysis was againemployed to test for differences in species frequency upstreamand downstream from diversions.To investigate the response of species and wetland indicator
classes to topography, we plotted the probability of speciesoccurrence as a function of lateral and vertical distance fromthe active channel using logistic regression. This analysis relatesthe probability of species orWetland Indicator Category to eleva-tion or distance to the channel, and tests whether this topograph-ical relationship differs between upstream and downstream fromdiversions (Merritt and Wohl, 2006; Polvi, 2009). Based onpresence–absence data for each point, we fit logistic regressionequations, separately, for vertical elevation above active channel(EL) and horizontal distance away from the active channel (DIS).We also added a variable for upstream versus downstream (DIV)and an interaction term (DIV*DIST or EL).
Sin
uosi
0.8
1.0
1.2
1.4
control diverted
1.3 1.17
igure 2. (A) Boxplots illustrating distributions for bankfull channelidth, bankfull depth, and bankfull cross-sectional area upstream andownstream from diversions. Mean value of each population is listedelow the box. (B) Boxplot illustrating differences in channel sinuosityetween reaches upstream from diversions (control) and reaches down-tream from diversions (diversion). Sinuosity differs significantly be-een the groups. Mean value of each population is listed below theox. For all box plots, n = 18 for the control reaches and n = 20 fore diverted reaches.
Results
Channel geometry
Comparing group variablesTable I summarizes morphologic characteristics of the studyreaches. Boxplot comparisons and summary statistics of thechannel geometry variables show some differences between themeans and medians of the control and diverted groups: sinuosity,slope, width, width/depth, entrenchment and cross-sectionalarea all have slightly higher mean values for the control group(Fig. 2A). The D50 value has slightly greater mean and medianvalues in the diverted group, and depth does not differ betweenthe groups (Blaschak, 2012). The only variable that differs signif-icantly between groups, however, is sinuosity (Fig. 2B), based ona paired t-test (p=0·0054), non-parametric Wilcoxon signed-rank test (p=0·0156), and unpaired t-test (p=0·0205).
Mixed modelsOnly sinuosity is significant (p=0·005) in the first set of mixedmodels, which compares reach response variables between thediverted and control groups. The second set of mixed models,which included valley slope, valley width, vegetation type,drainage basin area and lithology as predictor variablesrevealed significant differences in three response variables.Stream width (p=0·0013), depth (p=0·005), and cross-sectional area (p=0·0068) were significantly less in divertedchannels (Table II).The output of the mixed models includes the least-squared
mean estimates of the response variables, which are calculatedby subtracting the diverted group from the control group, afteradjusting for all other effects in the model. Type III tests of fixedeffects, which include F-values and corresponding p-values,were used to examine which predictor variables were influen-tial on the response variables. The significant variable for depthwas drainage area (F=9·54, p=0·005). The significantvariables for channel width were drainage area (F=12·93,p=0·0013) and lithology (F=5·01, p=0·0324). The significantvariables for cross-sectional area were valley width (F=8·45,p=0·0068), lithology (F=4·08, p=0·0524), and drainage area(F=14·37, p=0·0524). These relations were used to standard-ize response variables in order to remove the effects ofvariables not related to diversion: channel width was standard-ized by drainage area using the transformation w/A0·6 to ac-count for potential non-linear increase in channel width with
Copyright © 2014 John Wiley & Sons, Ltd.
Fwdbbstwbth
larger drainage area. Using the transformed width variable inthe mixed effects model still resulted in a significant differencebetween control and diverted groups.
In summary, the results partially support H1 by indicating sig-nificant differences in some channel morphologic parametersbetween control and diverted reaches.
Riparian vegetation
From all 37 reaches, encompassing 3700 sampling points, a to-tal of 238 plant taxa were recorded. Vegetation characteristicsof the study reaches are summarized in Table III.
With respect to riparian vegetation community compositionupstream and downstream of diversions (H2), results on thewhole indicate significant differences. Mean species richness,species accumulation curves, and heterogeneity tests usingthe Shannon, Simpson, and Inverse Simpson indices are allhigher downstream from diversions, although the differencesare not significant (Caskey, 2013). Evenness, as indicated bythe Shannon and Simpson indices, is significantly greaterdownstream from diversions (Fig. 3). ANOSIM, MRPP, and per-mutational MANOVA analyses testing for species compositiondifferences indicate significant difference between upstreamand downstream vegetation communities (p=0.01), when ana-lyzed at a point level. Difference between species compositionis not significant when points are aggregated into reach-leveldata, where all 100 points for a reach are distilled into one
Earth Surf. Process. Landforms, Vol. 40, 586–598 (2015)

Table II. Results of mixed effects model for channel morphologic variables showing differences of group least squared means and adjustment formultiple comparisons with Tukey–Kramer
Variable Estimate Standard error df t Value Pr> t Adjust p
D50 �7·1596 6·9855 30 �1·02 0·3136 0·3136Entrenchment �0·0071 0·4776 17·6 �0·01 0·9883 0·9883Depth 0·0552 0·0262 20·3 2·11 0·0478 0·0478Sinuosity 0·0752 0·0596 14·1 1·26 0·2277 0·2277Width 1·2221 0·4825 19·6 2·53 0·02 0·02Width/depth 0·8931 1·8832 19·4 0·47 0·6406 0·6406Cross-sectional area 0·6107 0·3091 20·1 1·98 0·0621 0·0621Gradient 0·0027 0·0021 32 1·29 0·2046 0·2046
Note: significant variables shown in italic typeface.
Table III. Vegetation characteristics of study reaches (16 control, 16 diverted)
Reach Species richness Diversity Evenness OBL FACW OBL+ FACW FAC FACU UPL FACU+UPL
ControlBeaver 42 3·12 114 55 169 29 45 0 45Chedsey 32 2·81 0·81 135 1 136 12 32 0 32Jolley 18 2·08 0·72 101 5 106 3 53 0 53Little Muddy 32 3·00 0·87 89 8 97 44 107 9 116Muddy 19 2·42 0·82 71 0 71 16 12 0 12Service 10 1·35 0·59 127 0 127 2 3 0 3Slater 19 1·95 0·66 113 2 115 5 4 0 4Slater #2 35 2·90 0·81 98 4 102 25 58 0 58South Fork Big 39 2·90 0·79 160 54 214 15 37 1 38Red Dirt 31 2·76 0·8 88 22 110 27 25 0 25West Fork 25 2·63 0·82 111 34 145 16 19 0 19Summit 26 2·64 0·81 124 3 127 11 17 0 17Rock Willow 27 2·64 0·8 92 3 95 36 60 0 60Newcomb 33 2·94 0·84 58 28 86 28 49 0 49Grizzly 34 2·79 0·79 99 87 186 12 19 0 19Trout 31 2·90 0·84 94 50 144 57 34 0 34DivertedBeaver 26 2·53 123 2 125 18 16 0 16Chedsey 39 3·21 0·88 62 10 72 16 52 0 52Jolley 12 1·95 0·79 94 17 111 0 26 1 27Little Muddy 37 2·97 0·82 53 16 69 54 103 0 103Muddy 30 2·90 0·85 75 9 84 14 40 0 40Service 10 1·27 0·55 136 0 136 6 9 0 9Slater 35Slater #2 26 2·83 0·87 88 19 107 16 69 0 69South Fork Big 35 3·22 0·91 56 37 93 29 65 0 65Red Dirt 28 2·84 0·85 112 15 127 18 28 5 33West Fork 22 2·63 0·85 105 25 130 15 4 2 6Summit 23 2·60 0·83 89 8 97 12 33 0 33Rock Willow 40 3·13 0·85 71 19 90 19 77 3 80Grizzly 41 3·18 0·86 72 30 102 20 46 2 48Newcomb 30 2·82 0·83 49 38 87 14 33 0 33Trout 36 3·03 0·85 85 60 145 52 64 3 67
Note: OBL, FACW, etc. indicate abundance of these categories of species, respectively. Gaps indicate missing data.
592 S. T. CASKEY ET AL.
frequency value for each species. Chi-square analysis of overallspecies frequency, by species, indicates that seven of the eightwetland species (OBL or FACW) have significantly higherabundances upstream from the diversion, including three spe-cies in the genus Salix (willow) and one species in the genusCarex (Table IV). Additionally, six of the eight non-wetland,FACU or UPL species have significantly higher abundancesdownstream from the diversion. Significant increases in occur-rence of upland species downstream of diversion include theforbs Chamerion angustifolium, and Geranium richardsonii, thegrasses Poa pratensis and Poa spp., and Pinus contorta, the onlyconifer significantly different upstream and downstream from di-versions. Taraxacum officinale, one of the few facultative (FAC)
Copyright © 2014 John Wiley & Sons, Ltd.
species in Table IV, is significantly more abundant downstreamfrom diversions.
Grouping species by Wetland Indicator Category reveals asignificantly higher frequency of wetland species upstreamfrom diversion (p=0·03), and a marked increase (althoughnot significant) in upland species downstream of diversion(p=0·12) (Fig. 4).
In summary, evenness is significantly greater downstream fromdiversions. Species composition at a point level differs signifi-cantly between control and diverted vegetation communities.Seven of the eight wetland species are significantly more abun-dant upstream fromdiversions, and six of the eight upland speciesare significantly more abundant downstream from diversions.
Earth Surf. Process. Landforms, Vol. 40, 586–598 (2015)

Sha
nnon
Eve
nnes
s In
dex
Sim
pson
Eve
nnes
s In
dex
0.5
0.6
0.7
0.8
0.9
1.0
control diverted
0.79 0.826
0.20
0.25
0.30
0.35
0.40
0.45
0.50
0.55
0.60
control diverted
0.345
0.402
Figure 3. Shannon and Simpson evenness indices upstream and downstream of diversions. Mean value of each population is listed above the box.Sample size is 16 for all analyses.
Table IV. Results of chi-square analysis, sorted by wetland indicator status
TaxaLife
historyWetlandIndicator p-Value
Frequencyabove
Frequencybelow
Directionof change
Carex utriculata (Northwest Territory sedge) P OBL 0 337 222 �Mertensia ciliata (mountain bluebells) P OBL 0·003 34 13 �Salix monticola (park willow) W OBL 0·008 30 12 �Salix planifolia (diamondleaf willow) W OBL 0 90 47 �Salix wolfii (Wolf’s willow) W OBL 0 117 64 �Veronica americana (American speedwell) P OBL 0·004 10 0 �Deschampsia cespitosa (tufted hairgrass) G FACW 0 192 86 �Equisetum arvense (field horsetail) P FACW 0 47 94 +Ligusticum spp. FAC 0·008 24 8 �Ribus parviflorus (thimbleberry) P FAC 0·001 15 1 �Taraxacum officinale (dandelion) P FAC 0·003 67 106 +Abies lasiocarpa (subalpine fir) W FACU 0·002 36 13 �Bromis inermis (smooth brome) G FACU 0·002 12 0 �Chamerion angustifolium (fireweed) P FACU 0·005 8 25 +Geranium richardsonii (Richardson’s geranium) P FACU 0·009 19 40 +Pinus ponderosa (ponderosa pine) W FACU 0·006 12 31 +Poa pratensis (Kentucky bluegrass) G FACU 0 3 31 +Poa spp. G FACU 0 37 83 +Unknown G FACU 0 0 28 +
Note: Native plants are in bold font.Under life history, G is graminoid, P is perennial, and W is woody.OBL is obligate wetland species; FACW is facultative wetland species; FAC is hydrophyte species that occurs in both wetland and non-wetland habitats;FACU is facultative upland species.Frequency above refers to frequency of this species above diversions (control reaches); frequency below refers to below diversions (diverted reaches).Direction of change is + if species became more abundant downstream from diversion,� if species became less abundant downstream from diversion
Figure 4. Number of occurrences of Wetland Indicator Categories forspecies upstream and downstream from diversions. In each set of boxplots, the first box is upstream and the second is downstream. Samplesize is 16 for each box, and mean value is given below the box.
593EFFECTS OF FLOW DIVERSION IN COLORADO ROCKY MOUNTAINS
Copyright © 2014 John Wiley & Sons, Ltd.
With respect to differences in lateral and vertical zonation ofriparian species (H3), the results indicate some significantdifferences. Diversity indices are not significant in any of thezones, although they are noticeably higher in the downstreamof diversion group at the less than 100 cm above channel(elevation), and less than 300 cm away from channel (distance)(Table V). Evenness is significantly greater downstream from di-version for the less than 100 cm elevation above active chan-nel, and the less than 200, 300, and 400 cm distance awayfrom channel groups. Relative abundance of wetland speciesis significantly higher upstream from diversions, in all eleva-tions zones tested except those closest to the channel, and alldistance zones except for 100 to 200 cm distance away.Relative abundance of upland species is significantly higherdownstream of diversion in one distance zone (200–300 cmdistance) and is noticeably higher, although not significant, inalmost every zone analyzed except for those closest in eleva-tion and distance to the active channel. Species accumulationcurves for the elevation and distance zones show a trend
Earth Surf. Process. Landforms, Vol. 40, 586–598 (2015)

Table V. Metrics with corresponding p-values for each elevation and distance zone analyzed
Elevation or distanceranges (cm)
Simpsonsdiversity index
Simpsonsevenness index
Wetland speciesrelative abundance
Upland speciesrelative abundance
Elevation above channel < 25 0.926 0.503 0.352 0.872< 50 0.959 0.694 0.000 0.978< 75 0.156 0.176 0.012 0.128< 100 0.128 0.020 0.019 0.077
25–75 0.147 0.338 0.037 0.22675–100 0.869 0.314 0.021 0.11675–150 0.778 0.493 0.042 0.140
Distance away from channel < 100 0.573 0.173 0.022 0.698< 200 0.183 0.049 0.019 0.318< 300 0.063 0.012 0.009 0.083< 400 0.084 0.033 0.008 0.078
100–200 0.333 0.309 0.098 0.093200–300 0.119 0.078 0.005 0.037
Note: significant values, α< 0.05, are shown in italic typeface.Wetland species =OBL + FACW.Upland species = FACU+U.
594 S. T. CASKEY ET AL.
starting with upstream of diversion having higher species rich-ness at less than 25 cm above the channel. Richness is then in-creasingly greater downstream of diversion going fromthe< 50 cm to<75 cm zones, becoming closer to even atthe< 100 cm zone (Fig. 5).Species frequency analyses through chi-square testing for
several elevation zones indicates that, at 25 cm, only one spe-cies (Salix wolfii) has significantly higher frequency upstreamfrom diversions (Caskey, 2013). At< 50 cm above active chan-nel, four species have significantly higher frequencies upstreamfrom diversions; Carex utriculata, Deschampsia cespitosa, Salixplanifolia, and Salix wolfii. No species has significantly greaterfrequencies downstream of diversion in this elevation zone.At<75 cm above active channel, Pinus contorta, Poa pratensis,and an unknown graminoid, which are all upland species,occur only downstream from diversion. Additionally, theweedy generalist species Taraxicum officinale is more abun-dant downstream from diversion.
< 75 cm
< 25 cm
upstreamdownstream
Spe
cies
ric
hnes
sS
peci
es r
ichn
ess
0
8006004002000
15010050
Sites
Sites
0
0
20
10
20
30
40
50
60
40
60
80
100
120
140
upstreamdownstream
Figure 5. Species accumulation curves for four zones with respect to eleva
Copyright © 2014 John Wiley & Sons, Ltd.
Species accumulation curves for the distance zones of< 1m,2m, 3m and 4m indicate a trend from higher species richnessnearest to the channel upstream of diversion, to similar inthe< 2m zone, to slightly higher richness downstream of diver-sion in the< 3m zone, and a noticeably higher richness down-stream of diversion in the< 4m zone (Caskey, 2013).
ANOSIM, MRPP, and permutational MANOVA analysesshow no significant differences in species composition be-tween upstream and downstream reaches based on vertical dis-tance above or lateral distance away from active channel.
Logistic regression for elevation above the channel indicatesa higher probability of occurrence of wetland vegetation spe-cies upstream from diversions, as well as greater difference inprobability closer to the channel, decreasing with increasing el-evation above active channel (Fig. 6). The p-values associatedwith the topography variable for elevation (EL� β1) show thatall of the Wetland Indicator Categories except UPL speciesare significantly related to elevation above the channel,
< 50 cm
< 100 cm
Spe
cies
ric
hnes
sS
peci
es r
ichn
ess
2001000 300 500400
8006004002000 1000 1200
Sites
Sites
0
0
20
20
40
60
80
100
120
140
upstreamdownstream
upstreamdownstream
40
60
80
tion above the channel.
Earth Surf. Process. Landforms, Vol. 40, 586–598 (2015)

0
0.2
0.4
0.6
0.8
1
Elevation above channel (m)
Pro
babi
lity
of o
ccur
renc
e of
FA
CU
or
UP
L
Pro
babi
lity
of o
ccur
renc
e of
OB
L or
FA
CW
Upland species
upstreamdownstream
1.51.00.50
upstreamdownstream
1.51.00.5
Elevation above channel (m)0
Wetland species
0
0.2
0.4
0.6
0.8
1
Figure 6. Logistic regression fits for probability of species occurrence versus distance above channel.
595EFFECTS OF FLOW DIVERSION IN COLORADO ROCKY MOUNTAINS
although none are significantly different between upstream anddownstream from diversion, as indicated by the p-value of theinteraction term (EL*Div – β3) (Table VI). We evaluated eleva-tion significance of the logistic regression for all species, and31 plant species are significantly related to elevation abovethe channel (Caskey, 2013). Significant difference between spe-cies probability as a function of elevation above the channelbetween upstream and downstream from diversion was foundin 14 species (Caskey, 2013). The obligate hydrophyte and fac-ultative wetland species Carex aquatilis and Deschampsiacespitosa have higher probability of occurrence upstream fromdiversion up to 1m above the active channel, whereas the non-hydrophyte Achillea millefolium has a greater probability of oc-currence near the channel downstream of diversion, with zeroprobability of occurrence upstream below 0·4m elevation.Logistic regression for distance from channel indicates that
FACU, FAC and FACW species have probabilities of occur-rence significantly related to distance from the channel, withthe Wetland Indicator Category of FACW species also beingsignificantly different upstream and downstream from diver-sions as a function of distance from the channel (Table VII).Fig. 7 indicates that the FACW group actually has a higherprobability of occurrence as a function of distance up to3.9m, where the curves intersect and upstream from diversionprobability becomes greater.
Table VI. Wetland indicator status logistic regression coefficients and p-val
Intercept (β0) p < Elevation (β1) p <
OBL �1·4575 0·0000 �0·4762 0·0040FACW �1·0560 0·0000 �0·5619 0·0034FAC �1·7840 0·0000 0·6156 0·0004FACU �1·4561 0·0000 0·8375 0·0000
Table VII. Logistic regression coefficients and p-values for significant wetla
Species Intercept (β0) p < Distance (β1) p <
FACW �1·6358 0·0000 0·0812 0·0043FAC �1·6156 0·0000 0·0722 0·0115FACU �1·2086 0·0000 0·0920 0·0003
Copyright © 2014 John Wiley & Sons, Ltd.
In summary, some species typically considered wetland orupland indicators differ significantly in lateral and verticalzonation between reaches upstream and downstream from di-versions. Evenness is significantly greater downstream of diver-sion for some laterally and vertically zoned groups, but not all.Relative abundance of wetland species is significantly higherupstream from the diversions in almost all elevation and dis-tance zones. Upland species relative abundance is significantlyhigher downstream of diversion in one zone. A few wetlandspecies are significantly more frequent upstream from diver-sions, whereas three upland species are significantly more fre-quent downstream from diversions. Two wetland species havehigher probability of occurrence upstream from diversions,whereas one upland species has a greater probability of occur-rence near the channel downstream of diversions. Wetland andupland species have probabilities of occurrence significantlyrelated to distance from the channel.
Discussion
Channel geometry
The statistical analyses indicate that diversions can have a dis-cernible effect on the channel geomorphic parameters measured
ues
Diversion (β2) p < Elev*div (β3) p <
�0·8281 0·0000 0·1847 0·4044�0·1198 0·5151 0·3005 0·25760·3065 0·1053 �0·4798 0·05440·1814 0·2850 0·2977 0·1854
nd indicator groups as a function of distance from the channel
Diversion (β2) p < Dist*div (β3) p <
0·3908 0·0122 �0·1142 0·00530·0658 0·6799 �0·0204 0·61650·5586 0·0000 �0·0486 0·1668
Earth Surf. Process. Landforms, Vol. 40, 586–598 (2015)

upstreamdownstream
Pro
babi
lity
of o
ccur
renc
e of
FA
CW
321
Distance away from channel (m)
0.0
0.1
0.2
0.3
0.4
0 654
Figure 7. Logistic regression plot for FACW species as a function ofdistance from the channel.
596 S. T. CASKEY ET AL.
in this study. The group comparisons indicate that divertedstreams become slightly less sinuous, with the most pronouncedchanges in willow-dominated riparian zones. Reduced sinuosityin these diverted streamsmay reflect lower ability to locally erodethe banks and preserve meander bends. Width, depth, and cross-sectional area differ significantly between control and divertedstreams in the second set of mixed effects models, which adjustedfor drainage basin size. We emphasize the results from thismodel, rather than from the group comparisons or first set ofmixed effects models, because we believe the second set ofmixed effects models more realistically evaluates the complex re-lationships among interacting variables that influence patterns inchannel morphology upstream and downstream from diversions.In summary, diverted streams appear to become narrower andmore homogeneous, as suggested by narrower variance forwidth, depth, and cross-sectional area in the diverted group thanin the control group of streams.The significance of these statistical analyses is particularly in-
teresting given three factors that might have reduced potential dif-ferences between control and diverted streams. The first of theseis the wide range of alterations in flow associated with diversionsin the study area. Diversions completely dewater channels suchas Little Muddy and Service Creeks for some portion of the year,whereas observations during the 2011 and 2012 field seasonssuggest minimal reductions in peak flow along other channels.The second potential complication was the fact that the year2011 was among the highest magnitude andmost sustained peakflows on record at gaged sites throughout this area of northernColorado. During the first year of data collection, we suspectedthat these high flows might have re-set channel morphologyaltered during preceding years of reduced peak flows. Becausethe flow diversions in the study area are primarily for local irriga-tion, diversion is seasonal and proportionally lower during wetyears or years of abundant snowmelt. Finally, groundwater inputsdownstream from the diversion point might be expected to ame-liorate some of the effects of reducing stream flow (McCarthy,2008). The Service Creek Reach, for example, is located in awet meadow. Despite these potentially complicating effects,stream reaches downstream from diversions display significantalterations in channel morphology.
Riparian vegetation
The numerous statistical analyses conducted on the riparian veg-etation data indicate clear differences in riparian communities
Copyright © 2014 John Wiley & Sons, Ltd.
downstream from diversions. Species richness does not changesignificantly downstream from diversions, but this likely reflectsthe increased presence of upland species in the riparian areasdownstream from diversions. Seven of the eight wetland speciesexamined are significantly more frequent upstream from diver-sions, and six of the eight upland species are significantly morefrequent downstream, as is one weedy, invasive, generalist spe-cies (Taraxicum officinale). The change in species dominancedownstream from diversions is an important indicator of asystemic shift in riparian community composition and suggeststhat riparian areas downstream from diversions are becomingterrestrialized as a result of flow alteration. Riparian vegetationmay have responded more strongly to flow diversion than didchannel geometry because the high flows that maintain keycomponents of channel geometry are less influenced by diver-sions, particularly when occasional high flows are allowed tobypass diversions during years of abundant snowmelt, whereasdiversion during warm, dry periods can particularly stress ripar-ian vegetation.
Exposure to physical processes that can structure ripariancommunities, including frequency, magnitude and duration ofinundation and erosion and deposition of substrate, varies in re-lation to elevation above and distance away from the channel.Analyses of riparian vegetation in relation to elevation and dis-tance suggest that much of the shift in community compositionis occurring between 0·25 and 1m above the channel. Theabundance of wetland species closest to the channel(<0·25m above the channel) does not differ significantly be-tween control and diverted reaches, and the most significantdifferences occur in the zones< 0·75m above the channel.Distance from the active channel does not determine speciescomposition patterns as strongly as elevation. For distances of2 to 4m from the channel, however, the decreasing frequencyof wetland species downstream from diversions becomes moresignificant with increasing distance from the channel. This sug-gests that wetland species are being outcompeted as upland spe-cies encroach in response to increasing habitat suitability, likely adecrease in soil moisture. Elevation above and distance awayfrom the channel are interrelated, but the results support H3 insuggesting that moisture gradients downstream from diversionsfavor upland species at the expense of wetland species.
Management implications
Collectively, the hundreds of thousands of intrabasin andtransbasin diversions throughout the AmericanWest have cumu-lative effects on riparian ecosystems that would be difficult toquantify. These effects could collectively account for changessimilar to those imposed by large dams in terms of areal extentof conversion from obligate and facultative wetland-dominatedriparian areas to more xeroriparian areas. Many, mostly smaller,diversions extract water from streams without impounding andstoring significant volumes of water. On those run-of-river diver-sions that pass peak flows, the magnitude and timing of peakflows may be little altered, but the low flow segment of thehydrographmay be significantly altered. In contrast, large storagefacilities, which commonly reduce the magnitude of peak flowssignificantly and alter the timing of the attenuated peaks that pass,potentially increase base flow, and alter daily variability in flows.Several studies have shown that large storage facilities mayreduce the frequency of creation and the extent of open patcheswhich colonizing riparian species rely upon to becomeestablished, while at the same time increasing the duration offlooding near the channel and enhancing habitat for hydric spe-cies (e.g. Merritt and Cooper, 2000). Downstream from diver-sions, however, regenerative habitat may be available, but the
Earth Surf. Process. Landforms, Vol. 40, 586–598 (2015)

597EFFECTS OF FLOW DIVERSION IN COLORADO ROCKY MOUNTAINS
low flows to support extant native hydric vegetation may be al-tered. This could favor ruderal, weedy species and explain the re-duction in obligate wetland species downstream from diversions.Obligate riparian species tend to be ecological specialists withlife history traits that are closely tied to the natural hydrologic re-gime. Obligate plants could thus be predicted to be more vulner-able to diversion, whereas some facultative plants could actuallybenefit, as our results indicate. This is consistent with patterns ofdownstream impacts from river damming (Rood et al., 2010).Our findings suggest that diversion-induced flow alteration is
altering channel geometry and riparian vegetation communi-ties in the lower gradient stream segments of this semi-arid,mountainous region. Natural patterns of lateral and longitudi-nal connectivity are integral to sustaining populations of manyriverine species (Bunn and Arthington, 2002), but our results in-dicate that both channel geometry and vegetation in the studyarea are becoming homogenized downstream from diversions,similar to the homogenization of flow (Poff et al., 2007), fish(Moyle and Mount, 2007), and wetlands (Lougheed et al.,2008) in environments around the world. As hydrophytic spe-cies decrease in abundance downstream from diversions, thiscould impact processes such as allochthonous energy inputs,stream temperatures, and the ability of exotic species to colo-nize riparian zones (Bunn and Arthington, 2002). The effectsof flow diversion could also potentially be exacerbated by cli-mate change, which is projected to result in warmer tempera-tures and earlier snowmelt peaks in the study area (Stewartet al., 2005). Because many riparian species have dispersal,germination or other reproductive traits adapted to the timingof peak flows, the stresses associated with flow diversionscould influence riparian community composition even morein the future (Lytle and Poff, 2004). Although our study didnot evaluate how far downstream from each flow diversionthe observed changes exist, the large number of diversions onstreams in the study area and in other mountainous watershedsof the western United States suggests that the cumulative effectsof diversion-induced changes in river systems are likely to besubstantial.Management of diversions and mitigation of their effects could
focus on quantifying the effects of individual diversions on flowregime by installing discharge gages, developing a record of dailyflows upstream and downstream from diversions, or just withinthe diversions, and using a comparative analysis such as Indica-tors of Hydrologic Alteration (Richter et al., 1996). Streamsegments likely to have greater biodiversity, such as partly con-fined and unconfined valleys, could be targeted for protectionfrom future diversions or for moving existing diversions to lesssensitive stream segments. Finally, ensuring that diversions haveproper oversight, especially during periods when hydrographtriggers are most important for riparian species, could help toensure that at least some peak flows are allowed to reach streamreaches downstream from the diversion.
Conclusions
Many of the world’s rivers are affected by direct flow alteration,primarily by dams and diversions, yet the impacts of the latteron channel geometry and riparian plant community composi-tion and diversity have received little attention and are not wellunderstood.Diversions extract water from streams without impounding
flow. Diversions do not necessarily alter the shape of ahydrograph, but they can reduce peak and base flow, therebychanging the abiotic factors to which stream and riparian eco-systems have adjusted. Many riparian plant species are adaptedto the unique timing, magnitude and duration of the natural
Copyright © 2014 John Wiley & Sons, Ltd.
flow regime, implying that changes in flooding disturbanceand water availability could lead to decreased suitable habitatand invasion by upland and/or exotic species (Bunn andArthington, 2002; Naiman et al., 2005). Developing an under-standing of the effects on riparian vegetation by diversion-induced flow alteration is important to better managing thetiming, magnitude and duration of withdrawals in order tosustain native riparian communities and beneficial ecosystemservices, and to focus future study on specific thresholds ofhydrologic alteration resulting in community change.
Many studies have examined the effects of dams on riparianareas, but this work is the first to investigate changes in plantcommunity composition as a result of diversion. We found thatseveral channel morphologic parameters, and the proportion ofthe riparian vegetation community composed of characteristi-cally wetland versus upland species, differ significantlydownstream from diversions. Our findings that diversions sig-nificantly alter downstream channel morphology and riparianvegetation communities at the local scale suggests that thecumulative, watershed-scale effects of diversions on numerousheadwater channels are likely to be important. More intensive,site-level studies quantifying the hydrology and functionalcharacteristics of the plants are necessary to characterize theparticular aspects of the flow regime necessary to sustainhealthy riparian plant communities and populations, as wellas identifying the response thresholds at which effects of alteredhydrology significantly influence the composition and func-tioning of these ecosystems. Further, such information may beused to encourage minor adjustments in the management ofdiversions that provide for specific life history requirements ofriparian species and encourage ecological recovery with littlecost in terms of quantity of flow.
Acknowledgements—The authors thank the USDA Forest Service forfinancial and logistical support of this work. The manuscript wasimproved by comments from Stewart Rood and Murray Hicks.
ReferencesAmoros C, Bornette G. 2002. Connectivity and biocomplexity inwaterbodies of riverine floodplains. Freshwater Biology 47: 761–776.
Anderson MJ. 2001. A new method for non-parametric multivariateanalysis of variance. Austral Ecology 26: 32–46.
Anderson MJ, Ellingsen KE, McArdle BH. 2006. Multivariate dispersionas a measure of beta diversity. Ecology Letters 9: 683–693.
Atwood WW. 1937. Records of Pleistocene glaciers in the MedicineBow and Park Ranges. The Journal of Geology 45: 113–140.
Baker DW, Bledsoe BP, Albano CM, Poff NL. 2011. Downstreameffects of diversion dams on sediment and hydraulic conditionson Rocky Mountain streams. River Research and Applications 27:388–401.
Bendix J, Hupp CR. 2000. Hydrological and geomorphological im-pacts on riparian plant communities. Hydrological Processes 14:2977–2990.
Blaschak TS. 2012. Examining Geomorphic Effects of Flow Diversionson Low-gradient Mountain Streams in the Routt National Forest,Colorado, MS Thesis. Colorado State University, Fort Collins, CO.
Bohn CC, King JG. 2000. Stream Channel Responses to StreamflowDiversion on Small Streams of the Snake River Drainage, Idaho,USDA Forest Service, Rocky Mountain Research Station, ResearchPaper RMRS-RP-20. USDA Forest Service: Ogden, UT.
Bunn SE, Arthington AH. 2002. Basic principles and ecological conse-quences of altered flow regimes for aquatic biodiversity. Environmen-tal Management 30: 492–507.
Capesius JP, Stephens VC. 2009. Regional regression equations for esti-mation of natural streamflow statistics in Colorado. US GeologicalSurvey Scientific Investigations Report 2009–5136, 46 pp. Accessedvia StreamStats website: http://water.usgs.gov/osw/streamstats/colo-rado.html
Earth Surf. Process. Landforms, Vol. 40, 586–598 (2015)

598 S. T. CASKEY ET AL.
Caskey ST. 2013. Downstream Effects of Diversion Dams on RiparianVegetation Communities in the Routt National Forest, Colorado, MSThesis. Colorado State University, Fort Collins, CO.
Clarke KR. 1993. Non-parametric multivariate analyses of changes incommunity structure. Australian Journal of Ecology 18: 117–143.
Colorado Decision Support Systems (CDSS). 2012. Online Tools:Structures (Diversions). http://cdss.state.co.us/ONLINETOOLS/Pages/StructuresDiversions.aspx.
Englund G, Malmqvist B. 1996. Effects of flow regulation, habitat areaand isolation on the macroinvertebrate fauna of rapids in northSwedish rivers. Regulated Rivers: Research and Management 12:433–445.
Hail WJ. 1968. Geology of Southwestern North Park and Vicinity, Col-orado, US Geological Survey Bulletin 1257. US Geological Survey:Reston, VA; 119 pp.
Harrelson CC, Rawlins CL, Potyondy JP. 1994. Stream Channel Refer-ence Sites: An Illustrated Guide to Field Technique, USDA Forest Ser-vice, Rocky Mountain Forest and Range Experiment Station, GeneralTechnical Report RM-245. USDA Forest Service: Fort Collins, CO;61 pp.
Harris RR, Fox CA, Risser R. 1987. Impacts of hydroelectric develop-ment on riparian vegetation in the Sierra Nevada region, California,USA. Environmental Management 11: 519–527.
Kagawa H. 1992. Effects of diversion on the chemistry of a stream inJapan. Regulated Rivers: Research and Management 7: 291–302.
Kent M. 2011. Vegetation Description and Data Analysis: A PracticalApproach. Wiley-Blackwell: Oxford.
Kettler S, McMullen A. 1996. Routt National Forest Riparian VegetationClassification. Colorado State University, Colorado Natural HeritageProgram: Fort Collins, CO.
Krebs CJ. 1999. Ecological Methodology. Benjamin/Cummings: MenloPark, CA.
Lichvar RW, Melvin NC, Butterwick M, Kirchner WN. 2012. NationalWetland Plant List Indicator Rating Definitions, US Army Corps ofEngineers ERDC/CRREL TN-12-1. US Army Corps of Engineers:Washington, DC.
Lougheed VL, McIntosh MD, Parker CA, Stevenson RJ. 2008. Wetlanddegradation leads to homogenization of the biota at local and land-scape scales. Freshwater Biology 53: 2402–2413.
Lytle DA, Poff NL. 2004. Adaptation to natural flow regimes. Trends inEcology and Evolution 19: 94–100.
Magurran AE. 2004.Measuring Biological Diversity. Taylor and Francis:Oxford.
McCarthy JM. 2008. Factors Influencing Ecological Recovery Down-stream of Diversion Dams in Southern Rocky Mountain Streams,MS Thesis. Colorado State University, Fort Collins, CO.
McIntosh MD, Benbow ME, Burky AJ. 2002. Effects of stream diversionon riffle macroinvertebrate communities in a Maui, Hawaii, stream.River Research and Applications 18: 569–581.
McKay S, King A. 2006. Potential ecological effects of water extractionin small, unregulated streams. River Research and Applications 22:1023–1037.
Merritt DM, Cooper DJ. 2000. Riparian vegetation and channel changein response to river regulation: a comparative study of regulated andunregulated streams in the Green River basin, USA. Regulated Rivers:Research and Management 16: 543–564.
Merritt DM, Wohl EE. 2006. Plant dispersal along rivers fragmented bydams. River Research and Applications 22: 1–26.
Copyright © 2014 John Wiley & Sons, Ltd.
Mielke PW, Berry KJ. 2001. Permutation Methods: A Distance FunctionApproach. Springer Verlag: Berlin.
Montgomery DR, Buffington JM. 1997. Channel-reach morphology inmountain drainage basins. Geological Society of America Bulletin109: 596–611.
Moyle PB, Mount JF. 2007. Homogenized rivers, homogenized faunas.Proceedings, National Academy of Sciences 104: 5711–5712.
Naiman RJ, Décamps H. 1997. The ecology of interfaces: riparianzones. Annual Review of Ecology and Systematics 28: 621–658.
Naiman RJ, Décamps H, McClain ME. 2005. Riparia: Ecology, Conser-vation, and Management of Streamside Communities. AcademicPress: London.
Oksanen J. 2011. Multivariate analysis of ecological communities in R:vegan tutorial. R Package Version. http://www.r-project.org/.
Pielou EC. 1969. An Introduction to Mathematical Ecology. John Wiley& Sons: Chichester.
Pielou EC. 1977.Mathematical Ecology. JohnWiley & Sons: Chichester.Poff NL, Olden JD, Merritt DM, Pepin DM. 2007. Homogenization ofregional river dynamics by dams and global biodiversity implica-tions. Proceedings, National Academy of Sciences 104: 5732–5737.
Polvi LE. 2009. Characterization of Riparian Zones in Mountain Valleysof the Colorado Front Range, MS Thesis. Colorado State University,Fort Collins, CO.
R Development Core Team. 2011. R: A Language and Environment forStatistical Computing. http://www.r-project.org/.
Rader RB, Belish TA. 1999. Influence of mild to severe flow alterations oninvertebrates in three mountain streams. Regulated Rivers: Researchand Management 15: 353–363.
Richter BD, Baumgartner JV, Powell J, Braun DP. 1996. A method forassessing hydrologic alteration within ecosystems. ConservationBiology 10: 1163–1174.
Rood SB, Braatne JH, Goater LA. 2010. Responses of obligate versusfacultative riparian shrubs following river damming. River Researchand Applications 26: 102–117.
Rosgen DL. 1994. A classification of natural rivers. Catena 22: 169–199.Ryan SE. 1997. Morphologic response of subalpine streams to transbasinflow diversion. Journal of the American Water Resources Association33: 839–854.
Smith B, Wilson JB. 1996. A consumer’s guide to evenness indices.Oikos 76: 70–82.
Smith SD, Wellington AB, Nachlinger JL, Fox CA. 1991. Functional re-sponses of riparian vegetation to streamflow diversion in the easternSierra Nevada. Ecological Applications 1: 89–97.
Sokal RR, Rohlf FJ. 1994. Biometry: The Principles and Practices of Statis-tics in Biological Research, 3rd ed. W.H. Freeman and Co.: New York.
Stamp ML, Schmidt JC. 2006. Predicting channel responses to flowdiversions. Stream Notes October: 1–6.
Stewart IT, Cayan DR, Dettinger MD. 2005. Changes toward earlierstreamflow timing across western North America. Journal of Climate18: 1136–1155.
Stromberg JC, Patten DT. 1990. Riparian vegetation instream flow re-quirements: a case study from a diverted stream in the eastern SierraNevada, California, USA. Environmental Management 14: 185–194.
Wesche TA, Skinner QD, Hasfurther VR, Wolff SW. 1988. StreamChannel Response to Flow Depletion. Report to the Wyoming WaterDevelopment Commission, Cheyenne, WY.
Wolman MG. 1954. A method of sampling coarse river-bed material.Transactions American Geophysical Union 35: 951–956.
Earth Surf. Process. Landforms, Vol. 40, 586–598 (2015)