downsizing the us coal industry: can a slow-motion train ... · pdf filedownsizing the us coal...
TRANSCRIPT
Stefan RehbachRobert Samek
Metals & Mining Practice November 2015
Downsizing the US coal industry: Can a slow-motion train wreck be avoided?


3 Downsizing the US coal industry: Can a slow-motion train wreck be avoided?
Downsizing the US coal industry: Can a slow-motion train wreck be avoided?
The United States has plenty of coal, but the world does not need it. By 2020, the convergence of low-cost shale-gas supply, environmental regulation, and waning international demand is likely to push demand for US coal to at least 20 percent below what US mines currently produce—which is already almost 20 percent below 2008 levels.
The crisis the coal industry faces comprises a number of interlinked parts: overcapacity and continuing demand shrinkage, chronic indebtedness and environmental liabilities, and insufficient profitability, which together limit its freedom of maneuver. Even if industry capacity is cut enough to balance supply and demand in 2020, coal producers would still be unable to service most of their approximately $70 billion of remaining debt and liabilities, McKinsey’s Basic Materials Institute has found.
In this report, we examine the decline in demand for US coal and the industry rationalization that would be required to mitigate overcapacity. We quantify the industry’s financial liabilities and the challenge it faces servicing them today and in the future. A wide array of stakeholders is embroiled in this crisis, from mine workers and retirees to communities and state governments, from investors to pension funds and the holders of environmental claims against the mining companies. We believe that the industry’s financial difficulties—particularly its potential inability to support its liabilities after 2020—are not yet broadly understood, and we hope that our analysis offers stakeholders a solid fact base to underpin their discussions about how to address the crisis.
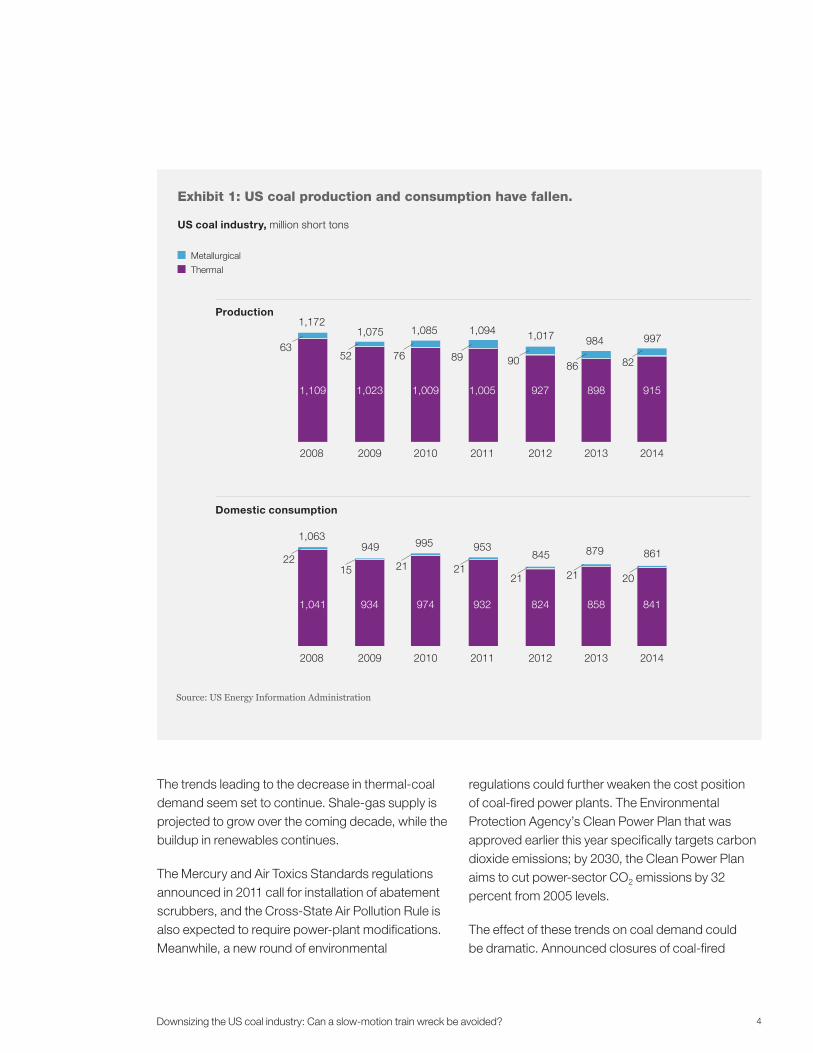
The United States is headed for more than 20 percent surplus capacityThe US coal industry hit its all-time peak production in 2008 and its highest-ever profitability as recently as 2011. Both output and earnings have since fallen sharply. The massive contraction in domestic thermal-coal demand is at the root of the industry’s problems. As of the end of 2014, demand had fallen by 200 million tons a year, or 19 percent, from the 2008 peak (Exhibit 1).
Production capacity has not fallen at nearly the same pace, so coal prices have also dropped significantly. Since 2011, prices have declined by 20 to 40 percent domestically and by more than 60 percent for exports.
There are a number of reasons for the fall in domestic thermal-coal demand. First, coal is losing market share in the power-generation sector to gas-fired power plants consuming low-priced natural gas—derived primarily from hydraulic fracturing of shale rock—and to renewables (Exhibit 2). On top of this, coal-fired power plants are facing government requirements to install emission-reduction equipment. If the shale gas–fired and renewables alternatives did not exist, or if coal-production costs had fallen sufficiently to stay competitive with gas, it could be economically viable for utilities to upgrade their coal-fired generation capacity to comply with the requirements. In the current environment, however, the return on these investments is well below the cost of capital; instead, it makes more sense for many power-generation companies to shut down coal-burning plants.
The US coal industry faces not just overcapacity but crippling liabilities that will outlive mine closures. Setting the industry on a viable course will require all stakeholders to step up with new ideas.
4Downsizing the US coal industry: Can a slow-motion train wreck be avoided?
The trends leading to the decrease in thermal-coal demand seem set to continue. Shale-gas supply is projected to grow over the coming decade, while the buildup in renewables continues.
The Mercury and Air Toxics Standards regulations announced in 2011 call for installation of abatement scrubbers, and the Cross-State Air Pollution Rule is also expected to require power-plant modifications. Meanwhile, a new round of environmental
regulations could further weaken the cost position of coal-fired power plants. The Environmental Protection Agency’s Clean Power Plan that was approved earlier this year specifically targets carbon dioxide emissions; by 2030, the Clean Power Plan aims to cut power-sector CO2 emissions by 32 percent from 2005 levels.
The effect of these trends on coal demand could be dramatic. Announced closures of coal-fired
November 2015US coalExhibit 1 of 6
Source: US Energy Information Administration
1,172
2008 2009 2010
1,075 1,085 1,094
2011 2012 2013
1,017 984
2014
997
1,063
2008 2009 2010
949 995 953
2011 2012 2013
845 879
2014
861
6352
8286908976
1,109 1,023 1,009 1,005 927 898 915
1,041 934 974 932 824 858 841
2215
2021212121
Domestic consumption
Production
Metallurgical
Thermal
Exhibit 1: US coal production and consumption have fallen.
US coal industry, million short tons

5
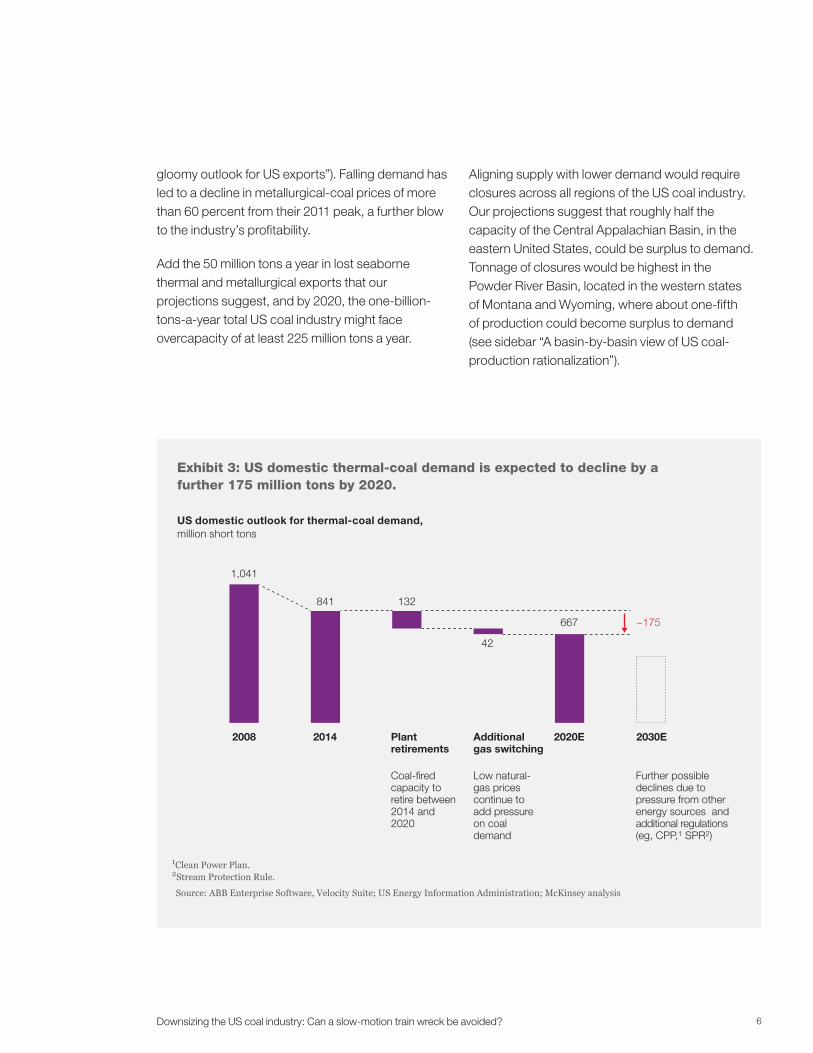
generation capacity between 2014 and 2020 would correspond to a reduction of about 132 million tons of coal demand, on top of the actual demand reduction of 200 million tons that occurred from 2008 to 2014.
We also analyzed utilities’ production economics and ability to afford pollution-abatement investments. Using a projected gas price of $3.30 per million British thermal units, we modeled how many utilities are likely to switch from coal to natural-gas power generation between 2014 and 2020. Our projections suggest that by 2020, such switching could lead to a further reduction of 42 million tons in annual coal demand; if a natural-gas price prevails that is lower
than what we have projected, it is possible that additional switching could occur.
This decline of approximately 175 million tons (132 million from announced closures, plus 42 million that we project) in total annual power-generation-sector demand by 2020 would represent a 21 percent reduction from 2014. At this point, the level of US domestic thermal-coal demand would be down by more than 35 percent compared with 2008 (Exhibit 3).
Demand for US metallurgical coal, primarily an export business, has also dropped from its peak in 2011 (see sidebar “Seaborne coal markets: A
Downsizing the US coal industry: Can a slow-motion train wreck be avoided?
November 2015US coalExhibit 2 of 6
2020E20102000
100%= 4,0534,372 4,512
Total electricity generation,terawatt-hours1
2000–10 CAGR,2 %
2010–20 CAGR, %
1Figures may not sum to 100%, because of rounding.2Compound annual growth rate.
Source: Enerdata; McKinsey analysis
−10 −2
2 3
0 1
5 4
−1 −431
19
141
35
46
19
111
24
9
3
20
Oil
Renewables
Nuclear
Natural gas
Coal
16
53
0.8% p.a.0.3% p.a.
Exhibit 2: US electricity production is expected to remain flat, with coal losing share to natural gas and renewables.
6Downsizing the US coal industry: Can a slow-motion train wreck be avoided?
gloomy outlook for US exports”). Falling demand has led to a decline in metallurgical-coal prices of more than 60 percent from their 2011 peak, a further blow to the industry’s profitability.
Add the 50 million tons a year in lost seaborne thermal and metallurgical exports that our projections suggest, and by 2020, the one-billion-tons-a-year total US coal industry might face overcapacity of at least 225 million tons a year.
Aligning supply with lower demand would require closures across all regions of the US coal industry. Our projections suggest that roughly half the capacity of the Central Appalachian Basin, in the eastern United States, could be surplus to demand. Tonnage of closures would be highest in the Powder River Basin, located in the western states of Montana and Wyoming, where about one-fifth of production could become surplus to demand (see sidebar “A basin-by-basin view of US coal-production rationalization”).
November 2015US coalExhibit 3 of 6
1Clean Power Plan.2Stream Protection Rule.
Source: ABB Enterprise Software, Velocity Suite; US Energy Information Administration; McKinsey analysis
US domestic outlook for thermal-coal demand,million short tons
1,041
2008 2014 2020EPlant retirements
Coal-fired capacity to retire between 2014 and 2020
Additional gas switching
2030E
Low natural-gas prices continue to add pressure on coal demand
Further possible declines due to pressure from other energy sources and additional regulations (eg, CPP,1 SPR2)
841 132
42
667 ~175
Exhibit 3: US domestic thermal-coal demand is expected to decline by a further 175 million tons by 2020.
7 Downsizing the US coal industry: Can a slow-motion train wreck be avoided?
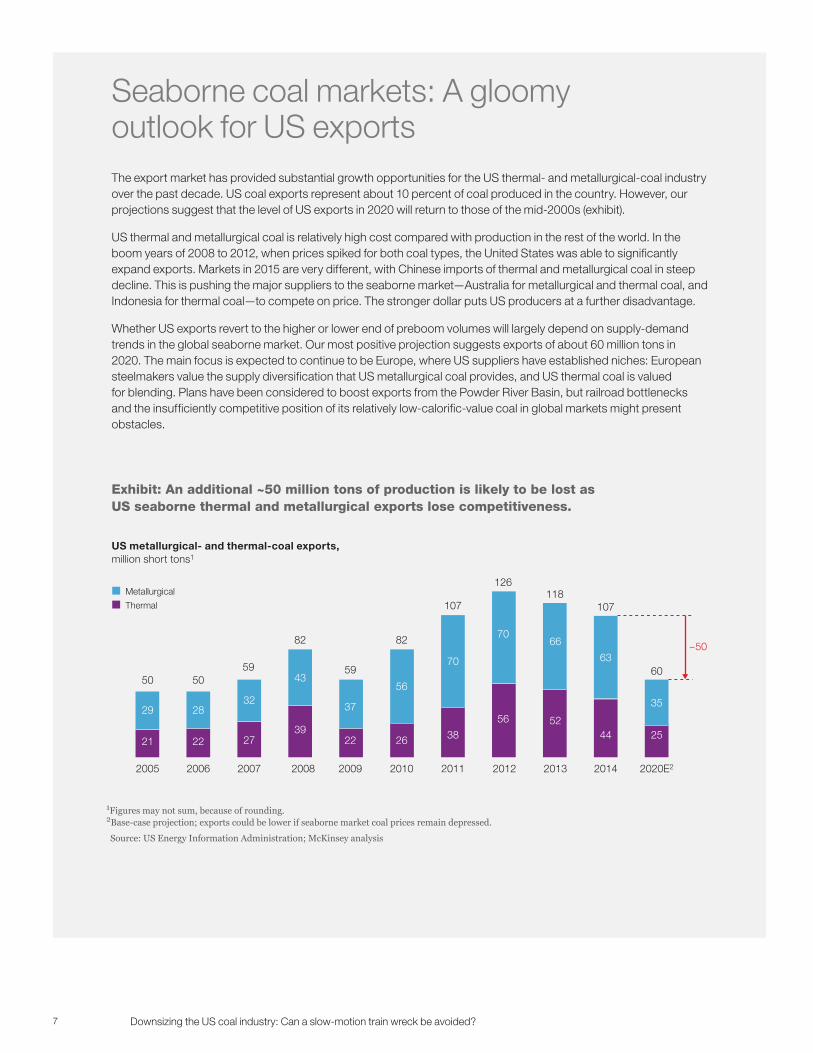
The export market has provided substantial growth opportunities for the US thermal- and metallurgical-coal industry over the past decade. US coal exports represent about 10 percent of coal produced in the country. However, our projections suggest that the level of US exports in 2020 will return to those of the mid-2000s (exhibit).
US thermal and metallurgical coal is relatively high cost compared with production in the rest of the world. In the boom years of 2008 to 2012, when prices spiked for both coal types, the United States was able to significantly expand exports. Markets in 2015 are very different, with Chinese imports of thermal and metallurgical coal in steep decline. This is pushing the major suppliers to the seaborne market—Australia for metallurgical and thermal coal, and Indonesia for thermal coal—to compete on price. The stronger dollar puts US producers at a further disadvantage.
Whether US exports revert to the higher or lower end of preboom volumes will largely depend on supply-demand trends in the global seaborne market. Our most positive projection suggests exports of about 60 million tons in 2020. The main focus is expected to continue to be Europe, where US suppliers have established niches: European steelmakers value the supply diversification that US metallurgical coal provides, and US thermal coal is valued for blending. Plans have been considered to boost exports from the Powder River Basin, but railroad bottlenecks and the insufficiently competitive position of its relatively low-calorific-value coal in global markets might present obstacles.
Seaborne coal markets: A gloomy outlook for US exports
November 2015US coalSidebar exhibit 1
5050
2005 2006 2007
59
82
59
2008 2012 2013 2014 2020E22009 2010
82
107
2011
126118
107
60
29 2832
43
37
56
70
7066
63
35
21 22 2739
22 26 38
56 5244 25
~50
Metallurgical
Thermal
1Figures may not sum, because of rounding.2Base-case projection; exports could be lower if seaborne market coal prices remain depressed.
Source: US Energy Information Administration; McKinsey analysis
Exhibit: An additional ~50 million tons of production is likely to be lost as US seaborne thermal and metallurgical exports lose competitiveness.
US metallurgical- and thermal-coal exports,million short tons1
Downsizing the US coal industry: Can a slow-motion train wreck be avoided?
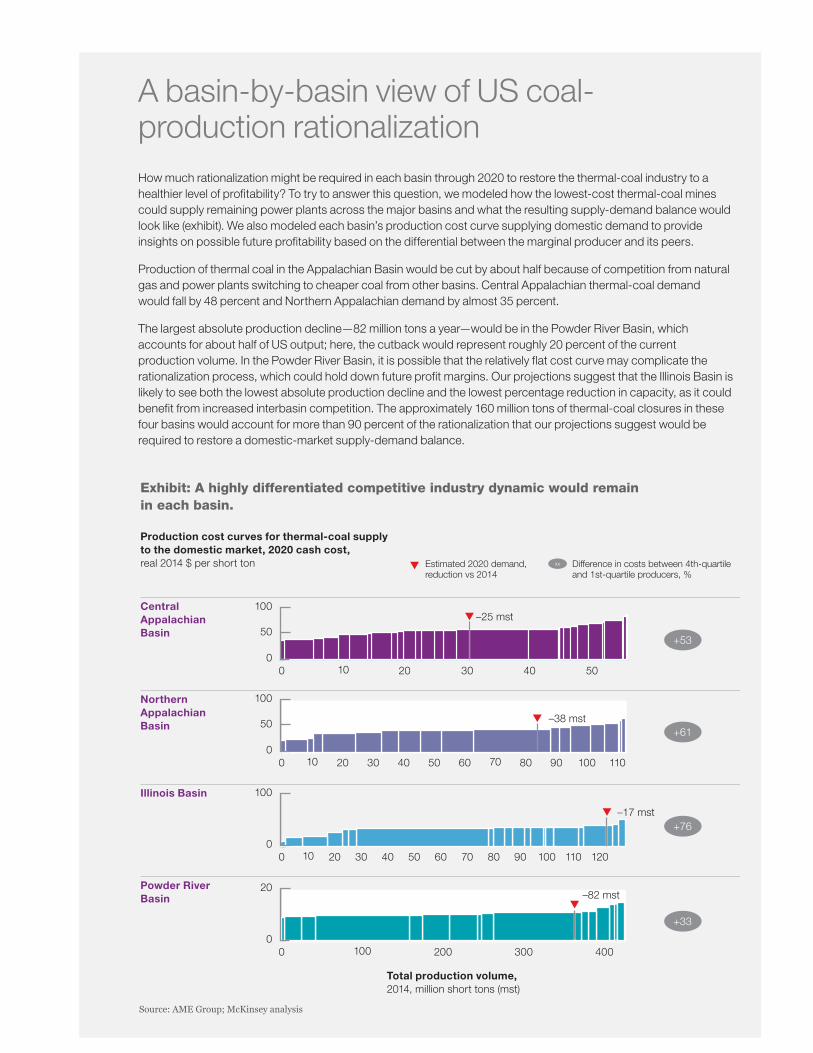
How much rationalization might be required in each basin through 2020 to restore the thermal-coal industry to a healthier level of profitability? To try to answer this question, we modeled how the lowest-cost thermal-coal mines could supply remaining power plants across the major basins and what the resulting supply-demand balance would look like (exhibit). We also modeled each basin’s production cost curve supplying domestic demand to provide insights on possible future profitability based on the differential between the marginal producer and its peers.
Production of thermal coal in the Appalachian Basin would be cut by about half because of competition from natural gas and power plants switching to cheaper coal from other basins. Central Appalachian thermal-coal demand would fall by 48 percent and Northern Appalachian demand by almost 35 percent.
The largest absolute production decline—82 million tons a year—would be in the Powder River Basin, which accounts for about half of US output; here, the cutback would represent roughly 20 percent of the current production volume. In the Powder River Basin, it is possible that the relatively flat cost curve may complicate the rationalization process, which could hold down future profit margins. Our projections suggest that the Illinois Basin is likely to see both the lowest absolute production decline and the lowest percentage reduction in capacity, as it could benefit from increased interbasin competition. The approximately 160 million tons of thermal-coal closures in these four basins would account for more than 90 percent of the rationalization that our projections suggest would be required to restore a domestic-market supply-demand balance.
A basin-by-basin view of US coal-production rationalization
November 2015US coalSidebar exhibit 2
Source: AME Group; McKinsey analysis
50
0
100
50403020100
Difference in costs between 4th-quartile and 1st-quartile producers, %
+53
–25 mst
xxEstimated 2020 demand, reduction vs 2014
–38 mst
–17 mst
–82 mst
+61
+76
+33
50
0
100
50403020100 11010090807060
0
100
50 807060 90 100 110 120403020100
0
20
4003002001000
Exhibit: A highly differentiated competitive industry dynamic would remain in each basin.
Production cost curves for thermal-coal supply to the domestic market, 2020 cash cost, real 2014 $ per short ton
Total production volume,2014, million short tons (mst)
Central Appalachian Basin
Northern Appalachian Basin
Illinois Basin
Powder River Basin

9 Downsizing the US coal industry: Can a slow-motion train wreck be avoided?
Breaking point: The industry’s liabilities are more than it can carry Correcting the supply-demand imbalance could help the industry, but its financial problems go much deeper. Indeed, the full extent of the industry’s financial difficulties is poorly understood, inside and outside the sector, even though several US coal companies have already filed for Chapter 11 bankruptcy. In our research, we sought to determine how big the industry’s liabilities actually are and whether there is a way for a much smaller coal sector to generate sufficient returns to cover them. The outlook is dire, our analysis found. Even after closing enough capacity to restore a supply-demand balance in 2020, the US coal industry would have remaining liabilities of about $70 billion. These would far outweigh the industry’s profit-making ability and therefore condemn it to potentially decades of loss-making operations.
Our company-by-company analysis shows that the industry’s current liabilities rose to nearly $100 billion by the end of 2014. The largest piece of this is long-term debt (the value of which has tripled since 2008), followed by contractual obligations, asset-retirement obligations, and pension-funding obligations (Exhibit 4). Based on our analysis of the financial statements of all the major US coal producers, it costs the industry about $9 billion to $10 billion a year just to service these liabilities. This is equivalent to roughly $10 a ton of coal produced.
Our calculations are based on book values of these liabilities as of the end of 2014. Given that the market value of the coal industry’s debt is now significantly below book value, it is arguable that the debt numbers used could be on the high side. However, the projections of asset-retirement obligations are based on the assumption that an orderly
November 2015US coalExhibit 4 of 6
1Based on company reports representing approximately 72% of 2014 production, with balance extrapolated.2Long-term sector debt has more than tripled since 2008.3United Mine Workers of America.
Source: McKinsey analysis
US thermal- and metallurgical-coal-mining industry liabilities,1
2014 end of year, $ billion
50−55
Asset-retirement obligations
Operating leases/contractual obligations
Long-term debt2
1974 UMWA3 plan
Pension/workers’ compensation/retiree medical
Total direct industry liability
1510
6
12 95−100On balance sheet
Off balance sheet
Exhibit 4: The US coal industry has estimated liabilities of approximately $100 billion, largely driven by debt and contractual and asset-retirement obligations.
10Downsizing the US coal industry: Can a slow-motion train wreck be avoided?
rationalization of overcapacity would take place, which is probably not realistic in today’s context, and so these liabilities are probably understated. In addition, the employee liabilities at some companies may be based on rates of return and discount rates that might understate the true scale of the liabilities. Taking these different factors into account, we believe the projected liabilities are in the range of the outcome that can be expected.
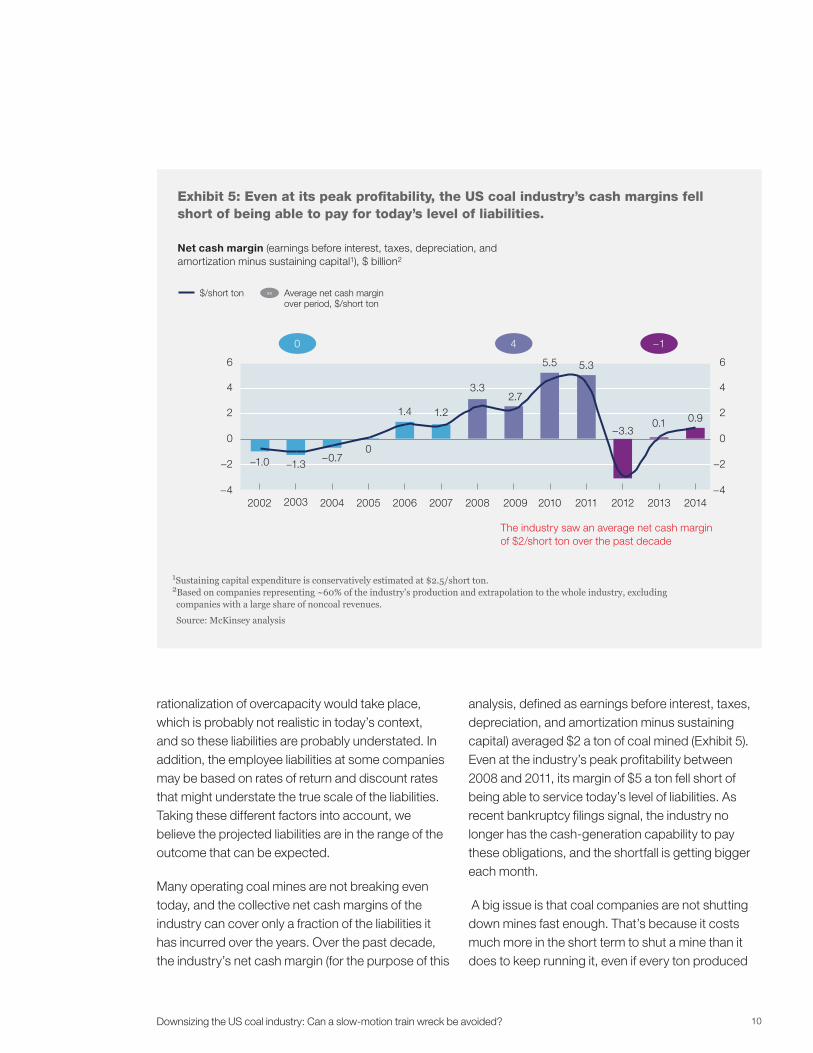
Many operating coal mines are not breaking even today, and the collective net cash margins of the industry can cover only a fraction of the liabilities it has incurred over the years. Over the past decade, the industry’s net cash margin (for the purpose of this
analysis, defined as earnings before interest, taxes, depreciation, and amortization minus sustaining capital) averaged $2 a ton of coal mined (Exhibit 5). Even at the industry’s peak profitability between 2008 and 2011, its margin of $5 a ton fell short of being able to service today’s level of liabilities. As recent bankruptcy filings signal, the industry no longer has the cash-generation capability to pay these obligations, and the shortfall is getting bigger each month.
A big issue is that coal companies are not shutting down mines fast enough. That’s because it costs much more in the short term to shut a mine than it does to keep running it, even if every ton produced
November 2015US coalExhibit 5 of 6
1Sustaining capital expenditure is conservatively estimated at $2.5/short ton.2Based on companies representing ~60% of the industry’s production and extrapolation to the whole industry, excluding companies with a large share of noncoal revenues.
Source: McKinsey analysis
−2
−4
2
4
0
6
−2
−4
2
4
0
6
200720062005200420032002 20092008 2010 20122011 2013 2014
1.21.4
0−0.7
−1.3−1.0
2.73.3
5.5
−3.3
5.3
0.1 0.9
$/short ton Average net cash margin over period, $/short ton
0 4
xx
−1
Exhibit 5: Even at its peak profitability, the US coal industry’s cash margins fell short of being able to pay for today’s level of liabilities.
Net cash margin (earnings before interest, taxes, depreciation, and amortization minus sustaining capital1), $ billion2
The industry saw an average net cash margin of $2/short ton over the past decade
11 Downsizing the US coal industry: Can a slow-motion train wreck be avoided?
is unprofitable. In other words, while rationalization of capacity might appear logical in the current market environment, the need for cash has resulted in decisions by several coal companies to maintain unprofitable production. This is often because of pressure from bondholders that demand continued payment of interest and, they hope, principal someday. Closing mines requires a lot of money and could impair the ability of coal companies to pay interest and return funds to bondholders. The result is that the United States is home to a collection of “zombie mines” that cannot turn a profit but are too costly to close.
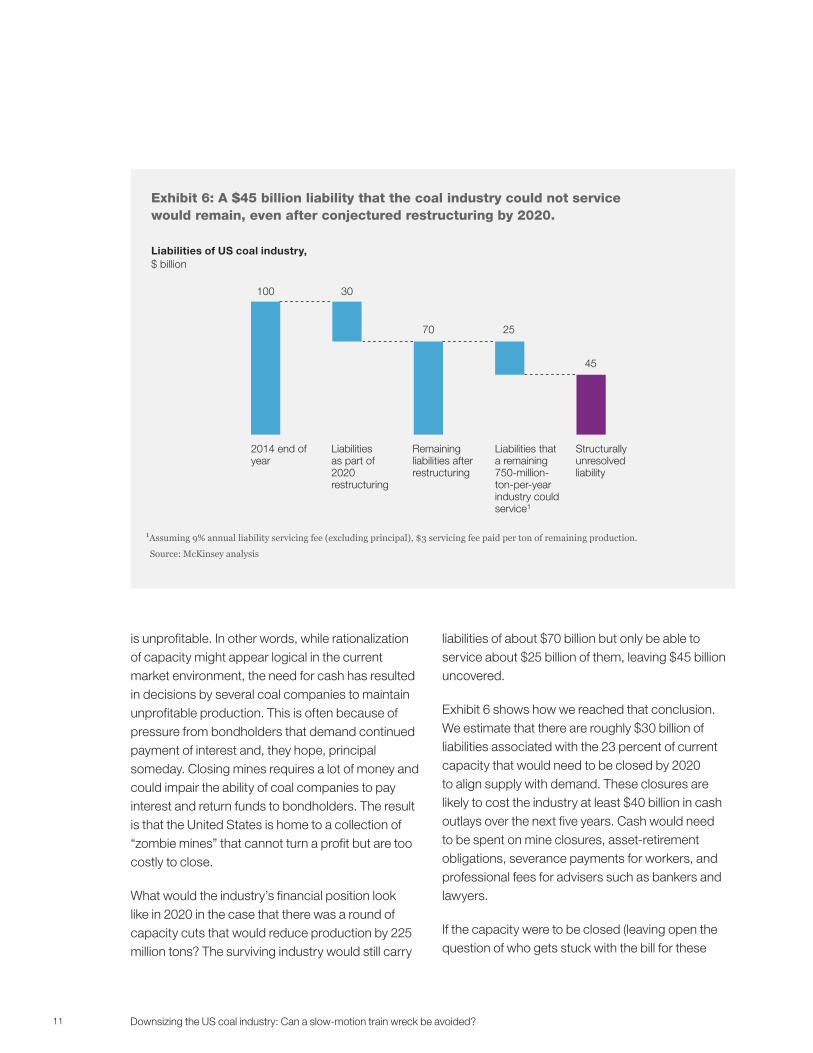
What would the industry’s financial position look like in 2020 in the case that there was a round of capacity cuts that would reduce production by 225 million tons? The surviving industry would still carry
liabilities of about $70 billion but only be able to service about $25 billion of them, leaving $45 billion uncovered.
Exhibit 6 shows how we reached that conclusion. We estimate that there are roughly $30 billion of liabilities associated with the 23 percent of current capacity that would need to be closed by 2020 to align supply with demand. These closures are likely to cost the industry at least $40 billion in cash outlays over the next five years. Cash would need to be spent on mine closures, asset-retirement obligations, severance payments for workers, and professional fees for advisers such as bankers and lawyers.
If the capacity were to be closed (leaving open the question of who gets stuck with the bill for these
November 2015US coalExhibit 6 of 6
1Assuming 9% annual liability servicing fee (excluding principal), $3 servicing fee paid per ton of remaining production.
Source: McKinsey analysis
Liabilities of US coal industry,$ billion
100
Remaining liabilities after restructuring
Liabilitiesas part of 2020 restructuring
2014 end of year
Liabilities that a remaining 750-million-ton-per-year industry could service1
Structurally unresolved liability
30
70 25
45
Exhibit 6: A $45 billion liability that the coal industry could not service would remain, even after conjectured restructuring by 2020.
12Downsizing the US coal industry: Can a slow-motion train wreck be avoided?
closures, given the challenged financial state of many mining companies), the smaller remaining industry would still have $70 billion of liabilities to service. If we take the industry’s historical average annual net cash margins of the past decade of just $2 a ton and project on that basis, the industry could only afford $25 billion of those liabilities. This would mean that the industry that emerges from the downsizing will still carry liabilities of $45 billion that its poor level of profitability would leave it unable to service.
What next for the US coal industry?The US coal industry is still in the early stages of what could be decades of financial difficulty. Beyond the pain to stockholders, debt holders, and employees, the industry’s giant liabilities are crippling its freedom of maneuver and will limit its flexibility to rationalize capacity. The coal industry faces some hard choices, whether or not players collectively realize it. While harsh capacity cuts are normally viewed as the tough but surefire way that an industry can turn its situation around, that is not the case for the US coal industry. As we have laid out, the industry could still face a burden of $70 billion of liabilities and lack the financial muscle to pay most of those burdens off, even after it has made the capacity cuts that could restore a balance between supply and demand in the theoretical 2020 case.
Based on industry history, we think it is likely that many US coal companies will continue in business-as-usual mode, pinning their hopes on a rebound in the domestic and export market. Each company will try to keep operations going, bumping along the bottom for as long as possible. Equity holders have already been more or less wiped out by the fall in coal-industry stock prices. For bondholders, however, continuing even minimally profitable operations is a better bet than shuttering mines and risking being wiped out in a bankruptcy settlement. But the volume of continuing operations at the zombie mines would slow any downsizing in the industry on the scale necessary to match future
demand, effectively putting a cap on any industry-wide recovery.
It is also possible that other ailing mining companies could follow their competitors into Chapter 11. Such a development may make it possible to close unprofitable mines, restructure their debt (especially nonsecured debt), sell or shut noncompetitive assets, and start to restore their businesses to a firmer financial footing. In addition, some companies may wind up liquidated and their creditors wiped out, creating the opportunity for players that provide new capital to earn profits by buying up the mine properties that are cash positive and would then be unencumbered by previous obligations. But these initiatives might have only limited impact on the overall financial health of the industry, given that there could continue to be many miners sticking to the business-as-usual path.
Facing this dire future, coal-mining companies may be forced to break out of their normal way of doing business and seek allies among a more broadly defined group of stakeholders, including unions, employees, communities, competitors, service suppliers such as railroads, capital providers and bondholders, and legislators and government bodies.
Possible lines of reflection might include taking a more coordinated approach inside and outside the industry to make an orderly rationalization possible. Were a coordinated restructuring approach to be possible, it might have a number of consequences. First, it might provide the coal industry with a somewhat speedier opportunity to return to profitability and implement solutions to resolve the uncovered $45 billion liabilities overhang. Second, such a course of action could also reduce uncertainty over the industry’s future, which would benefit the interests of the broader group of stakeholders such as employees and retirees, in addition to mining companies and their debt holders.

13 Downsizing the US coal industry: Can a slow-motion train wreck be avoided?
This path clearly would require significant dialogue at both the state and federal levels to assess potential support from relevant policy makers. Mining companies should be careful to consult with legal counsel to make sure this is done in a manner consistent with antitrust and other laws. The industry would also need to think carefully about how feasible this approach might be given political challenges—and recognize that such collective action requires a level of coordination that is exceedingly difficult to achieve once an industry is in such deep trouble. Based on our conversations with coal-company executives, it could also require a major mind-set change in the industry: many mining companies are at present inwardly focused as they work on surviving the current challenges, and if this inward focus does not change, it might slow down the process of working with partners inside and outside the sector to resolve the issues.
The US coal industry, the communities in which it operates, and its broad array of stakeholders face large and complex challenges. But the coal industry’s difficulties should not obscure the fact that maintaining a reliable supply of electricity to the US power system into the next decade is projected to still require some 665 million tons a year of domestic thermal coal. Some in the coal industry are already starting to consider the need for radical solutions, while others remain in denial. We hope that by showing the scale of the overcapacity and the liabilities challenge, we are providing a fact-based context for industry and stakeholder discussion.
Stefan Rehbach is a consultant in the Düsseldorf office, and Robert Samek is a director in the Toronto office and leader of the Americas Metals & Mining Practice.

Metals & Mining PracticeNovember 2015Copyright © McKinsey & Company
www.mckinsey.com