FACTORS ASSOCIATED WITH MILK FAT
SECRETION OF COWS IN RESPONSE
TO CONTRASTING AVAILABLE ENERGY
CONSUMPTION
by
Demetrio Zanartu
Dissertation submitted to the Graduate Faculty of the
Virginia Polytechnic Institute and State University
in partial fulfillment of the requirements for the degree of
DOCTOR OF PHILOSOPHY
in
Animal Sciences
APPROVED
ääi QEC.E. Pola , Chairman
. . Blaser 3 K. E. Webb Ä?
ßg' °ZZZ.f.VV?°ßJ«lL¤“6uy/
G. M. Jone M. L. McGi1liard
‘
«‘J.M. White
June, 1979
Blacksburg, Virginia
ACKNOWLEDGEMENTS
The author wishes to express his sincere appreciation to the
following persons.
Dr. C. E. Polan for his continued assistance and counsel through
the graduate program. His suggestions in the preparation of this
manuscript are greatly appreciated.
Dr. R. E. Blaser, Dr. K. E. Webb, Dr. M. L. McGilliard, Dr. G. M.
Jones, and Dr. J. M. White for their suggestions in the preparation of
this manuscript and advice and service as m=«bers of the graduate
committee.
Mr. C. N. Miller and his staff at the Dairy Research Center for
his help during the development of these studies. _
Dr. G. W. Niehaus for his help during the third experiment.
ii
TABLE OF CONTENTS
Page
Acknowledgements ............... , . ....... ii
Table of Contents ....................... iii
List of Tables ......... . ............... v
List of Figures ................ . . . , .... vi
Introduction ...........„...„.......... 1
Review of Literature ...... „ . . . ............ 4
Energy metabolism in the lactating cow .......... 4Glucose utilization in fatty acid synthesis . ....... 6Role of B-hydroxybutyric acid in fatty acid synthesis „ „ . 7Source of reducing equivalents for fatty acid synthesis . . 7Fatty acid synthesis ............... . . . . 10Enzyme control of lipid metabolism . ..... . . . „ „ . 13Diet composition and physical form on lipid metabolism . . 14Digesta flow rate and volatile fatty acids .... . . . . 16Ration characteristics and efficiency of energy utilization 16
Experiment I
Objectives................... . ..... 19Materials and Methods ............. . .... . 19Results .......................... 23Discussion .................... , . . . 25
Experiment II
Objectives .................... . . . . 27Materials and Methods ............ . . . . . „ „ 27
I I I I I Q I I I I I I I Q I I I I I I I Q I I I
IDiscussion........................ 47
Experiment III
Objectives ........................ 54Materials and Methods ......... . . . „ „
-„ . „ . 54
Results ........ . ........ . ........ 56Discussion .... . . . . . ........... . . . . 59
General Discussion ...........,........... 62
Sumary ...................... . ..... 70
iii

iv
EssConclusions........,................. 74
References...................... . . . . 75
Appendix..................„..... . . . 82
Vita................ . ....... „ „ „ . . 90
LIST OF TABLES
Table Page
l. Analysis of variance for milk fat percentage forExperiment I .............. . . . . . . .... 2l
2. Least square means for intake, body weight, milkand fat production ....... . . . . . . . . . . .... 22
3. Least square means for serum glucose and rumen VFA . . . . . 24
4. Analysis of variance for milk fat percentage inExperiment II ....... . ......... . ..... 30
5. Least square means for body weight, intake, milk andfat production . . ....... . . . . . . . . . . . . „ . 32
6. Least square means for buffer capacity, pH, and ruminalvolatile fatty acids .......... . . . . . ..... 43
7. Least square means for serum glucose, serum volatilefatty acids beta-hydroxybutyrate·and lipoproteins . . . . . 46
8. Analysis of variance for fatty acid synthetase activityin Experiment III ..................... 57
9. Least square means for activity of different enzymes,tissue protein and milk production . . ...... . .... 58
v
LIST OF FIGURES
Figure Page
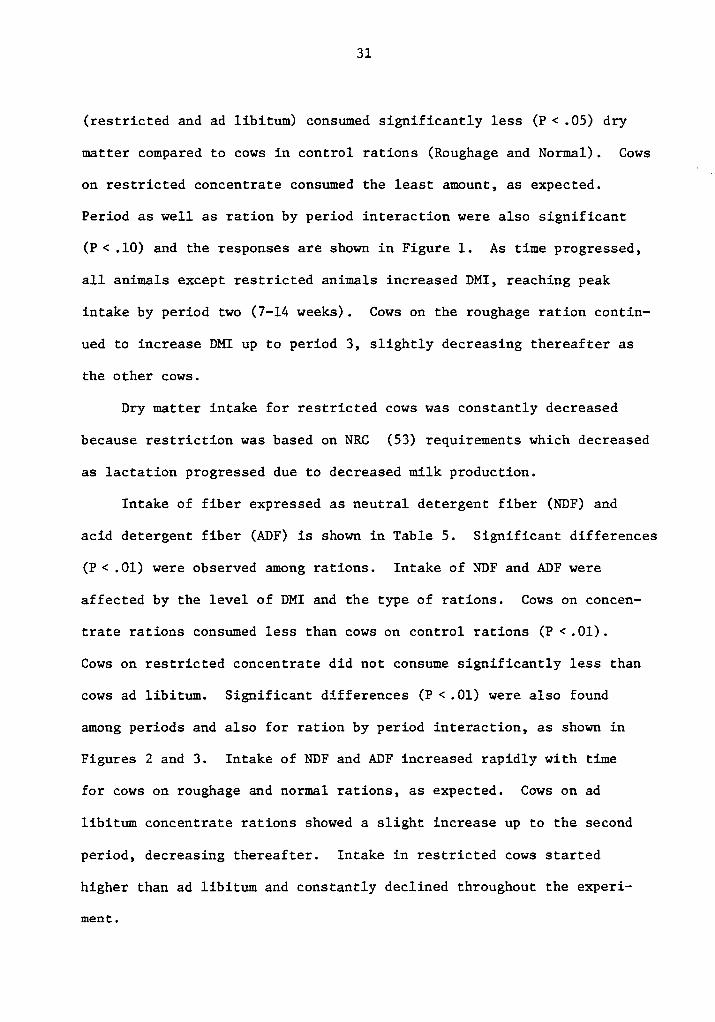
l. Changes in dry matter intake with time for Experiment II . 33
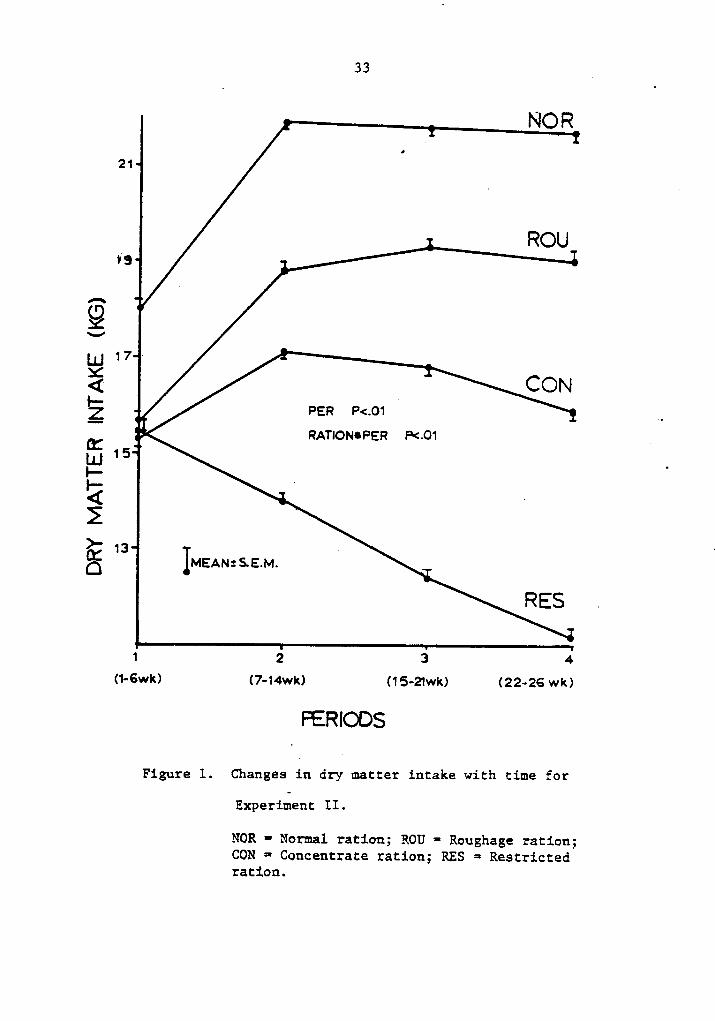
2. Changes in neutral detergent fiber (NDF) intake withtime for Experiment II . . . . . . ...... . . . . . . 34
3. Changes in acid detergent fiber (ADF) intake withtime for Experiment II . . . ...... . .... . . . . 35
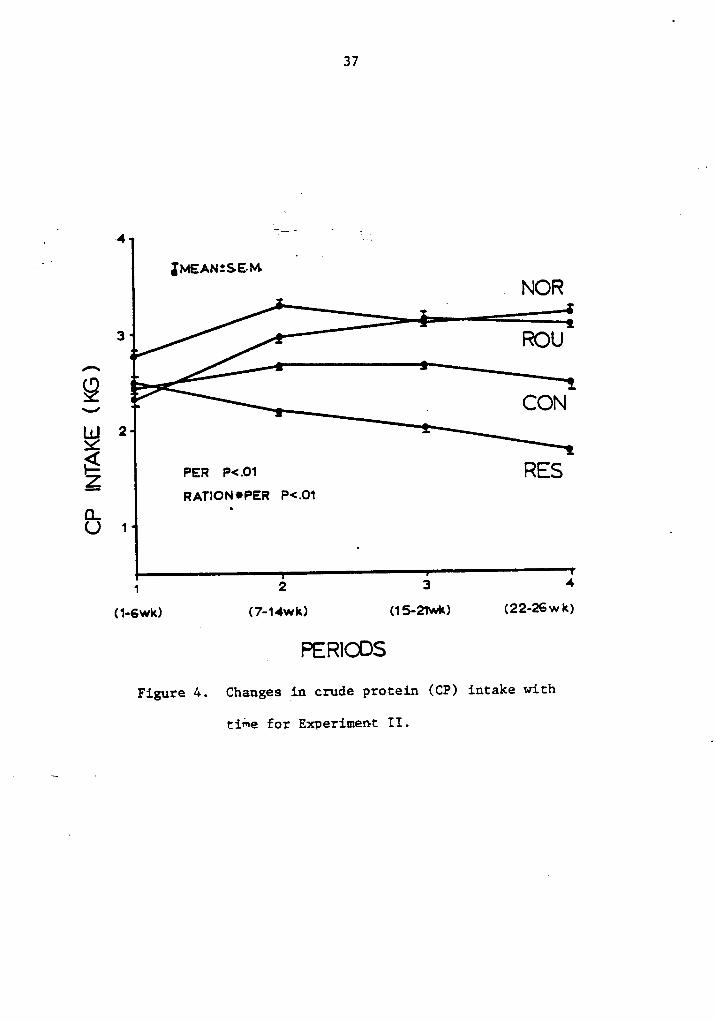
4. Changes in crude protein (CP) intake with time forExperiment II .......... . . . . . .„... . . 37
5. Changes in body weight with time for Experiment II .... 38
6. Changes in milk protein percentage with time forExperiment II ......... . . . . . . . . . . . . . 40
7. Weekly changes in milk fat percentage for Experiment II . 4l
8. Changes in molar proportion propionate with time forExperiment II . . . „ ..... . . . . . . . . ..... 44
9. Changes in serum glucose with time for Experiment II „ . . 52
10. Schematic representation of NADPH generation for fattyacid synthesis in ruminants ............. . . 65
vi

_ INTRODUCTION
Lipid metabolism with dairy cows has been studied for a number of
years, but still there are no clear answers regarding the metabolic
alterations involved in the dramatic decline in milk fat production and
increase in body weight gaius when energy deusity is increased or physi-
cal form of the ration altered.
The importance of keeping a normal fat content is well known. Low
fat indicates a poor efficiency of energy utilization for milk produc-
tion, resulting in more deposition of energy into the adipose tissue
than the milk.
Where fluid milk is being priced on milk solids criteria, it is
still important to keep a normal fat test from an economical and
metabolical standpoint.
A number of theories have been proposed to explain alterations
in lipid metabolism. An acetic acid shortage may be caused by the
replacement of cell wall digesting bacteria by bacteria that digest
cellular content producing relatively more propionic acid than acetic
acid. It is known that approximately 40% by weight of fatty acids
associated with ruminant milk fat are synthesized in the mammary
gland. Also, ruminants utilize acetic and butyric acid as primers
in fatty acid synthesis. The importance of this concept has been
curtailed by studies showing that exogenous acetic acid contribution
showed no important drop during low milk fat production (49).
It has been suggested that antiketogenic properties of propionic
acid reduce ketone bodies in peripheral blood, thereby reducing the
l
2
primers in fatty acid synthesis. Even though this may occur to a
small degree, it can be ignored.
Hormonal shifts that occur due to changes in aounts of glucogenic
compounds and glucose have been proposed to explain alterations in lipid
metabolism. Insulin, as well as growth hormone, thyroxine and epine-
phrine, may be involved in the regulation of the balance between lipo-
lysis and lipogenesis. Even though this seems to be an explanation,
contradictory results have been obtained when testing this theory. The
discrepancy may be explained because concepts of mono—gastric hormonal
control of lipid metabolism were applied to ruminants.
Our laboratory pursued the concept that the energy status of the
animal was involved in milk fat depression as proposed by Jenny, et al.
(4l)» In this research, cows in early (A5 days) lactation were
E compared with cows in mid lactation (150 days) for responses to milk
fat depression,vrher1 fed high concentrate diets ad libitum. Milk fat
depression was lower for cows in early lactation than for those in mid
lactation.
However, the changes in lipid metabolism are not explained ade-
quately by any of the theories; therefore, it appeared desirable to
investigate the association of other metabolic alterations with lipid
metabolism wlygu feeding milk fat depressing rations. Furthermore,
conducting the research at a specific physiological stage would control
some of the variables that affect lipid metabolism and improve the
validity of the data.
The overall objectives of this research were:

3
l. To further understand the regulation of lipid metabolism, specifi-
cally milk fat production, as influenced by the concentrations and
ratios of rumen fermentation products, blood metabolic parametersV
and—ration characteristics.
2. To investigate the role of total fermentable energy on milk fat
depression.
3. To monitor the effect and interaction of the variables during
different stages of lactation.
4. To measure changes in different enzymes involved in fatty acid
synthesis vvhen rations with varying amounts of fermentable energy
are fed to dairy cows.
LITERATURE REVIEW
Energy metabolism in the lactating cow
Mammary tissue is one of the most active tissues in the body with
regard to lipid synthesis. The principal source of carbon for fatty
acid synthesis in nonruminants is glucose. Studies conducted by
Folley and French (26, 27) demonstrated marked differences between
ruminant and nonruminant mamary tissue with regard to the kind of
substrates used for de novo fatty acid synthesis. This was also found
to be true for adipose tissue of ruminants compared with liver tissue
of nonruminants (8). The inability of ruminants to use glucose as a
source of carbon has been demonstrated in liver and adipose tissue
slices (31) and perfused mammary gland (32). Cow and sheep liver
showed negligible activity for the enzymes ATP citrate lyase (EC. 4.1.
3.8) and NADP malate dehydrogenase (EC. 1.1.1.40), which explains
ruminants inability to utilize glucose.
Hardwick (32) explained that glucose is not an important source
of carbon for fatty acid synthesis due to a compartmentation of
acetyl CoA based on its low diffusion thrcugh the mitochondrial
membrane. Pyruvate is oxidized to acetyl CoA only inside the mitochon-
drion and this must be changed into a more diffusible compound in order
to exit. Citrate, on the other hand, formed from acetyl CoA is found
in considerable quantities in milk, meaning it can leave the mito-
chondria easily.
Acetate found in the cytosol can be utilized for fatty acid
synthesis. It is converted to acetyl CoA via acetyl CoA syuthetase
4

l5
(8, 51). This enzyme, widely distributed in animal tissues, catalyzes
the initial reaction in acetate metabolism. The use of acetate as a
major substrate for fatty acid synthesis is, according to Ballard et
al. (8) a useful adaptation of carbon metabolism in the adult ruminant.
The fetal ruminant has the capacity to utilize glucose carbon for
lipogenesis, but this ends after birth with the acquisition of the
rumen microflora. Bickerstaffe et al. (20) using isotope dilution
techniques, estimated that in lactating dairy cows the percentage of
fatty acids derived from acetate were C10: 36-87%; C12: 34-57%;
C14: 25-57%; C16: 8-35% and no activity in C18 or longer.Even though ruminants have developed the capacity to utilize
fibrous feedstuffs and their fermentation end products, when cows are
fed different concentrate to grain ratios, the capacity to
utilize this product is altered. Annison et al. (2) found that when
cows were changed from high roughage to low roughage diets, blood
acetate decreased from 7.8 to 4.5 mg/dl; also, the acetate entry rate
fell from 3230 to 1630 mg/minutes and the contribution of acetate to
total CO2 from 33 to 24 mg/minutes, and mammary uptake of acetate from
280 to 220 mg/minutes. Based on changes in specific activity of acetate
measured across the mammary gland, Annison et al. (2) deonstrated
substantial reduction on endogenous acetate production. This is in
agreement with former observations by Annison and White (1) and
Bergman and Wolf (16).

_
6
Glucose utilization in fatty acid synthesis
Even though in ruminants glucose is not the main source of carbon
for fatty acid synthesis, glucose incorporation into fatty acids and
activities of relevant enzymes can be increased substantially by infus-
ing glucose post—ruminal1y or intravenously (14). The infusion of
glucose into lambs dramatically increased glucose utilization for lipo-
genesis relative to acetate with forty four and nine fold increase in
activity of ATP citrate lyase and NADP malate dehydrogenase.
Glucose plays an essential role in cell metabolism and caloric
needs of the body cannot be satisfied by fatty acids alone. According
to Bergman (17) adequate blood glucose and tissue glycogen must be
maintained for this purpose. The role of glucose in fat synthesis is
in the formation of a-glycerol-phosphate which is the specific precursor
of glycerol. A second role is furnishing NADPH which is formed via
the pentose pathway, required as a reducing agent in fatty acid syn-
thesis. A third role, although not as essential, is as carbon substrate
for fatty acid synthesis.
Work done by Smith and Glascock (67) showed that appreciable
amounts of glucose were oxidized by sheep udder tissue, especially
when.acetate was present. Glucose oxidation rate via the tricarboxy—
lic acid (TCA) cycle was equal to or greater than that found in lactat-
ing rat mamary slices. They further observed that addition of
acetate resulted in increased participation of the pentose phosphate
pathway in glucose catabolism. This also increased the activity of
the TCA cycle. Although sheep udder tissue incorporates acetate into
7
fatty acids when it is the only substrate, there was a considerable
increase in acetate incorporation when glucose was added to the
medium (9).
Role of B—Hydroxybutyric acid (BHBA) in fatty acid synthesis
Results of in vivo experiments by Popjak et al. (S9, 60) in
lactating goats and cows, established that acetate and BHBA contributed
equally to the initial four carbons of fatty acids synthesized in
mammary gland. Studies done by Kinsella et al. (43) have shown that
bovine fatty acid synthetase (FAS) complex has a marked preference for
butyryl CoA compared to acetyl CoA. Although the concentration of
butyryl CoA is much lower than acetyl CoA in lactating bovine mammary
tissue, Kinsella pointed out that the apparent Km of the FAS is lower
for butyryl CoA. Acetate is nevertheless the major source of the re-
maining carbons in the fatty acid chain (13, 43). While BHBA can be
incorporated into fatty acids as the initial four carbon primer unit,
any subsequent carbon incorporation depends on metabolism to acetyl
CoA by the enzyme B—hydroxybutyrate dehydrogenase (BHBDH). Cellular
distribution of BHBDH is not equal (10). The enzyme is located almost
exclusively in mitochondria, thus BHBA cannot furnish significant
quantities of carbon for fatty acid synthesis beyond the initial four
carbon unit because of the absence of citrate cleavage pathway (13).
Source of reducing equivalents for fatty acids synthesis
Lipogenesis or fatty acid synthesis require large amounts of
reducing equivalents as NADPH during fatty acid elongation. Glucose,

8
the normal source of carbon for lipogenesis in nonruminant tissues,
also provides the reducing equivalents, NADPH, by oxidation through
the hexose monophosphate pathway and by decarboxylation of malate via
citrate cleavage pathway (8).
In ruminants, under normal conditions enough glucose may be
metabolized via the hexose monophosphate pathway to supply adequate
amounts of NADPH. This is supported by the high activities of glucose·
6-phosphate dehydrogenase (G6PDH) (EC 1.1.1.49) and 6-phosphogluconate
dehydrogenase (6PGDH) (EC 1.1.1.44) found in adipose tissue and liver
from cows and sheep (31).
The source of reducing equivalents for fatty acid synthesis in
ruminant adipose tissue (14) and mammary gland (ll) differs from non-
ruminants. In ruminants, NADPH is generated in the pentose cycle (via
G6PDH and 6PGDH) and the isocitrate cycle (via NADP-isocitrate dehydro—
genase (ISOCDH) (EC 1.1.1.42). The activity of cytosolic NADP—ISOCDH
has been found to be extremely high in ruminant adipose tissue as com-
pared to nonruinants (14), probably because of its involvement in
acetate utilization for NADPH production. Similar species differences
may occur in mammary tissue.
Baldwin et al. ( 7) and Yang and Baldwin (79) indicated that the
isocitrate cycle furnished a minimum of one fourth of the NADPH neces
sary to support lipogenesis with the remainder arising from the pentose
shunt. Malate transhydrogenation cycle, an important source of NADPH
in rat adipose tissue, plays according to Baldwin and co—workers, a
very minor role in ruminants because of the low activity of NADP malate
dehydrogenase and extremely limited carbon flux through this pathway.
9
Bauman et al. (10) were the first to propose involvement of NADP-
isocitrate dehydrogenase in the generation of NADPH for fatty acid
synthesis in ruminants. The isocitrate cycle also involves a transhy-l
drogenation system in the mitochondria, employing glutamate dehydrogen—
ase (13). According to these authors, this allows for a recycling of
¤—ketoglutarate to citrate in the mitochondria. The extent of transhy-
drogenation would be controlled by NAD+7NADH ratio in mitochondria.
Bauman et al. (ll) postulated that the pentose phosphate cycle and ·
isocitrate cycle contributed approximately equal amounts of NADPH in
cow and sheep mammary gland tissue. The relative importance of differ-
ent pathways involved in generation of NADPH could depend on available
carbon sources, and the energy (ATP) requirements of the cells (ll).
Flatt (25) pointed out that in the process of metabolite incorporation
into fatty acids there is a net ATP yield which varies according to
the pathway employed to generate NADPH. Bauman and Davis (13) suggest-
ed that in ruminant mamary gland an ATP deficit occurs rather than
a net ATP yield. This is because glucose oxidation occurs primarily
in the pentose phosphate cycle, with the triose phosphate formed under-
going extensive recycling. On the other hand, they argue, that utiliza—
tion of acetate to generate ATP via isocitrate cycle, is an ATP yield-
ing process. With a functional mitochondrial transhydrogenation scheme,
Bauman and Davis (13) calculated the isocitrate cycle yields a net of
three moles of ATP per mole of acetate incorporated into fatty acids.
With the mitochondrial transhydrogenation scheme nonfunctional, carbon
returns to the mitochondria as ¤—ketoglutarate and is cycled in the
normal fashion to OAA. ln this case, the isocitrate cycle yields a
10
net of 14 moles of ATP in the process of producing two moles of NADPH
needed for a mole of acetate incorporation into fatty acids. Therefore,
even though the isocitrate cycle involves acetate instead of glucose in
the production of NADPH, its contribution towards generation of NADPH
is controlled by the ATP levels in the mammary cell. After ATP require-
ments have been met, additional reducing equivalents must arise from
the pentose phosphate cycle.
Baldwin et al. (7) proposed that in order to sustain higher rates
of fatty acid synthesis in adipose tissue of a lactating cow, basal
metabolism and simultaneously TCA cycle flux would have to increase to
enable additional NADPH formation via isocitrate pathway. Alternative-
ly, to make this possible they stated, glucose availability and pentose
cycle flux would have to increase. These concepts help to explain the
tendency to increase adipose fat deposition during high energy feeding.
At the mammary gland level, where a great amount of glucose is being
oxidized and utilized for lactose synthesis, an excessive carbon flux
through the TCA cycle could stop the transhydrogenation being carried
on via glutamate dehydrogenase. As a result, excessive production of
ATP would occur which will finally stop the isocitrate cycle as a
source of NADPH, and replace it by the pentose shunt.
Fatty acid szgthesis
Observations by Baldwin et al. (7); Opstvedt and Ronning (54);
and Yang and Baldwin (79) support the theory that TCA cycle flux as
determined, by basal metabolic rate and/or glucose availability,
ll
limits the rate of ruminant adipose and mammary lipogenesis. Fatty acid ·
synthesis from acetate in vitro by ruminant adipocites is highly depen-
dent on glucose availability (4, 79). As previously mentioned, when
acetate and glucose were added to sheep mammary tissue culture, glucose
oxidation rate via TCA cycle was equal to or greater than that found in
lactating rat mammary slices (67). The addition of acetate resulted
also in increased participation of the pentose phosphate pathway in
glucose metabolism. The authors suggested that probably the factor
responsible for this effect is the close relationship that exists in
mamary tissue between the pentose phosphate pathway and the systems for
the synthesis of fatty acids, these being dependent on the supply of
NADPH.
Work by Bickerstaffe (18) has shown that acetate, BHBA and plasma
free and esterified fatty acids are the main precursors of milk fatty
acids in several species. Isotopic data (20) confirmed that acetate,
stearate and palmitate are very important precursors of fat in the cow.
They found significant arteriovenous differences for acetate, propion-
ate, BHBA, triglycerides but not for free fatty acids or cholesterol
esters. They also reported that in contrast to goats, cows had a signi-
ficant mammary uptake of triglycerides from low density lipoprotein
(LDL).
Work with goats (78) showed that hydrolysis in the capillaries was
a prerequisite for triglyceride uptake by the mamary gland. They also
found that the mechanism by which plasma triglycerides are taken up
and incorporated into milk fat involves hydrolysis and re-esterifica—
tion within mammary tissue. There was also evidence that lipoprotein
~ 12
lipase (LPL) was involved in the hydrolysis of triglyceride before
uptake.
Ration characteristics seems to alter the pattern of uptake of
milk fat constituents. When cows were fed low roughage diets, reduced
uptake of plasma triglycerides by the udder were observed by Annison
and coworkers (2) even though the circulating levels were not reduced.
Similar results were obtained by West and Passey (77) for glucose and
palmitate when glucose was infused into the peripheral circulation
of sheep. Annison and coworkers (2) suggested that the reduced uptake
observed in cows secreting low milk fat could be due to impaired lipo-
protein lipase activity due to changes in fatty acid composition of
plasma triglycerides.
Annison et al. (2) also found a reduction of biohydrogenation in
milk fat depressed animals. Nevertheless, it seems unlikely that unsat-
uration would be responsible for the reduced susceptibility of trigly-
ceride to lipase action based on the successful results obtained by
Bickerstaffe and Annison (19) in treating milk fat depressed goats with
duodenal infusions of sunflower oil, which is rich in linoleic acid.
ln a more recent study, Storry et al. (69) found that in the low
milk fat syndrome, the capacity of the mammary gland to absorb preformed
fatty acid was not impaired. They also found a decrease in all milk
fatty acids except linoleic (Cl8:2) when cows were changed from high
roughage diet to low roughage diets. To account for the reduced incorp—·
oration, they proposed an increased uptake of long chain fatty acids by
adipose tissue at the expense of mammary tissue, in agreement with West
13
and Passey (77). McClymont and Vallance (50) suggested that an increas-
ed influx of glucose into the circulation might influence milk fat
synthesis by shifting the balance of fatty acid release and esterifica—
tion. According to West and Passey (77), the infusion of insulin either
into peripheral or portal circulation increased the uptake of glucose
and decreased the uptake of palmitate by the tissue of sheep. Apparently,
the effect of insulin on the metabolism of free fatty acids is mediated
through its effect on glucose metabolism. Glucose and insulin seem to
suppress fatty acid release by accelerating esterification without
altering the rate of lipolysis. The net result is a decrease in the
release of free fatty acids into the plasma, producing a caloric shift
from fatty acids to glucose. They also observed that when plasma
glucose fell below 40 mg/dl, the effect of insulin on fatty acid
release was overcome and reversed, probably by a sympathoadrenal
response to hypoglycemia. Insulin infusions in goats (64) increased
C12-C18 fatty acids in milk fat, probably due to a release of adrenaline
which promoted mobilization of fat in response to a decrease in peripher-
al blood glucose.
Enzyme control of lipid metabolism
A number of enzymes are involved in the synthesis of fatty acids,
both at the mammary and adipose tissue levels.
Although the controlling factors of lipogenesis in ruminant^
animals are not fully understood, results by Bauman (12)
indicate that within the cell the regulation is modulated via acetyl
CoA carboxylase. Mellenberger et al. (48) showed that in mammary
14
gland of a multiparous post—partum cow, activity of the cytosolic
enzyme acetyl CoA synthetase and acetyl CoA carboxylase closely V
paralleled changes in lipogenic capacity of mammary tissue slices. They
suggested that acetyl CoA carboxylase and perhaps acetyl CoA synthetase
represented important regulatory enzymes in fatty acid synthesis.
Bauman (14) confirmed similar results for ruminant adipose tissue and
mammary tissue. Acetyl CoA carboxylase was the only enzyme whose
activity closely paralleled the changes in the rate of fatty acid
synthesis. Acetyl CoA synthetase sharply increased after parturition in
primiparous and multiparous cows, goats, and rats, followed by a
gradual decrease in enzyme activity as lactation progressed (51).
According to Bauman and Davis (13), changes in acetyl CoA carboxyl-
ase activity in ruminant mamary and adipose tissue noted during fasting
and refeeding, were due to alterations in the synthesis and/or degrada-
tion rates of the enzyme. Support for acetyl CoA carboxylase serving as
the rate limiting enzyme in fatty acid synthesis is the fact that it
exists in an active and inactive form (13). Similar to nonruminants,
acetyl CoA carboxylase purified from bovine adipose tissue oscillates
between a catalytically inactive protomeric state and a catalytically
active polymeric state (45).
Diet composition and physical form on lipid metabolism
Diets in which the roughage is ground or diets with low proportion
of roughage and high proportions of concentrate can cause a dramatic
fall in the content and yield of fat in milk and significant changes in
15
its fatty acid composition. Van Soest and Allen (71) stated that the
degree of milk fat depression is related to the concentration of rumen
propionic acid. They also found a decrease in arterial acetate, and4
decreased utilization by mamary and peripheral tissues. When isocaloric
low roughage and high roughage diets were fed to cows in mid lactation,
milk yield was unaffected (23), but a decrease in milk fat percentage
was observed in low roughage cows.
Jorgensen and Schultz (39) showed a greater effect of pelleted over
conventional rations for developing milk fat depression. They observed
a significant decrease in glucose and increase in ketone bodies on
pelleted corn rations. They found that type and physical form of the
concentrate were more important than the ratio of concentrate to forage.
When pelleted corn, pelleted oats and pelleted corn plus thyroprotein
were fed to cows in early lactation, a significant decrease in milk fat
was observed in pelleted corn. When pelleted corn rations were switched
back to normal rations, higher test and lower body gains were obtained.
A better response in terms of milk fat secretion was observed when
pelleted oats (higher fiber) and pelleted corn plus thyroprotein
(catabolic effect) were fed. Addition of soybean oil meal, mechanically
extracted, or lard to the pelleted corn did not increase fat secretion
(40).
Kinsella et al. (43) confirmed that cows in restricted roughage
diets produced less fat throughout lactation. They found a rapid in-
crease in short and medium chain fatty acids after parturition, but
decreased palmitic and stearic acid, probably due to preferential
utilization by adipose tissue.

164
Jenny et al. (41) observed a significant increase in a—glycerol
phosphate dehydrogenase and LPL of adipose tissue during milk fat
depression. They also noted little or no change of these enzymes in
mammary gland. No difference was observed between stages of lactation,
however, midlactation cows showed a greater change in ruminal VFA, blood
glucose and insulin. They attributed the lack of responsivencss of
serum insulin and glucose to the metabolic demands for high milk produc-
tion.
Digesta flow rate and volatile fatty acids
Variation in flow is sometimes correlated with the composition of
the mixture of acids in the rumen. Isaacson et al. (38) working with
different dilution rates and volatile fatty acid ratios on continuous
culture studies observed that dilution rates did not affect total VFA or
acetate production, but as the dilution rate increased, propionate
tended to increase and butyrate to decrease. Similar results were
obtained with sheep by Hodgson and Thomas (33, 34). At 33, 42, 55, and
67 g of dry matter/kg metabolic weight/day respectively, a gradual
increase in the molar percentage of propionic acid was observed. When
steers were fed a diet of cubed barley at 80% of ad libitum, the pro-
portion of propionic acid in the rumen was low and there was a large
population of protozoa (70). When ad libitum feeding was reestablished,
the number of protozoa decreased and propionic concentration was higher.
Ration characteristics and efficiency of energy utilization
Calorimetric experiments involving intraruminal infusions of fatty
17
acids indicated that changes in the mixture of fermentation end products
have a pronounced effect on the distribution of energy between the udder
and the adipose tissue, but very little on the efficiency of utilization
of energy for milk secretion (4, 55). Similar results were obtained
varying the diet composition (24) although in some experiments there
are indications that the utilization of metabolizable energy for milk
secretion may be low for rations consisting solely or mostly of forage
(22).
Armstrong et al. (3) showed that for maintenance needs of ruminants,
mixtures of different molar proportions of volatile fatty acids were
utilized with equal efficiency. Inefficient utilization was only ob-
served when acetic acid was infused alone. The authors explained that
being non-glucogenic, acetic acid is dependent on a supply of glucogenic
materials to yield OAA for efficient oxidation. Orskov (57) proposed
to better understand efficiency of energy utilization, the concept of
an optimum proportion of non—glucogenic to glucogenic energy. He
reported that dairy cows differed from growing animals in being able to
tolerate a higher NGR (non—glucogenic ratio) before efficiency was
depressed. He suggested that the inefficient utilization of energy at
high NGR values was due to lack of OAA derived from C3 carbon, and
shortage of NADPH for fatty acid synthesis (coming from pentose phos—
phate cycle). At the adipose tissue level, an excess of ATP will be
produced resulting in increased heat production. Nevertheless, Hovell
et al. (35) suggested that this excess ATP may be required, and thus
efficiently utilized wh«en acetate oxidation occurred in the mammary
gland. On the other hand, with a high proportion of propionic acid at
l8
low NGR values, there is evidence from sheep and goats that the capacity
of the liver is exceeded (56).
In order to retain an efficient utilization of energy in dairy
cows, Orskov (57) suggested that NGR values should be below four. If
NGR values are much below three, the partition of energy will begin to
suffer insofar as milk fat percentage will be reduced and body fat
synthesis increased. Results obtained by Latham et al. (46) and Storry
and Rook (68) in dairy cows agreed with the concept of NGR presented by
Orskov.

EXPERIMENT I
Objectives —
1. To determine the effect of restricted energy intake of high
concentrate rations on butterfat production.
2. To determine the effect of VFA alteration on lipid metabolism
in lactating cows.
3. To study possible interrelations of ration and metabolic
variables with milk fat depression.
Materials and methods
Twenty-one Holstein cows in mid-lactation were stratified accord-
ing to fat test and milk production, and assigned at random to each of:
(1) roughage ration (14% crude protein (CP), 22% crude fiber (CF))
restricted to NRC (53); (2) concentrate(1S.7% CP, 11.7% CF) restricted
Q
to NRC (53) requirements; (3) concentrate (15.7% CP, 11.7% CF) ad
libitum and fed for 30 days. Roughage ration consisted of corn silage,
chopped hay, and 36% CP pelleted concentrate in a ratio 70:10:20 on a
dry matter (DM) basis. Concentrate rations consisted of long hay, and
a 16.8% CP pelleted concentrate in a ratio 15:85 on a DM basis. Compo-
sition of the concentrate mixture is shown in Appendix Table 1.
Feed intake and milk production were recorded daily. Blood via
jugular puncture and rumen fluid samples via stomach tube were taken
about days 15 and 30, 2.5 to 3 hours post-afternoon feeding. Body
weight (BW) and 2-day composite milk samples were taken weekly. Milk
fat content was determined on a Foss Mi1ko—Tester. Ruminal VFA were
19
20
measured by gas liquid chromatography by a procedure similar to that of
Baumgardt (15). Blood glucose was determined by a Iiarleco kit.l
Covariate analysis was used to correct for preexperimental values
of all parameters measured. A regression model was used to statisti-
cally evaluate the influence of the experimental rations on the animafs
metabolism. Least square means and standard errors were obtained, and
orthogonal contrasts were designed.
The mathematical model used was:
Y(ij)k = u + b1(IV) + Ti + Pj + TPij + 5 (ij)kwhere
u = overall mean
B = regression of y on IV, where IV is initial value
for the variable being studied
Ti = effect of the ith Treatment i = 1, 2, 3 .
Pj = effect of the jth Period j = 1, 2, or 1, 2, 3, 4
depending on the variable
G<ij)k = random error
An example of the analysis of variance (ANOVA) breakdown is shown in
Table 1, also ANOVA tables for every parameter measured are shown in
Appendix Table 2.
1Harleco, Philadelphia, PA 19143.
21
Table 1. Analysis of variance for milk fat percentage for Experiment I.U
SOURCE Qi gg gg E PROBABILITY
Covariate 1 12.62 12.62 48.58 0.001
Treatment (T) 2 13.12 6.06 25.26 0.001
Period (P) 3 3.91 1.30 5.02 0.001
T x P 6 1.94 .32 1.25 NS
Error 70 18.18 .26
Total 82 74.49
R2 .76
22
Table 2. Least square means for intake, body weight, milk and
fat production.
RATIONS ORTHOGONAL————————————————-———————————-—————-——- CONTRASTS
lgßlm CONCEN— RESTRICTED(2) ROUGH- P <.O5EL---Eä§ TRATE(l) CONCENTRATE AGE(3) ———————————————
1 vs 2 1 + 2
- - - .i. xs.;X SE X SE X SE
Dry MatterIntake (kg) 17.7; .4 12.9j_.6 14.0j .6 * *
Body Weight(kg) 573.Qj5.2 546.0j5.6 564.0j4.8 *
Daily Milk(kg) 20.9j-_ .-4 18.8i .5 l8.5_-4; .4 * *
Milk Fat (Z) 2.5j_.2 3.3j_.l 3.6: .1 * *
Energy In- 1 2 36.4 26.5 · 21.3take (Mcal)
’
Dry MatterIntakekg/100 kgBody Weight 3.1 2.4 2.5
lCa1culated based on NRC (53).
2Concentrate: 2.05 Mcal/kg DM, Roughage: 1.52 Mcal/kg DM.
23
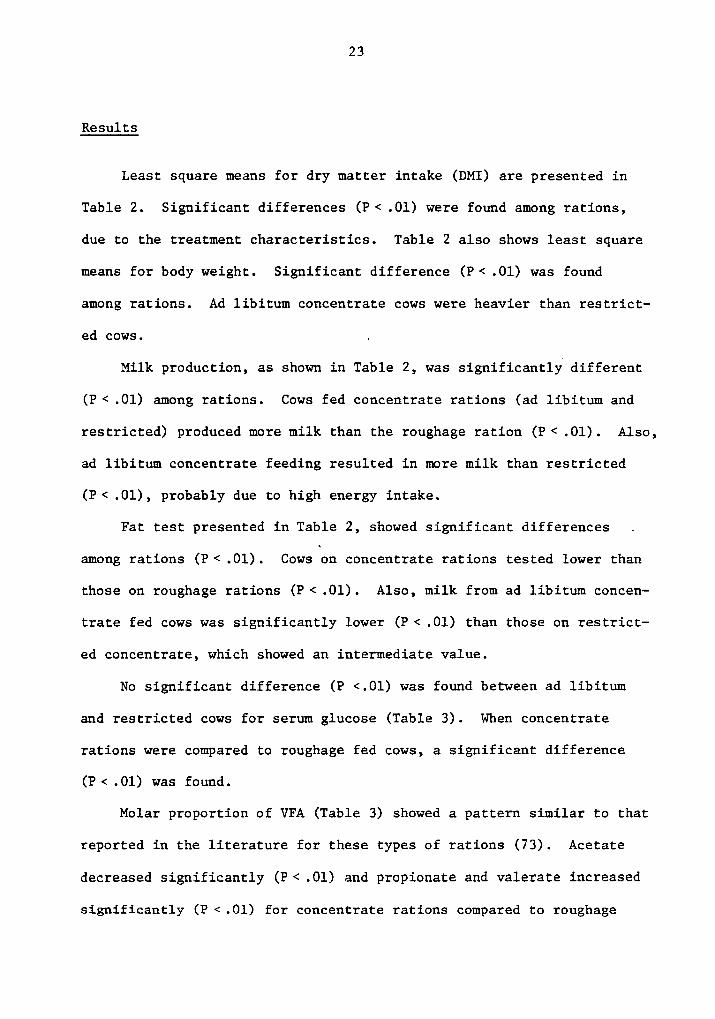
Results
Least square means for dry matter intake (DMI) are presented in
Table 2. Significant differences (P <.Ol) were found among rations,
due to the treatment characteristics. Table 2 also shows least square
means for body weight. Significant difference (P·<.Ol) was found
among rations. Ad libitum concentrate cows were heavier than restrict-
ed cows. .
Milk production, as shown in Table 2, was significantly different
(P <.Ol) among rations. Cows fed concentrate rations (ad libitum and
restricted) produced more milk than the roughage ration (P·<.0l). Also,
ad libitum concentrate feeding resulted in more milk than restricted
(P·<.Ol), probably due to high energy intake.
Fat test presented in Table 2, showed significant differences .
among rations (P·<.Ol), Cows on concentrate rations tested lower than
those on roughage rations (P·<.0l). Also, milk from ad libitum concen-
trate fed cows was significantly lower (P <.Ol) than those on restrict-
ed concentrate, which showed an intermediate value.
No significant difference (P <.Ol) was found between ad libitum
and restricted cows for serum glucose (Table 3). When concentrate
rations were compared to roughage fed cows, a significant difference
(P <.Ol) was found.
Molar proportion of VFA (Table 3) showed a pattern similar to that
reported in the literature for these types of rations (73). Acetate
decreased significantly (P <.Ol) and propionate and valerate increased
significantly (P <.Ol) for concentrate rations compared to roughage
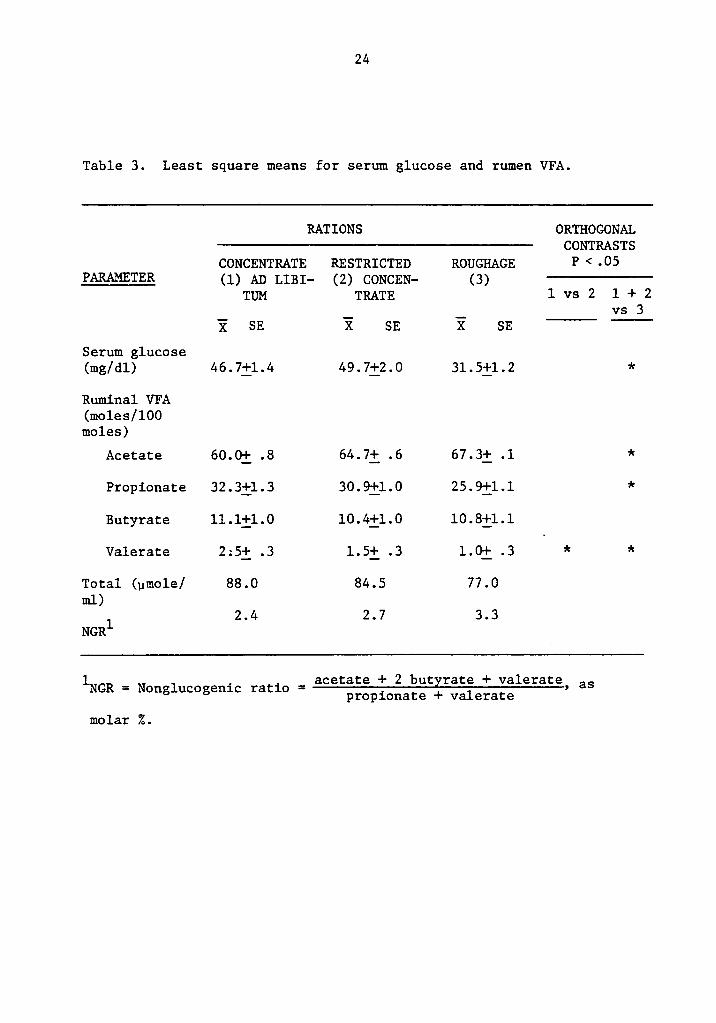
24
Table 3. Least square means for serum glucose and rumen VFA.
RATIONS ORTHOGONALCONTRASTS
CONCENTRATE RESTRICTED ROUGHAGE P < ·O5PARAMETER (1) AD um- (2) 601101211- (3) ——l-———
TUM TRATE 1 vs 2 l + 2_ _ vs 3
E SE X SE X SE
Serum glucose(mg/dl) 46.7j-_l.4 49.71-_2.0 31.5j-_l.2 *
Ruminal VFA(moles/100moles)
Acetate 60.0j-_ .8 64.7i .6 67.3i .1 *
Propionate 32.3_—|;l.3 30.9il.0 25.9j-_l.l *
Butyrate ll.li1.0 l0.4il.0 l0.8_-[1.1
Valerate 2:5i .3 1.5i .3 1.0j-_ .3 * *
Total (;1mole/ 88.0 84.5 77.0ml)
l 2.4 2.7 3.3NGR
1 _ ,=
acetate + 2 butvrate + valerateNGR - Nonglucogen1c ratio propicmate + valerate > as
molar Z.
25
ration, independent of the level of intake. When VFA concentration was
considered, cows on ad libitum concentrate showed higher values than
cows on the other rations.
NGR values, calculated from VFA values showed marked differences
among treatments (Table 3). Roughage and restricted concentrate rations
showed values that according to Orskov (57) will allow an efficient
utilization of energy. NGR values of ad libitum concentrate cows
suggested an inefficient utilization of energy for milk fat production
compared with fat deposition.
Discussion .
Cows on concentrate rations produced more milk agreeing with other
__ reports (23, 39). This is probably accounted for by higher total in-
take of energy and crude protein compared with restricted and roughage
rations. Even though DMI was lower for restricted fed cows compared
to those fed roughage, milk production was similar. The greater
caloric density of concentrate in the restricted ration allowed them
to produce as much milk as roughage cows.
Fat test was also affected by ration characteristics agreeing with
other reports (23, 39), but influenced also by the amount of ferment-
able energy consumed. Cows in restricted rations had more fat concen-
tration compared to ad libitum fed concentrate, presumably caused by
a decrease in the total amount of nonglucogenic VFA absorbed from the
rumen. Nevertheless, restricted cows had fat test still lower than
roughage cows, suggesting that metabolic alterations are not fully
26
solved by decreasing the total intake of fermentable energy.
Serum glucose, in contrast to some reports (20, 28, 41), did not
show differences among concentrate diets despite the differences
observed in fat test and milk production. Due to the increase ob-
served in total VFA concentration as well as NGR values for cows fed
ad libitum concentrate, one could suggest an increase in glucose
turnover rate to explain the similar values found for glucose among
treatments.
When NGR values are compared, cows on restricted concentrate seem
to utilize energy for milk fat production more efficiently than to cows
fed ad libitum concentrate.

EXPERIMENT II
Objectives · «·
1. To determine the effect of different energy intakes on milk fat
secretion, fermentation products and blood metabolic parameters
throughout the lactation cycle.
2. To determine interrelations between energy intake, chemical
properties of the ration, fermentation products and blood
metabolic parameters.
Materials and methods
Twenty—four Holstein cows were assigned to outcome groups of four
cows, each based on anticipated day of calving. They were randomly
allotted to each one of the four treatments to be specified.
Data on the different parameters mentioned in Experiment I was
collected in a similar fashion for a period of 180 days, except blood
was obtained from the tail via artery or vein. Extra blood was collect-
ed via jugular puncture at 35 and 150 days from every cow for 1ipopro—
tein analysis. Ruminal fluid, buffering capacity and pH were determin-
ed and recorded immediately after rumen sampling.
Neutral detergent fiber (NDF) and acid detergent fiber (ADF)
analysis were performed on feed samples according to Van Soest and
Wine (75), Van Soest (72, 74) and Robertson and Van Soest (61).
Four experimental rations were fed: (1) roughage (16.0% CP, 19.8%
CF) ad libitum, (2) concentrate (15.7% CP, 10.1% CF) ad libitum, (3)
concentrate (15.7% CP, 10.1% CF) restricted to NRC (53) recommendation
27

28
and (4) normal (14.7% CP, 13.8% CF) ad libitum.
Cows on high concentrate rations were kept on the roughage ration
for 21 days and changed gradually over a 12-day period to the experi-
mental concentrate ration.
The roughage ration consisted of corn silage, ground shelled corn,
chopped hay and 38% CP concentrate in a ratio 50:l5.8:15:l9.2 on a DM
basis. Concentrate rations consisted of long alfalfa hay and a 15.7%
CP concentrate, in an approximate ratio 13:87 on a dry matter basis.
Normal ration consisted of corn silage, 33% CP concentrate, ground
shelled corn and hay in a ratio 29.3:18.6:46.4:5.6 on a DM basis.
Concentrate ingredients are shown in Appendix Table 3.
Feed intake and milk production were recorded daily during the 180-
day period. One—day composite milk samples were taken once a week and
analyzed for fat in a Milko-Tester instrument. Milk protein was deter-
mined by the dye binding method in a Foss—Pro-Milk instrument. Milk
solids were determined by a gravimetric procedure based on an oven
drying method. Ruminal VFA were measured as in Experiment 1. Buffer-
ing capacity was measured by titrating 50 ml of filtered rumen fluid up
to pH 5.0 from pH 6 with 0.1 N HC1 and expressed as meq of acid per 50
ml of rumen fluid.
Serum glucose was determined as in Experiment I. Serum VFA were
determined by a procedure outlined by Supelco Inc.2 Serum ketone
2Chromatography Lipids, Vol. IX No. 2, 1975. Supelco, Inc.,
Bellefonte, PA 16823.

29
bodies were measured according to Williamson and Mellanby (75). Serum
lipoprotein were separated by an adaptation of the procedure used by
Rudel et al. (65) and quantitated according to Lowry et al. (47) by a
modification done by Schacterle and Pollack (66).
Data was arranged in four periods as follows: Period 1 = 1-6
weeks; Period 2 = 7-14 weeks; Period 3 = 15-21 weeks; Period 4 = 22-26
weeks.
A general linear model was used to statistically evaluate the in-
fluence of the experimental rations. Least square means and standard
errors were obtained. Orthogonal contrasts were set up.
The mathematical model used was:
Yijkm = u + Pi + Rj + PRij + Ck(j) + PCik(j) + em(ijk)
where
u = overall mean
th . .Pi = effect of the i Period 1 = 1, 2, 3, 4
Rj = effect of thejth Ration j = 1, 2, 3, 4
th . . ,th .Ck(j) = effect of the k cow within the j Ration
k = 1, 2, 3, 4, 5, 6
em(ijk) = random error
An example of ANOVA breakdown is presented in Table 4. Also ANOVA for
all parameters are shown in Appendix Tables 4, 5, and 6.
Results
Dry matter intake (DMI) values presented in Table 5 showed a
significant difference among rations. Cows on concentrate rations

30e
Table 4. Analysis of variauce for milk fat percentage in Experiment II.
SOURCE Q£_ §§_ §§_ §_ PROBABILITY
Ration (R) 3 50.08 16.69 6.87 0.002
Cow (Ration) 20 48.61 2.43 8.53 0.001
Period (P) 3 43.49 14.49 50.85 0.001
R x P 9 16.65 1.85 6.49 0.001
Error 535 152.52 .28
Total S70 318.73
R2 .52
31
(restricted and ad libitum) consumed significantly less (P <.O5) dry
matter compared to cows in control rations (Roughage and Normal). Cows
on restricted concentrate consumed the least amount, as expected.
A4)
Period as well as ration by period interaction were also significant
(P·<.l0) and the responses are shown in Figure l. As time progressed,
all animals except restricted animals increased DMI, reaching peak
intake by period two (7-14 weeks). Cows on the roughage ration contin-
ued to increase DMI up to period 3, slightly decreasing thereafter as
the other cows.
Dry matter intake for restricted cows was constantly decreased
because restriction was based on NRC (53) requirements which decreased
as lactation progressed due to decreased milk production.
Intake of fiber expressed as neutral detergent fiber (NDF) and
acid detergent fiber (ADF) is shown in Table 5. Significant differences
(P <.Ol) were observed among rations. Intake of NDF and ADF were
affected by the level of DMI and the type of rations. Cows on concen-
trate rations consumed less than cows on control rations (P <.0l).
Cows on restricted concentrate did not consume significantly less than
cows ad libitum. Significant differences (P <.Ol) were also found
among periods and also for ration by period interaction, as shown in
Figures 2 and 3. Intake of NDF and ADF increased rapidly with time
for cows on roughage and normal rations, as expected. Cows on ad
libitu concentrate rations showed a slight increase up to the second
period, decreasing thereafter. Intake in restricted cows started
higher than ad libitum and constantly declined throughout the experi-
ment .

32
Q
VJ[-4
ä"“ 4
[-4Z11f1 :*1OOU- ·k
NZOOO Q cn
• M +:11+ -1: -1: -1: -1: -1:G O PO 1-1 N
-1-4JJUG xx O O O Q 1!1 O 1!1 O Q O
"U Q MN N O O O N O 1-4 O :**1Q O ug 1 1 1 1 1 1 1 1 1 1
ä. Tl +I +I +I +l +I +I +I +I +IQ O tt! 0 1-4 1-4 Q 0 1.:1 1-11,1 1 1 1 1 1 1 1 1 1 1:11 l><Q O 1.:1 N M cx :*1 1-1 :11 rx
11-1 Q rx N N 1-1 NZ Ih
E-:¤ | O O 0 1-f1 1:1 O ID w :*1 0
QZ 1:-‘1N N O O O N O O O N
ii 1 1 1 1 1 1 1 1-1-1 Ozßd +I +I +I +I +I +4 +I +I +1 +lE ESI-4 1-+ M ::0 Q •-1 1--1 O c~ 1-1 th
•~ E1 §l><1x :*1 N 1-1 N 0 N O :*1 QG) U)xx&4 1-1 1-1 N r-I NM ::1:*1 1.:1Q xxxUG.,..1 1
M1-1•In HM O O O Q V1 O 111*1 w :*1 OU Z äh-1 MN N O O O N O O O N_; gg 1 1 1 1 1 1 1 1 1 1
BP E E°¤§ Ü-'1 +1 +1 +1 +1 +1 +1 +1 +1 +11-1 :*1 <1· 1x :0 M co oo cn c>Zzx |><lx O :*1 1-4 N O N O :*1 1.:1
:>1 ON Q 1-1 :*1 1-1 N'U Uv 1:*1O-¤
$-1 xxO 1-1
11-1 v O O 0 1f1 O CO 1!1 0 :*1 0WN N O O O N O O O N1 1 1 1 1 1 1 1 1
G1 4 + + + + + + +1+ +
*,:1 |><w O O Q N CD :*1 1-1 :*1 O:1) Q Ix 1-4 N 1-1 N1-1 M nn:¤:1 IJU' GU3 G)
xx OO U xxU B0 xx $-1 :.1 :1 xx xxxcn M :>1 0 0 -1-1 on mvGU v 0 1-1 on 0 M v(D ’U $-4 (D $-1 U vxx G
1-l -1-1 \ 11) O OJ O x UD -1-1.¤ :101-1 1-1 1-1 Mv·¤ 0
M an M 1-1 --1 0 1.1.1 1-1 -1-1 1.11 ;.1.1 -1-1 v :1: 0 Q -1-1 1.1 1-1 o 1x
1-f1 H 111 E $-1$-1 I-1 dl Z U1 O I-1 GD3 0 U0 ·¤0 *¤ 0 cn ¤-1 M
0 M >~. ::,1:1 -1-1,¤ :1 >1E-1 v1-1 >~1 :11 1-1 0--1 U‘Y" 1-1 1-1 M M,¤ *:1 IJ Q ZM 4¤1 O -1-1 1.1 1-1 1-1 E0 4 o ¤ Gl 1U -1-1 -1-1 U1- 1:1.1 ¤¤ 1-1 Q 1:1 E EZ 1-1
33 A
NOR
21 1ROU13
QS-!
UJ 17 ·X4 CONPER P<.O1 __G:
! RATIONUPER P<.01 A 1UJ 15
: _ .
>' 13 ·. RES .
1 2 3 4(1-6wk) (7·14wk) (15-21wk) (22-26 wk)FERIODS
Figure l. Changes in dry matter intake with time for
Experiment II.
NOR =· Normal ration; ROU-
Roughage ration;CON = Concentrate ratiou; RES = Restrictedratiou.
34
7 ROU
NOR
_ 5 Pen P<.O1RAT|ON•PER P<.O1f\
QV
.LU 4
( CONI-Z
; 2'
RES ”
2 IMEAN:SE.M
1 2 3* .(1-6wk) (7-14wk) (15-21wk) (22-26 wk)
PERnO0sFigure 2. Changes in neutral detergent fiber (NDF) intake
with time for Experiment II.

35 ·
ROU.
Q NOR3
\/
S2
¤- CONO .<(
PER P<.O1 _1 RATlON¤PER P<.O1
1 2 3 4(1-6wk) (7-14wk) (15-21wk) (22-26 wk)
PERIODSFigure 3. Changes in acid detergent fiber (ADF) intake
with time for Experiment II.

36
Crude protein (CP) intake was significantly different (P< .01)
among rations, as shown in Table S. Concentrate ration showedlower(P·<.01)
intake of CP compared with control rations. Also, restricted
cows consumed less (P <.10) CP than ad libitum fed cows. Significant
difference among periods (P·<.Ol) and for ration by period interaction
(P <.0l) are shown in Figure 4. Maximum intake of CP was reached
around the second period except for roughage ration where intake contin-
ued up to the third period. Crude protein intake constantly decreased
in cows fed restricted concentrate.
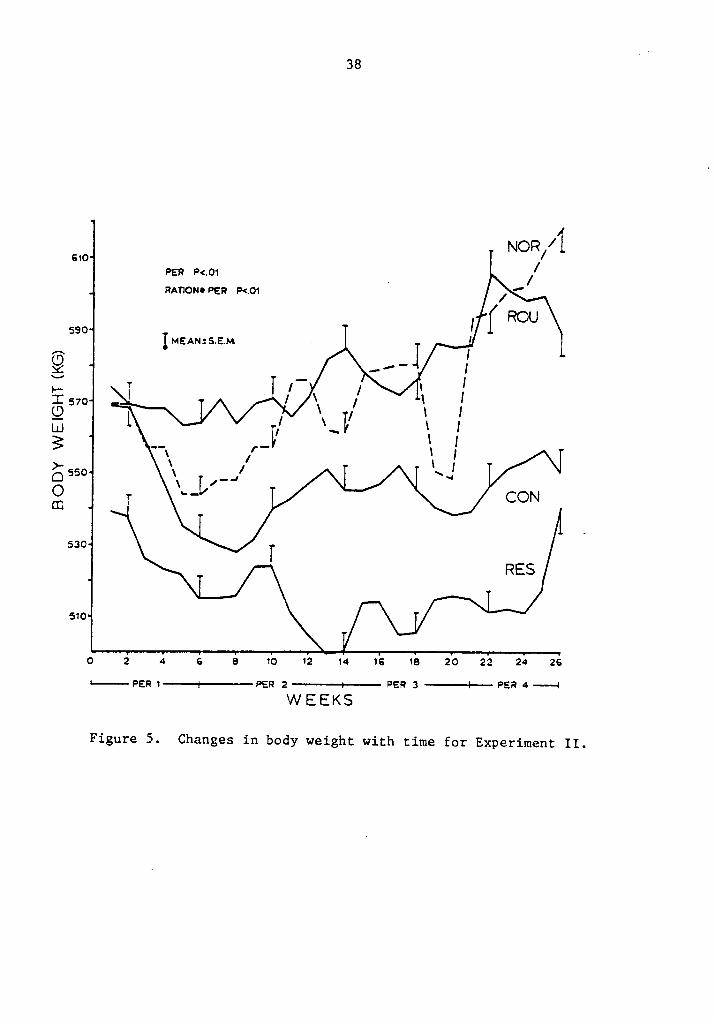
Least square means for body weight (BW) are presented in Table 5.
No significant difference was observed due to rations. Differences
among periods (P·<.Ol) and ration by period interaction (P·<.0l) are
shown in Figure 5. As expected, weight change was significantly
different for periods. In general, cows maintained weight (control
rations) or lost weight (concentrate rations) up toweek seven, constant-
ly gaining weight thereafter. Cows on the restricted ration paralleled
the weight increase of ad libitum cows. Cows on control rations did
gain more weight during the whole experiment compared to concentrate
fed cows.
No significant differences were observed for milk production among
the different rations (Table 5). Significant differences (P·<.Ol) were
observed between periods, probably attributed to stage of lactation.
Even though milk least square means for ad libitum concentrate were
larger than for restricted concentrate, the differences due to ration
were not significant.
37
4.2-* _ Q ' .
'O ]°MEAN:SE-M' l
E NOR
3 ROUf\
-# . CON
|_g_| 2X
PER P<.o1 RESRATlON•PER P<.O1
·O 1 _
1 2 3 4
(1-Gwk) (7-14wk) (15-21wk) (22-26wk)
_ PERIODS
Figure 4. Changes in crude protein (CP) intake with
time for Experiment II.
38E
Non /I610 /PERP<.O1RATIONOPER
( Row660 IMsA~:s.s.M 4Aig,·" [I- [ \
I-IE 570 I I / I IQ ,‘
I ‘ I2 -- ,-
‘IIx ’ II I
660Ü
~- Nm CO660 I
RES510
0 2 4 6 6 10 12 14 16 18 20 22 24 26|-——·PER1<—é—-lPER 2—·———+-i PER 3 +—— PER 4 :IW E EKSFigure 5. Changes in body weight with time for Experiment II.

39
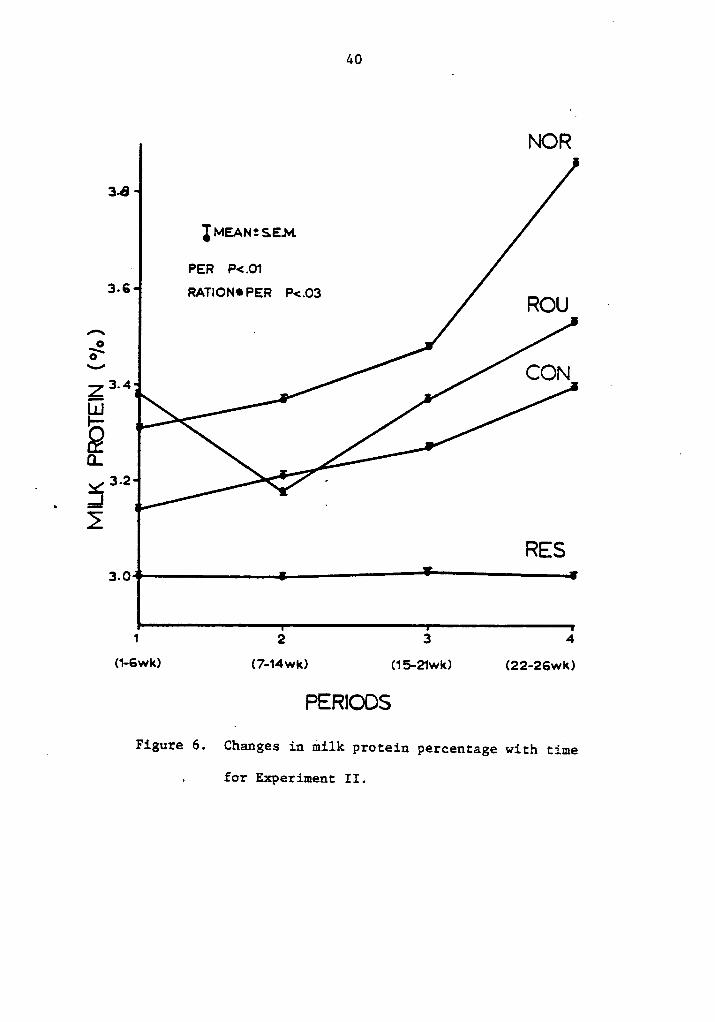
Milk components, as shown in Table 5, were affected by the differ-
ent rations. Milk solids showed significant differences (P <.0l) be- V
tween control and concentrate rations. Concentrate rations had similar
values even though intake differed; also milk protein showed significant
differences due to rations (P <.Ol). Cows in control rations had
higher milk protein compared to cows fed concentrate (P <.Ol). Also,
restricted concentrate cows showed significantly lower values (P <.05)
compared to ad libitum concentrate.
Figure 6 shows milk protein plotted by periods (P·<.Ol).„ The
ration by period interaction was significant (P <.03). In general,
milk protein tended to increase as lactation progressed, except for
restricted cows that showed no change. Cows on roughage rations had a
marked decrease during the second period, increasing thereafter in a
similar fashion to cows on normal and ad libitum concentrate rations.
The decrease can not be explained by similar differences in feed intake.
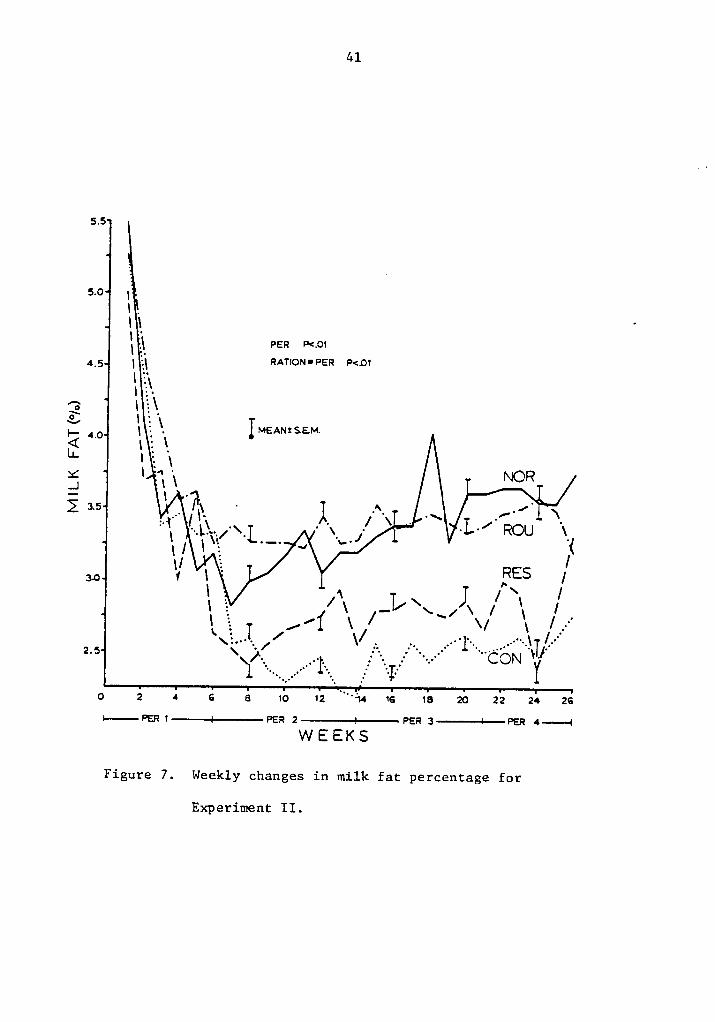
As shown in Table 5, fat test was significantly different among
rations (P <.Ol). Cows fed concentrate rations had lower values com-
pared with cows fed control rations. Figure 7 shows weekly variation
in milk fat production for the different rations. Periods and rations
by period interaction were significant (P <.Ol). A decrease in fat
test from the time of parturition to week 8 or 9 was observed for every
ration, being more pronounced for cows in concentrate rations.
Restricted concentrate feeding maintained milk fat secretion com-
pared to ad libitum concentrate, the change being noticeable after the
eighth week. Maximum improvement was reached by week 13, and maintained
40
NOR
36
Imemezssm
· PER P<.O13-6 RATIONOPER P .03‘1200.
f\ ‘
äV CON
Ä'Q ‘
_ x 3-2 ef ·
RES3.0
1 2 3 4(1-6wk) (7-14wk) (15-21wk) (22-26wk)
PERIODS
l Figure 6. Changes in milk protein percentage with time
. for Experiment II.
41
5.5
5.0 11 .\ 1 ‘ven
RATIONIPER P<.01\ Y1 2\-
11 140 \. Imemzsem.
<t ' 1 3 \LL \ 2 1hd \ *1 ‘ NORä }E 15 1 · l -^. ·"\. ·\.’ _3.1 [ _ _ . . n _/-.14, \_}____ \___/ L / mu «_(
1 2 "1/ 2 [so V l BSS /[. 1 /
12 /41/ 1/ 1/.--*.2..-1,,/1/2.6ON U
1 -1 YO 2 4 G 6 10 12 16 18 20 22 24 26
1--PER1-·-+---PER 2--4-PER 3-4-—PER 4-I
W E E K S
Figure 7. Weekly changes in milk fat percentage for
Experiment II.
42
throughout the experiment. Nevertheless, no significant difference
was observed between restricted and ad libitum rations when averages
for the whole experiment are considered.
Fat corrected milk (FCM) presented in Table 5 showed a pattern
very similar to fat percentage, largely due to the minimal difference
in milk production among rations.
Molar proportion of ruminal VFA and total VFA concentration of
rumen fluid differed among rations (Table 6). Significant differences
among concentrate and control rations were found for acetate (P <.l2),
propionate (P <.Ol) and butyrate (P <.O2). No difference was observed
between restricted and ad libitum concentrate rations, presumably due
to the same composition of both diets. Significant difference among
periods (P·<.04) and significant ration by period interaction (P·<.lO)
were found for propionate (Figure 8). All the rations except roughage
had an increase in propionate molar proportion up the second period
leveling off or decreasing later to values similar to the ones
observed in period one. Restricted cows maintained a narrow range of
fluctuations. Roughage cows were the only ones that ended with higher
values than in period one, but yet remained lower than the other diets.
Total VFA concentration showed significant differences among
rations (P <.O6). As shown in Table 6, cows on restricted concentrate
showed values similar to cows in control rations, but were less than
cows fed ad libitum concentrate.
Non glucogenic ratio (NGR), as defined by Orskov (57) [(acetate
+ 2 butyrate + valerate)·+ (propionate + valerate) in molar Z], was

43
Q
E/3 111H > ·1< ·kgr; .1-IEélh
<"'1OOO • U3 -I<
G gv >1:1 <¤¤.1 61
"U Z•1·1 OU CJ
Q :*1>~+ E-1 -1: -1: -1: -1: -1:
1.1 M +111+4-* O > [:11 +-1 61
11-1
AB Q '·+-1 V BJ MD O O O O O O UN O N1.1 U) O O N LD :*3 +-1 +-1 N 1-1
2 g G G G G G G . F; G äo ä +1 +1 +1 gl +1 +1 +1 +1 +I +-1> +-1 nn 61 Q 1h mn 11*1 GN oF, 2
[X ü ND O <"\ 1-1 \D ® LD O E
G3 +-1 10 co so 61 +-1 +-1 xo :1*1 111O LH N 1-1 ® CU
-1-1 I
E BJGJ“
1-1 E-OBJU3 1D LD O O O O O ON O -1-IO O N 1D Q +-1 +-1 GC+-1äÜUB +1 +1 +1 1+1 1 1 '—?1 1 Bw{OA GN N 1-1 ä N g Q g Gil-I
Ch In CQ +-1 :*1 O N N O P2
+-1 Lo 1- 1- +-1 +-1 +-1 c1 :-*1 +111•• Ih N 1-1 ® 1-1>~• I GJGJ
ä G1 EE‘++‘1’
U Z äh! BJ ~O LO O O O O O LO O 1-1+g F1-I cn O O 1- xo 1**1 +-1 +-1 1- +-1 umG1 b +-1 :11.1:1
é::.1 E-1 +| +| +1 +I +1 +1 +I +| +1 ..¤ 15Q :-*1 +-1 Q :*1 1.1*1 GN 61 1- Q GO FS O N +-1 ON GN CO G3 N3
11-1 UV N 10 N N 1-1 1-1 1-1 CW N -{-Q.11-1 Ih N 1-I G1 OD 0)+-1.¤ 1-*Q-
A (U
ä Ci ES11-1 BJ LD 1.r'1 O O O O O G3 O U
ll'-] U3 O O N O F5 1-1 1-1 N 1-1
äG . G G G . G P; . O
(.3 IIG G IJ IJ IJ IJ IJ IJ 56* IJ 3;* GE ä |:>< cx 1- :1: +-1 1h oo nn c- ~¤ -;,1GJ M +-1 10 O :-*1 61 +-1 +-1 LD :1*1 111
·~O N +-1 <I> 1-1:1 G :1cr GJ -1-1CD E G
D A 11)1.1 1-1 rn cbCD >s GJ OG1 1.1+-1 +-1 U111 ·+-1E o :11 GJ :1
+.1 0 E 1.1 1.1 +-1::10 <¤ :11 GJ 15 GJ co
M ::+11*1 B1O GJ G 1.1 L1 1.1 G-
BJ :¤\ >O 1.1 O G3 GJ <¤ OLo E-1 :11-1 +--1 ::1 -+-1 L1 +-1 1-1 Z
U ··-1\ 1.1 G. >s <¤ GJGJ MEA MU} GJ O 1-1 > 1-1 II
+-1 GJ '¤ Gcv :.1 L1 :3 1 :11 +-1,1:1 11.1¤··+-1 -+-1+-1 <: G- cn ·+-1 > :11 +-1 M:11 *4-1GJS Eo 1.1 M LD
E-1 G-1 IJE-1 :2.1 DE O CJ Z¤¤-/11-1 G. M-: E-1 Z +-1

I
44
30
gg·
28
,„27§RES
g 26<(
g 25 4NOR
\J
vz ROUZ 23 IMEAN!SE.M '.
[ PER P<.O422 RATION•PER P<.1O
0.
1 2 3 4(1-Gwk) (7-14wk) (15-21wk) (22-26wk)
PERIODSFiguia 8. Changes in molar·prop<$rtion propionace wich
time for Experiment II. · ""°’ ' — E

45
significant between rations (P <.Ol). As shown in Table 6, restricted
coucéuttaté rations did improve NGR values compared to ad libitum con-
centrate and approached NGR values for control diets. Differences were
observed in NGR values as lactation progressed, probably due to the
changes in glucogenic VFA molar ratio mentioned above.
As expected, due to the different characteristics of the rations,
significant differences (P <.Ol) were observed for ruminal pH. As
shown in Table 6, cows on ad libitum concentrate feeding, developed a
lower pH compared to the other diets. Restricted concentrate feeding
seems to aleviate the pH drop to a certain degree. No significant
differences were observed for buffering capacity of the rumen, even
though, a slight trend for a reduction in buffering capacity can be
observed in concentrate diets (Table 6). It seems that cows in
concentrate diets overcame satisfactorily the dietary challenge and
maintained throughout the experiment pH and buffering capacity similar
to that of control cows. These findings are also supported by the fact
that none of the cows in concentrate rations developed any metabolic
disorder during the experimental period.
Least square means for serum glucose are presented in Table 7.
No significant difference was observed among rations, even though in
concentrate rations, glucose was slightly higher.
Serum VFA least square means are presented in Table 7. Only
acetate showed a significant difference between concentrate and control
rations (P <.O7). Smaller values were observed for concentrate rations.
This agrees with a report by Annison et al. (2) that shows a decrease
in endogenous production of acetate where high concentrate diets are

46
:-4rs M Q N :-4Q MON :-4 O OO U: .
- -.
..1 +1 +1 +1 +1Q M Q xDQ O :-4 O
|>q . . .-O :-4 :-4
Z IhÄJJ
-:-4IDS
N GJ<""4 "OVM O
E-4 O Q N :-4 N 4*4 IO :-4 ,.¤ag mc- :-4 0 0 Q nn :-1 • coät-, gn . -
• • • • of; 12 E4:•~ OZ +4 +4 $4 +4 +4 +4 +4 +4
In :-412:1 Ih O Ih GN Ih :-4 P': ||"U MU N Ih :-4 O w N O Q-,4 5.42 454
-•
-. . .
- -
,_}
U UBO :-4 :-4 N :-4 CN <"1 OGl ät} Ih O :1;*
p., Z••
1.: 0 G*:1:* E I:'4I1-1 JJ
ä 6 O0) N 4-1
:-4 V Q--:-4 :-4 OJJ {dä Q Q N :-4 Ch Q :-4 N Q-IÜ P4 MON :-4 O O Q UN Ih • -:4
,.4 ég.4 ug . •- -
• •-
Q ,.4O 1-4 :-4 :-4 :-4> am +1 +1 $1 +1 +1 +1 +1 +1 >~
Z:-4 IO IO Q ¢'*"1 -0 :-4 O JJE M14 O Q 1-1 O N O O O -:-45 Q |>4 .
- -.
- -„
-gn
1-1 za N :-4 N cn ch 0 Ga: 04 rn :-4 cuU1 U :-4
’U
•-U3 N 3
414 S O OU) -:-4 • ,1O GJ VU J-4 ll3 O Q-1
:-4 $-4 xs -4¤0 Q. :-4 G4 Q
O V M Q N :-4 Ch W N :-4 JJ :4E Q: F:-IGN :-4 O O Ih N xD Q <¤:.4 -:-4 :1: •
- -•
- -• • 4,:
E-L: :-4 :-4 N 41)cu <: +4 +4 $I +4 $4 +4 +4 +4 U -1U) 'U E xD xD Ih Q IO :-4 G! U
G CJ 1- N :4 0 00 N IN cn J.:4,4 gg Q lpq „
-. •
-. . . 4.4 O
G O ON N 67 N N ON G $-1I1-1 zu nd Q cx I:.1 G.
1-: Ofh CU U) Q.Q $-4 JJ -:4<¤ Ä S ¤··4G) J-4 GJE E E irU Ä 46 -:-4$-1 N rx N 41.4 U)cd G 1-4 rx $-1 SB $-4 "U rx 1-4 JJ UU"
’UN 4-4 'U "U
U) Ä OD rx E N OO..G E :-4 cn G 34-1 1 -« E 0 E o o
U) Q \ 1-1 -/ E :-1(U JJ G) GJ GJ N N
•
41: 0: cn :-1 1.: cu rn :>4 G-1 .¤ o O cu cu 1-4 G Q4 1.: -:-1
0 E GJ G 1.: o +4 o GJ cuM D 1 JJ O G3 E 414 S > JJ
-1;:.1 :-4 zu -:-4 $-1 1
JJ 0 GN H U v J-: G. >« O -1 $-1 11 1-1
414 O JJ v $-4 Q :4 :4 414 Q.411 E E O 4.1 :> G. :-1 a a u-1 .:1 O
:-4 'J 5 ¢ 43-1 M ¢ O > IJ M $4-4 M Q.,.¤ $-1 $-4 M Q. -:-4 é -:-4441 4 01 41.1 :1: -:-4 a :-1
6-1 1::.: cn ua ¤¤ :-1 :-4 N

l 47
fed.
Least square means for ketone bodies expressed as beta—hydroxy—
butyric acid (BHBA) are presented in Table 7. No significant difference
was observed among rations. Nevertheless, concentrate rations showed
smaller values compared with control rations, results that agree with
reports found in the literature (71).
Least square means for the different lipoproteins are also
found in Table 7. Lipoprotein profiles and actual quantification of the
amount of lipoprotein were done for a number of animals in every ration.
Even though changes in the total amount of lipoprotein was observed
among cows, no trend was found in terms of diet effect on the different
lipoproteins. A great variation between cows was observed.
Discussion
Dry matter intake (DMI) followed a normal pattern as lactation
progressed for every ration, except restricted concentrate. As expect-
ed, cows in concentrate rations consumed less dry matter, ADF and NDF
than cows in control rations. Cows in control rations did consume more
crude protein (CP) compared to concentrate diets. Even though rations
were formulated to contain equal amounts of CP, the energy—protein ratio
was larger for concentrate fed cows, resulting in a lesser intake of
total ration and consequently of ration components. This difference in
intake and the energy—protein ratio partially explain the similarity
obtained in milk production for different rations.
Examining ration intake and milk production provides some expla-
nation of changes observed in body weight throughout the lactation

48
cycle. All cows maintained or lost weight up to the eighth week (Figure
5), increasing their energy deposition thereafter. Although not expect-
ed, cows on ad libitum concentrate did not gain the most weight, but·
closely paralleled body weight gains of cows in roughage ration.
According to Jahn et al. (42), cows on high concentrate rations are
expected to have higher energy deposition than cows on normal rations.
One possible explanation could be the appetite control mechanism. Due
to the high energy density of concentrate rations, it is possible to
suggest a chemostatic regulation of feed intake (52).
Body fill could also be affecting BW changes. According to Jahn
et al (42), animals consuming rations containing approximately 10% ADF —
15% CP will have an approximate body fill of 10% conpared to 14% for
cows receiving rations containing 20% ADF - 15% CP. When BW values from
Table 5 are corrected for body fill, true body weight differences are
minimal. Nevertheless, even though this correction seems applicable to
BW averages for the experiment, when BW corrections from the latter part
of the experiment are computed, cows in normal rations showed substan-
tially higher BW than cows in concentrate rations.
Milk solids for concentrate fed cows were lower compared to control
cows partially due to lower values for butterfat and protein components.
These results disagree with findings by Huber and Bowman (36). They
reported that protein content of milk was significantly higher for
high concentrate fed cows (hay: conc.l5:85) compared to low concentrate
(hay: conc.75:25). In another experiment, Huber and Bowman (37), work-
ing with grazing cows and different levels of grain supplementation
reported increases in solids—not—fat with increasing levels of
49 .
supplementation reported increases in solids-not—fat with increasing
levels of supplementation. Cows had available high quality pasture,
high in protein. This was not true for our experiment where CP was
similar for all rations independent of energy concentration. Results
reported by Boman (2l) tend to agree with our results, on the basis
that the level of fiber in the ration could affect milk protein. He
found that cows fed grain ad libitum plus 0.2 kg hay/day, had milk
protein content no higher than cows receiving hay, corn silage and
normal levels of grain, probably due to depressed intake and digestive
disturbances observed in ad libitum concentrate fed cows. Also our
data shows than when ad libitum and restricted concentrate fed cows
are compared, restricted cows showed lower milk protein values due to
lower CP intake.
Fat test, as reported in several places in the literature was
lower for cows fed concentrate rations (Figure 7); nevertheless, when
the overall average of the experiment is considered, no differences
existed between ad libitum and restricted concentrate fed cows. All
cows showed a decrease in fat test up to week eight or nine, which
coincide with a decrease in BW and gradual increase in milk production.
By week eight, cows have normally reached their maximum production and
their milk production decline begins.
Dry matter intake (DMI) increased during this time so that usually
just a few days beyond peak milk production, the animal energy status
changes from a negative one in which fat and protein is drawn out of
tissue to support production, to a positive one in which energy accumu-
lates. During the period prior to this change, milk fat pétcautagé
50
probably does not decline due to ration effect, because of the
support given by the animals tissue. Once this change is established,
as it can be seen in Figures 5 and 7, concentrate fed cows showed an5
inverse relationship between BW changes and fat test. These observa—
tions are nevertheless not applicable to control cows, where independent
of BW gains, milk fat percentage was maintained throughout the lacta—
tion. These findings tend to support observations by Jenny et al. (4l)
with respect to the lesser susceptibility to milk fat depression of
concentrate fed cows in early lactation compared with mid lactation.
Nevertheless, due to the different behavior of control cows, it is
suggested that other factors such as change in fermentation products
and blood metabolic parameters might be also involved in this metabolic
alteration. This will be in agreement with some of the theories that
have been proposed to explain milk fat depression (50, 73).
When rumen fermentation products are considered, a ration effect
on total VFA concentration as well as molar proportion was observed.
Total concentration of VFA was found to be higher for ad libitum concen-
trate compared to the other rations, including restricted concentrate.
This suggests that the amount—of VFA absorbed from the rumen could be
greater for concentrate diets increasing the amount of glucogenic and
nonglucogenic precursors available for milk and fat synthesis. However,
negative results had been reported in the literature (62, 63) when
attempts were made to induce milk fat depression and increase milk
production by infusing propionate and other VFA ruminally and
post-ruminally.

51
Molar proportion of VFA was also altered and the evaluation is
simplified by looking at NGR values. NGR was significantly different
for different rations. Control showed higher values, suggesting aA
better ratio between glucogenic and nonglucogenic VFA according to the
Orskov concept (57). This indicates energy is utilized in a more
efficient way in control rations compared to concentrate rations. This
largely coincides with production response as shown by FCM (Table 5).
Nevertheless, NGR values for concentrate rations are still considered
reasonable in terms of efficiency by Orskov but based on body weights
gains and milk fat production by these cows, efficiency was much lower.
No significant difference was found for serum glucose among rations.
It is reasonable to suggest that cows in ad libitum concentrate would
be expected to produce more glucose with lower NGR values and more
lpropionate production. However, because it was not shown for concen-
trate cows, the turn over rate of glucose must be greater.
Work found in the literature for glucose (41, 7l) generally dis-
agreed with the present findings. The difference can be explained
perhaps due to different sampling time, physiological stage of the
animal, level of production and duration of the experiment. Figure 9
shows serum glucose levels for the different rations throughout the
experimental period. Even though there was no significant difference
among rations, significant difference among periods can be seen, which
would then agree with certain literature (4l, 73).
If period 3 is considered, ad libitum concentrate showed the high-
est values for blood glucose, with restricted cows being located in
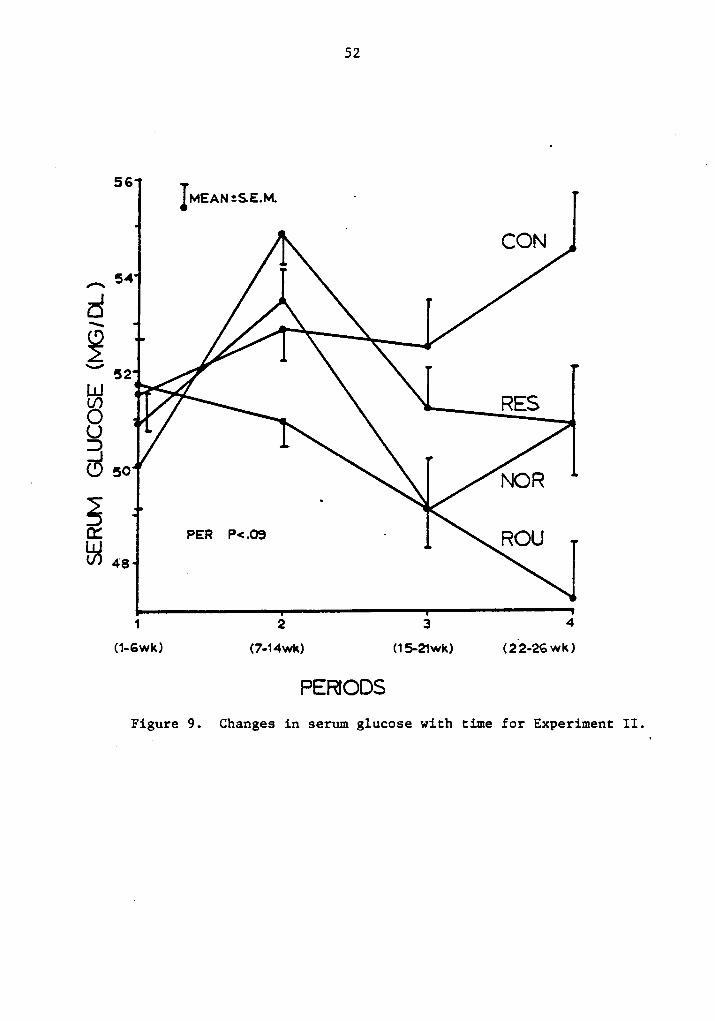
S2
56IMEAN:$.E.M. ·
CCON
^ 54
ä52ä'V / Rss
Q I
SoE32 ° NOR
0: PER P<.O9 - ROUB-) 48 Q
1 2 3 4(1-6wk) (7-14wk) (15-21wk) (22-26 wk)
PERIODSFigure 9. Changes in serum glucose with time for Experiment II.

53
between control and ad libitum cows. This trend was also found
although not significant in Experiment I, where cows in mid—lactation
(150 days) were followed for 30 days,

EXPERIMNT III
Objectives A
l. To determine the effect of different energy intakes on cow lipid
metabolism.
2. To monitor the changes in enzyme concentrations or activities in
mammary and adipose tissue when cows are fed restricted amounts
of fermentable energy.
Materials and Methods
Twelve cows in mid lactation (150 days) were used in this experi-
ment. Outcome groups of three cows were made according to milk produc-
tion and fat test and randomly assigned to the different rations. The
experimental rations were as in Experiment II, roughage, concentrate
ad libitum and concentrate restricted to NRC (53) requirements, Cows
on concentrate rations had an adjustment period of 12 days.
Weekly one day composite milk samples were taken and analyzed for
fat content in a Foss-Milko—Tester. When fat depression was establish-
ed, daily composite milk samples were taken for three to four days
before the animal was slaughtered. A similar procedure was followed
for roughage fed cows.
Cows in restricted concentrate feeding were first fed concentrate
ad libitum and monitored as cows in ad libitum concentrate until milk
fat depression occurred. From the onset of milk fat depression, daily
composite milk samples were taken for a period of four to five days
54
55
and analyzed for fat content. Consequently, intake of concentrate was
restricted to NRC (53) recommendations for their level of milk produc-
tion, fat test and body weight. Milk fat changes for restricted cowsAy
were monitored daily thereafter until fat test came up to predepressed
levels. When predepressed levels were established, cows were slaughter-
ed.
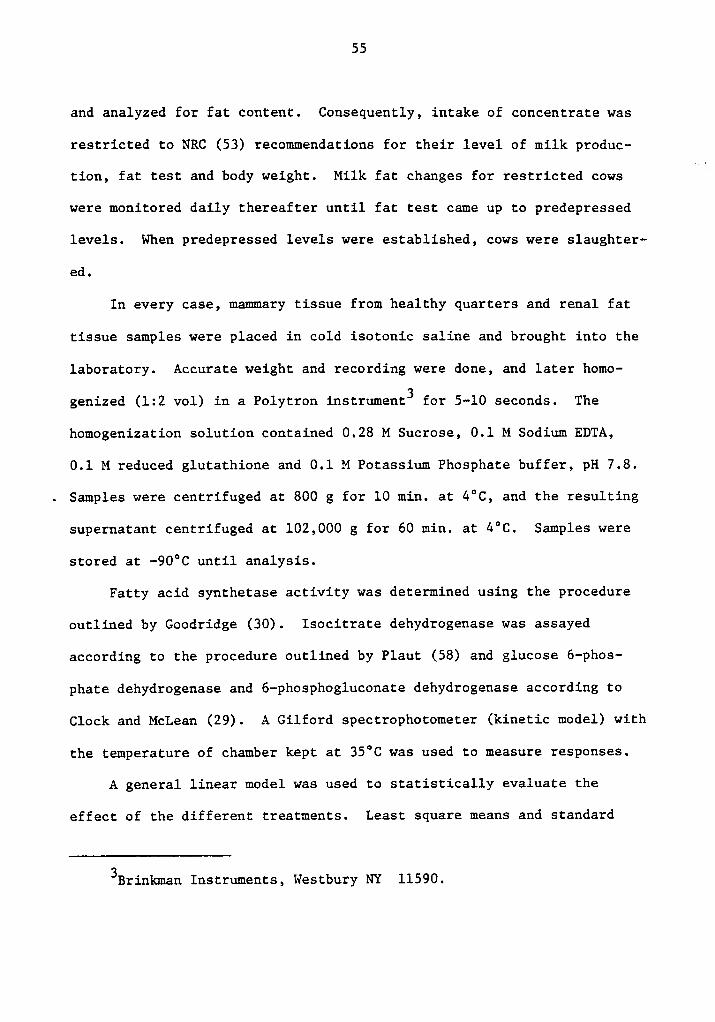
In every case, mamary tissue from healthy quarters and renal fat
tissue samples were placed in cold isotonic saline and brought into the
laboratory. Accurate weight and recording were done, and later homo-
genized (1:2 vol) in a Polytron instrument3 for 5-10 seconds. The
homogenization solution contained 0.28 M Sucrose, 0.1 M Sodium EDTA,
0.1 M reduced glutathione and 0.1 M Potassium Phosphate buffer, pH 7.8.
. Samples were centrifuged at 800 g for 10 min. at 4°C, and the resulting
supernatant centrifuged at 102,000 g for 60 min. at 4°C. Samples were
stored at -90°C until analysis.
Fatty acid synthetase activity was determined using the procedure
outlined by Goodridge (30). Isocitrate dehydrogenase was assayed
according to the procedure outlined by Plaut (58) and glucose 6—phos—
phate dehydrogenase and 6—phosphogluconate dehydrogenase according to
Clock and McLean (29). A Gilford spectrophotometer (kinetic model) with
the temperature of chamber kept at 35°C was used to measure responses.
A general linear model was used to statistically evaluate the
effect of the different treatments. Least square means and standard
3Brinkman Instruments, Westbury NY 11590.
56
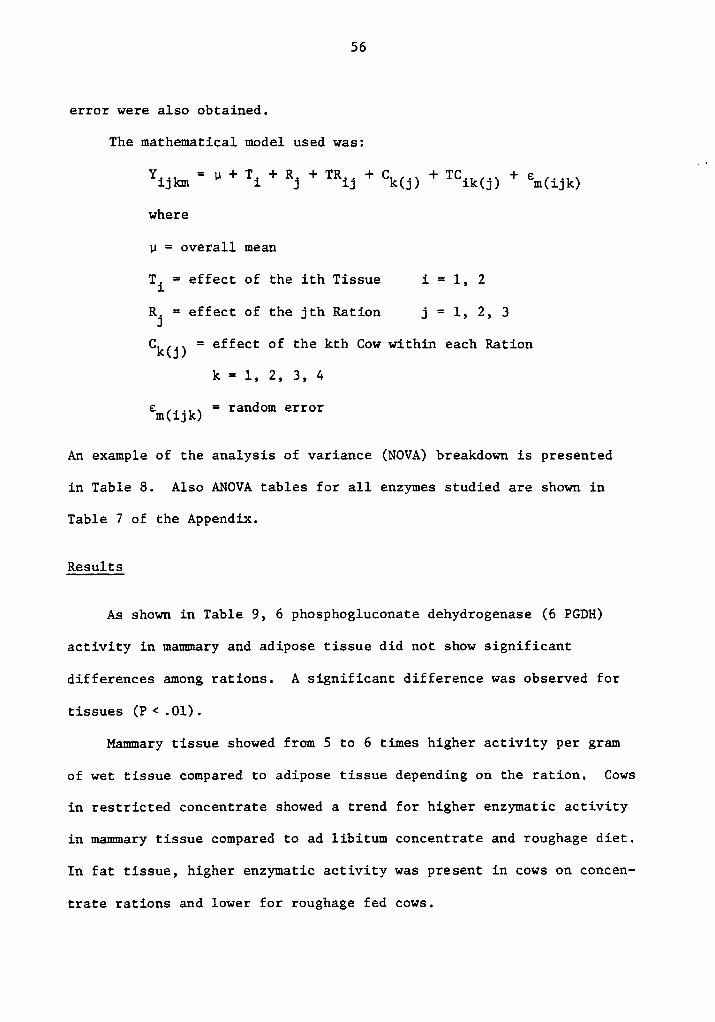
error were also obtained.
The mathematical model used was:
Yijkm = u + Ti + R5 + TRij + Ck(j) + TCik(j) + sm(ijk)W
where
u = overall mean
Ti = effect of the ith Tissue i = l, 2
Rj = effect of the jth Ration j = l, 2, 3
Ck(j) = effect of the kth Cow within each Rationk = l, 2, 3, 4
em(ijk) = random error
An example of the analysis of variance (NOVA) breakdown is presented
in Table 8. Also ANOVA tables for all enzymes studied are shown in
Table 7 of the Appendix.
Results
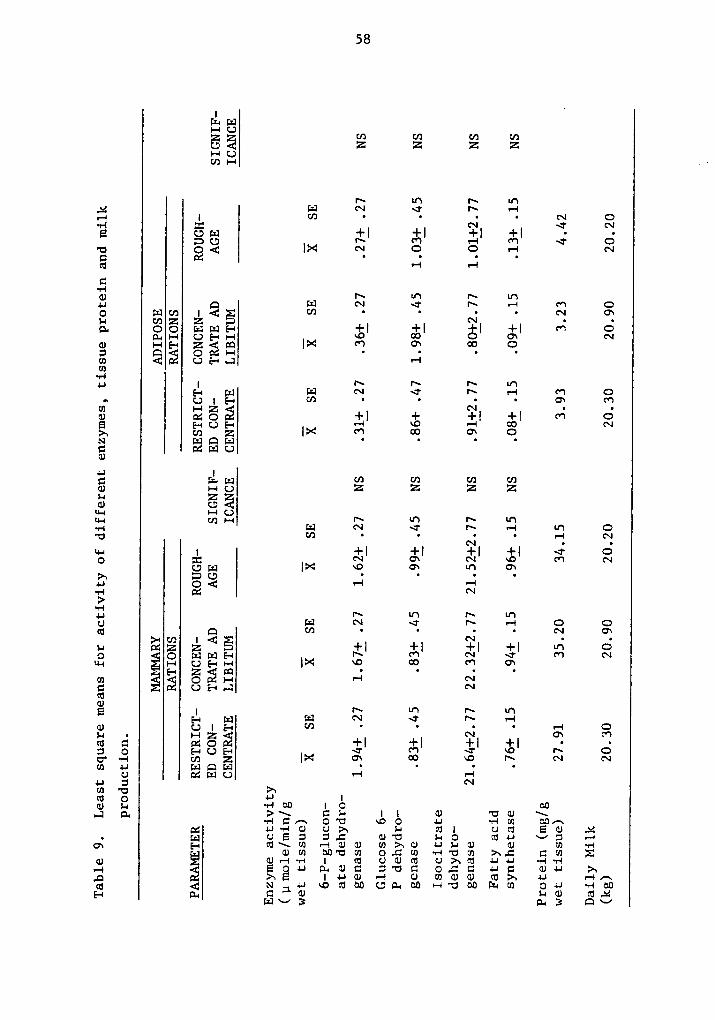
As shown in Table 9, 6 phosphogluconate dehydrogenase (6 PGDH)
activity in mammary and adipose tissue did not show significant
differences among rations. A significant difference was observed for
tissues (P <.0l).
Mammary tissue showed from S to 6 times higher activity per gram
of wet tissue compared to adipose tissue depending on the ration, Cows
in restricted concentrate showed a trend for higher enzymatic activity
in mamary tissue compared to ad libitum concentrate and roughage diet.
In fat tissue, higher enzymatic activity was present in cows on concen-
trate rations and lower for roughage fed cows.
57
Table 8. Analysis of variance for fatty acid synthetase activity inA,
Experiment III.
SOURCE Q£_ SS §§_ §_ PROBABILITY
Ration (R) 2 0.071 0.036 0.34 NS
Cow (Ration) 9 1.043 0.104 1.06 NS
Tissue (T) 1 3.159 3.159 32.14 0.001
R x T 2 0.028 0.014 0.14 NS
Error 9 0.786 0.098
Total 23 5.648
R2 .860
58
Eä cn cn cn cnQä z z z zHUum-I .·
N In N In,:4 lid N 4 N •—1
·· ,.1: **2 ‘ * „; ‘S E3-1-1
E Und +I +I +l +l · ·pg; N 01 ¤—1 01 4 O·¤ Q4 l>< N 0 0 .-1 N
•-4 •-1
.*3qj N Ih N In4,; Q Pd N 4 N •-1 M 08 ää ggä *" ° ' ßi
’°f °2¤. oo www +I +I gl +l #*1 <¤::.4+-+ 0&«•-I ~¤ ¤¤ ¤1 N
g-; HH ggü lx *7 Q *7 Q
Il | N N N Ih54 pg Lil N 4 N 1-4 W1 O4* $3é** °" ' ° =~1 ° °? "Y
cu zoä +l + +l +l **1 ¤E 54Q54 e-I IO 1-I M N>„ cn z |>< m oo cw 0E HU0EI
pL[;_] M M M MEQ Z Z Z ZJil gä2:: """ ¤ E 2 E E m Q4-U U} ,-Q O]
u-4 1 +l +l +I +I ~7' ¤O :1: N O1 N @ U1 N,_ gg I2* *2 **2 **2 **2o<: ·—I ·—I
5 z ~31*4 N |-F1 N UWU Erl N 4 N «-1 O Q
¢£ UI1-1 zZ Z +l +l +I +| I-F1 0Q O ;_q;q54 N 0*1 N 4 0*1 N
*~ ä; gg; *2* *2 *2 **2 **2cn O I-I •'l N1: Nzu
I N VW N V154 1:;] kl N 4 N 1-4
,*2 öl ' Si Qcu c: zog +l +I +I +| · ·gg Q 54;;;-4 4 01 4 ~0 N OQ-·•-4 cn Z I>< cx co 0 N N N
U 121::10 -··I ¤··I$7*1·€
>~ Nm o *-I Igg 5.4 •v·-JC!) IO OD,4 :1, >\ CH ll 0 *1:10
OT} @0 4-I -1-JU} ¤9/xQ 4.1~•-I0 U>„ x~4 =¤1 Um E0 .2. Q UE: :4: cu·¤ go mu v: •—«
cx 54 <¤\</J •—100 m>»0 us-I0 0 cn •«-Icum ¤0·¤cn 0.::::0 cm E
q; 1 cu U0<¤ 4.14.4 ·««·¤—1•-1 Eos-1 :140:: :·¤¤ 0.:::: 4.11: mu >»„¤ >~.E 14.40 r-Il 0 V100 ¢T$>s u «—+^Q 4 :~1_14.10:¤cßL¤¤4¤01-+·¤¤¤I=4m ou ·«-1c¤54 gp E 0 $-10 0.2
S9
Least square means for enzyme g1ucose—6—phosphate dehydrogenase
(G6PDH) are presented in Table 9. No significant differences were
observed for rations or tissues. A slightly higher activity was(Y
observed for the adipose tissue.
No real differences were observed for isocitrate dehydrogenase
activity in adipose and mamary tissue due to rations (Table 9). Signi-
ficant differences were found for tissue. Mammary tissue was 21
(roughage) to 28 times (restricted) more active than adipose tissue per
gram of wet tissue.
No significant differences were found among rations for fatty acid
synthetase complex (FAS) activity (Table 9). Significant differences
(P <.0l) were observed between tissues. In concentrate fed cows, mam-
mary tissue averaged 10 times more activity than adipose tissue. In
roughage fed cows, mamary tissue activity was only seven times more
active than adipose tissue.
Discussion
Results on enzymatic activity for 6—phosphogluconate dehydrogenase
(6PGDH) and glucose-6-PO4 dehydrogenase (G6PDH) agree in trend, but not
in magnitude, with values reported in the literature for adipose tissue
(6). Even though values presented in Table 9 were approximately 10
times higher than those reported by Baldwin et al. (6) for adipose
tissue, three to six times higher activity was found in G6PDH compared
to 6PGDH. Although not significant, rations seemed to have an effect
on the activity of these two enzymes. Ad libitum concentrate resulted
in the highest activity for G6PDH, restricted and roughage being

60
similar and lower in value. Enzymatic activity for isocitrate dehydro—
genase (ISOCDH) in adipose tissue was found similar to values reported
by the same authors.
Baldwin et al. (6) suggested that age of the animal and not physio-
logical stage was responsible for differences in activity. Our results
indicate that different periods within a lactation cycle could also
account for changes in activity. Based on different parameters measured
and overall condition of the animal throughout the lactation cycle,
Experiment II suggests that changes in enzymatic activity due to a
treatment could be obtained around 45-98 day compared to 150 days.
According to Experiment II, after 45 to 98 days, cows appear to
be less susceptible to milk fat depression and to possible changes in
activity of enzymes involved in lipid metabolism, independent of diet
characteristics. .
Opstvedt et al. (54) found that the enzymatic capacity for fat
synthesis in adipose tissue was higher in cows fed all concentrate
rations than cows fed all hay rations. Activities of many of the
enzymes involved in fatty acid synthesis tended to be slightly lower
in mamary tissue from cows fed concentrate than from cows fed hay.
They found fatty acid synthetase (FAS) activity to be one half for
concentrate cows. Even though enzymatic activity was higher for
mammary tissue in our study, no difference existed between ad libitum
concentrate and roughage rations.
Mellenberger et al. (48) working with cows that ranged in milk
production from 18 to 40 kg/day at peak lactation found values similar
to ours. Glucose-6-POa dehydrogenase and 6I’GDH activity for mammary
6l
tissue at 40 days post partum agree with ours, suggesting that inde-
pendent of ration effects, the level of enzymatic activity seems to
be maintained prior to peak lactation continuing up to 150 days.
Fatty acid synthetase activity found in mammary tissue was similar
to those reported by Mellenberger et al. (48) at 40 days post partum,
suggesting again a constant activity of the enzyme throughout the lacta-
tion cycle.l
lsocitrate dehydrogenase activity in mamary tissue was found to
be similar to values reported by Mellenberger et al. (48) and was found
to be more active than in adipose tissue. According to Mellenberger
et al. (48), ISOCDH is an important enzyme for providing a large percent-
age of NADPH for fatty acid synthesis in ruminants. Pentose shunt
enzymes according to the authors, do play a role compared to nonrumi—
nants.
Our results indicate that, independent of the amount of glucogenic
precursors available, cows in mid lactation obtained a large portion of
the reducing equivalents through the isocitrate cycle.
The minimal effect of ration on enzyme activity could also be
interpreted as not directly related to response between tissue metabol-
ism and enzyme activity (5). Ad libitum or restricted intake of fermen-
table energy could affect metabolite concentration and mammary and
adipose tissue metabolism without noticeable change in enzyme activity.
This could explain the partial increase obtained for fat test where
energy intake was restricted compared to ad libitum intake.

GENERAL DISCUSSION
Even though Experiment I indicated that milk fat depression was I
alleviated by controlling the amount of available energy consumed,
results were confounded by the fact that intake for the roughage group
was restricted to NRC (53) requirements. Also, l50 days post pattum
may not be the most appropriate time for a good comparison, based on
observations from Experiment II. In Experiment I, cows on ad libitum
concentrate showed higher milk production presumably due to higher
total ration and energy intake. Cows on restricted and roughage
rations were restricted in energy and crude protein creating the poten-
tial for milk production favorable for ad libitum concentrate cows.
Due to the level of restriction and the higher fiber content of
the ration, cows on roughage ration showed higher fat test. Cows
restricted in concentrate showed intermediate values compared to ad
libitum and roughage cows.
Molar proportion of VFA changed, mainly due to propionate increase
when concentrate was fed. Non—glucogenic ratio (NGR) showed a more
favorable value for restricted cows compared to ad libitum due to a
slight increase in acetate (57). That could increase fat synthesis
at mamary tissue level by providing a balanced proportion of metabol-
ites.
Similar results were obtained for Experiment II at 150 days when
compared to Experiment I. Cows fed ad libitum concentrate did produce
more milk than cows fed restricted concentrate or control rations.
Also, molar percent VFA changed for cows on concentrate rations due to
62
63
an increase in propionate production. When fat test was considered,
restricted concentrate cows showed intermediate values between ad
libitum concentrate and control rations. Dry matter intake, neverthe-
less, was higher for cows fed normal rations compared to concentrate
rations. When dry matter intake is considered for the whole experiment,
concentrate cows consumed less than normal cows, suggesting a chemo-
static regulation of intake due to the higher energy density of the
ration. If crude protein intake in considered, concentrate cows could
be considered to be borderline according to NRC (53) recommendations
for protein consumption. Based on Table 5 and NRC (53), cows in con-
centrate should receive 2.81 kg of protein per day, but only consumed
2.6 kg. Roughage cows required 2.81 kg and consumed 2.9 kg per day.
Limited intake of crude protein and fiber probably affected milk
components. Milk solids were lower for concentrate fed cows largely
due to a decrease in milk protein and milk fat. When lactose-mineral
content was calculated from Table l, no apparent difference was
observed for the different rations.
When fat test was followed on a weekly basis (Figure 7), a
marked decrease was observed for every animal independent of the exper-
imental ration up to week eight or nine. This decrease coincides with
an increase in milk production and decrease in body weight. After this
period, fat test stabilized at a given level depending on the energy
concentration of the ration consumed. Concentrate fed cows showed
lower fat test values compared to control cows and fat changes were
inversely related to body weight gains. When restricted cows are

64
compared with ad libitum concentrate cows for milk fat test differences
were observed after peak of lactation. When values for week l0 to
24 are compared, restricted cows had 3.17% milk fat as compared to4
2.88% for ad libium concentrate cows, suggesting an adverse effect of
metabolite concentration on milk fat secretion.
According to others (6, 57), cows in control groups were not
expected to gain weight because of the type of ration fed. However,
when comparing cows on control and concentrate rations, the former
gained more weight even after correction for body fill. No inverse
relationship occurred for control cows between body weight changes and
fat test (Figures 5 and 7). This suggests that in addition to crude
fiber content of the ration, amount of available energy consumed and
energy status of the animal, other factors must be involved in con-
trolling milk fat secretion in ruminants.
Therefore, it seemed important to look at several key enzymes
involved in fatty acid synthesis under different intakes of available
energy both in mammary and adipose tissue (Figure 10). There were no
significant differences due to rations for G6PDH(l), 6PGDH(2), ISOCDH
(3) and FAS complex (4) activity in either adipose or mammary tissue.
When 6-P-GDH activity for adipose tissue was plotted against mamary
tissue for every cow in the different rations, a negative relation
was found. Increases in adipose tissue activity were accompanied by
decreases in mammary enzymatic activity but were not consistent
enough to allow statistical significance. Even though some small
differences can be seen (Table 4), results agree with the literature

65
HERE' (
MADPH---NÄDP
- Gl conoloctone-6~P‘
Glucose 6 P GGPDH U ~\(D
‘\
\GIucon¤te·6·P 1
NAOP \Fructose·6· P 6PGDH@ \
\ NAOPI-I“\ }\ I \ }\ R1bulose-5·P 1} 1
I\1\:
‘}äfotty ocid—’
} Q 1' I I ‘ 1 ¤){ \ L.,} ms Ö1 "·+1 J/’ l ‘
·PYYUVOÜG I,,*
I rl \\
E I .Pymvoee 1}
\ •/ä_~Acetyl·CoA 3 }
Ciffdfé CIIYQIQ xE 1% EOxaloocetole isocitfote isocitrote }
mon ¤1„«««1¤«• mov 3 _ movNAO+XVk•@IMwwNADPQ»
äeä ISOCDHKNAOPHIM°‘¤‘[\° «· katoqlutcrute d-ketoqlutcrote
Fumcrote ä‘\Succin¤te\MITOCHONDRIA CYTOSOL
Figure 10. Schematic representation of NADPH generation for fatty
acid synthesis in ruminants. Adapted from (13).
(:1) FAS multienzyme complex: (1) Acyltrzms ferase , (2)Malonyltransacylasc, (3) DCIIYÖIGCLISC, (A) Enov1rcduct:1s:0,
(5) Acylcarrier protein (ACP), (6) D-ketoacyl ACP Syn- _thetase, (7) B-ketoncyl ACP rcductasc.
66
(6, 54) in suggesting a minor involvement of enzymes in explaining the
changes in milk fat secretion observed when high concentrate rations”
are fed. Changes in metabolism could occur due to factors other than
changes in enzymatic activity.
Our data supports Baldwin's concept (6) related with the implica-
tions of metabolite concentrations in the control of milk fat secretion
in the dairy cow.
The lack of response in enzymatic activity due to rations may be
explained perhaps by the reduced intake of ration components, particu-
larly crude protein by concentrate cows. Cows in concentrate ration
consumed less crude protein than required as mentioned earlier in this
discussion, due to a possible chemostatic regulation of intake.
Experiment II also suggests that extreme depression in milk fatA
secretions was not achieved in ad libitum concentrate cows. These
observations are supported by the fact that ad libitum concentrate cows
did not gain weight rapidly as shown by other (7, 54).
It has been assumed that cows in high concentrate rations produce
more milk compared to normal rations due to a higher availability of
milk precursors at the mammary gland level. Nevertheless, our experi-
ment showed that crude protein could be limiting because of the
restricted intake of total dry matter due to the high energy density of
the ration. Milk production will not be expressed at full potential,
unless especial consideration is given to the reduction in dry matter
intake when formulating for protein requirements,

67
Theoretically, ad libitum consumption of concentrate with a
proper energy—protein ratio should allow maximum intake of crude
protein and available energy for glucose synthesis and provide optimal
conditions to express maximum milk production, depressed milk fat
secretion, and increase in body weight gains.
Under these conditions, a number of metabolic alterations could
occur. Reports in the literature (4, 67, 79) have shown that fatty
acid synthesis from acetate in vitro in ruminants is greatly increased
in the presence of glucose. Under this theoretical situation, delineat-
ed before, glucose availability will be increased resulting in greater
amounts of glucose being channelled through the TCA cycle for use in
lactose synthesis and for oxidation purposes (7).
Isocitrate cycle provides NADPH for fatty acid synthesis by
utilizing acetate and is the main source of reducing equivalents with
an operational transhydrogeneration scheme (See item S, Figure 10).
This activity will diminish due to a disruption of the transhydrogen-
ation via glutamatedehydrogenase,‘with consecutive increase in pentose
phosphate cycle activity (See items 1 and 2, Figure 10) when glucose
concentration increases (7).
It was shown by Flatt (25) and Bauman and Davis (13) that the
individual pathway used by the cell in the generation of reducing
equivalents is related to the energy (ATP) needs of the cell. Iso-
citrate cycle is an ATP generating process and pentose phosphate cycle
an ATP deficient process. According to Bauman and Davis (13), iso-
citrate cycle yields three moles of ATP per mole of acetate incorpor-
ated into fatty acids. When transhydrogeneration is not operational,
68
the isocitrate cycle yields 14 moles of ATP.
Results agree with the literature (48) with respect to a greater
involvement of isocitrate cycle (See item 3, Figure 10) compared with.
the pentose shunt (See items 1 and 2, Figure 10) in providing reducing
equivalents for fatty acid synthesis at the mamary gland level under
the present conditions (Table 9).
Equal participation of the two pathways is observed for adipose
tissue (Table 9), results that agree with the literature (13). Adipose
tissue, being a less active tissue compared to mammary gland, does not
require the large amount of ATP that will be produced if isocitrate
cycle is the predominant souce of reducing equivalents.
Despite the agreement with the literature, overall changes in
enzyme activity did not show great response to rations. No appreciable
decrease was observed for ISOCDH (Item 3, Figure 10) or increase for
6PGDH (Item 2, Figure 10) and G6PDH (Item 1, Figure 10) in mamary
tissue of ad libitum concentrate cows when compared to restricted
concentrate. This was expected for high fat depressed cows.
An increase, although not significant, was observed for G6PDH and
6PGDH in adipose tissue for ad libitum concentrate compared to restrict-
ed fed cows. This could possibly explain the differences in fat test
observed in Figure 7 for these two groups. Increased metabolite concen-
tration could have altered fat synthesizing processes at the mamary
gland level in ad libitum concentrate fed cows.
Apparently, as mentioned before, mammary gland enzymes were not
responsive to ration effects (5, 54) and other factors like metabolite
concentrations or hormonal regulation of these metabolites might be
69
involved in the control of the metabolic alterations conducive to milk
fat depression (S4).
Our results support published reports (5, 6, 54) suggesting the
possibility that mammary enzyme activity is not the reason for the
differences observed in fat test when concentrates are fed. A variety
of ration extremes have been used to test the involvement of enzyme
activity, but little if any enzyme activity changes have been obtained.
According to our results, mid lactation (150 days), which has been
used in most of the reports, is probably not the appropriate time to
make enzyme comparisions. If any difference in enzyme activity is to
be expressed, comparisons should be done just beyond peak of lactation.
It is during this period where drastic changes in the cow metabolism
occur because of the heavy demands for synthesis of milk components.

SUMMARY
Three experiments were conducted to better understand the regula— ‘
tion of milk fat secretion by looking at concentration and ratio of
rumen fermentation products, blood metabolic parameters and ration
characteristics as well as the activities of some enzymes involved in
fatty acid synthesis.
In Experiment I, 21 cows in mid lactation (150 days) placed in
milk production strata were randomized to (1) roughage ration restricted
to NRC (53); (2) concentrate ration ad libitum; or (3) concentrate
ration restricted to NRC (53).
Cows fed concentrate rations (ad libitum and restricted) produced
more milk than those fed the roughage ration. Ad libitum concentrate
feeding resulted in more milk than restricted, probably due to higher
energy intake.
Fat content of milk was lower for concentrate as compared to
roughage rations; also values for ad libitum were lower than restricted
concentrates.
Serum glucose did not differ for cows fed ad libitum and restricted
concentrates; however, serum glucose was higher in cows fed Ccucénttaté
as compared to roughage rations.
Molar proportion VFA values were similar to those obtained by
others for similar types rations. Acetate decreased and propionate and
valerate were higher for the concentrate than the roughage ration,
independent of the level of intake. Total VFA concentration was
higher for ad libitum concentrate compared to other rations.
70
71
4Non—glucogenic ratio (NGR) [defined as (acetate + 2 butyrate +
valerate) +-(propionate + valerate)] showed marked differences among
rations. Restricted concentrate showed a more appropriate balance ofll
glucogenic and nonglucogenic VFA. Cows fed concentrate ad libitum had
NGR values that suggest inefficient utilization of energy for milk fat
production.
In Experiment II, 24 cows were used from parturition until 180 days
in their lactation. The rations used were (1) roughage ad libitum;
(2) concentrate ad libitum; (3) concentrate restricted to NRC (53); and
(4) normal ration ad libitum.
Cows on concentrate rations (ad libitum and restricted) consumed
less dry matter than control cows (roughage and normal). Periods as well
as ration by period interaction were also significant. Animals reached
peak intake around 45-98 days except for restricted concentrate cows
that constantly decreased.
Intake of neutral detergent fiber (NDF) and acid detergent fiber
(ADF) were significantly different among rations. Cows in concentrate
rations consumed less than control rations. Concentrate rations con-
sumed less CP compared to control rations. A chemostatic mechanism
controlling intake of concentrate cows could explain the lower intake.
Significant difference among periods and for ration by period
interaction was found for body weight. In general, cows maintained
weight (control rations) or lost weight (concentrate rations) up to
week seven, constantly gaining weight thereafter. Cows in control
rations did gain more weight during the whole experiment compared to
concentrate fed cows.
72
No significant differences were observed for milk production
among the different rations. However, milk solids showed significant I
differences between control and concentrate rations. Concentrate
rations had similar values independent of the level of intake. Milk
protein, also, showed significant differences among the different
rations. Cows in control rations had higher protein values compared to
cows in concentrate rations. Restricted cßucéntraté showed lower
values than ad libitum concentrate cows.
_Concentrate cows had lower fat test than cows in control rations.
A decrease in fat test from the time of parturition to week eight or
nine was observed for every ration, being more pronounced for cows in
concentrate rations. Energy restrictions improved milk fat secretion
compared to ad libitum intake after the eighth week.
Molar proportion VFA and total VFA concentration differed among
rations. Molar proportion acetate decreased and propionate and valerate
increased for concentrate compared to control rations. Restricted con-
centrate rations did not differ from ad libitum concentrate rations.
Molar proportion propionate showed significant variations during the
experiment. All rations except roughage showed increasing propionate
molar percentage up to period 2 (45-98 days), leveling off later in
the experiment.
Total VFA concentration showed differences between rations.
Restricted concentrate cows showed values similar to control fed cows
but less than ad libitum concentrate. Also, NCR was more favorable for
restricted compared to ad libitum concentrate cows.
73
Even though changes in pH were seen among the rations, no signifi-
cant differences were found for rumen buffer capacity,
When blood parameters are considered, concentrate cows showed
slightly higher glucose values and smaller blood acetate values compared
to control cows.
Twelve cows in mid lactation fed the rations of Experiment II
excluding normal ration were used to determine the effect of available
energy intake on activity of key enzymes involved in fatty acid
synthesis.
Activity for 6—phosphogluconate dehydrogenase was not different
among rations. Mamary tissue showed from 5 to 6 times higher activity
than adipose tissue depending on the diet. Cows on restricted concen-
trate tended to have higher activity in mamary tissue than ad libitum
or roughage cows. Fat tissue activity was higher for concentrate
rations and lower for roughage.
No significant differences were observed for rations or tissue
for glucose 6-phosphate dehydrogenase.
Isocitrate dehydrogenase did not differ due to rations, Neverthe-
less, when tissues are considered, mammary was 2l to 28 times more ac-
tive per gram of wet weight than adipose tissue.
Fatty acid synthetase did not show a difference in activity due to
ration. Significant differences were observed between tissues.
Mammary averaged l0 times more activity per gram of tissue than adipose
tissue. Mamary tissue activity of roughage fed cows averaged seven
times more than adipose.

74
From these experiments, the following has been concluded.
Conclusions -~
l. Milk fat depression is partially alleviated by limiting the
amount of intake of high concentrate rations.
2. Stage of lactation relative to energy status of the animal,
influences susceptibility to milk fat depression when high
grain rations are fed.
3. Enzymatic activity does not seem to be the main factor involved
in controlling milk fat secretion when measured during mid
lactation.
4. Excess grain feeding was inefficient for obtaining maximum
milk production.
REFERENCES
l. Annison, E. F., and R. R. White. 1961. Glucose utilization insheep. Biochem, J., 80:162. N
2. Annison, E. F., R. Bickerstaffe, and J. L. Linzell. 1974. Glucoseand fatty acid metabolism in cows producing milk of low fat con-tent. J. Agric. Sci., Camb., 82:87.
3. Armstrong, D. G., K. L. Blaxter, and N. McC. Graham. 1957. Theheat increment of mixtures of steam volatile fatty acids insheep. Brit. J. Nutr., 11:392.
4. Armstrong, D. G., and K. L. Blaxter. 1965. Effects of acetic andpropionic acids on energy retention and milk secretion in goats.In Energy Metabolism. p. 59. K. L. Blaxler, ed. Adademic Press,New York.
5. Baldwin, R. L., H. J. Lin, W. Cheng, R. Cabrera, and M. Ronning.1969. Enzyme and metabolite levels in mammary and abdominaladipose tissue of lactating dairy cows. J. Dairy Sci.,52:183.
6. Baldwin, R. L., J. R. Reichl, S. Louis, N. E. Smith, Y. T. Yang,and E. Osborne. 1973. Effects of age, pregnancy, and lacta—tion on rat, guinea pig, and cow adipose enzyme activities andcow adipose metabolism. J. Dairy Sci., 56:340.
7. Baldwin, R. L., Y. T. Yang, K. Crist, and G. Grichting. 1976.Theoretical model of ruminant adipose tissue metabolism in re-lation to the whole animal. Fed. Proc. 35:2314.
8. Ballard, F. J., R. W. Hanson, and D. S. Kronfeld. 1969. Glu-coneogenesis and lipogenisn in tissue from ruminant and nonrumi-nant animals. Fed. Proc., 28:218.
9. Balmain, J. H., S. J. Folley, and R. F. Glascock. 1952. Effectsof insulinaand of g1ycero1_in vitro on the incorporation of(carboxy— C) acetate into the fatty acids of lactating mammarygland slices with special reference to species differences.Biochem. J., 52:301.
10. Bauman, D. E., R. E. Brown, and C. L. Davis. 1970. Pathways offatty acid synthesis and reducing equivalent generation inmammary gland of rat, sow, and cow. Arch. Bioch. and Bioph.140:237.
11. Bauman, D. E., R. W. Mellenberger, and R. G. Derrig. 1973. Fattyacid synthesis in sheep mamary tissue. J. Dairy Sci., 56:1312.
75
76
12. Bauman, D. E. 1974. Fat metabolism in ruminants. Cornell Nutr.
Conf. p. 69.
13. Bauman, D. E., and C. L. Davis. 1975. Regulation of lipidmetabolism. In Digestion and Metabolism in the ruminant (Proc.IV Symposium on Rum. Physiology). I. W. McDonald A.C.I. Warner(Ed) p. 496.
14. Bauman, D. E. 1976. Intermediary metabolism of adipose tissue.Fed. Proc., 35:2308.
15. Baumgardt, B. R. 1964. Practical Observations on the QuantitativeAnalysis of Free Volatile Fatty Acids (VFA) in Aqueous Solutionsby Gas-Liquid Chromatography. Departmental Bulletin 1. Depart-ment of Dairy Science, University of Wisconsin, Madison, WI 53706.
16. Bergman, E. N., and J. E. Wolff. 1971. Metabolism of volatile fat-
ty acids by liver and portal-drained viscera in sheep. Amer.J. Phys., 221:586.
17. Bergman, E. N. 1973. Glucose metabolism in ruminants as related
to hypoglycemia and ketosis. The Cornell Veterinarian, 63:341.
18. Bickerstaffe, R. 1971. Uptake and metabolism of fat in thelactating mamary gland. In Lactation (ed I. R. Falconer) p.
317. Londonzßutterworth.
19. Bickerstaffe, R., E. F. Annison. 1971. Triglyceride synthesis
in goat and sow mamary tissue. Int. J. Biochem., 2:153.
20. Bickerstaffe, R., E. F. Annison, and J. L. Linzell. 1974. Themetabolism of glucose, acetate, lipids and amino acids in lacta-
ting dairy cows. J. Agric. Sci., Camb. 82:71.
21. Boman, R. L. 1965. The effects of various nutritional factors on
the composition of milk. M.S. Thesis, Virginia PolytechnicInstitute & State University, Blacksburg, VA.
22. Coppock, E. E., W. P. Flatt, L. A. Moore, and W. E. Stewart. 1964.
Relationship between end products of rumen fermentation and utili-
zation of metabolizable energy for milk production. J. DairySci., 47:1359.
23. Evans, E., J. G. Buchanan-Smith, G. K. MacLeod, and J. B. Stone.
1975. Glucose metabolism in cows fed low- and high-roughagediets. J. Dairy Sci., 58:672.
24. Flatt, W. P., P. W. Moe, L. A. Moore, N. W. Hooven, R. P. Lehmann,
E. R. 0rskov, and R. W. Hemken. 1969. In K. L. Blaxter, G.
Thorbek and J. Kielanowski (Ed.) Energy Metabolism of FarmAnimals. p. 221. Oriel Press, Newcastle-upon-Tyne.
77
25. Flatt, J. P. 1970. Conversion of carbohydrate to fat in adiposetissue: an energy—yie1ding and, therefore, self—1imiting pro-cess. J. of Lipid Res., 11:131.
26. Folley, S. J. and T. H. French. 1949. The intermediarymetabolism of the mammary gland. 1. Respiration of lactatingmammary gland slices in presence of carbohydrates. Biochem. J.45:117.
27. Folley, S. J., and T. H. French. 1950. The intermediary meta-bolism of the mammary gland. 3. Acetate metabolism of lactat-ing mamary gland slices with special reference to milk fatsynthesis. Biochem. J., 46:465.
28. Frobish, R. A., and C. L. Davis. 1977. Effects of abomasal in-fusions of glucose and propionate on milk yield and composition.J. Dairy Sci., 60:204.
29- Glock, G. E., and P. McLean. 1953. Further studies on the pro-perties and assay of glucose-6-phosphate dehydrogenase and6-phosphogluconate dehydrogenase of rat liver. Biochem. J.,55:400.
30- Goodridge, A. G. 1972. Regulation of the activity of acetylcoenzyme A carboxylase by palmitoyl coenzyme A and citrate.J. Biol. Chemistry, 247:6946.
3l- Hanson, R. W., and F. J. Ballard. 1967. The relative signifi-cance of acetate and glucose as precursors for lipid synthesisin liver and adipose tissue from ruminants. Biochem. J., 105:529.
32- Hardwick, D. C. 1966. The fate of acetyl groups derived fromglucose in the isolated perfosed goat udder. Biochem. J.,99:228.
33- Hodgson, J. C., and P. C. Thomas. 1972. The chemical composi-tion and dilution rate of rumen fluid in sheep receiving adiet of barley, hay and flaked maize. Proc. Nutr. Soc. 31:57A.
34• Hodgson, J. C., and P. C. Thomas. 1973. The influnce of thelevel of feeding on the digestion of a diet consisting of barley,hay and flaked maize. Proc. Nutr. Soc. 32:9lA.
35· Hovell, F. D. De B., J. F. D. Greenhalgh, and F. W. Wainman.1976. The utilization of diets containing acetate salts bygrowing lambs as measured by comparative slaughter and respira-tion calorimetry together with rumen fermentation. Brit. J.Nutr. 35:343.

78
36. Huber, J. T., and R. L. Boman. 1966. Nutritional factors affec—ting the solids—not-fat content of milk. J. Dairy Sci., 49:816.
37. Huber, J. T., and R. L. Boman. 1966. Effect of grain level andprotein content of the grain for grazing cows on milk composi-tion and yield, and certain blood and rumen constituents.J. Dairy Sci. 49:395.
38. Isaacson, H. R. F. C. Hinds, M. P. Bryant, and F. N. Owens. 1975.Efficiency of energy utilization by mixed rumen bacteria in con—tinuous culture. J. Dairy Sci., 58:1645.
39. Jorgensen, N. A., and L. H. Schultz. 1965. Ration effects onrumen acids, ketogenesis, and milk composition. I1. Restrictedroughage feeding. J. Dairy Sci., 48:1040.
40. Jorgensen, N. A., L. H. Schultz, and G. R. Barr. 1965. Factorsinfluencing milk fat depression on rations high in concentrates.J. Dairy Sci., 48:1031.
41. Jenny, B. F., C. E. Polan, and F. W. Thye. 1974. Effects of highgrain feeding and stage of lactation on serum insulin, glucoseand milk fat percentage in lactating cows. J. Nutr., 104:379.
42. Jahn, E., P. T. Chandler, and R. F. Kelly, 1976. Nutrientaccumulation and prediction of body composition of 20—week—oldcalves fed varying percentages of protein and fiber. J. Am.Sci. 42:736.
43. Kinsella, J. E., D. Bruns, and J. P. Infante. 1975. Fatty acidsynthetase of bovine mamary: properties and products. Lipids10:227.
44. Kinsella, J. E., and G. Houghton. 1975. Phospholipids and fatsecretion by cows on normal and low fiber diets: Lactationaltrends. J. Diary Sci., 58:1288.
45. Kleinschmidt. A. K., J. Moss, M. D. Lane. 1969. Acetyle co-enzyme A carboxylase: filamentous nature of the animal enzymes.Science 166:1276.
46. Latham, M. J., J. D Sutton, and M. E. Sharpe. 1974. Fermenta-tion and microorganisms in the rumen and the content of fatin the milk of cows given low roughage rations. J. Dairy Sci.,57:803.
97- Lowry, O. H., N. 0. Rosebrough, A. L. Fan, and R. J. Randall.1951. Protein measurement with the Folin phenol reagent.J. Biol. Chem. 193:265.
79
48. Mellenberger, R. W., D. E. Bauman, and D. R. Nelson. 1973.Metabolic adaptations during lactogenesis. Fatty acid and lac-tose synthesis in cow mammary tissue. Biochem. J., 136:741.
49. McClymont, G. L. 1951. Volatile fatty acid metabolism of ruminants ·with particular reference to the lactating bovine mammary glandand the composition of milk fat. Australian J. Agr. Res. 2:158.
50. McClymont, G. L., and S. Vallance. 1962. Depression of bloodglycerides and milk-fat synthesis by glucose infusion. Proc.Nutrition Soc., 21: XII.
Sl- Marinez, D. I., C. A. Ricks, and R. M. Cook. 1976. Utilization ofvolatile fatty acids in ruminants. 8. Acetate activation inmammary tissue. J. Agric. Food Chem., 24:927.
52· Montgomery, M. J., and B. R. Baumgardt. 1965. Regulation offood intake in ruminants. 1. Pelleted rations varying inenergy concentrations. J. Dairy Sci. 48:569.
53. Nutrient requirement of dairy cattle. 1971. National Academy ofSciences, National Research Council. Publ. ISBN 0-309-01916-8.
54. Opstvedt, J., R. L. Baldwin, and M. Ronning. 1967. Effect of dietupon activities of several enzymes in abdominal adipose andmammary tissues in the lactating dairy cow. J. Dairy Sci.,50:108.
55. OrSk0v,E. R., F. D. Hovell, and D. M. Allen. 1966. Utilizationof salts of volatile fatty acids by growing sheep. 2. Effectof stage of maturity and hormone implantation on the utilizationof violatile fatty acid salts as a source of energy for growthand fattening. Brit. J. Nutr., 20:307.
56. Orskov, E. R., and C. Fraser, 1974a. The effect of processing ofcereals on digestibility, type of rumen fermentation and firm-ness of subcutaneous fat in sheep. Brit. J. Nutr. 32:71.
57. Orskov, E. R. 1977. Capacity for digestion and effects of com-position of absorbed nutrients on animal metabolism. J. AnimalSci., 46:600.
58· Plaut, G. W. E. 1962. Isocitric dehydrogenase (TPN—1inked) frompig heart (revised procedure) In Methods in Enzymology vol.5:645.
59- Popjak, G., T. H. French, and S. J. Folley. 1951. Utilizationof acetate for milk-fat synthesis in the lactating goat.Biochem. J., 48:411.
80
60- Popjak, G., T. H. French, G. D. Hunter, and A. J. P. Martin. l951.
Mode of formation of milk fatty acids from acetate in the goat.
Biochem. J., 48:612.
6l- Robertson, J. B., and P. J. Van Soest. 1977. Dietary fiber _
estimation in concentrate feedstuffs. Paper no. 636, presented
at 69th meeting ASAS, Univ. Wisconsin, Madison.
62- Rook, J. A. F., and C. C. Balch. 1961. The effects of intraruminal
infusions of acetic, propionic and butyric acids on the yield and
composition of the milk of the cows. Br. J. Nutr. 15:361.
63- Rook, J. A. F., C. C. Balch, and V. W. Johnson. 1965. Further
observations on the effects of intriruminal infusions of
volatile fatty acids and of lactic acid on the yield and com-
position of the milk of the cow. Br. J. Nutr. 19:93.
64. Rook, J. A. F., J. B. Hopwood. 1970. The effects of intravenous
infusions of insulin and of sodium succinate on milk secretion
in the goat. J. Dairy Res., 37:193.
65. Rudel, L. L., A. L. Jason, D. M. Manford and M. S. James. 1974.
Characterization of plasms lipoprotein separated and purified
by agarose column chromatography. Bioch. J., 139:89.
66, Schacterle, G. R., and R. L. Pollack. 1973. A simplified method
for the quantitative assay of small amcuuts of protein in bio-
logical material. Anal. Biochem., 51:654.
67, Smith, R. W. and R. F. Glascock. 1969. The effects of acetate and
of pyruvate on the pathways of glucose catabolism in lactating
mamary tissue. Il. Sheep tissue. J. Dairy Res., 36:469.
68, Storrv, J. E. and J. A. F. Rook. 1965. Effects of intravenous
infrasions of acetate, beta-hydroxy—butyrate, triglyceride and
other metabolite on the composition of the milk fat and blood
in cows. Biochem. J. 97:879.
69. Storry, J. E., D. E. Brumby, A. J. Hall, and V. W. Johnson. 1974.
Responses in rumen fermentation and milk-fat secretion in cows
receiving low-roughage diets supplemented with protected tallow.
J. Dairy Res. 41:165.
70. Thomas, P. C. 1975. Diet and milk secretion in the ruminant.
World Review of An. Pord., X1:33.
7l. Van Soest, P. J., and N. N. Allen. 1959. Studies on the rela-tionship between rumen acids and fat metabolism of ruminants fedon restricted roughage diets. J. Dairy Sci., 42:1977.
81
72. Van Soest, P. J. 1963. Use of detergents in the analysis of fibrousfeeds. II. A rapid method for the determination of fiber andlignin. J. Assn. 0. A. Chem. 46:829.
73. Van Soest, P. J. 1963. Ruminant fat metabolism with particular _reference to factors affecting low milk fat and feed efficiency.A review. J. Dairy Sci., 46:204.
74, Van Soest, P. J. 1967. Development of a comprehensive system offeed analysis and its application to forages. J. Animal Sci.,26:219.
75. Van Soest, P. J., and R. H. Wine. 1967. Use of detergents inthe analysis of fibrous feeds. IV. The determination of plantcell wall constituents. J. Assn. O. A. Chem. 50:50.
76. Williamson, D. H., and J. Mellanby. 1965. D-(-)— Hydroxybu-tyrate In Methods of Enzymatic analysis. 2nd ed. Bergermeyer,H. V. Ed.
77. West, C. E., and R. F. Passey. 1967. Effect of glucose load andof insulin on the metabolism of glucose and of palmitate insheep. Biochem. J., 102:58.
78. West, C. E., R. Bickerstaffe, E. F. Annison and J. L. Linzell.1972. Studies on the mode of uptake of blood triglycerides bythe mamary gland of the lactating goat. Biochem. J., 126:477.
79. Yang. Y. T., and R. L. Baldwin. 1973. Preparation and metabolismof isolated cells from bovine adipose tissue. J. Dairy Sci.,56:350.

APPENDIX
82

83
Appendix Table l , Cgueeutrate IHZIXCUIES fO1' rations used in
Experiment I. _
INGREDIENTS CONCENTRATE ROUGHAGE
TM Salt 1.00 1.00
Ground Limestone 1.75 2.75
Dicalcium P04 .25 2.75
MgO .25 .25
Na2S04 .60 .60
Vit mix (12 x 106 U/gVit A, 12 x 106 U/g .25 .25Vit D)
Dried Molasses 1.25 1.25
Wet Molasses 3.00 3.00
Distillers Grain 2.50 2.50
Wheat 5.75 5.75
Pellet Binder 2.00 2.00
Ground Shelled Corn 63.35 77.10
Soybean Meal 18.05 .80
TOTAL 100.00 100.00
84
/\T•?^ Q; 3Uxxxx E-4U)N®©©U7¢\r·I<!'N®N® <d¢D€*\NOUWN!*$
Z3(JU) NNLu c~6161,—1»o 4 -·-4 <1·¤—·I Q
u-14 O"U N“~5I
E/\/°\
fd NQmu; xxx;
• OU)O\\O|\¢"7®®HJ-J
p-] G‘r-·INv—4G\g xxxxxx Q Ol-¤®®GJs-«
4 com-rs,-•¤¤ wl <r -1n-I "U 07 •
Q vFil kl ¤-•
[-1 <"'$lO\Dr-40\G\$1 ll
.,.4 4;.44 Q Q ••••••
m 'U N EIJID F3 V-H’Q'$ P; LQ?
I Ceu mmm ··-•·•-«| c> ·E xxxxxz 'U N V<¤ oNc~m<rco
G- II
U E3 3 GJg:qj |\|NC®1·-dl-Ö •••
R gd ...•..q;N
E EI E IS °"",'B‘°
u-1 :> <¤-Q-1 ·-,.,4 o 6-•"·¤ "U N
OIIG-e q·c¤r¤¤.n<rm ^^ '¤'¤
0cnUEm M\1·u'•Nw <£!IJ -—4N,—1c!>N¤h OO
H OONN-1xD GJV
*,6 Eli °' ä"‘ *3 ‘°Q..
> Q G-,.1 c ¤.Q·-ul c mu*+-1 '¤ N •¤ N UUO $-1
G B-}?03 Q-1 vv Nx um GJ GJO>~ I—|l’!J NNDONINNON E•UJ‘/ E'Em
>.4<rQ<rco H NN:-INND ¤.
61 S <r 61•~ uQ ¤-I „-C-'• U3
N ls-1·¤ N 'U
Nu-1Q Q HG.-¤ E-• E-• O-
xx N-! U-JVf\
mu; GJ;-lm wm>< ucv -1 ucv -1 4.1
-,-1 <¤<1J <G <¤GJ ru ·,·-•Il
·¤·,-•E·¤ :4
·,··•E·¤ :1 ::C'- Le-1.lOQ-•’¤ H4-JOB-1'U DG!G) tdtßw-4 -1-( <U<U•H ·r-4
ätä;‘3‘Q1"ä’,’Q„ ä,°Jä"3„
<¤ UE-•¤-«E—•¤¤< UH¤-•£-«¤¤¤d -161

85
Appendix Table 3. Concentrate mixtures for rations used in .
Experiments II and III.
AD LIBITUM
Zääääääfää 2¤L«.&
TM Salt 1.20 .24 1.43
Ground Limestone 3.00 .84 5.00
Dicalcium POA 4.20 .60 3.60
Mg0 1.20 .24 1.43
Na2SO4 .50 .10 1.55
Vit Mix (6xl05I.U./gVit A; 4x10⁵I.U./g .22 .44 .53Vit D)
Molasses 4.00 .80 4.00
H20 4.00 .80 4.00
SBM 77.00 12.30 74.33
Ground Corn __Q;QQ 84.10 __4;2Q
TOTAL 100.00 100.00 100.00

86
A I:.] as’U E•• ¤¤••·
Q xaé
Q xa N -5-• cn <r•-4•-•c~c«-4 M c~Qco•-JQN
•-•
< Q G<"$¤—IG«—•N>-• ¢’¥•-JVNQQN ~
EZ• „ • • • • pn • • • • • •
VQ N :> QNMQ0
Mv-4 M 0 o •-1 ¤n0 9..MCM v-I ON ·U12 Z I
9-• •-Glb-nl Q•-O MU-4 G ••~
r-I 'U G G•-I •-I
_ VH ReM asrs
ax lu Q ||g Q Q GG
G V H •-••-•r~Q¢•'s0 ¤¤dJ Q NQNNQNE gg.; Q Q Q Q QQq· Q • • • • • • .„
·•·| ä *3 • • • • • • Is} NIOGNQ Gs-e M ä -1 •-•c~ oGJ
FrJ>·• •
Ge U}? > VN D I ~
Erl G‘•'I Q-•
H-• NG "UI Ih Z IIvl IH Q
'U N H-IQ
•-4
H ax M•~
GJ JD F1Q xa QGJ l*7r-IFIGÖIG
•E
•V
Q• • • • ••ßl
Q In «-ILHGQI-h ¤.,Q M r-IQN Q
•~ß. Ars Q [|Bl Q GJ
4,; ug gn E-• xaxa•q)
g: ·¤ anä
Q<~a¤nr~r~„1· anG3 Q QGGGGG
••
H AA Q Q • • • • • • QQ
GJ M M Ä GNQQM •-song.; xaxa G ON ,¤ ~wu QQHGMG > M V-1-I GQNGUGG E4
·¤ m • • • • • „ z Qi,.1 ¤¤ <r·O00~ gz
H M QNGGr-I·•-I I
Q z NN:-4 «-4u-6 mo: ¤~ M ·¤·¤
U-0 Q GGJ '¤ N IJ ••~
U*6-• G
•-4 OG
G '¤ Q u-IO
E‘^ U °
:6 -=Z.>
GN Qrsrs Q ||
U-4 •-4 rxzsas GJ Q Q UO U1 Q Q Q Ct] VVV U
Q Gxaxa [-d Q <"INNG¤-IN HQ M 0) QGGGGQ <2 CB GGGVSMM GJ
•••
·•·¢ GJ Ü GGGGQU1 H• • •
·• • J-IN
GJ O• • • • • • kl NNNGN GJG
>~• U} MQGQQ U r-1Qr-4•-IQ E•
•-• <r~•-a :~ < «-e M VQ M
H
E„¤ E MmI-I G«E M II
lu MGMQQ MW FIGMQVX •G
·‘¤ N G U'J'U N G on
Q N r-I 3GJ
•·-IQ
¤-4 'U ":J H GG«¤ O I O O
••
Q Q -1-I xs ••4 U-I VVF _ G H G P
O GJ O GJ Q G-•¤·•
><·•-• M,-a ·«-A ¤-••-1 u
·•-4 M u x M u x M·•-• nu
'Q O G Q'U G G G Q'!} G 5 GG M O M O O "O O M O O "O D Q'P*GJ : •Hxa·rI·v·I••-I ·•-I~/•v-4••-tw-4G- O u 3 Hu 01 U 3 Hu QQ- UI Q O U Q UN G O U Q GJN • •
Q MUGJMMM MOD-•MMM «-IN
87
IN /\ /N
/\CGN III U ¤0 CU ·•~V V V V V V N
B cn I-I 0 «—I Q N 4 oc co •—-I LO 0 TI I-I0 N Q IZ; N 00 Ih Q N N •• • • • • • • • • • • •
I-I F3 O I-I •·-I O I-I 0 Q In I-I VI':-'I N Q Q Q IN In O 0 Q th I3-I3 In In IN oo IN co In c~ Q IN I
N Q O Q I-I E—• I-I Q I-I 0 II>-< th N In In 0 O NQ In Q Q H ¤-I ,I:O I:.I I-I *:1 I"U I O ••«
Q Q O0 Ü'-} A A A A I-I I-IIh III III III III ·A A A A V V V V V
. Z II: IU CU 0: E—· LPI IN IN In 0 NH I--I m V V V V z N 4 N go N N
p_,
I-{ gn IN IN ¥¤ l"I Ü} • • • • • •
H Q O Q N 0 Q 01 Q I-I In IN N II4.; O
• • • • • • ¢¥I 0 Q •—I N QC; M Q Q I-4 I·—I In Er-1 Q N In ab I-I ¤DQ cn I-I Q N F7
hd con-]
'° >• gw;I N
A A IN V4;,; III ·«-I Q In I:.
V Vg Q 0 In N O 0 II
.,.4 N th N Q Q CW A A A Agg gg gu Q4
m m Q Q (N] Q\ IQ V V V V
H Q N oo Q N Q I-I Q In N N ·•~
U kl N Q N N Ih 0: O 0 Q 0 kh In InU m gn Q 5-I 0*} • . • I . • Q
U O KD O Q Q 0 N•
E O ld Ih Q- Q I-I Ih •VI-I IN gg
Q ¤‘Q
Io I:-· •gl CN <Ü \D II
I-I I:-I II.I Ihg
’UCW •‘ GJ
Q In In •*
H„-G N GJ Q
Q [TJ m V V A /\ /N I••I
N O In IN 0 N <U CU *4-I .¤ •
IH 4 I-I Ih N I-I Q In V V V CU V.,.4 E-4 • • • • • • U) 0 0 N Q 0 Q E-I-¤ {xl Q N 00 Q N In In O ¤O N In In 0.,
U gn q- N cx dj • • • . I •Q
H 4 In O I-I Q Q In I—·I N 0 ·•-I IIO I-: In Q N
IH Z De "U "U
0:UU-I O 0-I 0 0
gg Q ·¤ co ·¤ 0 II-I 0I!) I-I Q •
-1-II—I 0: VI-I .¤
IU N I1-I> I-I A A A A A A E
III-I CU CU 'U 00 >·• ,¤ 00 G1 II
o 4 m IN 0 w O In O I—I IN co O Ih In 0 0Z Q I—I Q IN N Q U 01 N N I—I Ih N N I-I
U; Q . . . . . . 4 gg . . . . . • q; .„·•-I I-I 0 Q I-I Q IN I—I 0 I—I I-I I-I I.: NU1 ¤-I Q Q Q In In In 0: O>~I In Io I-I N0I-4III In Q I.: V¤ BJ CU ¤-•
4 Z Q: HIn 0 In cn 0 Q co .I:~ '4-4 N '4-I IN U ,.¤.,„ ct -¤ «—I ·¤ I-I III
I:°’ „I¤§
I-I '¤ '¤ H O O'Q Q Q O
• •
N A ‘•··I A •I·I U-I V VH I: I-I I: I-IO 0: O 0 In Q-I ¤-I
>< ·I-I I:. I-I ·«-I 0: I-I I.:~«-I ::1 I.: I: III I: >I III -I-4 II II'U U C1 CU 'U ¤ :3 C1 CU '¤ G 'J I3I: Q 0 Q 0 0 ·¤ 0 M o o '¤ Q II: ·•-I0: D ·•-I V ·«-I ·•-I ·«-I
·«-• V ·•—I •«·-I ·v-IQ. Q :.1 3 II-: IJ tt: 1.: 3 III I.: 01O- U3 O U N GJ N N O CU N GJ N • •4 U I3-I M M M M U ¤-I M M M I-I N
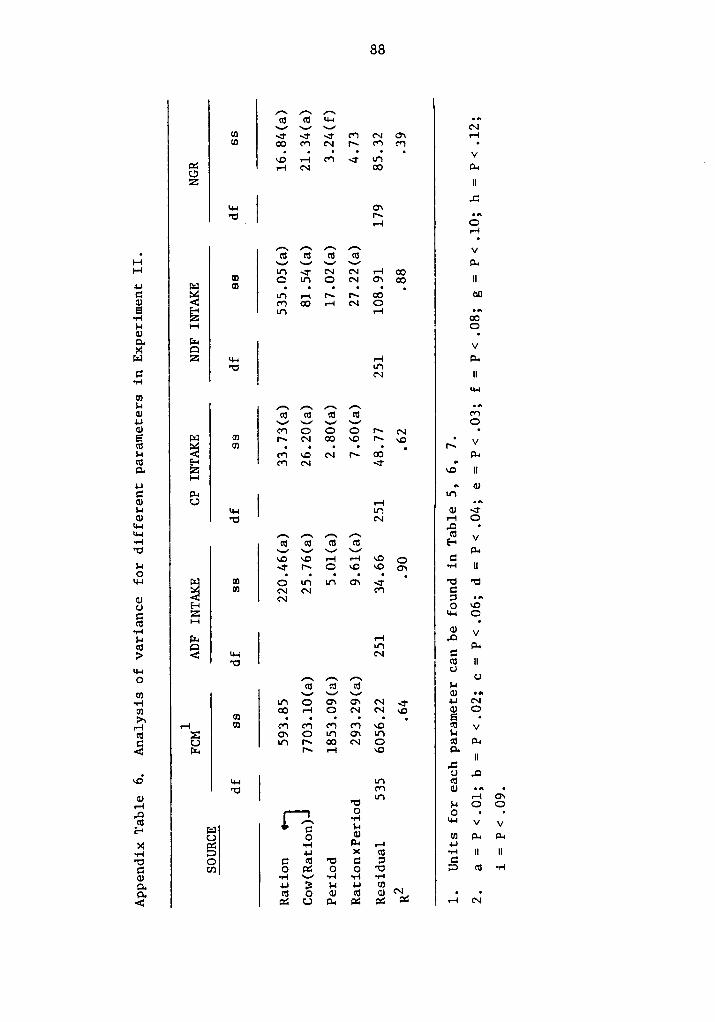
88
(IJ
Sm/N
M°°
<r
U61
N
,£.,-•
fav¤-·
,.§O, u•~
Tl
^A"*
'°
co A
.„
.
*5kl
oa:33*;
0F1
P,
•@61
*-*Z
¤n•c~1•'*
V
0H
¤_
D-e
NO' uZ
00
-,-4u-4
oa
'UH
00
„—•·
E
2"
E
A
°·
mjrx
oa
H
Ä=¤
°°o"S
“·‘
2-•
",„,<:>
;_gZ
fénxäß
°"
¤
"‘
„~¤•.·~=**
‘“
O
M
®•
•'
22l
„6°‘
,¤n
$.4
Ü:usw
f\
J3
i';T€^AN
cu'-
xoxzßm
„¤O
U
Nm.,.4M
<!'·~e-il
“‘ In
M·¤I
’ 2
2““
°‘é‘MI
¤‘^
·¤
¤-«‘°
cn
·'*O
,,,.4
I-O
(D'
gg
N•¤V
Z?gd°‘
U"
0
,„-,•ONc~1
:.4*-*
Lu
0_
‘°
co°‘ E
Q
O
¢¤°
,.4*6
~Dgv
.¤eo
I
¤„°··
F
,3gu
>§ä V1
222·°
·=2
2 2„:·
GJ
G
©O\
Q,
U)""
U
OO
¤_
,:04;.
u-«·_
<:
¤g-¤><··‘
VV
~<„„¤<=‘°***2.
u.,.4o,ä
3cu
@3:-«"".,.,n
ggmumS
u
¤4°°,,
zu
gzmoax
·,-•#2;
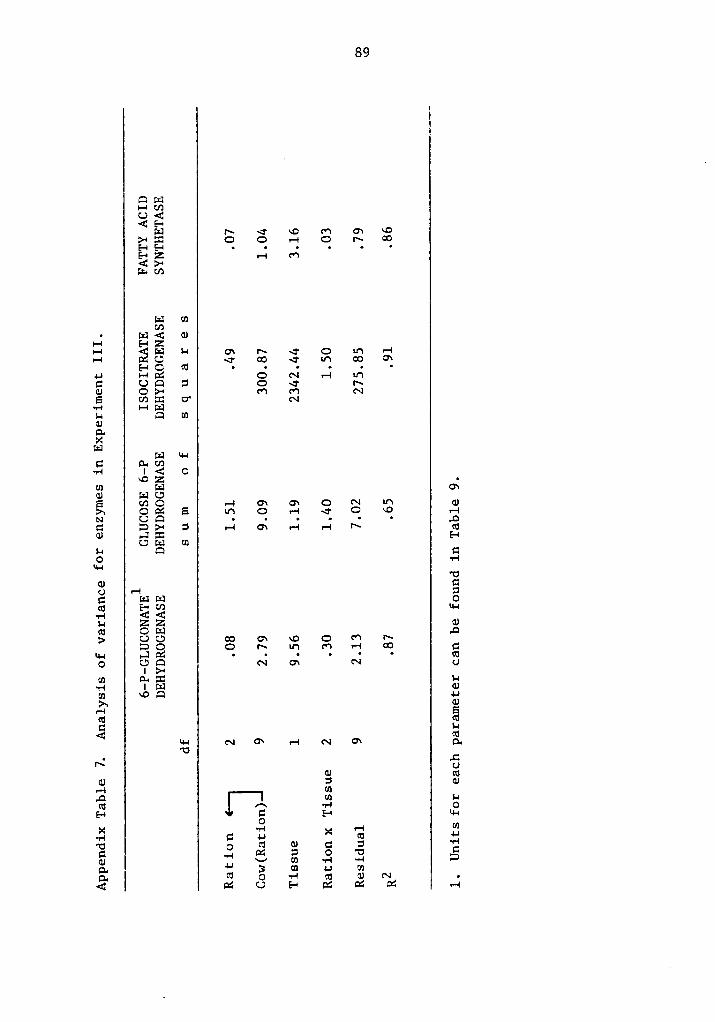
89
QM4-4U}c.><t<SE•
M 1~ <r ~o m cx ~0><M 0 0 :-1 0 :~ co. F;
• • •<>·•um
M rnU)
· M<2 GJ:-1 E-421-1 M cx 1~ <r 0 an :-41-1 U <r c¤ <r nn oo Ch
ßlc {U • • n • • •
u r-1M 0 N :-1 mn¤ UQ 'J O \1· r~GJ O:>-• m cn NE ¤/¤:¤ ¤‘ N
-:-1 1-1M$-4 Q U3GJCu><M mu-1ct mu:
-:-1 14 oxcz •
cn M ONGJ MU
EI 010 :-1 cw cx 0 N ¤¤ 0OM E nn 0 :-1 q- 0 ~¤ :-1
N QQ • „ . . • • _¤
¤ :>:>« :¤ 1-1 cx :-1 :-1 ¢~ cuGJ AM H<.’JM
U1$-1 Q QO -:-4•+1
’¤
GJ I3U •—* IJ
2 E5? -2-:-1 <¤<2J-1 ZZ GJul QM „¤
> uu co c~ ~o 0 <'¤ INIDC 0
•~ mn m :-1 cu g::4., ,.1m • „ • • •
-gg
o N c~ N 0fü
¤-•¤1‘•M
·:-4 IM GJ
Ei°“
*63•'* EGJ GS
2 *63¤-1 N Ch :-1 N G4 cnU „-C!IN<¤
GJ :1 cu:-4 U!„¤ UJ M3) 6 -1-1 Q
E-1 :1 H $4-4
54 :-1 VJ-:-1 s: 1-•
"cu 4-*
·c O =¤ zu 1;: :: ·•·44-. .,., zz :1 o -¤ ¤gg xa 0) •:-4 ~:·-4 =Q.
"‘'3 G2 4.J cn
Q1 GS Q ·:-4 Q CU N •
4 M U E—• M M M :-1

FACTORS ASSOCIATED WITH MILK FAT SECRETION OF COWS
IN RESPONSE TO CONTRASTING AVAILABLE ENERGY CONSUMTTION F
by
Demetrio Zanartu
(ABSTRACT)
Three experiments were conducted to determine the relationship
of milk fat secretion to concentration and ratio of rumen fermentation
products, blood metabolic parameters, ration characteristics and
certain enzymic activity involved in fatty acid synthesis.
In Experiment I, 21 cows in mid lactation were randomized
according to milk production to (l) roughage ration (~22Z CF)
restricted to NRC; (2) concentrate ration (ml2Z CF) ad libitum; or
(3) concentrate ration (~l2Z CF) restricted to NRC and fed for 30 days.
Ad libitum concentrate showed higher dry matter intake (DMI),
body weight (BW), milk production than restricted concentrate. The
opposite was true for fat test. Concentrate rations (ad libitum and
restricted) when compared to roughage showed higher values for DMI,
BW, milk poduction, serum glucose, molar proportion propionate and
valerate and lower values for fat test and molar proportion acetate.
In Experiment II, 24 cows 180 d. post parturition, were assigned
to four rations based on anticipated parturition. Rations were: (1)
roughage ad libitum (MZOZ CF); (2) concentrate ad libitum (~10Z CF);
(3) concentrate restricted (MIOZ CF) to NRC; and (4) normal ration
(¤l4Z CF) ad libitum. Cows on ad libitum and restricted concentrate
consumed less dry matter, acid detergent fiber, neutral detergent

fiber and crude protein than control cows (roughage and normal). Cows
fed control rations gained more weight than concentrate fed cows. No ,
difference was found for milk production. Milk protein was higher for
control cows. Concentrate cows had lower fat test than control cows.
Cows on all rations decreased fat test up to week three or four but by
week eight or nine, concentrate fed cows had decreased to their lowest
fat test. Energy restriction improved milk fat secretion compared to
ad libitum intake after the eighth week. Molar proportion VFA favored
propionate for concentrate cows and was similar for restricted and ad
libitum concentrate. Total ruminal VFA concentration was higher for
ad libitum concentrate cows and those cows showed slightly higher
glucose and smaller blood acetate compared to control.
Twelve cows in mid lactation were fed the rations of Experiment
II to determine the effect of available energy intake on activity of
key enzymes of fatty acid synthesis. Activity of 6—phosphogluconate
dehydrogenase was not different among rations. Mammary tissue showed
from five to six times higher activity than adipose tissue. Fat
tissue activity tended to be higher for concentrate rations compared
to roughage. No differences among rations were found for glucose
6—phosphate dehydrogenase nor isocitrate dehydrogenase. Mammary
tissue was 21 to 28 times more active than adipose tissue for latter
enzyme. Fatty acid synthetase showed no difference in acitvity due
to rations, but mammary tissue was seven to ten times more active
than adipose tissue.

![oÀ ¨µZ ]óí2 å å Au0f½âW©M N ßJ÷ 8Ï ¢´ ½ ¸ ~2Ìjóê8Rà Y ...renatomaia.net/arquivos/Facit/IC/3_Introducao_IC-IA.pdf · – Sensação, percepção, representação,](https://cdn.vdocuments.site/doc/165x107/5be5d8a409d3f288458c416d/oa-z-oi2-a-a-au0fawm-n-ssj-8i-2ijoe8ra-y-.jpg)


![· %#&WX~!YàÆòóhij"àÆMTUˆ "ö÷ •/_!Æ"% –&þ-y MœAWX~"5†‡!+ ^u"ABA /01!I’…ßA ßj"#+ Aö÷WXþ]nfl-àÆM"($)$ Aö÷‚™Cšž "))’! ⁄&—-tWX](https://cdn.vdocuments.site/doc/165x107/602609c4e43a366f661f0555/wxyhijmtu-a-a-y-mawx5aa.jpg)


