Young-Davidson Site TourJune 8, 2016

2
Cautionary Notes
No stock exchange, securities commission or other regulatory authority has approved or disapproved the information contained herein.
Certain statements in this presentation are “forward-looking statements”, including within the meaning of the United States Securities Exchange Act of 1934, as amended. All statements other than statements of historical
fact included in this presentation, including without limitation statements regarding forecast gold production, gold grades, recoveries, waste-to-ore ratios, total cash costs, potential mineralization and reserves, exploration
results, and future plans and objectives of Alamos, are forward-looking statements based on forecasts of future operational or financial results, estimates of amounts not yet determinable and assumptions of management
that involve various risks and uncertainties. Any statements that express or involve discussions with respect to predictions, expectations, beliefs, plans, projections, objectives, assumptions or future events or
performance (often, but not always, using words or phrases such as “expects” or “does not expect”, “is expected”, “anticipates” or “does not anticipate”, “plans”, “estimates” or “intends”, or stating that certain actions,
events or results “may”, “could”, “would”, “might” or “will” be taken, occur or be achieved) are not statements of historical fact and may be “forward-looking statements.” Alamos cautions that forward-looking information
involves known and unknown risks, uncertainties and other factors that may cause Alamos' actual results, performance or achievements to be materially different from those expressed or implied by such information,
including, but not limited to, gold and silver price volatility; fluctuations in foreign exchange rates and interest rates; the impact of any hedging activities; discrepancies between actual and estimated production, between
actual and estimated reserves and resources or between actual and estimated metallurgical recoveries; costs of production; capital expenditure requirements; the costs and timing of construction and development of new
deposits; and the success of exploration and permitting activities. In addition, the factors described or referred to in the section entitled “Risk Factors” in Alamos Gold Inc.’s Annual Information Form for the year ended
December 31, 2015 along with subsequent public filings available on the SEDAR website at www.sedar.com, should be reviewed in conjunction with the information found in this presentation.
Although Alamos has attempted to identify important factors that could cause actual results, performance or achievements to differ materially from those contained in forward-looking information, there can be other
factors that cause results, performance or achievements not to be as anticipated, estimated or intended. There can be no assurance that such information will prove to be accurate or that management’s expectations or
estimates of future developments, circumstances or results will materialize. Accordingly, readers should not place undue reliance on forward-looking information.
Note to U.S. Investors
Alamos prepares its disclosure in accordance with the requirements of securities laws in effect in Canada, which differ from the requirements of U.S. securities laws. Terms relating to mineral resources in this
presentation are defined in accordance with National Instrument 43-101 – Standards of Disclosure for Mineral Projects under the guidelines set out in the Canadian Institute of Mining, Metallurgy, and Petroleum
Standards on Mineral Resources and Mineral Reserves. The United States Securities and Exchange Commission (the “SEC”) permits mining companies, in their filings with the SEC, to disclose only those mineral
deposits that a company can economically and legally extract or produce. Alamos may use certain terms, such as “measured mineral resources”, “indicated mineral resources”, “inferred mineral resources” and “probable
mineral reserves” that the SEC does not recognize (these terms may be used in this presentation and are included in the public filings of Alamos, which have been filed with the SEC and the securities commissions or
similar authorities in Canada).
Cautionary non-GAAP Measures and Additional GAAP Measures
Note that for purposes of this section, GAAP refers to IFRS. The Company believes that investors use certain non-GAAP and additional GAAP measures as indicators to assess gold mining companies. They are intended
to provide additional information and should not be considered in isolation or as a substitute for measures of performance prepared with GAAP.
Additional GAAP measures that are presented on the face of the Company’s consolidated statements of comprehensive income include “Mine operating costs”, “Earnings from mine operations” and “Earnings from
operations”. These measures are intended to provide an indication of the Company’s mine and operating performance. “Cash flow from operating activities before changes in non-cash working capital” is a non-GAAP
performance measure that could provide an indication of the Company’s ability to generate cash flows from operations, and is calculated by adding back the change in non-cash working capital to “Cash provided by (used
in) operating activities” as presented on the Company’s consolidated statements of cash flows. “Free cash flow” is a non-GAAP performance measure that is calculated as cash flows from operations net of cash flows
invested in mineral property, plant and equipment and exploration and evaluation assets as presented on the Company’s consolidated statements of cash flows and that would provide an indication of the Company’s
ability to generate cash flows from its mineral projects. Return on Equity is defined as Earnings from Continuing Operations divided by the average Total Equity for the current and previous year. “Mining cost per tonne of
ore” and “Cost per tonne of ore” are non-GAAP performance measures that could provide an indication of the mining and processing efficiency and effectiveness of the mine. These measures are calculated by dividing
the relevant mining and processing costs and total costs by the tonnes of ore processed in the period. “Cost per tonne of ore” is usually affected by operating efficiencies and waste-to-ore ratios in the period. “Cash
operating costs per ounce”, “total cash costs per ounce” and “all-in sustaining costs per ounce” as used in this analysis are non-GAAP terms typically used by gold mining companies to assess the level of gross margin
available to the Company by subtracting these costs from the unit price realized during the period. These non-GAAP terms are also used to assess the ability of a mining company to generate cash flow from operations.
There may be some variation in the method of computation of these metrics as determined by the Company compared with other mining companies. In this context, “cash operating costs per ounce” reflects the cash
operating costs allocated from in-process and dore inventory associated with ounces of gold sold in the period. “Cash operating costs per ounce” may vary from one period to another due to operating efficiencies, waste-
to-ore ratios, grade of ore processed and gold recovery rates in the period. “Total cash costs per ounce” includes “cash operating costs per ounce” plus applicable royalties. Cash operating costs per ounce and total cash
costs per ounce are exclusive of exploration costs. “All-in sustaining costs per ounce” include total cash costs, exploration, corporate and administrative, share based compensation and sustaining capital costs. Non-
GAAP and additional GAAP measures do not have a standardized meaning prescribed under IFRS and therefore may not be comparable to similar measures presented by other companies. For a reconciliation of non-
GAAP and GAAP measures, please refer to Alamos’ Managements’ Discussion and Analysis as presented on SEDAR and the Company’s website.
Technical Information
Except as otherwise noted herein, Chris Bostwick, FAusIMM, Alamos Gold’s Vice President, Technical Services, has reviewed and approved the scientific and technical information contained in this presentation. Chris
Bostwick is a Qualified Person within the meaning of Canadian Securities Administrator’s National Instrument 43-101. For more information, please refer to the Alamos Gold Inc. 2015 Annual Information Form and the
technical reports referenced therein and in this presentation, available on SEDAR (www.sedar.com).
All figures in US$ unless otherwise indicated.
Cautionary Notes

3
Site Visit Schedule
7:45 AM
Operations Presentation
• Overview• Q1 2016 Results• Young-Davidson Teach-in
8:45 AM Underground Tour
11:00 PM Surface Tour
12:30 PM Group Departure

4
Safety Guidelines
Your safety is our priority
• The personal protection equipment provided to you is required in all areas:• Coveralls• Safety boots• Hard hat• Safety glasses• Ear plugs (as required)
• Please remain with the group throughout the tour
• Be sure to observe safety signage
• Keep a safe distance away from operating equipment at all times
If you have any concerns, please advise our company representatives

Overview
Jamie Porter – Chief Financial Officer

6
1 Based on 2016 Guidance2 As of March 31, 2016 3 Based on consensus analyst estimates.4 See mineral reserve and resource estimates and associated footnotes in appendix. Please refer to Cautionary Notes on non-GAAP Measures and Additional GAAP Measures.
Strong Platform for Delivering Long Term Value
Diversified gold production
370,000 – 400,000 oz from three North American mines1
Peer leading growth
Portfolio of low-cost development projects
Strong balance sheet
$283m cash and available-for-sale securities2 to support growth
Safe jurisdictions
More than 60% of valuation3 and mineral reserves4 located in Canada
Track record of delivering
shareholder value

7
715%
15%
247%
-70%
430%
930%
1430%
1930%
2430%
2003 2004 2005 2006 2007 2008 2009 2010 2011 2012 2013 2014 2015 2016
Alamos Gold Inc. (TSX:AGI) - Share Price
S&P/TSX Global Gold Index
Gold (US$/oz)
Track Record of Delivering Shareholder Value
17%Annualized return
since 2003
MULATOS: BLUEPRINT FOR SUCCESS
LEADING GROWTH PROFILE WITH DISCIPLINED M&A STRATEGY
ROE AMONG BEST IN INDUSTRY 11% Alamos five year average ROE prior to merger3
$10mcost to acquire
Mulatos in 2003
$350mfree cash flow1
generated to date
$70minitial capital raised
to build Mulatos
6development
projects
$170mtotal combined acquisition cost
10.7mcombined M&I and Inferred resources2
1 Please refer to Cautionary Notes on non-GAAP Measures and Additional GAAP Measures.2 See mineral reserve and resource estimates and associated footnotes in appendix.3 Alamos adopted AuRico Gold`s financials with the completion of the merger of the two companies in July 2015. Prior to the merger, Alamos’ five year average return on equity ending 2014 was 10.7%.

8
Best In Class Portfolio of Assets
Please refer to Cautionary Notes on non-GAAP Measures and Additional GAAP Measures.Note: Mineral resources are exclusive of mineral reserves. See mineral reserve and resource estimates and associated footnotes in appendix.
MULATOS
2016E Au Production 140-150k oz
2016E Au Total Cash Costs US$850/oz
2P Au Reserves 1.5 m oz
Total Au M&I Resources 2.8 m oz
Total Au Inf. Resources 0.5 m oz
EL CHANATE
2016E Au Production 60-70k oz
2016E Au Total Cash Costs US$1,100/oz
2P Au Reserves 0.5 m oz
Total Au M&I Resources 0.1 m oz
QUARTZ MOUNTAIN
StageAdvanced
Exploration
Total Au M&I Resources 0.3 m oz
Total Au Inf. Resources 1.1 m oz
YOUNG-DAVIDSON
2016E Au Production 170-180k oz
2016E Au Total Cash Costs US$600/oz
2P Au Reserves 3.9 m oz
Total Au M&I Resources 1.0 m oz
Total Au Inf. Resources 0.3 m oz
AĞI DAĞI
Stage Permitting
Est. Annual Production 143k oz
Est. Total Cash Costs US$611/oz
Total Au M&I Resources 1.7 m oz
Total Au Inf. Resources 0.2 m oz
Producing Assets
Exploration / Development Assets
TorontoHead Office
ESPERANZA
Stage Permitting
Est. Annual Production +100k oz
Est. Total Cash Costs ~US$500/oz
Total Au M&I Resources 1.1 m oz
KIRAZLI
Stage Permitting
Est. Annual Production 99k oz
Est. Total Cash Costs US$515/oz
Total Au M&I Resources 0.8 m oz
Total Au Inf. Resources 0.1 m oz
ÇAMYURT
Stage Resource Dev.
Total Au M&I Resources 0.5 m oz
Total Au Inf. Resources 0.1 m oz
LYNN LAKE
Stage Feasibility
Est. Annual Production 145k oz
Est. Total Cash Costs C$530/oz
Total Au M&I Resources 2.6 m oz
Total Au Inf. Resources 2.1 m oz
Diversified production Low-cost growth Safe jurisdictions

9
Core Strategy – Disciplined, Staged Growth
Mulatos – La Yaqui & Cerro Pelon Deposits
Young-Davidson Ramp-up
Near Term Focus:
Long Term Focus:
• Young-Davidson: Ramp up underground production
• Mulatos: Develop La Yaqui & Cerro Pelon deposits
• Utilize cash flow from YD & Mulatos to fund future growth
• Focus on highest return projects

2016 Guidance
11
2015A 2016E
380,000370,000 - 400,000
$1,091
$975
2015A 2016E
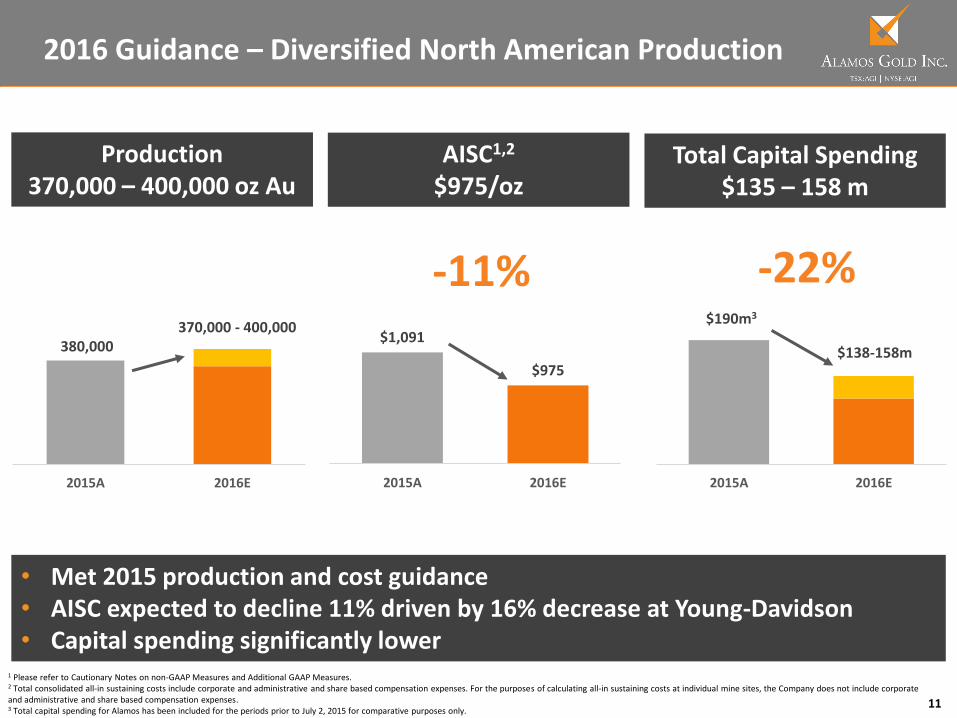
2016 Guidance – Diversified North American Production
• Met 2015 production and cost guidance• AISC expected to decline 11% driven by 16% decrease at Young-Davidson• Capital spending significantly lower
Production370,000 – 400,000 oz Au
AISC1,2
$975/oz
-11% -22%
Total Capital Spending$135 – 158 m
2015A 2016E
$190m3
$138-158m
1 Please refer to Cautionary Notes on non-GAAP Measures and Additional GAAP Measures. 2 Total consolidated all-in sustaining costs include corporate and administrative and share based compensation expenses. For the purposes of calculating all-in sustaining costs at individual mine sites, the Company does not include corporate and administrative and share based compensation expenses.3 Total capital spending for Alamos has been included for the periods prior to July 2, 2015 for comparative purposes only.

12
$1,093
$986
Q1/2015 Q1/2016
$51 m
$33 m
Q1/2015 Q1/2016
92,027 oz94,632 oz
Q1/2015 Q1/2016
Q1 2016 Results – Significantly Lower Costs and Capital
• Production on track to achieve full year guidance• AISC decreased 10% - driven by improvements at Young-Davidson & Mulatos• Capital spending decreased 35% - lower spending at Mulatos & El Chanate
Production (oz Au)
-10% -35%
Total Capital Spending3
1 Please refer to Cautionary Notes on non-GAAP Measures and Additional GAAP Measures. 2 Total consolidated all-in sustaining costs include corporate and administrative and share based compensation expenses. For the purposes of calculating all-in sustaining costs at individual mine sites, the Company does not include corporate and administrative and share based compensation expenses.3 Total capital spending for Alamos has been included for the periods prior to July 2, 2015 for comparative purposes only.
AISC1,2 (US$/oz)
+3%
Young-Davidson Teach-in
Luc Guimond – General Manager, Young-Davidson
14
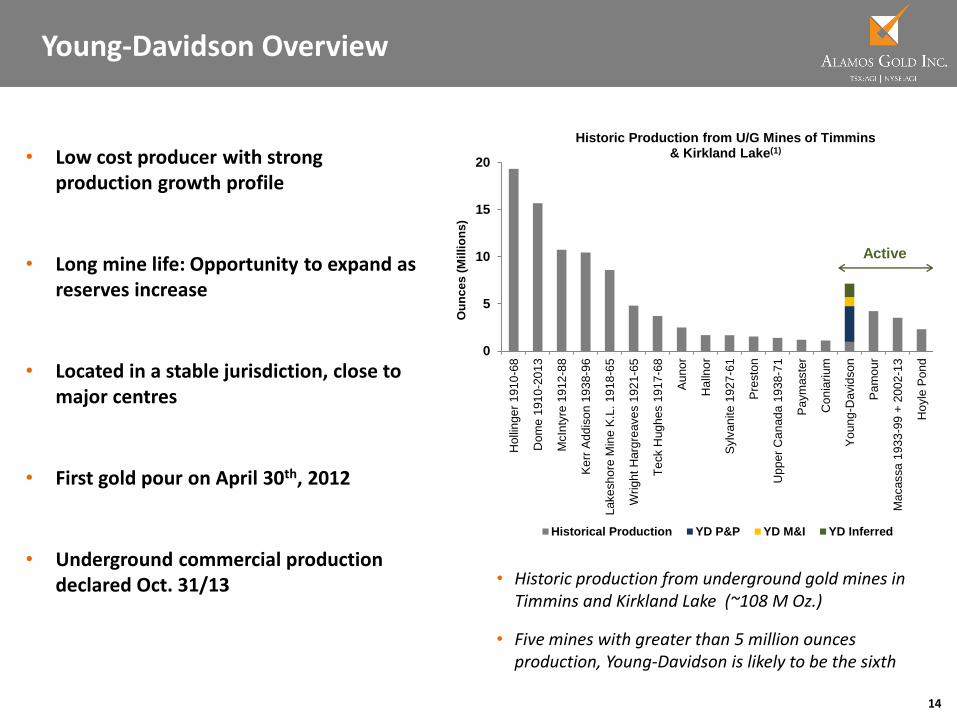
Young-Davidson Overview
• Historic production from underground gold mines in Timmins and Kirkland Lake (~108 M Oz.)
• Five mines with greater than 5 million ounces production, Young-Davidson is likely to be the sixth
• Low cost producer with strong production growth profile
• Long mine life: Opportunity to expand as reserves increase
• Located in a stable jurisdiction, close to major centres
• First gold pour on April 30th, 2012
• Underground commercial production declared Oct. 31/13
0
5
10
15
20
Holli
nge
r 1
91
0-6
8
Dom
e 1
91
0-2
01
3
McIn
tyre
19
12
-88
Ke
rr A
dd
iso
n 1
93
8-9
6
Lake
sh
ore
Min
e K
.L.
19
18
-65
Wrig
ht
Harg
reave
s 1
92
1-6
5
Te
ck H
ug
hes 1
91
7-6
8
Au
no
r
Halln
or
Sylv
an
ite 1
927
-61
Pre
sto
n
Upp
er
Ca
nad
a 1
93
8-7
1
Pa
ym
aste
r
Con
iari
um
Yo
un
g-D
avid
so
n
Pa
mo
ur
Ma
cassa
193
3-9
9 +
20
02-1
3
Hoyle
Pon
d
Ou
nc
es
(M
illi
on
s)
Historic Production from U/G Mines of Timmins & Kirkland Lake(1)
Historical Production YD P&P YD M&I YD Inferred
Active

15
Rich Tradition – Mine History
• Site of two former producers
• 20+ years in operation
• +1,200 tpd average production rate
• Early pioneers of bulk mining
• +1 million tonne stopes underground
• Mined ~9 million tonnes; produced 970,000 oz.
• Average realized grade of 3.37 g/tonne
• Profitable operations at realized grades
• Supported dividend payments
Period Mine Tonnes Grade (g/t) Produced (oz)
1934 to 1957 YD 5,653,000 3.21 585,000
1934 to 1954 MCM 3,205,000 3.66 378,000
1981 to 1982 MCM 96,400 2.36 7,300
Total 8,954,400 3.37 970,300
Young-Davidson Mine (YD)
Matachewan Consolidated Mine (MCM)

16
Responsible Mining
Fostering positive relationships with all stakeholders
• Solid safety record
• 3.7 M hours lost time injury free (~2.5 years)
• 2015 KL District Mine Rescue champions
• 2015 Provincial Mine Rescue runner up
• 2016 KL District Mine Rescue champions
• Strong First Nations support
• Partnerships with local communities
• Hiring and training locally
• 82% of mine workforce from local regions
• Supporting local suppliers
• $122 M spent with local suppliers in 2015

17
Underground Mine Plan – Highly Productive Bulk Mining
Highly Productive Mining Methods
3.8M reserve ounces with exploration upside
YD Historic
Mine Workings
Open Pit
Ramp Portal
10350L
MCM Shaft
9890L
9590L
9400L
9200L
8900L
MCM Historic
Mine Workings
NG Shaft
YD West Zone
• Highly mechanized – low manning requirements
• Transverse long hole stoping
• For wider zones (12-40m)
• 30m sub levels
• 94% of mineral reserve
• Pastefill
• Mining recovery ~ 92%
• Dilution ~10%
• Underground reserve grade 2.69 g/t
• Grades & tonnes have reconciled very well with the block model to date

18
2016 Production & Development Plan
MCM
Wastepass
East
wastepass
• MCM Shaft
o Sinking complete Q3 2015
o Men and materials shaft
o 8870 Loading Pocket installation complete
o Commissioned Q1 2016
• Planned reaming Northgate shaft begins H2 2016
• MCM waste pass in place by mid-2017

19
MCM & Northgate Shafts
MCM ShaftNorthgate Shaft
9440 L
• Capacity: ~8,500 tpd (ore + waste)
• Northgate shaft hoisting from 8900L beginning in 2019
• Capacity: ~2,000 tpd + men & materials
• Headframe/Skip/Cage changeover completed Q1 2016
• Begin skipping material from upper mine mid-2017
Total combined skipping capacity 10,500 tpd (8,000 tpd ore & 2,500 tpd waste)

20
Young-Davidson – 2016 Guidance
2015A 2016E Guidance Q1 2016A
Gold Production (k oz) 160.4 170 - 180 39.1
Total Cash Costs1 (US$/oz) $683 $600 $616
AISC1,2 (US$/oz) $986 $825 $846
Mill throughput (tpd) 7,545 7,800 7,342
Underground grade (g/t Au) 2.67 2.68 2.57
Recovery (%) 89% 90% 90%
Sustaining Capital (US$m) $47 $40-45 $9
Expansion Capital (US$m) $61 $45-50 $15
Total Capital (US$m) $108 $85-95 $24
• Production growth
• Ramp up of underground production to drive milled grade higher
• Costs substantially lower
• Productivity improvements, higher milled grade, significant exposure to weaker C$
• Capital spending lower
• Accelerated transition to owner development, buy out of capital leases, weaker C$
• FCF neutral in 2016 at $1,100/oz gold – Cash flow to fund sustaining & expansion capital
• Underground ramp up - 2016 year end target of 7,000 tpd; 8,000 tpd by mid-20171 Please refer to Cautionary Notes on non-GAAP Measures and Additional GAAP Measures.2 For the purposes of calculating all-in sustaining costs at individual mine sites, the Company does not include corporate and administrative and share based compensation expenses.

21
38,09839,065
Q1/2015 Q1/2016
$987
$846
Q1/2015 Q1/2016
$23.8 $24.0
Q1/2015 Q1/2016
• Ramp up expected to drive production higher through 2016• AISC decreased 14% YoY – expected to trend lower through 2016• Capital spending in line with budget – lower spending expected in H2 2016• Completed commissioning of MCM shaft and transition to owner development
Production (oz Au) AISC1,2 (US$/oz)
-14% +1%
Capital Spending (US$m)
1 Please refer to Cautionary Notes on non-GAAP Measures and Additional GAAP Measures. 2 Total consolidated all-in sustaining costs include corporate and administrative and share based compensation expenses. For the purposes of calculating all-in sustaining costs at individual mine sites, the Company does not include corporate and administrative and share based compensation expenses.
+3%
Young-Davidson – Q1 2016 Results

22
Young-Davidson – Historical Operational Results
1 Please refer to Cautionary Notes on non-GAAP Measures and Additional GAAP Measures.2 Excludes Net Realizable Value (“NRV”) inventory adjustments. See associated MD&A for a full reconciliation.3 Excludes hydro rebate not attributable to that quarter
• Underground mining rates – on track to achieve 7,000 tpd by end of 2016
– Q1 impacted by 5-day shutdown of underground crusher for unplanned maintenance
– Excluding 5-day shutdown, Q1 averaged 6,100 tpd
– Mining rates increased to average >6,300 tpd in April
• Mill throughput – below guidance due to temporary freezing in fine ore bins
– Liquid calcium to be added to mitigate freezing during future extreme cold temperatures
• Underground development on track – transition to owner development complete
Q1/13 Q2/13 Q3/13 Q4/13 Q1/14 Q2/14 Q3/14 Q4/14 Q1/15 Q2/15 Q3/15 Q4/15 Q1/16
Gold ounces produced 28,281 29,252 30,099 33,106 35,104 40,166 40,538 40,945 38,098 39,365 38,201 44,694 39,065
Total cash costs per oz. (1,2) $694 $716 $666 $850 $1,009 $871 $723 $719 $745 $697 $681 $617 $616
All-in sustaining costs per oz.(1,2) $1,059 $1,254 $1,357 $1,270 $1,315 $1,144 $959 $912 $987 $1,008 $979 $980 $846
Underground mine
Tonnes mined per day 1,130 1,611 1,417 2,590 2,611 3,595 3,753 4,140 4,130 5,149 5,081 5,911 5,776
Grades (g/t) 2.7 2.5 2.8 3.1 2.8 3.3 3.1 3.0 3.0 2.6 2.6 2.6 2.6
Development metres 1,941 2,445 2,620 2,986 3,772 3,545 3,269 3,438 3,409 3,789 3,619 3,769 3,490
Unit UG mining costs (US$)Pre-commercial production
$46 $45 $41 $39 $39 $33 $32 $293 $31
Unit UG mining costs (CAD$) $51 $49 $45 $44 $48 $41 $41 $383 $42
Mill processing facility
Tonnes processed per day 6,466 7,017 6,747 6,969 7,163 8,230 7,670 7,757 7,186 7,677 7,680 7,630 7,342
Grades (incl. open pit stockpile) 1.8 1.7 1.7 2.0 1.8 2.2 1.9 2.0 2.0 2.0 1.9 2.2 2.1
Recoveries (%) 86% 85% 89% 88% 87% 88% 90% 88% 86% 88% 92% 91% 90%

23
Growing production; declining costs; declining capital intensity
-
1,000
2,000
3,000
4,000
5,000
6,000
7,000
8,000
Q1/13 Q2/13 Q3/13 Q4/13 Q1/14 Q2/14 Q3/14 Q4/14 Q1/15 Q2/15 Q3/15 Q4/15 Q1/16
Mill TPD Underground TPD
>6,300 tpdAverage underground mining rate
in April 2016
Underground Ramp Up on Track
Owner developmenttransition completed in April 2016
MCM shaftcompleted commissioning Q1 2016
6,000 tpdAchieved 2015 year-end target
Please refer to Cautionary Notes on non-GAAP Measures and Additional GAAP Measures.

24
Transition to Owner Development
• Transition to 100% owner development now complete
• Reduced development costs per metre
• Higher capital of $6m in H1 2016 for equipment purchases
Utilizing balance sheet strength to accelerate
transition to owner development
Significant capital and operating savings over
next several years

25
Unit Costs & Currency Sensitivities
Unit Costs per tonne
2016 Estimates Life of Mine
Underground CAD$39 CAD$35
Mill Processing CAD$14 CAD$14
Administration1 CAD$4 CAD$4
Footnotes:1. Per tonne processed
Significant Leverage to CAD$/US$
• 90-95% of all outflows in CAD$
• $0.05 change in CAD$ would have an impact on FCF of approx. US$10M in 2016
Fixed Cost Structure:
Approx. 40% of costs are fixed

26
Capital Spending – Declining Intensity
Capital (US$m) 2016 EstimatesAnnual
Life of Mine
Sustaining $40-45 $40
Expansion $45-50 $0
Total $85-95 $40
Footnotes:1. Assumes 0.75 CAD$ to every 1 US dollar
• Declining capital intensity once 8,000 tpd achieved mid-2017
• Decrease to long term sustaining capital rate of ~$40m/year once tie in of upper and lower mine complete in 2019

27
Development Schedule
Please refer to Cautionary Notes on non-GAAP Measures and Additional GAAP Measures.
Declining capital intensity
2016 2017 2018 2019
Commissioning of MCM shaft
Transition to 100% owner development
• Ramp up to 7,000 tpd
• Raise boring of lower NG shaft
• Completion of MCM waste pass
• Ramp up to 8,000 tpd
• Shaft bottom infrastructure
• Northgate shaft hoisting from 8900L

28
Underground Tour
• U/G ore handling
• Rock breaker
• Crusher
• Loading pocket
• Remote mucking stope

29
Appendices

30
2016 Guidance – Capital Budget
2016 Guidance 2015A
Sustaining Capital Growth Capital Total TotalOperating Mines (in millions)
Young-Davidson $40-45 $45-50 $85-95 $108
Mulatos $10-15 $15-20 $25-35 $45
El Chanate $1 - $1 $14
Total – Operating Mines $51-61 $60-70 $111-131 $167
Development Projects (in millions)
Total – Development Projects - $27 $27 $23Total Consolidated Budget $51-61 $87-97 $138-158 $190
• Total capital budget of 22% lower than 2015 (based on mid-point of guidance)
• Spending focused on core – ramp up of Young-Davidson and Cerro Pelon and La Yaqui deposits at Mulatos
• Operating mines – capital spending significantly lower in 2016
• Development projects – spending curtailed; focused on key projects
Please refer to Cautionary Notes on non-GAAP Measures and Additional GAAP Measures.
31
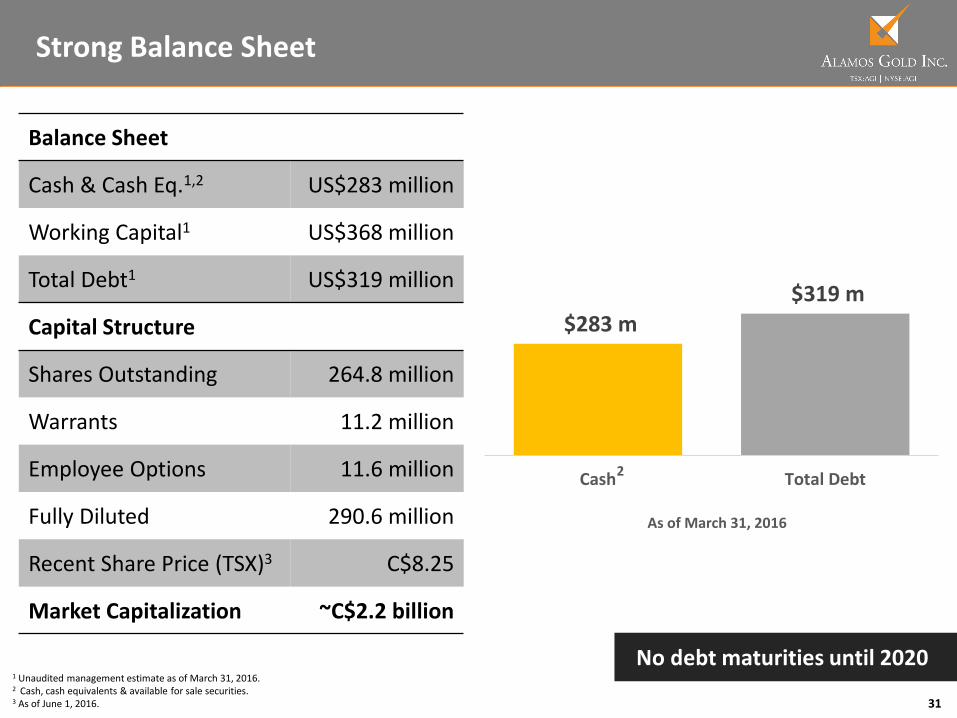
Strong Balance Sheet
1 Unaudited management estimate as of March 31, 2016.2 Cash, cash equivalents & available for sale securities.3 As of June 1, 2016.
No debt maturities until 2020
Balance Sheet
Cash & Cash Eq.1,2 US$283 million
Working Capital1 US$368 million
Total Debt1 US$319 million
Capital Structure
Shares Outstanding 264.8 million
Warrants 11.2 million
Employee Options 11.6 million
Fully Diluted 290.6 million
Recent Share Price (TSX)3 C$8.25
Market Capitalization ~C$2.2 billion
$283 m
$319 m
Cash Total Debt
As of March 31, 2016
2
32
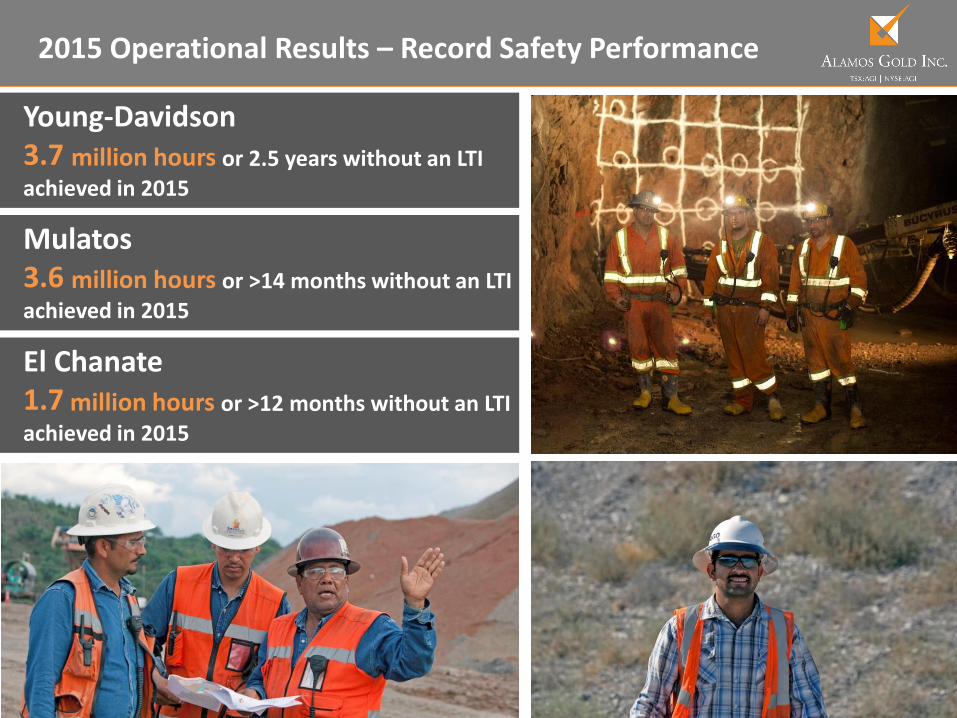
2015 Operational Results – Record Safety Performance
Young-Davidson3.7 million hours or 2.5 years without an LTI achieved in 2015
Mulatos3.6 million hours or >14 months without an LTI achieved in 2015
El Chanate1.7 million hours or >12 months without an LTI achieved in 2015

33
2015 Proven and Probable Mineral Reserves
PROVEN AND PROBABLE MINERAL RESERVES
AS AT DECEMBER 31, 2015
PROVEN PROBABLE PROVEN + PROBABLE
TONNES GRADE CONTAINED TONNES GRADE CONTAINED TONNES GRADE CONTAINED
(000) (G/T AU)OUNCES
(000)(000) (G/T AU)
OUNCES(000)
(000) (G/T AU)OUNCES
(000)
Young-Davidson
Surface 1,396 0.82 37 - 0.00 - 1,396 0.82 37
Underground 14,282 2.73 1,255 30,008 2.68 2,582 44,290 2.69 3,837
Total Young-Davidson 15,678 2.56 1,292 30,008 2.68 2,582 45,686 2.64 3,874
Mulatos
Mulatos Main Pits 5,248 0.98 165 27,654 0.85 756 32,902 0.87 921
San Carlos Underground 83 15.49 42 77 7.66 19 161 11.73 61
Stockpiles 6,485 1.45 302 - - - 6,485 1.45 302
La Yaqui 474 1.52 23 1,438 1.42 66 1,912 1.45 89
Cerro Pelon 960 1.70 53 2,293 1.59 117 3,253 1.63 170
Total Mulatos 13,251 1.37 585 31,462 0.95 958 44,713 1.07 1,543
El Chanate
El Chanate Open Pit 11,480 0.55 204 7,837 0.64 161 19,317 0.59 365
El Chanate Leach Pad Inv. - - 98 - - - - - 98
Total El Chanate 11,480 0.82 302 7,837 0.64 161 19,317 0.75 463
Total Alamos 40,409 1.68 2,178 69,307 1.66 3,702 109,716 1.67 5,880

34
2015 Total Measured and Indicated Mineral Resources
MEASURED AND INDICATED GOLD MINERAL RESOURCES (AS AT DECEMBER 31, 2015)
MEASURED RESOURCES INDICATED RESOURCES TOTAL MEASURED AND INDICATED
TONNES GRADE OUNCES TONNES GRADE OUNCES TONNES GRADE OUNCES(000'S) (G/T AU) (000'S) (000'S) (G/T AU) (000'S) (000'S) (G/T AU) (000'S)
Young-Davidson – Surface 496 1.13 18 1,242 1.28 51 1,739 1.24 69Young-Davidson – Underground 4,248 3.47 474 3,707 3.43 408 7,955 3.45 883
Total Young-Davidson 4,744 3.23 493 4,949 2.89 460 9,694 3.05 952
Mulatos 8,625 1.24 343 65,921 1.08 2,287 74,546 1.10 2,630San Carlos UG 236 6.03 46 367 5.42 64 603 5.66 110La Yaqui - - - - - - - - -
Cerro Pelon 117 2.75 10 455 2.52 37 572 2.57 47Carricito 58 0.82 2 1,297 0.82 34 1,355 0.82 36
Total Mulatos 9,036 1.38 401 68,040 1.11 2,422 77,076 1.14 2,823
El Chanate 765 0.66 16 1,563 0.95 48 2,327 0.86 64Lynn Lake 15,010 1.99 960 25,293 2.05 1,669 40,303 2.03 2,629Esperanza 19,226 1.01 622 15,126 0.95 462 34,352 0.98 1,083
Orion - - - 554 3.66 65 554 3.66 65Ağı Dağı 2,008 0.67 44 88,044 0.58 1,651 90,052 0.59 1,695Kirazli 837 1.13 31 31,897 0.71 727 32,734 0.72 758
Çamyurt 513 1.00 17 17,208 0.89 492 17,721 0.89 509Total Turkey 3,358 0.84 91 137,149 0.65 2,871 140,507 0.66 2,961Quartz Mountain 214 0.95 7 11,942 0.87 333 12,156 0.87 339
Alamos - Total 52,353 1.54 2,588 264,615 0.98 8,328 316,968 1.07 10,917
MEASURED AND INDICATED SILVER MINERAL RESOURCES (AS AT DECEMBER 31, 2015)
MEASURED RESOURCES INDICATED RESOURCES TOTAL MEASURED AND INDICATED
TONNES GRADE OUNCES TONNES GRADE OUNCES TONNES GRADE OUNCES
(000'S) (G/T AG) (000'S) (000'S) (G/T AG) (000'S) (000'S) (G/T AG) (000'S)
Esperanza 19,226 7.25 4,482 15,126 9.16 4,455 34,352 8.09 8,936
Orion - - - 554 309 5,503 554 309 5,503
Ağı Dağı 2,008 4.87 314 88,044 4.07 11,535 90,052 4.09 11,849
Kirazli 837 12.79 344 31,897 8.64 8,857 32,734 8.74 9,202
Çamyurt 513 5.63 93 17,208 6.15 3,404 17,721 6.14 3,496
Alamos - Total 22,584 7.21 5,233 152,829 6.87 33,754 175,413 6.91 38,987

35
2015 Total Inferred Mineral Resources
INFERRED GOLD MINERAL RESOURCES (AS AT DECEMBER 31, 2015)
TONNES GRADE OUNCES
(000'S) (G/T AU) (000'S)
Young-Davidson - Surface 31 0.99 1
Young-Davidson - Underground 3,523 2.76 312
Total Young-Davidson 3,554 2.74 313
Mulatos 7,078 0.90 205
San Carlos UG 162 4.93 26
La Yaqui 5,087 1.42 232
Cerro Pelon 109 1.23 4
Carricito 900 0.74 22
Total Mulatos 13,336 1.14 489
El Chanate 101 0.36 1
Lynn Lake 50,704 1.28 2,089
Esperanza 718 0.80 18
Orion 91 3.33 10
Ağı Dağı 16,760 0.46 245
Kirazli 5,689 0.59 108
Çamyurt 2,791 0.95 85
Total Turkey 25,240 0.54 438
Quartz Mountain 39,205 0.91 1,147
Alamos - Total 132,949 1.05 4,506
INFERRED SILVER MINERAL RESOURCES (as at DECEMBER 31, 2015)
TONNES GRADE OUNCES
(000'S) (G/T AG) (000'S)
Esperanza 718 15.04 347
Orion 91 95.00 275
Ağı Dağı 16,760 2.85 1,534
Kirazli 5,689 8.96 1,638
Çamyurt 2,791 5.77 518
Alamos - Total 26,049 5.15 4,312
36
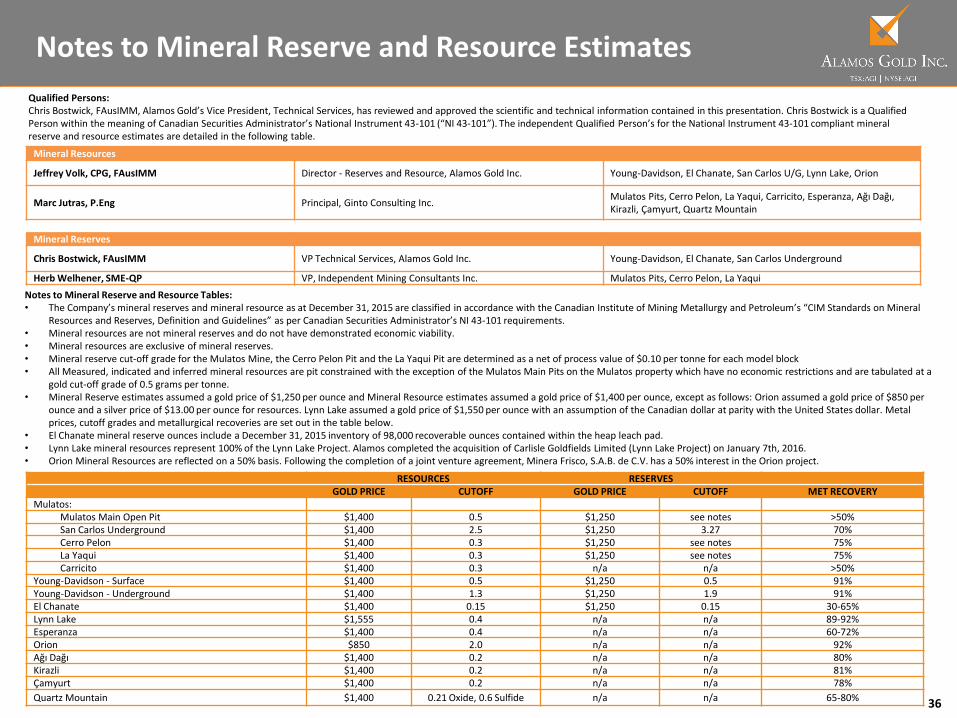
Notes to Mineral Reserve and Resource Estimates
Notes to Mineral Reserve and Resource Tables:• The Company’s mineral reserves and mineral resource as at December 31, 2015 are classified in accordance with the Canadian Institute of Mining Metallurgy and Petroleum’s “CIM Standards on Mineral
Resources and Reserves, Definition and Guidelines” as per Canadian Securities Administrator’s NI 43-101 requirements. • Mineral resources are not mineral reserves and do not have demonstrated economic viability.• Mineral resources are exclusive of mineral reserves.• Mineral reserve cut-off grade for the Mulatos Mine, the Cerro Pelon Pit and the La Yaqui Pit are determined as a net of process value of $0.10 per tonne for each model block• All Measured, indicated and inferred mineral resources are pit constrained with the exception of the Mulatos Main Pits on the Mulatos property which have no economic restrictions and are tabulated at a
gold cut-off grade of 0.5 grams per tonne.• Mineral Reserve estimates assumed a gold price of $1,250 per ounce and Mineral Resource estimates assumed a gold price of $1,400 per ounce, except as follows: Orion assumed a gold price of $850 per
ounce and a silver price of $13.00 per ounce for resources. Lynn Lake assumed a gold price of $1,550 per ounce with an assumption of the Canadian dollar at parity with the United States dollar. Metal prices, cutoff grades and metallurgical recoveries are set out in the table below.
• El Chanate mineral reserve ounces include a December 31, 2015 inventory of 98,000 recoverable ounces contained within the heap leach pad.• Lynn Lake mineral resources represent 100% of the Lynn Lake Project. Alamos completed the acquisition of Carlisle Goldfields Limited (Lynn Lake Project) on January 7th, 2016.• Orion Mineral Resources are reflected on a 50% basis. Following the completion of a joint venture agreement, Minera Frisco, S.A.B. de C.V. has a 50% interest in the Orion project.
Qualified Persons:Chris Bostwick, FAusIMM, Alamos Gold’s Vice President, Technical Services, has reviewed and approved the scientific and technical information contained in this presentation. Chris Bostwick is a Qualified Person within the meaning of Canadian Securities Administrator’s National Instrument 43-101 (“NI 43-101”). The independent Qualified Person’s for the National Instrument 43-101 compliant mineral reserve and resource estimates are detailed in the following table.
Mineral Resources
Jeffrey Volk, CPG, FAusIMM Director - Reserves and Resource, Alamos Gold Inc. Young-Davidson, El Chanate, San Carlos U/G, Lynn Lake, Orion
Marc Jutras, P.Eng Principal, Ginto Consulting Inc.Mulatos Pits, Cerro Pelon, La Yaqui, Carricito, Esperanza, Ağı Dağı, Kirazli, Çamyurt, Quartz Mountain
Mineral Reserves
Chris Bostwick, FAusIMM VP Technical Services, Alamos Gold Inc. Young-Davidson, El Chanate, San Carlos Underground
Herb Welhener, SME-QP VP, Independent Mining Consultants Inc. Mulatos Pits, Cerro Pelon, La Yaqui
RESOURCES RESERVESGOLD PRICE CUTOFF GOLD PRICE CUTOFF MET RECOVERY
Mulatos:Mulatos Main Open Pit $1,400 0.5 $1,250 see notes >50%San Carlos Underground $1,400 2.5 $1,250 3.27 70%Cerro Pelon $1,400 0.3 $1,250 see notes 75%La Yaqui $1,400 0.3 $1,250 see notes 75%Carricito $1,400 0.3 n/a n/a >50%
Young-Davidson - Surface $1,400 0.5 $1,250 0.5 91%Young-Davidson - Underground $1,400 1.3 $1,250 1.9 91%El Chanate $1,400 0.15 $1,250 0.15 30-65%Lynn Lake $1,555 0.4 n/a n/a 89-92%Esperanza $1,400 0.4 n/a n/a 60-72%Orion $850 2.0 n/a n/a 92%Ağı Dağı $1,400 0.2 n/a n/a 80%Kirazli $1,400 0.2 n/a n/a 81%Çamyurt $1,400 0.2 n/a n/a 78%
Quartz Mountain $1,400 0.21 Oxide, 0.6 Sulfide n/a n/a 65-80%


