YIELD POTENTIAL ESTIMATION IN GRAIN
SORGHUM (Sorghum bicolor L.), AND EFFECTS
OF PLANT HEIGHT, SENSING ANGLE AND
HEIGHT ON YIELD PREDICTION
OF CORN (Zea mays. L)
By
SHAMBEL MARU MOGES
Bachelor of Science
Awassa College of Agriculture Awassa, Ethiopia
1997
Master of Science Oklahoma State University Stillwater, Oklahoma, USA
2002
Submitted to the Faculty of the Graduate College of
Oklahoma State University in partial fulfillment of the requirements for
the Degree of DOCTOR OF PHILOSOPHY
December 2005

YIELD POTENTIAL ESTIMATION IN GRAIN
SORGHUM (Sorghum bicolor L.), AND EFFECTS
OF PLANT HEIGHT, SENSING ANGLE AND
HEIGHT ON YIELD PREDICTION
OF CORN (Zea mays. L)
Dissertation Approved: Dr. William B Raun______________
Thesis Advisor Dr. Haillin Zhang________________ Dr. John B. Solie_______________ Dr. Marvin S. Stone_____________ D r. Al Carlozzi_________________
Dean of the Graduate College
ii

ACKNOWLEDGEMENTS I would like to express my appreciation to the Department of Plant and
Soil Sciences of Oklahoma State University for giving me the opportunity to
pursue a PhD program. My utmost sincere thanks go to my advisor Dr. William
R. Raun along with his family for his leadership, guidance, encouragement, and
help in every regard of my study. This would not be possible without him. It has
been a privilege to work and learn within the soil fertility project team. I would
like to extend my heart felt gratitude to all members of the OSU Soil Fertility
program especially: Dr. Kyle Freeman, Dr. Kefyalew Girma, Dr. Roger Teal, Dr.
Jagadeesh Mosali, Brain Arnal, Clint Mack, Star Holtz, Brenda Tubana, Olga
Walsh and Chung Byungkyun for their help, support and friendship. My sincere
thanks also extended to my committee members Dr. Hailin Zhang for his
comments and suggestions, to Dr. John B. Solie and Dr. Marvin L. Stone from
the Biosystems and Agricultural Engineering Department. My special thanks go
to Mrs. Tanya Raun, Essie Raun’s family, and for their constant encouragement
and priceless support from day one to the end of my study.
Finally, I would like to thank my wife Tigest Aweke for her continuous help
and encouragement, support and taking care of our daughters Megan and Ruth
with all her amazing patience.
iii
TABLE OF CONTENTS
Chapter Page
I. YIELD POTENTIAL ESTIMATION IN GRAIN SORGHUM AT DIFFERENT LEVELS OF NITROGEN FERTILIZER USING A HAND HELD OPTICAL SENSOR………………………….…..…………..1
Abstract…..…………………………………………………………….….1
Introduction…………………………………………………………….….2
Role of CV in midseason grain yield estimation…………….…..…….8
Materials and Methods………………………………………...............10
Experimental Design and Treatment Structure ..…………......10 Sensor measurements.…………………………………….…….11 Grain yield sampling………………………………………………13
Data Analysis.. ………………………………...………………….13
Results……………………………………………………………………15 Grain yield...………………………………………………………..15 Crop year 2004………………………………………………..15
Crop year 2005………………………………………..………15 Sensor measurements. ..…………………………………………16 Crop year 2004………………………………………………..16
Crop year 2005…………………..……………………………17
Discussion………………………………………………………………..18 Grain yield…………………………………………………………18 Sensor measurements …………..….…………………………..19
Conclusions.……………………………………..………………..….....22
References……………………………………………………...……….23
iv
Chapter Page
II. EFFECT OF PLANT HEIGHT, SENSING ANGLE AND SENSING HEIGHT ON PREDICTION OF CORN (Zea mays L.)GRAIN YEILD
AND NITROGEN CONTENT....................................................................43
Abstract .... …………………………………………………….……….43
Introduction…………………………………………………….……….44
Materials and Methods……………………….…………….………....50 Sensing height and angle experiment…………………………..50
Effect of plant height on grain yield.…………………….....…...51
Results and Discussion..………………..……………………...........54 Plant height and grain yield………………………………….…..54 Crop year 2004…………………………………………..…..54 Crop year 2005………………………………………………55 Sensing height and angle…………………….………………….56
Conclusions…………………………………………...…..……………58
References……….…………………………………………………….59
Appendices……….…………………………..……….……………….72
v
LIST OF TABLES
CHAPTER I
Table Page
1. Initial surface (0-15 cm) test soil characteristics of the experimental plots at Efaw, Hennessey and Lake Carl Blackwell, OK, 2004-2005…………………………………………………….27
2. Treatment structure for sorghum yield potential study experiments at Efw , Lake Carl Blackwell and Hennessey, OK, 20004 and 2005……………………………………………….…………..27
3. Average grain yield of sorghum yield potential experiments
at Lake Carl Blackwell, Hennessey and Efaw, OK, 2004 and 2005……………………………………………………………………………..28
4. Test of significance using single degree o freedom non- orthogonal contrasts of overall N treatments for grain yield at Efaw, Hennessey and Lake Carl Blackwell, OK, in 2004 and 2005………………………………………………………………………..29
CHAPTER II
1. Average corn height (cm) and corn by-plant yield for five transects at three growth stages and two locations at Efaw and Perkins, OK, 2004…………... ……………………………….………………………….62
2. Minimum, maximum, mean, standard deviation and CV for by-plant corn grain yields for individual transects at Efaw and Perkins, OK, 2004………………………………………………………………. ..………56 3. Average corn plant height (cm) and corn by-plant yield for five
transects at three growth stages and two locations at Efaw and Lake Carl Blackwell, OK, 2005…….………………………………………... 57
vi
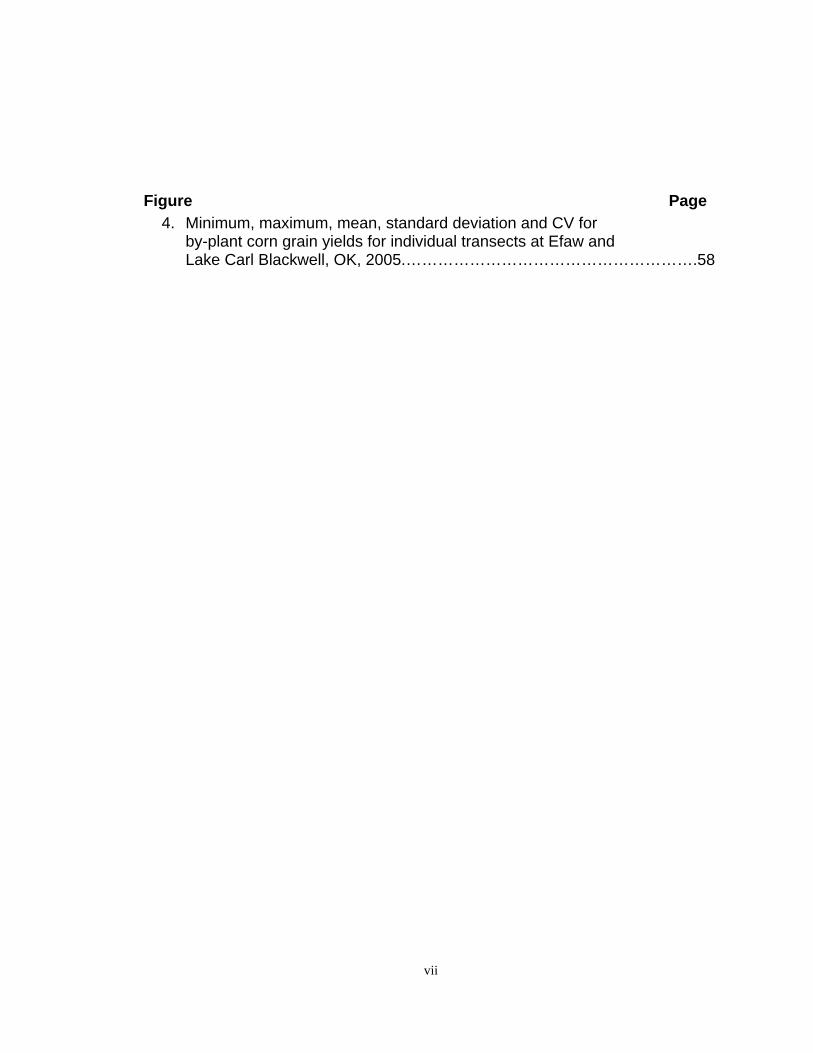
Figure Page 4. Minimum, maximum, mean, standard deviation and CV for
by-plant corn grain yields for individual transects at Efaw and Lake Carl Blackwell, OK, 2005.……………………………………………….58
vii
LIST OF FIGURES
CHAPTER I
Figure Page
1. Relationship of RNDVI and Sorghum grain yield at growth stage 3 at Efaw and Lake Carl Blackwell, OK, 2004..…...……………….…….30
2. Relationship of GNDVI and sorghum grain yield at growth stage 3 at Efaw and Lake Carl Blackwell, OK, 2004……………………………30
3. Relationship of red INSEY and sorghum grain yield at growth stage 3 at Efaw and Lake Carl Blackwell, OK, 2004………..………….31
4. Relationship of green INSEY and sorghum grain yield at growth stage 3 at Efaw and Lake Carl Blackwell, OK, 2004..……..……….…31 5. Relationship of RNDVI and sorghum grain N uptake at growth stage 3 at Efaw and Lake Carl Blackwell, OK, 2004..……..………… 32 6. Relationship of GNDVI and sorghum grain N uptake at growth stage 3 at Efaw and Lake Carl Blackwell, OK, 2004……….….………32 7. Relationship of red CV and sorghum grain yield at growth stage 3 at Efaw and Lake Carl Blackwell, OK, 2004…...……………………….33 8. Relationship of green CV and sorghum grain yield at growth stage 3 at Efaw and Lake Carl Blackwell, OK, 2004………..………....33 9. Relationship of CV and RNDVI at growth stage 2 at Efaw and Lake Carl Blackwell, OK, 2004.....……….………………34
10. Relationship of CV and GNDVI at growth
stage 2 at Efaw and Lake Carl Blackwell, OK, 2004..…………………………34 11. Relationship of CV and GNDVI at growth stage 3 at Efaw and Lake Carl Blackwell, OK, 2004………………………………………….….……35 12. Relationship of RNDVI and grain yield at sorghum growth stage 2 at Efaw and Hennessey, OK, 2005………………………………….…35
viii

Figure Page 13. Relationship of RNDVI and grain yield at sorghum growth stage 3 at Efaw and Hennessey, OK, 2005……………………………………36 14. Relationship of GNDVI and grain yield at sorghum growth stage 3 at Efaw and Hennessey, OK, 2005………………………..…………..36 15. Relationship of RNDVI and CV at sorghum growth stage 2 at Efaw, Hennessey and Lake Carl Blackwell, OK, 2005……....…………….….37
16. Relationship of CV and RNDVI at sorghum growth stage 3 at Efaw, Hennessey and Lake Carl Blackwell, OK, 2005…...……………………37 17. Relationship of CV and RNDVI at sorghum growth stage 5 at Efaw, Hennessey and Lake Carl Blackwell, OK, 2005……..………………....38 18. Relationship of CV and RNDVI at sorghum growth stage 6 at Efaw, Hennessey and Lake Carl Blackwell, OK, 2005……………….……….38 19. Relationship of CV and GNDVI at sorghum growth stage 3 at Efaw, Hennessey and Lake Carl Blackwell, OK, 2005…………………….….39 20. Relationship of CV and GNDVI at sorghum growth stage 5 at Efaw, Hennessey and Lake Carl Blackwell, OK, 2005 ...….……………….…39
21. Relationship of CV and GNDVI at sorghum growth stage 6 at Efaw, Hennessey and Lake Carl Blackwell, OK, 2005……… . …………..….40 22. Relationship of CV and GNDVI at sorghum growth stage 7 at Hennessey and Lake Carl Blackwell, OK, 2005………………………….……40 23. Relationship of RNDVI and grain yield at growth stage 3 combined overall locations and years, 2004-2005……..……………..….……41 24. Relationship of GNDVI and grain yield at growth stage 3 combined overall locations and years, 2004-2005……………..….…………..41 25. Relationship of green INSEY and grain yield at growth stage 3 combined overall locations and years, 2004-2005……..……………..….……42
ix

Figure Page 26. Relationship of red INSEY and grain yield at growth stage 3 combined overall locations and years, 2004-2005……..……………..….……42
CHAPTER II
1. By-plant corn grain yield per area and plant height relationship at
growth stage VT at Eaw , OK, 2004...…………….…..…………………………67 2. By-plant corn grain yield (grams per plant) and plant height
relationship at growth stage VT at Efaw, OK, 2004..………………….……….67
3. By-plant corn grain yield per area and plant height relationship at growth stage R1 at Perkins, OK, 2004…………………………68
4. By-plant corn grain yield (grams per plant) and plant height relationship at growth stage R1 at Perkins, OK, 2004…………………………68
5. By-plant corn grain yield per area and plant height relationship
at growth stage VT at Efaw, OK, 2005…………………………………………..69 6. By-plant corn grain yield (grams per plant) and plant height
relationship at growth stage VT at Efaw, OK, 2004……….……………….…..69 7. Grain yield and NDVI relationship at growth stage V8 at different
sensing height and angle combination at Efaw and Perkins, OK, 2004..……70 8. Grain yield and NDVI relationship at growth stage VT at different
sensing height and angle combination at Efaw and Perkins, OK, 2004..……70 9. Grain yield and NDVI relationship at growth stage R1 at different
sensing height and angle combination at Efaw and Perkins, OK, 2004……..71
x
CHAPTER I
YIELD POTENTIAL ESTIMATION IN GRAIN SORGHUM (Sorghum bicolor L.)
ABSTRACT
Sensor based nitrogen management helped to improve fertilizer
recommendations for various crops. The objective of this study was to estimate
the yield potential of grain sorghum (Sorghum bicolor L. Moench) at different
nitrogen levels using a self illuminated hand held optical sensor designed at
Oklahoma State University. A total of six experiments with four levels of nitrogen
(50,100,150,200 kg ha-1) and there types of applications (Preplant, topdress and
split) were arranged in a randomized complete block design in three replications
at Efaw, Lake Carl Blackwell and Hennessey, OK in summers of 2004 and 2005.
Sensor readings were taken using red (650 10 nm full width half magnitude
(FWHM)) and green (550 + 12.5 nm FWHM) head sensors at five growth stages
(2, 3, 5, 6 and 7) from two middle rows out of four rows in each experimental unit.
Results from statistical analysis have shown that sorghum grain yield and grain
nitrogen content are highly correlated to both green and red NDVI readings at
growth stage 3. In-season estimated yield (INSEY) was also found highly
correlated with final grain yield. Over all results of these experiments suggest that
1

INSEY can be used as a tool to predict yield and to determine mid-season
fertilizer N rate.
INTRODUCTION
Grain sorghum (Sorghum bicolor L. Moench) is grown on 42 million hectar
worldwide and 3.6 million hectar in the United States (FAO, 2002). It is a major
feed ingredient for both cattle and poultry in the United States, and it is grown for
grain or silage in different parts of the Southern Great Plains. Research with
grain sorghum, a relatively low acreage crop to Oklahoma, has shown sorghum
to be a more water-use-efficient-crop than corn (Zea mays L.). It has been
recognized as a more drought tolerant crop (Bennett et al., 1990; Khosla et al.,
1995) and an alternative to corn and grows best in places with warm conditions
with low moisture and high temperatures. Sorghum is generally grown in rotation
with winter wheat (Triticum aestivum L.) and often double cropped with soybeans
(Glycine max). However, in-sufficient data on N fertilization of grain sorghum are
available for this region.
Successful crop growth is achieved through proper management of
necessary mineral nutrients required by the crop. One of the most demanded
nutrients by sorghum is nitrogen. Every cropping season substantial amount of N
fertilizer is applied to sorghum due to its high biomass production. In fact,
efficient utilization of nitrogen by crops is often governed by the cumulative
effects of different factors including available soil moisture, fertilization time and
growth stage of the crop. Devising a nutrient management program which
2
synchronizes these factors to recommend optimum rates of nitrogen (N) for
maximum economic yield has always been a challenge (Mengel et al., 1982;
Touchton and Hargrove, 1982; Rao and Dao, 1992). Besides economic
consequences, excess N fertilization may result in contamination of surface and
ground water (Feinerman et al., 1990).
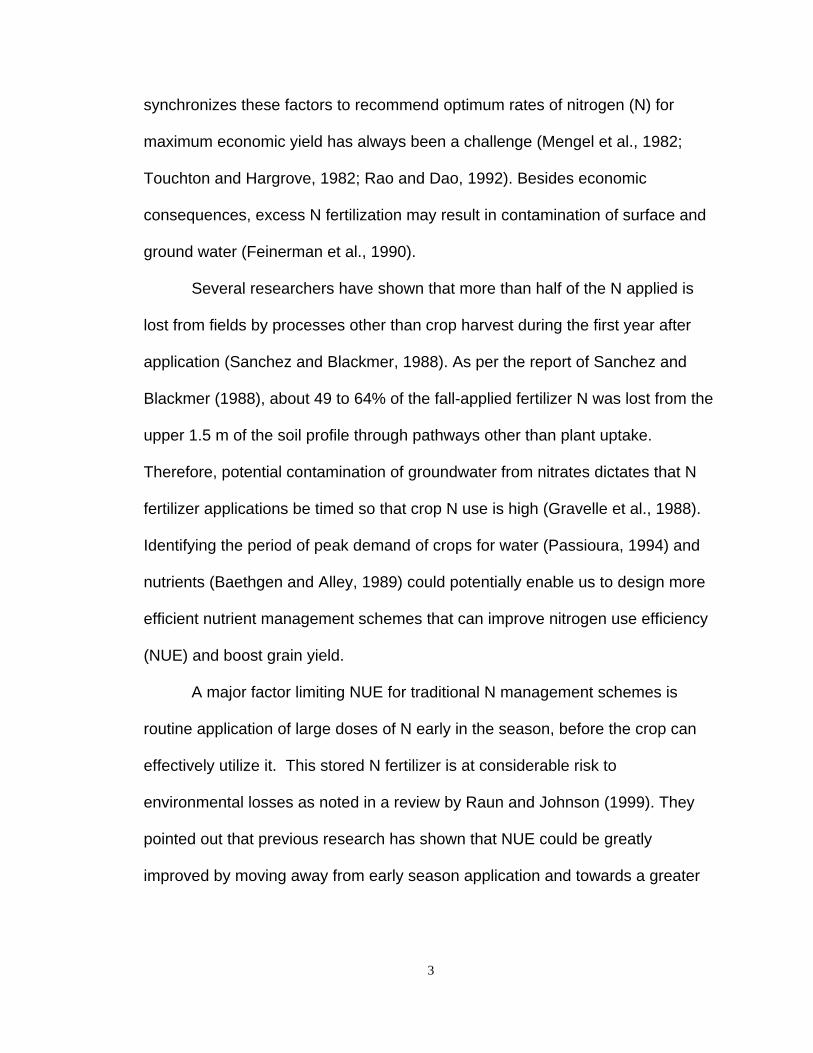
Several researchers have shown that more than half of the N applied is
lost from fields by processes other than crop harvest during the first year after
application (Sanchez and Blackmer, 1988). As per the report of Sanchez and
Blackmer (1988), about 49 to 64% of the fall-applied fertilizer N was lost from the
upper 1.5 m of the soil profile through pathways other than plant uptake.
Therefore, potential contamination of groundwater from nitrates dictates that N
fertilizer applications be timed so that crop N use is high (Gravelle et al., 1988).
Identifying the period of peak demand of crops for water (Passioura, 1994) and
nutrients (Baethgen and Alley, 1989) could potentially enable us to design more
efficient nutrient management schemes that can improve nitrogen use efficiency
(NUE) and boost grain yield.
A major factor limiting NUE for traditional N management schemes is
routine application of large doses of N early in the season, before the crop can
effectively utilize it. This stored N fertilizer is at considerable risk to
environmental losses as noted in a review by Raun and Johnson (1999). They
pointed out that previous research has shown that NUE could be greatly
improved by moving away from early season application and towards a greater
3
emphasis on mid-season applications of N fertilizer in amounts that better
coincide with crop needs.
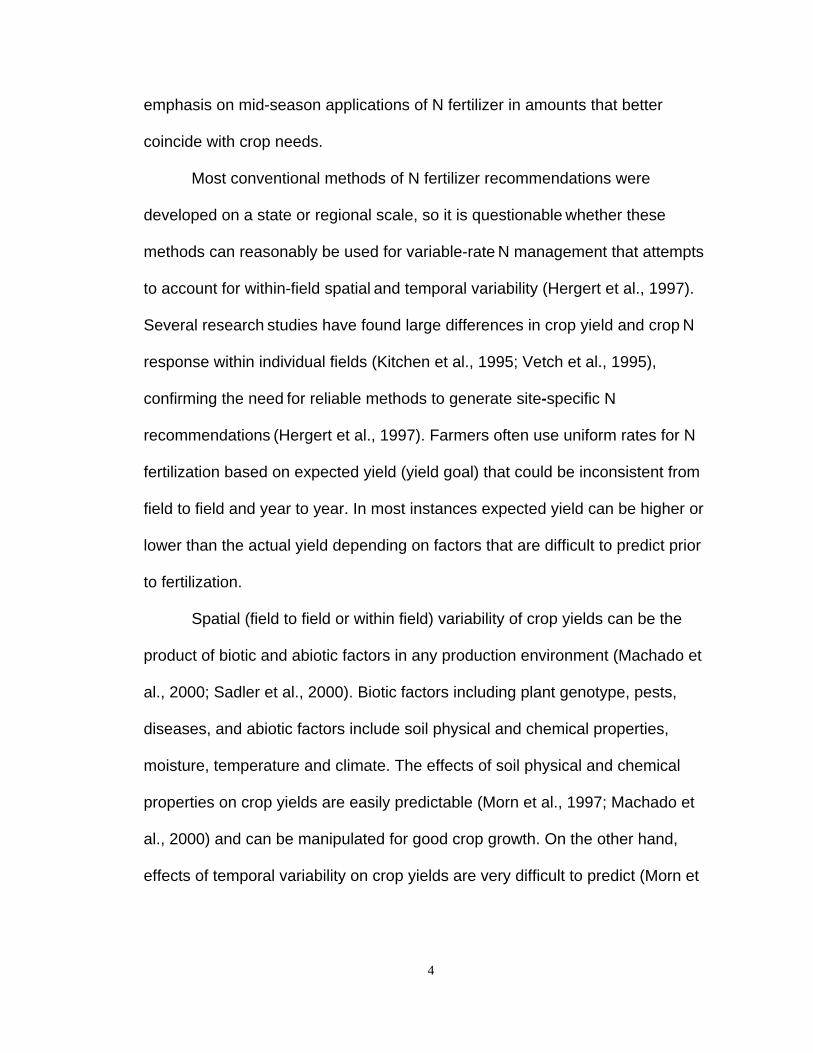
Most conventional methods of N fertilizer recommendations were
developed on a state or regional scale, so it is questionable whether these
methods can reasonably be used for variable-rate N management that attempts
to account for within-field spatial and temporal variability (Hergert et al., 1997).
Several research studies have found large differences in crop yield and crop N
response within individual fields (Kitchen et al., 1995; Vetch et al., 1995),
confirming the need for reliable methods to generate site-specific N
recommendations (Hergert et al., 1997). Farmers often use uniform rates for N
fertilization based on expected yield (yield goal) that could be inconsistent from
field to field and year to year. In most instances expected yield can be higher or
lower than the actual yield depending on factors that are difficult to predict prior
to fertilization.
Spatial (field to field or within field) variability of crop yields can be the
product of biotic and abiotic factors in any production environment (Machado et
al., 2000; Sadler et al., 2000). Biotic factors including plant genotype, pests,
diseases, and abiotic factors include soil physical and chemical properties,
moisture, temperature and climate. The effects of soil physical and chemical
properties on crop yields are easily predictable (Morn et al., 1997; Machado et
al., 2000) and can be manipulated for good crop growth. On the other hand,
effects of temporal variability on crop yields are very difficult to predict (Morn et
4
al., 1997; Machado et al., 2000) and could have substantial impact on nutrient
budget of the crop.
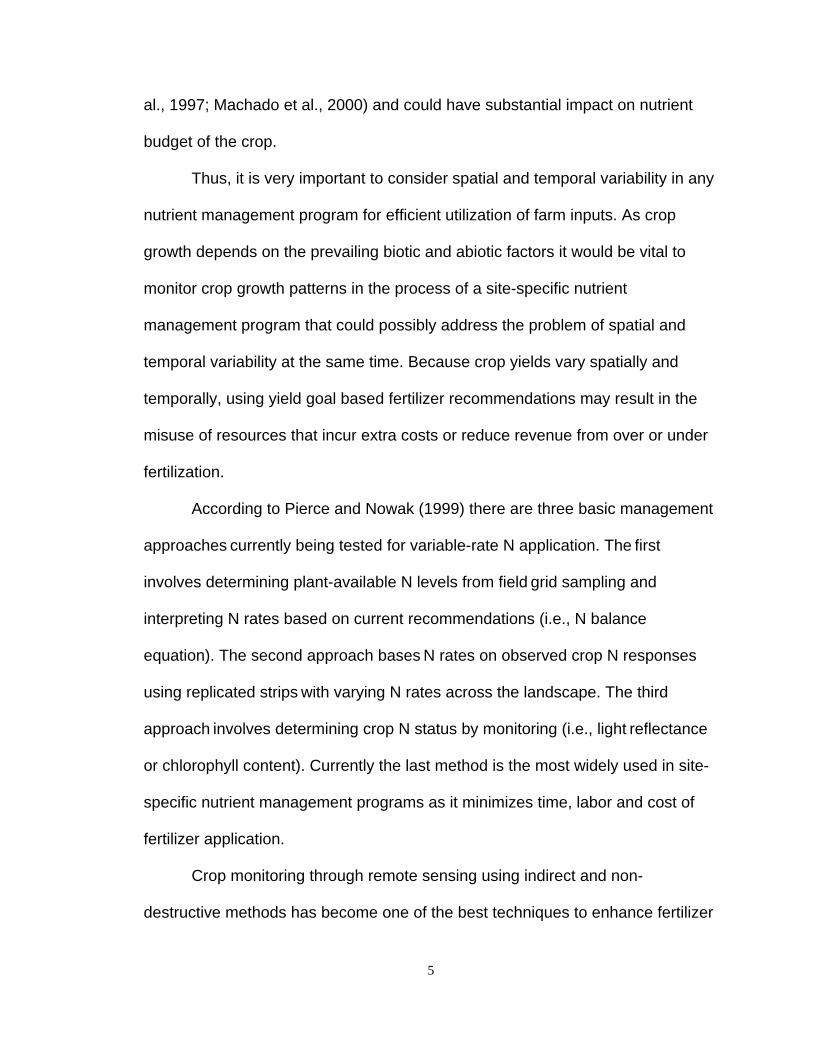
Thus, it is very important to consider spatial and temporal variability in any
nutrient management program for efficient utilization of farm inputs. As crop
growth depends on the prevailing biotic and abiotic factors it would be vital to
monitor crop growth patterns in the process of a site-specific nutrient
management program that could possibly address the problem of spatial and
temporal variability at the same time. Because crop yields vary spatially and
temporally, using yield goal based fertilizer recommendations may result in the
misuse of resources that incur extra costs or reduce revenue from over or under
fertilization.
According to Pierce and Nowak (1999) there are three basic management
approaches currently being tested for variable-rate N application. The first
involves determining plant-available N levels from field grid sampling and
interpreting N rates based on current recommendations (i.e., N balance
equation). The second approach bases N rates on observed crop N responses
using replicated strips with varying N rates across the landscape. The third
approach involves determining crop N status by monitoring (i.e., light reflectance
or chlorophyll content). Currently the last method is the most widely used in site-
specific nutrient management programs as it minimizes time, labor and cost of
fertilizer application.
Crop monitoring through remote sensing using indirect and non-
destructive methods has become one of the best techniques to enhance fertilizer
5

application on-the-go as it avoids cumbersome activities like soil sampling and
processing. Early research by Colwell (1956) showed that infrared aerial
photography could be used to detect loss of vigor from disease in wheat (Triticum
aestivum L.) and other small grains. One of the earliest digital remote-sensing
analysis procedures developed to identify the vegetation contribution in an image
was the ratio vegetation index , created by dividing near-infrared reflectance
(NIR) by red reflectance (Jordan, 1969). The basis of this relationship is the
strong absorption (low reflectance) of red light by chlorophyll and low absorption
(high reflectance and transmittance) in the NIR by green leaves (Avery and
Berlin, 1992). Dense green vegetation produces a high ratio while soil has a low
value, thus yielding a contrast between the two surfaces. The red normalized
difference vegetation index (RNDVI), where RNDVI = (NIR - Red)/(NIR + Red),
was originally proposed as a means of estimating green biomass (Tucker, 1979).
The basis for the relationship between NDVI and green biomass appears to be
related to the amount of photosynthetically active radiation absorbed by the
canopy (Sellers, 1985). The NDVI relates the reflectance in the red region (near
chlorophyll a absorption max.) and NIR region to vegetation variables such as
leaf area index, canopy cover, and the concentration of total chlorophyll.
Numerous researchers (Teillet, 1992; Wade et al., 1994; Ramsey et al.,
1995; Roderick et al., 1996) have utilized NDVI, derived from a very high
resolution radiometer collected from satellite platforms, to assess the health and
condition of crops and natural vegetation over large geographical regions.
Alternatively, Gitelson et al. (1996) proposed the use of the green normalized
6
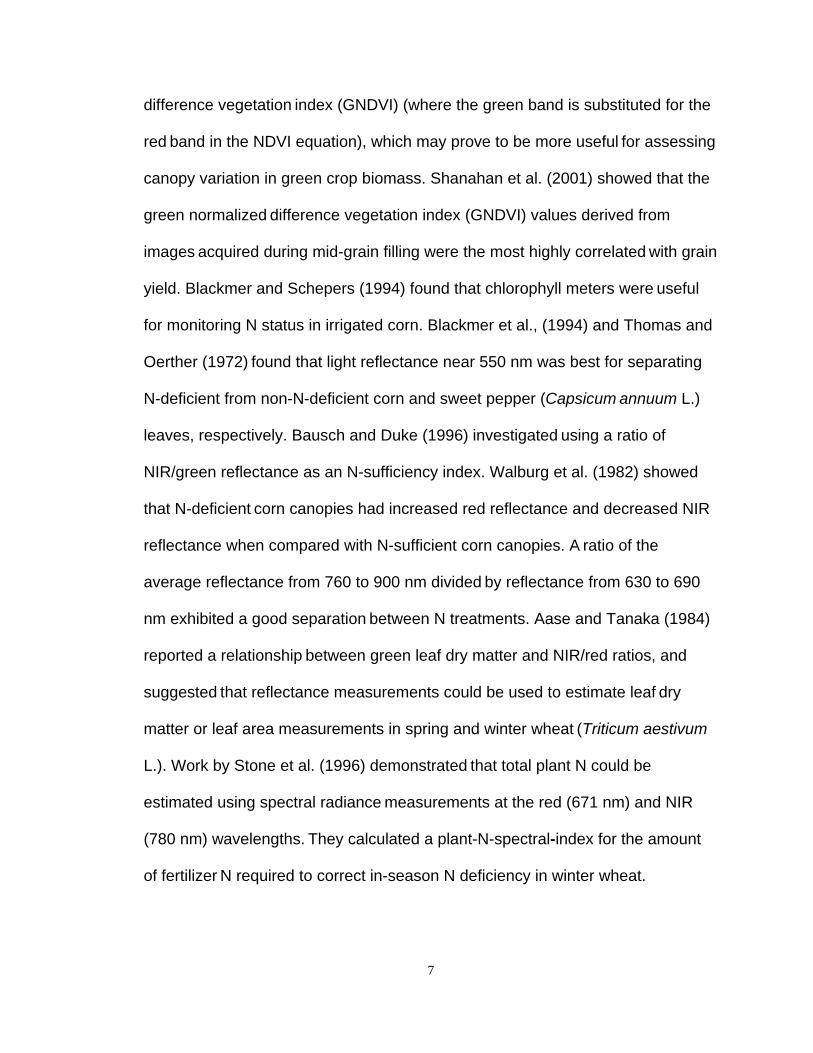
difference vegetation index (GNDVI) (where the green band is substituted for the
red band in the NDVI equation), which may prove to be more useful for assessing
canopy variation in green crop biomass. Shanahan et al. (2001) showed that the
green normalized difference vegetation index (GNDVI) values derived from
images acquired during mid-grain filling were the most highly correlated with grain
yield. Blackmer and Schepers (1994) found that chlorophyll meters were useful
for monitoring N status in irrigated corn. Blackmer et al., (1994) and Thomas and
Oerther (1972) found that light reflectance near 550 nm was best for separating
N-deficient from non-N-deficient corn and sweet pepper (Capsicum annuum L.)
leaves, respectively. Bausch and Duke (1996) investigated using a ratio of
NIR/green reflectance as an N-sufficiency index. Walburg et al. (1982) showed
that N-deficient corn canopies had increased red reflectance and decreased NIR
reflectance when compared with N-sufficient corn canopies. A ratio of the
average reflectance from 760 to 900 nm divided by reflectance from 630 to 690
nm exhibited a good separation between N treatments. Aase and Tanaka (1984)
reported a relationship between green leaf dry matter and NIR/red ratios, and
suggested that reflectance measurements could be used to estimate leaf dry
matter or leaf area measurements in spring and winter wheat (Triticum aestivum
L.). Work by Stone et al. (1996) demonstrated that total plant N could be
estimated using spectral radiance measurements at the red (671 nm) and NIR
(780 nm) wavelengths. They calculated a plant-N-spectral-index for the amount
of fertilizer N required to correct in-season N deficiency in winter wheat.
7

The majority of sorghum N research has focused on preplant and in-
season fertilization regardless of the prevailing soil-plant nutrient status within the
growing season. Observations during the grain sorghum growing season reveals
that luxuriant crop growth can occur when the crop receives adequate to
excessive rainfall in the early part of the growing season and has adequate to
excessive N available. However, this luxury vegetative growth does not
necessarily result in higher grain yields because heavy rainfall during the early
growing season may leach NO3-N from the soils resulting in late-season N
deficiency. Also, early season luxurious vegetative crop growth significantly
increases the daily crop water use (Khosla and Persaud, 1997). Consequently,
plants may experience severe water stress later in the growing season causing
early leaf senescence, poor head development and grain filling, and resulting in
lower grain yields. Optimum grain yields therefore depend on whether there is an
adequate supply of N and water stored in the soil to meet the plant N and water
needs. Thus, the objective of this experiment is (1) to determine the optimum
amount of N which will give the best yield (2) to identify the specific growth stage
when sorghum grain yield can be predicted using sensor readings from
vegetative stages and; (3) to identify the peak nutrient demanding growth period
which is highly responsive to fertilization.
Role of CV in Mid-Season Grain Yield Prediction
Coefficient of variation (CV) provides a relative measure of data dispersion
compared to the mean. It is defined as the ratio of standard deviation to the
8
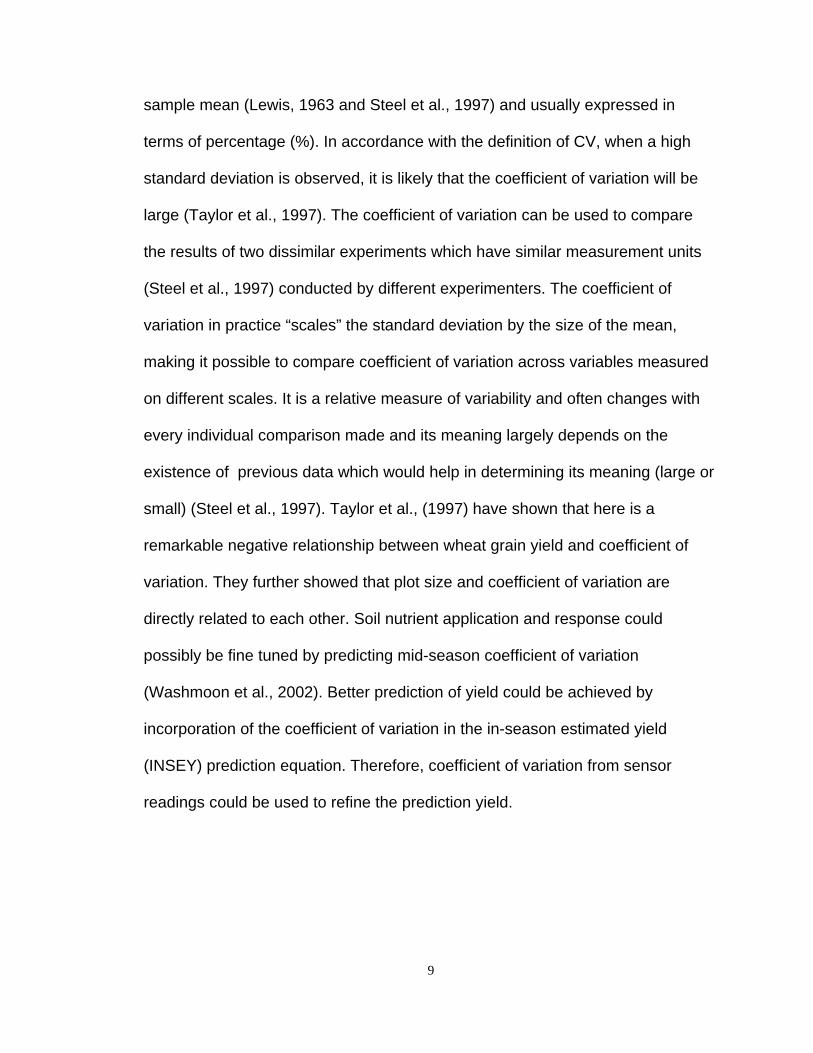
sample mean (Lewis, 1963 and Steel et al., 1997) and usually expressed in
terms of percentage (%). In accordance with the definition of CV, when a high
standard deviation is observed, it is likely that the coefficient of variation will be
large (Taylor et al., 1997). The coefficient of variation can be used to compare
the results of two dissimilar experiments which have similar measurement units
(Steel et al., 1997) conducted by different experimenters. The coefficient of
variation in practice “scales” the standard deviation by the size of the mean,
making it possible to compare coefficient of variation across variables measured
on different scales. It is a relative measure of variability and often changes with
every individual comparison made and its meaning largely depends on the
existence of previous data which would help in determining its meaning (large or
small) (Steel et al., 1997). Taylor et al., (1997) have shown that here is a
remarkable negative relationship between wheat grain yield and coefficient of
variation. They further showed that plot size and coefficient of variation are
directly related to each other. Soil nutrient application and response could
possibly be fine tuned by predicting mid-season coefficient of variation
(Washmoon et al., 2002). Better prediction of yield could be achieved by
incorporation of the coefficient of variation in the in-season estimated yield
(INSEY) prediction equation. Therefore, coefficient of variation from sensor
readings could be used to refine the prediction yield.
9

MATERIALS AND METHODS
Experimental Design and Treatment Structure
In the summers of 2004 and 2005, a total of six experiments were
conducted at three locations, Lake Carl Blackwell (Port fine-silty, mixed,
superactive, thermic Cumulic Haplustoll), Hennessey and Efaw (Easpur loam
fine-loamy, mixed, superactive, thermic Fluventic Haplustoll), Oklahoma. Initial
soil analysis results are presented in Table 1. Four pre-plant, three split and four
topdress nitrogen rates were applied in a randomized complete block design with
three replications at all the experiments (Table 2).
In the first cropping season (summer 2004), sorghum was planted May 6,
2004 at Efaw, Lake Carl Blackwell and Hennessey using a John Deere Max
Engine planter set at 75 cm row spacing and at a population of about 111,150
plants per hectare. An amount of 24.4 kg P per hectare was applied pre-plant
and incorporated to the soil by using a tractor mounted barber spreader. The pre
plant nitrogen rates were applied before planting and incorporated by a field
cultivator harrow. Urea (46-0-0) was used as the pre-plant source of nitrogen in
all experiments. Top dress nitrogen was applied as UAN (28-0-0) at sorghum
growth stage 3 (growing point differentiation) between June 14 and 16. In the
second cropping season (summer 2005) sorghum was planted May 17, 2005 at
Efaw and Lake Carl Blackwell and May 18, 2005 at Hennessey, Oklahoma and
the same management practices were carried as in 2004.
10

Plot sizes were about 3 m x 6 m (18 m2). There were four rows of sorghum
plants in each plot where the two middle rows were used for physical and sensor
measurements and for collecting final grain yield.
Sensor Measurements
A GreenSeeker® Hand Held Optical Sensor (NTech Industries, Inc.) was
used to collect normalized difference vegetative index (NDVI) measurements.
This device uses a patented technique to measure crop reflectance and to
calculate NDVI. The unit senses a 0.6 x 0.01 m area when held at a distance of
approximately 0.6 to 1.0 m from the illuminated surface. The sensed dimensions
remain approximately constant over the height range of the sensor. The sensor
unit has self-contained illumination in the red (650 10 nm full width half
magnitude (FWHM)), green (550 + 12.5 nm FWHM) and NIR (770 15 nm
FWHM) bands. The device measures the fraction of the emitted light in the
sensed area that is returned to the sensor (reflectance). These fractions are
used within the sensor to compute Red (RNDVI) and Green (GNDVI) according
to the following formula:
dNIR
dNIR
FFFF
RNDVIRe
Re
+−
=
GreenNIR
GreenNIR
FFFF
GNDVI+−
=
Where: FNIR – Fraction of emitted NIR radiation returned from the sensed area (reflectance).
FRed – Fraction of emitted Red radiation returned from the sensed area (reflectance).
11
FGreen – Fraction of emitted Green radiation returned from the sensed area (reflectance).
The sensor unit is designed to be “hand-held” and measurements were
taken nadir as the sensor is passed over the crop surface. It samples at a
very high rate (approximately 1000 measurements per second) and averages
measurements between outputs. The sensor outputs NDVI at a rate of 10
readings per second. The sensor was passed over the crop at a height of
approximately 0.7 m above the crop canopy and oriented so that the 0.6 m
sensed width was perpendicular to the row and centered over the row. With
advancing stage of growth, sensor height above the ground increased
proportionally. Travel velocities were at a slow walking speed of
approximately 0.5 m s-1 resulting in NDVI readings averaged over distances
of < 0.05 m.
Sensor readings for each year were taken at growth stage 2 (collar of
5th leaf is visible: occurs approximately 20 days after emergence), 3 (growing
point differentiation: 35 days after emergence), 5 (boot stage), 6 (half bloom)
and 7 (soft dough). Duration of growth stages may vary depending on the
existing weather condition in the growing season. Sensor readings were
taken from the two middle rows by sensing each row at a time. Plot NDVI
readings were estimated by averaging readings from the two middle rows.
12

Grain Yield Sampling
Final plot grain yield was obtained from two middle rows which were
harvested using a plot harvesting Massey Ferguson combine which has
automated moisture and weighing scales. Grain yield was adjusted for standard
moisture content of grain sorghum (13%) using the following formula:
⎥⎦
⎤⎢⎣
⎡−
−=moisturestatndard
moitureactualyieldharvestedyieldadjustedMoisture100
100*
Total N in the grain was determined using a Carlo Erba (Milan, Italy) NA-
1500 dry combustion analyzer (Schepers et al., 1989) after grain samples were
dried (70 oC for three days) and grounded to pass a 0.125 mm (120-mesh) sieve
and analyzed.
Data Analysis
In-season estimated yield (INSESY) was calculated as a ratio of average
plot NDVI and growing degree days (GDD> 0). GDD represents the duration of
biomass production where only days with optimum temperature for growth are
considered throughout the growth cycle. INSEY and GDD were calculated using
the following formulas:
⎥⎦
⎤⎢⎣
⎡>
=0GDDwhereDays
NDVIINSEY
CTT
GDD 0minmax 4.42
−⎥⎦⎤
⎢⎣⎡ +
=
13
Where Tmin and Tmax represent daily ambient minimum and
maximum temperatures, respectively.
Coefficient of variation for red and green NDVI for each plot were
calculated automatically by the software in the Greenseeker.
The relationship among grain N uptake, grain yield, in-season estimated yield
(INSEY) and GNDVI and RNDVI at different growth stages were evaluated using
simple regression analysis proc reg procedure using SAS (SAS, 1999) statistical
software.
14
RESULTS
Grain Yield
Crop Year 2004
Average grain sorghum yield was somewhat higher at Lake Carl Blackwell
(6482 kg ha-1) when compared to Efaw (4278 kg ha-1). Over all grain yields
ranged from 3703 to 5062 kg ha-1 and from 5465 kg ha-1 to 7440 kg ha-1 at Efaw
and Lake Carl Blackwell, respectively (Table 3). The range in sorghum grain
yields was largely attributed to the response to fertilizer N. At all locations,
sorghum grain yields increased with increasing N applied, but the significance of
this trend over locations varied by site (Table 4). Maximum yields were generally
achieved at the 100 or 150 kg N ha-1 rates, and yield increases over the 0-N
check were more than 700 kg ha-1 over all sites (Table 3).
Crop Year 2005
Average grain yield of sorghum was 3420, 2399 and 8476 kg ha-1 at Efaw,
Hennessey and Lake Carl Blackwell, respectively (Table 3). The highest yield
was obtained from mid-season applied 150 kg N ha-1, split applied 100 kg N ha-1
and split applied 150 kg N ha-1 with corresponding yields of 4442, 3125 and 9245
kg ha-1 at Efaw, Hennessey and Lake Carl Blackwell, respectively (Table 3). For
the 5 site-years included in this work, only Lake Carl Blackwell in 2004 showed
limited response to fertilizer N.
15
Over all sites, differences in preplant, topdress, and split methods of N
application produced variable results. Split applied N was expected to be better
where irrigation was available and yield levels were higher (Lake Carl Blackwell),
but results were inconsistent (Table 3), evidenced in the lack of significant effects
from single degree of freedom contrasts (Table 4).
Sensor Measurements
Crop Year 2004
Results of simple linear regression analysis showed that there was a
significant relationship between NDVI and final sorghum grain yield from sensor
readings collected at growth stage 3. When evaluating this relationship over
stages of growth, the best correlation between grain yield and GNDVI and
RNDVI was obtained at growth stage 3 (coefficient of simple determination (r2) of
0.70 (RNDVI) and 0.65 (GNDVI) (Figures 1 and 2). Similarly, simple regression
analysis of the combined location data revealed that in-season estimated yield
(INSEY) was significantly correlated with both red (r2=0.68) and green (r2=0.71)
NDVI (Figures 3 and 4). It should be noted that the use of INSEY did not
significantly improve this relationship over that of NDVI alone for either red or
green. At the same growth stage grain N uptake was also significantly correlated
with red (r2= 0.48) and green (r2= 0.48) NDVI (Figures 5 and 6). Coefficient of
variation (CV%) from RNDVI (r2 = 0.46) and GNDVI (r2=0.50) was also correlated
with grain yield at growth stage 3 (Figures 7 and 8). Over sites, CV’s decreased
with increasing NDVI (red and green, Figures 9 and 10) at growth stage 2, while
16
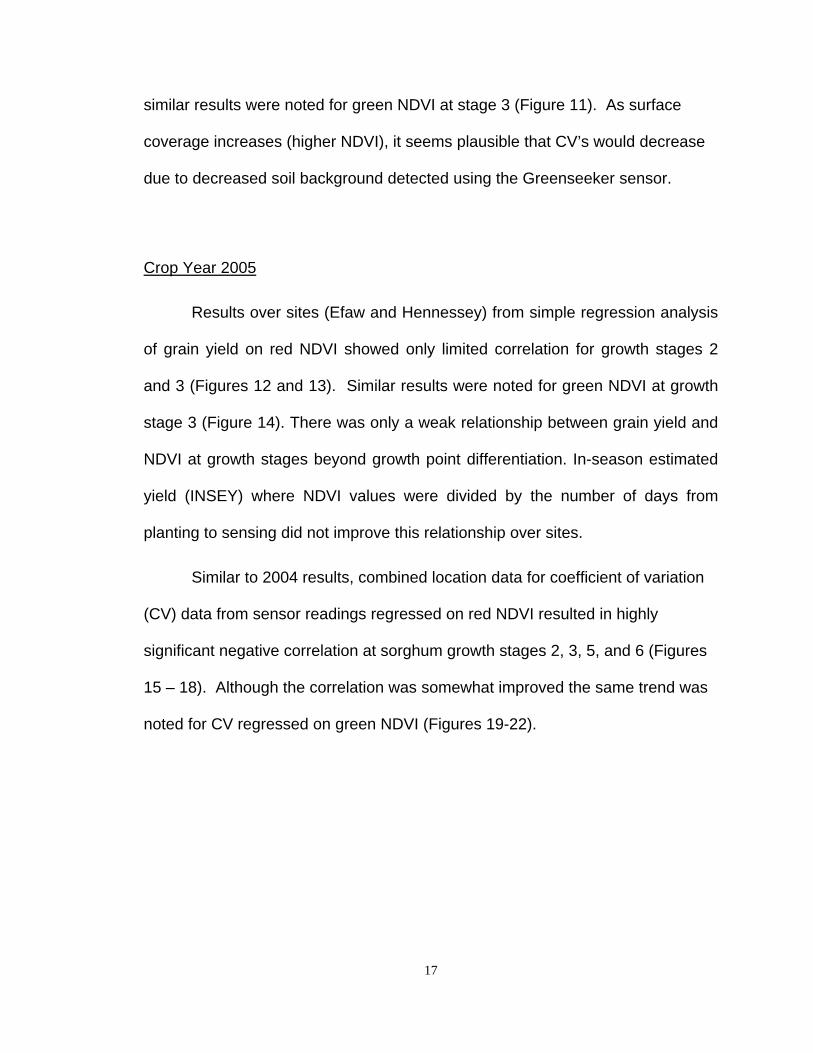
similar results were noted for green NDVI at stage 3 (Figure 11). As surface
coverage increases (higher NDVI), it seems plausible that CV’s would decrease
due to decreased soil background detected using the Greenseeker sensor.
Crop Year 2005
Results over sites (Efaw and Hennessey) from simple regression analysis
of grain yield on red NDVI showed only limited correlation for growth stages 2
and 3 (Figures 12 and 13). Similar results were noted for green NDVI at growth
stage 3 (Figure 14). There was only a weak relationship between grain yield and
NDVI at growth stages beyond growth point differentiation. In-season estimated
yield (INSEY) where NDVI values were divided by the number of days from
planting to sensing did not improve this relationship over sites.
Similar to 2004 results, combined location data for coefficient of variation
(CV) data from sensor readings regressed on red NDVI resulted in highly
significant negative correlation at sorghum growth stages 2, 3, 5, and 6 (Figures
15 – 18). Although the correlation was somewhat improved the same trend was
noted for CV regressed on green NDVI (Figures 19-22).
17
DISCUSSION
Grain Yield
In 2004 no grain was harvested from the Hennessey experimental site due
to severe bird damage after seed set. The majority of the experimental plots in
the third replication at this site were water logged for some part of the growing
period. The water logging problem led to uneven emergence, planting skips,
ultimately poor crop stands in both years. Moreover, extended moisture stress
due to erratic and low rainfall was responsible for very low yields at this site.
In the 2004 cropping year there was only limited yield response to nitrogen
rates at Lake Carl Blackwell. Non-responsiveness or negative-responsiveness of
grain sorghum yields in the 2004 cropping year were attributed to high levels of
residual mineral N present in the soil profile at planting. Also, erratic rainfall
patterns that promoted early season luxuriant crop growth caused severe water
stress conditions later in the season. These conditions translated into poor early
season growth, later season head development and grain fill. Consequently,
grain yields were lower and only limited response was noted to applied N
fertilizer. Analysis of soil samples collected from the experimental area prior to
planting showed that there was substantial residual nitrogen (Table 1). Soil test
results indicated relatively high residual ammonium N present at all sites in the
15 cm soil surface (Table 1). Khosla et al (2000) has also suggested that
residual mineral N levels greater than 45 kg N ha-1 in the surface 0.3 m of soil
were sufficient to support the crop growth until midseason fertilizer was applied.
18
These results demonstrate the importance of soil testing at each experimental
site prior to planting.
In 2005 the Lake Carl Blackwell experimental site was irrigated and as a
result, grain yields in excess of 9000 kg ha-1 were realized. At this site statistical
data analysis showed that there was a remarkable response of grain yield to
nitrogen treatments. The main effect of nitrogen rate was linear (P<0.01) or
quadratic (P<0.05) for all pre-plant, top dress and split nitrogen applications
methods. Sorghum grain yields peaked at 200, 150 and 150 kg N ha-1
treatments for pre-plant, top dress and split application methods, respectively.
However only limited differences in application methods were noted for grain
yield at all sites (Table 4).
Sensor Measurements
In both 2004 and 2005 crop years it was observed that the relationship of
NDVI and grain yield was better at the stage of growing point differentiation
(growth stage 3). This stage (35 days after emergence) is a period of rapid
growth and nutrient uptake by the sorghum plant (Vanderlip, 1993). In-season
estimated yield (INSEY) is a measure of mid-season potential yield using NDVI
(estimate of biomass) as a function of the number of days transpired to the time
sensor measurements are collected. Invariably the relationship with final grain
yield was improved at growth stage 3 when compared to other stages evaluated.
This enhances the importance of collecting early season sensor measurements
for projecting grain yield, for ensuing adjustments in nutrient needs.
19
Combined data over all locations and years appeared to show a trend
somewhat similar to what was found from data on individual locations on grain
yield and NDVI relationships at growth stage 3. The scatter plot diagram of grain
yield on both green and red NDVI illustrated a discernable trend for most sites,
excluding the 2005 Lake Carl Blackwell site (Figures 23, and 24). Since this site
was irrigated throughout the growth period, higher grain yields were realized
compared to the other locations (Figures 23 and 24), and response was also
detectably different. Therefore, this site resulted in a data cluster much different
than the rest that were produced under dryland conditions. This finding is
consistent with the need for highly specialized yield prediction equations reported
on the NUE web site (http://www.nue.okstate.edu/Yield_Potential.htm).
However, it should be noted that when using INSEY the combined data were in
fact normalized and the outer boundary for detecting yield potential was quite
clear using the green NDVI sensor (Figure 23). Scatter below the outer
boundary is expected since post sensing conditions can lead to the
underestimation of yield potential (drought stress, disease, insect damage, etc.).
But, what is important to note is that both rainfed and irrigated sites could be
combined on one graph (Figure 25) when using INSEY (green NDVI sensor),
further suggesting that early season detection of growth rate (biomass produced
per day, estimated using NDVI divided by the number of days from planting to
sensing) is in fact related to final grain yield.
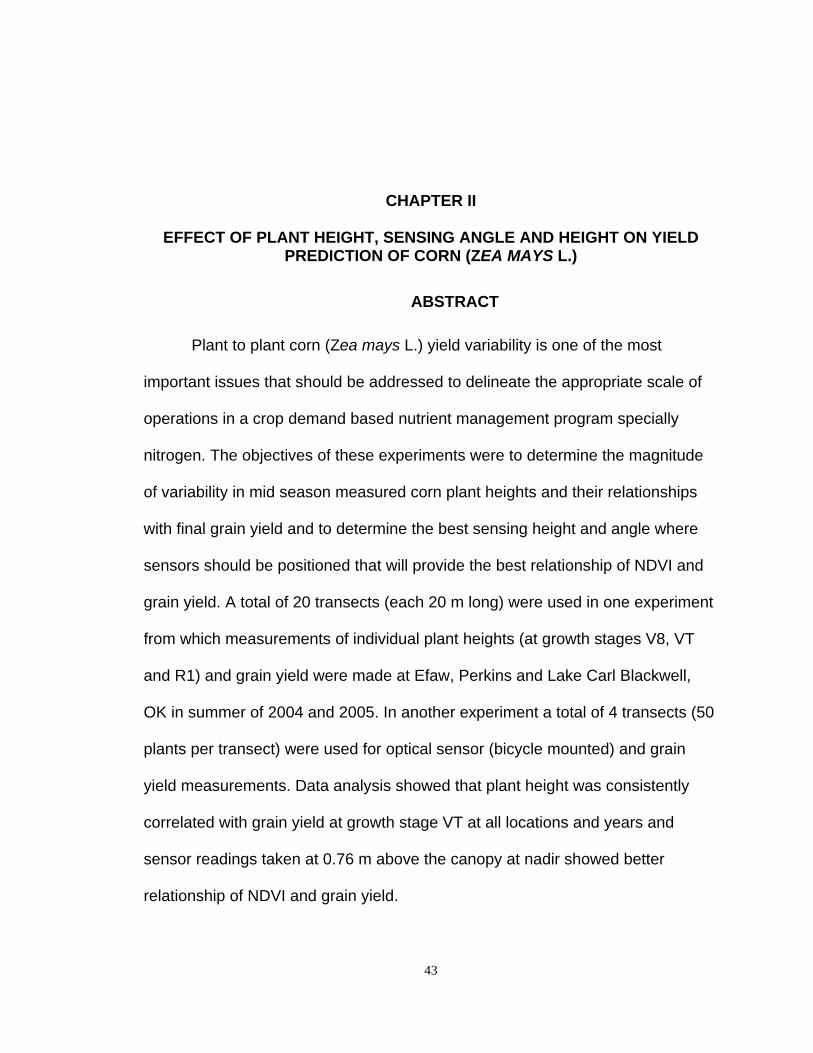
This same trend was noted when using the red NDVI at growth stage 3
over sites and years versus sorghum grain yield (Figure 26). However, for this
20
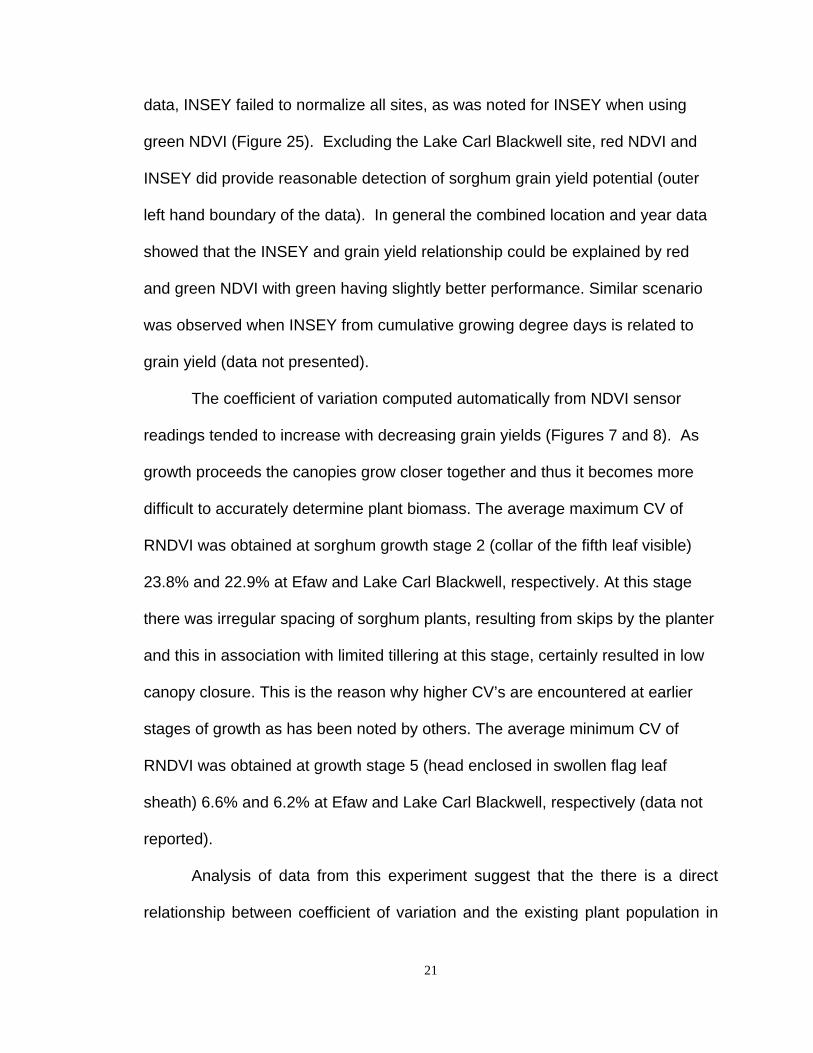
data, INSEY failed to normalize all sites, as was noted for INSEY when using
green NDVI (Figure 25). Excluding the Lake Carl Blackwell site, red NDVI and
INSEY did provide reasonable detection of sorghum grain yield potential (outer
left hand boundary of the data). In general the combined location and year data
showed that the INSEY and grain yield relationship could be explained by red
and green NDVI with green having slightly better performance. Similar scenario
was observed when INSEY from cumulative growing degree days is related to
grain yield (data not presented).
The coefficient of variation computed automatically from NDVI sensor
readings tended to increase with decreasing grain yields (Figures 7 and 8). As
growth proceeds the canopies grow closer together and thus it becomes more
difficult to accurately determine plant biomass. The average maximum CV of
RNDVI was obtained at sorghum growth stage 2 (collar of the fifth leaf visible)
23.8% and 22.9% at Efaw and Lake Carl Blackwell, respectively. At this stage
there was irregular spacing of sorghum plants, resulting from skips by the planter
and this in association with limited tillering at this stage, certainly resulted in low
canopy closure. This is the reason why higher CV’s are encountered at earlier
stages of growth as has been noted by others. The average minimum CV of
RNDVI was obtained at growth stage 5 (head enclosed in swollen flag leaf
sheath) 6.6% and 6.2% at Efaw and Lake Carl Blackwell, respectively (data not
reported).
Analysis of data from this experiment suggest that the there is a direct
relationship between coefficient of variation and the existing plant population in
21
the field. This is in turn related to final grain yield which has also been reported
in the literature. Work by Raun et al. (2005) and Arnall et al. (2005) have shown
that there is significant relationship between grain yield and coefficient of
variation, and that is tied to plant population in corn and wheat.
CONCLUSIONS
The results obtained from this experiment suggest that yield potential
prediction in sorghum using spectral measurements should be carried out at a
stage of critical biomass production and nutrient demand. This was shown by the
relationship of INSEY and final grain yield at sorghum growth stage 3 (growing
point differentiation) which starts approximately 35 days after planting. Red and
the green NDVI sensor data collected at growth stage 3 were highly correlated
with final sorghum grain yield. However, the use of INSEY as has been
employed in wheat and corn trials was not as effective in normalizing sites
whereby one yield prediction equation could be established. Further work will
need to focus on the use of cumulative growing degree days and/or other
denominators for the INSEY equation in order to refine yield potential prediction
equations for sorghum.
22
REFERENCES Aase, J.K., and D.L. Tanaka. 1984. Effects of tillage practices on soil and wheat spectral reflectance. Agron. J. 76:814–818. Arnall, D.B., K. W. Freeman, K. Girma, K.L. Martin, R. K. Teal, W.R. Raun, J.B. Solie, and M.L. Stone. Relationship Between Coefficient of Variation Measured by Spectral Reflectance and Plant Density at Early Growth Stages. J. Plant Nutr. 2005. (in press). Avery, T.E., and G.L. Berlin. 1992. Fundamentals of remote sensing and air photo interpretation. 5th ed. Macmillan, New York. Baethgen, W. E., and M. M. Alley. 1989. Optimizing soil and fertilizer nitrogen use by intensively managed winter wheat: I. Crop nitrogen uptake. Agron. J. 81:116–120. Bausch, W.C., and H.R. Duke. 1996. Remote sensing of plant nitrogen status in corn. Trans. ASAE 39:1869–1875. Bennett, W.F., B.B. Tucker, and A.B. Maunder. 1990. Modern Grain Sorghum Production. p.3-9. Iowa State University Press, Ames IA. Blackmer, T.M., and J.S. Schepers. 1994. Techniques for monitoring crop nitrogen status in corn. Commun. Soil Sci. Plant Anal. 25: 1791–1800.
Blackmer, T.M., J.S. Schepers, and G.E. Varvel. 1994. Light reflectance compared with other nitrogen stress measurements in corn leaves. Agron. J. 86:934–938.
Colwell, R.M. 1956. Determining the prevalence of certain cereal crop diseases by means of aerial photography. Hilgardia 26:223–286. FAO. 2002. FAOSTAT database results [Online]. Available at http://apps.fao.org/page/collections?subset = agriculture (verified 17 Aug. 2003). FAO, Rome. Feinerman, E., E.K. Choi, and S.R. Johnson. 1990. Uncertainty and split nitrogen application in crop production. Amer. J. Agr. Econ. 72:975-984.
Gitelson, A.A., Y.J. Kaufman, and M.N. Merzlyak. 1996. Use of a green channel in remote sensing of global vegetation from EOS-MODIS. Remote Sens. Environ. 58:289–298. Gravelle, W.D., M.M. Alley, D.E. Brann, and K.D.S.M. Joseph. 1988. Split spring nitrogen application affects on yield, lodging, and nutrient uptake of soft red winter wheat. J. Prod. Agric. 1:249-256.
23

Hergert, G.W., W.L. Pan, D.R. Huggins, J.H. Grove, and T.R. Peck. 1997. Adequacies of current fertilizer recommendations for site-specific management. p. 283–300. In F.J. Pierce and E.J. Sadler (ed.) The state of site-specific management for agriculture. ASA, CSSA, and SSSA, Madison, WI. Jordan, C.F. 1969. Derivation of leaf area index from quality of light on the forest floor. Ecology 50:663–666. Khosla, R., N. Persaud, N.L. Powell, and D.E. Brann. 1995. Water use of sorghum on a marginal soil in eastern Virginia. In Appendix 1. p.11. Agronomy abstracts. ASA, Madison, WI. Khosla, R., and N. Persaud. 1997. Performance of a commercial resonant frequency capacitance probe: II. Measurement of water use of dryland crops. Commun. Soil Sci. Plant Anal., 28(15&16), 1347-1357. Khosla, R., M. M. Alley and P. H. Davis. 2000.Nitrogen management in no-tillage grain sorghum production. Agron. J. 92:321-328. Kitchen, N.R., D.F. Hughes, K.A. Sudduth, and S.J. Birrell. 1995. Comparison of variable rate to single rate nitrogen fertilizer application: Corn production and residual soil NO3–N. p. 427–439. In P.C. Robert et al. (ed.) Site- specific management for agricultural systems. ASA, CSSA, and SSSA, Madison, WI. Lewis, E.E. 1963. Methods of Statistical Analysis in Economics and Business. 2nd Ed. Houghton Mifflin Co., Boston, MA. Machado, S., E.D. Bynum, Jr., T.L. Archer, R.J. Lascano, L.T. Wilson, J. Bordovsky, E. Segarra, K. Bronson, D.M. Nesmith, and W. Xu. 2000. Spatial and temporal variability of corn grain yield: Site-specific relationships of biotic and abiotic factors. Precision Agric. 2:343–360. Mengel, D.B., D.W. Nelson, and D.M. Huber. 1982. Placements of nitrogen fertilizers for no-till and conventional till corn. Agron. J. 74:515-518. Moran, M.S., Y. Inoue, and E.M. Barnes. 1997. Opportunities and limitations for image based remote sensing in precision crop management. Remote Sens. Environ. 61:319–346. Passioura, J. B. 1994. The yield of crops in relation to drought. p. 343–359. In K.T. Boote et al. (ed.) Physiology and determination of crop yield. ASA, SSA, and SSSA, Madison, WI.
24
Pierce, F.J., and P. Nowak. 1999. Aspects of precision agriculture. Adv. Agron. 67:1–85. Ramsey, R.D., A. Falconer, and J.R. Jensen. 1995. The relationship between NOAA-AVHRR NDVI and ecoregions in Utah. Remote Sens. Environ. 53:188–198. Rao, S.C. and T.H. Dao. 1992. Fertilizer placement and tillage effects of nitrogen assimilation by wheat. Agron. J. 84:1028-1032. Raun, W.R. and G.V. Johnson. 1999. Improving nitrogen use efficiency for cereal production. Agron. J. 91:357–363. Roderick, M., R. Smith, and G. Lodwick. 1996. Calibrating long-term AVHRR- derived NDVI imagery. Remote Sens. Environ. 58:1–12. Sadler, E.J., P.J. Bauer, and W.J. Busscher. 2000. Site-specific analysis of a droughted corn crop: I. Growth and grain yield. Agron. J. 92:395–402. Sanchez, C. A., and A. M. Blackmer. 1988. Recovery of anhydrous ammonia- derived nitrogen-15 during three years of corn production in Iowa. Agron. J. 80:102–108. Schepers, J. S, D. D. Francis, and M. T. Thompson. 1989. Simultaneous determination of total C, total N, and 15N on soil and plant material. Commun. Soil Sci. Plant Anal. 20:949-959. Sellers, P.J. 1985. Canopy reflectance, photosynthesis, and transpiration. Int. J. Remote Sens. 6:1335–1372. Shanahan, J.F., J.S. Schepers, D.D. Francis, G.E. Varvel, W.W. Wilhelm, J.M. Tringe, M.R. Schlemmer and D.J. Major. 2001. Use of Remote-Sensing Imagery to Estimate Corn Grain Yield. Agron. J. 93:583-589. Steel, R.G.D., J.H. Torrie, and D.A. Dickey. 1997. Principles and Procedures of Statistics A Biometrical Approach. 3rd Ed. McGraw-Hill Book Co., New York, NY. Stone, M.L., J.B. Solie, W.R. Raun, R.W. Whitney, S.L. Taylor, and J.D. Ringer. 1996. Use of spectral radiance for correcting in-season fertilizer nitrogen deficiencies in winter wheat. Trans. ASAE 39: 1623– 1631.
25
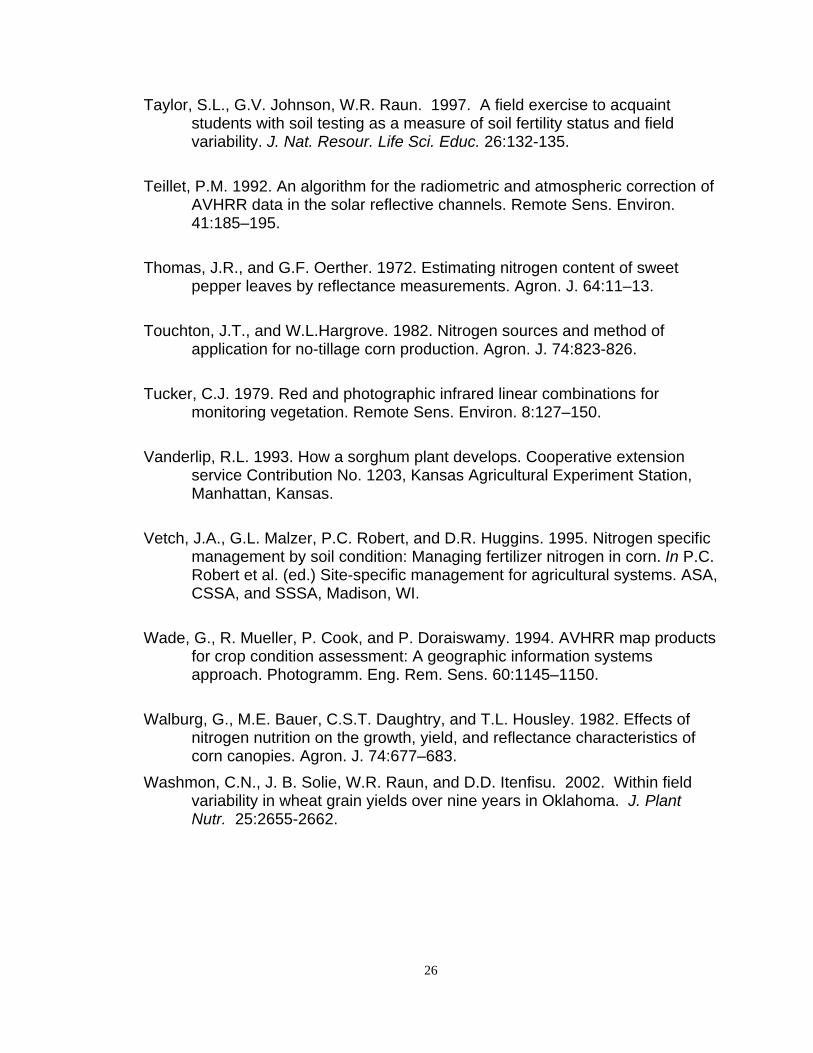
Taylor, S.L., G.V. Johnson, W.R. Raun. 1997. A field exercise to acquaint students with soil testing as a measure of soil fertility status and field variability. J. Nat. Resour. Life Sci. Educ. 26:132-135.
Teillet, P.M. 1992. An algorithm for the radiometric and atmospheric correction of AVHRR data in the solar reflective channels. Remote Sens. Environ. 41:185–195. Thomas, J.R., and G.F. Oerther. 1972. Estimating nitrogen content of sweet pepper leaves by reflectance measurements. Agron. J. 64:11–13. Touchton, J.T., and W.L.Hargrove. 1982. Nitrogen sources and method of application for no-tillage corn production. Agron. J. 74:823-826. Tucker, C.J. 1979. Red and photographic infrared linear combinations for monitoring vegetation. Remote Sens. Environ. 8:127–150. Vanderlip, R.L. 1993. How a sorghum plant develops. Cooperative extension service Contribution No. 1203, Kansas Agricultural Experiment Station, Manhattan, Kansas. Vetch, J.A., G.L. Malzer, P.C. Robert, and D.R. Huggins. 1995. Nitrogen specific management by soil condition: Managing fertilizer nitrogen in corn. In P.C. Robert et al. (ed.) Site-specific management for agricultural systems. ASA, CSSA, and SSSA, Madison, WI. Wade, G., R. Mueller, P. Cook, and P. Doraiswamy. 1994. AVHRR map products for crop condition assessment: A geographic information systems approach. Photogramm. Eng. Rem. Sens. 60:1145–1150. Walburg, G., M.E. Bauer, C.S.T. Daughtry, and T.L. Housley. 1982. Effects of nitrogen nutrition on the growth, yield, and reflectance characteristics of corn canopies. Agron. J. 74:677–683. Washmon, C.N., J. B. Solie, W.R. Raun, and D.D. Itenfisu. 2002. Within field
variability in wheat grain yields over nine years in Oklahoma. J. Plant Nutr. 25:2655-2662.
26
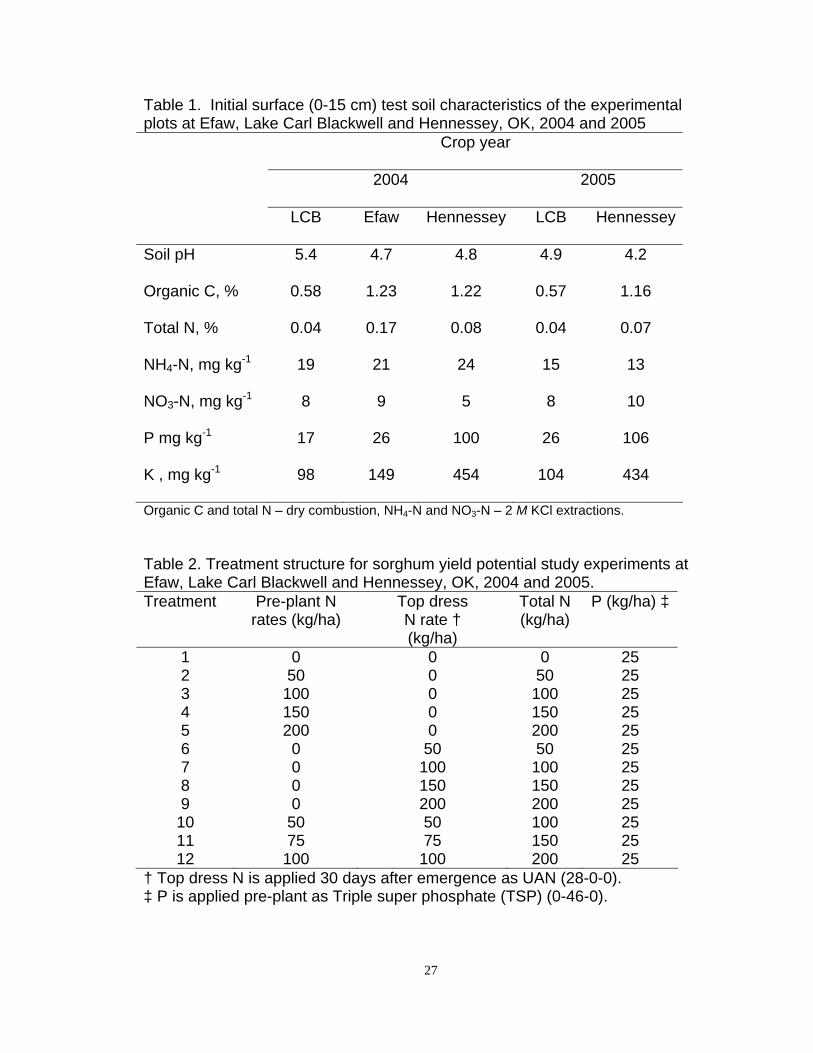
Table 1. Initial surface (0-15 cm) test soil characteristics of the experimental plots at Efaw, Lake Carl Blackwell and Hennessey, OK, 2004 and 2005 Crop year
2004 2005
LCB Efaw Hennessey LCB Hennessey
Soil pH 5.4 4.7 4.8 4.9 4.2
Organic C, % 0.58 1.23 1.22 0.57 1.16
Total N, % 0.04 0.17 0.08 0.04 0.07
NH4-N, mg kg-1 19 21 24 15 13
NO3-N, mg kg-1 8 9 5 8 10
P mg kg-1 17 26 100 26 106
K , mg kg-1 98 149 454 104 434
Organic C and total N – dry combustion, NH4-N and NO3-N – 2 M KCl extractions. Table 2. Treatment structure for sorghum yield potential study experiments at Efaw, Lake Carl Blackwell and Hennessey, OK, 2004 and 2005. Treatment Pre-plant N
rates (kg/ha) Top dress N rate † (kg/ha)
Total N (kg/ha)
P (kg/ha) ‡
1 0 0 0 25 2 50 0 50 25 3 100 0 100 25 4 150 0 150 25 5 200 0 200 25 6 0 50 50 25 7 0 100 100 25 8 0 150 150 25 9 0 200 200 25 10 50 50 100 25 11 75 75 150 25 12 100 100 200 25
† Top dress N is applied 30 days after emergence as UAN (28-0-0). ‡ P is applied pre-plant as Triple super phosphate (TSP) (0-46-0).
27
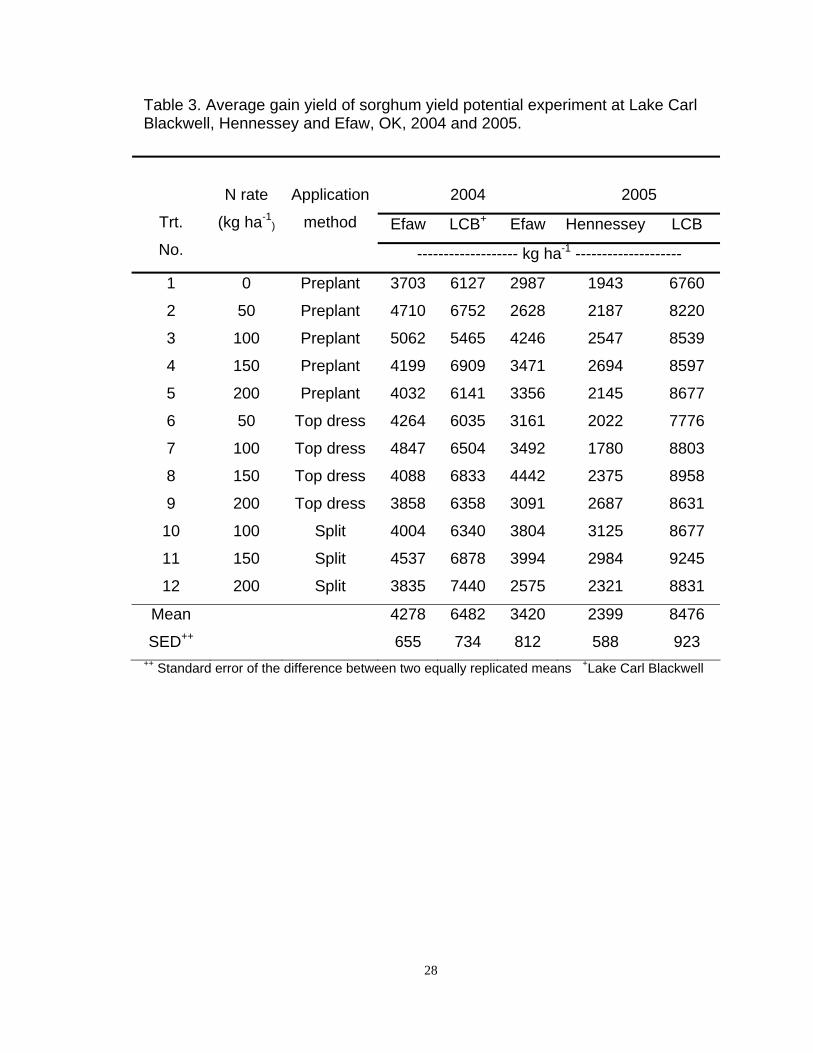
Table 3. Average gain yield of sorghum yield potential experiment at Lake Carl Blackwell, Hennessey and Efaw, OK, 2004 and 2005.
++ Standard error of the difference between two equally replicated means +Lake Carl Blackwell
2004
2005
Efaw LCB+ Efaw Hennessey LCB
Trt.
No.
N rate
(kg ha-1)
Application
method
------------------- kg ha-1 --------------------
1 0 Preplant 3703 6127 2987 1943 6760
2 50 Preplant 4710 6752 2628 2187 8220
3 100 Preplant 5062 5465 4246 2547 8539
4 150 Preplant 4199 6909 3471 2694 8597
5 200 Preplant 4032 6141 3356 2145 8677
6 50 Top dress 4264 6035 3161 2022 7776
7 100 Top dress 4847 6504 3492 1780 8803
8 150 Top dress 4088 6833 4442 2375 8958
9 200 Top dress 3858 6358 3091 2687 8631
10 100 Split 4004 6340 3804 3125 8677
11 150 Split 4537 6878 3994 2984 9245
12 200 Split 3835 7440 2575 2321 8831
Mean 4278 6482 3420 2399 8476
SED++ 655 734 812 588 923
28
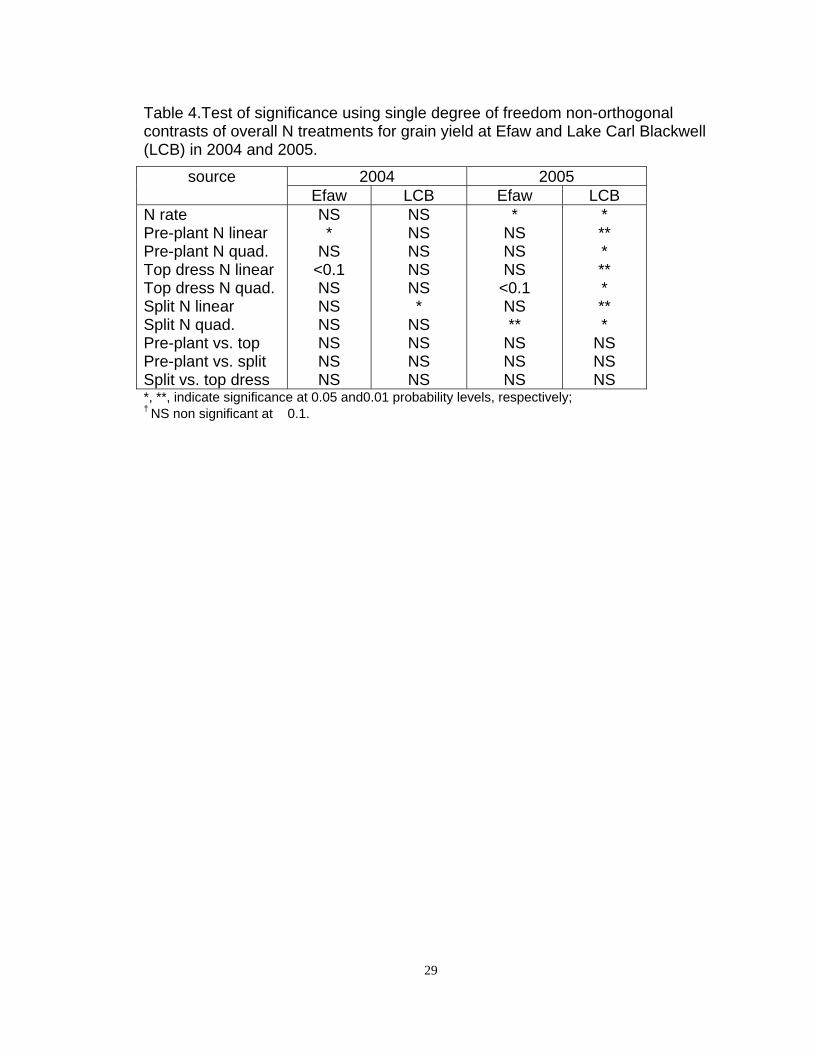
Table 4.Test of significance using single degree of freedom non-orthogonal contrasts of overall N treatments for grain yield at Efaw and Lake Carl Blackwell (LCB) in 2004 and 2005.
2004 2005 source Efaw LCB Efaw LCB
N rate Pre-plant N linear Pre-plant N quad. Top dress N linear Top dress N quad. Split N linear Split N quad. Pre-plant vs. top Pre-plant vs. split Split vs. top dress
NS *
NS <0.1 NS NS NS NS NS NS
NS NS NS NS NS *
NS NS NS NS
* NS NS NS
<0.1 NS **
NS NS NS
* ** * ** * ** *
NS NS NS
*, **, indicate significance at 0.05 and0.01 probability levels, respectively; † NS non significant at 0.1.
29
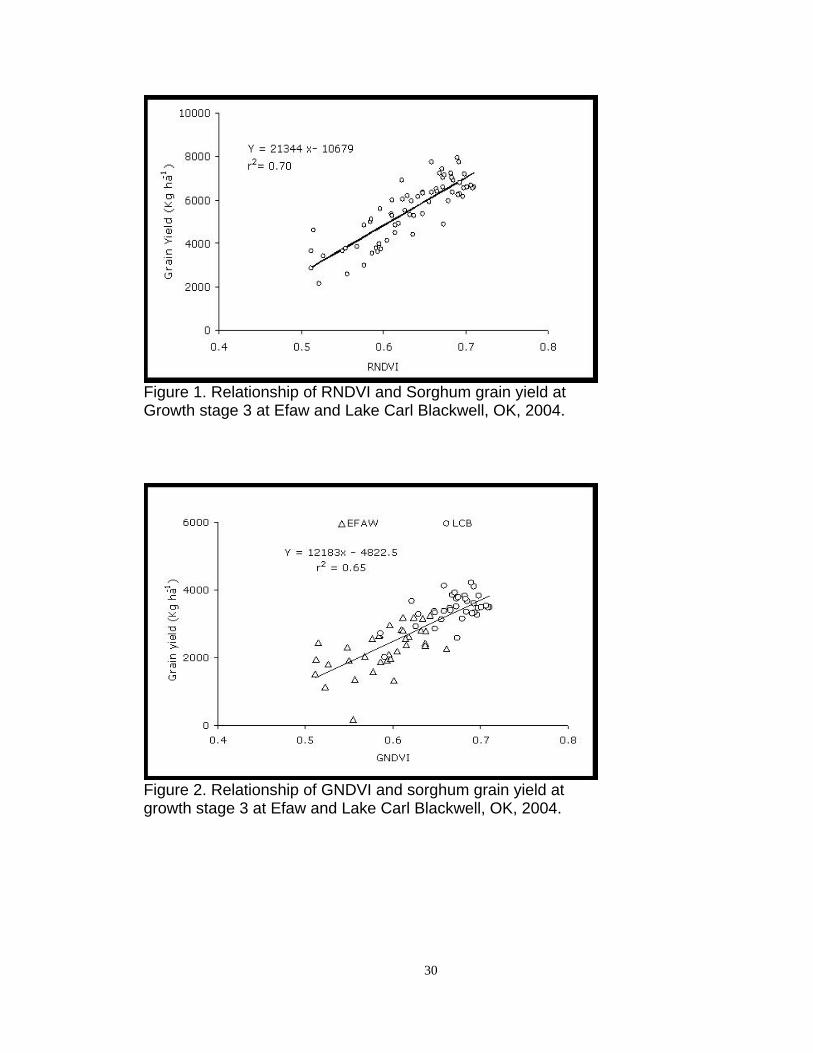
Figure 1. Relationship of RNDVI and Sorghum grain yield at Growth stage 3 at Efaw and Lake Carl Blackwell, OK, 2004.
Figure 2. Relationship of GNDVI and sorghum grain yield at growth stage 3 at Efaw and Lake Carl Blackwell, OK, 2004.
30
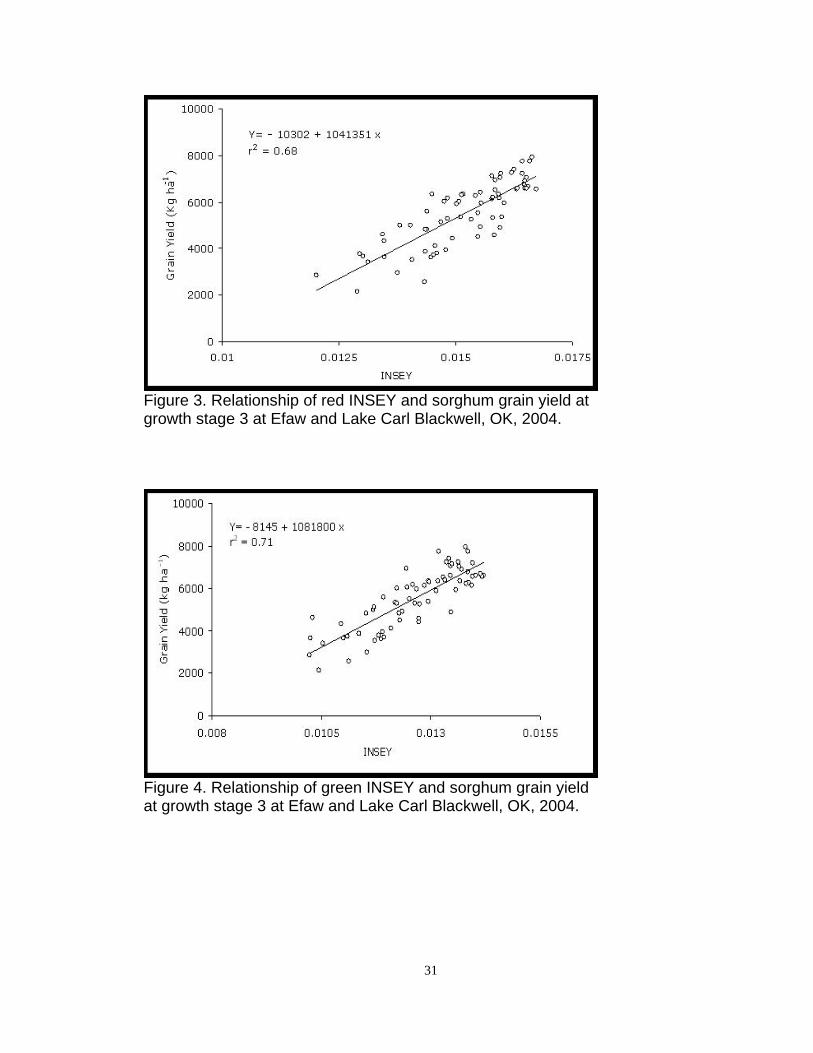
Figure 3. Relationship of red INSEY and sorghum grain yield at growth stage 3 at Efaw and Lake Carl Blackwell, OK, 2004.
Figure 4. Relationship of green INSEY and sorghum grain yield at growth stage 3 at Efaw and Lake Carl Blackwell, OK, 2004.
31
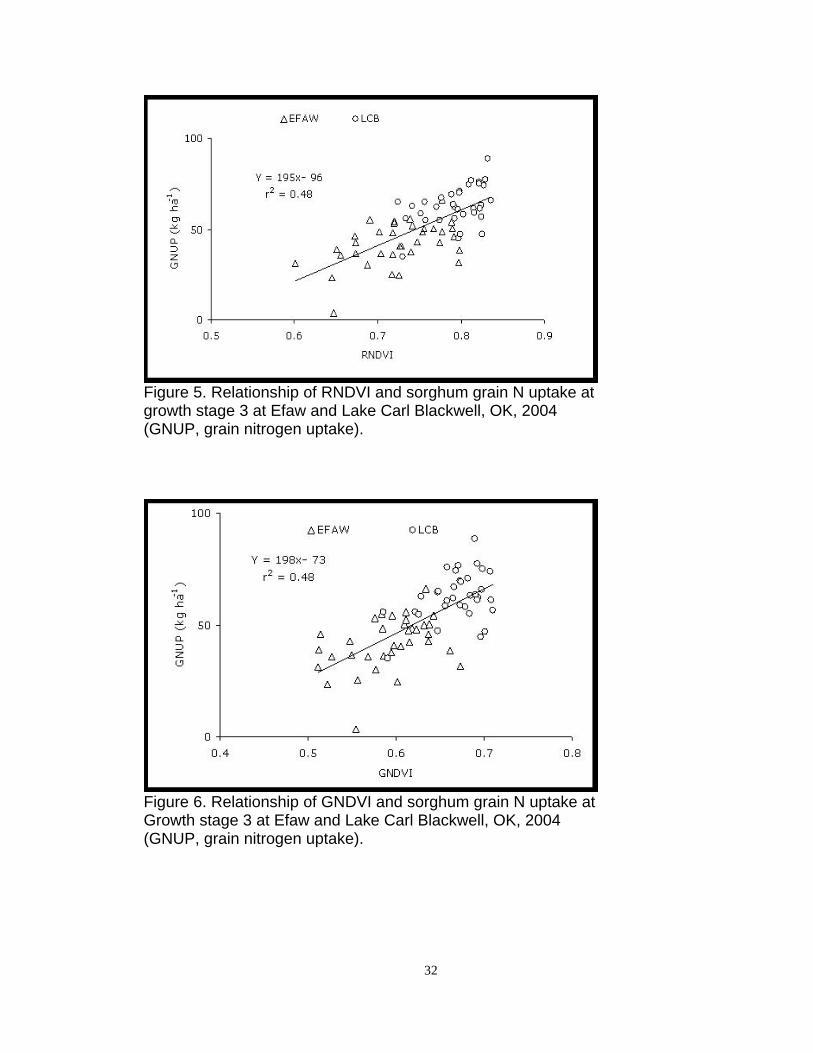
Figure 5. Relationship of RNDVI and sorghum grain N uptake at growth stage 3 at Efaw and Lake Carl Blackwell, OK, 2004 (GNUP, grain nitrogen uptake).
Figure 6. Relationship of GNDVI and sorghum grain N uptake at Growth stage 3 at Efaw and Lake Carl Blackwell, OK, 2004 (GNUP, grain nitrogen uptake).
32
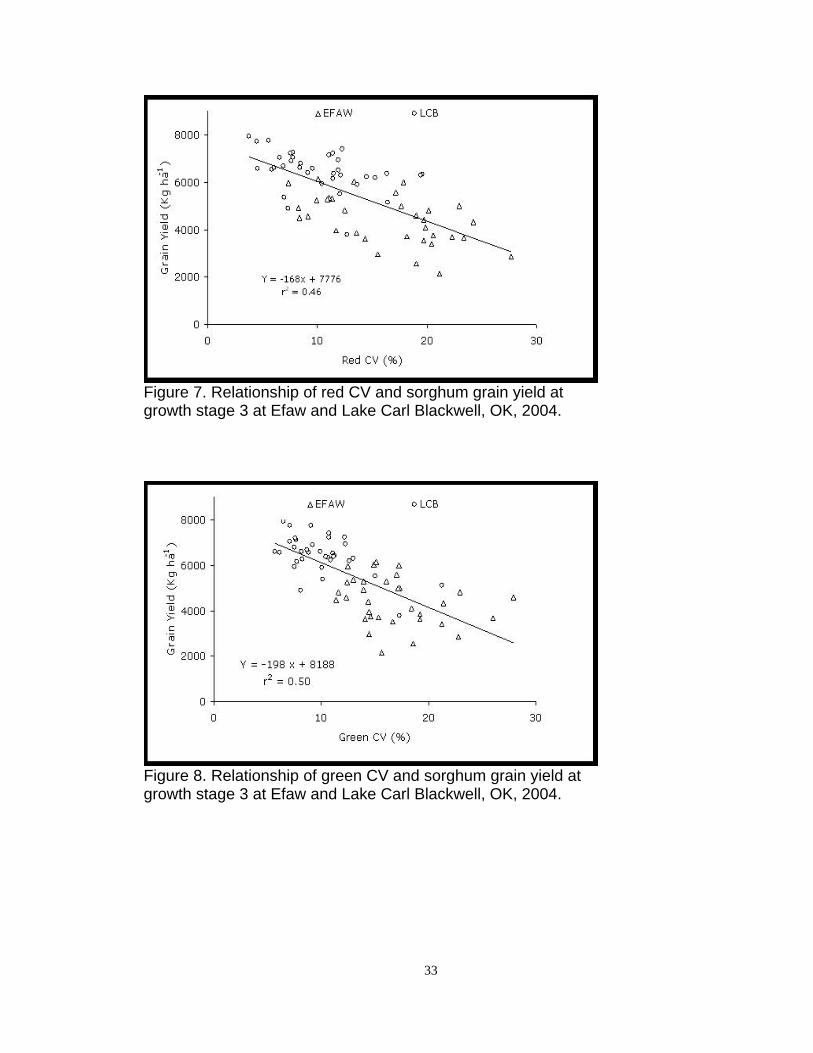
Figure 7. Relationship of red CV and sorghum grain yield at growth stage 3 at Efaw and Lake Carl Blackwell, OK, 2004.
Figure 8. Relationship of green CV and sorghum grain yield at growth stage 3 at Efaw and Lake Carl Blackwell, OK, 2004.
33

Figure 9. Relationship of CV and RNDVI at growth stage 2 at Efaw and Lake Carl Blackwell, OK, 2004.
Figure 10. Relationship of CV and GNDVI at growth stage 2 at Efaw and Lake Carl Blackwell, OK, 2004.
34

Figure 11. Relationship of CV and GNDVI at growth stage 3 at Efaw and Lake Carl Blackwell, OK, 2004.
Figure 12. Relationship of RNDVI and grain yield at sorghum growth stage 2 at Efaw and Hennessey, OK, 2005.
35

Figure 13. Relationship of RNDVI and grain yield at sorghum growth stage 3 at Efaw and Hennessey, OK, 2005.
Figure 14. Relationship of GNDVI and grain yield at sorghum growth stage 3 at Efaw and Hennessey, OK, 2005.
36
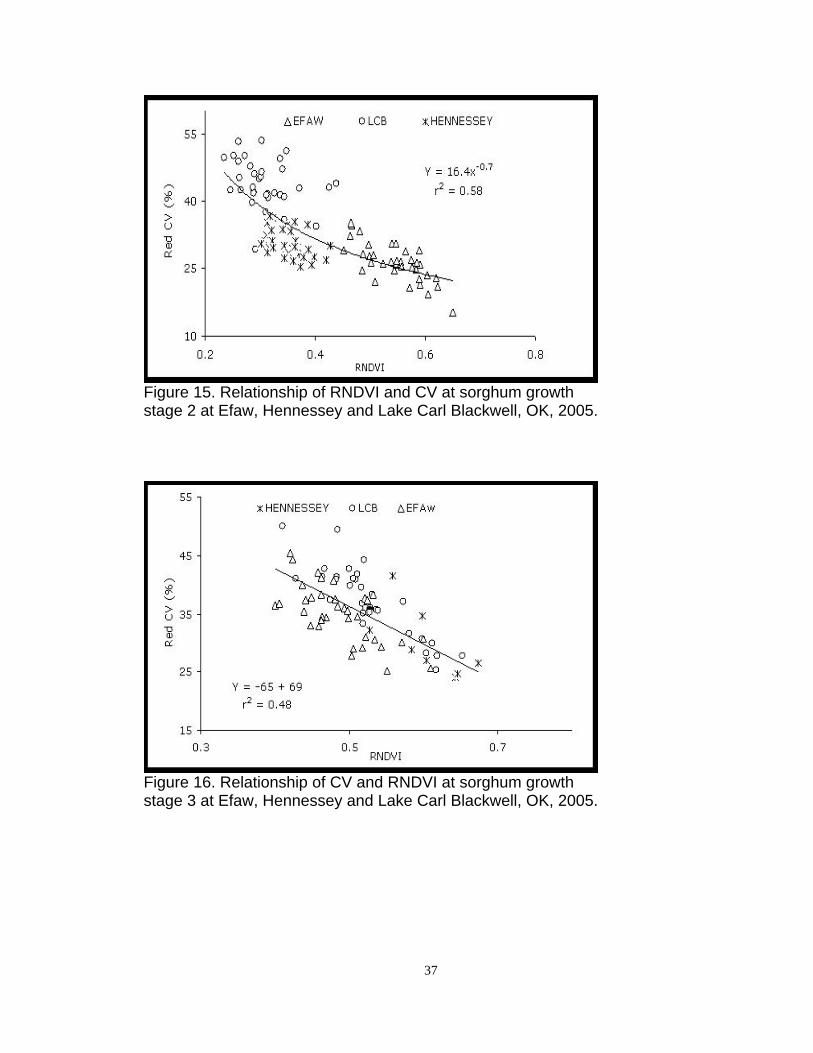
Figure 15. Relationship of RNDVI and CV at sorghum growth stage 2 at Efaw, Hennessey and Lake Carl Blackwell, OK, 2005.
Figure 16. Relationship of CV and RNDVI at sorghum growth stage 3 at Efaw, Hennessey and Lake Carl Blackwell, OK, 2005.
37
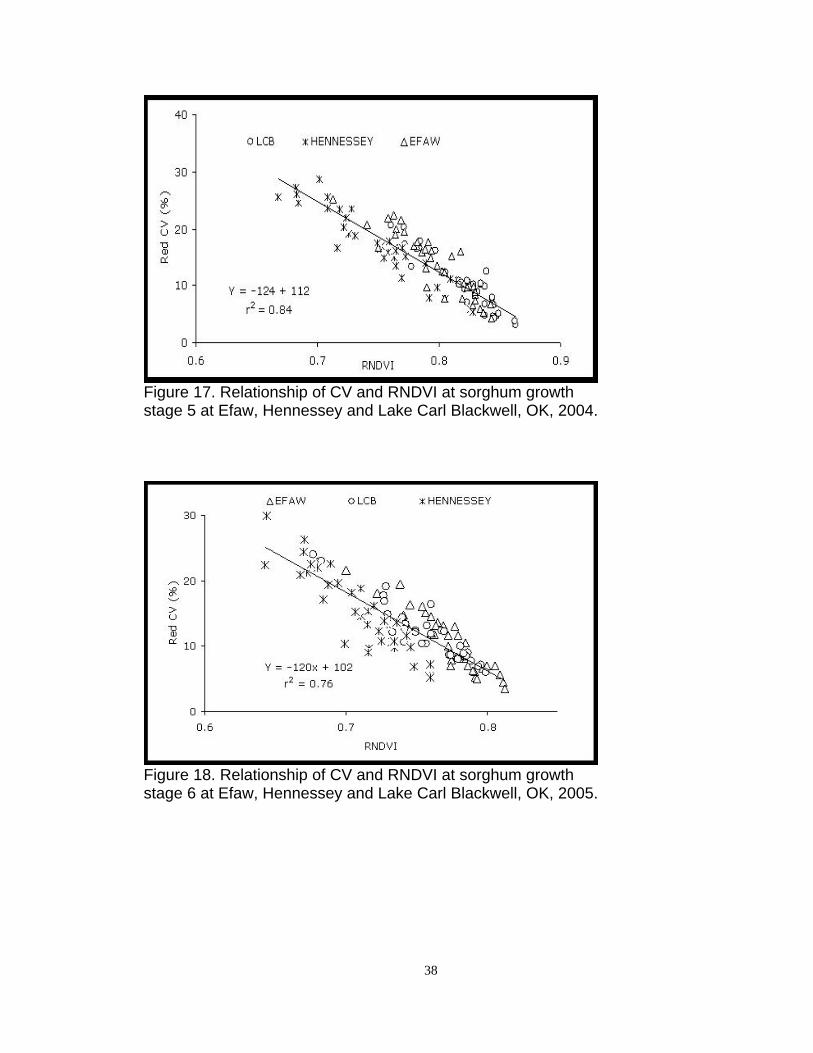
Figure 17. Relationship of CV and RNDVI at sorghum growth stage 5 at Efaw, Hennessey and Lake Carl Blackwell, OK, 2004.
Figure 18. Relationship of CV and RNDVI at sorghum growth stage 6 at Efaw, Hennessey and Lake Carl Blackwell, OK, 2005.
38
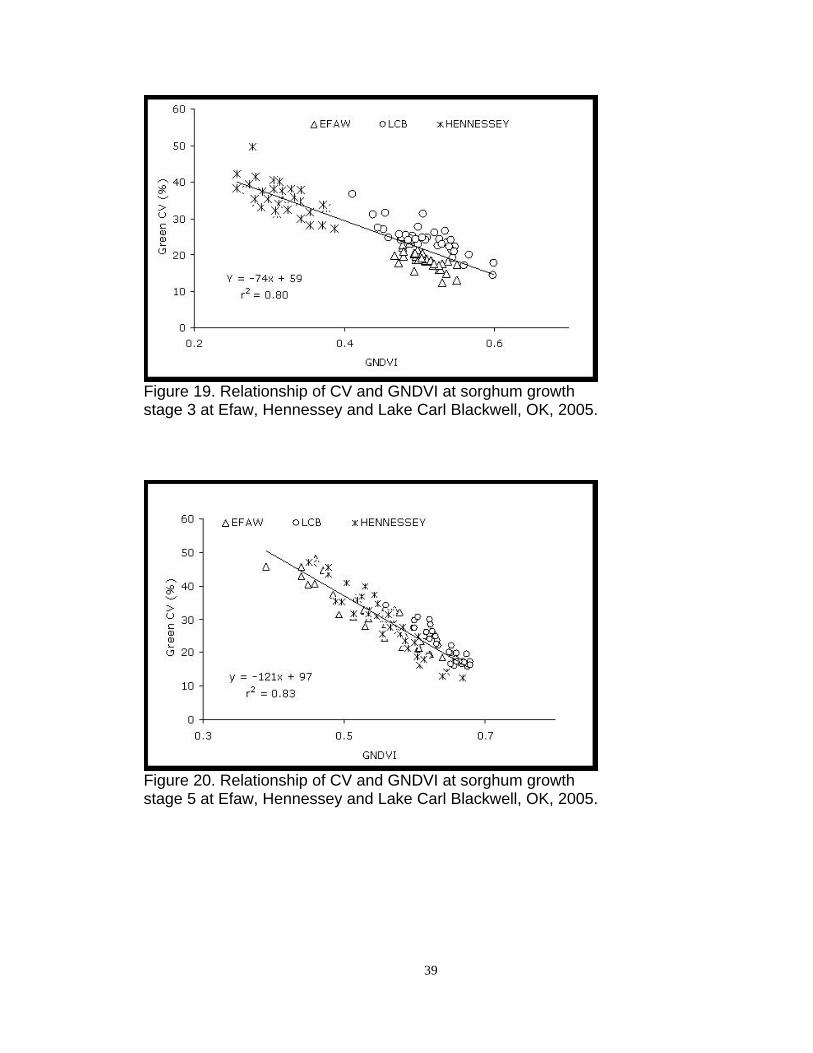
Figure 19. Relationship of CV and GNDVI at sorghum growth stage 3 at Efaw, Hennessey and Lake Carl Blackwell, OK, 2005.
Figure 20. Relationship of CV and GNDVI at sorghum growth stage 5 at Efaw, Hennessey and Lake Carl Blackwell, OK, 2005.
39
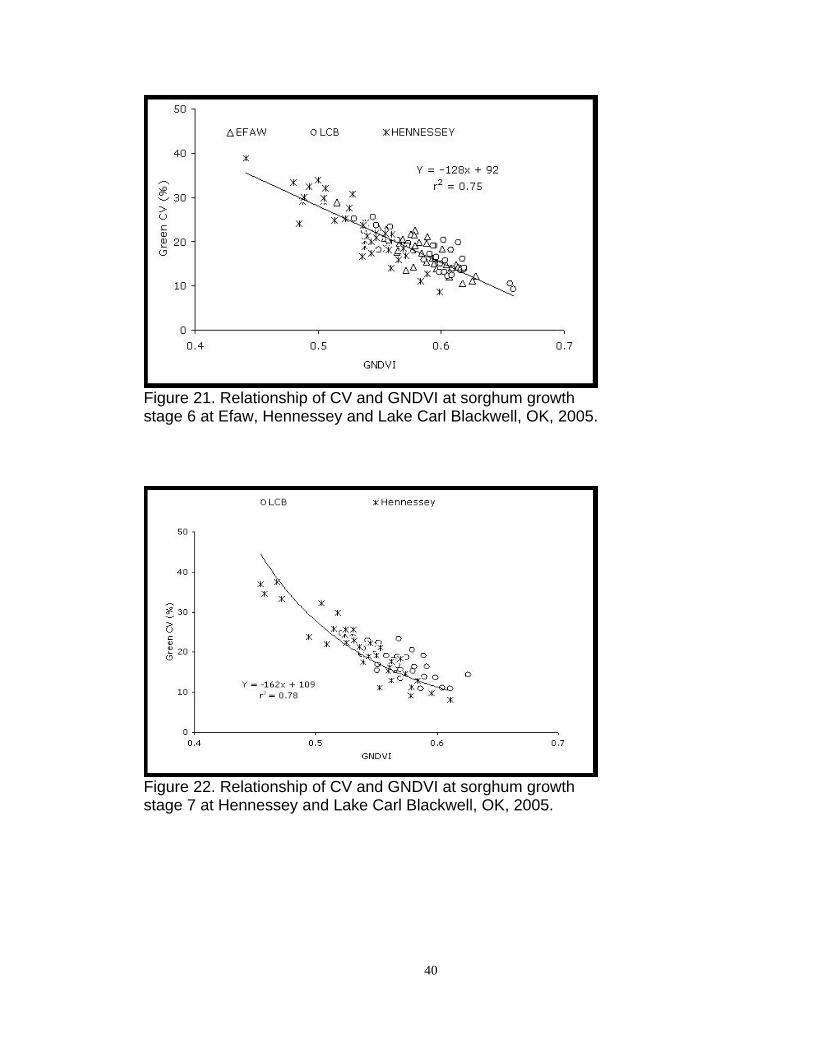
Figure 21. Relationship of CV and GNDVI at sorghum growth stage 6 at Efaw, Hennessey and Lake Carl Blackwell, OK, 2005.
Figure 22. Relationship of CV and GNDVI at sorghum growth stage 7 at Hennessey and Lake Carl Blackwell, OK, 2005.
40
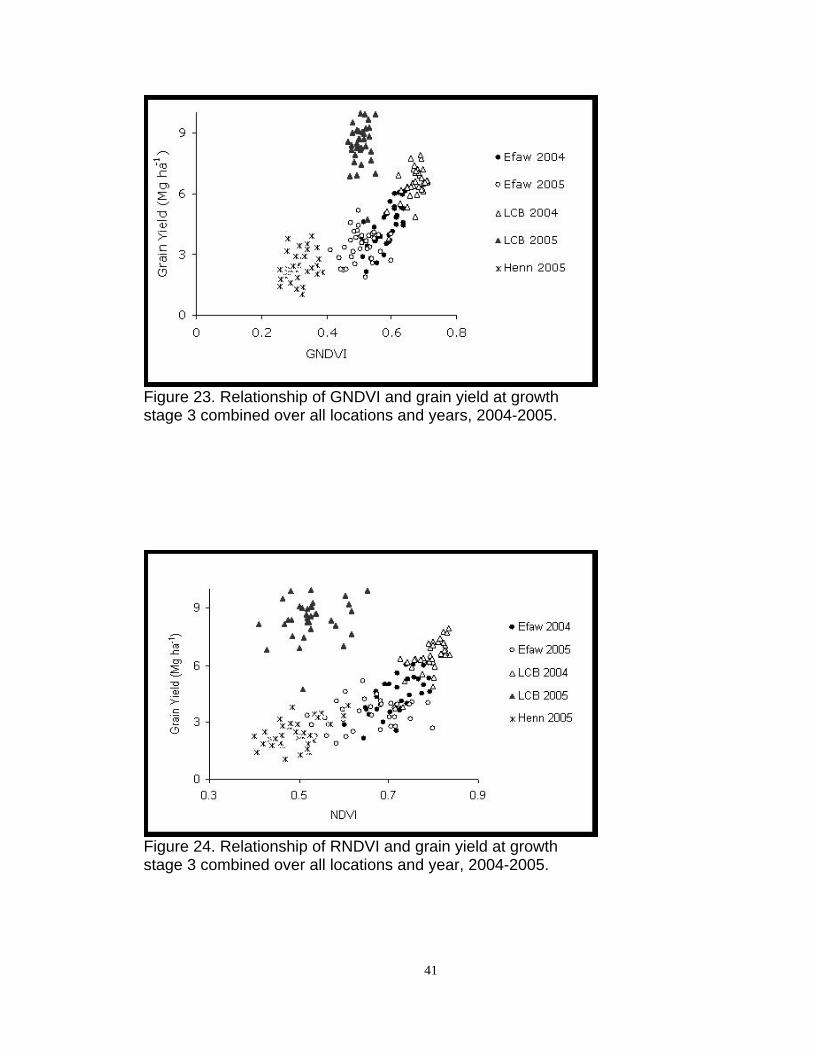
Figure 23. Relationship of GNDVI and grain yield at growth stage 3 combined over all locations and years, 2004-2005.
Figure 24. Relationship of RNDVI and grain yield at growth stage 3 combined over all locations and year, 2004-2005.
41

Figure 25. Relationship of Green INSEY and grain yield at growth stage 3 combined over all locations and years, 2004-2005.
Figure 26. Relationship of Red INSEY and grain yield at growth stage 3 combined over all locations and years, 2004-2005.
42
CHAPTER II
EFFECT OF PLANT HEIGHT, SENSING ANGLE AND HEIGHT ON YIELD PREDICTION OF CORN (ZEA MAYS L.)
ABSTRACT
Plant to plant corn (Zea mays L.) yield variability is one of the most
important issues that should be addressed to delineate the appropriate scale of
operations in a crop demand based nutrient management program specially
nitrogen. The objectives of these experiments were to determine the magnitude
of variability in mid season measured corn plant heights and their relationships
with final grain yield and to determine the best sensing height and angle where
sensors should be positioned that will provide the best relationship of NDVI and
grain yield. A total of 20 transects (each 20 m long) were used in one experiment
from which measurements of individual plant heights (at growth stages V8, VT
and R1) and grain yield were made at Efaw, Perkins and Lake Carl Blackwell,
OK in summer of 2004 and 2005. In another experiment a total of 4 transects (50
plants per transect) were used for optical sensor (bicycle mounted) and grain
yield measurements. Data analysis showed that plant height was consistently
correlated with grain yield at growth stage VT at all locations and years and
sensor readings taken at 0.76 m above the canopy at nadir showed better
relationship of NDVI and grain yield.
43
INTRODUCTION Excess fertilizer is applied for corn (Zea mays L.) throughout North America.
Aiming to obtain the highest yield in the rs traditionally
apply nitro
early-season side d aries with growth
stage and weather conditions. The am nt available in a soil of a
certain
growing season, farme
gen (N) fertilizers at uniform rates across a field as either a pre-plant or
ress application. But, plant nutrient uptake v
ount of nutrie
field may vary over time (temporal) and space (spatial). Fertilizer
management practices that fail to consider these variables may result in low N
use efficiency (NUE). Since N fertilizer has been relatively inexpensive and
weather conditions vary from year to year along with yield potential (Wilhelm et
al., 1987), producers typically apply N at levels so as not to limit yield in good
years. This can result in excess N applied beyond which the plant can remove
from the soil. In fact, Raun and Johnson (1999) estimated that NUE for world
cereal grain production systems to be only 33%, with the unaccounted 67%
representing a $15.9 billion annual loss of fertilizer N. With the increasing costs
of N fertilizer due to natural gas shortages, unaccounted fertilizer N is now
estimated to be worth more than $20 billion dollars annually. Failure to recover
the applied fertilizer may contaminate surface and subsurface water supplies.
Nitrogen losses during corn production are of special concern because large
areas are planted to this crop, and N is applied at relatively high rates, with
substantial amounts of NO
Several research works have shown that
more than half of the N applied is lost from fields by processes other than crop
3–N found in water that drains from these soils (Gast et
al., 1978; Baker and Johnson, 1981).
44
harvest during the first year afte mer, 1987; Sanchez and
ke.
e
al
r application (Black
Blackmer, 1988; Timmons and Cruse, 1990).
Paramasivam et al. (2002) showed that 21 to 36% of fertilizer N leached
below the root zone, while plant uptake accounted for 40 to 53%. Sanchez and
Blackmer (1988) reported that 49 to 64% of the fall-applied fertilizer N was lost
from the upper 1.5 m of the soil profile through pathways other than plant upta
They speculated that transport of this N to the Gulf of Mexico results in th
creation of a hypoxic zone, with dissolved oxygen levels too low to sustain anim
life, adversely impacting a $2.8 billon commercial and recreational fishing
industry in the region. Sexton et al. (1996) observed that NO 3-N leaching
increased rapidly as N rates exceeded 100 kg N ha yr for corn grown on a -1 -1
sandy loam soil in central Minnesota, and as N rates increased to about 250 kg N
ha (corresponding to maximum yield), NO-1 3-leaching increased exponentially.
They also reported that reducing N application rates by 5% less than that
required to achieve maximum corn yield reduced NO3
from
f
leaching by 40 to 45%.
Kranz and Kanwar (1995) estimated that 70% of the NO3-N leached came
less than 30% of cornfields. According to Dennis et al. (2002) spatial variability o
corn yield creates a significant challenge for N fertility management because
excessive N can result in NO3-N contamination of surface and ground water
bodies and inadequate N results in yield and profit losses. Increasing use of
spatial demand as a basis for N management can remarkably reduce surface
and ground water contamination and loss of revenue (Dorge et al., 2002).
45
Amount and timing of N fertilization can significantly affect the outcome
any efficient nutrient management program. Va
of
rious works on N management
have d
nse of
ally
eveloped a yield goal based N fertilizer recommendation, none of which
addressed inherent field spatial and temporal variability in a growing season. As
per the work of Katsvairo et al. (2003) yield goal based N application, based on
yield map data, have resulted in over fertilization of N in about 25% of the field
where corn yields were greatest and under fertilization on about 15% of the
fields where corn yields were the poorest. The biggest challenge in the current
nutrient management system is identifying areas in crop fields where respo
N would be maximized with a minimum loss to the environment. This actu
requires a through investigation and detailed measurement to understand why
crop yield varies over time and space (Sadler et al., 2000; Machado et al., 2002).
One of the best ways to improve efficiency is via crop monitoring. Crop
monitoring usually helps to improve control over temporal variation in crop growth
and also provides information on crop development that is useful in developing
management strategies that improve water and nutrient use efficiency. Water and
nutrient applications
made at periods of peak demand improve water (Passioura,
1994) and nutrient (Baethgen and Alley, 1989) use efficiency and increase grain
yields. Furthermore, efficient use of nutrients could result in N savings without
reduction in grain yield (Stone et al., 1996). Most research work on plant
monitoring has been done by remote sensing (Nilsson, 1995; Moran, 1997). The
main emphasis has been to increase the accuracy of estimating crop biomass
(Bedford et al., 1993), leaf area index (Bouman et al., 1992), nutrient deficiency
46

(Thom
e
as and Oerther, 1972; Peñuelas et al., 1994), water stress (Peñuelas et al.,
1994), and diseases (Nilsson, 1995; Pederson and Nutter, 1982). However, littl
effort has gone into relating these measurements to final grain yield (Blackmer et
al., 1996; Zhang et al., 1998) and determining how this information could be used
for managing site-specific farming.
There have been several techniques tested to estimate N uptake and
availability in corn, most which are time consuming and cumbersome. These
. include chlorophyll meter readings, destructive plant sampling and soil sampling
Increased scientific understanding of spectral responses of crops is increasing
the potential for using remote sensing to detect nutrient stresses. One of the
earliest digital remote-sensing analysis procedures developed to identify the
vegetation contribution in an image was the ratio vegetation index, created by
dividing near-infrared reflectance (NIR) by red reflectance (Jordan, 1969). The
basis of this relationship is the strong absorption (low reflectance) of red light by
chlorophyll and low absorption (high reflectance and transmittance) in the NIR by
green leaves (Avery and Berlin, 1992). Blackmer et al. (1994) and Thomas and
Oerther (1972) found that light reflectance near 550 nm was best for separating
N-deficient from non-N-deficient corn and sweet pepper (Capsicum annuum L.)
leaves, respectively. Bausch and Duke (1996) investigated using a ratio of
NIR/green reflectance as an N-sufficiency index. Comparison of this method to
the SPAD chlorophyll meter measurements (Minolta Corp., Ramsey, NJ)
demonstrated that the NIR/green ratio and SPAD measurements exhibited a 1:1
relationship and that the ratio could be used to determine fertilization need for
47
irrigated corn. Aase and Tanaka (1984) reported a relationship between green
leaf dry matter and NIR/red ratios, and suggested that reflectance measurements
could be used to estimate leaf dry matter or leaf area measurements in spring
and winter wheat (Triticum aestivum L.). Work by Stone et al. (1996)
demonstrated that total plant N could be estimated using spectral radiance
measu rements in the red (671 nm) and NIR (780 nm) wavelengths. They
calculated a plant-N-spectral-index for the amount of fertilizer N required to
correct in-season N deficiency in winter wheat.
Sensor based variable rate technologies nowadays widely used in site-
specific nutrient management scheme. However, their practical application on
field is closely related to soil and crop parameters that could possibly alter the
information collected from fields at different circumstances. Hence thorough
investigation of the relationship between crop parameters and sensor readings
would be of a great importance in the refinement of sensors used in crop
measurements. Researches have shown that crop parameters such as plant
height affect early season sensor readings, as it is related to final grain yield and
yield variability in a field. Sadler et al. (2000) reported that Plant height and
biomass during corn vegetative development showed significant spatial variabilit
in an 8-ha cornfield in South Carolina. Plant height at the V12 (12
a
y
e)
r
k after
rly
th leaf stag
(Ritchie et al., 1993) correlated with grain yield in a dry year but not in a wet yea
in a 2.7 ha field in Texas (Machado et al., 2002). Plant height at 4 and 8 w
emergence correlated with corn yield at three of five sites in the Corn Belt in the
USA (Mallarino et al., 1999). They also reported that conditions that favored ea
48
season corn growth are the most important factors in explaining the spatial yield
variability. Katsvairo et al. (2003) reported that plant height at the V6 and V10
stages were more sensitive indicators than biomass and N uptake at the V6, R
and R6 growth stages in assessing the spatial variability in corn field.
Sensor measurements traditionally taken by holding the sensor at a
certain height from the corn canopy disregarding the effect of individual pla
height on biomass and grain yield estimation. Thus to study the effect of
individual plants height on estimation of biomass
1,
nt
and yield, considering individual
plants
Therefore two different experiments were designed with the following
hypothesis.
population is normally distributed over the mean height.
in the course of sensing would be more informative.
1. individual corn plant height has significant effect on final grain yield
2. Sensor measurements taken at different geometric positions and height in
reference to corn canopy surface can equally be used in estimating final
grain yield.
The objectives of these experiments were,
1. to determine the best combination of sensing height and sensing angle
where sensors would be positioned to get NDVI measurements that can
be used to estimate final grain yield.
2. to determine the effect of individual plant height measurements on corn
grain yield at different growth stages and to observe if plant height
49
MATERIALS AND METHODS
Sensing Height and Angle Experiment
Two already established corn fields were used in the summer of 2004, one
near S ur
stoll),
(Oklahoma State
university research site) located on a Port fine-silty, mixed, superactive, thermic
Cumulic Haplustoll.
Bt corn variety was used at both locations with 113 days maturity at Efaw
and 108 days maturity at Perkins. At each location two transects were selected
from corn rows where there is detectible variability in plants. There were fifty
sequential plants in each transect used for by-plant sensor readings and yield
measurements. Distance of each individual plant in relation to and from its
neighbor was measured in order to determine by-plant corn grain yield per area
(based on the area occupied as a function of neighboring plants) and by-plant
sensor reading. Plants were tagged at V6 (six leaf fully expanded) to avoid
confusion of missing plants.
bike m of light,
24 inch by positioning
tillwater (planted on April 7), at the Agronomy Research Station (Easp
loam fine-loamy, mixed, superactive, thermic Fluventic Haplustoll) and Perkins
(planted April 2) (Teller sandy loam-fine-loamy, mixed, thermic Udic Argiu
Oklahoma. In summer of 2005 transects were selected, from corn field at Efaw
(planted April 7) and Lake Carl Blackwell (planted April 12)
Sensor readings were taken using Oklahoma State University designed
ounted (GreenSeeker™), which produces an infrared sensing strip
es long and 0.5 inches wide. Senor readings were taken
50
the sensor 76 cm and 10 at growth stages V8
ight full expanded leaves), VT (tasseling), and R1 (silking). Two sensing angles
e the canopy) and 45 degree (sensor
tilted a
ly
Percent grain N was determined using dried grain samples which were
ground to pass a 0.125 mm (120-mesh) sieve and analyzed for total N using a
Carlo
AS
at
r of 2004 and at Efaw and Lake Carl Blackwell in
summer of 2005.
0 cm above corn canopy surface
(e
nadir (senor held parallel and directly abov
t 45 degree from the canopy) were used to take readings from the
selected rows at each growth stage.
Ears from plants in each transect were harvested and weighed individual
and recorded. Once removed from the stalk, ears were dried at 66°C for 48
hours and weighed before and after shelling. The weight taken from the dry,
shelled corn was the final grain weight used for yield determination.
Erba (Milan, Italy) NA-1500 dry combustion analyzer (Schepers et al.,
1989). The relationship between NDVI versus grain yield and grain N was
determined by simple linear regression method using proc reg procedure in S
software program.
Effect of Plant Height on Grain Yield
This experiment was conducted on an already established corn field
Efaw and Perkins, in summe
Plant height and grain yield measurements were made on five transects of
20 m length which were selected randomly from corn field at each location. At
51

corn growth stage V6 individual plants in each transect were counted and
distance between plants in each transect measured and recorded and each plant
was tagged to track missing plants. The first and the last plant were not
considered for analysis to avoid boarder effect. Distances between plants
used to calculated area occupied by e
were
ach plant in relation to its neighbor.
Relative area occupied by a plant was calculated by the following formula:
RA iiiii ⎥⎦⎢⎣
+= +−2211
Where: A is the area occupied by the i
dddd ⎤⎡ −−
i
(V10
centimeter graduated yard stick from the base of the plant up
to the tip of fully expanded leaf (stretched vertically) at growth stages V8. At
growth stages VT and R1 plant height measurement was made from the base of
recorded individually. Once removed from the stalk, ears were dried at 66°C for
fter shelling. The weight taken from the dry,
shelled
th plant,
di-1,di,di+1 are the distances to the i-1, i, and i+1 plants and
R is the row spacing
Individual corn plant height was measured at three growth stage V8
in fall of 2005), VT and R1 for each transect at each location. Plant height was
measured by using
the plant to the collar of the last leaf which bundles the tassel.
Ears from plants in each transect were harvested and weighed and
48 hours and weighed before and a
corn was the final grain weight used for yield determination. Relationship
between plant height and grain yield was estimated using simple linear
52

regression method using proc reg procedure in SAS (SAS institute, 1988)
software program.
53
RESULTS AND DISCUSSION
Plant Height and Grain Yield
rop Year 2004C
After excluding dead or damaged plants a total of 514 (Efaw) and 383
(Perkins) individual plants in five transects were used for height and grain yield
measurements. Average corn plant heights of combined transects were 107, 171
and 174 cm at Efaw and 80, 113 and 130 cm at corn growth stages V8, VT and
R1 at Perkins, respectively (Table 1). Corn planted at Perkins was found to be
relatively short due to the sandy texture of the soil and less efficient to conserve
moisture during the growing cycle. As a result most plants at this site had
stunted growth and resultant low grain yields.
There was significant variability observed in by-plant grain yield of corn.
Grain yield of individual plants ranged from 979 kg ha-1 (15 bu/acre) to 14,160 kg
ha-1 (226 bu/acre) at Efaw and from 1,151 kg ha-1 (18 bu/acre) to 8,837 kg ha-1
(141 bu/acre) at Perkins (Table 2). The average corn grain yield was 5,219 and
3,924 kg ha-1 with corresponding standard deviations of 2,070 and 1,321 Kg ha-1
at Efaw and Perkins, respectively (Table 2). At both locations close to 70 and 95
percent of by-plant grain yield measurements were in the range of one and two
standard deviations from the mean grain yield, respectively (Table 2).
Simple regression analysis of the data showed that there was a significant
relationship between corn grain yield and plant height at both locations in this
year. At Efaw, grain yield calculated on an area basis was highly correlated with
plant height at growth stage VT (r2=0.61) (Figure 1). Similar results were found at
54

growth stage R1 at Efaw ip was improved when
y-plant corn grain yield was regressed with plant height, without considering
ficient of simple determination (r2) of 0.74
igure 2). The improved relationship of by plant yields with plant
height
is
Crop y
(data not shown). This relationsh
b
area. This was shown by a coef
obtained at VT (F
, not accounting for area was also observed at R1 (data not reported).
At Perkins an r2 of 0.55 was obtained at growth stage R1 when by-plant
grain yields accounting for area were regressed with individual plant height
measurements (Figure 3). When by-plant grain yields without considering area
were regressed on plant height, an r2 of 0.69 was obtained at R1 (Figure 4). Th
same trend was observed at growth stage VT (improved correlation of non-area
dependent data versus area dependent).
ear 2005
A total of 455 (at Efaw) and 540 (at Lake Carl Blackwell) plants in five
transects were used for by-plant height and grain yield measurements. Average
plant height was 128, 161 and 170 cm at Efaw and 130, 186, 206 cm at Lake
Carl Blackwell at growth stage V8, VT and R1, respectively (Table 3). Corn
plants were relatively taller at Lake Carl Blackwell as compared to the Efaw site.
This was due to irrigation at the Lake Carl Blackwell site which resolved the
water stress problem from planting to harvest and increased early seas
on and
late se
ason biomass accumulation.
By-plant corn grain yields ranged from 258 kg ha-1 (4 bu/acre) to 15,881
kg ha-1 (226 bu/acre) at Efaw and from 2,327 (37 bu/acre) to 42,906 kg ha-1 (684
55
bu/acre) at Lake Carl Blackwell (Table 4). Average by-plant corn grain yields
were 5,093 kg ha-1 (81 bu/acre) at Efaw and 16,757 kg ha-1 (267 bu/acre) at La
Carl Blackwell (Table 4). At both locations 71 and 96 percent of individual
yields were with in one and two standard deviations from the mean by-plant yield,
respectively (Table 4) and appeared to be normally distributed.
ke
plant
Simple regression analysis of the data revealed that by-plant corn grain
yield (calculated on an area basis) was related to plant height at growth stage VT
(r = 0.53) at Efaw (Figure 5). Similar results were found at growth stages V8 and
R1 (data not shown). This relationship was somewhat better when by-plant yield
(non-area based) was regressed with plant height at growth stages VT (r =0.62)
and slightly weaker at V8 (data not shown) at the Efaw site (Figure 6). The same
scenario of improved relationship between by-plant corn grain yield and plant
height was observed in 2004 when non-area based yield was related to individual
plant height measurements.
nopy surface and holding the sensor
directly
canopy, or at a 45 degree angle (Figure 7). Data for the 45 degree angle
2
2
Sensing Height and Angle
Results of simple regression analysis of the data have shown that there
was a significant variation in the relationship between grain yield and NDVI
depending on height and geometric position of the sensor. Measurements of
NDVI taken 0.76 m above the corn ca
above the corn canopy (nadir) showed improved correlation with corn
grain yield at growth stage V8 (r 2=0.69) when compared to 1m directly above the
56
measurements were lost for the VT growth stage, however, similar to that note
at V8, improved correlation was found at the 0.76 m height when compared to
1m for readings collected at this growth stage (Figure 8). Identical to results at
the V8 growth stage, 0.76m NDVI data collected directly above the corn canopy
at R1 (Figure 9) resulted in improved correlation with final by-plan
d
t grain yield
when compared to NDVI data collected at the 1m height either directly above the
canopy or at a 45 degree angle.
In general the relationship of grain yield and NDVI was weaker when
moving from 0.76 m to the 1 m height above the canopy surface and from nadir
to the 45 degree position (Figures 7 and 9). This may be due to the sensor’s loss
of vision of crop canopy at increased height and 45 degree angles. The
relationship between NDVI and by-plant grain yields remained positive when
moving from 0.76m to 1m, but the correlation was significantly reduced (Figures
7, 8, and 9). However, consistent for both the V8 and R1 growth stages, sensing
at 45 degree angles significantly decreased the correlation of NDVI and by-plant
grain yield, especially at the 1m height (Figures 7 and 9).
57
CONCLUSIONS
Results from this study showed that part of the variability in corn grain yield can
be explained by plant height data collected at either VT or R1 growth stages.
Plant height is clearly an important variable when recognizing differences in yie
potential in corn, evidenced in the consistency for the two stages of growth
reported in this work. Similar stud
ld
ies by Machado et al. (2002) showed that 60%
of varia
VI
sensor readings
m directly above the corn canopy, and using measured plant
height.
tion in corn yield was explained by plant height.
Sensor NDVI measurements taken at two vertical distances above the
corn canopy and two geometric sensor positions showed differences in
performance of predicting by-plant corn grain yield. Results of regression
analysis of the data showed the presence of a strong relationship between ND
and grain yield when sensor measurements were taken at nadir position and
0.76 m above the corn canopy surface. This relationship was weak when sensor
measurements were taken 1 m high either directly above or at 45 degree angles.
By plant corn grain yields can be accurately predicted using
collected 0.76
58

REFERENCES Aase, J. K., and D. L. Tanaka. 1984. Effects of tillage practices on soil and wheat
spectral reflectance. Agron. J. 76:814–818.
Avery, T.E., and G.L. Berlin. 1992. Fundamentals of remote sensing and air photo interpretation. 5th ed. Macmillan, New York. Baethgen, W. E., and M. M. Alley. 1989. Optimizing soil and fertilizer nitrogen use by intensively managed winter wheat: I. Crop nitrogen uptake. Ag J. 81:116–120.
ron.
Baker, J. L., and H. P. Johnson. 1981. Nitrate-nitrogen in tile drainage as affected by fertilization. J. Environ. Qual. 10:519–522. Bausch, W. C., and H. R. Duke. 1996. Remote sensing of plant nitrogen status in corn. Trans. ASAE 39:1869–1875. Bedford, R. K., E. R. Harvey, and P. Di Prinzio. 1993. Remote sensing of crop biomass with a hand-held multispectral radiometer. p. 392. In Proc. 7th Aust. Agron. Conf., Adelaide, Australia.
F.M. D'Itri and L. M. Wolfson (ed.) Rural groundwater contamination.
Blackmer, T. M, Schepers, J. S., Varvel, G. E. 1994. Light reflectance compar with other nitrogen stress measurements in corn leaves. Agron. J. 86: 934-938.
Blackme
Blackmer, A. M. 1987. Losses and transport of nitrogen from soils. p. 85–103. In
Lewis Publ., Chelsea, MI.
ed
r, T. M., J. S. Schepers, G. E. Varvel, and G. E. Meyer. 1996. Analysis
of aerial photography for nitrogen stress within cornfields. Agron. J. 88:729–733.
ouman, B. A. M., H. W. J. van Kasteren, and D. Uenk. 1992. Standard relations to estimate ground cover and LAI of agricultural crops from reflectance measurements. Eur. J. Agron. 1:249–262.
Dennies, D.L., D.L. Karlen, D. B. Jaynes, T.C. Kaspar, J.L. Hatfield, T.S. Colvin, and C.A. Cambardella. 2002. Nitrogen management strategies to reduce
nitrate leaching in tile-drained Midwestern soils. Agron. J. 94:153-171.
B
59
Doerge, T.A. 2002. variable rate ment creates opportunities and challenge for corn producers [online]. Available at
nitrogen manage http://www.plantmanagementnetwork.org/cm/. Crop management doi. 10.1094/cm-2002-0905-01-RS. Gast, R. G., W. W. Nelson, and G. W. Randall. 1978. Nitrate accumulation in soils and loss in tile drainage following nitrogen applications to continu
ous
corn. J. Environ. Qual. 7:258–261. Jordan, C. F. 1969. Derivation of leaf area index from quality of light on the forest floor. Ecology 50:663–666. Katsvairo W.T., W.J. Cox, H.M. Vans Es, and M. Glos. 2003. Spatial yield response of two hybrids at two nitrogen levels. Agron. J. 95:1012-1022.
Group on water quality, Kansas City, MO. 5-8 Mar. 1995. Am. Soc. of Agric. Eng. St. Joseph, MI.
Nesmith, and W. Xu. 2002. Spatial and temporal variability of corn growth and grain yield: Implication
allari P.N. Hinz. 1999. Interpreting within field relationships between crop yields and soil plant analysis using factor
Kranz, W.L., and R.S. Kanwar. 1995. Spatial distribution of leachate losses due to preplant tillage methods. In Clean water-clean environment–21st century. Vol. 2. Proc. Conf. Working Machado, S., E.D. Bynum, Jr., T.L. Archer, R.J. Lascano, L.T. Wilson, J. Bordovsky, E. Segarra, K. Bronson, D.M. for site-specific farming. Crop Sci. 42:1564-1576. M no, F., E.S. Oyarzabal, and analysis. Prec. Agric. 1:15-25. Moran, M. S., Y. Inoue, and E. M. Barnes. 1997. Opportunities and limitations for Sens. Environ. 61:319–346.
image based remote sensing in precision crop management. Remote
Nilsson, H. E. 1995. Remote sensing and image analysis in plant pathology. Annu. Rev. Phytopathol. 15:489–572.
nd soil under citrus production. J.
of Environ. Qual. 31:671-681.
Paramasivam, S., A.K. Alva, A. Fares and K.S. Sajwan. 2002. Fate of nitrate a bromide in an unsaturated zone of a sandy Passioura, J. B. 1994. The yield of crops in relation to drought. p. 343–359. In
60
K.T. Boote et al. (ed.) Physiology and determination of crop yield. ASA, SSA, and SSSA, Madison, WI. Pederson, V. D., and F. W. Nutter, Jr. 1982. A low-cost portable multispectral
radiometer for assessment of onset and severity of foliar disease of barley. Proc. Int. Soc. Optical Eng. 356:126–130. Peñeuelas, J., I. Filella, C. Biel, L. Serrano, and R. Savé. 1993. The reflectance at the 950–970 nm region as an indicator of plant water status. Int. J. Remote Sens. 14:1887–1905. R cereal production. Agron. J. 91:357–363.
aun, W. R. and G. V. Johnson. 1999. Improving nitrogen use efficiency for
itchie, S.W., J.J. Hanway, and G.O. Benson. 1993. How a corn plant develops.
J. 92:403-410.
-
R Spec. Rep. 48. Iowa State Univ. Ext. Serv. Ames. IA. Sadler, E.J., P.J. Bauer, W.J. Busscher, and J.A. Millen. 2000. Site specific analysis of a droughted corn crop: II. Water and stress. Agron. Sanchez, C. A., and A. M. Blackmer. 1988. Recovery of anhydrous ammonia derived nitrogen-15 during three years of corn production in Iowa. Agron. J. 80:102–108. Schepers, J. S, D. D. Francis, and M. T. Thompson. 1989.Simultaneous determination of total C, total N, and 15N on soil and plant material. Commun. Soil Sci. Plant Anal. 20:949-959. Sexton, B.T., J.F. Moncrief, C.J. Rosen, S.C. Gupta, and H.H. Cheng. 1996. Optimizing nitrogen and irrigation inputs for corn based on nitrate leaching and yield on a coarse-textured soil. J. Environ. Qual. 25:982–992. Stone, M. L., J. B. Solie, W. R. Raun, R. W. Whitney, S. L. Taylor, and J. D.
Ringer. 1996. Use of spectral radiance for correcting in-season fertilizer nitrogen deficiencies in winter wheat. Trans. ASAE 39: 1623–1631.
Thomas, J. R., and G. F. Oerther. 1972. Estimating nitrogen content of sweet
pepper leaves by reflectance measurements. Agron. J. 64:11–13.
Timmons, D. R., and R. M. Cruse. 1990. Effect of fertilization method and tillage on nitrogen-15 recovery by corn. Agron. J. 82:777–784.
61
W , W. W., J. S. Schepers, L. N. Milhelm ielke, J. W. Doran, J. R. Ellis, and W. W.
Stroup. 1987. Dryland maize development and yield resulting from tillage and nitrogen fertilization practices. Soil Tillage Res. 10:167-179. Zhang, M., P. Hendley, D. Drost, M. O'Neill, and S. Ustin. 1998. Corn and soybean yield indicators using remotely sensed vegetation index. p. 1475– 1481. In P.C. Robert et al. (ed.) Proc. Int. Precision Ag. Conf., 4th, Minneapolis, MN. 19–22 June 1998. ASA, CSSA, and SSSA, Madison, WI.
62
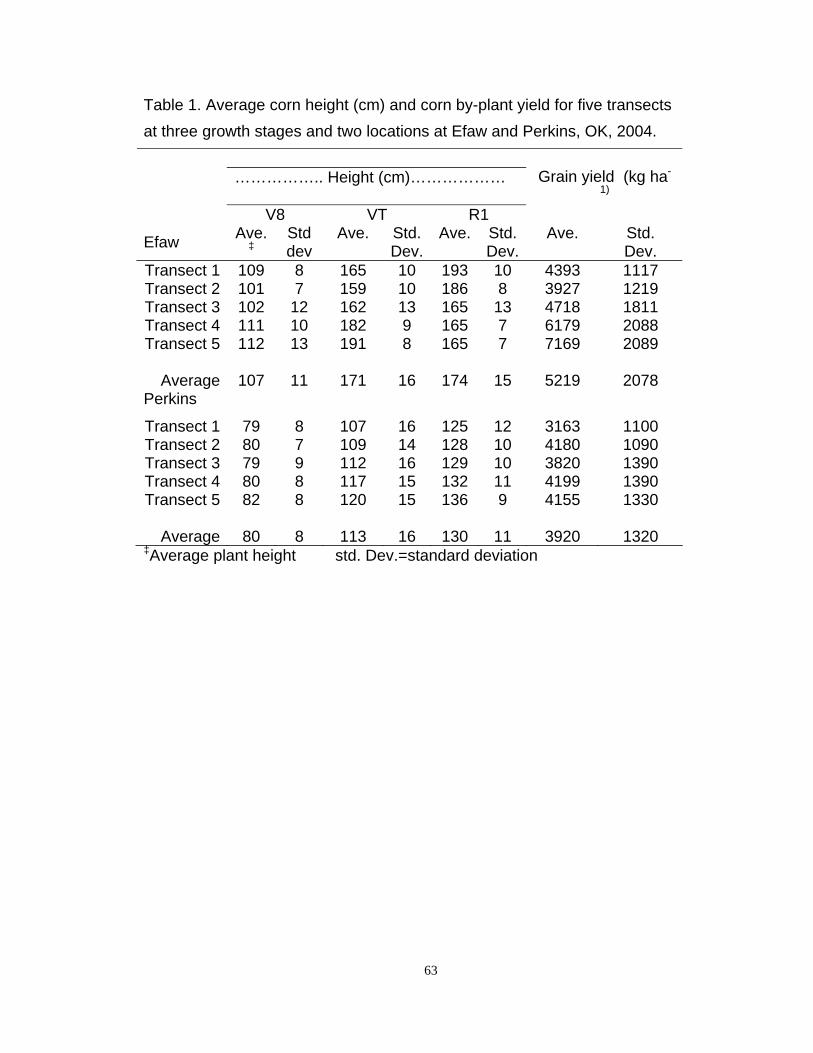
Table 1. Average corn height (cm) at three growth stages and two locations at Efaw and Perkins, OK, 2004.
and corn by-plant yield for five transects
…………….. Height (cm)………………
V8 VT R1
Grain yield (kg ha-
1)
Efaw Ave.‡
Std dev
Ave. Std. Dev.
Ave. Std. Dev.
Ave. Std. Dev.
Transect 1 Transect 2
109 101
8 165 10 193 10 4393 1117
Transect 3 Transect 4 Transect 5
Average
102 111 112
107
7 12 10 13
11
159 162 182 191
171
10 13 9 8
16
186 165 165 165
174
8 13 7 7
15
3927 4718 6179 7169
5219
1219 1811 2088 2089
2078
Perkins
Transect 1 Transect 2 Transect 3 Transect 4 Transect 5
Average
79 80 79 80 82
80
8 7 9 8 8 8
107 109 112 117 120
113
16 14 16 15 15
16
125 128 129 132 136
130
12 10 10 11 9
11
3163 4180 3820 4199 4155
3920
1100 1090 1390 1390 1330
1320
‡Average plant height std. Dev.=standard deviation
63
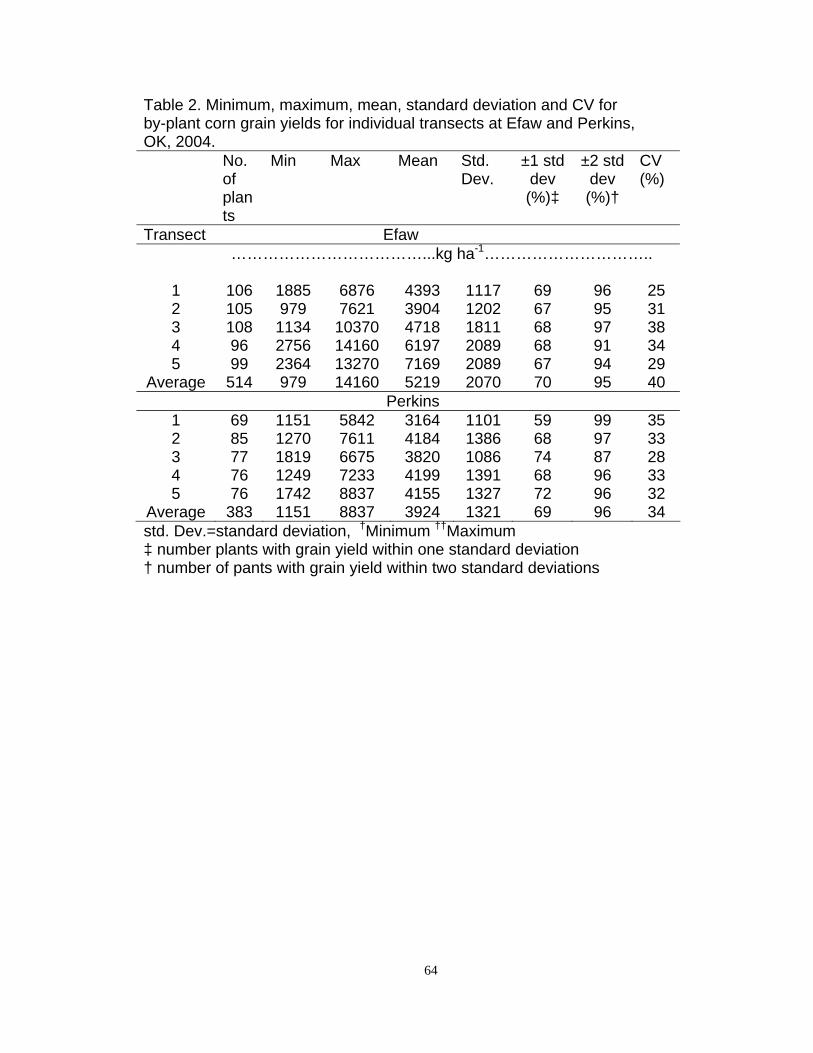
Table 2. Minimum, maximum, mean, standard deviation and CV for by-plant corn grain yields for individual transects at Efaw and Perkins, OK, 2004. No.
oplants
Min Max Mean Std. ±1 stdd(%)‡
±2 std
(%)†
CV f Dev. ev dev (%)
Transect E faw … …… ………… ..kg ha-1 ………………… …… ……. ……… …..
1 106 18 93 17 69 96
9 04 0 6 95 11 10370 18 11 68 97
9 27 14160 97 89 68 91 5
A99 2364
913270 14160
69 19
20897
67 7
94 95
Perkins
85 6876 43 11 252 105 79 7621 39 12 2 7 313 108 34 47 18 384 6 56 61 20 34
verage 514 79 7152 20
0 0
29 40
1 2 3 4 5
Average
687778
1151 1270 1819 1249 1742 1151
648420995524
08892
321
5676769
99 97 87 96 96 96
9 5 7 6 6 33
584276116675723388378837
31 1141 1338 1041 1341
13139
1 6 6 1 7
9 8 4 8 2
353328333234
st n d d atio ini † im
† number of pants with grain yiel
d. Dev.=sta dar evi n, †M mum †Max um ‡ number plants with grain yield within one standard deviation
d within two standard deviations
64
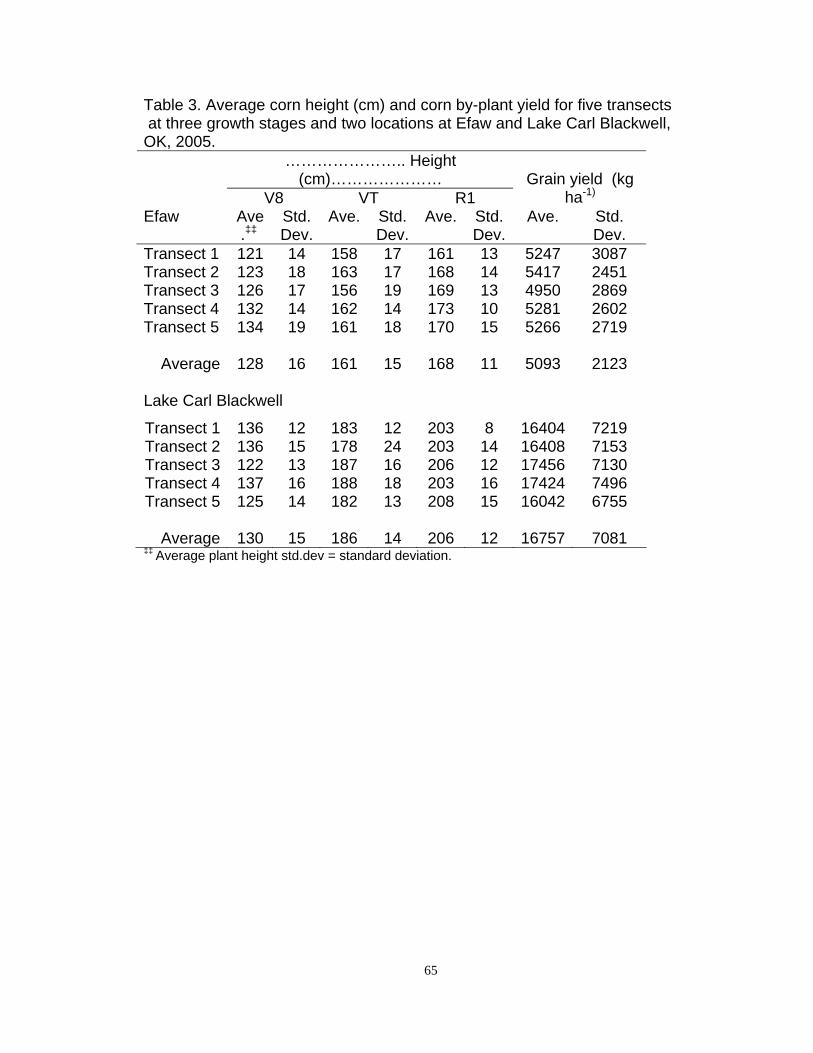
Table 3. Average corn height (cm) and corn by-plant yield for five transects ell, at three growth stages and two locations at Efaw and Lake Carl Blackw
OK, 2005.
… … t (cm)…………………
V8 VT R1
…… ……… .. Heigh Grain yield (kg
ha-1)
Efaw Ave Std. Ave. Std. Ave. Std. Dev.
Ave. Std. Dev.
TraTransect 2 Transect 3 Transect 4 Transect 5
Average
123
8
18 163 11
17 19 14
168
14 5417 4950 5281 5266
5093
2451
.‡‡ Dev. Dev.nsect 1 121 14 158 17 161 13 5247 3087
126132134
12
17 14 19
16
56 62
161 18
161 15
169173170
168
13 10 15
11
286926022719
2123
Lake Carl Blackwell
Transect 1 Transect 2 Transect 3 Transect 4
6 6 2 7
11111
12 24 16 18 13
1640416408174561742416042
7081
72197153713074966755
Transect 5
Average
130
15
186
14
206
12 1
13131213125
12 15 13 16 14
83 78 87 88 82
203203206203208
8 14 12 16 15
6757
‡‡ Average plant height std.dev = standard deviation.
65
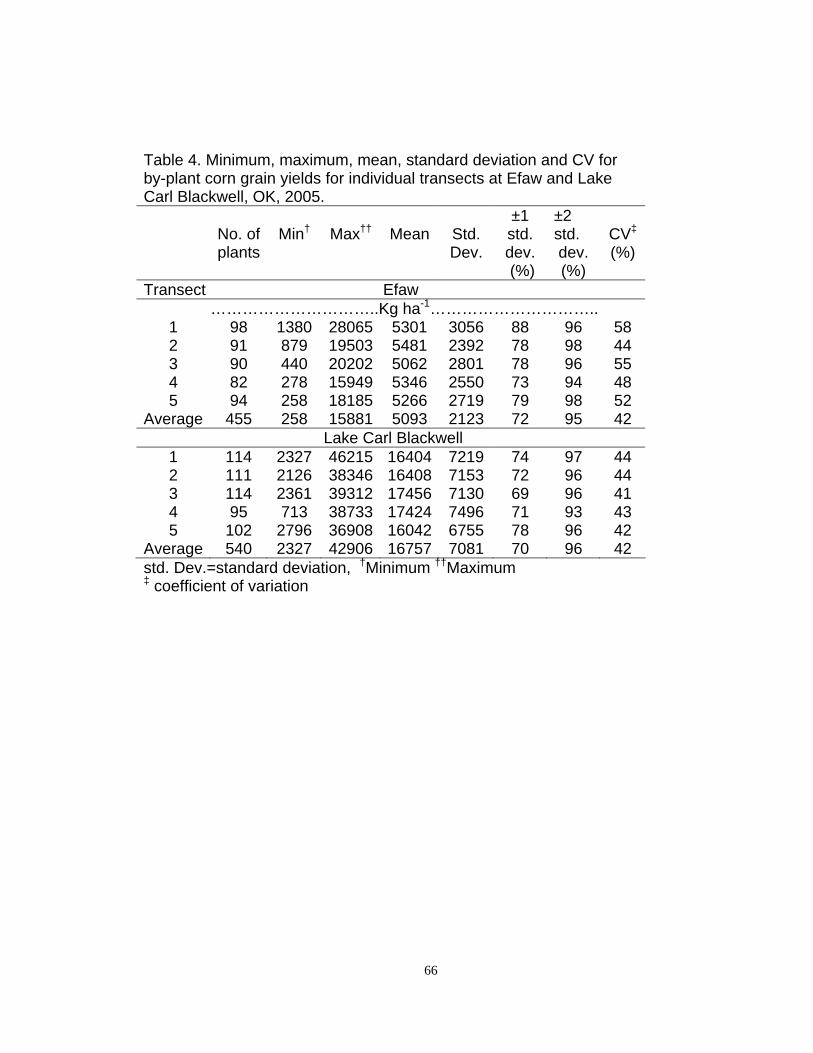
Table 4. Minimum, m deviation and C for y-plant corn grain yie ects at Efarl Blackwell, OK, 2005.
No. of la
Max†† an
Stdev
±1
de (%
std.
ev.)
aximum, mean, standardlds for individual trans
Vb aw and Lake C
p nts
Min†
Me . std.
D .
±2
v. d) (%
(%)
CV‡
Transect Efaw …… … … ..K a- … … ……… …… …… g h 1…… …… ……… ..
1 9 1 01 56 88 2 91 879 19503 481 2392 78 98
4 62 01 78 4 82 278 15949 5346 2550 73 94 48
58 2
18185 5266 93
2719 23
79 7
98 52
Lake Carl Blackwell
8 380 28065 53 30 96 58 5 44
3 90 40 20202 50 28 96 55
5 94 2Average 455 58 15881 50 21 2 95 42
1 12 13 4
1
5 1Average 540 2327 42906 16757 7
14 11 14 5 9
2327 2126 2361 7
2796
0408562442
1953309581
776777
02 1 3
46215383463931238 33736908
164164174174160
72 71 7174
6
5670
4 97 2 96 9 1
96 93
8 0
96 96
44 44 41 43 42 42
std. Dev.=standard deviation, Minimum Maximum ‡ coefficient of variation
† ††
66
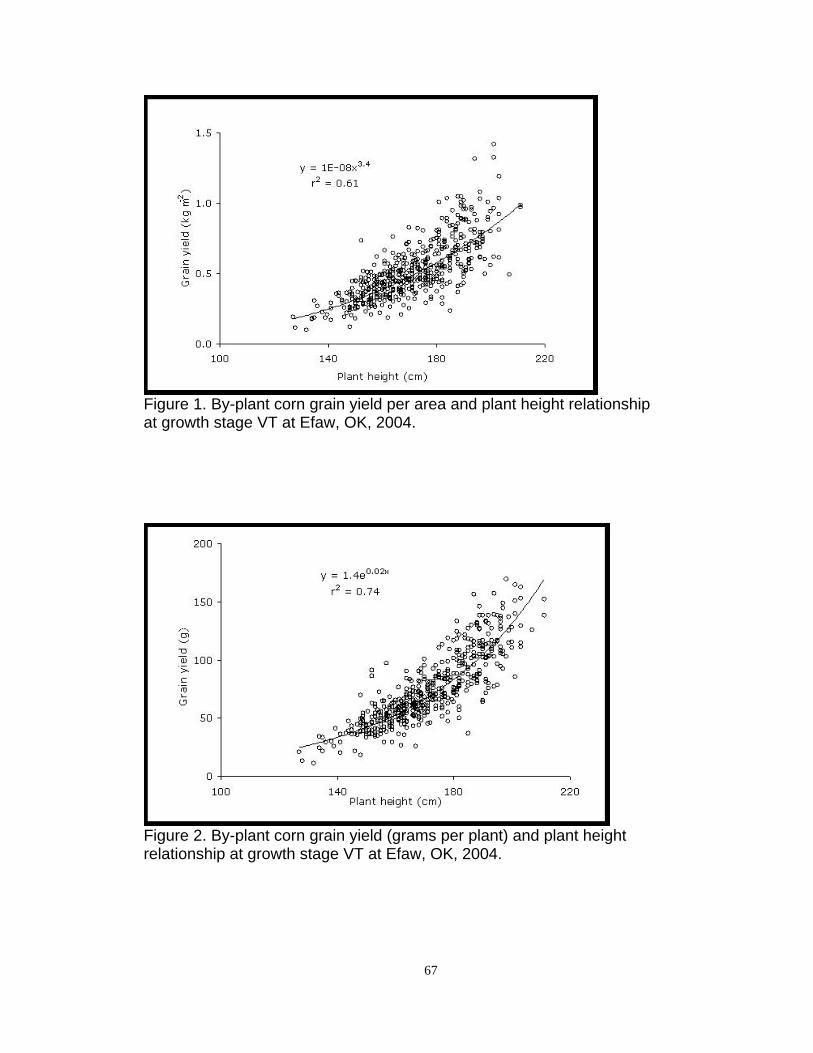
Figure 1. By-plant corn grain yield per area and plant height relationship
s T aw 20
Figure 2. By-plant corn grain yield (grams per plant) and plant height relationship at growth stage VT at Efaw, OK, 2004.
at growth tage V at Ef , OK, 04.
67

Figure 3. By-plant corn grain yield per area and plant height relationship at growth stage R1 at Perkins, OK, 2004.
K, 2004.
Figure 4. By-plant corn grain yield (grams per plant) and plant height relationship at growth stage R1 at Perkins, O
68

Figure 6. By-plant corn grain yield (grams per plant) and plant height relationship at growth stage VT at Efaw, OK, 2005.
Figure 5. By-plant corn grain yield per area and plant height relationship at growth stage VT at Efaw, OK, 2005.
69
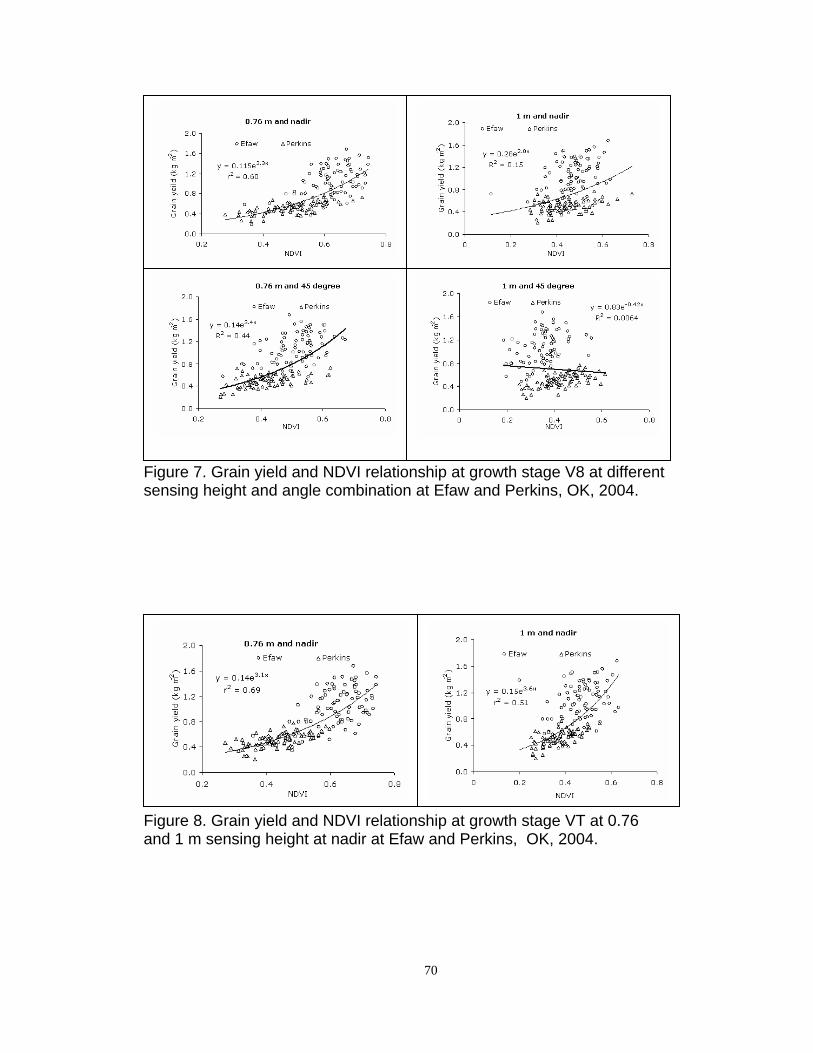
igure 7. Grain yield and NDVI relationship at growth stage V8 at different ensing height and angle combination at Efaw and Perkins, OK, 2004.
F
s
Fa
igure 8. Grain yield and NDVI relationsnd 1 m sensing height at nadir at Efaw
at 0.76 004.
VT hip at growth stage and Perkins, OK, 2
70

FaP
igure 9. Grain yield and NDVI relatiot different sensing height and angle cerkins, OK, 2004.
nship at growth stage R1 ombination at Efaw and
71

APPENDICES
72

Growth stage escription D
0 Emergence occurs (coleoptile is visible at the soil surface) 3- 10 days 1 Three leaf (leaves fully expanded) 10 days after emergence 2 Five leaf (leaves full expanded ) 3 weeks after emergence 3 Growing point differentiation (time of changing from vegetative to
reproductive) 5 Boot stage (The head is full size and is encompassed by the flag-leaf
sheath) 6 Half bloom (50% of the t some stage of blooming) plants in the field a7 Soft dough (grain has a dough-like consistency) 9 Physiological maturity (Maximum total dry weight of the plant has
occurred) Adopted from: http://weedsoft.unl.edu/documents/GrowthStagesModule/Sorghum/Sorg.htm Figure A.1. Schematic representation of growth stages in grain sorghum.
73
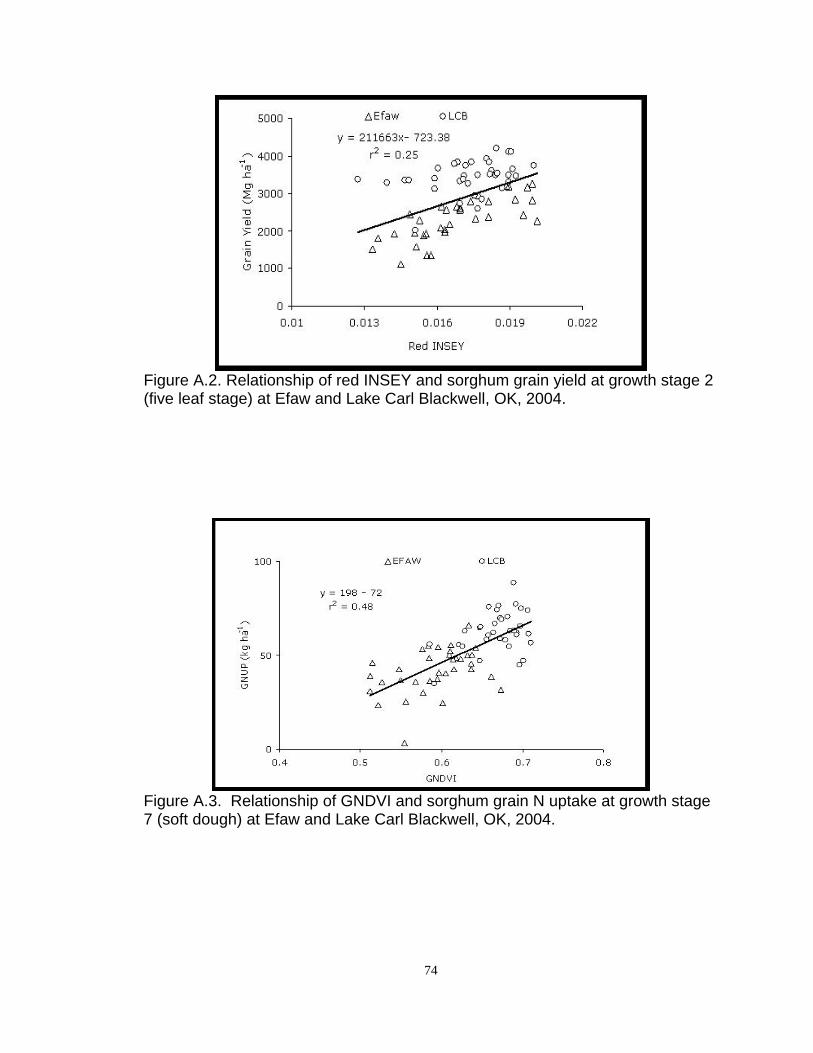
74
Figure A.2. Relationship of red INSEY and s( e
Figure A.3. Relationship of GNDVI and sorghum grain N uptake at growth stage 7 (soft dough) at Efaw and Lake Carl Blackwell, OK, 2004.
orghum grain yield at growth stage 2 five le f staga ) at Efaw and Lake Carl Blackwell, OK, 2004.

Figure A.4. Combined location average CV of green and red NDVI at each growth stage of sorghum at Efaw and Lake Carl Blackwell, OK, 2004.
Figure A.5. Relationship of CV and RNDVI at sorghum growth stage 5 at Efaw, Hennessey and Lake Carl Blackwell, OK, 2004.
75
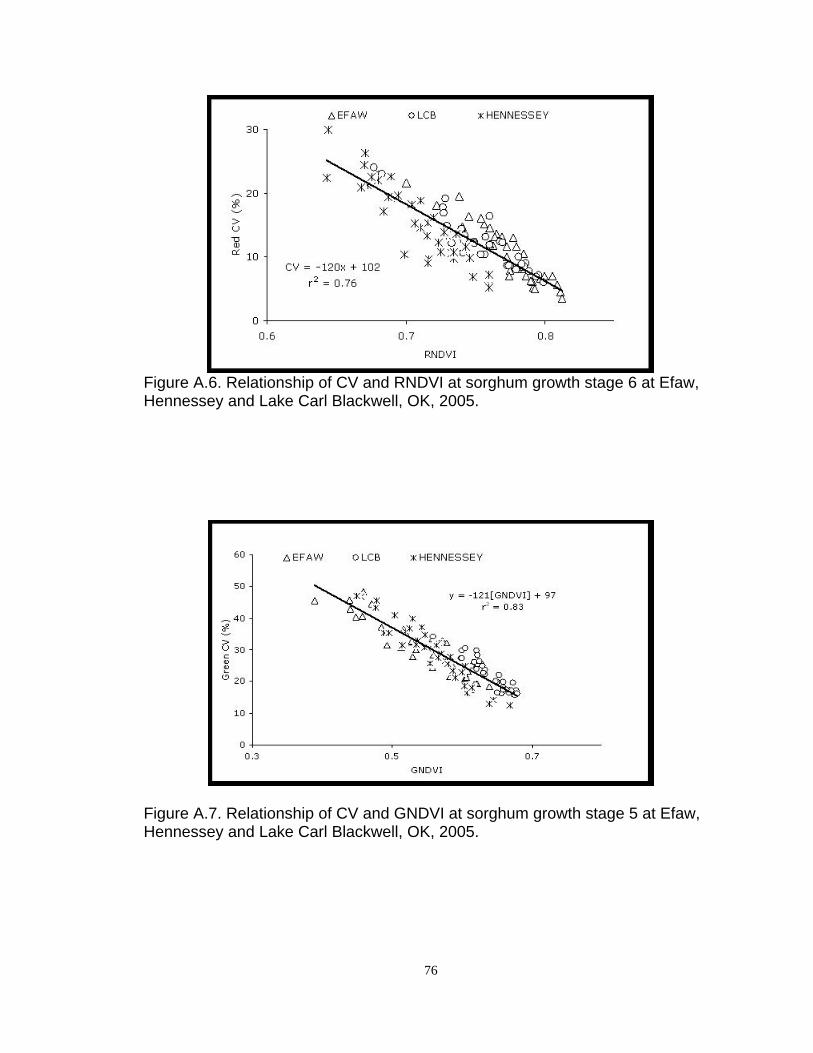
Figure A.6. Relationship of CV and RNDVI at sorghum growth stage 6 at EfaHennessey and Lake Carl Blackwell, OK, 2005.
w,
growth stage 5 at Efaw, Hennessey and Lake Carl Blackwell, OK, 2005.
Figure A.7. Relationship of CV and GNDVI at sorghum
76
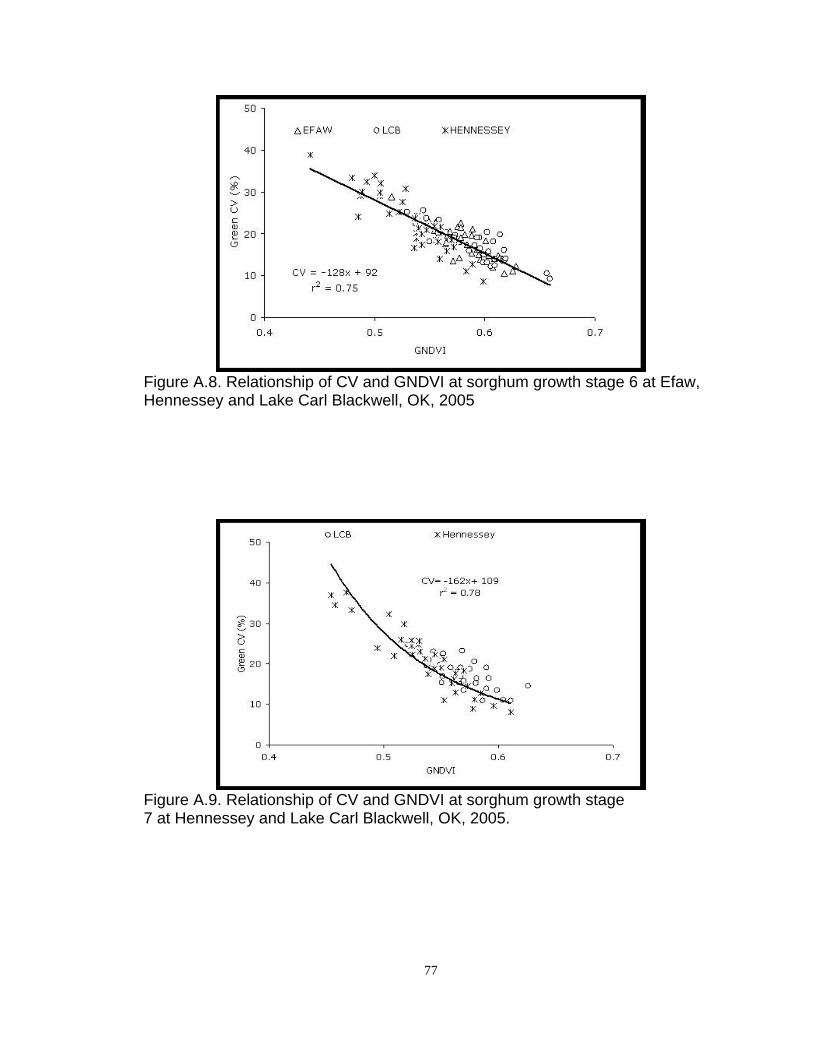
Figure A.9. Relationship of CV and GNDVI at sorghum growth stage
Figure A.8. Relationship of CV and GNDVI at sorghum growth stage 6 at Efaw, Hennessey and Lake Carl Blackwell, OK, 2005
7 at Hennessey and Lake Carl Blackwell, OK, 2005.
77

Figure A.10. By-plant corn grain yield and plant height relationship at growth stage VT at Perkins, OK, 2004
aFigure A.11. By-plant corn dry cob weight and plant height relationship t growth
stage V8 at Perkins, OK, 2004
78

Figure A.12. By-plant corn grain yield and plant height relationship at growth stage V8 at Perkins, OK, 2004.
Figure A.13. By-plant corn grain yield and plant height relationship at growth stage V8 at Perkins, OK, 2004.
79

Figure A.14. By-plant grain yield and plant height relationship at growth stageat Efaw, OK, 2004.
R1
t at
Figure A.15. Relationship of by-plant corn grain yield per area and plant eighgrowth stage V8 at Efaw, OK, 2005.
h
80

Figure A.16. Relationship of by-plant grain yield and plant height at growth stage V8 at Efaw, OK, 2004.
.
Figure A.17. By-plant corn grain yield per area and plant height relationship at growth stage VT at Perkins, OK, 2004
81

Figure A.18. Relationship of by-plant grain yield per area and plant height at growth stage R1 at Efaw, OK, 2004.
th
Figure A.19. By-plant corn wet cob weight and plant height relationship at growstage R1 at Perkins, OK, 2004
82

wth
Figure A.20. By-plant corn dry cob weight and plant height relationship at grostage R1 at Perkins, OK, 2004
Figure A.21. Relationship of by-plant wet cob weight and plant height at growth stage VT at Efaw, OK, 2004.
83
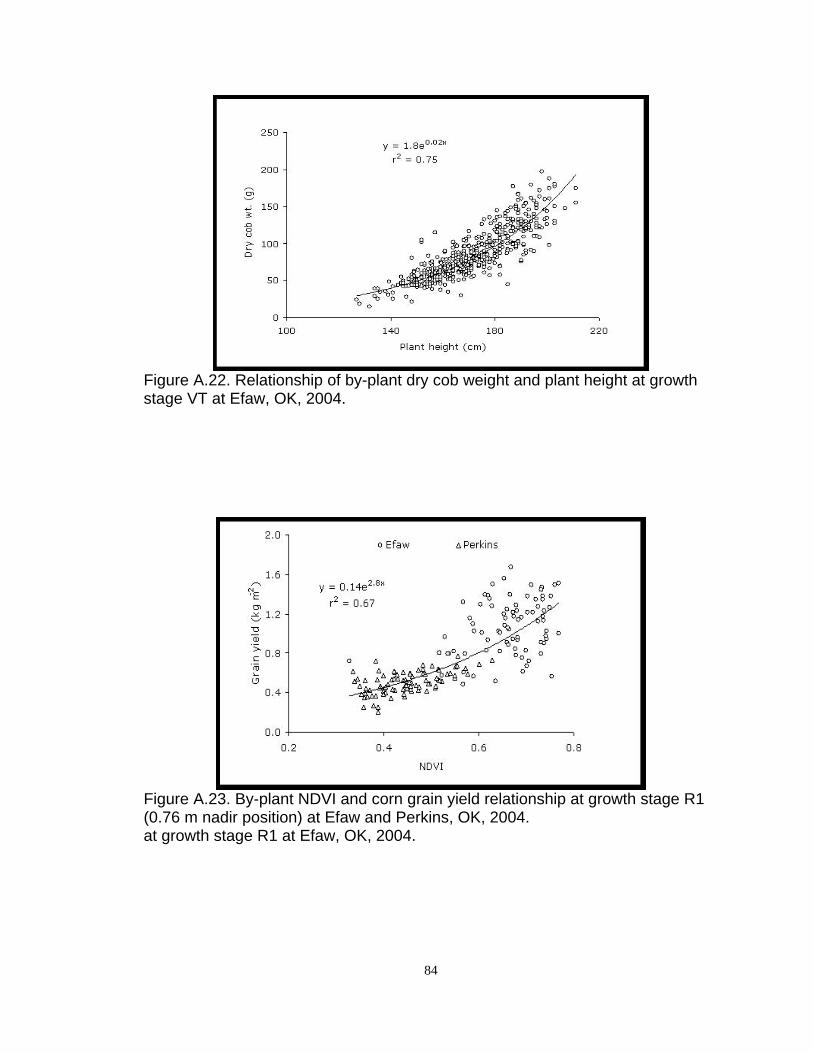
Figure A.22. Relationship of by-plant dry cob weight and plant height at growth stage VT at Efaw, OK, 2004.
t growth stage R1 at Efaw, OK, 2004.
Figure A.23. By-plant NDVI and corn grain yield relationship at growth stage R1 (0.76 m nadir position) at Efaw and Perkins, OK, 2004. a
84
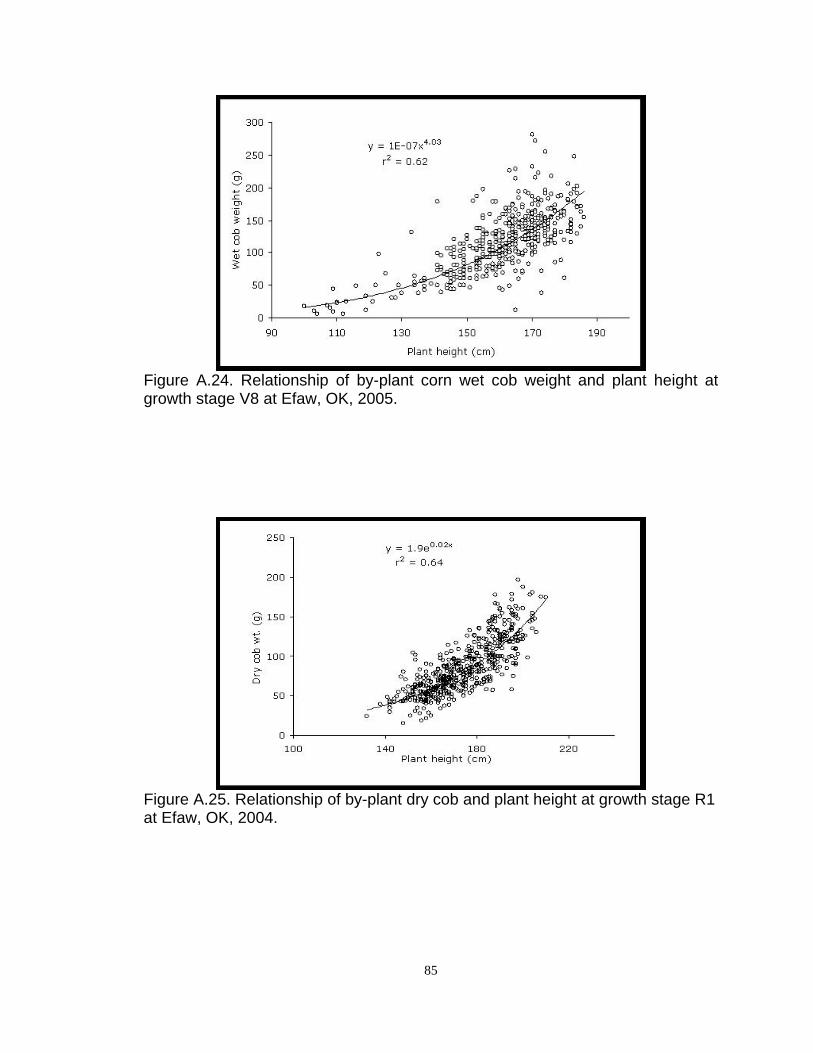
Figure A.24. Relationship of by-plant corn wet cob weight and plant height growth stage V8 at Efaw, OK,
at 2005.
Figure A.25. Relationship of by-plant dry cob and plant height at growth stage R1at Efaw, OK, 2004.
85

Figure A.26. Relationship of by-plant corn wet cob weight and plant height at growth stage V8 at Efaw, OK, 2005.
Figure A.27. Relationship of by-plant corn dry cob weight and plant height at growth stage V8 at Efaw, OK, 2005.
86
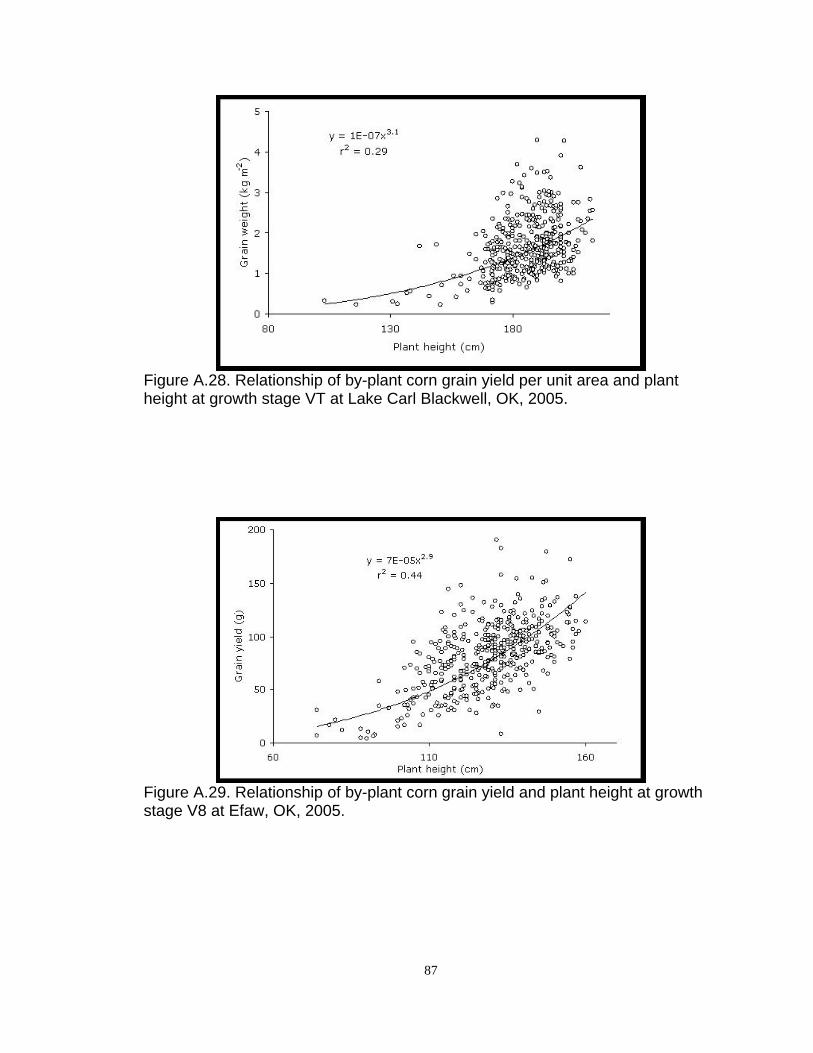
Figure A.28. Relationship of by-plant corn grain yield per unit area and plant height at growth stage VT at Lake Carl Blackwell, OK, 2005.
th
Figure A.29. Relationship of by-plant corn grain yield and plant height at growstage V8 at Efaw, OK, 2005.
87
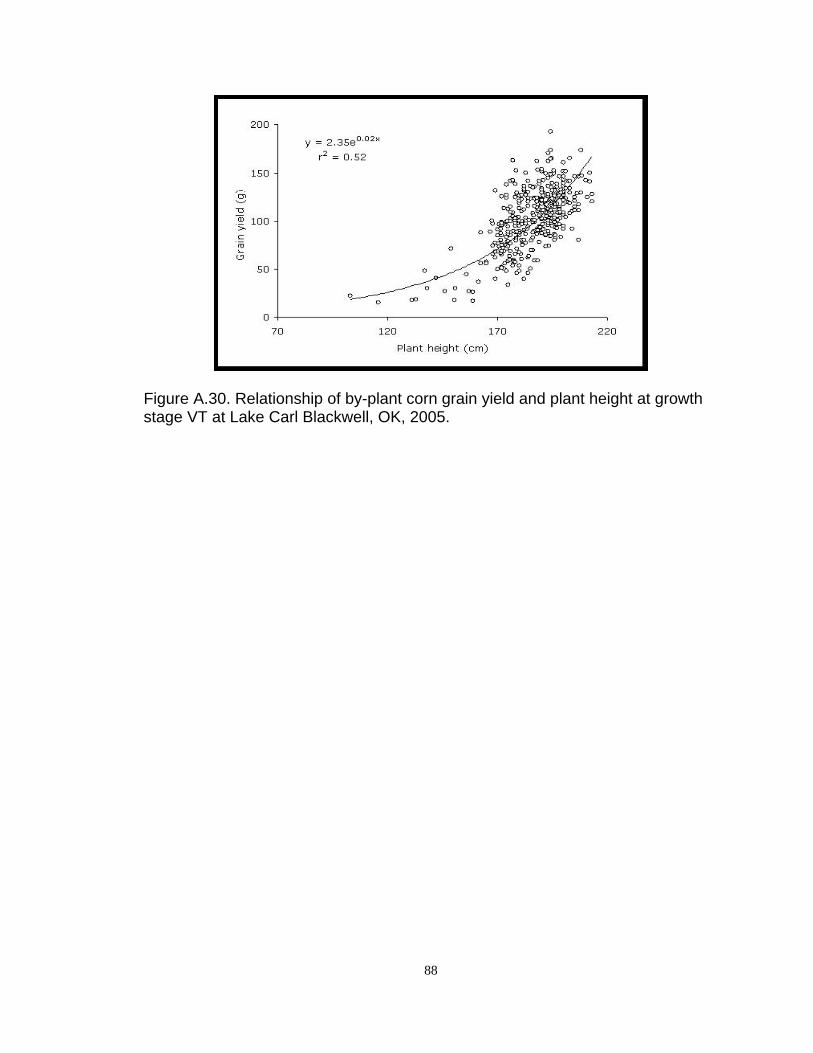
Figure A.30. Relationship of by-plant corn grain yield and plant height at growth tage VT at Lake Carl Blackwell, OK, 2005.
s
88
VITA
Shambel Maru Moges
Candidate for the Degree of
Doctor of Philosophy Thesis: I. YIELD POTENTIAL ESTIMATION IN GRAIN SORGHUM Sorghum bicolor L.),
II. EFFECTS OF PLANT HEIGHT, SENSING ANGLE AND HEIGHT ON YIELD PREDICTION OF CORN (Zea mays. L)
Major Field: Soil Science
iographical:
Personal Data: born in Nazareth, Ethiopia on May 12, 1970 Education: Graduated from Harar Meda Model High school, Arsi,
Ethiopia in August 1988; received Bachelor of Science degree in Plant Sciences from Awassa College of Agriculture, Awassa, Sidamo, Ethiopia in July, 1997; received Master of Science degree in Plant and soil Sciences from Oklahoma State University, Stillwater, Oklahoma, 2002. Completed the requirements for the Doctor of Philosophy degree with a major in Soil Sciences and minor in Statistics at Oklahoma State University in December 2005.
Experience: Employed by Ethiopian Agricultural Research Organization
(EARO) as Junior Agricultural Research Officer (December, 1997 – December, 2000); employed as a graduate research assistant for the Department of Plant & Soil Sciences, Oklahoma State University, 2001- 2005.
Professional Memberships: member of Ethiopian Weed science, Crop science, and Agronomy societies of Ethiopia since 1997. Member of American Society of Agronomy, Since 2002.Name:
B
89
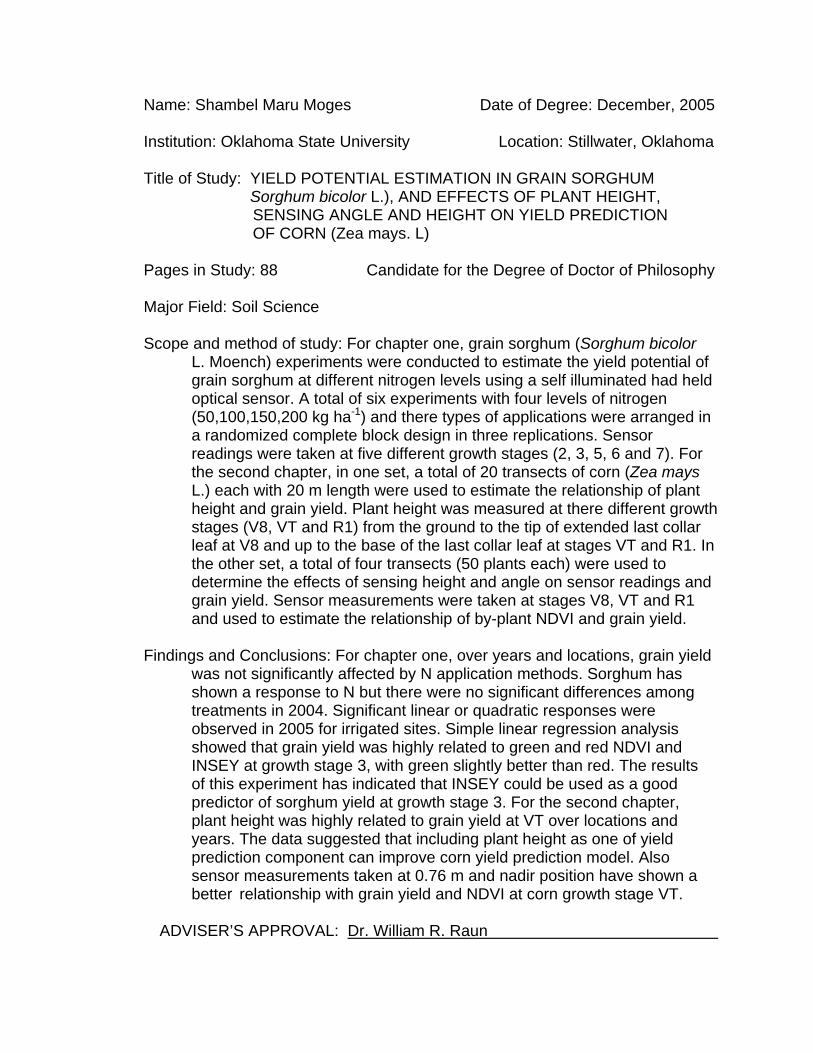
Name: Shambel Maru Moges Date of Degree: December, 2005 Institution: Oklahoma State University Location: Stillwater, Oklahoma Title of Study: YIELD POTENTIAL ESTIMATION IN GRAIN SORGHUM Sorghum bicolor L.), AND EFFECTS OF PLANT HEIGHT, SENSING ANGLE AND HE OF CORN (Ze
Pages in Study: 88 of Doctor of Philosophy Major Field: Soil Science
r one, grain sorghum (Sorghum bicolor L. Moe l of grain s ld optical sensor. A total of six experiments with four levels of nitrogen (50,100,150,200 kg ha-1) and there types of applications were arranged in a randomized complete block design in three replications. Sensor
at five different growth stages (2, 3, 5, 6 and 7). For the second chapter, in one set, a total of 20 transects of corn (Zea mays
with 20 m length were used to estimate the relationship of plant height and grain yield. Plant height was measured at there different growth
d last collar af at V8 and up to the base of the last collar leaf at stages VT and R1. In
determ d grain y R1 and us
Findings and ld was no shown treatments in 2004. Significant linear or quadratic responses were INSEY of this od predictor of sorghum yield at growth stage 3. For the second chapter, plant height was highly related to grain yield at VT over locations and predict lso sensor etter relationship with grain yield and NDVI at corn growth stage VT.
ADVISER’S APPROVAL: Dr. William R. Raun
IGHT ON YIELD PREDICTION a mays. L)
Candidate for the Degree
Scope and method of study: For chapte
nch) experiments were conducted to estimate the yield potentiaorghum at different nitrogen levels using a self illuminated had he
readings were taken
L.) each
stages (V8, VT and R1) from the ground to the tip of extendelethe other set, a total of four transects (50 plants each) were used to
ine the effects of sensing height and angle on sensor readings anield. Sensor measurements were taken at stages V8, VT and ed to estimate the relationship of by-plant NDVI and grain yield.
Conclusions: For chapter one, over years and locations, grain yiet significantly affected by N application methods. Sorghum has
a response to N but there were no significant differences among
observed in 2005 for irrigated sites. Simple linear regression analysis showed that grain yield was highly related to green and red NDVI and
at growth stage 3, with green slightly better than red. The resultsexperiment has indicated that INSEY could be used as a go
years. The data suggested that including plant height as one of yieldion component can improve corn yield prediction model. A measurements taken at 0.76 m and nadir position have shown a
b
90


