
WT ospti1a
EV EV 18 264 6
HAstrepII-OsPti1a
OsPti1a-HAstrepII
OsPti1a
CBB
WB: anti-HA antibody
BA
C
OsPti1a-HAstrepII
18 264 6
EV
ospti1aWT
EV HAstrepII-OsPti1a
EV
ospti1aWT
EV
Supplemental Figure 1. Complementation test of HAstrepII-OsPti1a or OsPti1a-HAstrepII in the ospti1a mutant background. In (A) and (B), transgenic plants expressing HAstrepII-OsPti1a, OsPti1a-HAstrepII, or empty vector (EV) in the ospti1a mutant were grown under same conditions, respectively. The photograph shows the T0 transgenic plants in the ospti1a background and WT. The numbers indicate independent transgenic plant lines. (C) Immunoblot analysis of total proteins extracted from leaves of these transgenic plants. Lower panels indicate CBB staining of the membrane after immunoblotting.
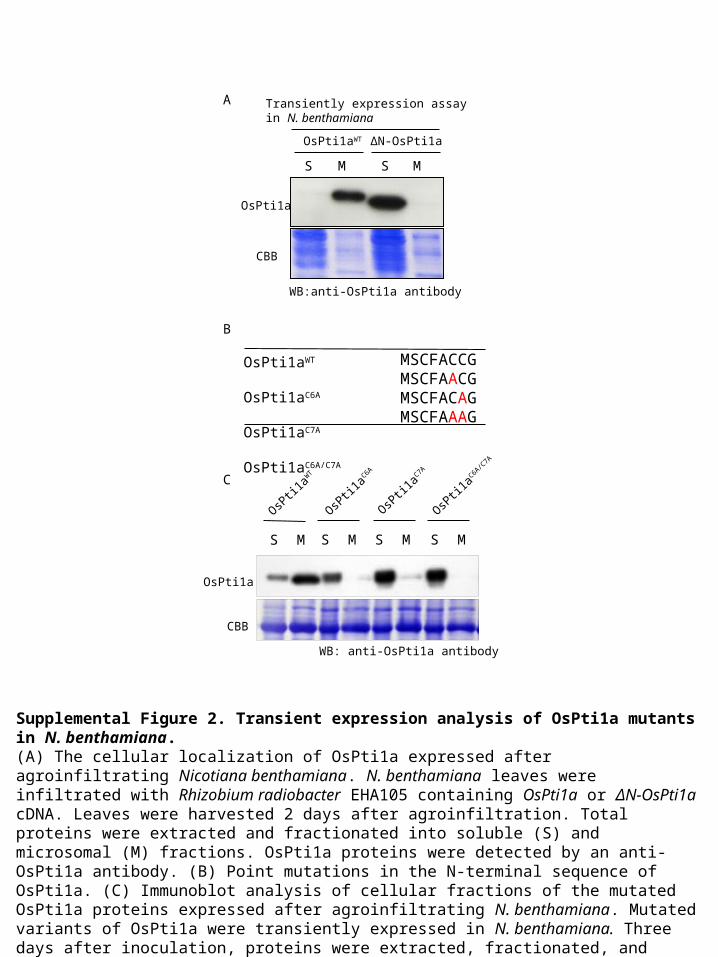
S M S M
OsPti1a
CBB
OsPti1aWT ΔN-OsPti1a
Transiently expression assay in N. benthamiana
WB:anti-OsPti1a antibody
A
C
Supplemental Figure 2. Transient expression analysis of OsPti1a mutants in N. benthamiana.(A) The cellular localization of OsPti1a expressed after agroinfiltrating Nicotiana benthamiana. N. benthamiana leaves were infiltrated with Rhizobium radiobacter EHA105 containing OsPti1a or ΔN-OsPti1a cDNA. Leaves were harvested 2 days after agroinfiltration. Total proteins were extracted and fractionated into soluble (S) and microsomal (M) fractions. OsPti1a proteins were detected by an anti-OsPti1a antibody. (B) Point mutations in the N-terminal sequence of OsPti1a. (C) Immunoblot analysis of cellular fractions of the mutated OsPti1a proteins expressed after agroinfiltrating N. benthamiana. Mutated variants of OsPti1a were transiently expressed in N. benthamiana. Three days after inoculation, proteins were extracted, fractionated, and subjected to immunoblot analysis using an anti-OsPti1a antibody (upper panel). After immunoblotting, the PVDF membrane was stained with CBB (lower panel).
OsPti1aWT OsPti1aC6A OsPti1aC7A OsPti1aC6A/C7A
MSCFACCGMSCFAACGMSCFACAGMSCFAAAG
B
OsPti1
aW
T
OsPti1
aC6A
OsPti1
aC7A
OsPti1
aC6A
/C7A
CBB
OsPti1a
WB: anti-OsPti1a antibody
MS MS MS MS
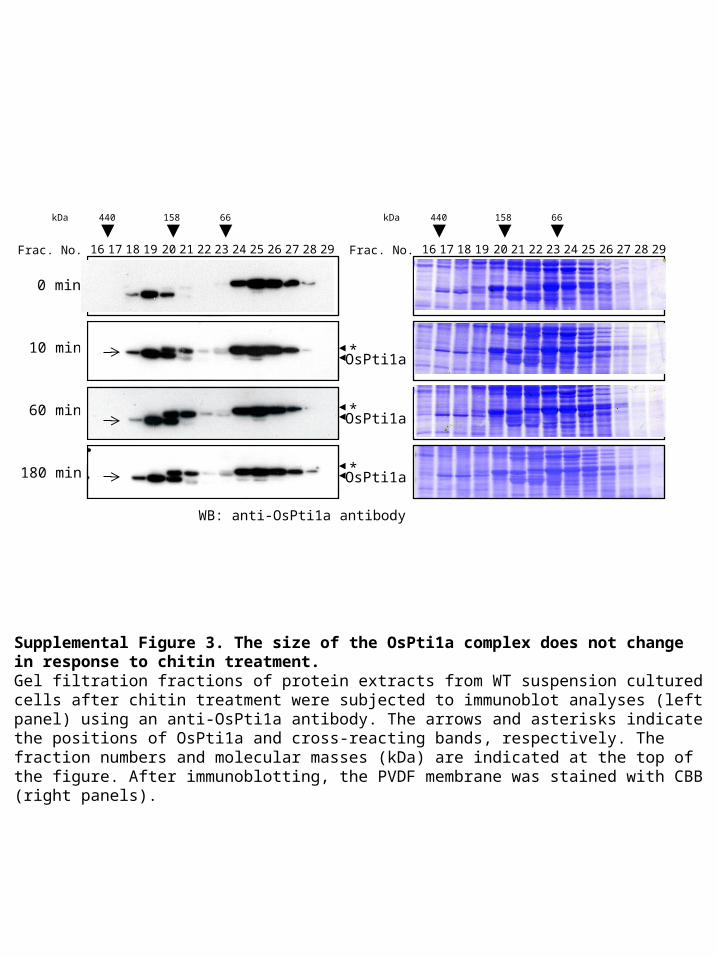
Supplemental Figure 3. The size of the OsPti1a complex does not change in response to chitin treatment. Gel filtration fractions of protein extracts from WT suspension cultured cells after chitin treatment were subjected to immunoblot analyses (left panel) using an anti-OsPti1a antibody. The arrows and asterisks indicate the positions of OsPti1a and cross-reacting bands, respectively. The fraction numbers and molecular masses (kDa) are indicated at the top of the figure. After immunoblotting, the PVDF membrane was stained with CBB (right panels).
WB: anti-OsPti1a antibody
10 min
180 min
60 min
17 18 19 20 21 23 25 27 2922 24 26 2816
440 158 66kDa
Frac. No.
OsPti1a*
OsPti1a*
OsPti1a*
0 min
17 18 19 20 21 23 25 27 2922 24 26 2816
440 158 66kDa
Frac. No.


