Download - WRF Performance and Scaling Assessment

WRF Performance and Scaling Assessment
Christopher Kruse Mentor - Davide Del Vento

Research Interests Atmospheric Waves
Mountain Meteorology
High resolution simulation!
– High resolution required with complex terrain!
– Requires lots of computational power!

Internship Research Main Goals:
– Document the performance of scaling WRF over
nearly the entire Yellowstone (YS) Super Computer
– Investigate performance of WRF with different configurations, compilers, MPI implementations
• hybrid parallelization and scaling • domain decomposition • IBM Parallel Environment and Intel MPI Library MPI
implementations • Hyperthreading
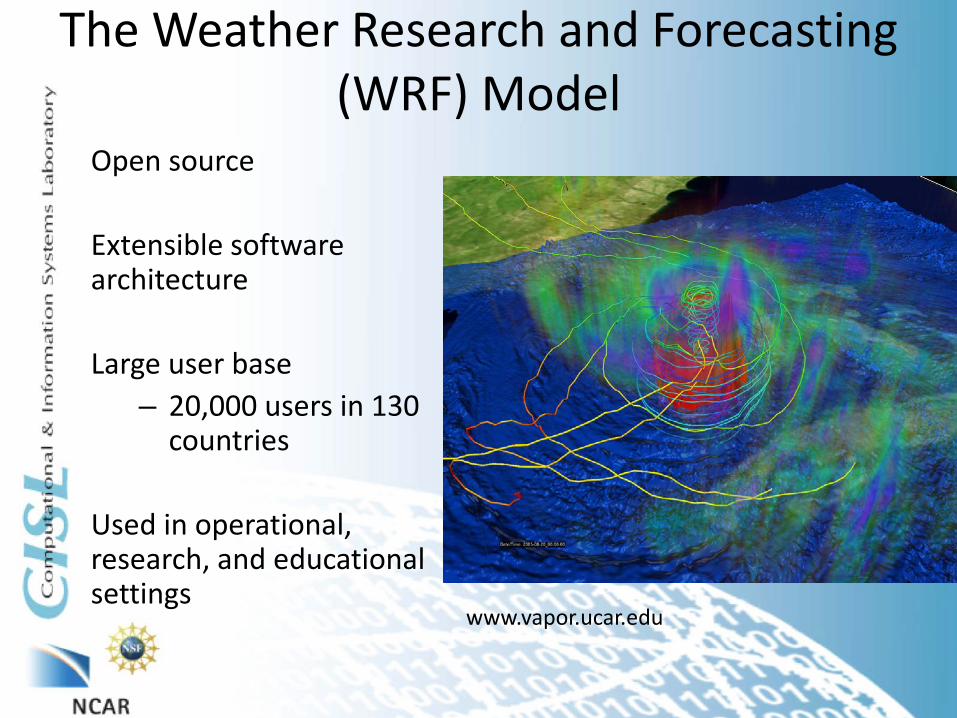
The Weather Research and Forecasting (WRF) Model
Open source
Extensible software architecture
Large user base
– 20,000 users in 130 countries
Used in operational, research, and educational settings
www.vapor.ucar.edu

Previous Scaling Assessments WRF has been benchmarked on many systems
There are a number of ways to quantify model performance
– E.g., Gflops, Simulation speed, time steps completed/time
WRF Scales well to 8K cores
Standard workloads are “Small” – 2.5 km CONUS: ≈ 63
million grid points
http://www.mmm.ucar.edu/wrf/WG2/benchv3/
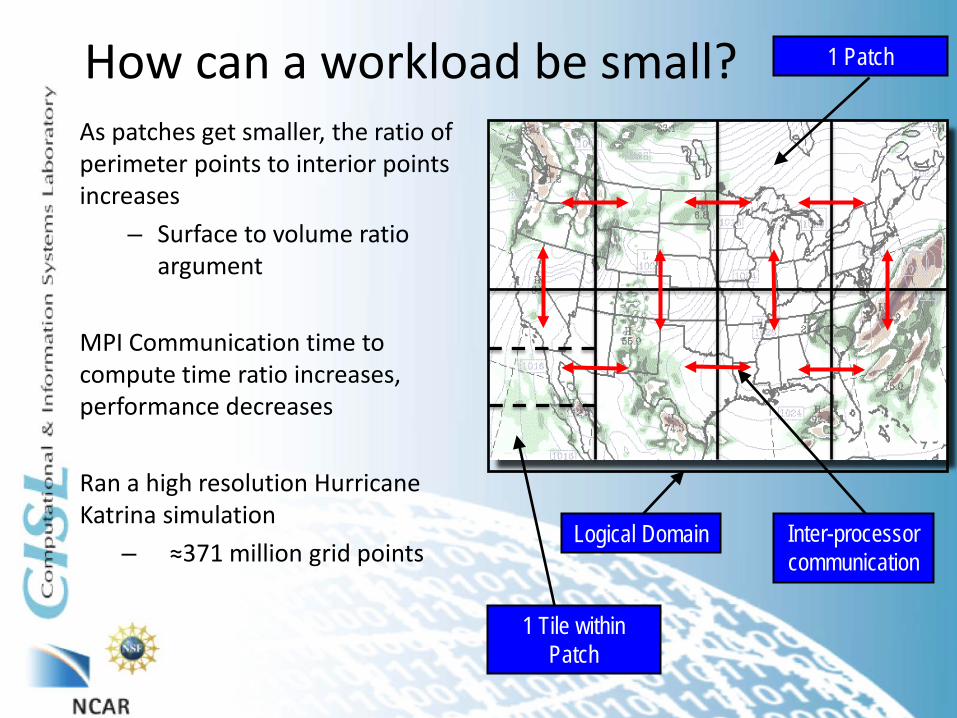
1 Patch
Inter-processor communication
How can a workload be small? As patches get smaller, the ratio of perimeter points to interior points increases
– Surface to volume ratio argument
MPI Communication time to compute time ratio increases, performance decreases Ran a high resolution Hurricane Katrina simulation
– ≈371 million grid points Logical Domain
1 Tile within Patch

Hybrid Parallelization
Tested hybrid parallelization at a relatively “small” core count
– Hybrid = distributed and shared memory parallelism
Cores were not over subscribed
Any number of threads per task decreased performance!
256 Nodes = 4096 cores
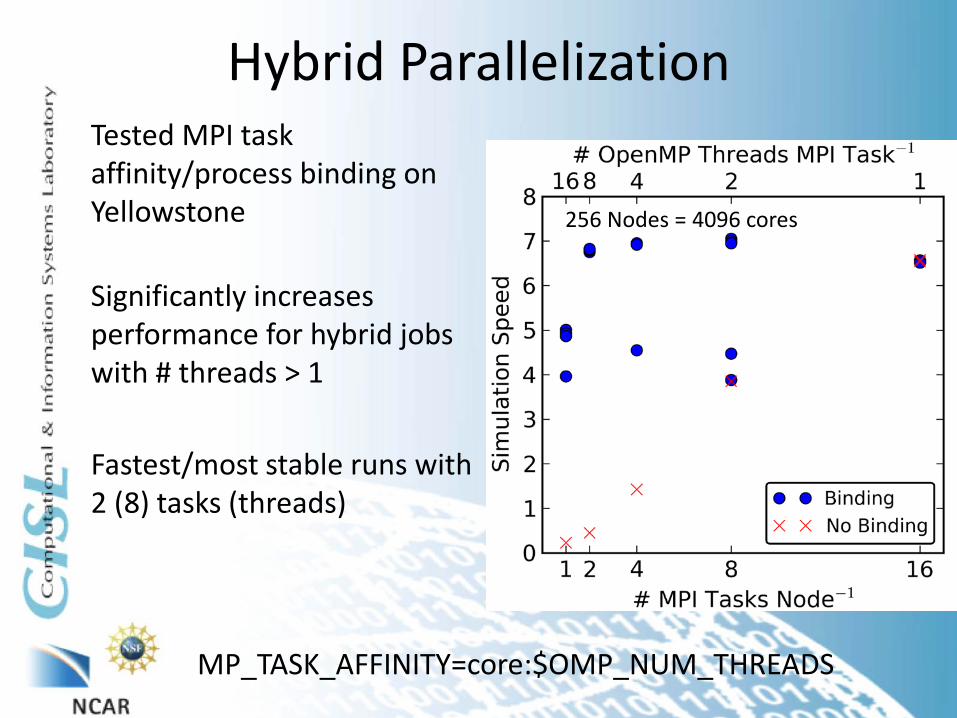
Hybrid Parallelization Tested MPI task affinity/process binding on Yellowstone
Significantly increases performance for hybrid jobs with # threads > 1 Fastest/most stable runs with 2 (8) tasks (threads)
256 Nodes = 4096 cores
MP_TASK_AFFINITY=core:$OMP_NUM_THREADS

Scaling Assessment Was a computer hog
– Frequently “flooded the queues”
Scaled the 1-km Katrina workload from 512 to 65,536 cores!
– ≈ 91% of Yellowstone!
Intel Compiler performed best
Issues with seg faults using PGI at core counts < 16K
Linear scaling through 16K cores
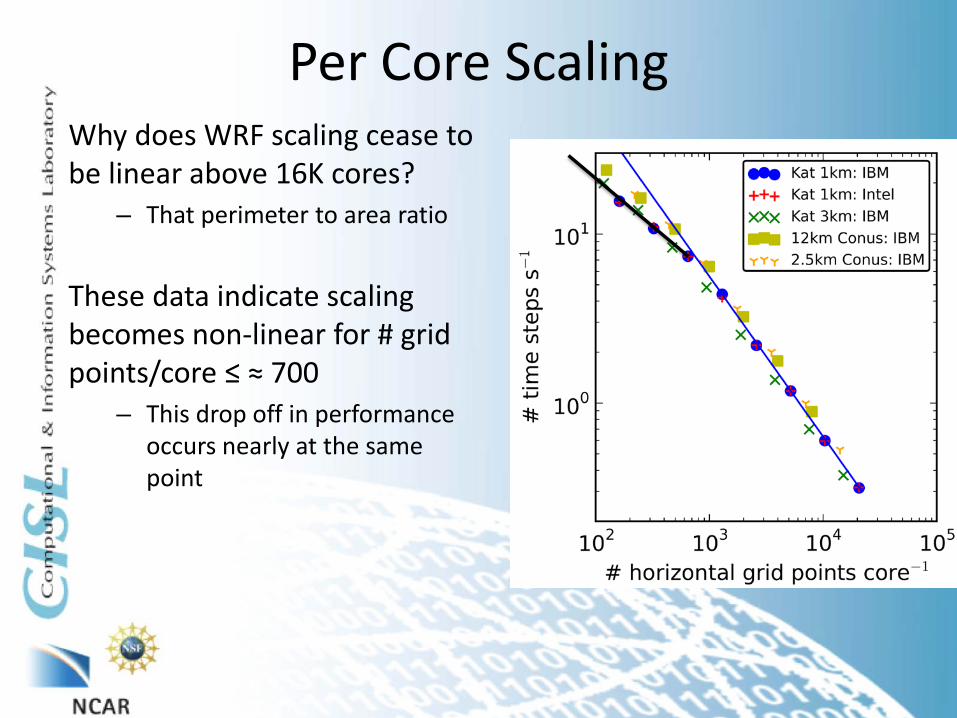
Per Core Scaling Why does WRF scaling cease to be linear above 16K cores?
– That perimeter to area ratio
These data indicate scaling becomes non-linear for # grid points/core ≤ ≈ 700
– This drop off in performance occurs nearly at the same point

Per Core Scaling Why does WRF scaling cease to be linear above 16K cores?
– That perimeter to area ratio
These data indicate scaling becomes non-linear for # grid points/core ≤ ≈ 700
– This drop off in performance occurs nearly at the same point
Drop off in scaling at extreme core counts due to increased communication in application, not YS

Total Times • WRF runs broken down:
– Total time
– Initialization Time – reading and processing input
– Compute Time – computation and MPI communication
– Write Time – time to write one time step (29G) to disk
• Disk I/O quickly dominates total run
time…
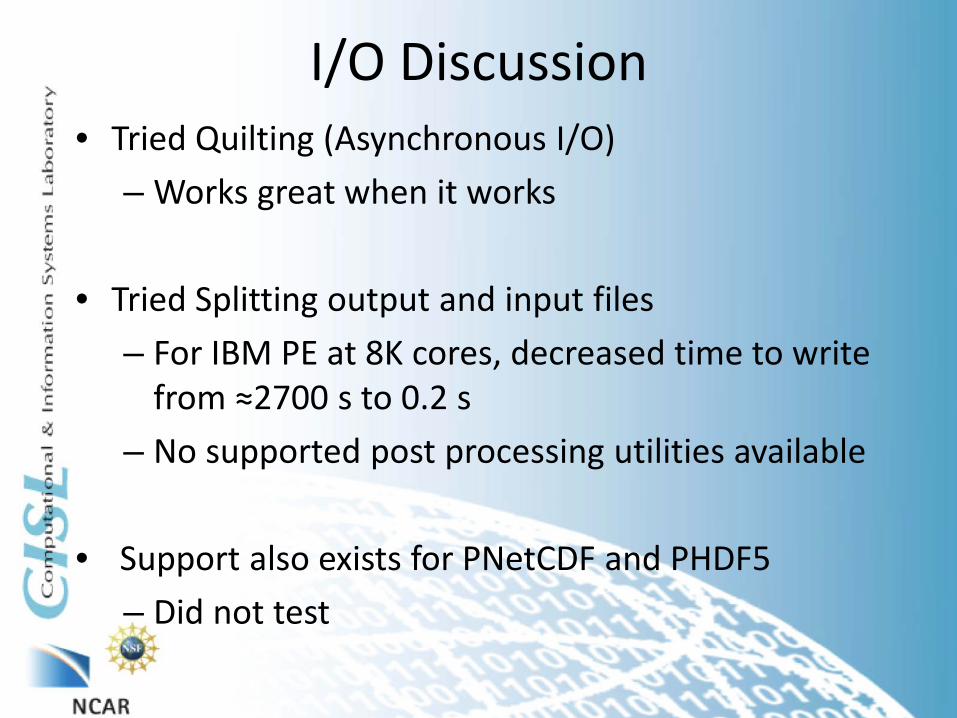
I/O Discussion • Tried Quilting (Asynchronous I/O)
– Works great when it works
• Tried Splitting output and input files – For IBM PE at 8K cores, decreased time to write
from ≈2700 s to 0.2 s – No supported post processing utilities available
• Support also exists for PNetCDF and PHDF5
– Did not test
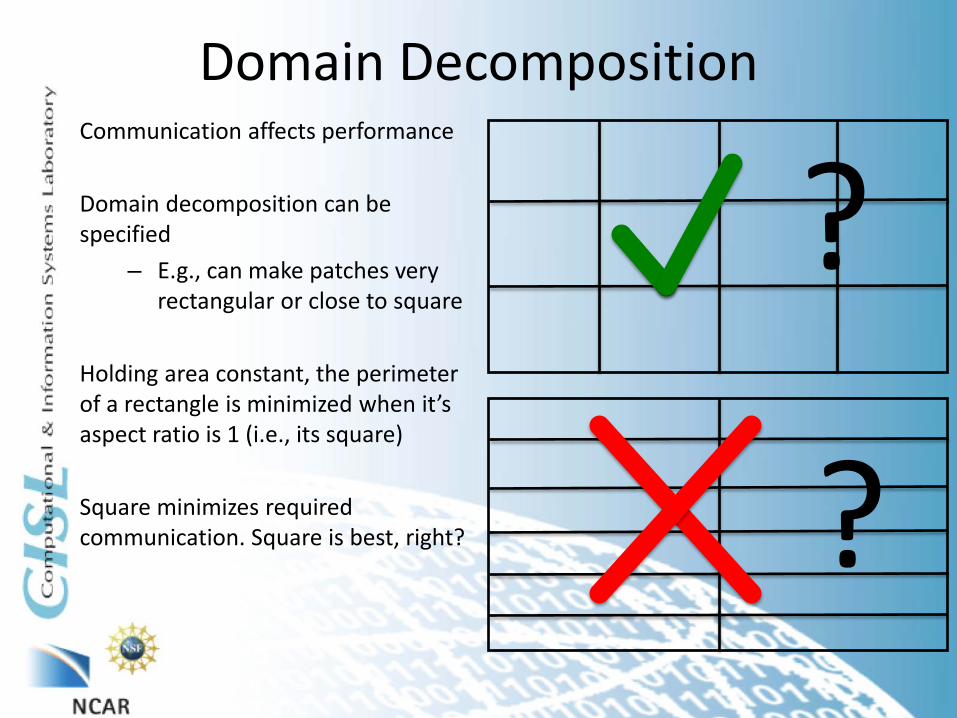
Domain Decomposition Communication affects performance
Domain decomposition can be specified
– E.g., can make patches very rectangular or close to square
Holding area constant, the perimeter of a rectangle is minimized when it’s aspect ratio is 1 (i.e., its square)
Square minimizes required communication. Square is best, right?
?
?
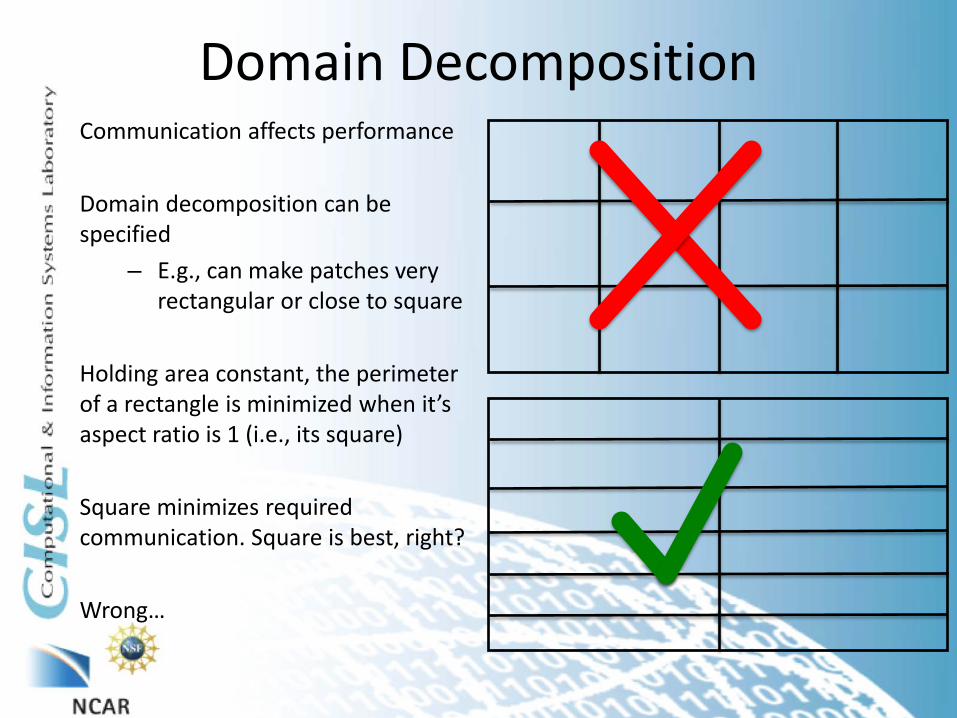
Domain Decomposition Communication affects performance
Domain decomposition can be specified
– E.g., can make patches very rectangular or close to square
Holding area constant, the perimeter of a rectangle is minimized when it’s aspect ratio is 1 (i.e., its square)
Square minimizes required communication. Square is best, right? Wrong…

Domain Decomposition (not finished) • 1-km Katrina workload
• Chose to run on 2520
cores, 15 per node – Many factor pair
permutations
• Best performance when patches were nearly 10 longer east-west than north-south

Domain Decomposition • Repeated
decomposition with completely different simulation
• Again, square was not best
• In this case, decomposition could decrease performance by 50%!

Conclusions WRF integration is efficient and scales well up to 64K cores
Initialization and writing output (i.e., disk I/O) with default I/O settings “anti-scale”
– Significantly limits realistic output frequencies at high core counts!
Domain decomposition can significantly reduce performance when domain is highly decomposed
– i.e., few grid points assigned to each core

Acknowledgements Davide Del Vento - NCAR Raffaele Montouro - Texas A&M Scott McMillan - Intel Corporation Mark Lubin - Intel Corporation I could not have gathered and presented all my measurements without the work these people had completed before me.

Questions?
Thanks
References Barker, D., et al., 2012: The Weather Research and Forecasting model's community variational/ensemble data assimilation system. Bull. Amer. Meteor. Soc. , 93 , 831-843.
Intel, 2013a: Intel R Composer XE 2013. http://software.intel.com/en-us/intel-composer-xe.
Intel, 2013b: Intel R MPI Library. http://www.intel.com/go/mpi. Michalakes, J., et al., 2008: WRF nature run. J. of Physics: Conference Series , 125 , doi: 10.1088/1742-6596/125/1/012022.
MPI, 2012: MPI: A Message-Passing Interface standard version 3.0. http://www.mpi-forum.org/docs/mpi3.0/mpi30-report.pdf.
NCAR, 2013: NCAR-Wyoming Supercomping Center. http://www2.cisl.ucar.edu/resources/yellowstone. OpenMP Archetecture Review Board, 2011: OpenMP application program interface version 3.1. http://www.openmp.org/mpdocuments/OpenMP3.1.pdf.

References Patricola, C. M., P. Chang, R. Saravanan, and R. Montouro, 2012: The effect of atmosphere-ocean-wave interactions and model resolution on Hurricane Katrina in a coupled regional climate model. Geophys. Res. Abs. , 14 , http://meetingorganizer.copernicus.org/EGU2012/EGU2012-11855.pdf. Quintero, D., A. Chaudhri, F. Dong, J. Higino, P. Mayes, K. Sacilotto de Souza, W. Moschetta, and X. T. Xu, 2013: IBM Parallel Environment (PE) Developer Edition. http://www.redbooks.ibm.com/redbooks/pdfs/sg248075.pdf.
Saha, S., et al., 2010: The NCEP climate forecast system reanalysis. Bull. Amer. Meteor. Soc. , 91 , 1015-1057. Skamarock, W. C., et al., 2008: A description of the advanced research wrf version 3. NCAR Tech. Note NCAR/TN-4751STR, 113 pp. [Available online at http://www.mmm.ucar.edu/wrf/users/docs/arw_v3.pdf. ].

Additional – Kat 3-km Decomp • Did decomp testing
with 3-km workload
• Two curves apparent – lower on suspected due to bad node?
• Otherwise, top curve maxima predicted by previous decomp tests

Additional – Scaling • Similar scaling analysis as before, but
performance vs. total grid points per patch/core
– Takes differing vertical levels between runs into account
• Comparable performance curves noted between runs
• Deviation from linearity at about 20000 grid points/core
• Plotting against total grid points vs horiz grid points might be advantageous as runs with more vertical levels require more computation in each patch, which might allow the workload to scale better to higher core counts compared to a run with less vlevs

Additional – Hybrid Parallelization Decomposition
• This plot supplements previous domain decomp plots
• The two optimal task/thread decompositions are MPI-only and 5x3 (# TASKSx# THREADS)

Additional – Hybrid Parallelization Decomposition with hyperthreading
• Same as plot in slide 8, but with hyperthreading
• NOTE: a typical MPI-only speed for this workload and core # is about 6.5
• This plot indicates some speed up (~8%) by using hyperthreading
4096 cores

Additional – Hybrid Parallelization Decomposition 128 node
• While 2x8 decomp was optimal (best combo of performance and run to run stability), 4x4 decomp was optimal at 128 nodes
2048 cores

Additional – Hybrid Parallelization Decomposition w/ hyperthreading
• Same as plot in previous slide but with hyperthreading
• Highest performance curve differs from data with hyperthreading on 256 nodes (slide 25)
2048 cores


