
Working Paper S e r i e s
N U M B E R W P 0 5 - 1 0 S E P T E M B E R 2 0 0 5
1 7 5 0 M A S S A C H U S E T T S A V E N U E , N W | W A S H I N G T O N , D C 2 0 0 3 6 - 1 9 0 3
T E L : ( 2 0 2 ) 3 2 8 - 9 0 0 0 | F A X : ( 2 0 2 ) 6 5 9 - 3 2 2 5 | W W W . I I E . C O M
Importers, Exporters, and Multinationals: A Portrait of Firms in the U.S. that Trade Goods
Andrew B. Bernard, J. Bradford Jensen, and Peter K. Schott
Andrew Bernard is professor of international economics at the Tuck School of Business at Dartmouth College and research associate at the National Bureau of Economic Research (NBER) and at the Massachusetts Institute of Technology Industrial Performance Center. J. Bradford Jensen is deputy director of the Institutute for International Economics. Peter K. Schott is associate professor of economics at the Yale School of Management and faculty research fellow at NBER.
Abstract
This paper provides an integrated view of globally engaged US firms by exploring a newly developed dataset that links US inter-national trade transactions to longitudinal data on US enterprises. These data permit examination of a number of new dimen-sions of firm activity, including how many products firms trade, how many countries firms trade with, the characteristics of those countries, the concentration of trade across firms, whether firms transact at arm’s length or with related parties, and whether firms import as well as export. Firms that trade goods play an important role in the United States, employing more than a third of the US workforce. We find that the most globally engaged US firms, i.e. those that both export to and import from related parties, dominate US trade flows and employment at trading firms. We also find that firms that begin trading between 1993 and 2000 experience especially rapid employment growth and are a major force in overall job creation.
Note: Bernard and Schott thank the National Science Foundation (SES-0241474) for research support. The research in this paper was conducted while the authors were Special Sworn Status researchers of the US Census Bureau at the Boston Census Research Data Center and the Center for Economic Studies Research. Results and conclusions expressed are those of the authors and do not necessarily reflect the views of the Census Bureau or the NBER. This paper has been screened to insure that no confidential data are revealed.
Keywords: Exporters, Importers, Multinationals, Related-Party TradeJEL classification: F23
Copyright © 2005 by the Institute for International Economics. All rights reserved. No part of this working paper may be reproduced or utilized in any form or by any means, electronic or mechanical, including photocopying, recording,
or by information storage or retrieval system, without permission from the Institute.
Firms that Trade 2
1. Introduction
�What does (Art Vandelay) do?�
�He�s an importer.�
�Just imports? No exports?�
�He�s an importer-exporter. Okay?�
Seinfeld, Episode: The Cadillac (2), aired 1996
Art Vandelay is not alone. In 1993, 38.1 million workers were employed by
a �rm that was directly engaged in the international trade of goods (see Table
1). These workers represent 31.7 percent of the entire civilian workforce and 40.0
of employment outside government and education.1 By 2000, the total number of
workers at �rms that either import or export had risen to 47.9 million or 35.0 percent
of the civilian workforce. Indeed, importing and exporting are closely related, more
than 50 percent of the �rms in the United States that import also export and these
�rms account for close to 90 percent of U.S. trade.
This paper o¤ers an integrated perspective on globally engaged �rms by explor-
ing a newly developed dataset that links international trade transactions to longitu-
dinal data on U.S. enterprises. It extends existing empirical research by examining
importers as well as exporters, identifying the activities of multinational �rms sep-
arately from those of domestic enterprises, and di¤erentiating between arms length
and related-party (i.e., intra-�rm) trade.
A surge of interest in the microeconomics of international trade and investment
has yielded numerous studies of exporters and multinationals. Using �rm-level data,
empirical researchers have documented that exporting plants and �rms represent a
small fraction of the total, that �rms engaged in exporting have positive performance
characteristics (including higher productivity, larger size, greater capital intensity,
etc.), that multinational �rms pay higher wages than domestic counterparts, and
that globally engaged �rms undertake more innovation.2 To date, these research
streams have proceeded largely in parallel with little integration. This paper ex-
pands our understanding of internationally engaged �rms by examining a number
of new dimensions of �rm activity, including how many products �rms trade, how
1These shares are probably an understatement of the employment at �rms directly engaged ingoods trade as the linked data employed in this paper cannot associate every export and importtransaction with a �rm. We discuss this issue in greater detail in the Data Appendix. We alsoprovide a more precise de�nition of non-government, non-agriculture workforce Section 3..
2See Bernard and Jensen (1995, 1999), Doms and Jensen (1998) and Criscuolo, Haskel andSlaughter (2004)

Firms that Trade 3
many countries �rms transact with, the characteristics of those countries, the con-
centration of trade across �rms and whether �rms import as well as export. We
also trace the evolution of these variables, as well as �rm survival and employment,
over time.
Our ability to answer these questions is made possible by merging two newly
available datasets. The �rst records U.S. import and exports at the transaction
level, i.e., according to the customs documents that accompany every shipment of
goods crossing a U.S. border. A unique feature of these documents is that they note
whether a transaction takes place at arms length or between related parties.3 We
merge these data with a second, recently developed longitudinal database of U.S.
enterprises that tracks almost all private sector �rms in the United States as well
as their employment over time (Jarmin and Miranda 2002).
The merged dataset provides a more complete picture of �rm-level U.S. trade
than has heretofore been possible. For example, we can examine the trading activity
of �rms both inside and outside of manufacturing. We also can identify �rms that
import as well as �rms that export or do both. Perhaps most importantly, unlike
most other data sources on trade, we can measure how much of each �rm�s trade
takes place at arms length versus with related parties.
Our analysis uncovers a wealth of interesting results. Some of these reinforce
existing �ndings, while others are entirely new. We �nd U.S. trade to be concen-
trated among a very small number of �rms. In 2000, for example, the top 1 percent
of trading �rms (in terms of their trade �ows) account for 81 percent of U.S. trade.
In terms of product and trading-partner intensity, we �nd that most importers as
well as exporters tend to trade relatively few products and engage in trade with a
relatively small number of high-income countries. However, the small number of
�rms with the greatest product and trading-partner intensity employ large numbers
of workers and account for the preponderance of both exports and imports. Over
time, the number of �rms that export and the number of �rms that import rises
substantially, from 2.6 and 1.7 percent of all �rms in 1993, respectively, to 3.1 and
2.2 percent of all �rms in 2000. For exporters, this increase is matched by greater
product and trading-partner intensity: between 1993 and 2000, exporters�average
3As discussed below, �related party� trade refers to trade between U.S. companies and theirforeign subsidiaries as well as trade between U.S. subsidiaries of foreign companies and their foreigna¢ liates. For imports, �rms are �related�if either owns, controls or holds voting power equivalentto 6 percent of the outstanding voting stock or shares of the other organization (see Section 402(e) ofthe Tari¤Act of 1930). For exports, �rms are �related�if either party owns, directly or indirectly, 10percent or more of the other party (see Section 30.7(v) of The Foreign Trade Statistics Regulations).
Firms that Trade 4
number of products increases from 6 to 10 while their average number of destination
countries increases from 3.3 to 3.5. For importers, there is little change in either
product or trading-partner intensity.
By linking trade transactions to a comprehensive database on U.S. employment
we are able to explore the composition of trading �rms across goods-producing,
wholesale and retail, and service sectors. We �nd that greatest share of exporting
and especially importing �rms are found in wholesale and retail trade. However,
goods-producing �rms account for the majority of exports and imports by value.
Multinationals that export are typically goods producers while more than half of
multinational importers are in the wholesale and retail sector.
Analysis of �rm dynamics reveals that both importing and exporting are asso-
ciated with greater probability of survival. Both importers and exporters are less
likely to exit than �rms that do not trade, and �rms that engage in some form of
related-party trade, i.e. multinationals, have even lower failure rates than �rms that
trade at arms length.4
Employment growth also varies by trading status. We �nd that trading �rms
increase employment more rapidly than non-trading �rms between 1993 and 2000.
We also observe that �rms switching their trading status during the sample pe-
riod have more extreme changes in employment growth than �rms with constant
trade status. The average �rm that opens up to trade between 1993 and 2000
experiences employment growth of close to 100 percent, while the average �rm that
quits trading over this period experiences a decline on the order of 10 percent. By
comparison, employment growth at continuing traders and continuing non-traders
averages between 20 and 25 percent.
The unique characteristics of our data permit identi�cation of a special subset
of �rms that we refer to as the �most globally engaged�(MGE). MGE �rms import
as well as export and conduct at least a portion of both types of trade with related
parties. Thus, these multinationals have the maximum possible links to the global
economy. MGE �rms are very in�uential in U.S. trade and employment. In 2000
they account for nearly 80 percent of U.S. exports and imports, respectively and
employ 18 percent of the entire U.S. civilian workforce. They also stand out in a
number of other dimensions. First, they are more likely to export to and import
from low-income countries than other U.S. exporters and importers. Second, they
experience substantially higher growth in exports and imports per worker than non-
4This de�nition of a multinational is comparable to that employed by the Bureau of EconomicAnalysis in its surveys of multinational �rms.
Firms that Trade 5
MGE traders. Finally, over time the MGEs increase their share of intra-�rm trade
with low-income countries and increase their share of arms-length trade with upper-
income countries.
The remainder of this paper is structured as follows. Section 2 documents
existing empirical research. Section 3 and the Data Appendix provide a detailed
description of our dataset. Section 4 characterizes U.S. trade according to various
dimensions of �rm activity. Section 5 o¤ers an in-depth view of U.S. multinationals
and MGEs. Section 6 summarizes trading �rm dynamics. Section 7 concludes.
2. Existing Research
We begin by reviewing the existing literature on exporters, importers and multi-
nationals. Our overview is limited to empirical studies that describe their charac-
teristics and the role they play in U.S. trade and employment. We note that there
is virtually no research documenting and analyzing importing �rms.
In the last decade a substantial body of work has documented the di¤erences
between exporters and �rms producing solely for the domestic market. Looking
at U.S. manufacturing �rms, Bernard and Jensen (1995, 1999) �nd that exporters
are relatively rare and quite large. Even in tradable goods sectors, the majority of
plants and �rms do not export and non-exporters are an order of magnitude smaller
than exporters. In addition, exporters are more productive, more capital-intensive,
pay higher wages, employ more technology and have more skilled workers than non-
exporting �rms even when controlling for industry and geography.5 To date, these
studies have been largely limited to the manufacturing sector due to the limitations
of the underlying data.6 In this paper, we summarize export participation and the
employment evolution of exporters across all sectors of the U.S. economy from 1993
to 2000.
Recent work by Eaton et al. (2004) extends the analysis of exporting manufac-
turing �rms. These authors examine French �rm-level data in 1986 that include
information on the destination markets for exporters as well as information about
the manufacturing �rms themselves. 17.4 percent of the 234,300 French manufac-
turing �rms export; among the exporters, 34.5 percent ship to exactly one country
5Similar evidence on exporters has been documented for other countries, e.g. Bernard andWagner (1997) - Germany, Clerides, Lach and Tybout (1998) - Colombia, Mexico and Morocco,Aw, Chung and Roberts (2000) - Korea and Taiwan, Delgado, Farinas, and Ruano (2002) - Spainamong many others.
6The general data source for such studies are censuses of manufacturing plants or �rms. e.g. theU.S. Census of Manufactures.

Firms that Trade 6
while 19.7 percent export to 10 or more markets and only 1.5 percent export to 50
or more countries. We examine the intensity of export and import activity by U.S.-
based �rms and changes in these intensities over time. In addition, we sort source
and destination countries into groups based on income per capita and examine how
trading patterns vary according to the global engagement of the �rm.
Given the increasing attention to exporters, it is surprising how little work has
considered the actions of importing �rms. There are no systematic studies of the
characteristics of importing �rms in the U.S. or other developed economies. Mac-
Garvie (2003) reports some features of large importers using French �rm data in her
study of the patenting behavior of trading �rms. In a subsample of 2757 large �rms,
she �nds di¤erences between �rms that trade and those that do not. Speci�cally, in
her sample she compares exporters and non-exporters and then importers and non-
importers and �nd that both exporters and importers are larger, more productive,
more capital-intensive and pay higher wages. While she notes that exporters are
likely to also be importers, she does not separately examine �rms that both export
and import. Given the nature of our data, we are able to provide a �rst look at
the extent of importing by U.S. �rms, the distribution of activity across importers,
and their role in the overall economy.
There is also an enormous literature on multinational �rms which we cannot
hope to adequately summarize here. As our focus is on the exports, imports, and
employment of U.S.-based �rms, we limit our discussion to studies of multinationals
based in the U.S., either U.S. parents or U.S. a¢ liates of foreign �rms, that also
examine these areas.
Two recent papers by Slaughter (2004a,b) using aggregate data from the Bureau
of Economic Analysis summarize employment trends of multinationals operating in
the United States. Although these papers focus on two di¤erent types of multi-
nationals based in the U.S., both report sizable increases in employment at multi-
nationals during the 1990s. Slaughter (2004a) �nds that U.S. employment of U.S.
multinationals increases from 17.5 million to 23.9 million from 1993 to 2000. Look-
ing at U.S. a¢ liates of foreign parents, Slaughter (2004b) reports that employment
rises from 3.9 million in 1992 to 5.4 million in 2002. Using our �rm-level data, we
are able to decompose the overall changes in U.S. employment from 1993 to 2000
by the trading activities of the �rm.7
Another body of work has documented di¤erences between multinational and
7Our linked trade-�rm data does not provide information on the nationality of ownership so weare unable to separately examine the activities of U.S.-based versus foreign-based multinationals.
Firms that Trade 7
domestic �rms. Doms and Jensen (1998) use plant level data from the Census
Bureau and the Bureau of Economic Analysis to examine the characteristics of plants
owned by multinational companies. Doms and Jensen �nd that U.S. plants owned
by MNCs (whether U.S. MNCs or foreign-owned MNCs) are larger, more capital
intensive, more skill intensive, pay higher wages, are more technology intensive, and
are more productive than non-MNC plants.
A related literature focuses on multinational trade. Zeile (1997) summarizes the
role of multinationals and intra-�rm trade in overall U.S. trade using data from �rm-
level surveys conducted by the Bureau of Economic Analysis. Zeile (1997) reports
little trend in the share of intra-�rm exports and imports in total U.S. exports and
imports from 1977 to 1994. He also reports that U.S. parents have seen their share
of trade decrease even as their trade has shifted toward intra-�rm activity. Using
trade transaction data, we are able to examine the role of multinationals in U.S.
exports and imports and we report separate results for total trade and related-party
trade throughout the paper.
Another collection of recent papers using �rm-level data has examined the deci-
sion by U.S. multinationals to export intermediate goods to their foreign a¢ liates.
Hanson et al (2004) �nd that higher trade costs, higher wages for unskilled labor
and higher corporate tax rates reduce demand for intermediate inputs exported by
U.S. parents. Borga and Zeile (2002) also use data on U.S. MNCs collected by
the U.S. Bureau of Economic Analysis in the 1994 benchmark survey. They report
that the share of intermediate goods exported from U.S. parents to their a¢ liates
increased from 8 percent of total U.S. exports in 1977 to 15 percent in 1999. Borga
and Zeile (2002) are primarily concerned with analyzing vertical versus horizontal
multinational structure and consider the role of �rm, industry and country e¤ects
on the share of imported intermediates in total sales of a¢ liates.
One of the main goals of this paper and further research using the transaction-
�rm linked data is the development of a deeper understanding of the decision to
trade at arms length or inside the �rm. The role of arms-length versus intra-�rm
trade has been the focus of several recent theoretical papers. Antràs (2003) devel-
ops a trade model with �rm boundaries set by incomplete contracts and property
rights to examine the variation in intra-�rm trade across destinations and sectors in
U.S. trade. Antràs and Helpman (2004) study the importance of within-sector het-
erogeneity and industry characteristics on the prevalence of integrated versus arms
length organizational forms in a model North-South trade. Grossman and Helpman
(2004) develop a model of �rm organization and location across borders that focuses
Firms that Trade 8
on problems in contracting between principals and suppliers or employees in a world
with heterogeneous �rms. Grossman et al. (2004) develop a model of heterogeneous
�rms in the presence of variation in industry characteristics, the cost of transport,
and regional demand.
3. Data
This paper exploits a new dataset which links individual trade transactions to
U.S.-based �rms. This dataset is derived from two sources. The �rst is a database
of all U.S. trade transactions assembled by U.S. Customs (imports) and the U.S.
Census Bureau (exports). These data cover all shipments of goods that crossed
into or out of the United States between 1992 and 2000 inclusive. In this paper,
we make use of data from the years 1993 and 2000.
The second data source is the Longitudinal Business Database (LBD) of the
Census Bureau.8 These data record employment and survival information for all
U.S. establishments outside of agriculture, forestry and �shing, railroads, the U.S.
Postal Service, education, public administration and several other smaller sectors.
Total employment in the sectors covered by the LBD rose from 95 million to 115
million from 1993 to 2000.9
For the �rm-level summary that is the focus of this paper, we aggregate im-
ports and exports for each �rm according to (a) product, (b) country (source or
destination), (c) relationship (intra-�rm or arms length), and (d) year.10 We also
aggregate the establishment-level employment data in the LBD up to the level of
the �rm, retaining information on the �rm-level distribution of employment across
sectors. We link the two datasets at the level of the �rm. This link allows us to
match the inward and outward trade transactions by the dimensions noted above
to the appropriate �rms. This linked data covers more than three quarters of U.S.
imports and exports in each year. All of the results reported below are with respect
to this linked dataset unless otherwise noted. We also note that all dollar amounts
reported in this paper are nominal.
8See the Data Appendix for more information on all the data sources and the sectors covered.See Jarmin and Miranda (2002) for an extensive discussion of the LBD and its construction.
9Total employment in the U.S. increases by 16.7 million from 120.2 million in 1993 to 136.9million in 2000 (Economic Report of the President 2005).10Every export or import transaction records whether the transaction takes place between �re-
lated parties�. See the Data Appendix for the de�nition of related-party transactions for exportsand imports. We use the terms �intra-�rm�and �related-party�interchangeably in this paper. All�rms that have a related-party transaction (export, import or both) during the year are describedas �multinationals�or related-party �rms.
Firms that Trade 9
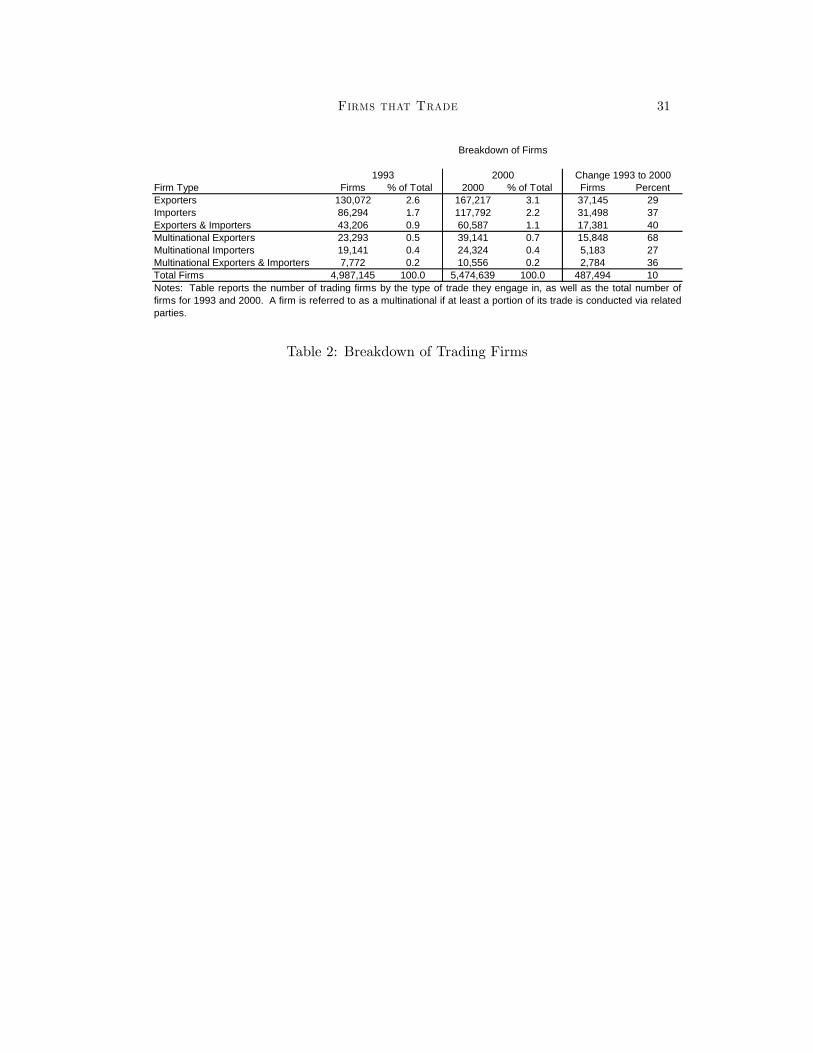
Table 2 reports the number of trading �rms as well as the total number of �rms
in each year of the sample. Firms are categorized according to whether they export,
import, or both export and import, as well as according to whether they engage in
these activities as multinationals. We categorize �rms as multinationals if at least
a portion of their trade is with related parties. Thus, �Multinational Exporters�
di¤er from �Exporters� in that the former have non-zero shares of related-party
trade. As indicated in the table, trading �rms are relatively rare vis-a-vis all �rms,
and multinationals are rarer still. The data indicate that �rms that export are
more prevalent than �rms that import, but that the numbers of both types of �rms
engaged in international trade are increasing three to seven times faster than the
overall number of �rms. In 2000, 2.6 percent of �rms export, 1.7 percent of �rms
import, and 0.9 percent of �rms both import and export. Fewer than a quarter of
exporters or importers are multinationals.
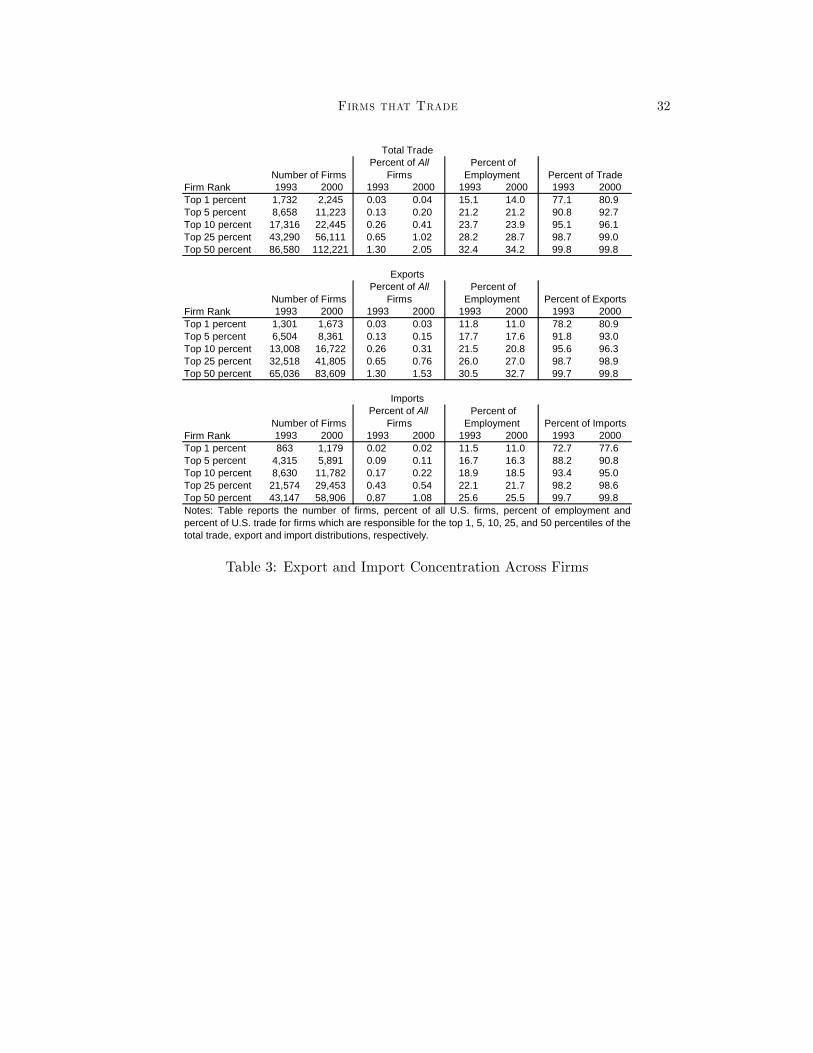
U.S. trade is heavily concentrated among a very small number of �rms. Indeed,
trade concentration is much more extreme than either production or employment.
Table 3 reports the distribution of exports and imports across �rm percentiles in
both 1993 and again in 2000. The top panel summarizes the share of U.S. trade
and employment at �rms in the top 1, 5, 10, 25, and 50 percentiles of total trade,
i.e. imports plus exports. As indicated in the table, trade concentration is re-
markably high, with the top 1 percent of traders (1732 �rms) accounting for 77
percent of exports plus imports in 1993.11 These �rms are also among the largest
in the economy, accounting for 15.1 percent of employment or 14.3 million work-
ers. Over time trade is becoming increasingly concentrated at the top �rms. By
2000, the largest 1 percent of trading �rms (2245 �rms) control almost 81 percent
of all trade.12 The second and third panels of Table 2 report concentration among
importers and exporters separately. Importers show a similar if slightly smaller
degree of concentration than exporters. For both imports and exports, the smallest
75 percent of �rms are responsible for less than 2 percent of imports and exports,
respectively.
4. Importers and Exporters
In this section we characterize U.S. �rm-level trade according to several dimen-
sions of activity. First we examine �rms�product and trading-partner intensity,
11These �rms control equal shares of exports and imports.12Note that while the shares of the top 5, 10, 25, and 50 percent of �rms rose, these increases
were due entirely to growth in shares at the very top of the distribution.
Firms that Trade 10
i.e. the number of products �rms trade and the number of countries with which
they trade. We then segment �rm trade according to the income level of source
and destination countries. Finally, we categorize trading �rms�global engagement
and identify the set and in�uence of �rms that we de�ne to be the most globally
engaged (MGE).
This section highlights several noteworthy trends. First, we show that importers
as well as exporters tend to trade relatively few products with a relatively small
number of countries. Second, we show that most trading �rms import from or
export to relatively high-income countries, and that importers are relatively more
likely to trade with lower-income countries than exporters. Third, we �nd that a
substantial and growing fraction of trading �rms are in service sectors, particularly
wholesale and retail, though the majority of MGEs, multinationals that export as
well as import, are found in manufacturing. Finally, we demonstrate that MGE
�rms dominate U.S. trade �ows and employment among trading �rms.
4.1. Firms�Product-Intensity
Exporters generally export fewer products per �rm than importers import, but
exporters are catching up over time. Between 1993 and 2000, the average number
of products exported by exporters rose from 6.1 to 8.9 products per �rm. The
average importer sources 10 products in both periods.
Table 4 reports the distribution of �rms, export and import value, intra-�rm
trade, and employment according to the number of products �rms import or export
in each year. Each cell of the table reports the share of one of these variables
accounted for by all �rms exporting or importing the number of products noted at
the left. As indicated in the table, exporters are more likely to trade just a single
product and are less likely to export more than ten products than importers, though
in both cases single-export and single-import �rms are in the majority. The vast
majority of trade value and related-party trade value, on the other hand, increasingly
�ows through �rms that export or import the largest number of products. In 2000,
just 6 percent of exports, and 2 percent of related-party exports are accounted for
by �rms shipping fewer than 10 products. Similar �gures are reported for imports.
Export product intensity is increasing over time while import product intensity is
basically �at. The share of �rms exporting just one product falls from 41.2 percent
in 1993 to 36.2 percent in 2000 while the share of �rms exporting ten or more
products increases from 11.6 percent to 17.4 percent. This shift among exporters
occurs even as the number of exporting �rms rises by 28 percent and the number
Firms that Trade 11
of exporters as a fraction of all U.S. �rms increases from 2.6 percent to 3.1 percent
(see Table 2).
The �nal block of columns in Table 4 reports the share of U.S. employment
represented by �rms that export and import relative to �rms that serve the domestic
market only. The �rst row of these columns reveals that the share of workers
employed by �rms that do not trade, while high in both periods, has fallen with
time. This decline is evident across both exporters and importers, but is more
pronounced among exporters (a decline of 63.7 to 60.6 percent versus 67.7 to 67.0
percent). The number of workers employed by �rms that export the largest number
of products grows faster (34 percent) than the overall workforce (20 percent) between
1993 and 2000.
Table 5 reports the average employment as well as trading volume per �rm
and per worker by the number of products �rms trade. As expected, average
employment per �rm is positively correlated with the number of products traded.
Firms that export the largest number of products are more than ten times larger
than exporters exporting just one or two products. Over time the average �rm size
for the most proli�c exporters has fallen from 1477 employees to 1025 employees.
Over the same interval, these �rms experience a slight decline in export value per
�rm (roughly $20 million in both years) and a 44 percent increase in export value
per worker, from $13.4 to $19.3 thousand.
These results demonstrate that, over time, trade is becoming more concentrated
at �rms sending and receiving the most products across U.S. borders. This rise in
concentration stems both from an increase in the number of �rms engaged in multi-
product trade as well as a dramatic increase in exports and imports per employee
at those same �rms. Firm size is actually decreasing for this group.
4.2. Firms�Trading-Partner Intensity
This section examines the changing nature of the �rms�global engagement in
terms of their trading-partner intensity. The average number of countries with
which exporters trade is rising over the sample period, from 3.3 to 3.5. For im-
porters, trading-partner intensity is �at at an average of 2.8 countries per �rm in
both years. Table 6 summarizes this activity. Here, as with product intensity,
there is substantial variation across �rms. More than half of both importers and
exporters transact with just a single foreign country, while substantially fewer �rms
transact with ten or more countries. Here, too, the dominant portion of exports
and imports as well as related party trade �ow through �rms transacting with the
Firms that Trade 12
largest number of countries.
Trading partner intensity increases slightly over time for importers and more so
for exporters. Between 1993 and 2000 the share of exporters transacting with just
a single country declined from 60.3 percent to 56.6 percent, while the analogous
movement for importers is a decline from 52.1 percent to 51.3 percent. Similarly,
the share of trade, the share of related-party trade and the share of employment all
increase over time for �rms trading with more than a single country.
Average �rm employment as well as average trading value per �rm and per
worker by trading-partner intensity are reported in Table 7. As above, average
employment is positively correlated with the number of countries with which �rms
trade but is declining with time. For both exporters and importers, average value
per �rm and per worker for �rms trading with the largest number of countries
increases substantially between 1993 and 2000.
Trade is also becoming more concentrated at �rms with the most trading part-
ners. Again, this rise in concentration stems both from an increase in the number
of �rms with multiple trading partners as well as a dramatic increase in exports and
imports per employee at those �rms even as �rm size has been shrinking.
4.3. The Income Level of Firms�Trading Partners
In this section we examine the types of countries with which �rms trade. Our
analysis makes use of a classi�cation developed by the World Bank that segments
countries according to whether their per capita income is low, lower-middle, upper-
middle or high.13 Use of these groups to classify trading partners is consistent
with existing research indicating a strong relationship between income per capita
and both variety-driven intra-industry trade and endowment-based comparative ad-
vantage. Though most trade is conducted with �rms in upper-income countries,
a relatively greater share of importers and import value is associated with lower-
middle-income countries. Over time, the share of trade with middle- and low-income
countries is rising.
The �rst two columns of Table 8 report the share of exporters and importers
that trade with at least one country of each type in 1993 and 2000. In both
years, the largest share of both exporters and importers trade with at least one
13We use the 2003 classi�cation for both years of our sample. The income cut-o¤s for the four groups are $765 or less, $766 to $3,035, $3,036 to $9,385 and$9,386 or more. For a list of countries and their World Bank income group, seehttp://www.worldbank.org/data/countryclass/countryclass.html. The Data Appendix describesmodi�cations made to this data.

Firms that Trade 13
upper-income country, though these shares decline over time for both groups of
�rms. In 2000, 85.6 percent of exporters and 79.9 percent of importers transact
with at least one upper-income country, down from 88.3 percent and 85.5 percent
in 1993, respectively.14 The middle two rows of each panel in Table 8 reveal that
lower-middle-income countries are substantially more important for imports than for
exports. More than 30 percent of importers source goods from at least one lower-
middle country in 1993, rising to more than 38 percent in 2000. This di¤erence is
likely driven by China, which is de�ned by the World Bank to be a lower-middle
country.
The largest shares of export and import value are destined for upper-income
countries. In 1993, 72.2 percent of exports and 69.7 percent of imports are ac-
counted for by upper income countries while low-income countries represented just
1.5 percent and 2.6 percent of trading value, respectively.15 Lower-middle income
countries are relatively more important for imports than for exports. Over time,
the export and import value shares represented by both middle income groups in-
creases the most for both imports and exports, by 4.4 percentage points for exports
and 8.6 percentage points for imports.
The middle four columns of Table 8 report the employment shares of �rms as
well as average employment per �rm according to the types of countries with which
they transact. While most exports and most exporters are engaged in trade with
upper-income countries, average employment is greatest for �rms shipping to low-
income destinations. Average �rm size falls systematically as the income of �rms�
trading partners increases. This �nding suggests that the largest �rms are the �rst
to enter markets that are least similar to the United States.
4.4. Firms�Sector A¢ liation
Typically imports and exports are categorized according to the product being
traded. In this section we focus on �rms and ask how much trade is controlled
by �rms in three broad sectors: goods producing �rms, wholesale and retail, and
service establishments. We provide the �rst direct evidence on the distribution of
trade by �rms across sectors.
We �rst place �rms in one of �ve groups based on the activities of their operations
14Note that the cumulative sum of shares in the �rst two columns of the table do not sum to 100percent because �rms may trade with countries of di¤erent income levels, and therefore be includedin more than one row of the table.15Note that export and import value shares do sum to 100 percent because export and import
value can be observed at the transaction level.

Firms that Trade 14
in the U.S.. Each establishment within a �rm is categorized by a primary industry
designation, i.e. a four-digit Standard Industrial Classi�cation code. We group
these codes into three sectors: Goods, i.e. manufacturing, mining, and agriculture,
Wholesale & Retail trade, and Services, i.e. all remaining industries. We then
calculate the share of employment within the �rm that is in each of these three
aggregate sectors. Firms are assigned to one of �ve groups �Goods, Wholesale and
Retail, Services, Goods Plus, and Other �depending upon these shares. Firms with
at least 75 percent of their employment in manufacturing, mining, and agriculture
are designated as Goods. Firms with at least 75 percent of their employment in
Wholesale and Retail or Services are assigned to those sectors respectively. Firms
with 25 to 75 percent of their employment in manufacturing, mining, and agriculture
are assigned to Goods Plus. All remaining �rms, i.e. �rms with less than 25 percent
employment in Goods and less than 75 percent employment in either Wholesale &
Retail or Services, are assigned to Other.
Table 9 shows the distribution of �rms, employment and trade by �rms�sector
a¢ liation. In 2000, Goods, Wholesale & Retail, and Services account for 99.9
percent of �rms (7.3, 23.2, and 69.4, respectively) and 95.5 percent of employment
(16.2, 24.9, and 54.4 respectively). Exporters are most likely to be in Goods or
Wholesale & Retail (35.2 and 40.8 percent, respectively) with Services accounting
for 22.6 percent. However, most exports (by value) originate in �rms with a heavy
presence in Goods: 62.8 percent at Goods �rms and 19.2 percent at Goods Plus
�rms even though the latter sector comprises a relatively small number of �rms.
Exports per �rm in the Goods Plus category average more than $61 million in 2000.
Understandably, a greater share of importers than exporters are in Wholesale &
Retail (62.7 percent in 2000), followed by Goods and Other (24.9 and 20.4 percent,
respectively). Import value is also increasingly concentrated among Goods and
Goods Plus �rms (40.1 and 21.6 percent, respectively), though the level of imports
due to Wholesale & Retail �rms (27.3 percent in 2000) is substantially higher than
for export value (10.4 percent). Related-party trade is most heavily concentrated
at production-based �rms: 90.5 percent of related-party exports and 74.5 percent
of related-party imports are at Goods and Goods Plus �rms in 2000.
Though employment rises over the sample period for �rms in all sectors except
Other, employment growth is disproportionately large among trading �rms in the
Wholesale & Retail and Service sectors. While employment in Goods �rms rises 3
percent, employment at Wholesale & Retail and Services �rms grows by 18 and 30
percent, respectively.
Firms that Trade 15
These results point to a shift in activity in the tradeable goods sectors. While
goods-producing �rms still dominate the landscape, trading �rms are increasingly
engaged in wholesale and retail trade.
4.5. Firms��Global Engagement�
In previous sections we found that the largest �rms account for the preponder-
ance of trade and are the most likely to trade with the poorest countries. In this
section we de�ne �rms�global engagement according to the breadth and depth of
their global interaction. Firms may export, import, do both or neither. Firms
that both export and import have greater breadth of global engagement than �rms
that do not trade or �rms that just export or just import. Trading �rms may also
trade via arms length transactions or with related parties, with the latter re�ecting
greater depth of global engagement than purely domestic �rms. We de�ne the
most globally engaged (MGE) �rms as those which both export to and import from
a related foreign a¢ liate.
Table 10 reports the distribution of exporters and importers according to their
export and import relationships. Results are reported in two panels, with the upper
panel summarizing all �rms that export and the lower panel summarizing all �rms
that import. The export and import relationships noted in the �rst two columns
roughly characterize increasing global engagement. For example, arms-length (AL)
exporters that do not import are the least globally-engaged exporters, i.e. they are
�less�globally engaged that exporters that also import and have at least some part
of one of their relationships encompassing trade with related parties.
As indicated in the table, the MGE �rms comprise a very small share of trad-
ing �rms, 6 percent of exporters and 9 percent of importers. The overall global
engagement of exporters is increasing with time. Between 1993 and 2000, the
share of exclusively arms-length exporters declined from 59 percent to 53 percent.
Exclusively arms-length importers are 44 percent and 43 percent of all importers,
respectively, in the two years.
Table 11 summarizes trading �rms according to both their level of global en-
gagement and the income level of countries with which they trade. The �rst block
of columns reports results for exporters and the countries to which they send goods
while the second block of columns reports results for importers and the countries
from which they source products. In 1993, for example, 3 percent of exporters that
only export and only via arms length trade shipped goods to at least one country
Firms that Trade 16
with the lowest-level of income. The analogous number for importers is 7 percent.16
Table 11 shows that trading �rms are most likely to transact with upper-income
countries regardless of their level of global engagement, reinforcing the message of
Table 8 above. More interestingly, the table reveals that the most globally engaged
�rms (MGEs), i.e. those that both import and export and engage in at least some
trade with related parties, are the most likely to export to countries of all types.
While just 4 percent of exclusively arms length exporters export to a low-income
country in 2000, for example, 18 to 26 percent of the most globally engaged �rms do
so that year. These di¤erences between the least and most globally engaged �rms
are generally more pronounced for exporters than for importers, but are present for
both groups of trading �rms. Table 11 also shows that the greater proclivity of
importers to trade with lower-middle income countries increases with their global
engagement.
Table 12 reports export and import value shares according to the same typology
used in Table 11.17 As expected, upper-income countries account for the largest
share of trade value. However, an interesting di¤erence emerges between low and
low-middle trading partners versus upper and upper-middle partners. Looking
across types of �rms, we �nd that poorer countries account for a relatively larger
share of trade at the least globally engaged �rms. In 2000, arms length exporters
ship 20 percent of their goods to the two lowest income groups and arms length
imports source 40 percent of their imports from the same countries. In contrast,
the most globally-engaged multinationals send just 16 percent of their exports and
source 16 percent of their imports from these same countries.
5. Multinationals
Multinationals play a key role in U.S. employment and trade patterns. Em-
ployment at multinationals accounts for 33.3 million workers or 29.1 percent of the
non-governmental workforce in 2000, up from 25.5 million workers and 26.7 percent
in 1993 (Table 13). The increase of employment at multinational �rms represents
more than 40 percent of the net job creation in the private sector over period high-
lighting the disproportionate role of multinationals as a source of job creation.
Multinationals also mediate a substantial majority of U.S. trade. This role
16As noted in the table, the percentages for any given level of global engagement do not sum to100 percent because �rms may trade with countries of more than one income level.17As noted in the table, the export or import value percentages for each export and import
relationship pair sum to 100 percent because trade can be observed at the �rm-transaction level.
Firms that Trade 17
is highlighted by Figure 1, which reveals that roughly 90 percent of U.S. exports
and imports in our sample �ow through multinational �rms. Each column in
the �gure reports the total trade by either exclusively arms length trading �rms or
multinationals in 1993 or 2000. The �rst four columns summarize imports while the
second four columns summarize exports. The columns for multinationals note the
share of their trade that is conducted at arms length as well as the share conducted
inside the �rm.
As indicated in the Figure, multinationals�share of total trade in our sample in-
creases over time, rising 2.0 percent for imports and 4.0 percent for exports. Within
multinationals, the breakdown of trade between intra-�rm and arms length trans-
actions remains relatively constant over time. For imports, the share of intra-�rm
trade in the linked dataset rises slightly from 48.4 percent in 1993 to 51.7 percent
in 2000. For exports, it falls from 35.6 to 32.6 percent.
Figures 2 and 3 break down U.S. exports and imports, respectively, by the global
engagement categories employed in Section 4.5.. A large majority of both exports
and imports are due to �rms that both export to and import from related-parties,
i.e. MGEs. In both cases these shares increase over time, from more than 70 percent
in 1993 to just under 80 percent in 2000. The role of MGEs in both employment
and, especially, trade is on the rise, driven in large part by a large increase in the
number of these most globally engaged �rms.
Within multinationals, the share of trade that is with related parties varies
widely. Table 14 reports the distribution of multinational �rms and related-party
trade according to related-party-trade intensity, i.e., whether related-party trade
accounts for less than 25 percent, between 25 percent and 75 percent, or more than
75 percent of multinationals�trade, respectively. For a large share of multinationals,
related-party trade makes up less than a quarter of total trade.
Among �rms with higher related-party-trade intensity, there are substantial dif-
ferences between exporters and importers. About a quarter of multinationals have
intra-�rm trade shares between 0.25 and 0.75. Exporters in this group account for a
majority of related-party trade, 56.6 percent in 1993 while importers in this group,
by contrast, account for a much smaller share of intra-�rm trade, 30.8 percent.
The roles are reversed for multinationals reporting the highest level of related-party
trade intensity. Exporters with intra-�rm trade shares greater than 75 percent are
only 22 percent of all exporting multinationals in 1993 and their share of overall
intra-�rm exports is relatively low, 36.7 percent. Firms with intra-�rm import
shares greater than 75 percent are about one third of importing multinationals but
Firms that Trade 18
dominate overall intra-�rm imports, 66.0 percent of total related party imports in
1993.
There are signi�cant changes over time in the share of �rms and intra-�rm trade
in the three groups of multinationals. In addition we �nd di¤erent trends for
exports and imports. Between 1993 and 2000, the share of multinationals in the
lowest related-party-trade intensity category increases from 53.0 and 41.9 percent
to 63.9 and 43.1 percent for exporters and importers, respectively. However, these
�rms are responsible for a relatively small, albeit rising, amount of related-party
trade in both years, less than 10 percent for exports and less than 4 percent for
imports. One potential explanation for these trends is the substantial increase in
the numbers of multinationals during the period. New multinationals may have
smaller share of related party trade than established �rms.
The share of exports among �rms with intermediate related-party-trade intensity
rises to 68.3 percent in 2000, while importers in this group account for a smaller
share of imports in 2000, 25.9 percent. The roles are reversed for multinationals
reporting the highest level of related-party trade intensity with the share of intra-
�rm trade falling to 13.1 for exporters and rising to 70.6 percent for importers in
2000.
5.1. The Most Globally Engaged Firms (MGEs)
The most globally engaged �rms are multinationals that both import and export
with related-parties. In this section we describe the activities of this set of �rms in
greater detail.
Table 15 breaks out the number of �rms, trading value and employment of the
most globally engaged �rms according to the sectoral activity of the �rm. The
distribution of MGEs across sectors is sharply di¤erent from the overall distribution
of �rms reported in Table 9. Firms with a major presence in goods production,
either Goods or Goods Plus, account for more than 50 percent of MGE �rms. In
contrast goods-producing �rms account for under 10 percent of all U.S. �rms and 35
percent of non-multinational �rms that import and export. Wholesale and Retail
and Services �rms are 10 percent and 37 percent of MGEs respectively in 2000.
The importance of Goods and Goods Plus �rms among the most globally engaged
�rms is even more evident when we consider their share of trade �ows. Goods-
producing �rms control an increasing share of total trade by MGEs, 91 percent
of exports and 72 percent of imports in 2000. Intra-�rm trade by MGEs is even
more concentrated at Goods and Goods Plus �rms. Their share of MGE intra-�rm
Firms that Trade 19
imports rises to 77 percent in 2000 while their export share increases to 93 percent.
These increases in export and import shares occur even as employment is shifting
towards MGEs in the Wholesale and Retail sector. The overall picture painted by
Table 15 is of the continued and increasing importance of goods-producing �rms in
U.S. trade �ows controlled by MGEs.
Table 16 provides a view of the distribution of MGE activity across country-
income groups. The �rst two columns report the share of MGE intra-�rm exports
and imports by source or destination country where, as before, countries are grouped
by per capita income. The last two columns report the share of total U.S. exports
and imports controlled by MGEs. Looking across country groups, we �nd that
intra-�rm trade shares for MGEs generally are rising with the income of the source
or destination country. However, there have been several notable changes over
time. For both exports and imports, intra-�rm trade shares are rising for the lower
income countries. In contrast, intra-�rm exports to upper income destinations
fall for MGEs, while imports show small increases in intra-�rm trade even for the
upper income source countries. At the same time, Table 16 reveals that while the
importance of trade with the most globally engaged �rms is falling for low-income
countries, it is rising for middle- and high-income countries.
Throughout this paper, we have found that multinationals that both export to
and import from a related party play a large role in total U.S. trade. The results
here suggest these �rms are still heavily associated with goods production and that
the extent of their intra-�rm trade varies substantially with the characteristics of
the source or destination country.
6. Importer and Exporter Dynamics
In this section we examine trading-�rm versus non-trading-�rm survival and
employment growth rates as well as changes in �rms�trading status between 1993
and 2000. We �nd that both importing and exporting are positively associated
with survival and that multinationals have an even higher probability of survival
than the larger group of trading �rms. We also show that employment growth
varies by trading status, with �rms that transition from being non-traders to traders
expanding the fastest.

Firms that Trade 20
6.1. Firm Survival Dynamics
Table 17 decomposes the overall growth of trading �rms between 1993 and 2000
into several categories. Each row of the table focuses on a di¤erent, non-mutually
exclusive subset of trading �rms. In the upper panel, the �rst and last columns
of the table report the number of �rms in each subset of �rms at the beginning
and end of the sample period. The second and third columns of the top panel
report the number of 1993 �rms that shutdown and the number of new �rms that
enter between 1993 and 2000 respectively. The fourth, �fth and sixth columns of
the upper panel report on �rms that exist in both years according to their trading
status: trade in both years, start trading and stop trading respectively. The �nal
row of the upper panel reports an analogous breakdown for all �rms. The lower
panel of the table expresses all of these �rm counts as percentages of their 1993
values.
As indicated in the Table, survival rates for �rms vary according to their trading
status. Exit rates for every type of trading �rm (33 to 39 percent) are signi�cantly
lower than the failure rate for all �rms (47 percent). Among trading �rms, multina-
tionals have higher survival probabilities than their non-multinational counterparts,
while MGE �rms, i.e., multinationals that both import and export, have the highest
survival rate of all. The relatively low failure of MGE �rms is one contributor to
the rising share of MGE �rms over time.
6.2. Firm Trading-Status Dynamics
Table 17 reveals that another factor in the rising share of globally engaged �rms
over the sample period is the transition of some continuing �rms from non-trading
to trading status between 1993 and 2000. The �rst row of the table, for example,
indicates that 49,035 �rms, or 1.9 percent of the 2.6 million continuing �rms that
did not trade in 1993, become exporters over the sample period. The share continu-
ing �rms that move in the opposite direction, i.e., that shift from being exporters in
1993 to be non-exporters in 2000, by contrast, constitute a much small percentage (1
percent). Similar relative magnitudes are found for all forms of global engagement
�the share of continuing �rms that disengage from international trade ranges from
roughly one-third to three-quarters of the share of continuing �rms that start trad-
ing. Furthermore, the levels and shares of �rms that start engaging in international
trade exceed the number of international traders that exit. Both the higher likeli-
hood of �rms switching into trade relative to switching out and the higher number
Firms that Trade 21
of new entrants engaged in international trade spur increases in the overall share of
globally engaged �rms.
6.3. Firm Employment Dynamics
Table 18 decomposes 1993 to 2000 employment growth along the same dimen-
sions as Table 17. As indicated in the last row of each panel, aggregate employment
grows by 19 million workers, or 20 percent, over the sample period. Employment at
trading �rms generally grows even faster. Exporters and multinational exporters ex-
perience the highest employment growth rates, at 30.2 and 32.3 percent respectively.
The higher employment growth in the exporters category is due to both employment
growth at continuing �rms that export and continuing �rms that start to export.
The net employment e¤ect of the exit of exporters and the entrance of new export-
ing �rms is negative (as exiting �rms tend to be larger than entrants). Employment
growth across importers and multinational importers is somewhat lower, at 22.3
and 19.5 percent, respectively, while employment growth across all �rms that both
export and import is 27.4 percent while multinationals that both import and export
expand by 20.3 percent.
Table 19 shows the employment growth at �rms by trading status. The most
striking feature is the employment growth rates at �rms that change their trading
status. Firms that switch from being non-traders in 1993 to traders in 2000 expe-
rience the largest gains in employment growth. This growth is highlighted in Table
19, which reveals that �rms that become exporters over the sample period increase
their employment by 94.3 percent, from 3.9 million to 7.4 million.18 Firms that
become importers or switch into both importing and exporting experience similar
increases. Table 19 also reports the employment declines experienced by �rms that
exit international markets. Firms that quit exporting, quit importing, and quit both
importing and exporting witness declines of 12.3, 16.6 and 10.1 percent, respectively.
Table 19 also reports the employment growth rates at �rms that maintained
the same status in both periods. For continuers, trading �rms that maintain their
trading status typically have lower employment growth rates than non-trading �rms
that maintain their trading status.
18This is consistent the �ndings of Bernard and Jensen (1999, 2004) that exporters grow signi�-cantly faster than non-exporters.
Firms that Trade 22
7. Conclusions
This paper provides a new integrated portrait of �rms in the U.S. that trade
goods. We document the increasing globalization of U.S. �rms by linking data on
U.S. international trade transactions to a comprehensive census of U.S. enterprises.
U.S. �rms�global engagement is increasing in a number of dimensions. First, there
is substantial growth in the number of �rms that export, import and trade with
related parties. Second, �rms increasingly send a greater number of products to a
larger set of more diverse countries. Third, trading �rms are becoming increasingly
more import and export intensive in terms of their dollar value of trade per worker.
We show that the most globally engaged �rms, i.e., those that export as well as
import from related parties, have substantial in�uence: they both account for a
signi�cant share of U.S. employment and mediate a dominant portion of U.S. trade
�ows.
The data employed in this paper can be used to answer a wide-ranging set of
questions about the decisions of �rms engaged in international commerce. By being
able to separately identify arms-length and intra-�rm transactions, we can under-
stand the response of multinationals to �nancial crises, transfer pricing inside the
�rm, the role of �rm, product and country characteristics in the decision to out-
source, pricing-to-market and pass-through responses to exchange rate movements,
the role of multinationals in job creation, and the importance of imports and exports
in �rm performance among many others.
Firms that Trade 23
References
Antràs, Pol, (2003), �Firms, Contracts, and Trade Structure,�Quarterly Journal of
Economics, 118 (4), November, pp. 1374-1418.
Antràs, Pol and Elhanan Helpman, (2004), �Global sourcing�, Journal of Political
Economy 112: 552-580.
Aw, Bee Y., S. Chung, and Mark J. Roberts M, (2000), �Productivity and turnover
in the export market: Micro-level evidence from the Republic of Korea and
Taiwan (China)�, World Bank Economic Review, 14 (1): 65-90
Baldwin, John R. and Wulong Gu, (2003), �Export-market participation and pro-
ductivity performance in Canadian manufacturing�, Canadian Journal of Eco-
nomics, 36 (3): 634-657
Bernard, Andrew B. and J. Bradford Jensen. (1995). �Exporters, Jobs, and Wages
in U.S. Manufacturing, 1976-1987.� Brookings Papers on Economic Activity,
Microeconomics. Washington DC.
Bernard, Andrew B. and J. Bradford Jensen. (1999). �Exceptional Exporter Per-
formance: Cause, E¤ect or Both?�Journal of International Economics Vol. 47,
No. 1: 1-25.
Bernard, Andrew B. and J. Bradford Jensen. (2004). �Exporting and Productivity
in the USA�Oxford Review of Economic Policy, 2004, Vol. 20, No. 3, 343-357.
Bernard Andrew B. and Joachim Wagner (1997), �Exports and success in German
manufacturing�, Weltwirtschaftliches Archiv, 133 (1): 134-157
Borga, Maria and William J. Zeile, (2004), �International Fragmentation of Pro-
duction and the Intra�rm Trade of U.S. Multinational Companies�, Bureau of
Economic Analysis Working Paper 2004-02.
Clerides, Sofronis K., Saul Lach, and James R. Tybout, (1998) �Is learning by
Exporting Important? Micro-dynamic Evidence from Colombia, Mexico, and
Morocco." Quarterly Journal of Economics, Vol. 113, No. 3, 903-947.
Chiara Criscuolo, Jonathan E. Haskel and Matthew J. Slaughter (2004), �Why Are
Some Firms More Innovative? Knowledge Inputs, Knowledge Stocks, and the
Role of Global Engagement�, Tuck School of Business mimeo.
Firms that Trade 24
Delgado M.A., J.C. Farinas, and S. Ruano, (2002), �Firm productivity and export
markets: a non-parametric approach�, Journal of International Economics, 57
(2): 397-422
Doms, Mark E. , and J. Bradford Jensen, (1998) �Comparing wages, skills and
productivity between domestically and foreign-owned manufacturing establish-
ments in the United States�in R.E. Lipsey R.E. Baldwin and J.D. Richardson,
editors, Geography and Ownership as bases for economic accounting, Universtiy
of Chicago press, 235�258.
Economic Report of the President, (2005) U.S. Government Printing O¢ ce, Wash-
ington, DC 20402-0001
Grossman, Gene M. and Elhanan Helpman, (2004), �Managerial incentives and the
international organization of production�, Journal of International Economics
63, 237-262.
Grossman, Gene M., Elhanan Helpman, and Adam Szeidl, (2004), �Optimal Inte-
gration: Strategies for the Multinatinal Firm�, CEPR Working Paper No. 4477.
Hanson, Gordon H., Raymond J. Mataloni, and Matthew J. Slaughter, (2004), �
Vertical Production Networks in Multinational Firms�, revision of NBER Work-
ing Paper #9723.
MacGarvie, Megan, (2003), �Do Firms Learn from International Trade? Evidence
from Patent Citations and Micro Data", Boston University School of Manage-
ment mimeo.
Slaughter, Matthew J. (2004a), �Globalization and Employment by U.S. Multina-
tionals: A Framework and Some Facts�Daily Tax Report, March 26.
Slaughter, Matthew J. (2004b), �Insourcing Jobs: Making the Global Economy
Work for America�Organization for International Investment, mimeo, October.
Zeile, William J., (1997), �U.S. Intra�rm Trade in Goods�, Survey of Current Busi-
ness, 77:2, February, 23-38.
Firms that Trade 25
A Data Appendix
A1. Data Sources
In this paper, we make use of transaction level import and export data linked
to information on �rms in operation in the U.S..
The transaction data used in this paper are compiled from administrative records
from the o¢ cial U.S. import and export merchandise trade statistics. The merchan-
dise trade data are a complete enumeration of documentation collected by the U.S.
Customs Service and are not subject to sampling error. Quality assurance proce-
dures are performed at every stage of collection, processing and tabulation; however,
the data are subject to non-sampling errors, including undocumented shipments,
timeliness, and data capture errors.
The establishment and �rm data used in this paper are compiled from admin-
istrative records and the Census Bureau�s Company Organization Survey program.
The establishment level data should represent a complete enumeration of all es-
tablishments in scope for the Economic Census and not subject to sampling error.
However, the data are subject to non-sampling errors.
A2. Export Transaction Data
We make use of transaction level data on exports collected by the U.S. Census
Bureau via the Shippers Export Declaration (currently U.S. Department of Com-
merce Form 7525-V). The Census Bureau collects export shipments data for all
export shipments above $2,500. The Shippers Export Declaration (SED) contains
information on the �rm that ships the exports (Employer Identi�cation Number),
detailed 10-digit Harmonized System product code, value, quantity, export destina-
tion, date of the transaction, port, mode of transport, and whether the transaction
is between related parties.19
The datanumber of export transactions range from 13 million in 1993 to 23
million in 2000 and represent the universe of export shipments greater than $2,500.
The Census Bureau imputes a total value for low-value exports. We exclude these
imputed records.
19For exports, Foreign Trade Statistics Regulations, 30.7(v), de�ne a related party transaction asone between a U.S. exporter and a foreign consignee, where either party owns, directly or indirectly,10 percent or more of the other party.
Firms that Trade 26
A2.1. Canada Data Exchange
The data for exports to Canada is not collected through the Shippers Export
Declaration. To reduce reporting burden for U.S. and Canadian �rms, the U.S. and
Canada exchange import transaction information. The U.S. uses Canadian import
transaction from the U.S. as export transaction to Canada. These transactions con-
tain the same information as the SEDs with the exception of Employer Identi�cation
Number. The Canadian transactions do not contain EIN but instead contain a �rm
name �eld.
Exports to Canada account for approximately 35 percent of total transaction
volume and approximately 20 percent of total transaction value.
A3. Import Transaction Data
We make use of transaction level data on imports collected by U.S. Customs
and Border Protection via import declarations (including current U.S. Customs
Forms 7501 and 7533). U.S. Customs collects import shipments data for all import
shipments above $2,000 ($250 for certain quota items). The Customs forms contain
information on the �rm that imports (Employer Identi�cation Number), detailed
10-digit Harmonized System product code, value, quantity, country of origin, date
of the transaction, port, mode of transport, and whether the transaction is between
related parties.20
The number of import transactions range from 16 million in 1993 to 33 million in
2000 and represent the universe of import shipments greater than $2,000. The Cen-
sus Bureau imputes a total value for low-value imports. We exclude these imputed
records.
A4. Standard Statistical Establishment List (SSEL)/Business Register
We make use of Employer Identi�cation information and business name informa-
tion from the Census Bureau Business Register (also called the Standard Statistical
Establishment List (SSEL)). The SSEL contains records for all private entities except
households. The SSEL carries information on the business name, address, Employer
Identi�cation Number (EIN), and information on the industry and employment at
the entity. The SSEL also contains information on the �rm or enterprise that owns
20For imports, Section 402(e) of the Tari¤ Act of 1930 de�nes related party trade to includetransactions between parties with various types of relationships including �any person directly orindirectly, owning, controlling or holding power to vote, 6 percent of the outstanding voting stockor shares of any organization.�
Firms that Trade 27
the entity. We make use of the EIN and name information to match �rm identi�ers
to the import and export transaction data. We use the SSEL because it contains
name, EIN, and �rm level information and because it represents the largest possible
universe of �rms.
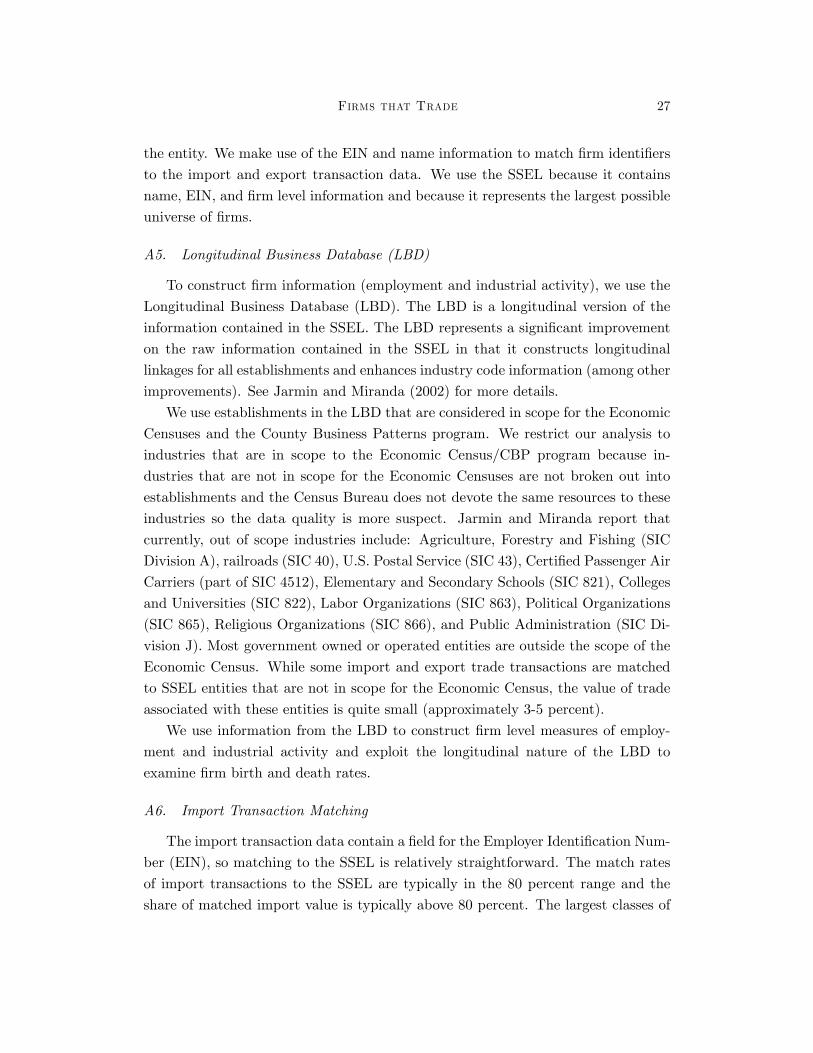
A5. Longitudinal Business Database (LBD)
To construct �rm information (employment and industrial activity), we use the
Longitudinal Business Database (LBD). The LBD is a longitudinal version of the
information contained in the SSEL. The LBD represents a signi�cant improvement
on the raw information contained in the SSEL in that it constructs longitudinal
linkages for all establishments and enhances industry code information (among other
improvements). See Jarmin and Miranda (2002) for more details.
We use establishments in the LBD that are considered in scope for the Economic
Censuses and the County Business Patterns program. We restrict our analysis to
industries that are in scope to the Economic Census/CBP program because in-
dustries that are not in scope for the Economic Censuses are not broken out into
establishments and the Census Bureau does not devote the same resources to these
industries so the data quality is more suspect. Jarmin and Miranda report that
currently, out of scope industries include: Agriculture, Forestry and Fishing (SIC
Division A), railroads (SIC 40), U.S. Postal Service (SIC 43), Certi�ed Passenger Air
Carriers (part of SIC 4512), Elementary and Secondary Schools (SIC 821), Colleges
and Universities (SIC 822), Labor Organizations (SIC 863), Political Organizations
(SIC 865), Religious Organizations (SIC 866), and Public Administration (SIC Di-
vision J). Most government owned or operated entities are outside the scope of the
Economic Census. While some import and export trade transactions are matched
to SSEL entities that are not in scope for the Economic Census, the value of trade
associated with these entities is quite small (approximately 3-5 percent).
We use information from the LBD to construct �rm level measures of employ-
ment and industrial activity and exploit the longitudinal nature of the LBD to
examine �rm birth and death rates.
A6. Import Transaction Matching
The import transaction data contain a �eld for the Employer Identi�cation Num-
ber (EIN), so matching to the SSEL is relatively straightforward. The match rates
of import transactions to the SSEL are typically in the 80 percent range and the
share of matched import value is typically above 80 percent. The largest classes of
Firms that Trade 28
unmatched import transactions are import transactions where the EIN is not in the
SSEL or the EIN �eld is blank. Non-employers are not included in the SSEL, so im-
port transactions with Social Security Numbers (SSN) as the �rm identi�er will not
match to the SSEL. The other large category of non-matches is import transaction
where the EIN �eld is blank representing about 3-5 percent of import transactions
and import value.
Once the match to the SSEL is made via the EIN, �rm level identi�ers are
applied to the import transaction data. These �rm level identi�ers are then used
to match to �rm level information constructed from the LBD. Detailed match rate
information on import transactions and import value is presented in the top panel
of Table 20.
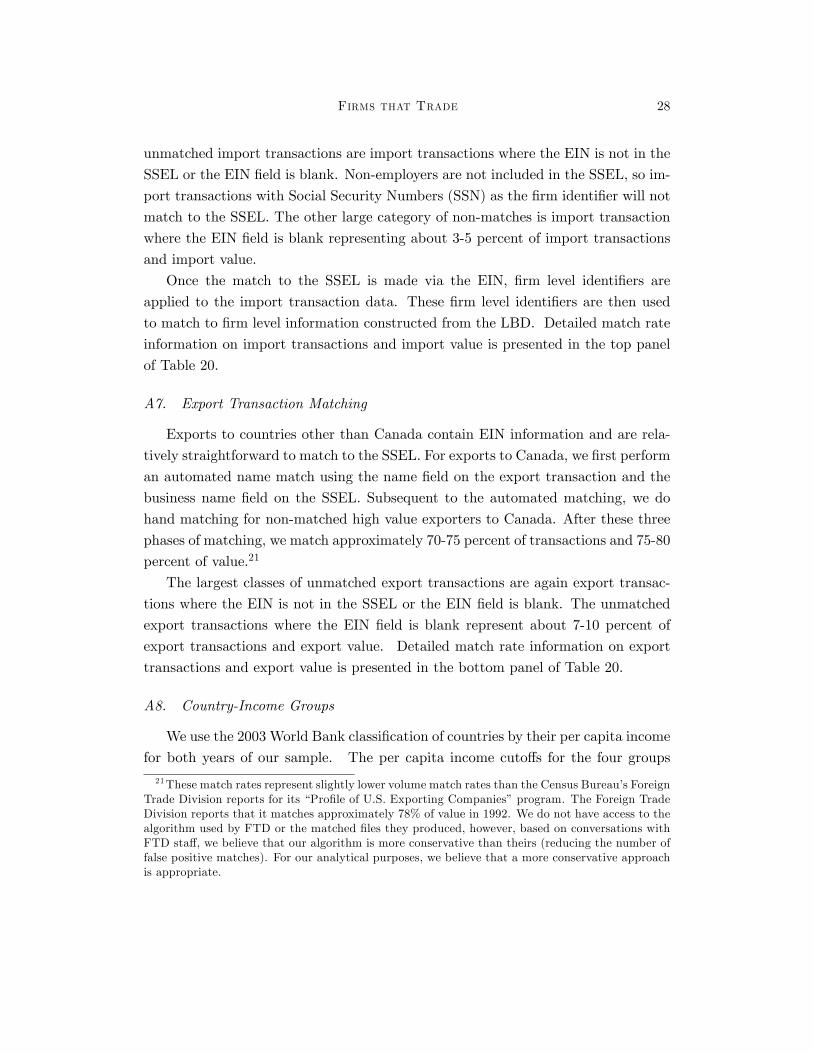
A7. Export Transaction Matching
Exports to countries other than Canada contain EIN information and are rela-
tively straightforward to match to the SSEL. For exports to Canada, we �rst perform
an automated name match using the name �eld on the export transaction and the
business name �eld on the SSEL. Subsequent to the automated matching, we do
hand matching for non-matched high value exporters to Canada. After these three
phases of matching, we match approximately 70-75 percent of transactions and 75-80
percent of value.21
The largest classes of unmatched export transactions are again export transac-
tions where the EIN is not in the SSEL or the EIN �eld is blank. The unmatched
export transactions where the EIN �eld is blank represent about 7-10 percent of
export transactions and export value. Detailed match rate information on export
transactions and export value is presented in the bottom panel of Table 20.
A8. Country-Income Groups
We use the 2003 World Bank classi�cation of countries by their per capita income
for both years of our sample. The per capita income cuto¤s for the four groups
21These match rates represent slightly lower volume match rates than the Census Bureau�s ForeignTrade Division reports for its �Pro�le of U.S. Exporting Companies�program. The Foreign TradeDivision reports that it matches approximately 78% of value in 1992. We do not have access to thealgorithm used by FTD or the matched �les they produced, however, based on conversations withFTD sta¤, we believe that our algorithm is more conservative than theirs (reducing the number offalse positive matches). For our analytical purposes, we believe that a more conservative approachis appropriate.

Firms that Trade 29
are $765 or less, $766 to $3,035, $3,036 to $9,385 and $9,386 or more. For a list of
countries and their World Bank income group,see
http://www.worldbank.org/data/countryclass/countryclass.html.
Taiwan, Israel and Czechoslovakia (1993 only) were not in the World Bank list-
ing and were allocated to the upper middle, upper, and lower middle country income
groups respectively. Smaller trading partners of the U.S., i.e. some small coun-
tries and country subdivisions, e.g. territories, that were missing per capita income
information in the World Bank data were omitted from the country income group
analysis.

Firms that Trade 30
Employment Share* (%) Employment Share* (%)Firms that trade 38.1 40.0 47.9 41.9Firms that export 34.6 36.3 45.0 39.4Firms that import 30.8 32.3 37.7 33.0Firms that export and import 27.3 28.7 34.8 30.4Firms that just export 7.3 7.7 10.2 8.9Firms that just import 3.5 3.7 2.9 2.5
1993 2000
Notes: Table reports the amount of employment (in millions of workers) and share of totalcivilian U.S.employment at private firms. For a more detailed description of the firm andemployment data see Section 3 and the Appendix. The categories are not mutuallyexclusive, i.e. the bottom three rows sum to the first row, as do the second and the sixth,and similarly for the third and fifth rows.
Employment (Mill) at Trading Firms
Table 1: Employment at Firms Engaged in Trade
Firms that Trade 31
Firm Type Firms % of Total 2000 % of Total Firms PercentExporters 130,072 2.6 167,217 3.1 37,145 29Importers 86,294 1.7 117,792 2.2 31,498 37Exporters & Importers 43,206 0.9 60,587 1.1 17,381 40Multinational Exporters 23,293 0.5 39,141 0.7 15,848 68Multinational Importers 19,141 0.4 24,324 0.4 5,183 27Multinational Exporters & Importers 7,772 0.2 10,556 0.2 2,784 36Total Firms 4,987,145 100.0 5,474,639 100.0 487,494 10Notes: Table reports the number of trading firms by the type of trade they engage in, as well as the total number offirms for 1993 and 2000. A firm is referred to as a multinational if at least a portion of its trade is conducted via relatedparties.
1993 2000 Change 1993 to 2000
Breakdown of Firms
Table 2: Breakdown of Trading Firms
Firms that Trade 32
1993 2000 1993 2000 1993 2000 1993 2000Top 1 percent 1,732 2,245 0.03 0.04 15.1 14.0 77.1 80.9Top 5 percent 8,658 11,223 0.13 0.20 21.2 21.2 90.8 92.7Top 10 percent 17,316 22,445 0.26 0.41 23.7 23.9 95.1 96.1Top 25 percent 43,290 56,111 0.65 1.02 28.2 28.7 98.7 99.0Top 50 percent 86,580 112,221 1.30 2.05 32.4 34.2 99.8 99.8
1993 2000 1993 2000 1993 2000 1993 2000Top 1 percent 1,301 1,673 0.03 0.03 11.8 11.0 78.2 80.9Top 5 percent 6,504 8,361 0.13 0.15 17.7 17.6 91.8 93.0Top 10 percent 13,008 16,722 0.26 0.31 21.5 20.8 95.6 96.3Top 25 percent 32,518 41,805 0.65 0.76 26.0 27.0 98.7 98.9Top 50 percent 65,036 83,609 1.30 1.53 30.5 32.7 99.7 99.8
1993 2000 1993 2000 1993 2000 1993 2000Top 1 percent 863 1,179 0.02 0.02 11.5 11.0 72.7 77.6Top 5 percent 4,315 5,891 0.09 0.11 16.7 16.3 88.2 90.8Top 10 percent 8,630 11,782 0.17 0.22 18.9 18.5 93.4 95.0Top 25 percent 21,574 29,453 0.43 0.54 22.1 21.7 98.2 98.6Top 50 percent 43,147 58,906 0.87 1.08 25.6 25.5 99.7 99.8
Percent ofEmployment
Notes: Table reports the number of firms, percent of all U.S. firms, percent of employment andpercent of U.S. trade for firms which are responsible for the top 1, 5, 10, 25, and 50 percentiles of thetotal trade, export and import distributions, respectively.
Imports
Firm Rank Number of Firms
Percent of AllFirms Percent of Imports
Total Trade
Firm Rank Number of Firms
Percent of AllFirms Percent of Trade
Percent ofEmployment
Exports
Firm Rank Number of Firms
Percent of AllFirms Percent of Exports
Percent ofEmployment
Table 3: Export and Import Concentration Across Firms
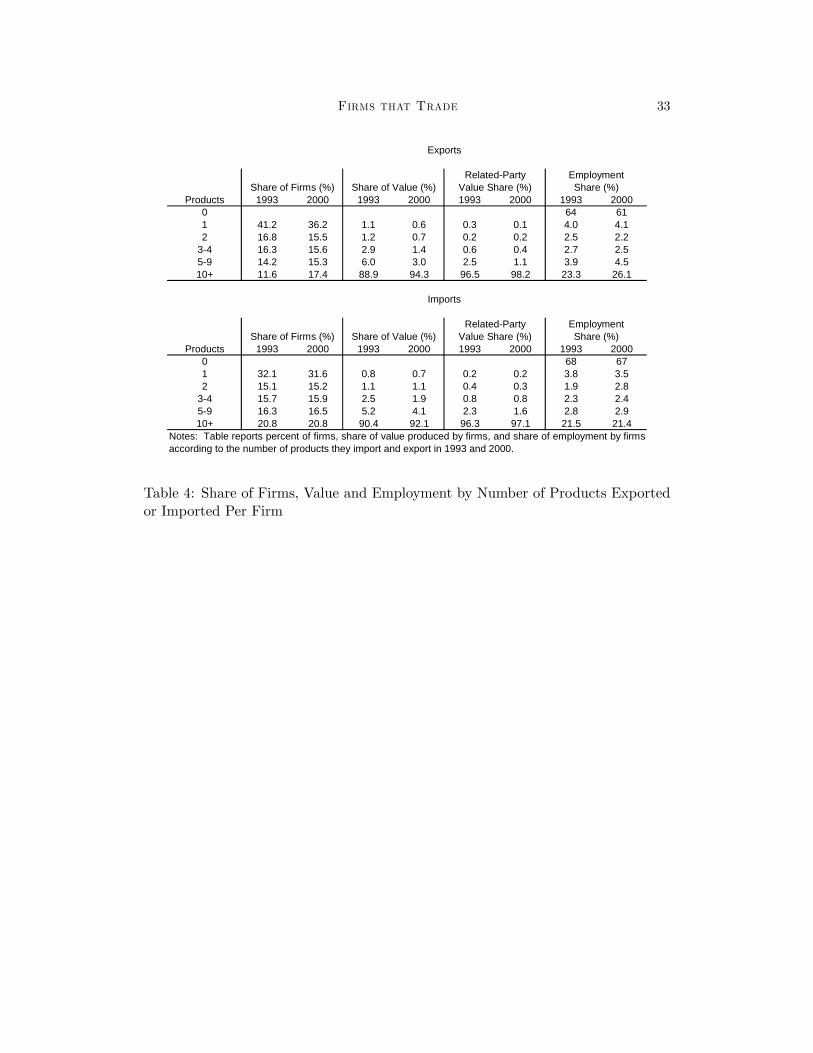
Firms that Trade 33
Products 1993 2000 1993 2000 1993 2000 1993 20000 64 611 41.2 36.2 1.1 0.6 0.3 0.1 4.0 4.12 16.8 15.5 1.2 0.7 0.2 0.2 2.5 2.2
3-4 16.3 15.6 2.9 1.4 0.6 0.4 2.7 2.55-9 14.2 15.3 6.0 3.0 2.5 1.1 3.9 4.510+ 11.6 17.4 88.9 94.3 96.5 98.2 23.3 26.1
Products 1993 2000 1993 2000 1993 2000 1993 20000 68 671 32.1 31.6 0.8 0.7 0.2 0.2 3.8 3.52 15.1 15.2 1.1 1.1 0.4 0.3 1.9 2.8
3-4 15.7 15.9 2.5 1.9 0.8 0.8 2.3 2.45-9 16.3 16.5 5.2 4.1 2.3 1.6 2.8 2.910+ 20.8 20.8 90.4 92.1 96.3 97.1 21.5 21.4
Exports
Related-Party Employment
Related-Party Employment
Imports
Notes: Table reports percent of firms, share of value produced by firms, and share of employment by firmsaccording to the number of products they import and export in 1993 and 2000.
Share of Firms (%) Share of Value (%) Value Share (%) Share (%)
Value Share (%) Share (%)Share of Firms (%) Share of Value (%)
Table 4: Share of Firms, Value and Employment by Number of Products Exportedor Imported Per Firm
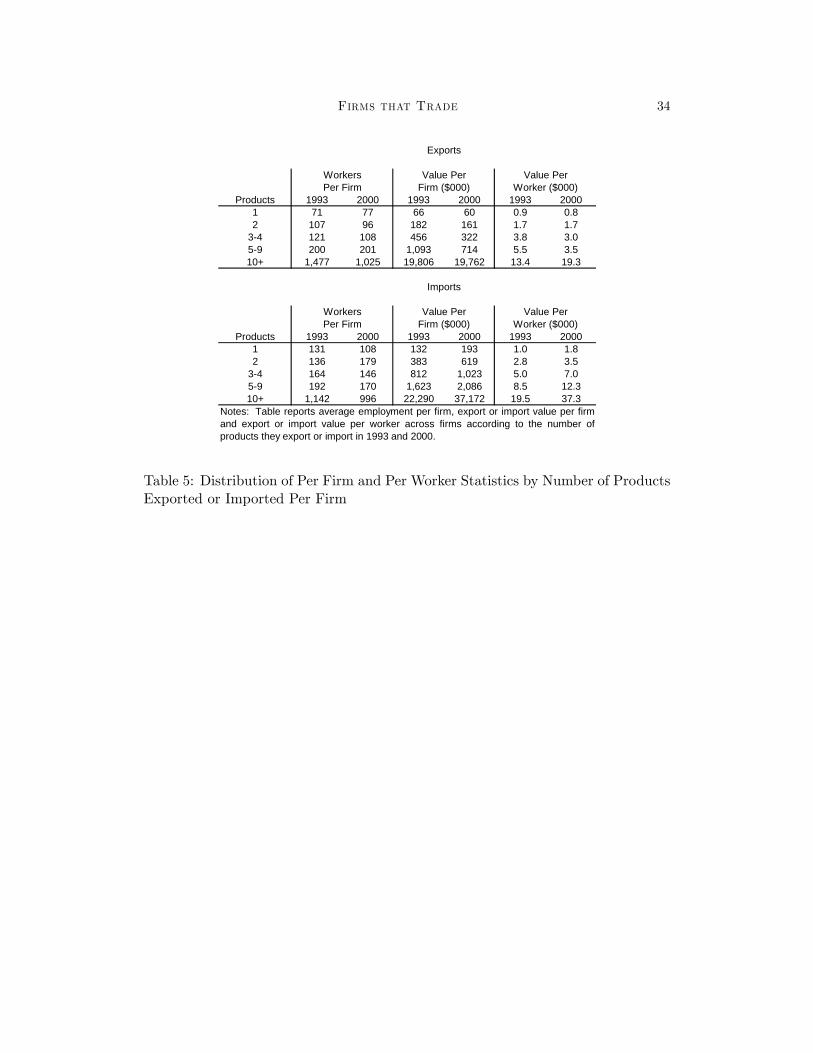
Firms that Trade 34
Products 1993 2000 1993 2000 1993 20001 71 77 66 60 0.9 0.82 107 96 182 161 1.7 1.7
3-4 121 108 456 322 3.8 3.05-9 200 201 1,093 714 5.5 3.510+ 1,477 1,025 19,806 19,762 13.4 19.3
Products 1993 2000 1993 2000 1993 20001 131 108 132 193 1.0 1.82 136 179 383 619 2.8 3.5
3-4 164 146 812 1,023 5.0 7.05-9 192 170 1,623 2,086 8.5 12.310+ 1,142 996 22,290 37,172 19.5 37.3
Exports
Imports
Notes: Table reports average employment per firm, export or import value per firmand export or import value per worker across firms according to the number ofproducts they export or import in 1993 and 2000.
Workers Value Per Value Per
Workers Value Per Value Per
Firm ($000)
Worker ($000)
Worker ($000)
Per Firm
Per Firm
Firm ($000)
Table 5: Distribution of Per Firm and Per Worker Statistics by Number of ProductsExported or Imported Per Firm
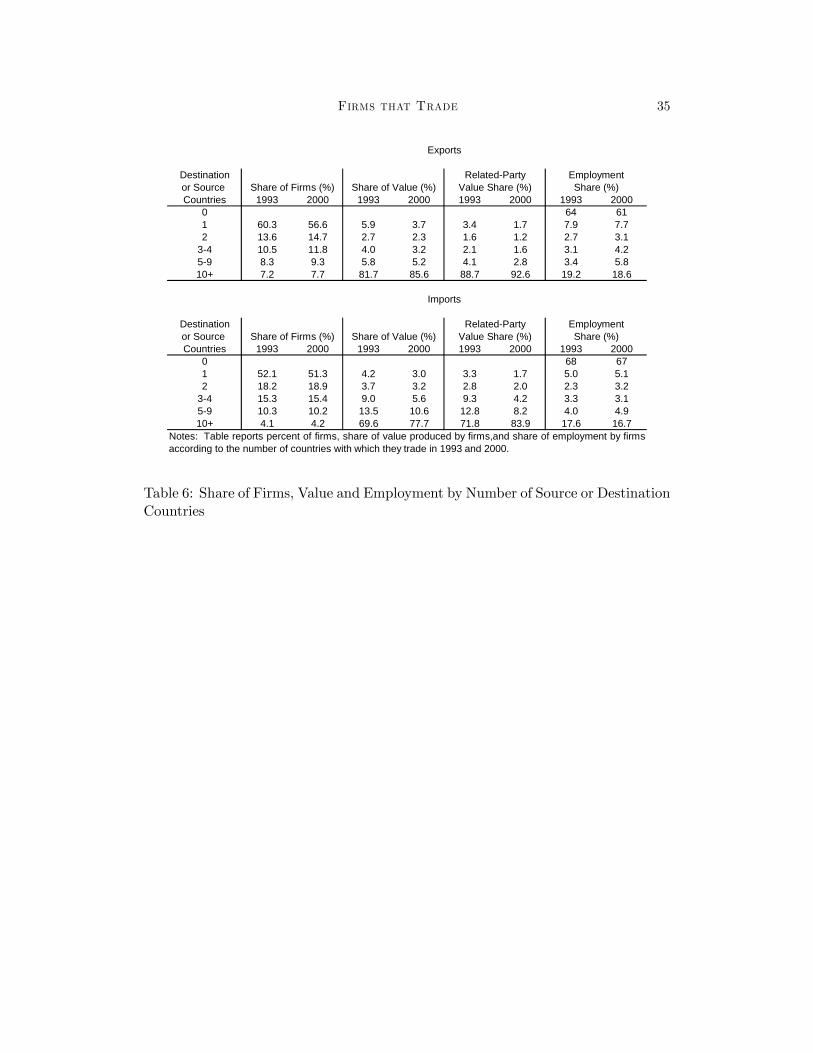
Firms that Trade 35
Destinationor SourceCountries 1993 2000 1993 2000 1993 2000 1993 2000
0 64 611 60.3 56.6 5.9 3.7 3.4 1.7 7.9 7.72 13.6 14.7 2.7 2.3 1.6 1.2 2.7 3.1
3-4 10.5 11.8 4.0 3.2 2.1 1.6 3.1 4.25-9 8.3 9.3 5.8 5.2 4.1 2.8 3.4 5.810+ 7.2 7.7 81.7 85.6 88.7 92.6 19.2 18.6
Destinationor SourceCountries 1993 2000 1993 2000 1993 2000 1993 2000
0 68 671 52.1 51.3 4.2 3.0 3.3 1.7 5.0 5.12 18.2 18.9 3.7 3.2 2.8 2.0 2.3 3.2
3-4 15.3 15.4 9.0 5.6 9.3 4.2 3.3 3.15-9 10.3 10.2 13.5 10.6 12.8 8.2 4.0 4.910+ 4.1 4.2 69.6 77.7 71.8 83.9 17.6 16.7
Exports
Imports
Related-Party Employment
Related-Party Employment
Notes: Table reports percent of firms, share of value produced by firms,and share of employment by firmsaccording to the number of countries with which they trade in 1993 and 2000.
Share of Firms (%) Share of Value (%) Value Share (%) Share (%)
Share of Firms (%) Share of Value (%) Value Share (%) Share (%)
Table 6: Share of Firms, Value and Employment by Number of Source or DestinationCountries

Firms that Trade 36
Destinationor SourceCountries 1993 2000 1993 2000 1993 2000
1 95 93 251 241 2.6 2.62 143 145 514 562 3.6 3.9
3-4 218 242 964 980 4.4 4.05-9 302 430 1,786 2,049 5.9 4.810+ 1,944 1,652 29,085 40,675 15.0 24.6
Destinationor SourceCountries 1993 2000 1993 2000 1993 2000
1 106 97 416 487 3.9 5.02 141 163 1,041 1,437 7.4 8.8
3-4 241 197 3,007 3,046 12.5 15.55-9 431 466 6,720 8,710 15.6 18.710+ 4,713 3,815 86,412 153,956 18.3 40.4
Exports
Imports
Notes: Table reports average employment per firm, export or import value per firmand export or import value per worker for firms according to the number of countrieswith which they trade in 1993 and 2000.
Workers Value Per Value Per
Workers Value Per Value PerPer Firm
Per Firm
Firm ($000)
Firm ($000)
Worker ($000)
Worker ($000)
Table 7: Distribution of Per Firm and Per Worker Statistics by Number of CountriesWith Which Firms Trade
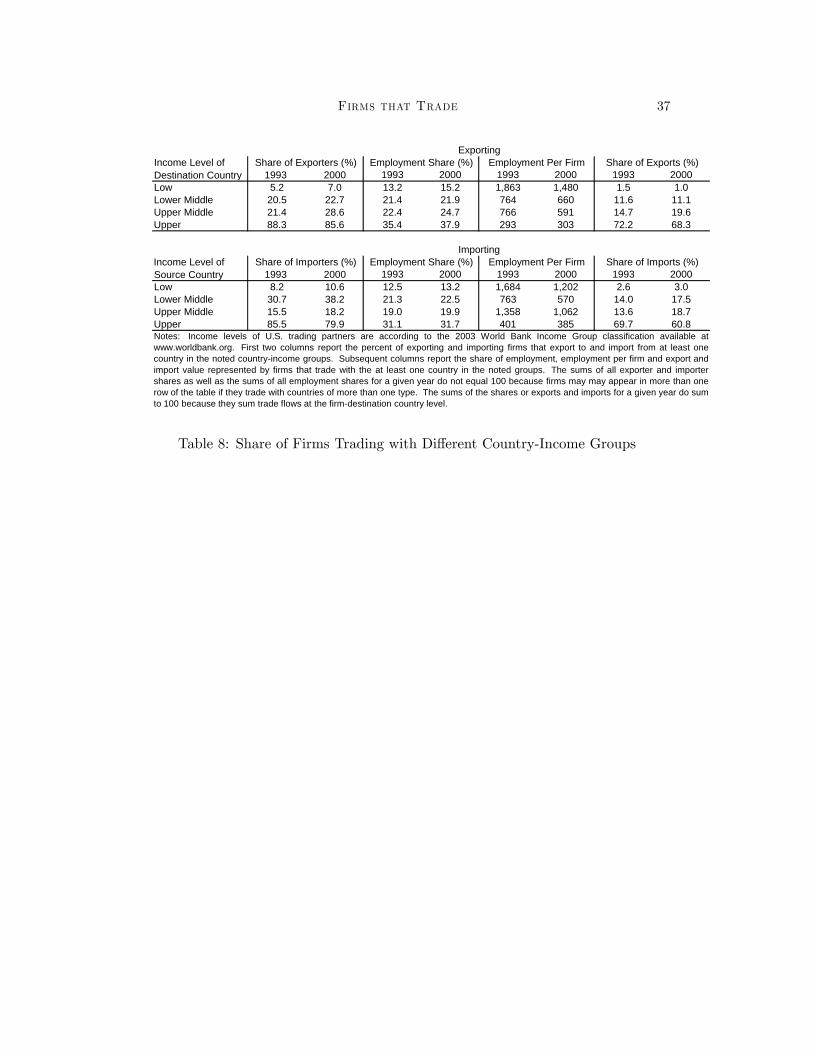
Firms that Trade 37
Income Level ofDestination Country 1993 2000 1993 2000 1993 2000 1993 2000Low 5.2 7.0 13.2 15.2 1,863 1,480 1.5 1.0Lower Middle 20.5 22.7 21.4 21.9 764 660 11.6 11.1Upper Middle 21.4 28.6 22.4 24.7 766 591 14.7 19.6Upper 88.3 85.6 35.4 37.9 293 303 72.2 68.3
Income Level ofSource Country 1993 2000 1993 2000 1993 2000 1993 2000Low 8.2 10.6 12.5 13.2 1,684 1,202 2.6 3.0Lower Middle 30.7 38.2 21.3 22.5 763 570 14.0 17.5Upper Middle 15.5 18.2 19.0 19.9 1,358 1,062 13.6 18.7Upper 85.5 79.9 31.1 31.7 401 385 69.7 60.8Notes: Income levels of U.S. trading partners are according to the 2003 World Bank Income Group classification available atwww.worldbank.org. First two columns report the percent of exporting and importing firms that export to and import from at least onecountry in the noted country-income groups. Subsequent columns report the share of employment, employment per firm and export andimport value represented by firms that trade with the at least one country in the noted groups. The sums of all exporter and importershares as well as the sums of all employment shares for a given year do not equal 100 because firms may may appear in more than onerow of the table if they trade with countries of more than one type. The sums of the shares or exports and imports for a given year do sumto 100 because they sum trade flows at the firm-destination country level.
Employment Share (%)
Employment Share (%)
Employment Per Firm
Employment Per FirmImporting
Share of Importers (%) Share of Imports (%)
ExportingShare of Exporters (%) Share of Exports (%)
Table 8: Share of Firms Trading with Di¤erent Country-Income Groups
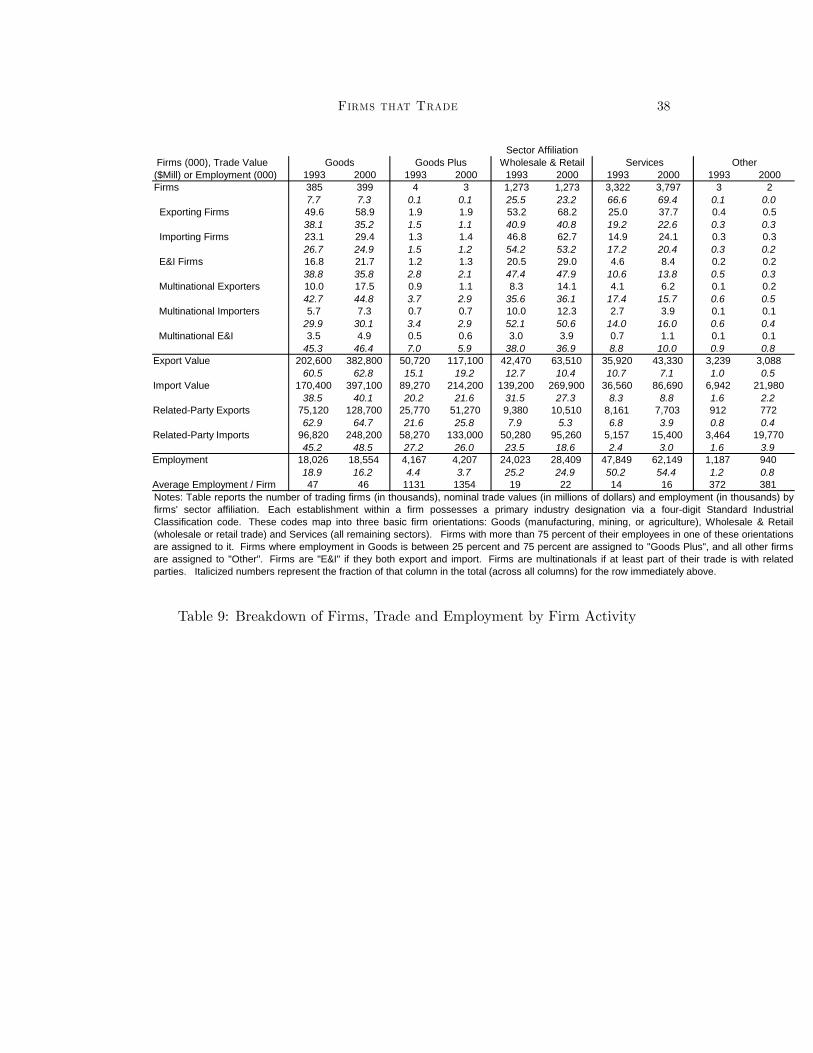
Firms that Trade 38
1993 2000 1993 2000 1993 2000 1993 2000 1993 2000Firms 385 399 4 3 1,273 1,273 3,322 3,797 3 2
7.7 7.3 0.1 0.1 25.5 23.2 66.6 69.4 0.1 0.0 Exporting Firms 49.6 58.9 1.9 1.9 53.2 68.2 25.0 37.7 0.4 0.5
38.1 35.2 1.5 1.1 40.9 40.8 19.2 22.6 0.3 0.3 Importing Firms 23.1 29.4 1.3 1.4 46.8 62.7 14.9 24.1 0.3 0.3
26.7 24.9 1.5 1.2 54.2 53.2 17.2 20.4 0.3 0.2 E&I Firms 16.8 21.7 1.2 1.3 20.5 29.0 4.6 8.4 0.2 0.2
38.8 35.8 2.8 2.1 47.4 47.9 10.6 13.8 0.5 0.3 Multinational Exporters 10.0 17.5 0.9 1.1 8.3 14.1 4.1 6.2 0.1 0.2
42.7 44.8 3.7 2.9 35.6 36.1 17.4 15.7 0.6 0.5 Multinational Importers 5.7 7.3 0.7 0.7 10.0 12.3 2.7 3.9 0.1 0.1
29.9 30.1 3.4 2.9 52.1 50.6 14.0 16.0 0.6 0.4 Multinational E&I 3.5 4.9 0.5 0.6 3.0 3.9 0.7 1.1 0.1 0.1
45.3 46.4 7.0 5.9 38.0 36.9 8.8 10.0 0.9 0.8Export Value 202,600 382,800 50,720 117,100 42,470 63,510 35,920 43,330 3,239 3,088
60.5 62.8 15.1 19.2 12.7 10.4 10.7 7.1 1.0 0.5Import Value 170,400 397,100 89,270 214,200 139,200 269,900 36,560 86,690 6,942 21,980
38.5 40.1 20.2 21.6 31.5 27.3 8.3 8.8 1.6 2.2Related-Party Exports 75,120 128,700 25,770 51,270 9,380 10,510 8,161 7,703 912 772
62.9 64.7 21.6 25.8 7.9 5.3 6.8 3.9 0.8 0.4Related-Party Imports 96,820 248,200 58,270 133,000 50,280 95,260 5,157 15,400 3,464 19,770
45.2 48.5 27.2 26.0 23.5 18.6 2.4 3.0 1.6 3.9Employment 18,026 18,554 4,167 4,207 24,023 28,409 47,849 62,149 1,187 940
18.9 16.2 4.4 3.7 25.2 24.9 50.2 54.4 1.2 0.8Average Employment / Firm 47 46 1131 1354 19 22 14 16 372 381
Goods Plus Firms (000), Trade Value($Mill) or Employment (000)
Sector AffiliationWholesale & Retail Services OtherGoods
Notes: Table reports the number of trading firms (in thousands), nominal trade values (in millions of dollars) and employment (in thousands) byfirms' sector affiliation. Each establishment within a firm possesses a primary industry designation via a four-digit Standard IndustrialClassification code. These codes map into three basic firm orientations: Goods (manufacturing, mining, or agriculture), Wholesale & Retail(wholesale or retail trade) and Services (all remaining sectors). Firms with more than 75 percent of their employees in one of these orientationsare assigned to it. Firms where employment in Goods is between 25 percent and 75 percent are assigned to "Goods Plus", and all other firmsare assigned to "Other". Firms are "E&I" if they both export and import. Firms are multinationals if at least part of their trade is with relatedparties. Italicized numbers represent the fraction of that column in the total (across all columns) for the row immediately above.
Table 9: Breakdown of Firms, Trade and Employment by Firm Activity
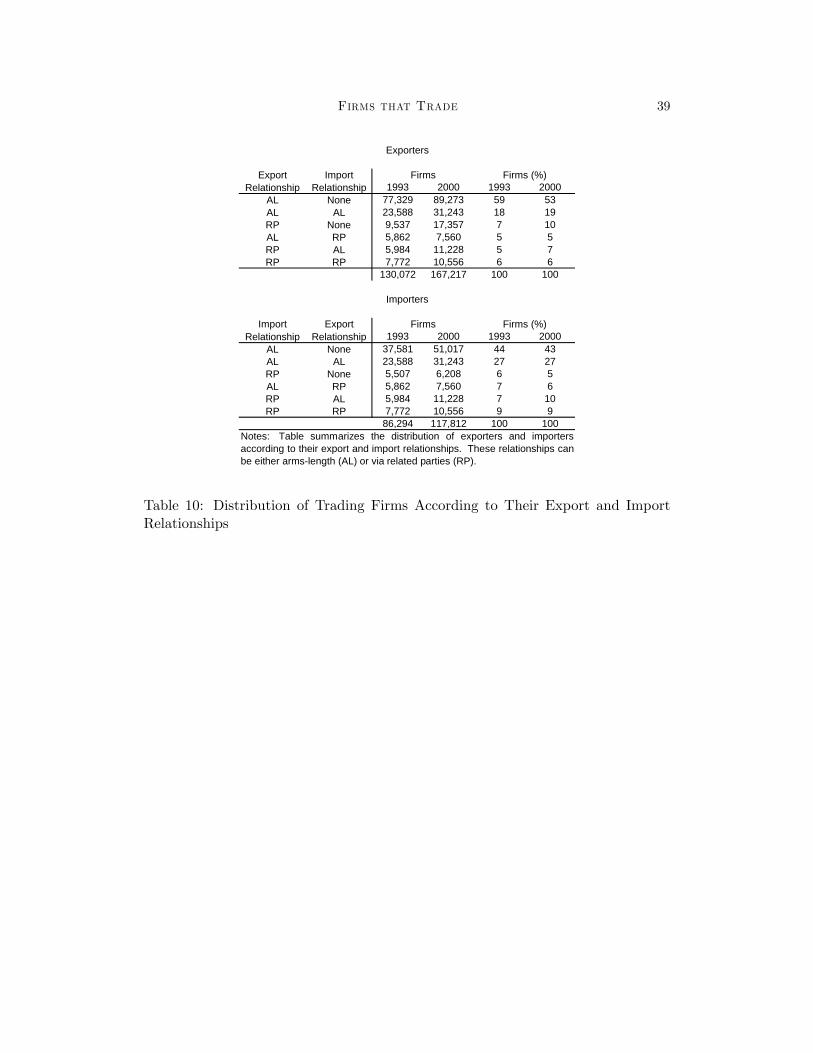
Firms that Trade 39
Export ImportRelationship Relationship 1993 2000 1993 2000
AL None 77,329 89,273 59 53AL AL 23,588 31,243 18 19RP None 9,537 17,357 7 10AL RP 5,862 7,560 5 5RP AL 5,984 11,228 5 7RP RP 7,772 10,556 6 6
130,072 167,217 100 100
Import ExportRelationship Relationship 1993 2000 1993 2000
AL None 37,581 51,017 44 43AL AL 23,588 31,243 27 27RP None 5,507 6,208 6 5AL RP 5,862 7,560 7 6RP AL 5,984 11,228 7 10RP RP 7,772 10,556 9 9
86,294 117,812 100 100Notes: Table summarizes the distribution of exporters and importersaccording to their export and import relationships. These relationships canbe either arms-length (AL) or via related parties (RP).
Firms Firms (%)
Exporters
Importers
Firms Firms (%)
Table 10: Distribution of Trading Firms According to Their Export and ImportRelationships

Firms that Trade 40
Trading PartnerIncome Level
ExportRelationship
ImportRelationship 1993 2000
ImportRelationship
ExportRelationship 1993 2000
Low AL None 3 4 AL None 7 10AL AL 5 6 AL AL 8 10RP None 7 7 RP None 8 11AL RP 4 6 AL RP 6 10RP AL 16 18 RP AL 11 13RP RP 21 26 RP RP 13 17
Lower Middle AL None 13 14 AL None 29 36AL AL 24 26 AL AL 31 38RP None 26 21 RP None 29 34AL RP 23 26 AL RP 27 37RP AL 49 47 RP AL 36 41RP RP 51 57 RP RP 40 51
Upper Middle AL None 14 20 AL None 10 12AL AL 24 30 AL AL 14 17RP None 26 28 RP None 16 16AL RP 26 33 AL RP 19 22RP AL 49 54 RP AL 23 24RP RP 57 68 RP RP 37 45
Upper AL None 87 82 AL None 80 72AL AL 88 85 AL AL 87 82RP None 88 91 RP None 86 83AL RP 90 87 AL RP 91 87RP AL 93 95 RP AL 92 90RP RP 96 96 RP RP 95 95
Notes: Table reports the distribution of trading firms according to both their export and import relationships and theincome level of their trading partners. Exporting and importing firms are allocated to one of six mutually exclusivecategories according to their export and import relationships, which can be either arms-length (AL) or related-party(RP). The first block of columns reports results for exporters and the countries to which they export while the secondblock of columns reports results for importers and the countries from which they import. The percentages reportedin columns 4, 5, 8 and 9 represent the percent of trading firms of each type that export to (columns 3 and 4) orimport from (columns 8 and 9) at least one country of the noted type. The percentages for any given export andimport relationship pair may not sum to 100 percent because firms may trade with countries of more than oneincome level.
Exporter Type Exporters (%) Importer Type Importers (%)
Table 11: Global Engagement and Trading Partner Characteristics
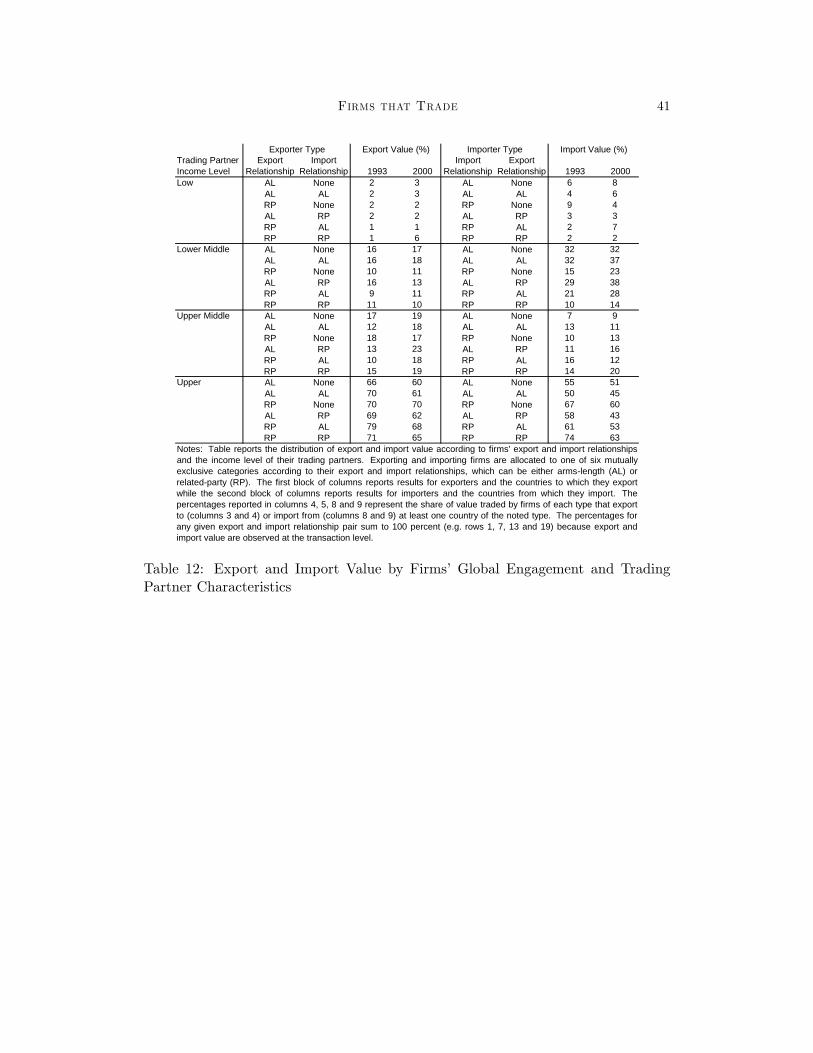
Firms that Trade 41
Trading PartnerIncome Level
ExportRelationship
ImportRelationship 1993 2000
ImportRelationship
ExportRelationship 1993 2000
Low AL None 2 3 AL None 6 8AL AL 2 3 AL AL 4 6RP None 2 2 RP None 9 4AL RP 2 2 AL RP 3 3RP AL 1 1 RP AL 2 7RP RP 1 6 RP RP 2 2
Lower Middle AL None 16 17 AL None 32 32AL AL 16 18 AL AL 32 37RP None 10 11 RP None 15 23AL RP 16 13 AL RP 29 38RP AL 9 11 RP AL 21 28RP RP 11 10 RP RP 10 14
Upper Middle AL None 17 19 AL None 7 9AL AL 12 18 AL AL 13 11RP None 18 17 RP None 10 13AL RP 13 23 AL RP 11 16RP AL 10 18 RP AL 16 12RP RP 15 19 RP RP 14 20
Upper AL None 66 60 AL None 55 51AL AL 70 61 AL AL 50 45RP None 70 70 RP None 67 60AL RP 69 62 AL RP 58 43RP AL 79 68 RP AL 61 53RP RP 71 65 RP RP 74 63
Exporter Type Export Value (%) Importer Type
Notes: Table reports the distribution of export and import value according to firms' export and import relationshipsand the income level of their trading partners. Exporting and importing firms are allocated to one of six mutuallyexclusive categories according to their export and import relationships, which can be either arms-length (AL) orrelated-party (RP). The first block of columns reports results for exporters and the countries to which they exportwhile the second block of columns reports results for importers and the countries from which they import. Thepercentages reported in columns 4, 5, 8 and 9 represent the share of value traded by firms of each type that exportto (columns 3 and 4) or import from (columns 8 and 9) at least one country of the noted type. The percentages forany given export and import relationship pair sum to 100 percent (e.g. rows 1, 7, 13 and 19) because export andimport value are observed at the transaction level.
Import Value (%)
Table 12: Export and Import Value by Firms�Global Engagement and TradingPartner Characteristics
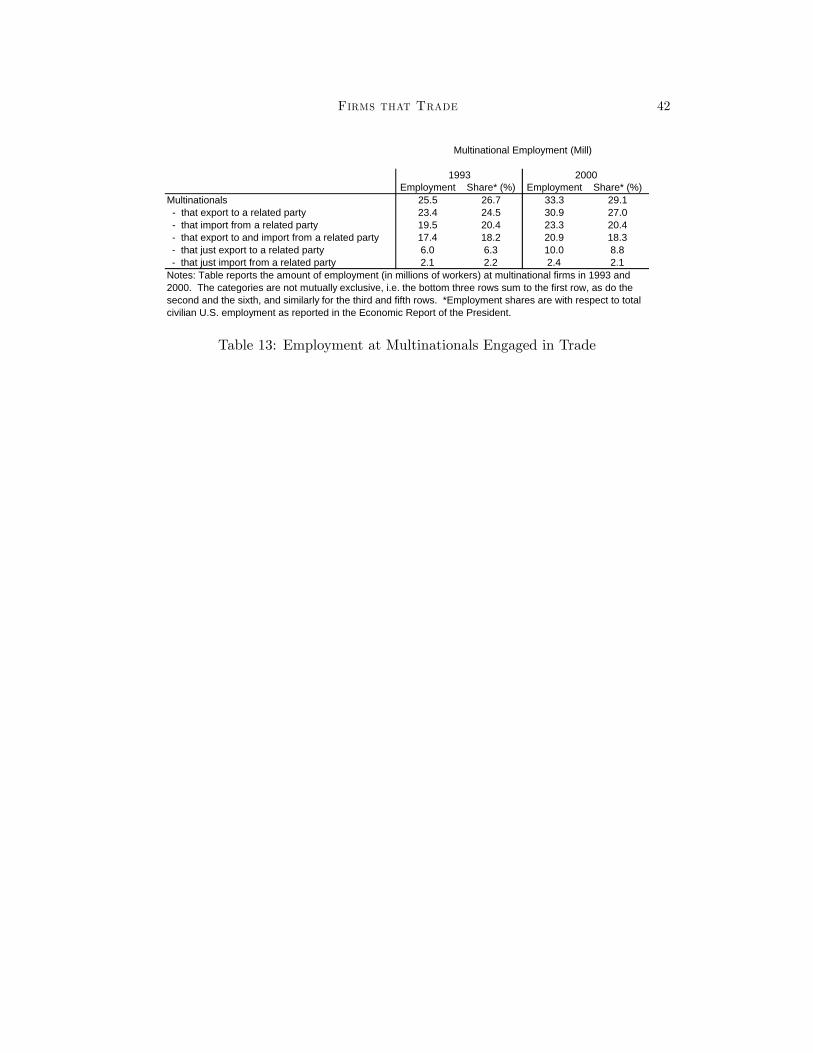
Firms that Trade 42
Employment Share* (%) Employment Share* (%)Multinationals 25.5 26.7 33.3 29.1 - that export to a related party 23.4 24.5 30.9 27.0 - that import from a related party 19.5 20.4 23.3 20.4 - that export to and import from a related party 17.4 18.2 20.9 18.3 - that just export to a related party 6.0 6.3 10.0 8.8 - that just import from a related party 2.1 2.2 2.4 2.1
Multinational Employment (Mill)
1993 2000
Notes: Table reports the amount of employment (in millions of workers) at multinational firms in 1993 and2000. The categories are not mutually exclusive, i.e. the bottom three rows sum to the first row, as do thesecond and the sixth, and similarly for the third and fifth rows. *Employment shares are with respect to totalcivilian U.S. employment as reported in the Economic Report of the President.
Table 13: Employment at Multinationals Engaged in Trade
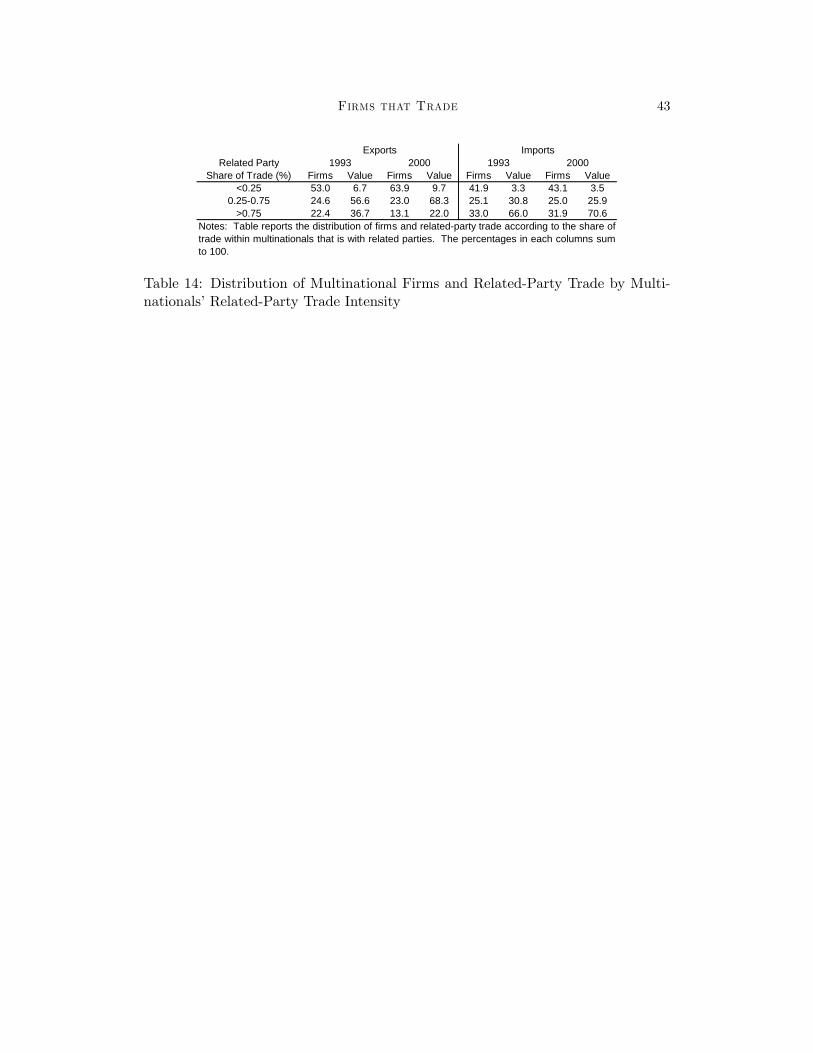
Firms that Trade 43
Related PartyShare of Trade (%) Firms Value Firms Value Firms Value Firms Value
<0.25 53.0 6.7 63.9 9.7 41.9 3.3 43.1 3.50.25-0.75 24.6 56.6 23.0 68.3 25.1 30.8 25.0 25.9
>0.75 22.4 36.7 13.1 22.0 33.0 66.0 31.9 70.6Notes: Table reports the distribution of firms and related-party trade according to the share oftrade within multinationals that is with related parties. The percentages in each columns sumto 100.
Exports Imports1993 2000 1993 2000
Table 14: Distribution of Multinational Firms and Related-Party Trade by Multi-nationals�Related-Party Trade Intensity

Firms that Trade 44
1993 2000 1993 2000 1993 2000 1993 2000 1993 2000Firms 3,523 4,901 541 626 682 1,057 2,955 3,891 71 81
45.3 46.4 7.0 5.9 8.8 10.0 38.0 36.9 0.9 0.8Export Value 173 341 42 114 13 18 17 26 2 2
69.9 68.0 17.1 22.7 5.3 3.6 6.9 5.2 0.9 0.4Import Value 155 366 82 209 20 46 73 149 6 21
46.1 46.2 24.4 26.4 6.0 5.8 21.6 18.8 1.9 2.7Related-Party Exports 72 125 20 51 4 5 6 7 1 1
70.0 66.1 19.4 26.9 3.8 2.7 6.1 3.8 0.8 0.4Related-Party Imports 95 244 56 133 4 11 41 79 3 20
47.7 50.2 28.1 27.3 1.9 2.3 20.6 16.2 1.7 4.0Employment 8,018 8,510 3,131 3,334 2,349 4,682 3,232 3,974 625 373
46.2 40.8 18.0 16.0 13.5 22.4 18.6 19.0 3.6 1.8
Sector Affiliation
Other
Notes: Table breaks out the number of firms, trading value and employment of the most globally engaged (MGE) firms according to theirsector affiliation. Each establishment within a firm possesses a primary industry designation via a four-digit Standard IndustrialClassification code. These codes map into three basic firm orientations: Goods (manufacturing, mining, or agriculture), Wholesale &Retail (wholesale or retail trade) and Services (all remaining sectors). Firms with more than 75 percent of their employees in one of theseorientations are assigned to it. Firms where employment in Goods is between 25 percent and 75 percent are assigned to "Goods Plus",and all other firms are assigned to "Other".
Goods Goods Plus Wholesale & Retail Services
Table 15: A Breakdown of The Most Globally Engaged Firms by Activity
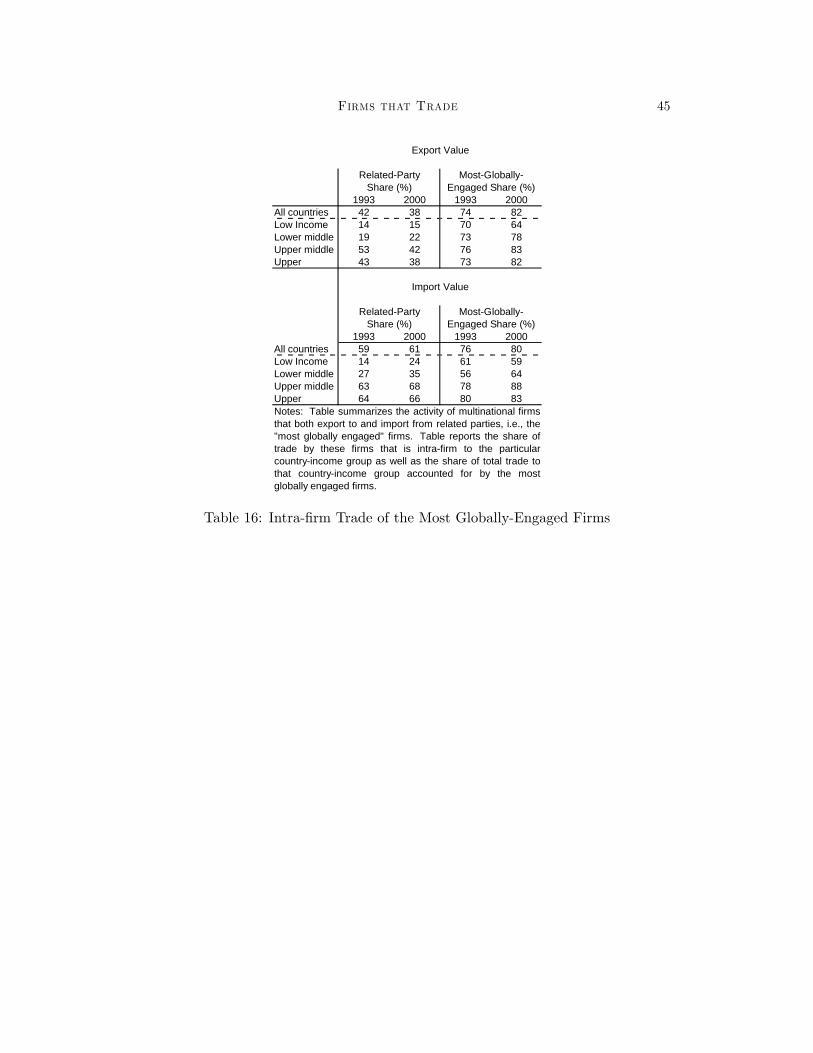
Firms that Trade 45
1993 2000 1993 2000All countries 42 38 74 82Low Income 14 15 70 64Lower middle 19 22 73 78Upper middle 53 42 76 83Upper 43 38 73 82
1993 2000 1993 2000All countries 59 61 76 80Low Income 14 24 61 59Lower middle 27 35 56 64Upper middle 63 68 78 88Upper 64 66 80 83
Share (%) Engaged Share (%)
Share (%) Engaged Share (%)
Import Value
Related-Party Most-Globally-
Notes: Table summarizes the activity of multinational firmsthat both export to and import from related parties, i.e., the"most globally engaged" firms. Table reports the share oftrade by these firms that is intra-firm to the particularcountry-income group as well as the share of total trade tothat country-income group accounted for by the mostglobally engaged firms.
Export Value
Related-Party Most-Globally-
Table 16: Intra-�rm Trade of the Most Globally-Engaged Firms
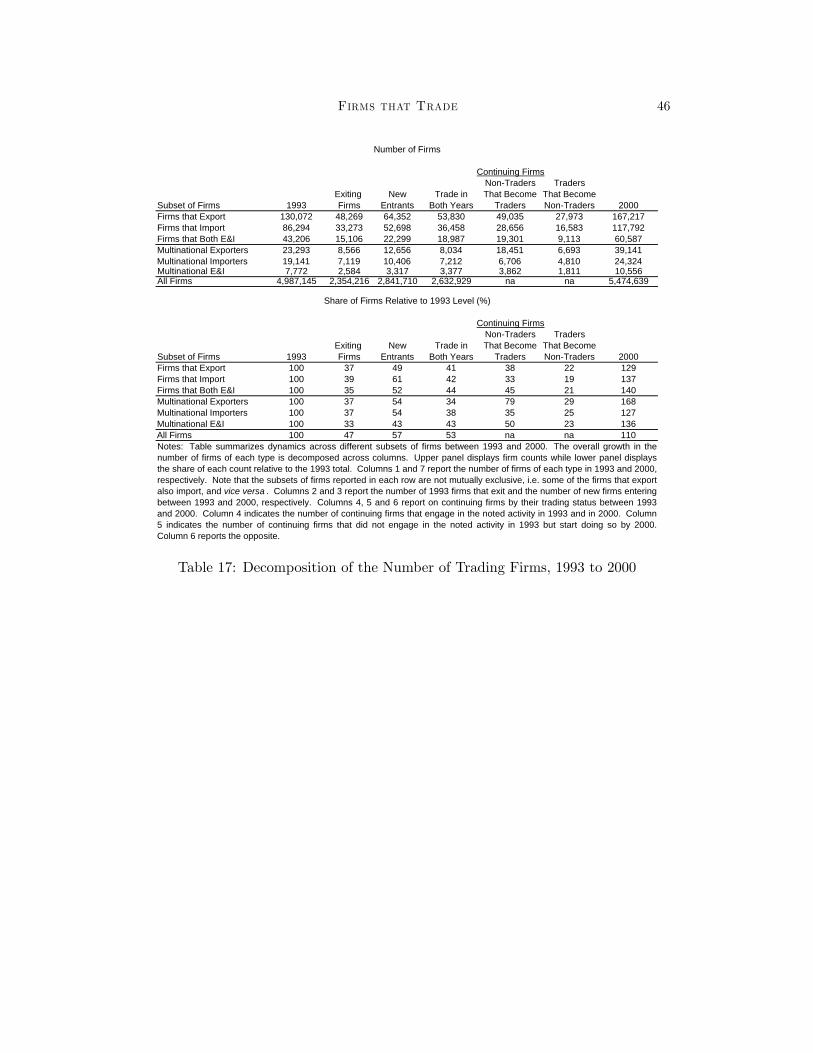
Firms that Trade 46
Non-Traders TradersExiting New Trade in That Become That Become
Subset of Firms 1993 Firms Entrants Both Years Traders Non-Traders 2000Firms that Export 130,072 48,269 64,352 53,830 49,035 27,973 167,217Firms that Import 86,294 33,273 52,698 36,458 28,656 16,583 117,792Firms that Both E&I 43,206 15,106 22,299 18,987 19,301 9,113 60,587Multinational Exporters 23,293 8,566 12,656 8,034 18,451 6,693 39,141Multinational Importers 19,141 7,119 10,406 7,212 6,706 4,810 24,324Multinational E&I 7,772 2,584 3,317 3,377 3,862 1,811 10,556All Firms 4,987,145 2,354,216 2,841,710 2,632,929 na na 5,474,639
Non-Traders TradersExiting New Trade in That Become That Become
Subset of Firms 1993 Firms Entrants Both Years Traders Non-Traders 2000Firms that Export 100 37 49 41 38 22 129Firms that Import 100 39 61 42 33 19 137Firms that Both E&I 100 35 52 44 45 21 140Multinational Exporters 100 37 54 34 79 29 168Multinational Importers 100 37 54 38 35 25 127Multinational E&I 100 33 43 43 50 23 136All Firms 100 47 57 53 na na 110Notes: Table summarizes dynamics across different subsets of firms between 1993 and 2000. The overall growth in thenumber of firms of each type is decomposed across columns. Upper panel displays firm counts while lower panel displaysthe share of each count relative to the 1993 total. Columns 1 and 7 report the number of firms of each type in 1993 and 2000,respectively. Note that the subsets of firms reported in each row are not mutually exclusive, i.e. some of the firms that exportalso import, and vice versa . Columns 2 and 3 report the number of 1993 firms that exit and the number of new firms enteringbetween 1993 and 2000, respectively. Columns 4, 5 and 6 report on continuing firms by their trading status between 1993and 2000. Column 4 indicates the number of continuing firms that engage in the noted activity in 1993 and in 2000. Column5 indicates the number of continuing firms that did not engage in the noted activity in 1993 but start doing so by 2000.Column 6 reports the opposite.
Number of Firms
Share of Firms Relative to 1993 Level (%)
Continuing Firms
Continuing Firms
Table 17: Decomposition of the Number of Trading Firms, 1993 to 2000
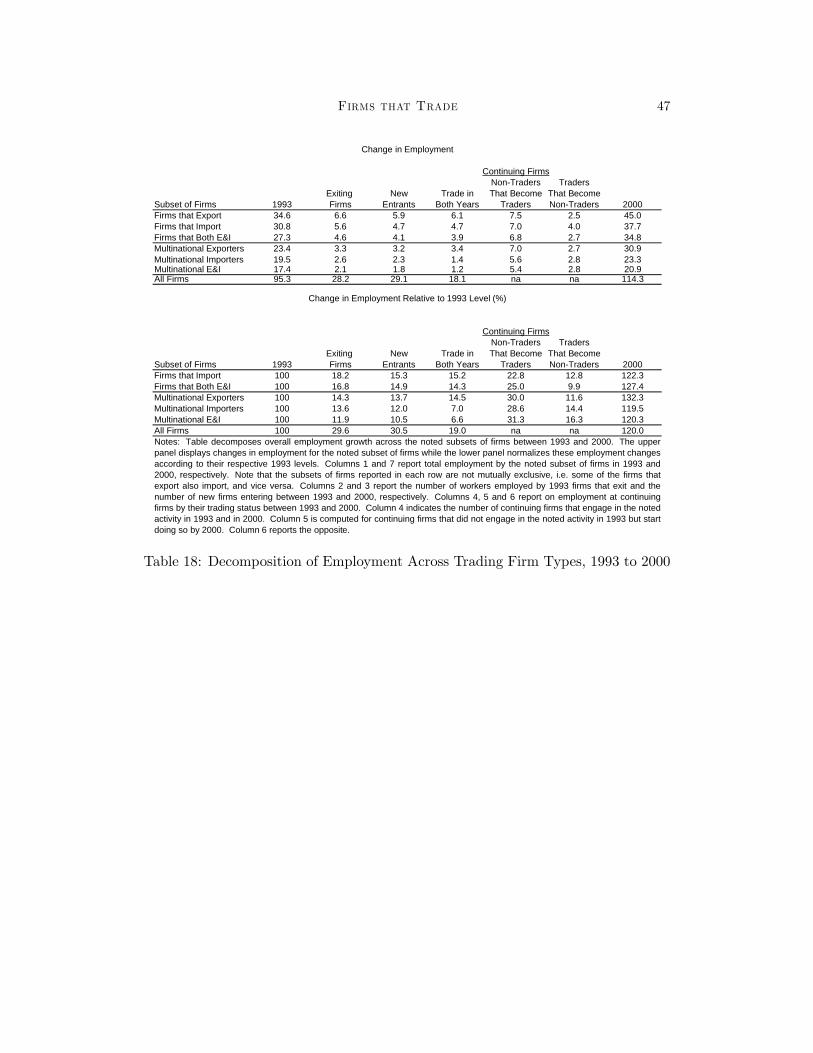
Firms that Trade 47
Non-Traders TradersExiting New Trade in That Become That Become
Subset of Firms 1993 Firms Entrants Both Years Traders Non-Traders 2000Firms that Export 34.6 6.6 5.9 6.1 7.5 2.5 45.0Firms that Import 30.8 5.6 4.7 4.7 7.0 4.0 37.7Firms that Both E&I 27.3 4.6 4.1 3.9 6.8 2.7 34.8Multinational Exporters 23.4 3.3 3.2 3.4 7.0 2.7 30.9Multinational Importers 19.5 2.6 2.3 1.4 5.6 2.8 23.3Multinational E&I 17.4 2.1 1.8 1.2 5.4 2.8 20.9All Firms 95.3 28.2 29.1 18.1 na na 114.3
Non-Traders TradersExiting New Trade in That Become That Become
Subset of Firms 1993 Firms Entrants Both Years Traders Non-Traders 2000Firms that Import 100 18.2 15.3 15.2 22.8 12.8 122.3Firms that Both E&I 100 16.8 14.9 14.3 25.0 9.9 127.4Multinational Exporters 100 14.3 13.7 14.5 30.0 11.6 132.3Multinational Importers 100 13.6 12.0 7.0 28.6 14.4 119.5Multinational E&I 100 11.9 10.5 6.6 31.3 16.3 120.3All Firms 100 29.6 30.5 19.0 na na 120.0
Change in Employment
Change in Employment Relative to 1993 Level (%)
Notes: Table decomposes overall employment growth across the noted subsets of firms between 1993 and 2000. The upperpanel displays changes in employment for the noted subset of firms while the lower panel normalizes these employment changesaccording to their respective 1993 levels. Columns 1 and 7 report total employment by the noted subset of firms in 1993 and2000, respectively. Note that the subsets of firms reported in each row are not mutually exclusive, i.e. some of the firms thatexport also import, and vice versa. Columns 2 and 3 report the number of workers employed by 1993 firms that exit and thenumber of new firms entering between 1993 and 2000, respectively. Columns 4, 5 and 6 report on employment at continuingfirms by their trading status between 1993 and 2000. Column 4 indicates the number of continuing firms that engage in the notedactivity in 1993 and in 2000. Column 5 is computed for continuing firms that did not engage in the noted activity in 1993 but startdoing so by 2000. Column 6 reports the opposite.
Continuing Firms
Continuing Firms
Table 18: Decomposition of Employment Across Trading Firm Types, 1993 to 2000

Firms that Trade 48
Transition Type 1993 2000 Change % ChangeNot Exporting to Exporting 3.9 7.5 3.6 94.3Not Importing to Importing 3.6 7.0 3.4 93.9Not E&I to E&I 3.3 6.8 3.5 108.3Exporting to Not Exporting 2.5 2.2 -0.3 -12.3Importing to Not Importing 4.0 3.3 -0.7 -16.6E&I to Not E&I 2.7 2.4 -0.3 -10.1Continuing Exporters 25.5 31.6 6.1 24.0Continuing Importers 21.3 25.9 4.7 22.0Continuing E&I 20.0 23.9 3.9 19.5Continuing Non-Exporters 35.3 43.9 8.6 24.5Continuing Non-Importers 38.2 48.9 10.7 27.9Continuing Non-E&I 41.1 52.0 10.9 26.6
Employment (Mill)
Notes: Table reports the employment level of surviving firms that continue trading or switch tobeing traders of the noted type from being non-traders, and vice versa , between 1993 and 2000.E&I refers to firms that both import and export.
Table 19: Employment Growth by Firms�Trading Status, 1993 to 2000
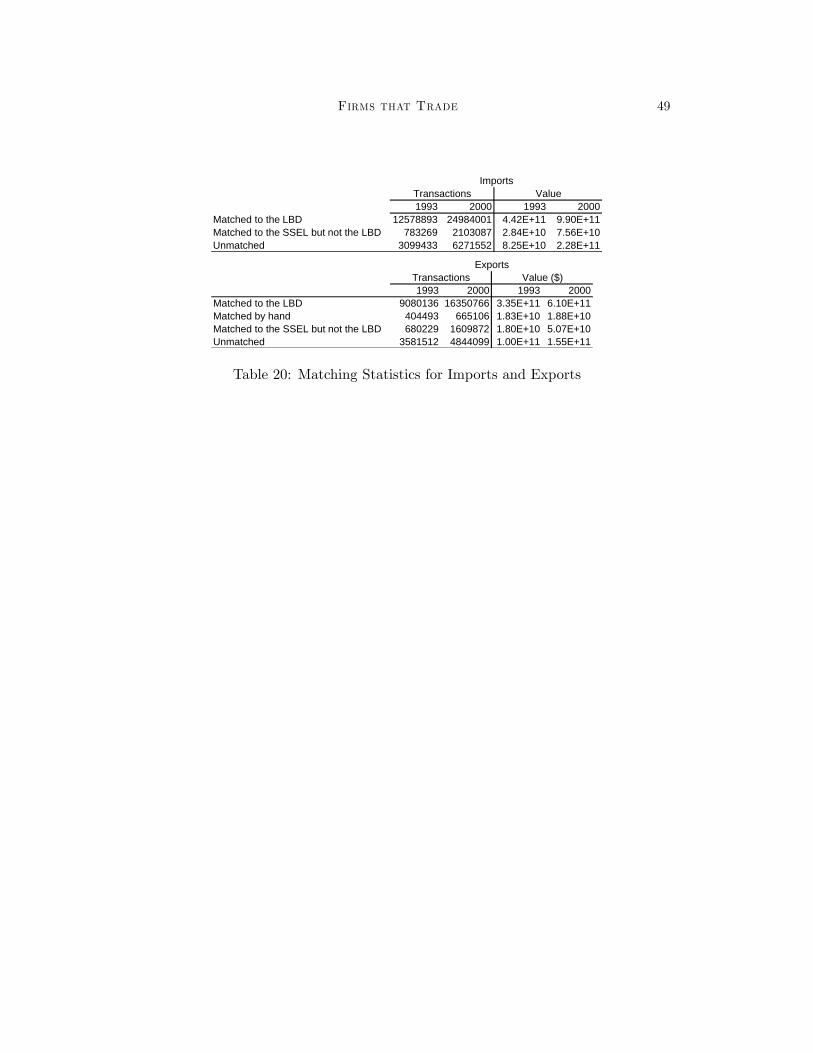
Firms that Trade 49
1993 2000 1993 2000Matched to the LBD 12578893 24984001 4.42E+11 9.90E+11Matched to the SSEL but not the LBD 783269 2103087 2.84E+10 7.56E+10Unmatched 3099433 6271552 8.25E+10 2.28E+11
ValueTransactionsImports
1993 2000 1993 2000Matched to the LBD 9080136 16350766 3.35E+11 6.10E+11Matched by hand 404493 665106 1.83E+10 1.88E+10Matched to the SSEL but not the LBD 680229 1609872 1.80E+10 5.07E+10Unmatched 3581512 4844099 1.00E+11 1.55E+11
ExportsTransactions Value ($)
Table 20: Matching Statistics for Imports and Exports
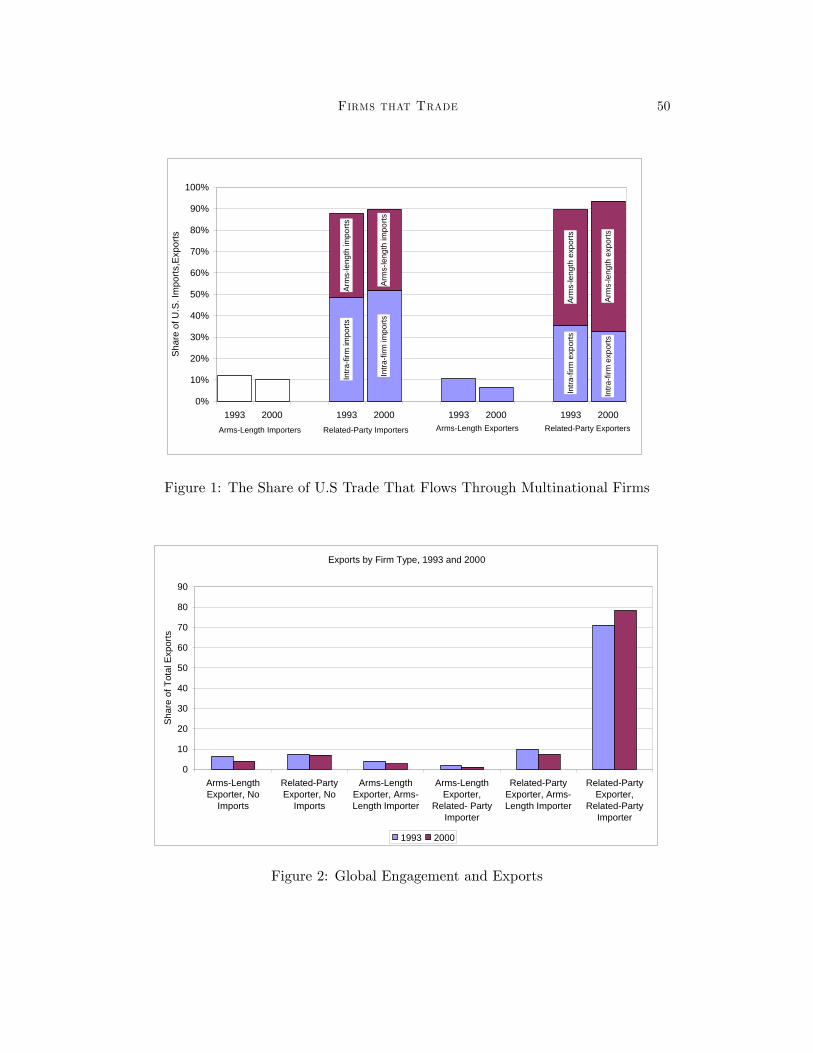
Firms that Trade 50
Intra
-firm
exp
orts
Intra
-firm
exp
orts
Intra
-firm
impo
rts
Intra
-firm
impo
rts
Arm
s-le
ngth
exp
orts
Arm
s-le
ngth
exp
orts
Arm
s-le
ngth
impo
rts
Arm
s-le
ngth
impo
rts
0%
10%
20%
30%
40%
50%
60%
70%
80%
90%
100%
1993 2000 1993 2000 1993 2000 1993 2000
Sha
re o
f U.S
. Im
ports
,Exp
orts
Arms-Length Importers Related-Party Importers Arms-Length Exporters Related-Party Exporters
Figure 1: The Share of U.S Trade That Flows Through Multinational Firms
Exports by Firm Type, 1993 and 2000
0
10
20
30
40
50
60
70
80
90
Arms-LengthExporter, No
Imports
Related-PartyExporter, No
Imports
Arms-LengthExporter, Arms-Length Importer
Arms-LengthExporter,
Related- PartyImporter
Related-PartyExporter, Arms-Length Importer
Related-PartyExporter,
Related-PartyImporter
Sha
re o
f Tot
al E
xpor
ts
1993 2000
Figure 2: Global Engagement and Exports

Firms that Trade 51
Imports by Firm Type, 1993 and 2000
0
10
20
30
40
50
60
70
80
90
Arms-LengthImporter, No
Exports
Related-PartyImporter, No
Exports
Arms-LengthExporter, Arms-Length Importer
Arms-LengthExporter,
Related- PartyImporter
Related-PartyExporter, Arms-Length Importer
Related-PartyExporter,
Related-PartyImporter
Shar
e of
Tot
al Im
port
s
1993 2000
Figure 3: Global Engagement and Imports


