
i .
I I
I I I
' .
I I
I· I
\ I
I I I· I I
I
Economic Internet Toolkit for African Policy Makers
An Africa Internet Forum, UNECA and infoDev Project
102656P
ublic
Dis
clos
ure
Aut
horiz
edP
ublic
Dis
clos
ure
Aut
horiz
edP
ublic
Dis
clos
ure
Aut
horiz
edP
ublic
Dis
clos
ure
Aut
horiz
ed

The Economic Internet Toolkit for African Policy Makers was produced for the Africa Internet Forum under the direction of Robert Schware, Senior Informatics Specialist in the Telecommunications and Informatics Division of the World Bank. The models, data and accompanying text were created by Charles Kenny; Anil Srivastava and Anat Bernstein contributed to the section on examples of Internet use on the continent; and Sham pa Banerjee edited and prepared the document for publication. Our special thanks and appreciation for major contributions made to the policy and global Internet sections go to Robert Hawkins. We are very grateful for the help of Lane Smith (USAID), Inta Brikovskis (NAS), Lee McKnight (MIT), Michael Jensen (UNIDO), Michel Menou (CABECA), Nancy Hafkin (UNECA), John Mack (U.S. Department of State) and Raymond Akwule (George Mason University). The project was funded by the World Bank's infoDev program (ID 950920-10): infoDev is a grant-making program designed to encourage reform and investment for. improving access to information technology in developingcountries.
The toolkit will be available on infoDev' s website, part of the World Bank website (www.worldbank.org) ..
The findings, interpretations, and conclusions expressed in the Toolkit are those of the authors and should not be attributed in any manner to the member organizations of the Africa Internet Forum or to the World Bank, its affiliated organizations, members of its Board of Executive Directors, or the countries they represent.

Foreword
Liberalization of the telecommunications sector is progressing across Africa. One of the most important benefits of this trend is that it will make value-added services, particularly Internet access, more affordable and reliable for telecommunications users in the continent. '
The Internet need not be a useful tool only for industrial societies. The poor in many African countries, struggling to meet basic needs, often remain poor not only- because they are denied access to physical and human capital, but also because they lack the information necessary to best convert that capital into wealth. By opening wide the door to a huge store of global knowledge, the Internet offers untapped possibilities to address the blight of information poverty. This Toolkit is inspired by the African experience where access to the World Wide Web is helping doctors to save patients, schools to educate children, and communities to create businesses that will lift them out of destitution.
Today there is growing exposure to the Internet in Africa. Over the last three years, the number of Internet host sites, excluding the developed market of South Africa, has risen twenty-fold. However, there are still many hurdles to a comprehensive coverage of African nations. Issues that require urgent deliberation include pricing structures, mo- · nopoly controls and licensing charges. Often these are a result of state policies restricted by a short-term view of the economy and its future, or by concerns over the immediate effect of the Internet on telephone company revenues.
This Toolkit closely examines these issues. It finds that, in the long term, the Internet cannot be looked upon as a threat to telecommunications companies. It is true that it is one of a range of technological advances that are forcing changes i:ri. the operation of telecommunications systems, but it also presents opportunities for new sources of revenues and new ways to meet the demands of society. The Internet has become a tool for development, with its ability to facilitate the delivery of social services, disaster mitigation, and poverty relief. The Toolkit also finds that the move toward liberalization is likely to have a beneficial effect on Internet roll out, just as it has on basic service provision.
The Toolkit is part of a collaborative effort on expanding Internet access in Africa that began in 1995 with the creation of the Africa Internet Forum (AIF). This is a group of donors, users and other interested organizations including the UNDP, UNITAR, USAID, CIDA, NASA, the Carnegie Corporation and the African Networking Initiative - which itself includes groups such as the IDRC, ITU, ECA and UNESCO. The Toolkit is intended to be used in policy dialogues and country assessments, broadly to facilitate the involvement of the private sector in Internet provision, and specifically to help policy makers shape their attitudes toward this exciting and expanding sector of the telecommunications business.
James Bond Director, Energy, Mining and Telecommunications Department
The World Bank

I I
- ~------------
Contents
1 Introdudion and Executive Summary / 1
2 Global Telecommunications, Emergence of the Internet, and Africa / 9
3 The Internet In Africa / 18
4 Policy Issues I 30
BIBLIOGRAPHY I 39
ANNEXES
1 Results of the Model for Costs and Revenues from Communications I 42
2 Calculation of Telecommunications Revenue Lost to Substitution Using FCC Data / 59
3 The Relationship Between Communications Liberalization and Internet Price and Penetration I 60
4 The Importance of Accounting Rates to African Telecommunications Companies / 68
5 Potential Internet Penetration in Africa/ 70
6 The Internet Cost-Benefit Model / 77

1 Introduction and Executive Summary
As the old telecommunications regime crumbles around the world and a new one emerges, Africa has an unprecedented opportunity to vastly improve its information technology and communication infrastructure. African nations, however, must act quickly to gain access and contribute to the world's knowledge base, communicate with global neighbors, and fully participate in the development of a global information society. The Internet represents a technology that encapsulates much of the promise of this information revolution. This toolkit aims to assist African policy and decision makers to better understand how the Internet is different, its costs and benefits, and policy issues that surround this new technology.
Despite the low level of telecommunications development in the African continent, the Internet has expanded relatively rapidly over the past few years. Private, nonprofit, and public sector Internet service providers have sprung up to help exploit the opportunities presented by this new technology. At the time this report was written, 42 of the 54 nations in Africa had live public access to the Internet in the capital city, while eight had countrywide local dial-up access. These were Burkina Faso, Malawi, Mali, Mauritius, Morocco, Senegal, Chad, and Zimbabwe (Jensen, 1998). Competition (where allowed) can be fierce, and the price for "all you can eat" web access dropped below US$30 I month for some countries in the region. In Mozambique, one of the least developed nations of the continent, it is
Definition: email Electronically transmitted messages sent via the Internet. Email allows a
user to compose messages and transmit them in a matter of seconds to one
or more recipients anywhere in the world over the Internet.
Definition: World Wide Web (WWW) A global hypertext system that uses the
Internet as its transport mechanism. Created in 1989 at the CERN research institute in Switz/er/and, the Web relies
on hypertext transfer protocol, an Internet standard that specifies how an
application can locate and acquire resources and information stored on
another computer on the Internet.
Definition: Host site Any computer that can function as the beginning and end point of data trans
fers. An Internet host has a unique Internet address and a unique domain
name,such as worldbank.org.
possible to make a telephone Figure 1.1 African Internet Host Sites
call over the Internet today. Largely because of the efforts of private operators, the number of host sites in African countries has increased from 290 in five countries in 1995 to 6,510 in 32 countries in 1998 (see Annex 3). These figures exclude South Africa, which alone has 129,000 sites.
However, the Internet has been growing so rapidly worldwide (at a rate of 12
140000
120000
100000
80000
60000
40000
20000
1995
-+-Africa Total
------- Africa minus SA
1996 1997 1998
1

Economic Toolkit for African Policy Makers
Definiffon:Bandwidth A networks carrying capacity. The rate at which information can move between computers. Bandwidth is measured in bits of data per second
2
percent a month), that Africa's share of host sites has been falling over the last year. Africa's share of Internet host sites worldwide was a mere 0.025 percent in 1997, and fell to 0.022 percent by the beginning of 1998. Excluding South Africa, the entire continent with its population of well over 650 million has about as many Internet sites as Croatia with its population of five million.Twenty-two countries across the world, with populations of over one million, have no Internet host sites at all. Of these, 16 are African: Zaire, Chad, Somalia, Sierra Leone, Sudan, Rwanda, Malawi, Mauritania, Mali, Lesotho, Guinea, Gambia, Eritrea, Congo, the Central African Republic, and Burundi. In fact, outside South Africa, only one out of every 5000 Africans have access to the Internet.
Infrastructure and development
Further growth of the Internet in Africa is closely tied to the quality and availability of telecommunications infrastructure in this vast continent. A major component in this process is the liberalization of the sector and private sector investment. In subSaharan Africa, change is already underway; 25 countries have begun reform programs in telecommunications. However, how much these reforms will immediately impact the growth of the Internet is yet to be gauged.
The Internet places large demands on infrastructure with its requirements of high quality and high speed connections. Service providers need cheap and reliable access to international communications lines to link with the web, as well as equally reliable local access for their customers. This need for high bandwidth infrastructure creates serious pressures on the less developed telecommunications networks of the world. This is certainly true of most African nations, which have only two percent of the world's telephones to offer to 12 percent of the world's population.
While there are very advanced networks in some African countries like Rwanda and Botswana, others, like Madagascar and Uganda have unreliable analog systems. The proportion of digital lines on the continent is 56 percent as compared to a global low income average of 90 percent. Advanced technologies such as ISDN, mobile telephony and leased lines are still not fully developed in most African countries. Despite this, Africa has a great opportunity to leapfrog such constraints by using cheaper technology such as wireless local loop, low earth orbiting satellites, and the ability to send data over the electricity grid.
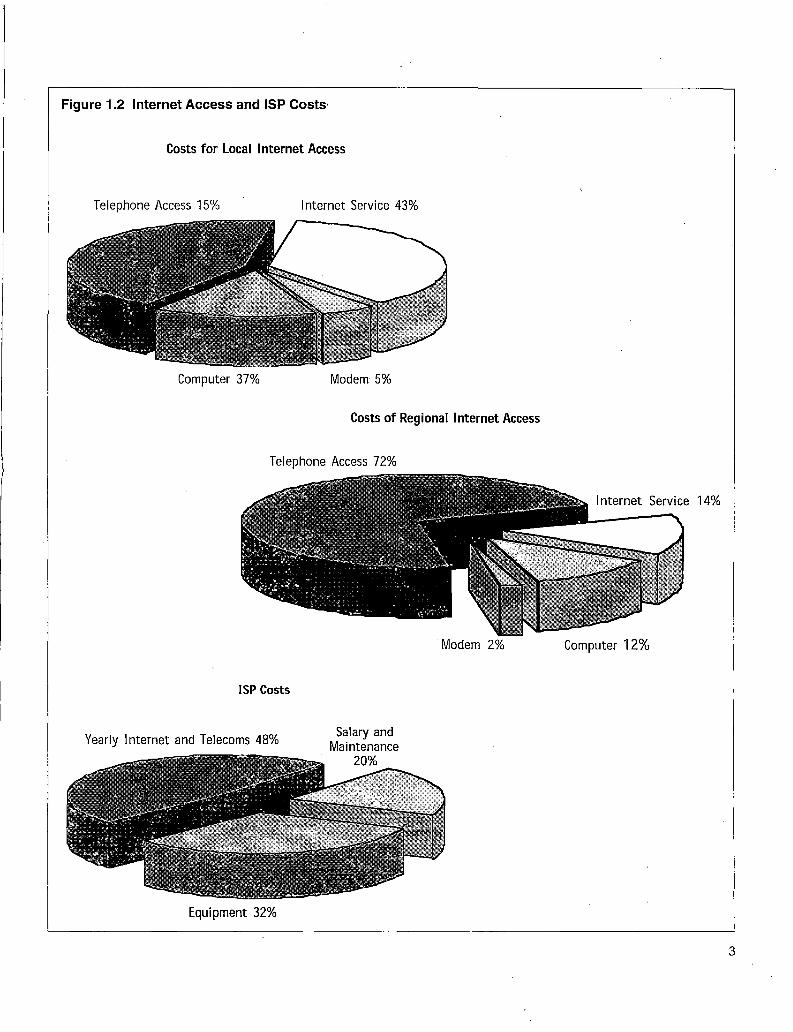
Figure 1.2 Internet Access and ISP Costs·
Costs for Local Internet Access
Telephone Access 15% Internet Service 43%
Computer 37% Modem 5%
Costs of Regional Internet Access
Telephone Access 72%
Modem 2% Computer 12%
ISP Costs
Yearly Internet and Telecoms 48%
Equipment 32%
3

Economic Toolkit for African Policy Makers
4
Table 1.1 Lost Profits to International Email Substitution
Cost structure and development
Country
South Africa Zimbabwe Mozambique Ghana
Lost profit/yr Telecom US$m (high) Revenue/yr
US$m
31.9 1.2 0.4 0.6
36747.0 146 .. 2
62.6 65.0
Lost profit as % of revenue
0.87 0.80 0.65 0.89
Another, no less serious, challenge to the development of the Internet in Africa is the existing cost structure for access to the network. At the moment telephone charges represent an insignificant cost for those who have local access to an ISP used only for electronic mail. For any user accessing the World Wide Web, and for email users accessing the Internet from outside a local dialling area, telephone charges become very significant.
For instance, the percentage of costs for local Internet access that go toward telephone charges and ISP charges is 58 percent of the total user cost. For a user who accesses an ISP from outside a local calling area, telephone and ISP charges skyrocket to 86 percent of total user cost (see Figure 1.2). Furthermore, Internet Service Providers (ISPs) pay a large percentage of their costs for connectivity: 48 percent of ISP costs are accounted for by Internet backbone connection and international leased line costs.
While the Internet is threatened by inefficient telecommunications infrastructure, unreformed African telecommunication companies in turn feel threatened by the impact that the Internet might have on their revenue stream.
In fact, while the Internet is likely to divert traffic from high
Figure 1.3 Comparison of Forces on PTT Revenue revenue-generating international voice communications and adversely affect the profits of African telephone companies over the short term, the relative impact of the Internet on revenue is not significant. In markets that have not yet seen any reform, and where there is greater dependence on overpriced international call charges, the Internet is likely to be utilized to bypass these costs. Estimates of the resulting losses are presented in Table 1.1, based on a low-level use of about one email in and out a day. However, the Internet is only one of a number of forces that will have an impact on telecommunications companies in the region. There are many others,such as international pressures on regulating accounting rates charges, and the growing presence of callback technology. Even South Africa Zimbabwe Mozambique Ghana Ethiopia
a Lost profit as % of revenue El US settlement as % of revenue
countries with advanced Internet provision are probably experiencing only

I 1 \
I
about one percent of revenue reduction directly resulting from email substitution. U.S. accounting rates settlement payments to African countries are significantly larger - 2.4 percent of Mozambique's revenues, for instance, or 14.3 percent of Ghana's (see Annex 4 and Figure 1.3). Furthermore, while in the longer term, Internet telephony probably represents the larger Internet-based threat to telecommunications company revenue, at the moment the level of capacity in most African countries is insufficient to support this technology.
To be genuinely competitive in the global marketplace, African telecommunications companies need to rapidly integrate the changes that are reshaping telecommunications across the world, and transforming it into a commodity business. By embracing Internet technology and expanding the number of users who can access the network, these companies have a considerable amount more to gain in the long run. At the same time, the growth of the Internet offers new opportunities for businesses and communities on the continent.
The Internet is good business
Models presented in this toolkit suggest that expansion of the Internet in Africa cah provide opportunities for significant reduction in the communications cost of a wide range of African telecommunications users. These savings would come almost exclusively from international calls. There are two reasons for this conclusion. First, at the moment, 80 to 90 percent of email are sent to and received from outside of the continent. Second, international calls from and to the continent attract revenues far in excess of the costs of completing the call.
Ironically, given the pressures on rate rebalancing which are unconnected with the Internet, it is likely that emailing will become relatively less attractive as a substitute for voice or fax as international call costs drop and local call costs increase. At the moment, however, Internet access is a profitable investment, purely from the point of view of direct savings on communications for companies that do a lot of international business. Talking to the United Kingdom for about an hour each business day over the period of a year would cost a Mozambican businessman approximately US$38,250. Faxing that same information would cost US$7,650. All of the yearly costs of a regional Internet connection - a computer, a modem, and Internet access - used for international email alone as a substitute for fax traffic, would together amount to US$1,328. The yearly savings over fax use would thus be US$6,322.
"Internet access is more essential for Africa than for any other region,"
argues Ernest Wilson, Director of the Center for International
Development and Conflict Management at the University of
Maryland, ''because of the deterioration of African libraries and
universities which lack current journals, periodicals and books. Internet access could help keep
scholars and students connected with current developments in their
field"
5
Economic Toolkit for African Policy Makers
6
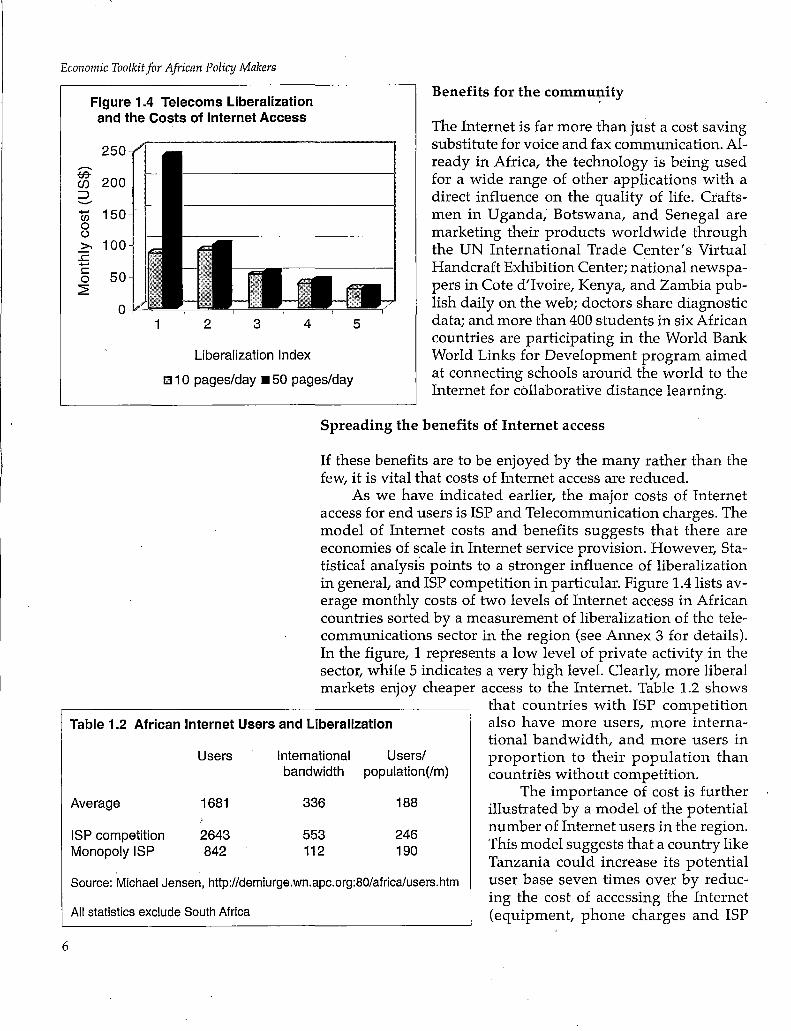
Figure 1.4 Telecoms Liberalization and the Costs of Internet Access
Benefits for the commu1i1ity
The Internet is far more than just a cost saving substitute for voice and fax communication. Already in Africa, the technology is being used for a wide range of other applications with a direct influence on the quality of life. Craftsmen in Uganda, Botswana, and Senegal are marketing their products worldwide through the UN International Trade Center's Virtual Handcraft Exhibition Center; national newspapers in Cote d'Ivoire, Kenya, and Zambia publish daily on the web; doctors share diagnostic data; and more than 400 students in six African countries are participating in the World Bank World Links for Development program aimed at connecting schools around the world to the Internet for collaborative distance learning.
250
y;; 200 CJ)
:::> ..._, ....... 150 Ul 0 (,)
>. 100 .c ....... c
50 0 2
0 1 2 3 4 5
Liberalization Index
r:i 1 o pages/day • 50 pages/day
Spreading the benefits of Internet access
If these benefits are to be enjoyed by the many rather than the few, it is vital that costs of Internet access are reduced.
As we have indicated earlier, the major costs of Internet access for end users is ISP and Telecommunication charges. The model of Internet costs and benefits suggests that there are economies of scale in Internet service provision. However, Statistical analysis points to a stronger influence of liberalization in general, and ISP competition in particular. Figure 1.4 lists average monthly costs of two levels of Internet access in African countries sorted by a measurement of liberalization of the telecommunications sector in the region (see Annex 3 for details). In the figure, 1 represents a low level of private activity in the sector, while 5 indicates a very high level. Clearly, more liberal markets enjoy cheaper access to the Internet. Table 1.2 shows
Table 1.2 African Internet Users and Liberalization that countries with ISP competition also have more users, more international bandwidth, and more users in proportion to their population than countries without competition.
Average
ISP competition Monopoly ISP
Users
1681
2643 842
International bandwidth
336
553 112
Users/ population(/m)
188
246 190
Source: Michael Jensen, http://demiurge.wn.apc.org:BO/africa/users.htm
All statistics exclude South Africa
The importance of cost is further illustrated by a model of the potential number of Internet users in the region. This model suggests that a country like Tanzania could increase its potential user base seven times over by reducing the cost of accessing the Internet (equipment, phone charges and ISP

costs) to South African levels. This increase, however, depends on these sites being accessible to a paying public. While the private sector will likely compete for users in the urban areas, there will be an increased role for government to insure access to those users in rural areas. Unless Internet sites proliferate in community centers, libraries, schools, and telecenters, access will be restricted to a small urban elite.
While financial considerations are clearly central, results from a survey of Internet usage in Africa point to other important factors in spreading the technology to a larger number of people. First, usage was severely restricted by a lack of knowledge and adequate training. Further, even those with the skill to access the technology were discouraged by the paucity of relevant content and the unreliability of the network connections.
Policy conclusions
The Internet is likely to continue to revolutionize the means in which people communicate and access information. Because the Internet represents such a- powerful new communication tool, the environment in which it operates must be regulated differently from traditional information and communication media. The toolkit stresses three general principles: the importance of not trying to fit the Internet into existing regulatory structures, the power of competition on Internet growth, and the necessity of allowing the Internet to flourish without the burden of unnecessary regulation.
The models and data presented in the toolkit suggest a number of policy conclusions. To expand access and use of the Internet in Africa, it is necessary to provide the following:
• Low cost and reliable access to international band-width.
• Low cost and reliable local bandwidth connectivity. • Countrywide reliable local cost access to ISPs. • Low cost access to network equipment. • Widespread public access to networked computers. • An educated and trained user and provider base .
. • Support for the development of national and African Internet content.
The policies that may help to meet these needs are: • Liberalization of the telecommunications network. • Liberalization of Internet service provision. • Lowering of tariffs on computer and telecommuni
cations equipment. • General tariff rebalancing with possible support for
local cost ISP access. • Support for community access to the Internet. • Support for training in the use of the Internet.
7

Economic Toolkit for African Policy Makers
8
• Support for local content development. • An Africa-wide backbone.
The Internet represents a new opportunity for increased knowledge and information for development. In the long term, it will significantly alter the structure of telecommunications. In the short term, the main policy conclusions from this toolkit are not very different from those of studies that concentrate on telecommunications in general. The Internet is heavily dependent on an efficient telecommunications sector, which is usually market-based. The Internet is itself another pressure acting toward the market option of further competition and liberalization. However, while the market forces will expand access to a section of the population, there will still remain a role for government to reach the poorest.

2 Global Telecommunications, Emergence of the Internet, and Africa
Not long ago, there were less than 200 telephone companies in the world. Now there are perhaps 5,000 companies, and soon there might be 100,000. Technological advances across the world are making it difficult for monopolies to survive. This changing environment is having diverse effects on the international telecommunications system - not least on the costs and prices of international phone calls (see box).
International calls account for a large percentage of African post and telecommunications (PTT) profits, and these profits have been artificially maintained by agreements between governments and the big national telephone companies. Changing technology and global policy reforms are now threatening this arrangement, most visibly though the combined pressures of accounting rates reform and call back services. This is only the beginning, for there are other factors waiting to transform the old telecommunications paradigm.
Technological advances have also ushered in changes in the economics of local supply (see box). Wireless local loop technology, for example, eliminates the need to run cables to every home, by operating a short-distance wireless link that greatly
Pfrss~fes:o~ftntir~ati&"J~i.calz·P~i;;~ .<:' , '• ,
'1:1,titomati.s~HYi':'a · fo.. ., .~line afW8f:~tes ... · the1~~Xce
}.;i .. a ·countryfs tar: 01ft,t:.8~1i~e.~itl1tJg 9}flt&es · ·
.. •coJ~~,i~~ii~W~;~<;~~J~~,f~~i}\:~~~i~i:~1U!~~::. ;;·•·: · fiica'rJ>ptrs; · ·· Vallle<f at $1 ,p· l:S;tlHOn::tn 19J:i6t
in.dusfr. ·that. · ,be~ii M~J?J11'\g~'.~t~;J:~iz.~·eaci1, ;.:.: :~~, <, 'i~.···iJ~JY ,
>Y(V; ,~; ;·:y,, ;- '. ;;,;:=~~;~ ;.;-·, ,,
9

Economic Toolkit for African Policy Makers
Table 2.1 Telecommunications Liberalization in Sub-Saharan Africa, Late 1997
Liberal Separate Independent New Sector Private Tel co Competition Equipment Posts and Regulator Law Cellular Privatized in Basic
Trade Telecoms Service
.Angola x x n.a. Benin x Botswana x x x 97 98 Burkina Faso x 98 Burundi x x 97 x Cameroon x x 97 Cape Verde x x x x CAR x x Chad x 97 Comoros x x Congo-Brazzaville x x 97 x x 97 Congo-Kinshasa x x Cote d'Ivoire x x x x x x 2004 Djibouti x n.a. Equ. Guinea n.a. n.a. Eritrea x n.a. Ethiopia x x x Gabon x 98 97 98 98 Gambia x x x Ghana x x x x x x x Guinea x x x x x Guinea Bissau x x x x Kenya x 97 97 97 97 98 Lesotho x x x Liberia n.a. x n.a. Madagascar x x x x Malawi x x Mali x x x n.a. Mauritania x Mauritius x x x x x Mayotte Mozambique x x x Namibia x x x x Niger n.a. n.a. n.a. n.a. n.a. n.a. n.a. Nigeria x x x Rwanda x x S. T & Principe x x n.a. x Senegal x x x x 98 97 Seychelles x x x n.a. x x x Sierra Leone x x n.a. Somalia n.a. n.a. n.a. n.a. n.a. n.a. n.a. South Africa x x x x x 2002 Sudan x x x x x Swaziland x Tanzania x x x x x 98 Partial Togo x x 97 97 98 99 98 Uganda x 97 97 97 x 97 97 Zambia x x x x Zimbabwe x X = reforms already carried out. Numbers =years reforms start.
10

·;The~i:J;rei:lint/~'~kY bf¢8m"vi«~fr:qti. ',C .. ::.·
Rik'~Joptics, fii~'~;;in,trod~c~:~lfJ;~~e . s/ ~~ie~·:;g;~~'- :?nd ailow for:s~~~;;~:~~i~es sue . . ca11~~1lb,:and effi-'ejcrfosi'On in,,!l;r,e ca,.pa~ify, OJ ba~9.~t9..th£8f tran~mission ·. ciency gains through "intelligent networking". §Y§tems1,AJilj~r tRJnnert1lfl!;l hi.ih\atj··pajJ.qm:(:arty 1llany Wireless has become even more affordable through thousand~e~·teik!?P:~we cort:\?etsations/s'&'~l{~f.':!he:co~tp~r. the introduetion oJ ne"?",techfaologi~s for using the radio ·
· \TOice'brcuif:,pe<:;oine~·.in.fiJ]itesimal. A milJtt.t~bn aJta~s,~ spectrum, induding Time Division Muttiple Access:··. ·aHai1tic cap~~ l.f~d 40Y~.~!~ ago cost a hefty US$2A4; bl.\!i.<!(TDMA) fln_i:L ~.ode. Division Multipl~ Ac;c,ess (CDMA).>•;
~sm~A~~~~7:~1i~~~~1~~s~~i~~[~e[i~~~~i~wr~~~1~~,.· that the basic. Ccisfof •a internationaL:link:iS,.n · · ·· ·vial. ;,/: · · "1.ms sucli ~s iD.tegrated circ · · and infriia ...... · zatiotL These cables .. can now.be·cormect .. · itch-········ . . ·, pute.r~'p~c?Ine'faster,,t 1 •. ,. ;ceof~~&1V~DJeveLdf ..
. .• fogc61-T1EBn~~tstha~,~·?st. a';fi:~,fJ.t\i'· . •,e:2WA)!ns power ~~,~-rease~;;~.0·; esame. <ira1nahc ·:~~e: .·
reduces the cost of connection. Such changes suggest that parts of Africa might soon see local competition. In fact, in countries that have opened up the telecommunications sector to a second· network operator (SNO), the new entrant has frequently instituted wireless technology as the solution. Unfortunately, there are many countries in Africa where liberalization attempts are not keeping pace with technological change, as Table 2.1 amply illustrates.
While the global telecommunications sector has already undergone significant changes, the technology of the Internet is likely to add to both the rate and the scale of change. The Internet is doubling in size each year. While Africa remains the least connected continent on the globe (see Tables 2.2 and 2.3), it is still likely to be affected by changes in global communications systems brought about by the new technology - especially if African nations embrace and encourage Internet development.
The Internet and the global telecommmunications revolution
Encouraged by its nonproprietary nature, established firms such as ATT and British Telecom have all embraced the TCP /IP protocol of the Internet and are constructing their own networks around it. As more individuals connect to the Internet and more services are created for it, the demand for capacity increases. As more capacity becomes available, more innovative services are created and more individuals connect to the Internet. This feature of increasing returns to scale is one characteristic of the Internet that has fostered its incredible growth and led to analysts predicting a massive increase in demand for telecommunications network capacity to support it.
Indeed, companies across the world are scrambling to meet this demand for capacity. A U.S. company, Qwest, is building a new U.S. network with a top capacity of 2 terabits (2 trillion bits) per second - sufficient to transmit the entire contents of
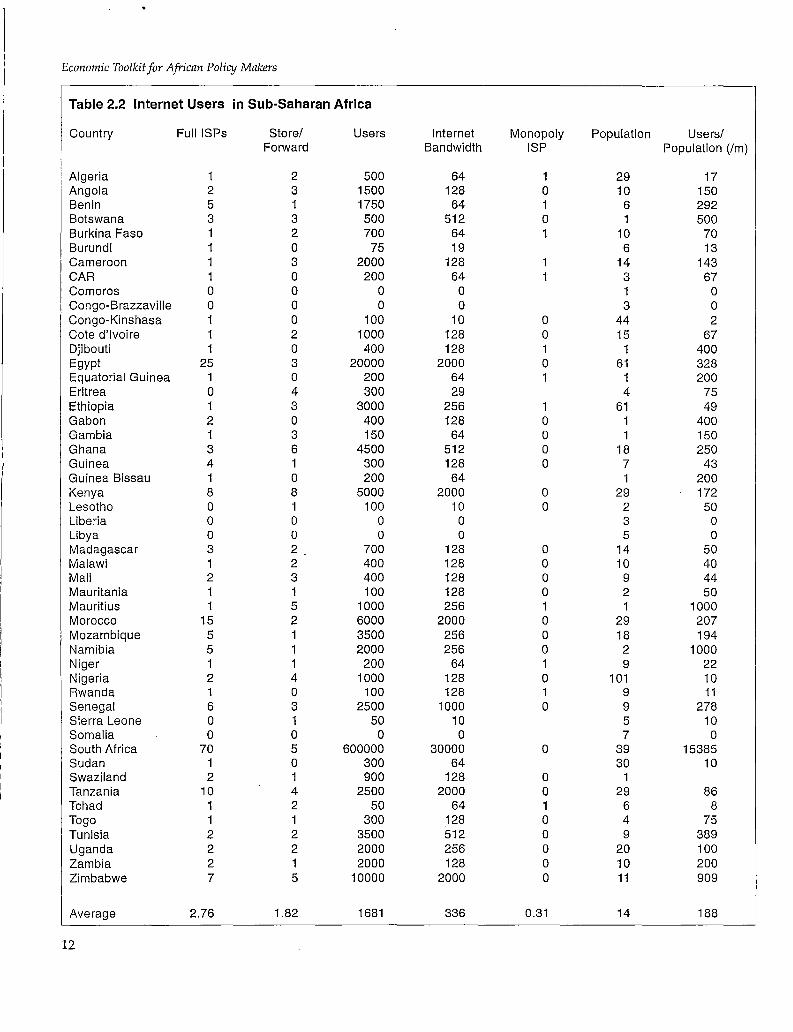
The Status of the Internet in Africa Table 2.2 (from Jensen, 1998) lays out
the number of full Internet service providers, the number of store and
forward email providers, the number of users, the size of the international connection(s) devoted to Internet
service provision in kilobits per second, the status of monopoly ISPs (1 = monopoly Internet provision, O =
competition), country population, and number of users per million people in
the country.
Definition: TCP/IP Transmission Control Protocol and the
Internet Protocol together form the language that transports messages (in
the form of packets) across multiple networks on their way to a final
destination.
11
Economic Toolkit for African Policy Makers
Table 2.2 Internet Users in Sub-Saharan Africa
Country Full ISPs Store/ Users Internet Monopoly Population Users/ Forward Bandwidth ISP Population (Im)
Algeria 1 2 500 64 1 29 17 Angola 2 3 1500 128 0 10 150 Benin 5 1 1750 64 1 6 292 Botswana 3 3 500 512 0 1 500 Burkina Faso 1 2 700 64 1 10 70 Burundi 1 0 75 19 6 13 Cameroon 1 3 2000 128 1 14 143 CAR 1 0 200 64 1 3 67 Comoros 0 0 0 0 1 0 Congo-Brazzaville 0 0 0 0 3 0 Congo-Kinshasa 1 0 100 10 0 44 2 Cote d'Ivoire 1 2 1000 128 0 15 67 Djibouti 1 0 400 128 1 1 400 Egypt 25 3 20000 2000 0 61 328 Equatorial Guinea 1 0 200 64 1 1 200 Eritrea 0 4 300 29 4 75 Ethiopia 1 3 3000 256 1 61 49 Gabon 2 0 400 128 0 1 400 Gambia 1 3 150 64 0 1 150 Ghana 3 6 4500 512 0 18 250 Guinea 4 1 300 128 0 7 43 Guinea Bissau 1 0 200 64 1 200 Kenya 8 8 5000 2000 0 29 172 Lesotho 0 1 100 10 0 2 50 Liberia 0 0 0 0 3 0 Libya 0 0 0 0 5 0 Madagascar 3 2 700 128 0 14 50 Malawi 1 2 400 128 0 10 40 Mali 2 3 400 128 0 9 44 Mauritania 1 1 100 128 0 2 50 Mauritius 1 5 1000 256 1 1 1000 Morocco 15 2 6000 2000 0 29 207 Mozambique 5 1 3500 256 0 18 194 Namibia 5 1 2000 256 0 2 1000 Niger 1 1 200 64 1 9 22 Nigeria 2 4 1000 128 0 101 10 Rwanda 1 0 100 128 1 9 11 Senegal 6 3 2500 1000 0 9 278 Sierra Leone 0 1 50 10 5 10 Somalia 0 0 0 0 7 0 South Africa 70 5 600000 30000 0 39 15385 Sudan 1 0 300 64 30 10 Swaziland 2 1 900 128 0 1 Tanzania 10 4 2500 2000 0 29 86 Tchad 1 2 50 64 1 6 8 Togo 1 1 300 128 0 4 75 Tunisia 2 2 3500 512 0 9 389 Uganda 2 2 2000 256 0 20 100 Zambia 2 1 2000 128 0 10 200 Zimbabwe 7 5 10000 2000 0 11 909
Average 2.76 1.82 1681 336 0.31 14 188
12

Table 2.3 African Internet Host Sites
1998 1997 1996 1995
Africa total 128,535 103,307 49,406 27,330 Africa total minus S. Africa 6,510 4,023 1,129 290
World total 29,669,611 16,146,360 9,472,224 4,851,843
Africa - SA % of World 0.022 0.025 0.012
Source: Calculated from Network Wizards, http//www.nw.com Includes North Africa
the Library of Congress across the U.S. in 20 seconds. The pipeline of future projects is equally impressive. Table 2.4 below provides an overview of projects planned or underway, that will directly affect the African region.
The explosion of international bandwidth shows no signs of slowing down. In 1994, George Gilder predicted in his "Gilders Law" (Gilder, 1993) that the capacity of communications systems, the global bandwidth, will triple every 18 months. This increase represents just one force that will continue to drive down the price of communications.
Technological changes that shape telecommunications
This expansion of Internet traffic is partially driven by underlying technological changes that threaten to further alter the shape of the telecommunications industry. These forces include convergence through digitalization, packet-switched networks, and the standardization of the TCP /IP protocol.
Table 2.4 Global Broadband Satellite Projects
Company Cost in Technology Year of US$ billions Type Operation
Skybridge 3.9 64 LEOs 2001 1 GEO
Teledesic 9.0 288 LEOs 2002 Celestri -Motorola 12.9 63 LEOs 2002
1 GEO Expressway -Hughes 4.0 14 GEOs 2003
TOTAL 29.8 429
0.006
Definition: GEOs, LEOs, MEOs The distinction between the sat(311ite
systems in Table 2.4 is the orbit in which they operate. Systems are
classified as GEOs (geosynchronous earth orbit), MEOs (medium earth orbit),
and LEOs (low earth orbit). MEOs and LEOs revolve around the earth at about 8000 miles and 500 to 1000 miles from
the surface respectively. The shorter distance means that the communication
signal is stronger when it reaches the earth, which in turn means that lighter
and cheaper transmitters/receivers can be used to capture the signal.
13

Economic Toolkit for African Policy Makers
'Vuring the latter half of the next decade," says MCI's Vincent Cerf, "there will be a new driver [in telecommunications]" billions of devices attached to the Internet. As a result, the voice call that is now the mainstay of the telephone business may one day become a small, specialist activity, perhaps thrown in for nothing along with other services. "
Definition: Node A connecting point in a network.
Definition: Bits to gigabytes
Bit The building block of computer language, either a 1 or a O signifying either an "on" or "off" command for the computer.
§.yte Equal to 8 bits. A byte forms one character - a letter or a number.
Ktlobyte 1,000 bytes. A kilobyte of information would be equal to half a page of information.
Megabyte 1,000 kilobytes or 1 million bytes.
Gigabyte 1,000 megabytes or 1 billion bytes of information. A Gigabyte of information is equivalent to about 2,500 books.
Definition: HTML Hypertext markup language. The language used to compose pages which can be displayed via the World Wide Web.
14
Convergence is the standardization of formerly distinct content types and delivery mechanisms. Boundaries that have traditionally existed between the telephone network, the satellite broadcasting network and the radio network are dissolving. While traditionally the telephone delivered voice communication over copper wires, data networks delivered data over copper , and fiber, and broadcast networks delivered video information/ over the airwaves, the three primary types of information -f voice, data, and video - can now all be organized into a stream of ones and zeros and distributed over copper, fiber or throug~ ~ili J
The digital revolution, by allowing communication to be parceled into the ones and zeros of binary code, has also made packet-switching technology possible.
Packet switching, as opposed to circuit switching, represents the second great technological shift that challenges the traditional telecommunications model, and has deep implications for the way in which communications services will be priced and regulated. A packet-switched network transports informa-
(tion from point A to point B by dividing it up into pieces or ., ,packets and sending these packets through the most efficient path on the network. At each node on the network, a machine
. _ _called a router calculates the best path onwards for the packet, given current traffic patterns, and sends the packet to the next node in the chain. Whereas a circuit switched network occupies a dedicated circuit from point A to point B, blocking all other traffic, the packet-switched network leaves routes open to be used by many users and many types of information at the same time. Instead of tying up an entire phone line's capacity, no matter how much data is actually being sent, the Internet sends packets only when there are packets to be sent. For many applications, this use of the telecommunications infrastructure is much more efficient and therefore much cheaper. ,
Finally, the protocol that the Internet uses - TCP /IP - IB\ fast becoming the de facto standard for the transport of bits over_J packet-switched networks. Because of the importance of standards in computing, the technology that reaches critical mass first pulls in other applications into its orbit and eventually becomes a de facto standard. The World Wide Web has reached such a level of critical mass that content and software developers are creating applications and developing content (in HTML) for this protocol. Indeed, this critical mass is forcing established telecommunications companies around the worl.~. to construct their own networks based on Internet technology]
If these changes come to fruition, the carriage of data will become a commodity business, like the carriage of freight. The wholesale telecommunications industry will still be a rewarding business, but very different from the business of today. It

I'
" will depend more on volume than on margin: the goal will be to connect as many users as possible to the network. While the big carriers contract with cable, satellite and other companies to construct huge networks, markets will develop for many smaller specialists to develop retail products selling access to these very networks in a variety of forms. Such retail access might include unlimited communications in the purchase price, fixed low-cost access, or pay as you use systems. These changes will pose both __ direct and indirect threats to the traditional telecommunications structure.
The threat posed by the Internet to African PTTs
One technological advance that has already become a direct threat to traditional telecommunications is Internet telephony. Another, much simpler way, in which the Internet is affecting company revenues is through the substitution of email for voice and fax calls. The models presented in Annexes 1, 2 and 6 are in part designed to calculate a PTT' s potential losses because of email substitution. Based on data from Mozambique and elsewhere in Africa, it is possible to estimate the likely financial effect of such substitution.
While the Internet has relatively high fixed costs as a method of communication (annualized equipment and connection cost, excluding the cost of telephone rental, is estimated to be approximately US$1,172 a year for Mozambique), the recurrent cost - the cost of sending each additional email - is almost zero. This is because a page of information is transmitted by email in under half a second over a standard modem. The yearly costs at even a fairly high usage rate would only be US$10 per year for a local connection. In contrast, while the annualized cost of a telephone line is relatively small in Africa (US$108 in Mozambique), the marginal cost of an international telephone call is very high. A three minute call to the U.K. costs US$7.65.
The costs of communicating different numbers of pages of information internationally using different communications technologies are given in Table 2.5 (for details see Annex 1). The data exclude the costs of telephone connection, but include all other associated fixed costs.
Evidence suggests that the average level of use in African countries is approximately one email in and out a day, almost always to and from outside the continent, with an average length of 3 to 4 pages (see Annex 6). Based on surveys it can be estimated that 25 percent of these email are replacing faxes, while 10 percent are replacing phone calls (the other 65 percent are communications that would not have been made in the absence of an email system). This leads to a further estimation: that substitution by the present number of subscribers in Mozambique
The Challenge of Internet Telephony
In July 1997, Germany's Deutsche Telekom announced a pilot program to
allow 1, 000 customers to place international calls over the Internet from their own telephones to a limited range of cities for DM0.24 (13 cents/minute)
- a bargain compared with DM1.32 for ordinary off peak calls to the United
States.
In December 1997, Qwest Communications announced a long
distance phone service at a rate of 75 cents/minute using voice over the
Internet. "Our network can't be duplicated by the other carriers," says
Joseph Nacchio, Qwest's CEO and former AT&T executive. ''For the most part, these savings come from lower equipment costs. Savings also come
from the inherent advantage of packet switching over circuit switching."
("Telecom Goes Qwest': Wired, March 1998.)
Some 800, 000 telephone subscribers in Stockholm will, from May 1998, be able to make voice calls via the Internet as a
result of a service unveiled by Glocalnet, a privately owned Swedish
Internet network company, and Stockholm Energi, the municipal power
utility. The companies claim that this joint venture is the largest project of its kind in the world Stockholm Telecom,
a Glocalnet subsidiary, said routing calls via the internet could cut call charges by
up to 50 per cent.
15

Economic Toolkit for African Policy Makers
Table 2.5 Yearly Cost of International Communication to User (US$)
Pages Sent/yr 100 1,000
Phone 383 3,825 Fax 232 920 Email (local) 1,182 1, 182 Email (regional) 1,328 1,328
--------------------------~---
10,000
38,250 7,805 1, 182 1,328
costs Mozambique's PTT close to US$1.8 million l 1
year in revenue. ~:
Another technique (presented in Annex 2.f · estimates the effects of present usage in African 1
countries in general on telecommunications company profits. The Federal Communication Commission (FCC) has calculated the cost to the South African and Kenyan PTTs of making or receiving
1
an international call. Taking into account the call ' charges, the given level of substitution by email, i
and using Kenya as the high-end estimate and! South Africa as the low-end estimate of African call completion costs, it is possible to measure the impact of email on company profits. In more developed Internet markets in Africa, a highend estimate of profit loss looks to equal about one percent o!_,J revenue.
However, there are four important lessons to be remembered. First, so far, losses arising from email substitution are smaller than increased revenues provided by the rapid rise in international telephone traffic in and out of Africa (ITU 1997). Second, if the Internet poses a threat to telecommunications profits in Africa, the threat is minimal when compared to that from accounting rate reform. For example, annual U.S. accounting rates settlements alone account for 2.4 percent of Mozambican PTT revenues. Third, the cost of international service provision is a fraction of the charges the PTTs demand for it. Email substitution is only one small element in a wider set of pressures on international call rates which are highly overpriced. Fourth, Internet telephony, the more obvious Internet-based threat to tra~\:" ditional telecommunications charging structures, is likely to\ become widespread only after significant improvements in the ,' quality of Internet service provision. This, in turn, is likely only! after reforms take place in the broader telecommunications sec- ~1 tor that will make African telecommunications companies less 'I
reliant on international call revenues. _ __,
Table 2.6 Lost Profits to International Email Substitution
Country Estimated 3 minute Accounting Lost Profit/yr Lost profit/yr Revenue Lost profit number of call to U.S. rate with (US$) (low) (US$) (high) /yr (US$M) as%
subscribers (US$) US$/min revenue
South Africa 700,000 4.58 1..00 31,943,473 n.a. 3674.7 0.87 Zimbabwe 8,000 7.50 0.75 913,070 1, 172,742 146.2 0.80 Mozambique 2,750 7.65 1.19 316,384 405,646 62.6 0.65 Ghana 4,000 7.50 1.00 450,785 580,621 65 0.89 Ethi0pia 1,000 4.80 1.80 46,086 78,545 72.3 0.11
16
If African PTTs give way to pressures for rate rebalancing (charging less for international calls and more for a local connection and calls), this is likely to have a significant impact on the economics of the Internet in the continent, making email substitution both less attractive to users and less of a threat to the region's telephone companies. More significantly, however, it might drive up the revenues that PTTs receive from World Wide Web users, which could turn Internet usage from a revenue drain into a profit center for telecommunications companies.
Economic issues and the Internet
Beyond the fact that the Internet poses little threat to flexible PTTs, the new technology offers exciting opportunities for African economic development. The Internet is the backbone of a growing sector of the global economy - that of networked ser-
. vices. The impact of this increasingly networked economy is illustrated by Metcalfe's Law, which states that the value of ~ network is equivalent to the square of the number of nodeqJin other words, as networks grow, the utility of being connected to the networks not only increases, but does so exponentially. Each added connection to a network's pool of knowledge multiplies the value of the whole. At the same time, as the bandwidth available throughout the network continues to grow, Gilder's Law states that the price of obtaining a given level of bandwidth continues to drop. The ratio of cost to value of access plummets over time and high bandwidth connections become that much more important, generating more usage and more capital to upgrade the network. These trends also indicate that a larger variety of machines will be available with the computing capacity necessary to be connected to the Internet.
Today, personal computers and some cell phones have the ability to connect to the Internet. In the future, it is likely that even a household device, or a wristwatch, will access the Internet. All this suggests a bright future for the Internet and information industries worldwide, a future that is already reflected in the stock prices of information-based companies. For example, Microsoft has annual sales of US$11 billion, yet the stock market values the company at well over US$150 billion. This compares to IBM with sales of US$76 billion and a market capitalization of US$100 billion, or General Motors with sales of US$ 160 billion and a market capitalization of only US$50 billion.
Technological change has begun a revolution in the telecommunications sector today. The Internet is going to increase the scale and scope of that revolution. In Africa, the breakaway from tradition will force changes in the way that African telecommunications companies operate, and in the process create a new future for many less-developed African nations.
Studies of Economic Growth and the Internet
Recent econometric studies have found evidence of a causal link between
telecommunications development (the number of telephones per capita or per
worker) and economic development. See Norton (1992), Canning (1997a,
1997b}, Canning and Fay (1993}, and Easterly and Levine (1997). Easterly and Levine argue.that the low rate or-
telecommunications development is a significant factor in helping to explain
Africa's overall slow growth rates. Evidence has been gathered on high
returns to investment in telecommunications equipment by
Antonelli (1993), Hardy (1980), Aschauer(1989} and Easterly and
Rebelo (1993). McKinsey (1995) argues that adding one new telephone to the network in countries with a GNP per capita of $100 adds $12,000 to the
, GNP. Micro evidence on high returns to telecommunications investment can be
found in the World Bank's Operations Evaluation Department study of World
Bank lending in the sector (1992), Antonelli (1996), and Wellenius (1992).
Studies of returns to the Internet in particular have not been carried out in
developing countries, as the technology is still too new. However, there are
strong reasons to believe that returns should be as high or even higher than
those of basic telephony. These include: the greater ability of the Internet to
provide tailored information, to provide this information to thousands at the
same time (rather than one recipient of a phone call), and to reduce cost of
searQh on the network.
17
Economic Toolkit for African Policy Makers
3 The Internet in Africa
18
Who uses the Internet iri Africa?
The CABECA survey of African Internet users was carried out in 1997-98 to gather data on the characteristics of the average African Internet user (see Bibliography for full citation). The survey found that there was as yet little government use of the Internet: only one percent of users in Ethiopia, and only six percent in Zambia, were government employees. The highest number of users belonged to nongovernment organizations (NGOs ), private companies, and universities. The ratio of nationals to non-nationals varied between countries: 44 percent of users surveyed in Zambia were nationals as compared to 90 percent in Ghana. Most users were male: 86 percent, 83 percent, and 64 percent in Ethiopia, Senegal, and Zambia respectively. A large majority of users were well educated: 87 percent of users in Zambia and 98 percent in Ethiopia had a university degree. A recent South African survey of the Internet found similar results: the average user was male, 26 to 30, spoke English, was high school or university-educated, earned between US$24,000 and US$45,000 per year and worked in the computer industry.
What is the Internet used for?
The survey findings suggest that the average level of email use is one per day, sending and receiving. Email is used for general correspondence and document exchange, technical advice, managing projects, arranging meetings, and exchanging research ideas, although its use is still limited for finding and accessing formal information resources. Across the continent, users report that email has increased efficiency and reduced the cost of communication - but as yet it is used almost exclusively for contacting individuals in other regions. The WWW is still a relatively underutilized resource, although 40 percent of Zambian users questioned had conducted literature searches on the web. Further, there are signs that the Internet is beginning to play a larger role in the economies of the region.
Exporting through the Internet
African countries export many commodities that can be easily

traded over the web'. One example is coffee. In 1997, the world consumption of coffee exceeded eight million metric tons, up from 6.5 in 1987, and Africa produces more than 20 percent of the world's coffee. Of the African nations, Cote D'Ivoire, Cameroon, Uganda, Kenya and Zaire together produce over 60 percent of the continent's coffee crops. The Ugandan Coffee Trade Federation (UCTF) has created a home page (www.patriot.net/-Uganda) which provides information about coffee production, the growers, the land, and the different kinds of coffee. ,,
The Ugandans also examined the possibility of growing an organic coffee, posting the idea on their web site to research the market and find possible collaborators. The Uganda web site is only one example of how, by having better communications, African growers can reach out to vendors, to other growers in the area, as well as to growers in other countries who may share experiences with Uganda.
There are other examples of trade and commerce on the Internet. Craftsmen in Uganda, Senegal, Botswana, and Zimbabwe are now marketing their products worldwide through the UN International Trade Center's "Virtual Handicraft Exhibition" web site (http:/ /www.unicc.org/itc/virtexib/vexhibl.html).
A small import-export company in Tanzania, Regent Clearing and Forwarding, now uses 10 cents electronic mail messages and $1 email-to-fax gateways instead of $20 faxes to place orders for products in North America and Europe. As a result the company has seen its telecommunications bill go from over $500 each month to $45 a month.
Also in Tanzania, a small African shipping company, Sangare Clearing and Forwarding, has eliminated one of its biggest expenses. As agents for Fedex and Airborne Express, the company went through three to four rolls of triplicate telex paper each day. Now it uses email to send waybill numbers and time of delivery.
A British supermarket is planning to use email to conduct just-in-time purchase of chili peppers from a farm in Kenya.
The African Market only offers products from Africa and more specifically from Southern Africa. The product are uniquely African or depict African themes (http: I/ www.safariiafrica.com/ market/ index.html).
Take the Internet route to Africa
In the last three years, the Internet has become a new marketing and sales tool for travel to Africa. Several countries offer a complete tourism directory on the net. Zimbabwe's, for example, is at www.zimbabwe.net/ tourism. A visitor to this site will be able to get information on every aspect of a trip. The site provides
\
19

Economic Toolkit for African Policy Makers
20
information on visas, entry formalities, currency, health requirements, entry points to the country, holidays, and the weather. In addition, the site has many links to other tourism related Internet sites, such as air transport information, accommodation options, sport activities, safari camps and trip planners, and other regional information. Zambia's site (www.africa-insites.com/ zambia/ travel) offers the potential traveler to Zambia a complete directory of hotels/ safari operators, service providers, travel advisory, adventures and package tours.
Botswana Focus is a private sector site that provides comprehensive travel information on that country through the web at www.wildnetafrica.com/ stbrob.html. The Tanzania Tourism Board has also posted a colorful web site with information about traveling in Tanzania (www.tanzania-web.com). The site provides an interactive map where visitors can click on a place to find information on wildlife, accommodation, booking options, and on how to get there. In addition to the official site, Zanzibarnet (www.zanzibar.net) gives further information about travel to Zanzibar.
Agriculture and environment
Assisted by the Environment Liaison Center International in Nairobi, a rural Kenyan farming cooperative has established a relationship through electronic mail with the EarthMarketplace, a U.S. organization, to sell local produce directly to North American consumers, bypassing the distributors, thus increasing the choice and reducing the cost for the consumer, and increasing the revenues of local farmers.
In Madagascar, a low earth orbit satellite is sending environmental monitoring and conservation project administration information from remote areas to the capital.
Health
A doctor in Kenya recently solved a life threatening case of malaria complications through HealthNet, Kenya's low-cost electronic mail service which connected him to experts in the U.S. (http:/ /www.healthnet.org/hnet/ken.html).
Education
Over 6 000 correspondence course students all over Africa can now obtain advice and reading material from their tutors at UNISA in South Africa via electronic mail and the web (http:/ / www.unisa.ac.za I).
A World Bank project called World Links for Development is linking secondary school students in Africa to other students

around the world over the Internet for collaborative distance learning (http:/Iwww.worldbank.org/ worldlinks). Government and NGOs
Grassroots NGOs in many African countries are now in daily contact with their local networks and funders worldwide, increasing their ability to seek advice or support, and reducing the necessity for time-consuming and costly face-to-face meetings. Active users in outlying areas using the NGO network in South Africa - SangoNet - include:
• The Oukassie Development Trust • The Kwanobuhle Self Help and Resource Exchange
(SHARE) • The Wozasep Sekhukhune Educare Project • MidNet, Natal Midlands Rural Development Net
work, Pietermaritzburg, a network of Natal NGOs. • The Africa Cooperative Action Trust, Umtata. • The Environmental Development Agency, Matat
Hill.
Journalism and the media
National newspapers in Cote d'Ivoire, Kenya and Zambia are how published daily on the web, allowing users in remote areas and expatriates to obtain the latest news without waiting days or weeks for local deliveries (http: I I www.africaonline.ci).
Rural correspondents for the East Cape News Agency in South Africa are able to provide increased coverage of events affecting their neighbors through electronic mail.
Gender
Kenyan women are building an electronic network including a database of contacts and an on-line discussion area (http:// www.africaonline.co.ke I AfricaOnline I women.html).
African users and suppliers: problems and solutions
Thus, the Internet is expanding rapidly both in scale and scope on the African continent. However, users and suppliers have identified many problems with operating the new technology. Network Computer Systems in Ghana found the cost and reliability of Ghana Telecom's infrastructure a significant barrier to the growth of the Internet. High speed lines cost up to 20 times their cost in the U.S. Links to the Internet backbone were also constricted, necessitating an international link that bypassed the Ghana Telecom network. NCS also mentioned a low level of PC penetration and equally low computer literacy as significant
African Newspapers on the Web The Post in Zambia (http://
www.zamnet.zm/zamnetlpost/ post.html}, The Daily Graphic in Ghana
(http://www.graphic.com.ghl), The Independent in Ghana (http://
www.africaonline.com.gh/AfricaOnline/ newsstand/independent/1 I
homepage.html}, The Ghanaian Chronicle (http://
www.africaonline.com.gh/AfricaOn/ine/ newsstandlchronic/e/1/homepage.html}.
21

Economic Toolkit for African Policy Makers
22
barriers (Quaynor, Tevie and Bulley, 1997). The computer training center in Wa, Upper West Province
in Ghana, exemplifies the additional problems that sites distant from the capital city can face in accessing the Internet. A range of infrastructure issues and the high fixed costs of Internet service provision make running such a center very challenging. First, the telephone connection cost to Accra is 33 cents and the hourly charge US$7.50. Poor line quality limits transmission speed and means that it usually takes five attempts to connect successfully to the ISP (adding another US$1.67 to the connection charges). Line drops frequently disrupt downloads, necessitating reconnection and starting the download again. The training center also suffers from other infrastructure weaknesses: electricity has been rationed since the beginning of 1998 due to low rains. Repair and maintenance problems include the difficulties of a seven-hour bus ride to Accra over poor roads. At the moment, the center is only financially viable because it is run by volunteers: revenues are US$2,000 a year, but locals trained in computer skills and management are in high demand: they can fetch US$6,000 per year. Without a local user base of at least 35 users, a commercially viable center will be impossible to operate (Hirsch, 1998). Interviews with a number of schools in Uganda suggest similar problems. Complaints included difficulty in getting telephone lines, inadequate trained personnel, unreliable computer equipment, poor telephone links (especially when it rains) and unreliable electricity supplies (Hawkins, 1998).
Another problem the Africa Internet faces right now is the poor speed of connectivity. The low bandwidth causes a slow download of sites that are hosted in Africa. This is why many of the African Internet sites mentioned earlier are hosted on servers that are in Europe or the U.S. The Zambian web site, for example, is hosted by a company in London, a lodge in Zimbabwe has its own site on a Hungarian server and the Chiawa Camp in Zambia has its website hosted by a Florida Internet provider.
The CABECA survey reports that a low level of computer literacy in general and knowledge of mailer programs in particular stifled Internet use. Overall, there was a clear correlation between low computer skills and the low number of email sent by users. This problem was exacerbated by a widespread paucity of trainers in the countries surveyed. The high number of users per line and limited access to nodes also restrict use. However, there are signs of hope. Seventeen percent of Zambian users were already complaining of information overload!
A sub-survey of a telematics user group uncovered the feeling that a lack of awareness of the benefits of the Internet at high levels in government, and resistance from telecommunications service providers, were major factors in slowing Internet

development in the region. The regional telematics symposium sur
veyed by the CABECA study argued that the most important changes required to make electronic commerce on the continent sustainable were
Table 3.1 Estimated Cost of Internet Access and per Capita Expenditure on Communications
• privatization, • free use of email without govern
ment interference, • skills upgrading for users and
operators, • affordable costs, • effective management, and • aggressive marketing of systems.
Providing cheaper, more reliable Internet access
Country
South Africa Tanzania Ghana Cote d'Ivoire Senegal
Cost appears to be a central concern of users (and certainly of nonusers) in the African continent, then. Annex 5 presents details on potential Internet penetration in Africa. Table 3.1 shows the estimated cost of an Internet access point in five countries, and average potential per person communications expenditure, based on the (low-end) assumption that one percent of income goes toward communications.
The figures in Table 3.1 clearly suggest that at the moment only the very rich in Africa will be able to afford their own Internet connection. It also emphasizes the need for genuine public access if the Internet is going to be widely used. Even so, if as much as 50 percent of low-income users' potential expenditure on communications was harnessed to provide Internet access to the poorest 20 percent of the population in Tanzania, the number of Internet access points they could afford per head at present would be one per every 25,000 (one every 800 km2 at average population densities). This, in turn, emphasizes the vital importance of lowering connection costs. If Tanzania's cost of connection was to fall to South Africa's level, potential Internet connectivity would increase sevenfold, raising the average potential ratio of one terminal per 10,000 people to one per 1,500. The results also suggest how vital
Annualized Internet Access
Cost ($US)
793 5,425 1,270 1,062
875
Per Capita Communications
Expenditure ($US)
32.8 1.2 3.7 7.2 5.7
public access to community Internet Table 3.2 The Cost of Internet Access in Mozambique per Year provision will be, if the Internet is to be widely used. Item Cost Yearly equivalent cost % of Total
Where do these costs of connec-tion come from? Table 3.2 presents evidence of the breakdown of costs for an end-user with his own computer dedicated to local Internet access who uses the Internet for an hour
Computer Modem Web connection Web yearly fees Telephone access
1,300 175
10
507 68
2 600 208
37 5 0
43 15
23

Economic Toolkit for African Policy Makers
Table 3.3 Price of Internet Access in Sub-Saharan Africa and the OECD (US$)
each business day. It should be noted that if the
user only had regional access to the
Ethiopia Ghana Senegal South Africa Uganda Zambia
African Average OECD Average
ISP Charge /month
20 hrs 30hrs
88 138 54 54 21 21 14 14 66 66 78 113
115 137 66 82
PTT Charge /month
20 hrs 30hrs
16 36 46 43 93 49
60 42
22 52 67 57
135 73
84 56
Total ISP+ PTT 20 hrs 30hrs
104 90 68 57
159 128
175 108
160 106 88 71
201 187
221 138
Based on calculations from. Annex 3
Internet, phone charges alone would amount to US$3,120 per year, or 73 percent of total costs. Obviously, cheap local access to the Internet is vital for expanding use. Secondly, the most significant cost for those with local access is the ISP charges. The CABECA study suggests that there are as many as three subscribers to each computer in Africa, indicating that equipment costs account for only about 16 percent of the average subscriber's Internet access bill. Therefore, the other significant
way to ensure low cost access to the Internet is to reduce ISP charges. Table 3.3 displays the disparity between Internet access provider charges and PTT charges for 20 and 30 hours of connection to the Internet in Africa, as compared to the OECD average. The costs for accessing the Internet in Africa average 62 percent higher than OECD countries. On the other hand, effi-
cient markets on the continent, such as Ghana,
Table 3.4 Reliability of Telecommunications Infrastructure in Africa Senegal, and South Africa, show that there is no in
Country ·Satisfied % of demand for lines telephones digital
(% total demand)
Angola Cameroon 66 68 Cote d'Ivoire 82 84 Ethiopia 46 40 Ghana 80 58 Kenya 77 54 Mali 78 Mozambique 94 72 Senegal 88 76 South Africa 97 66 Tanzania 38 39 Zimbabwe 56 32
Sub-Saharan Africa 69 56 Low Income 88.8 90
Source: ITU, 1997
24
Faults per 100 lines per year
150 74 80 74
176
44 39
8 201 190
142 167
Cellular Leased subscribers circuits
(%) (000)
3.2 4.5
9.4 0.9
0.1 12.0
3.7
5.9
0.02 0.02 0.20 0.22 0.06
0.04 0.19 0.10
61.74 0.56 0.28
herent reason for high Af-rican Internet access charges.
Reliability is another pressing concern of users in Africa. Here again, the record of many African PTTs is sadly lacking, as is clear from Table 3.4.
The ISP
If a major concern of users is the cost and reliability of Internet service provision, it is worth looking at the cost breakdown for an ISP. The model based on Mozambican data suggests that for an

Table 3.5 ISP information - International Gateway, Mozambique
Network lnt'I satellite capacity Internet Access Node Equipment (operation&maint.) Leased Lines to local ISPs (operation&maint.) Other Maintenance Sub-Total Percentage of Total
Node Facility Climate Control Other (inc. power, light, rent) Sub-Total Percentage of Total
Administration Training of personnel Other (inc. accounts, billing, supplies) Sub-Total Percentage of Total
Salaries Technical Support Management Security Other Sub Total Percentage of Total
Other Sales/Marketing Percentage of Total
Total Operating Expenses
Annual Depreciation on Equipment Percentage of Total Total Costs (Break-even) Annual Return on Investment - 8% Annual Revenue Requirement
Total Cost/month in US$
6,000 500 100 100
50 6,750
100 110 210
100 85
185
700 500
50 10
1,260
Annual Cost in US$
72,000 6,000 1,200 1,200
600 81,000
60.07%
1,200 1320
2,520 1.87%
1,200 1,020 2,220 1.65%
8,400 6,000
600 120
15, 120 11.21%
5,043 3.74%
105,903
28,933 21.46% 134,836
6,453 141,289
25

Economic Toolkit for African Policy Makers
26
ISP serving 3,500 customers the equipment cost is likely to be US$89)S16; the yearly Internet and telecommunications cost will be US$134,490; and the salary and maintenance expenditure will be US$56,000. These figures probably underrate the costs of salaries, marketing, and maintenance, but they clearly indicate that connectivity is the most expensive item.
If we look at USAID' s model of the costs of an international gateway for Mozambique's Internet, we can see again that international connectivity forms the bulk of the expenditure.
The cost breakdown in Table 3.5 indicates that around 60 percent of the costs for an International ISP gateway in Mozambique is for network connectivity. The greatest percentage of this cost is international satellite connectivity which accounts for 88 percent of the network costs. Not surprisingly,
. sensitivity tests of the model suggest that the high international connectivity costs are a major cause of high ISP charges (see Annex 1).
The PTT
The telecommunications company clearly plans a vital role in providing affordable access, then. What type of reaction the Internet creates in the telecoms sector is likely to be critical in determining the growth of the Internet. It is likely that a policy of active support will reap the highest rewards.
We have already seen that the Internet can be used to substitute email for voice and fax communication, but that is only one element of the relationship between Internet users and telecommunications companies. For example, PTTs gain profits from World Wide Web access. Internet access in Mozambique averages 100 hours a year per subscriber at the moment. Assuming that 90 percent of users have local access, Mozambique's PTT gains US$759,000 annually in telephone charges from users (see Annex 1 for details). If one in 20 users manage to obtain a second line dedicated to Internet use, another US$12,600 are added per year in revenues. There is also the revenue from ISP leased lines, subscriber lines and international connectivity.
Using the cost and load assumptions laid out in Annex 6, it appears that, even in Mozambique, where the PTT gains little revenue from the ISP's international connection, cost of providing the services required by Internet users is below the revenues received for this service. Rough estimates suggest that present levels of Internet usage add US$500,000 to the PTT' s profits each year. The sensitivity tests carried out in Annex 1 suggest that if Internet usage was to increase in Mozambique, the extra revenues from calls into the ISPs would outweigh the revenue losses from email substitution. This is in the interests of the PTT to
ensure that the Internet user base expands in the country. This approximation in Mozambique is supported by U.S.
evidence on the impact of the Internet on telephone companies. Preliminary results from the U.S. suggest that:
• congestion has not caused any collapse of the telephone network; and
• local phone companies are actively promoting second line access, and additional revenue from second lines are six times the amount the companies claim they need to upgrade their networks for handling Internet traffic.
In other words, both the model and U.S. evidence suggest that, while the Internet might change telephone usage patterns, flexible PTTs should not be overly threatened by its expansion and, in fact, should encourage it.
One change mentioned earlier is likely to have an impact on the rate of the Internet's expansion, however. Tariff rebalancing is narrowing the difference between the prices for local and long distance services. In Australia, the ratio between the price of a long distance call between Sydney and Melbourne and the price of a local call was 45 to one in 1966. This had been reduced to 30 to one in 1976, 15 to one in 1986 and four to one in 1996. This trend will most likely continue in the coming years. Rebalancing in usage charges of local calls versus long distance calls has led to an increase of 43 percent in the price of local calls between 1990 and 1996 in OECD countries. In contrast, the average price of a long distance call (at 490 km) fell 30 percent over the same period.
However, all PTTs are rebalancing tariffs based on traditional patterns of telephony. On average, local telephone calls in the OECD area last less than three minutes whereas callers to the Internet, or proprietary on-line data bases make calls of much longer duration. Pricing of local networks is going to become increasingly challenging for PTTs. In countries with relatively expensive measured rates the growth of new services may be slowed. In countries with flat or unmeasured rates the networks designed to handle relatively short calls may become congested. These will need to be quickly upgraded with new technologies designed to cope with new usage patterns.
Competition as a solution
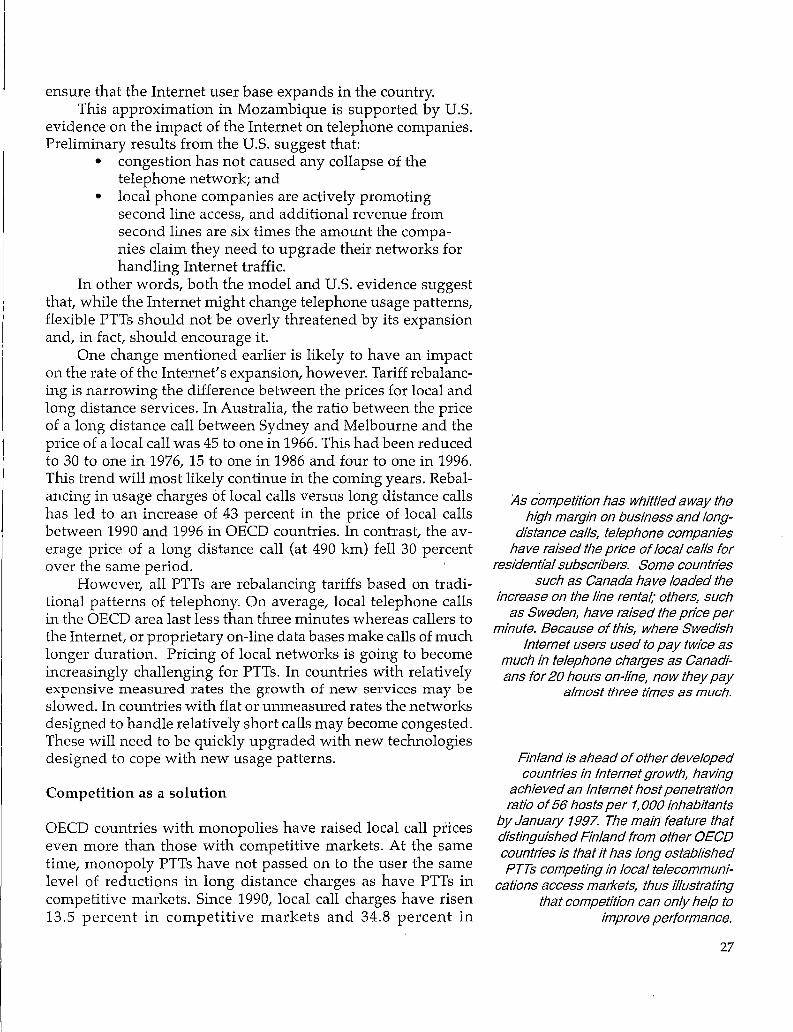
OECD countries with monopolies have raised local call prices even more than those with competitive markets. At the same time, monopoly PTTs have not passed on to the user the same level of reductions in long distance charges as have PTTs in competitive markets. Since 1990, local call charges have risen 13.5 percent in competitive markets and 34.8 percent in
As competition has whittled away the high margin on business and long
distance calls, telephone companies have raised the price of local calls for
residential subscribers. Some countries such as Canada have loaded the
increase on the line rental,· others, such as Sweden, have raised the price per
minute. Because of this, where Swedish Internet users used to pay twice as
much in telephone charges as Canadians for 20 hours on-line, now they pay
almost three times as much.
Finland is ahead of other developed countries in Internet growth, having
achieved an Internet host penetration ratio of 56 hosts per 1, 000 inhabitants
by January 1997. The main feature that distinguished Finland from other OECD countries is that it has long established PTTs competing in local telecommuni
cations access markets, thus illustrating that competition can only help to
improve performance.
27

Economic Toolkit for African Policy Makers
Table 3.6 Telecommunications Liberalization and Internet Access in Sub-Saharan Africa
Liberalization Index
1998 1997 private liberal
involvement
Average 1.9 3.5 0
1 to 2 3 to 4
o to 3 4 to 7
28
Hosts Monthly Cost US$ Internet Access
1998
128 103 123 145 89
174
10 pages/ 50 pages/ yes/no no. of day day 1995 providers
1997
64 88 0.39 3.4 86 239 0.25 2.5 77 83 0.29 2.7 34 36 0.60 4.8 82 124 0.29 3.0 43 44 0.50 3.7
monopoly markets. Charges for long distance have been decreased by 30 to 35 percent in competitive markets and around 20 percent in noncompetitive markets over the same period. All this data strongly support competition as a strategy to keep the prices down for Internet users.
As is clear from the analysis in Annex 3, the rule that competition lowers costs also applies to African nations. Liberaliz~d telecommunications markets have cheaper Internet access because of both lower overall telephone charges and lower ISP payments. Sorting African countries by two different measures of liberalization, one based on the extent of private involvement in the telecommunications market in 1998 and one based on the broad extent of liberalization in the sector in 1997, it is clear that more liberalized countries have more Internet hosts, and lower monthly access costs when transferring 10 or 50 pages a day (see Table 3.6). For both indices, 0 is a measure of little private competition, and 4 (in the case of the private involvement index) or 7 (in the case of the liberal index) suggests a great deal of competition in the sector.
It is similarly true that countries with competition in the field of Internet service provision have lower costs of service provision and a larger number of Internet hosts. Evidently, even though there are small scale economies in this area, these are outweighed by the efficiency gains brought on by competition.
Taking data from Table 3.7 on African Internet users, we can see in Table 3.8 that countries that are more liberal by either the liberalization index or the privatization index have more ISPs, more users and more international bandwidth.

Table 3.7 ISP Competition and Internet Access in Sub-Saharan Africa
No. of ISPs Liberalization Index Hosts Monthly Cost (US$)
1998 private 1997 1998 10 pages/ pages/ involvement liberalization day day
One 1.13 2.25 43 83.88 95.38 More than one 2.13 3.87 157 57.09 85.39
Table 3.8 Internet Users and Liberalization in Sub-Saharan Africa
Country Full ISPs Store/ Users Internet Monopoly Population Users/ forward bandwidth ISP population
(Im)
Average 2.76 1.82 1681 336 0.31 14 188 ISP Competition 4.30 2.41 2643 553 0.00 17 246 Monopoly ISP 1.33 1.58 842 112 1.00 13 190 Liberal lndex>=4 3.29 2.57 1750 406 0.15 21 266 Liberal lndex<4 2.18 2.06 1538 327 0.38 8 225 Private Index= 0-1 1.53 1.40 717 95 0.46 6 217 Private Index= 2-4 3.75 3.13 2494 614 0.13 22 269
Source: Michael Jensen, http://demiurge.wn.apc.org:80/africa/users.htm All average statistics exclude South Africa.
29

Economic Toolkit for African Policy Makers
4 Policy Issues
30
By changing the way connections are utilized, the Internet challenges present profit centers and network configurations. In particular, Internet telephony and substitution threaten profits from international voice communication. However, there are at least three arguments that suggest this is not reason enough for PTTs to control or discourage Internet expansion:
• The Internet is only one of a number of technologydriven forces that are initiating changes in the structure of the network and pricing. Discouraging its expansion on the continent cannot preserve the status quo.
• The Internet offers potential new revenue sources - increased local call revenue and greater demand for international bandwidth, for example. Evidence suggests that an increased user base will generate profits for the PTT.
• There is more than enough evidence to demonstrate the value of the Internet and its ability to encourage economic growth in Africa. Fear of change in telecommunications companies is not reason enough to restrict the opportunities that the Internet presents.
Even if official attitudes toward the Internet change for the better across Africa, there remain policy issues. One of the major ones, already discussed, deals with rate rebalancing which may lead to an increase in the cost ot local calls and connection to the network. This presents a challenge to policies encouraging universal service or at least universal access to telephones, and may also restrict Internet usage. To meet this challenge, and others involving costs and access, the toolkit offers the twopronged strategy of liberalization and competition coupled with public access.
There are other issues that may affect decision making in this sector. The toolkit offers some general principles for government policy:
• Think differently and stress openness: governments need to treat the Internet as a new technology and not a mere addition to the existing telecommunications or broadcasting regimes. Policies and regulation need to be open and flexible, to adjust to new environments.
• Promote competition: governments should work to encourage competition at all levels, a tested tool for increasing efficiency and lowering costs.
• Avoid unnecessary regulation: governments need to work to avoid unnecessary interference with the Internet's development. The Internet has grown so rapidly primarily because it has been allowed the freedom to do so.
Think differently
It is important that government regulatory policies encourage innovation and new service applications, and to do so, very often those policies have to undergo major redesign. The existing definitions of broadcasting, publishing, and communications are changing all over the world. Government policy must be sensitive to these changes, and realize that the Internet landscape a few years in the future may look very different from that of today. Also, convergence is changing the way that voice, data, and video content is delivered. Opportunities to create and deliver this information will come from many sources, both domestic and international. The regulatory infrastructure must be sensitive to this and create conditions to allow many new entrants to participate in and contribute to the development of a new information society.
Promote competition
Competition in telecommunications network services, Internet service provision, and content development should be stressed in order to bring the greatest efficiency gains to the country. Wherever possible, market forces should be harnessed to take the place of direct regulatory intervention. Although new services like Internet telephony and streaming audio and video may create regulatory problems, these developments are positive ones which governments should encourage.
New Cqmmunjcat,ions.LaW'i~~i;~~a~W,e:;',Exampl.ep£,'f!n ·,;~:;;i~~rl.]Joli91{' · Media worke~·s andci~il s.ociety r~presentatives iAZim~ .... ti9p9 :e~Ji~~s);;itl-t!h§ e~~eptich{;~~:~~Ii~Iarphdneser\Tices,. babwe have, call~d on' ,the government t,o aine,nd 'forasuccessoi- cofn:par1yofthe existingP.osts;and J'elecomZimbabwe' s draft comm.unicatior1s. pm in ord§r}O,• al- municatidps qirporatiori .. All s.J}q.:re§ ig.the·:successoryQfn:- • l()w for.an independenttelecoll}111un~cati.ons (lri<l'~ro.Cl-q-;.:·· panywil1'1;;¢;}1~.19,:PYr;Pfi!:r.sons rioifiinatedby t~.e,·fM:inister of;·· castingregi1lator~hat. is·'1Eigally free from slate,•·•;. ·l1J~g:r111atiorio'ri'.tje,~.~1~:0'f:the state. In respo11se, ,grqups:m·:
.·.·· goyernment 'ot PCJ.litical •c.:cmtrbl. The Cpmn:,lUnicat,ionp · :'f:itilbabwe called for the 1ibetalizatipn,:,:of,;t:l};e, air:\;v,aves arid Bill 1997, dau9e S;3'(2);:pr,6vides,·tlrn,t,o.n1ytheZimba- ·. a"regulci.t8~Yc;!)§qy .whiCh Wotlldb~acsountable9nlyto:z~m~ ,,. bwe Broadcasting. Cprporatiqn(:z;~C)sfoll operate/ 61<: ·. babweanpeo.pl~::<tl}i;gpgh: pci:rli~fn:.erit·· (Media',lnt>tit.tite.·of'
. · have in its :possession or control; ·a broadcast station:.: 'Soutl:iep1.Africa ...:.,...MlSA.C2'/.25/9.8\ The ·d~~-~~-~,b'Pl ·'.~!Sci"i;et.~i;1:~~,~monop?~~·i1:1,,·t~~:P,~:¥!R~~p~~~-, , -·;·:'\:=>L~c., .;~:;;~;<= :; ,·
31

Economic Toolkit for African Policy Makers
32
Avoid unnecessary regulation
Governments should regulate the Internet as little as possible. The ultimate objective should be less regulation for all, rather than more regulation for some. For instance, if competitive imbalance exists because a new technology is not subject to the same regulatory constraints as a competing older technology, the answer should be reduced regulation of the older technology. However, positive contributions to network development by governments are important, especially in the area of universal service, international cooperation, content creation, training and development of education and health networks.
The most common policy issues dealing with the Internet today have been categorized in five separate sections below: costs and liberalization, infrastructure, management, content, and training. The sections identify the questions raised by the changing telecommunications environment, questions that the toolkit attempts to answer.
Costs and liberalization
Internet as a liberalized value-added service
Questions to be raised and debated about the basic nature of services offered by the Internet include:
• Should the Internet be considered a part of telecommunications network services or value-added services?
• Should the Internet fall into the existing regulations for telecommunications or for broadcasting?
• What are the benefits of liberalizing the Internet in my country? .
• Should organizations be allowed to run private Internet networks?
Although some African countries have already liberalized the Internet as a value-added service, many others have not. The toolkit clearly indicates that the Internet should be fully liberalized as a value-added service and the government should encourage the growth of the Internet by allowing private sector initiatives to flourish. The potential benefits of this liberalization are many. It will lower costs to consumers, generate more communication access points for the country, provide opportunities to create new services and job opportunities, and motivate entrepreneurs to construct communications networks.
International gateways
The next set of questions are concerned with restrictions that
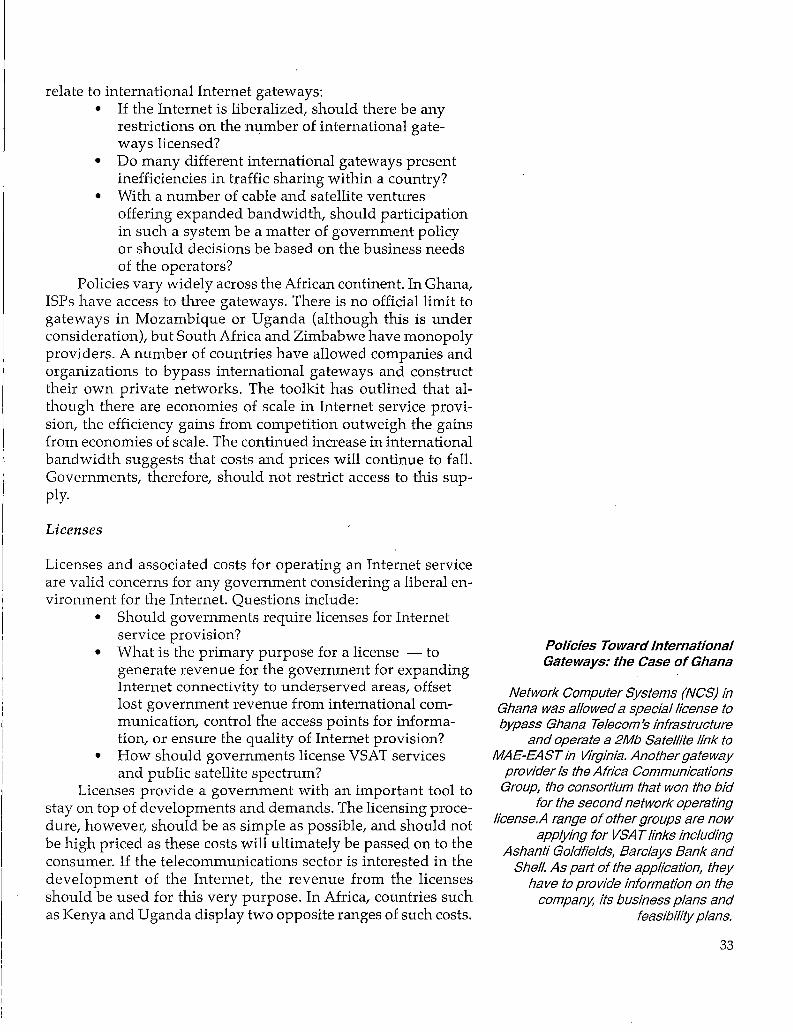
relate to international Internet gateways: • If the Internet is liberalized, should there be any
restrictions on the number of international gateways licensed?
• Do many different international gateways present inefficiencies in traffic sharing within a country?
• With a number of cable and satellite ventures offering expanded bandwidth, should participation in such a system be a matter of government policy or should decisions be based on the business needs of the operators?
Policies vary widely across the African continent. In Ghana, ISPs have access to three gateways. There is no official limit to gateways in Mozambique or Uganda (although this is under consideration), but South Africa and Zimbabwe have monopoly providers. A number of countries have allowed companies and organizations to bypass international gateways and construct their own private networks. The toolkit has outlined that although there are economies of scale in Internet service provision, the efficiency gains from competition outweigh the gains from economies of scale. The continued increase in international bandwidth suggests that costs and prices will continue to fall. Governments, therefore, should not restrict access to this supply.
Licenses
Licenses and associated costs for operating an Internet service are valid concerns for any government considering a liberal environment for the Internet. Questions include:
• Should governments require licenses for Internet service provision?
• What is the primary purpose for a license - to generate revenue for the government for expanding Internet connectivity to underserved areas, offset lost government revenue from international communication, control the access points for information, or ensure the quality of Internet provision?
• How should governments license VSAT services and public satellite spectrum?
Licenses provide a government with an important tool to stay on top of developments and demands. The licensing procedure, however, should be as simple as possible, and should not be high priced as these costs will ultimately be passed on to the consumer. If the telecommunications sector is interested in the development of the Internet, the revenue from the licenses should be used for this very purpose. In Africa, countries such as Kenya and Uganda display two opposite ranges of such costs.
Policies Toward International Gateways: the Case of Ghana
Network Computer Systems (NCS) in Ghana was allowed a special license to bypass Ghana Telecom's infrastructure
and operate a 2Mb Satellite link to MAE-EAST in Virginia. Another gateway
provider is the Africa Communications Group, the consortium that won the bid
for the second network operating license.A range of other groups are now
applying for VSAT links including Ashanti Goldfields, Barclays Bank and
Shell. As part of the application, they have to provide information on the
company, its business plans and feasibility plans.
33

Economic Toolkit for African Policy Makers
34
Kenya has a fixed license cost of US$10,000, as well as an additional US$5,000 and one percent of gross turnover as yearly costs. Uganda, on the other hand, has only a single fixed cost of US$1,000.
Costs of inputs.
Concerns about import duties and taxes give rise to the following questions:
• What is the appropriate tariff level for computers and networking equipment in Africa?
• What discounts should be given to educational institutions?
• What discounts should be given to other sectors of the economy?
The model suggests that net density is strongly correlated to the cost of Internet inputs such as computers and networking equipment. In order to expand Internet access in a country, governments should consider reducing tariffs on computer equipment. For instance, a reduction from 45 percent to zero on computer tariffs in Mozambique would decrease the cost of Internet access by more than 11 percent.
Table 4.1 describes the current tariff level of a number of countries in Africa. Some of the zeros in the table may indicate that although there is officially no import tax, there is a monopoly or quotas on the provision of equipment, so that governments control imports and prices more directly.
Infrastructure Table 4.1 Telephone Equipment and Computer
Import Duties and Taxes(%) Questions associated with government's role in developing Internet infrastructure are listed below.
Telephone Equipment
Import Sales
Ghana South Africa Ethiopia Mozambique Congo Kenya Nigeria Senegal Zambia Zimbabwe Uganda
duty tax
10 0 0
35 15 30 15 61 20
0 30
7.5
3 18
Computers
Import Sales duty tax
10 17.5 5
15 2 45 15 3 15 15 15 26 20 20 17
Source: World Trade Organization
• What are the consequences of allowing service providers to set up their own infrastructure?
• If there is a monopoly provision of infrastructure and some form of competition in other services, must the suppliers of the competitive services use the monopoly's infrastructure, or can they supply their own?
• If there is a monopoly provision of the local loop, should the use of radio technology for Internet in the local loop be considered part of the monopoly, or just one of the alternatives to the local loop?
• What are the rules under which private networks can operate?

Universal access
African countries have been far from successful in achieving universal service, and despite efficiency gai:r:is and falling costs, there is little hope of their reaching this goal in the near future. This emphasizes the importance of setting a more realistic goal of universal access. Here are some of the concerns linked with universal access to the Internet as opposed to universal service.
• What is the definition of universal access? • How does Internet affect opportunities for univer
sal access as interim measure to reaching the goal of universal service?
• Who should be made responsible for telecenter development and how should it be financed?
• How can telecenters be made sustainable? The concept of universal access for the Internet stipulates
that all citizens should be within a certain distance of a communication facility. Many countries have begun to encourage the development of infrastructure called telecenters to meet this goal. A telecenter is a community access structure where the fusion of telecommunications, information, multimedia and computing functions help address a variety of community problems and needs. Most telecenters charge the community a nominal fee for use of the facility. An example of a telecenter project is the one being undertaken by the Universal Service Agency in South Africa.
PTT competition
The success of the Internet is closely linked with competition in the provision of service. The questions that follow have direct significance for African PTTs.
• What is the impact of local telecommunication service competition on Internet growth?
• How can competition be encouraged? • What are the negative consequences of opening up
to competition too quickly? The toolkit demonstrates that competition in telecommu
nications services lowers the costs of Internet access to end users. This suggests that competition should be encouraged as a mechanism to reduce costs, provide technical innovation, improve quality of service to customers, and provide a greater variety of services. Local competition is likely to be a key policy instrument used by governments to expand affordable access to the Internet.
Universal Service in Developed Countries
Developed countries have been dealing with the· concept of universal service
diversely. In Canada, the Telecommunications Act requires that
reliable and affordable telecommunication services be
accessible in all regions of of the country, which allows flexibility to revise
universal service obligations in light of changing technologies and services. In
Denmark, the definition is more specific, citing in particular telephony
services, ISDN, and leased lines with a maximum of 2 Mbit capacity.
Telecenters in South Africa The Universal Service Agency is a statutory body established by the
Telecommunications Act of 1996. The job of the agency is to promote
universal access to telecommunications for all in South Africa. The Agency is
working with a number of different organizations such as schools, libraries,
churches, and existing community organizations to establish the
telecenters. In the first year of the project, 80 are being planned and an
additional 300 are forecast for the following year.
35

Economic Toolkit for African Policy Makers
36
Internet telephony
Full duplex telephone to telephone connections are available over the Internet today, but the regulatory questions about this have not yet been answered in all countries. Here are some concerns that may help to ensure best practice.
• How should Internet telephony be defined? • Should this service be considered voice traffic or
data traffic? • What is government's role in assuring quality of
service? Countries around the world have yet to determine how to,
or whether to regulate Internet telephony. Many countries have existing voice monopolies and as such would view Internet telephony as a breach of this monopoly. Others have taken no position, either because Internet telephony was not foreseen in current legislation or because of their already liberal markets.
International cooperation
The international presence of the Internet and its ability to enhance global solidarity and cooperation make the following questions pertinent for African countries.
• What role should governments play in developing regional cooperation and network extension across countries in Africa?
• What are the advantages a nation might find in synergy, greater participation in regional economies, improved personal and business communications, and expanded trade?
• What are the opportunities for regional standards structures to develop?
• How much could a regional backbone reduce costs to the end users?
One of the most important regional issues in which governments need to work together is the development of a regional Internet backbone. At the moment a majority of African ISPs must connect through a high bandwidth connection to the Internet backbone in the United States as there is no Internet backbone in Africa. In essence, Africans are paying United States ISPs so that the world is able to access Africans. Substantial savings and efficiency gains are possible if the African continent develops its own Internet backbone. Governments of African nations, therefore, should consider creating, with international cooperation, their own African Internet backbone.
Management
The Internet is a decentralized and distributed network of networks and thus inherently difficult, if not impossible, to control. There is no single organization that manages the Internet; rather, many individual networks cooperate to guarantee its success. The issue of domain name registration, however, is an area of Internet management in which governments might need to intervene.
Domain name registration
A controversial policy question in Internet management is the control of domain names - the brand names of the Internet.
In the U.S., Network Solutions Inc. (NSI) currently charges US$50 per year to register a domain name. A portion of this money goes to NSI to recover administrative costs and a portion goes into an "Internet Intellectual Infrastructure fund". But the existing registration process for generic top-level domains has generated substantial controversy. Some parties have objected to what they consider to be NSis monopoly control over a valuable resource, especially since an entity in the U.S. is responsible for assigning addresses with international ramifications. The International Ad Hoc Committee, comprising representatives from the Internet Society, International Telecommunications Union, the World Intellectual Property Organization and other groups, has issued a wide-ranging proposal to restructure the generic top-level domain name system.
In all countries outside of the U.S., the root domain has a country designation at the end, and one entity in the country is charged with distributing top level domain names. In some countries other bodies are charged with assigning lower level domain names such as .co for a private sector company, .school for an educational institution, and .org for an organization. Substantial debate has revolved around control of the top level domains in a number of African countries. The controversy centers around the question of whether domain name provision should be handled by a private entity or a government entity. For instance, Malawi and Zimbabwe have recently debated this issue.
Content
Content on the Internet and government's role in this area are major issues that cannot be covered adequately in this section of the toolkit. J?riefly, however, here are the major issues:
• What is government's role in legislating content on the Internet?
• What is government's role in protecting intellectual
37

Economic Toolkit for African Policy Makers
38
property rights? Are databases considered copyright material? What about software programs?
• Are the legal rationales for regulation of content in other media, such as scarcity of transmission capacity and invasiveness, applicable to the Internet?
All countries will have different laws governing issues such as acceptable content, intellectual property, and privacy. One area, however, in which government should focus its attention is the creation of local content. With an increase in relevant local content, it can be hoped that more users will use the Internet and the number of individuals contributing to its growth will increase. Governments can play a significant role in assisting with the computerization of government and public information. Also, the preservation of cultural heritage is an important area in which the Internet can be deployed to computerize, and thus share traditions that otherwise would be lost, forgotten, or at best retained by only a limited audience.
Training and human resource development
Training is one of the most important areas of investment for the future development of the Internet in Africa; it is also a pressing need that is not being adequately addressed. Here are some of the issues that need to be considered.
• What should be the government's role in the promotion of telecommunications training institutes and R&D centres?
• On which aspects of training should government focus its resources?
African governments need to invest in raising awareness of the benefits of the Internet across a broad range of sectors , including education, trade, agriculture, and health. In addition, training for end users in how to access and efficiently use the Internet, for system administrators in managing networks, and for content creators in development of data bases and web pages for accessing local content, all need to be emphasized.
In conclusion
For all of the policy areas listed above, the solutions will be different for each country. The toolkit's aim has been to provide a broad overview of the issues and work through some of the areas that need to be given extra consideration. In all cases local models for local needs will develop to address each country's specific and unique reality. But the Internet continues to expand globally, Africa must take advantage of the opportunities offered by the unique properties of this network of networks.
Bibliography
The CABECA study liberally referred to throughout the report has been documented in the following papers:
Asaba, K. J. F.; Bazirake Bamuhiiga, B. "Connectivity in Africa: use, benefits and constraints of electronic communication - Uganda Phase 1 and 2" (final version). Study carried out under the CABECA project of Padis as part of the IDRC sponsored research program on the Impact of information on development. Addis Ababa, UNECA/ PADIS, April 1998.
Chifwepa, V. "Connectivity in Africa: use, benefits and constraints of electronic communication - Zambia Phase 1 and 2" (final version). Study carried out under the CABECA project of Padis as part of the IDRC sponsored research program on the Impact of information on development. Addis Ababa, UNECA/PADIS, April 1998.
Diop, 0. La connectivite en Afrique: "Utilisation, avantages et contraintes des communications electroniques - Senegal Phase 1, 2" (version finale). Une etude realisee dans le cadre du projet CABECA de Padis sous l'egide du programme de recherche Impact de !'information sur le developpement finance par le CRDI Addis Ababa, UNECA/PADIS, Avril 1998.
Menou, M.J. "Connectivity in Africa: use, benefits and constraints of electronic communication - Synthesis Report, Part 1 and 2." Study carried out under the CABECA project of Padis as part of the IDRC sponsored research program on the Impact of information on development. Addis Ababa, UNECA/PADIS, May 1998. (In preparation).
Rorissa, A. "Connectivity in Africa: use, benefits and constraints of electronic communication - Ethiopia Phase 1 and 2" (final version). Study carried out under the CABECA project of Padis as part of the IDRC sponsored research program on the Impact of information on development. Addis Ababa, UNECA/PADIS, April 1998.
39

Economic Toolkit for African Policy Makers
40
Rorissa, A. "Connectivity in Africa: use, benefits and constraints of electronic communication - Results Obtained from a questionnaires survey of participants in the April 1995 Regional Symposium on Telematics for Development in Africa" (final version). Study carried out under the CABECA project of Padis as part of the IDRC sponsored research program on the Impact of information on development. Addis Ababa, UNECA/PADIS, April1998.
Other documents, Internet sites and papers used in the report are listed below:
Africa Internet Connectivity website (1998) http:// demi urge. wn.apc.org:80 I africa/ AfricaNET website http: I I www.fas.harvard.edu/-kbgandy / africanetlO.html
Antonelli, C. (1993), Investment, Productivity Growth and KeyTechnologies: The Case of Advanced Telecommunications, The Manchester School, LXI, 4 (December) 386-397.
Antonelli, C. (1996) The Network of Networks: Localized Technological Change in Telecommunications and Productivity Growth, Information Economics and Policy, 8, 317-335.
Aschauer, D. (1989) Is Public Expenditure Productive? Journal of Monetary Economics, XXIII, 177-200.
Blake, P. (1997) King of the Callbacks, Telephony, May 26. Bond, J. (1997), The Drivers of the Information Revolution - Cost
Computing Power, and Convergence in The World Bank, The Information Revolution and the Future of Telecommunications.
Canning, D. (1997a) A Database of World Infrastructure Stocks 1950-1995, mimeo, Harvard Institute for International Development.
Canning, D. (1997b) Does Infrastructure Cause Economic Growth? International Evidence for Infrastructure Bottlenecks, mimeo, Harvard Institute for International Development.
Canning, D. and Fay M. (1993) "The Effect of Transportation Networks on economic Growth," Discussion Paper Series, Columbia University Department of Economics.
Easterly, W. and Levine, R. (1996) Africa's Growth Tragedy: Policies and Ethnic Divisions, mimeo, World Bank.
Easterly, W. and Rebelo, S. (1993) "Fiscal Policy and Economic Growth: an Empirical Investigation journal of Monetary Economics, XXXII, 417-57.
Federal Communications Commission (1997) Report and Order In the Matter of International Settlement Rates, IB Docket No. 96-261, August 18.
Gebhardt, G. (1997) Proposed ISP Access Fees from an Economic Perspective Appendix to Reply comments to FCC Notice of Enquiry CC Docket 96-263.
Gilder, G. (1994) "The bandwidth Tidal wave", Forbes ASAP, Dec. 5
Hawkins, R. (1994) Computer Networking with Mozambique and its Relationship to the Bank's Strategic Objectives, World Bank, mimeo.
Hawkins, R. (1998) The Internet in Uganda, mimeo, World Bank, Washington.

Hirsch, A. (1998) Computer Training and Internet Access Issues in Wa, Upper West Province, Ghana, mimeo, World Bank, Washington.
International Telecommunications Union (1996) African Telecommunication Indicators, ITU, Geneva.
International Telecommunications Union (1997) Challenges to the Network: Telecoms and the Internet, ITU, Geneva.
International Telecommunications Union (1997) World Telecommunication Development Report 1996/7, ITU, Geneva.
Jensen, M. (1995) Telematics for Development: Discussion Paper http//www.sas.upenn.edu/African_Studies/Padis/ telematics_Jensen.html
Jensen, M. (1996) Bridging the gap in Internet Development in Africa http: I /www.idrc.ca/ acacia/ studies/ir-gaps2.htm#3.0
Jensen, M. (1997) Internet Connectivity for Africa: A UNIDO Study, Conference of African Ministers of Industry, Accra, Ghana, 1997. Network Wizards: http:/ /www.nw.com/zone/WWW /report.html
O'Neill, J. (1998) Africa: The New Telecoms Frontier in International Telecommunications Review. Euromoney, London.
OECD (1996) Information Infrastructure Convergence and Pricing: The Internet, http:/ /www.oecd.org/dsti/gd_docs/96_xxe.html
Operations Evaluation Department (World Bank) (1992) 1992 Evaluation Results, The World Bank, Washington DC.
Quaynor, N., Tevie, W. and Buley, A. (1998) The Expansion of Internet Backbone in Ghana, mimeo, Network Computer Systems, Ghana.
Saunders, R. Warford, J. and Wellenius, B. (1998) Telecommunications and Economic Development, Johns Hopkins, Baltimore.
United Nations Economic Commision for Africa Economic and Social Council (1996) Building Africa's Information Highway: The Case of Mozambique. Seventh Meeting of the Technical Thirty-First Session of the Commission, Addis Ababa, 30 April to 3 May.
USAID (1997) Model for Tariff Structure of an International Internet Gateway for Mozambique (spreadsheet and mimeo).
Wellenius, B. and others (1993) Telecommunications: World Bank Experience and Strategy, World Bank Discussion Paper 19.
World Bank (1996) Africa Regional Office, Internet Toolkit for Task Managers, Mimeo, March.
41

Economic Toolkit for African Policy Makers
Annex One: Results of the Model for Costs and Revenues from Communications
42
The Internet is likely to have a variety of effects - on users, ISPs, and telecommunications companies in Africa. Mere access to email would make an enormous difference to traditional data transmission and communication methods. In three minutes, a voice call can "transmit" two pages of information; a fax can transmit 10 pages of information; while, in the same time, a 28 k/ s modem is able to send an email of between 175 and 350 pages.
At such rapid speeds, email is a very attractive alternative to traditional modes of communication. However, it has high fixed costs: users require a computer and a modem in addition to a telephone, and there are costs of leasing, access, personnel and equipment of the ISP which are passed on to the user through Internet tariffs. All the same, once the equipment has been purchased and an email account paid for, the price of sending a single page across the country or around the world is the price of a few seconds long local call to the users' ISP. To send that page by fax may cost up to US$30 in Sub-Saharan Africa.
In response to these opportunities, users are likely to communicate more than they have done so far. They will email messages that they would not have bothered with if limited to voice or fax communication. But they will also substitute email for voice and fax communication, so reducing PTT revenues.
Of course, this exaggerates the scale of the problem for telecommunications companies.
First, home telecommunications companies have to pay the foreign company that provides service to the recipient an accounting rate fee for completing the international fax connection, so that gross revenues are higher than net revenues for international calls.
Second, the telecommunications company will gain revenues from the ISP, which has to lease lines and equipment to connect to the Internet backbone in the U.S., along with telephone lines to connect to customers. Further, email substitution will reduce pressure on international connections and regional trunks, reducing the need to invest in new trunk lines. However, as this need is chronic, and the effect of email on demand is unlikely to be that significant, this should provide little comfort to the region's telecommunications companies.
Third, this is likely to be a temporary problem, and one that

·-------------------
will lose its importance with the general increase in international traffic (outgoing traffic from Sub-Saharan Africa has increased from 322,000 minutes in 1990, to 449,000 minutes in 1994), and the changes underway due to political and technological pressures on the accounting rate regime.
Despite these ameliorating factors, however, email substitution will reduce African telecommunications company profits from outgoing calls, at least in the short term. Also, the companies will lose revenue they presently receive in the form of accounting rate charges for incoming calls when foreign customers email African countries instead of calling. These accounting rates are far above the real costs. For example, Cameroon's accounting rate with the U.S. is US$1.80 per minute, so that for every minute of incoming calls from the U.S., Cameroon's telecommunications company receives 90 cents (one half of the accounting rate, called the settlement rate). This compares to a local call rate of under three cents per minute. African telecommunications companies, that cross-subsidize the cost of phone installation and local calls using regional and foreign phone charge revenue, will find that an increasing number of users are using telephone lines mainly to make local calls to their ISPs, leading to large per line losses.
World Wide Web access presents its own set of problems. On the one hand, Web browsing involves long periods of local calling that offers revenue opportunities. Further, expanded Internet usage in the U.S. has seen approximately 10 million people ask for a second telephone line, which are cheap to install and profitable to offer. If this trend is repeated in Africa, telecommunications companies can expect to earn revenue from second line installation and rental. They can also lease lines to ISPs to handle the large quantity of data transfer that web access requires.
On the other hand, networks that were not designed to handle calls measured in hours rather than minutes can be overloaded by. Internet browsing, requiring the installation of new switch and transmit equipment. Whether this balance of problems and opportunities will lead to increased profitability or further losses depends very much on the assumptions made about network capacity and the pricing of telecommunications company services.
The following model explores the above issues. It was constructed to do two things. First, it measures the theoretical advantages (in reduced phone and/ or fax bills) to an individual subscriber, and revenue losses to a phone company from using email rather than phone or fax. This is calculated based on the number of pages of information sent. Second, it calculates ISP cost and revenue streams (based on a monopoly international hub), telecommunications cost and revenue streams, and user
43

I I
I I I
Economic Toolkit for African Policy Makers
Table A 1.1 Phone, Internet and Equipment Charges in Mozambique
costs and savings at various levels of Internet usage. Because of the assumptions and simplifications made, these estimates can be considered only very rough approximations to the real costs and benefits of the Internet to African users, ISPs and telecommunications companies.
• 3 Minute Local call
44
3 Minute Regional call 3 Minute International call (UK) Accounting Rate (/min) Web: Connection Web: Yearly fee Fax Machine Computer Modem
us$
0.04 0.60 7.65 1.19
10.00 600.00 400.00
1,300.00 175.00
Benefits to users
Table Al.1 lists phone and equipment charges for Mozambique (the Internet charges are regional equivalents). With these numbers, we can estimate the yearly cost of communication for users. In this run, we assume a four-year depreciation rate for computer equipment and a 20 percent cost of capital for users. We also assume that each user has to purchase a
computer to access the Internet. What are the fixed costs to each method of communication?
We have assumed that a telephone line is already installed (all compared systems would require a telephone, anyway). There is no extra equipment required to make a voice call, so the "fixed cost" of phoning is zero. The fixed cost to faxing information is the yearly cost of a fax machine allowing for depreciation and cost of capital. Here, it has been estimated to be in the region of US$155 per year. For email, the fixed cost is taken to be Internet access charges and the cost of a computer and a modem, allowing for depreciation and the cost of capital (or US$1,172 per year). Given that computers are useful for far more than Internet access, charging the entire cost of the computer against email fixed costs effectively overestimates this cost. Internet access as defined here also gives unlimited access to WWW, so that charging all of the cost of Internet access against fixed costs for emailing also effectively overestimates the fixed costs of emailing. The high cost of capital discriminates against emailing as a cheap communications option as well. Therefore, the fixed costs of emailing presented here are, if anything, exaggerated.
What are the costs of delivering this information per page? As mentioned above, a person can read out a page of information in about one and a half minutes. A fax can transmit the same information in about 18 seconds. A standard 28 k/ s modem should take around half a second to transmit the data. On the basis of data given above, we can calculate the approximate cost of sending a page of information by multiplying the number of pages by the amount of time taken in minutes, dividing by three and multiplying by the cost of a three minute call.
The actual time spent transferring data by email is probably shorter than the time taken to connect and disconnect from the email server. To calculate the yearly cost of emailing, then,

we have assumed that each business day it takes three minutes to connect, upload and download email, and disconnect. This gives a flat amount that emailers are likely to have to pay in telephone charges. For emailers dialing into a local ISP, this will amount to 260 multiplied by the cost of a three minute local call. For emailers dialing into an ISP in a different region of the country, this will amount to 260 multiplied by the cost of a three minute regional call. This is the only telephone charge that emailers will face - in that three minute period, they can download and upload their email for other regions in the country and for other countries in the world. Once again, charging all email telephone costs to local email (rather than dividing it up amongst local, regional and international) gives an exaggerated picture of the costs of local emailing.
As is clear from Table Al.2, email is not a great money saver on local calls in Mozambique. If a user talks on the telephone for about 250 hours a year (about an hour each business day), enough time to "speak" 10,000 pages, even over a local email service the difference between email and voice costs is a mere US$190. This is far less than the difference in fixed costs between voice and email ($1,172). Given that email and voice are not perfect substitutes, then, consumers will most likely continue to use local voice whenever it is preferable.
With regional calls, however, the savings are larger. Because the costs of email have all been accounted for, the cost of 10,000 pages of regional email is close to zero. This compares to a cost of US$3,000 forl0,000 pages spoken (in 250 hours). This difference is enough to pay for an emailer's computer, modem, Internet hookup and monthly fee, and regional connection to a server (total: US$1,328).
Table A 1.2 Non-Fixed Cost of Communication to User (US$)
On the other hand, a user would still be better advised to buy a fax machine, where the combined fixed costs and regional phone bill would come to just $755. Only a heavy user of regional telephony in Mozambique should buy a computer and hook up to the Internet purely to replace that service.
International communication is where the savings become impressive. Talking for about an hour each business day to the U.K. would cost a Mozambican businessman approximately US$38,250 per year. Faxing that information would still cost US$7,650. Again, taking all of the yearly costs associated witli. a regional Internet connection (US$1,328), and assuming that it is only used for international email substituting for fax traffic, the yearly savings amount to US$6,322. For example, a business with 10 staff members buys each one a computer, modem and Internet connection. Fixed costs rise by US$13,280 per annum. But if every employee substitutes
Pages Sent/yr
Local Phone Fax Email (local) Email (regional)
Regional Phone Fax Email (local) Email (regional)
International Phone Fax Email (local) Email (regional)
100
2 0
10 156
30 6 0 0
383 77
0 0
1,000 10,000
20 200 4 40
10 10 156 156
300 3,000 60 600
0 0 0 0
3,825 38,250 765 7,650
0 0 0 0
45

Economic Toolkit for African Policy Makers
Table A 1.3 Fixed Costs of Internet Access 10 minutes of voice traffic with the U.K. for email each business day, and one 10-page fax to the U.K. with email per day, telephone bill savings will amount to US$37,223, increasing profits by US$23,943 per year, or over US$2,000 per employee.
in Mozambique, per Year (US$)
Item
Computer Modem Web: Connection Web: Yearly Fee
Cost
1,300 175
10
Yearly equivalent
cost
507 68
2 600
% of total
43 6 0
51
How can email be made even more attractive? Presently, it is the high fixed costs of Internet access which make the system uneconomic for small users. These fixed costs come from two sources: ISP service and computer equipment. In turn, NCS Ghana (an ISP) estimates that 90 percent of its costs come from the expense of international connection, and a large percentage of the cost of equipment is
accounted for by import tariffs. Although telephone charges are not a particularly signifi
cant cost for email use, they do make a great deal of difference for a user's cost of full Internet access. A user, who accesses the WWW for one hour each business day, will have to pay approximately US$208 dollars per year in telephone charges if there is a local connection to an ISP available, or US$3,120 if Internet access is possible only through a regional call. Clearly, allowing low-cost telephone access to ISPs will be an important tool for encouraging wider Internet use.
Table A 1.4 Revenue to Telcos per Page (US$) Losses to PTTs
Pages Sent/yr 100
Local Phone 2 Fax 0 Email 10 Email (regional) 156
Regional Phone 30 Fax 6 Email 0 Email (regional) 0
International Out Phone 293 Fax 59 Email 0 Email (regional) 0
International In Phone 89 Fax 18 Email 0 Email (regional) 0
46
1,000
20 4
10 156
300 60
0 0
2,933 587
0 0
893 179
0 0
10,000
200 40 10
156
3,000 600
0 0
29,325 5,865
0 0
8,925 1,785
0 0
A major benefit of emailing over voice and fax communication is the savings made on telephone charges, which will have detrimental effects on telecommunications company revenue streams. For email, the only revenue to telecommunications companies comes from the daily call-up to deliver to, and receive messages from, the ISP.
For international calls, however, the picture is complicated somewhat by international accounting rates. This is a rate set between countries to compensate carriers in recipient countries for their part of the connection costs of a call originated in the other country. One half of the accounting rate (the settlement rate, in Mozambique's case about 60 cents a minute) is paid to the recipient carrier per minute of voice traffic received from the originating country. This reduces telecommunications company revenues for outgoing calls, but provides extra revenues from incoming calls. Because email bypasses the accounting rate regime, the telecommunications company receives no payment for incoming email. For a company that sends and receives 10,000 pages

of email each year, the loss to the telephone company amounts to US$7,650 in revenue per year if the email is substituting for fax and US$38,250 in revenue per year if the email is substituting for voice.
With the accounting rate calculation, it is possible to make a rough estimate of the lost profits from email substitution. The settlement rate is meant to compensate for the cost of delivering the traffic from half way between the countries to the recipient (the half circuit). In fact, accounting rates are known to be well above cost. However, they present an upper estimate of the cost of providing the connection. Three minutes of traffic at accounting rate cost equals US$3.57. The amount charged to Mozambican users is US$7.65, suggesting an approximate profit margin to the telephone company on outgoing calls of US$4.08, or 114 percent. Given that real upper-bound estimates of the costs to telecommunications companies of providing this service are estimated at closer to 30 to 40 cents per minute, profit margins rise to US$7.15 a minute.
Data based broadly on the Mozambique cost and price structure for Internet provision, telecommunications supply and equipment and usage levels, help to demonstrate the present and potential financial impact of the Internet on ISPs, telecom-munications companies and subscribers. ·
Minimizing the cost of the Internet
For greater detail on the information presented in the model below, see Annex 6. Data and estimates on the number of subscribers, the average length of an email and average levels of Internet use were provided by UEM. Estimates on the average number of email sent and received and their destination come from the CABECA survey, which was also used to estimate the percentage of email that replaced other methods of
Usage statistics Number of Internet subscribers Proportion web subscribers with local access Av. subs. Hours of web access/year
Average User Average number of emails sent/year Average number of emails received/year Average length of email (pages) % email replacing fax % email replacing phone % email local destination % email regional destination % email international destination
3,500 0.90 100
240 200
4 25 10 10
5 85
47.

Economic Toolkit for African Policy Makers
48
PTT Charges to ISPs
License PTT charge for 64 kbs of LL/Satellite
0 6,000
communication as opposed to being messages that otherwise would not be sent.1
There is no license charge for running an ISP in Mozambique
PTT Details (US$)
Cost per main line, initial Cost per main line, recurring Cost of installing second (and subsequent) lines Cost per second main line, recurring Cost of switch and transmit, initial Cost of switch and transmit, recurring Cost of 64 kbs of LL/satellite provision
4,500 600 500 600
1,125 188
4,800
and the costs of a 64 kps leased line (from within the capital to the international gateway) is a surprisingly low $6,000 per year.
PTT costs are all estimates based on World Bank data and author calculations.
ISP running costs are estimated from USAID data on Mozambique. It should be pointed out that these costs are for a monopoly provider. Presently, there are three ISPs in Mozambique, which together provide access for 3,500 subscribers and only two of which utilize the low-cost international access provided by the Leland link. The largest provider, UEM, does not use the Leland link because of concerns about the quality of the leased line to the link provided by the Mozambican PTT.
It should also be pointed out that this ISP model probably underestimates the cost of labor and of marketing. Below are the cost breakdowns for three U.S. Internet providers and the comparative breakdown for the model presented in this chapter. The cost structure of a U.S. ISP is as follows:
1. Cost of revenues (for ISP) is comparable to the cost of .goods sold by a manufacturing company. This figure represents the cost of producing the service. Depreciation can be part of this cost, although
1 It should be noted that the traffic data is unclear. First, we do not know if the users followed the rules and ignored mass-mailings when calculating the number of emails sent and received.

Expenditure Breakdown of U.S. Internet Service Providers
America On Line costs and expenses (US$ 000) 1996
costs of revenues 627,372 61% marketing 212,710 21% general and administrative 110,653 11% depreciation and amortization 7,078 1% equipment lease 0 0% product development 53,817 5% non recurring items
r 0 0%
Acquired Research and Development 16,981 2% Total costs and expenses 1,028,611 100%
Netcom costs and expenses (US$ 000) 1996
costs of revenues 88,369 52% marketing 51 ,237 30% general and administrative 23,610 14% depreciation and amortization 0 0% equipment lease 0 0% product development 6,020 4% non recurring items 0 0% Acquired Research and Development 0 0% Total costs and expenses 169,263 100%
Californian ISP costs and expenses (US$) 1997
costs of revenues 497,729 33% marketing 278,505 19% general and administrative 674,960 45% depreciation and amortization 37,429 0% equipment lease 0 0% product development 0 0% non recurring items 0 0% Acquired Research and Development 0 0% Total costs and expenses 1,488,623 100%
African ISP (in main model) costs and expenses (US$) 1998
costs of revenues 83,520 62% marketing 5,043 4% general and administrative 17,340 13% depreciation and amortization 28,933 21% equipment lease 0 0% product development 0 0% non recurring items 0 0% Acquired Research and Development 0 0% Total costs and expenses 134,836 100%
Source: Anat Bernstein-Reich, 1998
49

Economic Toolkit for African Policy Makers
50
many companies list their depreciation and amortization in a separate account. The cost of revenues includes direct labor, direct overhead and any other direct cost. Most U.S. ISPs and OLSPs (online service provider) have about 40 to 60 percent of their costs accounted for by costs of revenues. African ISPs are likely to face higher costs because of their higher costs of equipment, financing and communications in the region.
2. The sales and marketing cost is a component that should not be neglected. In the U.S., marketing expenses account for 20 to 30 percent of total costs. A large percentage of these costs is attributed to the high comp~tition that exists among ISPs. A marketing budget is important for Africa not necessarily because it can help overcome the competition (although this might become increasingly important), but because it may be used as a tool to encourage Internet use and increase Internet penetration. These costs are not properly accounted for in the main model, and the model might, therefore, underestimate the long term costs of Internet service provision in Africa.
3. The research and development account of the OLSP is much higher than that for the simple ISP in the U.S. Unlike ISPs that provide simple connectivity, the OLSP provides content and other Internet applications as well. This requires the companies to invest in product development and content. African ISPs are also likely to have to develop content because of the language issues and the need for local content. Again, this is a cost not accounted for in the main model.
Despite these problems, we believe that the model offers a
ISP Details (US$)
Administrative computer cost Other basic computer costs Setup for Leased line/VSAT Other setup costs Foreign telco charge for 64kbs VSAT/LL Internet backbone connection Recurrent salary and maintenance
55,000 1,000
0 17,800 24,000
0 21,000

Assumptions
Number of subscribers to each computer Email is accessed every business day for X minutes Average second line for web per subscriber= X In hypothetical ISP income streams, user support (per user) costs $X per year In hypothetical ISP income stream, one extra ISP phone line per X web subscribers In hypothetical ISP income stream, one extra ISP computer per X web subscribers In hypothetical ISP income stream, 64kbs of outside link for each X subscribers In hypothetical ISP income stream, each new subscriber requires X new switches Replacement of computer goods after X years Replacement of telecoms equipment after X years Replacement of other goods after X years Real cost of capital for telco = X% Real cost of capital for subscriber/ISP = X%
Telco YRC rate for telco.s equipment= User YRC rate for computer equipment= User YRC for other equipment=
YRC = yearly return to capital
reasonably good estimate of ISP costs and telecommunications company revenues from ISPs.
Assumptions necessary to the model are based on a range of sources and estimates. Here, it should be noted that, as opposed to the results above, the assumption is that subscribers share computers.
In the Mozambican case, the primary source of telecommunications company revenues from the Internet is the extra user traffic. This new traffic will be driven by the use of WWW, and not email. In Mozambique, the total user access to the Internet adds US$760,000 to phone bills. A monopoly ISP would pay a surprisingly small amount to Mozambique Telecom (US$36,600). This is both because there· is no ISP license charge in the country, and because most payments for international access go to the Leland link, rather than the Mozambique PTT. Further, leased lines in Mozambique, at only US$6,000 for a connection to the Leland link, are very cheap.
In Kenya, on the other hand, where a 64k international leased line connection costs US$177,000, ISP costs would be a more significant percentage of total telecoms revenues (although still smaller than user access). This also has a significant impact on ISP profits. The relatively low cost of international Internet connectivity, and the relatively low need for bandwidth because of low usage, reduce dramatically the most significant portion of an ISP' s costs in Mozambique. Although telephone, leased line, satellite ari.d Internet connections account for about 48 percent of the ISP's budget when it has 3,500 subscribers, this is
3 3
0.05 10 20
1,000 1,000
0.01 4
10 10
0.10 0.20 0.16 0.39 0.24
51

Economic Toolkit for African Policy Makers
Mozambique International ISP Telco Revenue Gained from Internet Use
Subscriber New lines Subscriber Extra traffic ISP License ISP Subscriber lines ISP lntnl. Connection TOTAL
12,600 759,360
0 12,600 24,000
808,560
Equipment Yearly inet + telecoms Salary and maintenance
Web revenue
Profit/loss
89,616 134,490 56,000
2, 107,000
1 ;826,894
Telco Revenue Lost From Internet Use
International Calls Out International Faxes Out International Calls In International Faxes In Regional Calls Regional Faxes Local Calls Local Faxes TOTAL
52
732,832 366,416 179,303
89,652 4,410 2,205
588 294
t,375,700
Subscriber Costs, Savings
Equipment Internet Access Subscriber New Lines Subscriber Extra Traffic
Telephone savings
664,739 2,107,000
12,600 759,360
1,441,298
significantly below what might be expected in Africa as a whole. This allows for the possibility of making huge profits at a US$600 yearly ISP subscription charge. A monopoly provider would be making excessive returns if it faced this hypothetical environment. On yearly outlays of US$280,000, such a company would be making revenues of over US$2 million. In part, this is because of returns to scale, but only in part. The estimated fixed costs for a Mozambican ISP would amount to approximately US$77,000 a year. More significant is that a company with such comparatively low costs of international access, low demand for bandwidth (an average of only 64kps for each 1,000 customers), and an equally low demand for ISP computing power, faces very low costs overall. This makes it a strong argument for competition to force down prices charged by an ISP.
The primary source of revenue loss through substitution for telecommunications companies is from the decline in outgoing international telephone traffic. Email substituting for voice and fax calls deprive the Mozambique PTT of more than a million dollars each year, or about 1.5 percent of revenue. Lost revenue from settlement rate payments not made because of incoming communication substitution adds a little over another quarter of a million to the revenue losses.
The major cost for subscribers is Internet access which includes both ISP and PTT charges. Together, at a cost of approximately US$3,000,000 (or US$820 per head), these figures dwarf that for the annual cost of equipment (assuming three subscribers to each computer): US$190 per subscriber per year. Again, it

Scenario Web Web Ave user Foreign connection yearly fee hrs of charge for
1 10 600 100 24,000 2 10 600 100 24,000 3 10 600 100 170,000 4 10 600 100 170,000 5 10 600 260 170,000 6 0 168 100 24,000 7 0 168 100 150,000
appears that lowering the cost of telephone and Internet access is probably the most significant thing that countries can do to encourage users to access the new technology.
By changing some of the underlying assumptions of the model, it is possible to see the impact on ISP revenues. The first scenario presents the base scenario, which suggests very large profits for the hypothetical ISP. The second scenario is that the ISP brings up its Internet access standards to international norms, and that a 64 kps line is sufficient for 10 people to be on line at any one time. Given average use of 100 hours per year, the average user is online 0.115 percent of the time, suggesting that, at average loads, a 64 kps bandwi.dth is satisfactory for 874 subscribers. Figures from NCS in Ghana suggest that peak hours see up to three times the number of people on line than the average load. To provide a good quality of Internet access, therefore, 64kps of bandwidth is required for at least every 400 subscribers. Altering this assumption reduces ISP profits, but because international bandwidth is so cheap, profits remain extremely healthy.
In the third scenario, the cost of international bandwidth is raised to US$170,000 for 64 kps. This is similar to prices paid by ISPs in other countries, including Kenya. Raising the price of connectivity at the present level of service reduces prices
ISP computer
1,000 400
1,000 400 150 400
1,000
more significantly, bringing down ISP profits to 1.2 million at the present level of usage.
Scenario ISP Profits (US$) at Number of Users
If both the level of service and the cost of connectivity are increased (scenario 4), profits for a monopoly provider charging US$600 per year for access fall to 0.26 million, or about 12 percent of revenues. If subscribers begin
1 2 3 4 5 6 7
O users
-76,961 -76,961
-222,961 -222,961 -222,961
-76,961 -202,961
1,000 users
558.982 456,490 412,982
18,490 -770,493
-25,510 -49,018
3,500 users
1,826,894 1,570,665 1,242,894
256,665 -2,702,024
51,665 -196, 106
ISP 64 kps for X users
1,000 400
1,000 400 150 400
1,000
10,000 users
5,820,509 5,051,820 4,360,509
401,820 -6,882,507
231,820 -259,491
53

The Costs and Revenues from Internet Communication
(C:\charles\cost2.xls)
Phone Charges, US Dollars
Installation (business)
Yearly rental (business)
3 Minute local call
3 Minute regional call
3 Minute International call
(UK) Accounting Rate (/min)
Internet Charges
Equipment
Web: Connection
Web: Yearly fee
Fax Machine
Computer
Modem
Usage statistics
Number of Internet subscribers
Proportion web subscribers with local access
Av. subs. Hours of web access/year
Average User
Average number of emails sent/year
Average number of emails received/year
Average length of email (pages)
% email replacing fax
% email replacing phone
% email local destination
% email regional destination
% email international destination
PTT Charges to ISPs
License
PTT charge for 64 kbs of LUSatellite
108
61
0.04
0.60
7.65
1.19
10
600
400
1,300
175
3,500
0.90
100
240
200
4
25
10
10
5
85
0
6,000
55
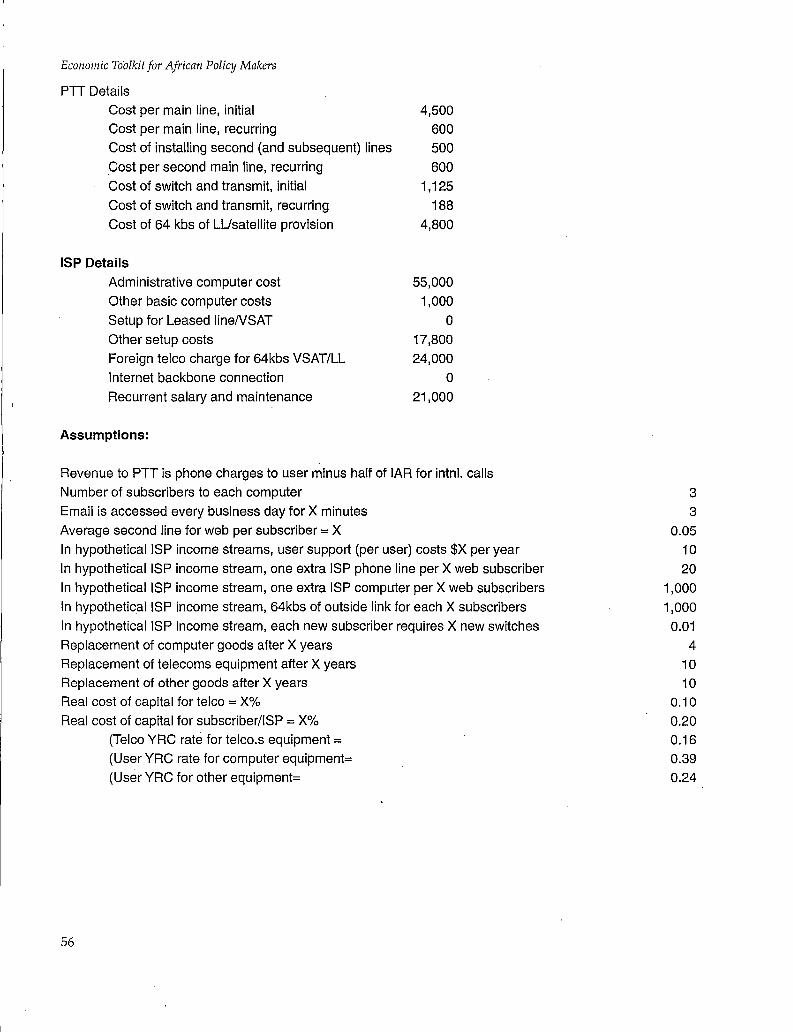
Economic Toolkit for African Policy Makers
PTT Details
Cost per main line, initial 4,500
Cost per main line, recurring 600
Cost of installing second (and subsequent) lines 500
Cost per second main line, recurring 600
Cost of switch and transmit, initial 1, 125
Cost of switch and transmit, recurring 188
Cost of 64 kbs of LUsatellite provision 4,800
ISP Details Administrative computer cost
Other basic computer costs
Setup for Leased line/VSAT
Other setup costs
Foreign telco charge for 64kbs VSAT/LL
Internet backbone connection
Recurrent salary and maintenance
Assumptions:
55,000
1,000
0
17,800
24,000
0
21,000
Revenue to PTT is phone charges to user minus half of IAR for intnl. calls
Number of subscribers to each computer
Email is accessed every business day for X minutes
Average second line for web per subscriber = X In hypothetical ISP income streams, user support (per user) costs $X per year
In hypothetical ISP income stream, one extra ISP phone line per X web subscriber
In hypothetical ISP income stream, one extra ISP computer per X web subscribers
In hypothetical ISP income stream, 64kbs of outside link for each X subscribers
In hypothetical ISP income stream, each new subscriber requires X new switches
Replacement of computer goods after X years
Replacement of telecoms equipment after X years
Replacement of other goods after X years
Real cost of capital for telco = X%
Real cost of capital for subscriber/ISP = X%
(Telco YRC rate for telco.s equipment =
(User YRC rate for computer equipment=
(User YRC for other equipment=
56
3 3
0.05
10
20
1,000
1,000
0.01
4 10
10
0.10
0.20
0.16
0.39 0.24

User Savings and Telco Revenues per Page
LOCAL REGIONAL (Extra)
Pages SenVyr 0 100 1,000 10,000 100 1,000 10,000
Cost to user, per year
Phone 0 2 20 200 30 300 3,000 Fax 155 155 159 195 6 60 600 Email (local) 1,172 1,182 1,182 1,182 0 0 0 Email (regional) 1,172 1,328 1,328 1,328 0 0 0
Revenue to PTT from user per year
Phone 0 2 20 200 30 300 3,000 Fax 0 0 4 40 6 60 600 Email (local) 0 10 10 10 0 0 0 Email (regional) 0 156 156 156 0 0 0
INTERNATIONAL (Extra)
Pages SenVyr 100 1,000 10,000
Cost to user, per year
Phone 383 3,825 38,250 Fax 77 765 7,650 Email (local) 0 0 0 Email (regional) 0 0 0
Revenue to PTT from user per year
Phone 293 2,933 29,325 Fax 59 587 5,865 Email 0 0 0
Email (regional) 0 0 0
Pages Rec.d/yr 100 1,000 10,000
Revenue to PTT from sender per year
Phone 89 893 8,925
Fax 18 179 1,785
Email 0 0 0
57

Economic Toolkit for African Policy Makers
Telco. Revenue Gained
Subscriber New lines
Subscriber Extra traffic
ISP License
ISP Subscriber lines
ISP lntnl. Connection
TOTAL
Telco. Revenue Lost
International Calls Out
International Faxes Out
International Calls In
International Faxes In
Regional Calls
Regional Faxes
Local Calls
Local Faxes
TOTAL
Total Web Revenue Effect
TOTAL
International ISP
Equipment
Yearly inet + telecoms
Salary and maint
Web revenue
Profit/loss
Subscriber Costs, Savings
Equipment
Internet Access
Subscriber New Lines
Subscriber Extra Traffic
Telephone savings
Total Cost
58
12,600 759,360
0 12,600
24,000
808,560
732,832 366,416
179,303 89,652
4,410
2,205
588 294
1,375,700
-567,140
89,616 134,490
56,000
2,107,000
1,826,894
664,739 2,107,000
12,600
759,360
1,441,298
2,102,401 I
Subs. 0 1,000 3,500 10,000
ISP, hypothetical cost/revenue
cost 76,961 91,018 280,106 679,491
revenue 0 650,000 2, 107,000 6,500,000
profit -76,961 558,982 1,826,894 5,820,509
Telecom. Income, Revenue
revenue 6,072 230,160 808,560 2,301,600 cost 6,132 76,247 270,267 766,080
substit. 0 393,057 1,375,700 3,930,570
profit b. -60 153,913 538,293 1,535,520 profit a. -60 -239,144 -837,407 -2,395,050
Users, Costs, Benefits
cost
substit. 0 1,012,485 3,543,699 10, 124,855 0 411,800 1,441,298 4,117,995

Annex Two: Calculation of Telecommunications Revenue Lost to Substitution Using FCC Data
A second simple way to estimate the approximate losses to telecommunications companies from international substitution is presented below. We have already presented estimates for the amount of incoming and outgoing telephone and fax traffic the average user substitutes with email. The FCC, as part of its attempts to put downward pressure on international accounting rates, has estimated the real cost per minute for countries to terminate an international call (the "half circuit cost") for a range of countries. This will be broadly the same as the cost of originating the call (both halves of the circuit are identical). In Africa, numbers are presented for Kenya (42.6 cents/minute) and South Africa (16.9 cents/ minute). Despite methodological problems with the FCC' s calculations, these numbers should approximate the real costs of completing a call. We also know the accounting rate and the international call charges of a range of African countries. With all of this data, we can estimate the amount of profit (revenue minus cost) that telecommunications companies lose from each email user each year (using the Kenya number as an upper bound of costs and South Africa as a lower bound). This leads to the figures below:
Table A2.1 Lost Profits to International Email Substitution
Country Estimated 3 minute Accounting Lost profit/yr number of international rate with (US$) (low)
subscribers call (US$) US$/min
South Africa 700,000 4.58 1.00 31,943,473 Zimbabwe 8,000 7.50 0.75 913,070 Mozambique 2,750 7.65 1.19 316,384 Ghana 4,000 7.50 1.00 450,785 Ethiopia 1,000 4.80 1.80 46,086
Lost profit/yr (US$) (high)
n.a. 1, 172,742
405,646 580,621 78,545
Revenue Lost profit as /yr ($m) %revenue
3674.7 0.87 146.2 0.80
62.6 0.65 65 0.89 72.3 0.11
59

Economic Toolkit for African Policy Makers
Annex Three: The Relationship between Communications Liberalization and Internet Pricing and Penetration
60
A recent study by ITU, Cha1¥!1g~§_jo the N~tivork: Telecoms and t_he In~~rnet (1997), arguec!, that the following factors are signifieantly-::-co:i;related with global Internet :E'enetra!ion: wealth, the qua!}-tit_z_and the qu~lity of telecommunications eg,uiEment, the number of PCs, low telephone and Internet charges, language, literacy and trai!i.ing.
-- ~--Concentrating on the link between policy and Internet growth, an attempt was made to explore in different ways the relationship between telecommunications liberalization,~nology friendly" policy~gim-es, and the ~nd-extenLof Interne±_E~_c_es_s in Afr_ica. Three differen!sets of data are presented below, which suggest the existence of such a relationship, and its positive nature.
The first takes two different measures of sector liberalization: one from World Bank datc.i._ (Biirfill,1997), ari:d'''TI!le1rom O'Neill's article onAfrica: "The New TelecomsFrontier" (1998). TaBie A3.1 lists this data for all Sub-Saharan African countries wherever information was available. The first column presents a private involvement index, based on O'Neill's report on the state of private involvement in African countries at the start of 1998. Countries receive one point for each of the following: new telecommunications laws and regulations; introduction of private investment into non-basic services excluding cellular; introduction of private investment into basic services (planned by the end of 1998 or already carried out); introduction of private investment into cellular services.
The second index measures a broader definition of liberalization from World Bank data at the start of 1997. Countries are given one point for each of seven stages:
• liberal CPE trade; • separate posts and telecommunications; • independent regulator; • reform in progress (or announced); • new sector law/ private cellular; and • privatized telecommunications company.
The table then lists two basic features of the economy that are likely to be connected with the scale of Internet penetration - population and GDP per capita (data from the ITU Yearbook). The next column estimates the number of host sites in the country, using information from the Network Wizards site,

www.nw.com. However, it should be noted that Network Wizards have changed their method of counting host sites, so that the data between 1998 and previous years are not strictly comparable.
Access prices come from the list of recommended ISPs in African countries, from the 1997 UNIDO study of Internet connectivity in Africa. The next two columns measure the monthly cost of web access per page as calculated for two levels of usage (measured in terms of pages per day) by Jensen. The next column measures the age of Internet access in a country, with a score of one indicating that there was TCP /IP connection at the end of 1995 (from the ITU yearbook). The final column indicates
Table A3.1 African Telecoms Liberalization and Internet Access
Liberalization Index Economy Hosts Monthly Cost (US$)
1998 private 1997 10 50 involvement liberalization population GDP/capita 1998 pages/day pages/day
Angola 1 1 10.8 997 4 149 149 Benin 1 1 5.5 290 13 25 25 Botswana 2 4 1.4 2905 550 23 23 Burkina Faso 0 2 10.4 153 45 24 24 Cameroon 1 3 13.3 454 2 20 20 CAR 1 2 3.3 303 0 27 27 Chad 1 2 6.5 124 0 47 47 Congo-Brazzaville 1 5 2.7 627 4 139 139 Cote d'Ivoire 4 7 14.2 487 253 33 33 Djibouti 1 2 0.6 835 0 198 198 Ethiopia 2 4 57.0 86 78 100 100 Gabon 2 2 1.3 3812 0 137 137 Ghana 3 7 17.1 320 252 51 51 Guinea 2 5 6.6 539 0 27 27 Kenya 3 3 27.0 267 458 75 75 Lesotho 1 0 2.8 444 0 61 152 Madagascar 4 5 13.5 215 17 20 20 Malawi 1 2 9.7 120 0 32 32 Mali 0 3 9.8 196 0 166 778 Mauritius 2 6 1.1 3134 201 17 17 Mozambique 3 4 17.4 87 69 20 20 Namibia 1 5 1.6 1923 640 56 56 Nigeria 3 4 111.3 412 49 17 39 Senegal 4 6 8.4 479 117 20 20 Sierra Leone 1 3 4.5 178 0 238 238 South Africa 3 5 41.5 2923 122025 14 14 Swaziland 0 1 0.9 1077 330 57 58 Tanzania 4 6 29.7 124 25 50 50 Togo 0 3 4.1 243 37 95 95 Uganda 3 3 19.0 244 30 29 29 Zambia 4 4 9.4 330 181 25 25 Zimbabwe 2 2 11.0 444 599 6 23
Avera e g 1.9 3.5 14.8 774 3937 62 86
Internet Access
number of
yes/no providers
1995 1997
0 4 0 1 0 4 0 3 0 3 0 1 0 2 0 1 1 3 1 1 1 4 0 1 1 7 1 1 1 10 0 1 0 3 0 2 0 4 0 6 0 3 1 2 0 7 1 4 0 2 1 46 1 1 0 5 0 2 1 4 1 2 1 10
0.41 5
61

Economic Toolkit for African Policy Makers
Table A3.2 Telecoms Liberalization and Internet Access in Sub-Saharan Africa
Average
Liberalization Index Economy Hosts Monthly Cost ($US) Internet Access
199 8 private involvement
1.9
0 1 to 2 3 to 4
number of 1997 10 50 yes/no providers
liberalization population GDP/capita 1998 pages/day pages/day 1995 1997
0 to 3 4 to 7
3.5 13.9 705 128 64.00 87.97 0.39 3.35
2.3 6.3 417 103 85.50 238.75 0.25 2.50 2.9 8.2 1013 123 76.59 82.94 0.29 2.71 4.9 26.7 297 145 34.00 36.20 0.60 4.80
8.3 599 89 81.53 123.94 0.29 3.06 20.8 833 174 42.71 44.29 0.50 3.71
':tf""fi?e number of providers present in 1997, again from Jensen (1997).
If we take average values for less and more liberal countries excluding South Africa (see Table A3.2), it becomes clear that more liberal regimes have, on average, more and cheaper access to the Internet. Although, countries such as Burkina Faso, with cheap access but a very illiberal telecommunications market, suggest the relationship is far from perfect. According to both liberalization measures, countries with a more open telecommunications sector have more host sites, lower monthly nternet charges and a greater number of providers. Table A3.3
suggests that competition in Internet service provision is also associated with higher rates of Internet penetration and lower costs. Of course, this correlation between liberalization in telecommunications and Internet provision and the extent and cost of access does not necessarily prove causation. In particular, it is difficult to disentangle the separate impact of liberalization of Internet access and that of the telecommunications sector more generally.
Further, countries with more liberal telecommunications and Internet markets tend to be more populous (with an average population of 21 million as compared to 8 million for less .JiQei;a~arkets). We have seen elsewhere that there does appear
Table A3.3 ISP Competition and Internet Access in Sub-Saharan Africa
Number of ISPs Liberalization Index Economy Hosts Monthly Cost ($US)
1998 private 1997 population GDP/capita 1998 10 pages/day pages/day
involvement liberalization
One 1.13 2.25 3 991 43 83.88 95.38 More than One 2.13 3.87 18 605 157 57.09 85.39
62

,,,..--------~~ .
to be some economies of ~,e;.in Internet provision, Table A3.4 Telecoms Liberalization and so it is possfole-tharsmaller countries are less able Costs of Internet Access, 1997 to take advantage of the benefits of competition without losing these economies of scale. One argument against this interpretation is that countries with the greatest private involvement (scoring three
11to four on O'Neill's index) have the lowest GDP per capita of the group ($297 per year). Despite their larger populations, they have smaller total GDPs than the group that scores one or two on the private involvement index. This suggests that scale economies cannot explain lower costs or the number of providers in the more liberal telecommuni-
Liberalization 1998 private involvement
cations environments. The data provide enough evidence to suggest that liberalization is a boon to the spread of the Internet in Africa.
The method of calculating the cost of Internet access above excludes one important component of the cost of access: the price of calling the ISP. Table A3.5 is based on a broadly similar methodology to the OECD' s Report on Information Infrastructure Convergence and Pricing (1996), which is the source of the OECD data reported in the table. Data on the pricing policies of African ISPs are from Jensen (1997), data on PTT pricing are taken from the ITU (1997). The price per month for Internet access is calculated as follows: The ISP connection charge divided by 36, the monthly charge, and any extra charges that apply to 20 or 30 hours of use. The PTT charge is the telephone connection charge divided by 60, the monthly charge for a telephone and the cost of 20 or 30 hours of local calls (multiplied up from the threeminute local call rate reported by the ITU). African countries in gray in the table have comparatively "liberal" telecommunications sectors, scoring more than three on the liberalization index based on World Bank data.
In the OECD, seven out of the eight countries with telecommunications infrastructure competition had cheaper than average total access charges while 12 of the 17 countries without competition were above the same benchmark (OECD, 1996) .
. These results are mirrored in estimates for African Internet provision. Some African countries provide very competitive Internet access as compared to the OECD (although it should be noted that the calculation does not follow exactly the same methodology). Botswana, Ghana, Lesotho, Namibia, Senegal and South Africa, all provide~cheaper overall Internet access than the OECD average, for example. On the other hand, closed telecommunications regimes in Africa provide 30 hours of Internet access at more than twice the OECD average cost. Only one closed regime provides cheaper Internet access than the OECD average - Lesotho. Lesotho appears to benefit from its proximity to the
0 1 2 3 4
Monthly Cost ($US) 1 O pages/day 50 pages/day
85.50 90.18 51.67 38.40 29.60
238.75 98.45 54.50 42.80 29.60
63

Economic Toolkit for African Policy Makers
Table A3.5 The Price of Internet Access in Sub-Saharan Africa and the OECD
64
AFRICA Angola Benin
'"·: .:;;~:;"':''~' ;-
Kenya Lesotho
',::·{~~~~ii0s'•'',' :,
,"'if f~Ahl2~' ':;:::·f~,~:~.~rii$.·,··•·•.,.::•,y·
Togo Uganda Zambia.<··
Average Closed Liberal
OECD France Japan Mexico Portugal UK us
OECD Average
ISP charge/month 20 hrs 30 hrs
155 127
115 139 97
61 110 80 42 15 21
66
223 181
137 176 109
91 110 80 67 15 21
82
PTO charge/month 20 hrs 30 hrs
147 63
60. 74 50
45 33 32 56 66 11
42
165 89
84 101 71
64 44
112 75 90 n
56
Total (ISP+PTO) 20 hrs 30 hrs
301 190
175 213 147
107 142 112 98 81 32
108
387 270
221 277 mo
156 153 192 142 104 32
138

efficient (and large) South African telecommunications market. Open telecommunications regimes in Africa appear to provide both cheaper ISP charges and cheaper PTT charges. This suggests that market efficiencies rather than rebalancing lead to cheaper access.
Statistical analysis of the determinants of Internet penetration in Africa (this time including South Africa) confirms this finding. Running a regression of Internet hosts in each country against a constant and population (regression 1), there is a positive relationship, but it is insignificant. Replacing population with GDP produces a strong positive relationship which is highly significant (regression 2). Undoubtedly, then, wealth plays a large role in determining the extent of Internet penetration in Africa. However, replacing GDP with number of computers (regression 3) produces an even better fit - the number of computers in a country explains 85 percent of the variation in the number of Internet hosts. This is a result that echoes one found by the OECD (1996) for richer countries and by the ITU with a global sample (1997). When entered with GDP per capita, the number of computers in a country remains significantly correlated with Internet penetration, whereas GDP does not (regression 4). The number of personal computers and population, when entered together in a regression (5), account for 98 percent of the variation in the number of Internet hosts in the 16 African countries for which we have data. It has to be assumed that the number of computers per capita is proxying for a technologyfriendly environment in general. This suggests that, while wealth is undoubtedly one important determinant of such an environment, even poor African countries can encourage far wider Internet penetration by becoming more technology friendly.
However, it should be pointed out that these results will be driven largely by South Africa. Further, regressing the number of Internet hosts per capita against variables, found GDP per capita a stronger determinant of Internet penetration than computers per capita. Regressions of Internet hosts per capita against GDP per capita and the cost of a local call, percentage of lines that were digital, main lines per capita, modems per capita or minutes of outgoing calls as percentage of incoming calls, found all variables except GDP per capita insignificant.
65

Economic Toolkit for African Policy Makers
Table A3.6 Determinants of Internet Penetration in Sub-Saharan Africa
Independent variable is number of Internet hosts in each country, 1995
1 2 3 4 5
Constant 49.9 -2904 -3946 -4425 2522 0.02 -2.30 -1.42 -1.35 2.12
Population 0.00014 -0.00038 1.41 -9.84
GDP 5.90E-07 7.80E-08 11.30 0.30
Personal Computers 0.081 0.072 0.1 8.77 2.29 26.06
N 49 35 16 16 16
A-Squared 0.04 0.76 0.85 0.85 0.98
Numbers in italics are t-statistics. Source: latest available year data from ITU.
66


Economic Toolkit for African Policy Makers
Annex Four: 1.
The Importance of Accounting Rates. to African Telecommunications Companies
Table A4.1 presents a list of African countries and an "accounting index". The index is designed to be a very rough measure of a country's reliance on income from accounting rates. It is calculated as follows:
((no of minutes, international telephone traffic in) - (no. of minutes, international traffic out))* (one half the accounting rate with the United States) all expressed as a percentage of GDP.
This measure can only be an approximation for a number of reasons. First, if we take the example of Swaziland, it is probable that the huge negative index score, based on more outgoing than incoming traffic, is because of a disparity of calls with
South Africa, not a disparity with the US. To make the index a true measure of reliance on
Table A4.1 African Countries and Dependency on 1
International Accounting Rates
international accounting rate revenues, it would have to be an accounting rate average weighted by origin of international calls minus an accounting rate average weighted by destination of international calls, all multiplied by international traffic imbalance in turn expressed as a percentage of GDP. Because we only have accounting rate figures for the U.S., the U.K. and New Zealand, we cannot construct this index. It has to be hoped that the U.S. rate is a fair proxy (see Table A4.2).
Country Accounting Rate Payment (% GDP)
Swaziland Zimbabwe Kenya Botswana Cameroon Guinea Burkina Faso Angola Sudan Zambia Benin Uganda Mauritius Tanzania Nigeria Equatorial Guinea Mozambique Senegal Guinea Bissau Cape Verde Sao Tome and Principe Gambia
68
-0.74 -0.36 -0.17 -0.17 -0.06 0.00 0.03 0.06 0.06 0.07 0.11 0.11 0.12 0.13 0.13 0.41 0.56 0.66 0.70 0.79 1.15 1.18
The table is significant because it suggests the scale of the potential threat posed by both accounting rate changes and also substitution from voice and fax telephony to email. If the Gambia gains anywhere near 1.18 percent of GDP per yea:t from accounting rates, any development that reduces the number of incoming international telephone calls (such as email substitution) is likely to have a serious effect on foreign exchange revenues and telecommunications company profitability. Of course, this measure does not capture the risks from reduced outgoing traffic, which is even more profitable and likely to fall as a result of email ·and callback services.

Table A4.2 African Accounting Rates Revenue from the US
Country US net US settlement US settlement rate settlement as% revenue
Proposed (9/96) B-mark
Angola 102,191 0.6 73 19.1 Benin 717,345 3.0 50 23.4 Botswana 663,030 1.0 75 19.1 Burkina Faso 366,390 1.4 59 23.4 Cameroon 5,340,070 6.7 90 23.4 CAR 562,121 3.6 146 23.4 Chad 468,289 5.4 250 23.4 Congo 350, 129 0.8 87.5 23.4 Djibouti 343,543 1.6 75 19.1 Ethiopia 11,000,000 20.6 90 23.4 Gabon 713,322 0.9 87.5 19.1 Ghana 8,779,732 14.3 50 23.4 Guinea 973,649 7.8 58.5 23.4 Kenya 11,800,000 4.6 70 23.4 Lesotho 122,465 1.0 75 23.4 Madagascar 490,234 1.5 302.5 23.4 Malawi 307,174 1.2 50 23.4 Mali 1,518,875 91 23.4 Mauritius 642,746 0.9 75 19.1 Mozambique 1,518,692 2.4 79.5 23.4 Namibia 825,387 1.5 85 19.1 Nigeria 8,465,816 1.8 75 23.4 Senegal 12, 100,000 11.7 110 23.4 Sierra Leone 3,615,028 54.8 75 23.4 South Africa 27,000,000 1.0 50 19.1 Swaziland 334,872 1.5 75 19.1 Tanzania 3,905,555 5.6 75 23.4 Togo 1,516,662 13.9 87.5 23.4 Uganda 1,252,754 3.0 60 23.4 Zambia 1,659,572 1.5 60 23.4 Zimbabwe 2, 166,959 1.8 75 23.4
69

Economic Toolkit for African Policy Makers
Annex Five: Potential Internet Penetration in Africa
70
Taking GDP and percentage of income by quintile from the World Bank, the model presented here estimates the potential expenditure per person in each income quintile on communication connectivity. This is based on the common assumption that communities are willing to spend around one percent of their income on access to telephones. Taking this number, estimates for the costs of computer equipment, and the costs of connectivity from Jensen and the ITU, we can estimate achievable telephone and Internet densities (per 100 people) on the basis of costs and willingness to spend. There are three sets of estimates. The first assumes that all expenditure will go to telephone connectivity, the second that 75 percent will go to telephone connectivity, but consumers will be willing to spend 25 percent of their connectivity budget on the Internet. The third set assumes that the connectivity expenditure will be evenly divided between the Internet and the telephone. The estimates measure expected teledensity, or telephones per 100 people (teledens), and expected Internet density, or computers hooked to the Internet per 100 people (netdens), for each of the five income groups, as well as an average. Below that, the total number of telephones and computers hooked to the Internet is estimated, and this number used to calculate an average density in terms of telephones or Internet sites per square kilometer.
The model, as it stands, appears to overestimate the actual number of telephones in the countries. There are two reasons for this, both connected with policy choices. The first is the problem of waiting lists. In countries where political pressure keeps the costs of access low without concomitant transfers or subsidies, telephone companies are unable to meet the demand created by below-cost service provision. This leads to huge waiting lists and low levels of satisfied demand. In Tanzania, the waiting time for a telephone is more than 10 years and satisfied demand is but 43 percent of the total (figures for other countries are: Ghana, 67.9 percent; Cote d'Ivoire, 67.6 percent; Senegal, 85 percent).
The second and more significant reason for the model overestimating telephone demand is that although models based on the "one percent of expenditure" assumption do quite well in estimating the number of connections to telephone networks, they do this by assuming that any household whose willingness to
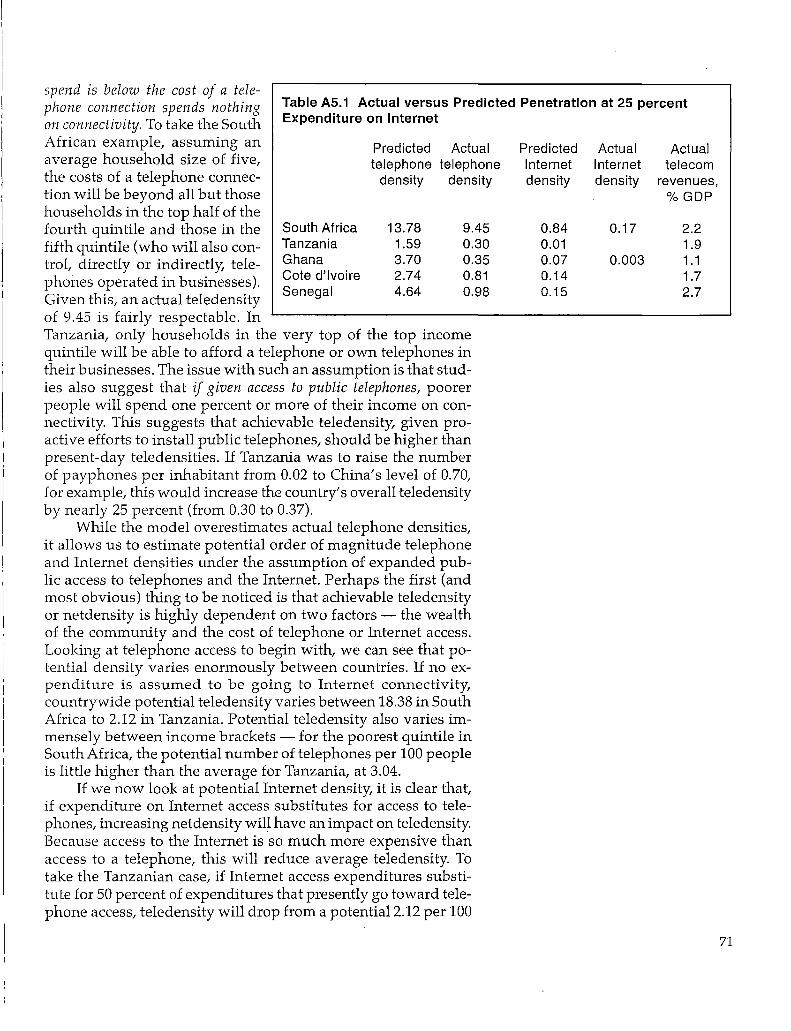
spend is below the cost of a telephone connection spends nothing on connectivity. To take the South African example, assuming an
Table A5.1 Actual versus Predicted Penetration at 25 percent Expenditure on Internet
average household size of five, the costs of a telephone connec-tion will be beyond all but those households in the top half of the fourth quintile and those in the South Africa fifth quintile (who will also control, directly or indirectly, telephones operated in businesses). Given this, an actual teledensity of 9.45 is fairly respectable. In
Tanzania Ghana Cote d'Ivoire Senegal
Predicted Actual telephone telephone
density density
13.78 1.59 3.70 2.74 4.64
9.45 0.30 0.35 0.81 0.98
Tanzania, only households in the very top of the top income quintile will be able to afford a telephone or own telephones in their businesses. The issue with such an assumption is that studies also suggest that if given access to public telephones, poorer people will spend one percent or more of their income on connectivity. This suggests that achievable teledensity, given proactive efforts to install public telephones, should be higher than present-day teledensities. If Tanzania was to raise the number of payphones per inhabitant from 0.02 to China's level of 0.70, for example, this would increase the country's overall teledensity by nearly 25 percent (from 0.30 to 0.37).
While the model overestimates actual telephone densities, it allows us to estimate potential order of magnitude telephone and Internet densities under the assumption of expanded public access to telephones and the Internet. Perhaps the first (and most obvious) thing to be noticed is that achievable teledensity or netdensity is highly dependent on two factors - the wealth of the community and the cost of telephone or Internet access. Looking at telephone access to begin with, we can see that potential density varies enormously between countries. If no expenditure is assumed to be going to Internet connectivity, countrywide potential teledensity varies between 18.38 in South Africa to 2.12 in Tanzania. Potential teledensity also varies immensely between income brackets - for the poorest quintile in Sou th Africa, the potential number of telephones per 100 people is little higher than the average for Tanzania, at 3.04.
If we now look at potential Internet density, it is clear that, if expenditure on Internet access substitutes for access to telephones, increasing netdensity will have an impact on teledensity. Because access to the Internet is so much more expensive than access to a telephone, this will reduce average teledensity. To take the Tanzanian case, if Internet access expenditures substitute for 50 percent of expenditures that presently go toward telephone access, teledensity will drop from a potential 2.12per100
Predicted Actual Actual Internet Internet telecom density density revenues,
%GDP
0.84 0.17 2.2 0.01 1.9 0.07 0.003 1.1 0.14 1.7 0.15 2.7
71

Economic Toolkit for African Policy Makers
72
people to 1.07 per 100 people (1.06 telephones plus 0.01 telephones attached to an Internet access point), while net density will reach only 0.01per100 people. In terms of average number of potential telephones and Internet access points per square km, the number of potential telephones would fall from one every one and a half km2 to one every three km2, while the number of Internet sites would reach one every 333 km2•
Of course, the picture is not that bleak. First, because of the potential of the Internet, it is likely that expenditure on access would be as much additional as it was substitutive (especially for rich users). Second, potential teledensity at 50 percent expenditure on the Internet is still higher than actual teledensity achieved in Tanzania (1.06 compared to 0.30 per 100 people). This suggests that the problem of substitution expenditure on the Internet driving down teledensity is likely to be largely theoretical.
It is clear, however, that the price of communication access, especially access to the Internet, is prohibitive for many. Even if 50 percent of potential expenditure on communications access was harnessed to provide Internet access to the poorest 20 percent in Tanzania, the number of Internet access points that they could afford per head at present prices would be one for each 25,000 of them, or one every 800 km2 at average population densities. Obviously, this is not a sustainable level of access.
Despite this, policy changes can be made to increase Internet access to a larger segment of the population. Tanzania's yearly Internet access costs (including equipment), at US$5,425, are more than five times the South African yearly Internet access costs of US$793. If Tanzania were to bring down the costs of Internet access to South African levels, potential Internet connectivity in the country would skyrocket. At a rate of 50 percent of potential communications expenditure being used for Internet access, average net density per 100 people would rise from 0.01to0.07 (or one per 10,000 to one per 1,500). At average population density, this suggests that the maximum walk to the nearest Internet access point would drop from about three hours long to around one hour (10.5km to 3.9km). The primary reason for cheaper Internet service provision in South Africa is cheaper access to leased lines and the Internet backbone. South Africa Telkom has been able to afford this cheaper backbone access in part through rate rebalancing between value added services and basic services. While greater efficiency undoubtedly plays a large role, it is also clear that South Africa's basic provision of telephone services is more expensive than Tanzania's (a yearly cost of US$178.2, as compared to US$57.33). Perhaps, then, it is fairer to take the whole bundle of South African costs and apply them to Tanzania. As before, we see far higher Internet access (although a little lower than

the SA Internet prices, because of the extra telephone charges). Yet, potential teledensity drops from 1.06 in the base case to 0.34 in the South African prices model. While overstating the case, this raises an important policy issue. If the costs of Internet service provision are reduced by lowering the costs of broadband access, this will reduce a source of cross-subsidy for basic telephone provision. In an environment of inefficiencies in public telephone monopolies, where demand cannot be met for basic telephone provision anyway, it should be possible to both reduce the costs ofinternational connectivity for Internet service providers and continue provision of basic telephone services at reasonably low cost. However, there might be at least short term costs in terms of basic telephone service provision.
Table A5.2 South Africa: Achievable Telephone and Internet Densities
GDP (USDm) 136035 Inc. quintile Expend Percentage of expenditure to telephone and Internet
Population (m) 41.5 %Nat. inc. /person 100% tel 75% tel 25% lnet 50% tel 50% lnet
Telephone instal ($) 81 teldens teldens netdens tel dens netdens Telephone rental/mth ($) 12.6
Internet eqp. + instal ($) 1875 1st 3.3 5.41 3.04 2.28 0.14 1.52 0.28
Internet charge/mth ($) 14 2nd 5.8 9.51 5.33 4.00 0.24 2.67 0.49 Area (1,000 km2) 1221 3rd 9.8 16.06 9.01 6.76 0.41 4.51 0.83
4th 17.7 29.01 16.28 12.21 0.75 8.14 1.49 5th 63.3 103.75 58.22 43.66 2.67 29.11 5.34
Tel. year cost ($) 178.2
Int year cost($) 793 Average 32.75 18.38 13.78 0.84 9.19 1.69
Total Phones/Site (k) '7626 5720 350 3813 700 Site Density (no/km2) 6.25 4.68 0.29 3.12 0.57
Table A5.3 Tanzania: Achievable Telephone and Internet Densities
GDP (USDm} 3602 Inc. quintile Expend Percentage of expenditure to telephone and Internet Population (m} 29.6 %Nat. inc. /person 100% tel 75% tel 25% lnet 50% tel 50% lnet
Telephone instal ($) 46 teldens teldens netdens tel dens netdens Telephone rental/mth ($) 3.5
Internet eqp. + instal ($) 1875 1st 6.9 0.42 0.73 0.55 0.00 0.37 0.004
Internet charge/mth ($) 400 2nd 10.9 0.66 1.16 0.87 0.00 0.58 0.01 Area (1,000 km2} 945 '3rd 15.3 0.93 1.62 1.22 0.00 0.81 0.01
4th 21.5 1.31 2.28 1. 71 0.01 1.14 0.01
5th 45.4 2.76 4.82 3.61 0.01 2.41 0.03
Tel. year cost ($) 57.33
Int year cost ($) 5425 Average 1.22 2.12 1.59 0.01 1.06 O.D1
Total Phones/Site (k) 628 471 2 314 3
Site Density (no/km2) 0.66 0.50 0.002 0.33 0.003
73

Economic Toolkit for African Policy Makers
Table A5.4 Ghana: Achievable Telephone and Internet Densities
GDP (USDrn) 6315 Inc. quintile Expend Percentage of expenditure to telephone and Internet
Population (rn) 17.1 %Nat. inc. /person 100% tel 75% tel 25% lnet 50% tel 50% lnet
Telephone instal ($) 196 tel dens tel dens netdens teldens netdens
Telephone rental/rnth ($) 0.8
Internet eqp. + instal ($) 1975 1st 7.9 1.46 1.95 1.46 0.03 0.97 0.05
Internet charge/rnth ($) 51 2nd 12 2.22 2.96 2.22 0.04 1.48 0.08
Area (1,000 krn2) 239 3rd 16.1 2.97 3.97 2.98 0.06 1.98 0.11
4th 21.8 4.03 5.37 4.03 0.07 2.69 0.15
5th 42.2 7.79 10.40 7.80 0.14 5.20 0.29
Tel. year cost ($) 74.93
Int year cost($) 1270.33 Average. 3.69 4.93 3.70 0.07 2.46 0.14
Total Phones/Site (k) 843 632 12 421 23
Site Density (no/krn2) 3.53 2.64 0.049 1.76 0.098
Table A5.5 Cote d'Ivoire: Achievable Telephone and Internet Densities
GDP (USDrn) 10069 Inc. quintile Expend Percentage of expenditure to telephone and Internet
Population (rn) 14 %Nat. inc. /person 100% tel 75% tel 25% lnet 50% tel 50% lnet
Telephone instal ($) 148 tel dens tel dens netdens tel dens netdens
Telephone rental/rnth ($) 12.3
Internet eqp. + instal ($) 1926 1st 6.8 2.45 1.24 0.93 0.05 0.62 0.10
Internet charge/rnth ($) 35 2nd 11.2 4.03 2.05 1.53 0.08 1.02 0.16
Area (1,000 krn2) 322 3rd 15.8 5.68 2.89 2.16 0.11 1.44 0.23
4th 22.2 7.98 4.05 3.04 0.16 2.03 0.32
5th 44.1 15.86 8.05 6.04 0.31 4.03 0.63
Tel. year cost ($) 196.93
Int year cost ($) 1062 Average 7.20 3.66 2.74 0.14 1.83 0.29
Total Phones/Site (k) 512 384 20 256 40
Site Density (no/krn2) 1.59 1.19 0.062 0.79 0.124
74
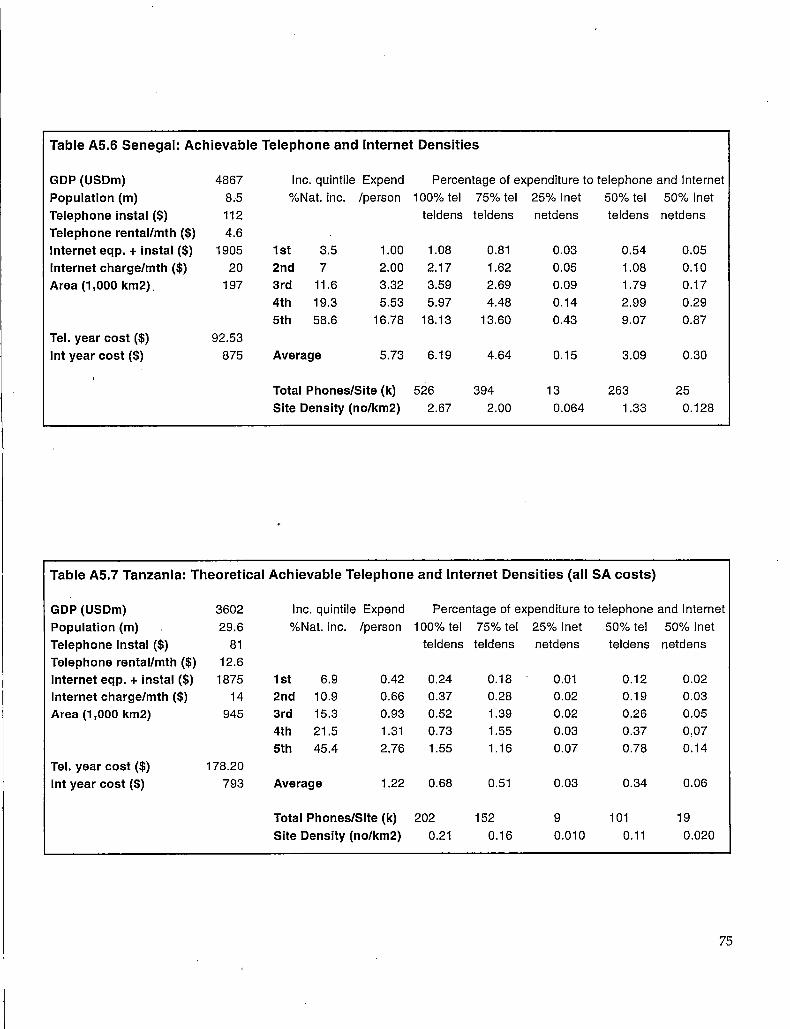
Table A5.6 Senegal: Achievable Telephone and Internet Densities
GDP (USDm) 4867 Inc. quintile Expend Percentage of expenditure to telephone and Internet
Population (m) 8.5 %Nat. inc. /person 100% tel 75% tel 25% lnet 50% tel 50% lnet
Telephone instal ($) 112 teldens teldens netdens teldens netdens
Telephone rental/mth ($) 4.6
Internet eqp. + instal ($) 1905 1st 3.5 1.00 1.08 0.81 0.03 0.54 0.05
Internet charge/mth ($) 20 2nd 7 2.00 2.17 1.62 0.05 1.08 0.10
Area (1,000 km2). 197 3rd 11.6 3.32 3.59 2.69 0.09 1.79 0.17
4th 19.3 5.53 5.97 4.48 0.14 2.99 0.29
5th 58.6 16.78 18.13 13.60 0.43 9.07 0.87
Tel. year cost ($) 92.53
Int year cost($) 875 Average 5.73 6.19 4.64 0.15 3.09 0.30
Total Phones/Site (k) 526 394 13 263 25
Site Density (no/km2) 2.67 2.00 0.064 1.33 0.128
Table A5.7 Tanzania: Theoretical Achievable Telephone and Internet Densities (all SA costs)
GDP (USDm) 3602 Inc. quintile Expend Percentage of expenditure to telephone and Internet
Population (m) 29.6 %Nat. inc. /person 100% tel 75% tel 25% lnet 50% tel 50% lnet
Telephone instal ($) 81 teldens teldens netdens tel dens netdens
Telephone rental/mth ($) 12.6
Internet eqp. + instal ($) 1875 1st 6.9 0.42 0.24 0.18 O.Q1 0.12 0.02
Internet charge/mth ($) 14 2nd 10.9 0.66 0.37 0.28 0.02 0.19 0.03
Area (1,000 km2) 945 3rd 15.3 0.93 0.52 1.39 0.02 0.26 0.05
4th 21.5 1.31 0.73 1.55 0.03 0.37 0,07
5th 45.4 2.76 1.55 1.16 0.07 0.78 0.14
Tel. year cost($) 178.20
Int year cost ($) 793 Average 1.22 0.68 0.51 0.03 0.34 0.06
Total Phones/Site (k) 202 152 9 101 19
Site Density (no/km2) 0.21 0.16 0.010 0.11 0.020
75

Economic Toolkit for African Policy Makers
Table AS.8 Tanzania: Achievable Telephone and Internet Densities (SA Internet costs)
GDP (USDm) 3602 Inc. quintile Expend Percentage of expenditure to telephone and Internet
Population (m) 29.6 %Nat. inc. /person 100% tel 75% tel 25% lnet 50% tel 50% lnet Telephone instal ($) 46 teldens teldens netdens tel dens netdens Telephone rental/mth ($) 3.5 Internet eqp. + instal ($) 1875 1st 6.9 0.42 0.73 0.55 0.01 0.37 0.02 Internet charge/mth ($) 14 2nd 10.9 0.66 1.16 0.87 0.02 0.58 0.04 Area (1,000 km2) 945 3rd 15.3 0.93 1.62 1.22 0.03 0.81 0.05
4th 21.5 1.31 2.28 1.71 0.04 1.14 0.08 5th 45.4 2.76 4.82 3.61 0.08 2.41 0.16
Tel. year cost ($) 57.33
Int year cost ($) 793 Average 1.22 2.12 1.59 0.04 1.06 0.07
Total Phones/Site (k) 628 471 11 314 21 Site Density (no/km2) 0.66 0.50 0.011 0.33 0.022
76

Annex Six: the Internet Cost-Benefit Model
The first two pages of the model list the data required to estimate the effects of Internet penetration on users, ISPs and telecommunications companies (C5-C65 and E71 to E83). Much of the data required is self-explanatory, but a few points should be made, and information on sources given.
Phone charges
The cost of a three-minute call has been used for the sake of convenience. It is the rate published by the ITU. When used as a basis for calculating the cost of a 30-minute or longer call (which is the more likely length of a connection to the Internet), it is obviously going to produce inaccuracies, usually overpricing the cost of a call of that length. In Ghana, for example, the price of a three-minute local call is 200 cedis, the price of a 30-minute local call is only 1,400 cedis.
The cost of a regional call will have to be an average, if there are many different regional call rates. Table A6.1 provides approximations from available data. The cost of an international call would preferably be weighted based on international call destinations. Here, we have taken estimates from available data. We have chosen the U.K. or the U.S. accounting rates to act as an estimate for the average accounting rate charged and received by the African telecommunications company.
Table A6.1 Phone Charges for .Selected African Countries, US Dollars
Installation Yearly 3-min 3-min 3-min (business) rental local call regional international
Mozambique 108.0 61.0 0.04 0.60 7.65 Ghana 52.3 12.0 0.10 0.30 7.50 Ethiopia 55.8 37.2 0.10 4.80 Cameroon 54.0 86.4 0.07 South Africa 74.8 130.8 0.06 0.64 4.58 Mali 91 .9 40.8 0.15 20.00 Uganda 127.6 18.0 0.05 11.00 Zimbabwe 206.4 22.8 0.04 7.50
Accounting rate/min
1.19 1.00 1.80 1.80 1.00 0.91 1.00 0.75
77

Economic Toolkit for African Policy Makers
Table A6.2 ISP (SLIP/PPP) Flat Rate Service Charges for business in Africa (US dollars)
Internet Charges
Internet connectivity charges are assumed to be a flat fee for full service. A connection charge plus a yearly flat fee provides unlimited Internet and email access for the customer. The Internet charges data allow for only one price regime for a country (obviously already false for much of the continent). It would make the model much more complicated if this were allowed to take multiple values. Further, the hypothetical revenue streams are based on a monopoly ISP provider.
Country
Ivory Coast (Africa Online) Ivory Coast (Africom) Djibouti Ghana Namibia Senegal (ENDA) Senegal (Metissacana) Sou th Africa Swaziland Tanzania Togo Uganda Mozambique
Connection Yearly Fee
18 1,584 53 423
282 2,373 100 613
0 671 40 240
0 1,056 0 168
22 761 0 4,800 0 1,144
50 780 10 600
Equipment
The figures for the price of a fax machine, computer and modem are
estimated from data for Mozambique (fax machine US$400; com-: puter US$1,300; modem US$175). The prices of these goods will clearly vary according to the cost of importing them.
Usage statistics
In South Africa, the number of users is estimated at 700,000, while Zimbabwe is estimated to have 10,000 users. Information from UEM in Mozambique provides an estimate of approximately 2,000 dial-up links for UEM and a total of 750 dial-up links for the other two ISPs. Because many dial-up links are accessed by more than one user, the total user-base in the country is estimated at 5,000 to 6,000 (up from zero in 1995). Estimates for Ghana are around 5,000 users (up from 60 in 1995). Ethiopia has approximately 1,600 users. In order to be consistent, however,
we will concentrate on the number of subscribers rather than the num
Table 6A.3 Use of Email in Uganda and Ethiopia: User Survey ber of users.
0-1 per month 1-4 per month 1-5 per week >1 per day
78
Uganda Sent Received (%) (%)
4.7 3.1
43.8 48.4
1.6 12.5 46.9 39.0
Ethiopia Sent Received ('Yo) (0/o)
8.4 15.7 39.8 36.1
18.3 12.2 50.0 19.5
Nearly all users in Mozambique are based in Maputo, and so have local access to an ISP. Estimates for Ghana also suggest about 90 percent local access rates. UEM data point to an average access time to the web in Mozambique of about eight hours per month, or approximately 100 hours per year. In

r- ~------1 I
Table A6.4 Ghana, figures from NCS suggest that an average of 10 out of 1,200 subscribers are accessing the Internet at any one time, suggesting an average usage level of 73 hours a year. Frequency of Use of Email in Uganda:
Average user
The average user statistics ask for the average number of email sent and received. Looking at data from the CABECA survey for Uganda and Ethiopia, it is possible to estimate the average number of email sent by each user. The data from user surveys suggest fairly high levels (and these figures exclude the receipt of mass-mailings).
The data suggest that users send somewhat more email than they receive, and (on average) send over one email a
Data from Node
Number of emails sent in two months
0-10 11-20 21-30 31-40 41-50 51-60 60+
day. There are problems of selection bias with this data, however (it is likely to have excluded those with an account which they do not use). CABECA also asked for node data on email usage which is likely to be more reliable. The two tables, A6.4 and A6.5, enumerate the number of outgoing email per subscriber from the node.
The number of email sent over a month for all subscribers, suggests an average of 20 email per month, or about one each business day - a fair estimate for present African usage levels. Annually, this might amount to 240 email. As the number of incoming email appears to be lower, we might estimate this at about 200. The average length of email in Mozambique can be estimated at about three and a half pages.1
Next, the model asks for the percentage of these email that are replacing telephone calls and faxes, excluding "new" email traffic. "New" email consists of email that contain information which otherwise would not have been sent by fax or phone. It is assumed that much email traffic will be new, because of the very low marginal cost of sending an email. However, empirical evidence suggests that there is also substitution occurring. In all of the countries of the CABECA survey, respondents reported
Table A6.5
No. of subscribers
73 32 27 19 3 5 4
that email had saved money on their communications budgets. The CABECA study in Uganda reveals that the method of communication most commonly replaced by email is surface and air mail, followed by fax, telephone and telex. Telephone and fax service savings were the most significant
Frequency of Use of Email in Ethiopia: Data from Node
1 This estimate is, admittedly, back of the envelope. UEM estimated that 60 percent of their outgoing traffic was emails. For the month of February, this amounted to 2.037 mb of emails. UEM has an estimated 2,000 users, who send approximately one email per day, or a total of 40,000 emails per month. The average length of an email is then 50.93 kb, or about three and a half pages. Senegal's average email length is estimated by ISPs there to be about 50 kb, although a Namibian ISP estimated the average length at just five kb, or under half a page.
Number of emails sent in two months
<30 30-61 61-122 >122
No. of subscribers
143 16 20 27
79

Economic Toolkit for African Policy Makers
80
source of reductions in communication budgets brought on by email (also mentioned were savings on publications, courier and postal fees and travel). It is fair to assume, then, that 35 percent of email traffic is substituting for either phone or fax.
World wide, fax is estimated to account for 40 percent of international phone traffic. This is because fax is considered a more efficient means of communication, transferring information five times faster than voicer. Given that email is also a substitute for fax, estimates from the CABECA study suggest that about 25 percent of email traffic is substituting for faxes and 10 percent for voice calls. The remaining 65 percent substitutes for other forms of communication (primarily post) or is new traffic.
The statistics also ask for the destination of outgoing email. In a user survey conducted in Uganda during the CABECA study, 80 percent of respondents had not yet used email for local exchange of information, but had done so to communicate with partners abroad. Eighty-two percent of Ethiopian users said that less than 10 percent of email traffic they sent stayed in-country, although in the more Internet-dense country of Zambia the figure was 26 percent. The CABECA study suggests that approximately 56 percent of email from Uganda have destinations outside the continent, 27 percent have destinations in Africa but not within the country, and only 17 percent are for recipients within Uganda. Given that the great majority of users in Africa appear to reside in capital cities, this implies that the percentage of email with a different region in the same country is very low indeed.
All of the above lead to the assumption that, per subscriber, email replaces about 68.9 minutes a year of outgoing international telephone calls (voice and fax), 4.1 minutes of regional calls, 12.2 minutes of local calls and 57.4 minutes per year of incoming international calls.
PTT charges to ISPs
We already know that licensing costs are a significant percentage of revenues for ISPs in some countries. Another major charge is the cost of leased line or VSAT connection to the Internet. The yearly charge is the portion paid to the PTT (any portion paid to foreign telephone companies or other providers should be listed below at C63). In Mozambique, the PTT charges US$250 a month for a 64 kbs leased line to a satellite connection provided by the Leland initiative. Leland charges US$2,000 a month for a connection from there to the U.S. Internet backbone (this would be covered by "Internet Backbone connection" charges, C64, with no separate foreign telco charge for 64 kb VSAT /LL, line C61). The major Internet provider, the UEM, pays US$4,982 a month to Transtel, a South African company, for a leased line to South
Africa's Internet backbone plus a usage-based charge to UNINET for access. They are willing to pay this premium for a more reliable service. Their costs will fall, however, if they are able to negotiate a ~iirect connection to the U.S. provided by Lyman Brothers for US$3,000 a month for 128 kbs. This suggests the advances that scale, technology and competition can make in cutting costs and increasing reliability for the Internet.
On the spreadsheet, not all points to enter information are necessarily relevant in all cases. In Mozambique, for example, payments to the PTT (C55) cover only the local leased line. For the international connection portion, the Leland Initiative link covers all costs. The charge by Leland includes Internet backbone access, and so there is only one lump sum to count (thus the zero charge for backbone access). Data for setup costs include leased line setup (C61), so, again, this is not counted as a separate charge. If the local telecommunications company is not providing the leased line service, as in Ghana, the cost to it of provision (C55) should be zero.
PTT details
Estimations of the cost of a main line in Africa vary greatly between countries. The ITU has found that costs per line vary between US$1,000 and US$8,000 per subscriber line, with an average of around US$4,250. This compares to a world average cost of US$1,500. It should be pointed out that this high cost will largely be the result of two factors: inefficiencies in African telecommunications companies and difficulties due to subscriber density and geography. A recent World Bank study has estimated a reasonable capital cost per line of rural telephones to be US$5,000 in Kenya, US$6,000 in Zimbabwe and US$8,000 in Uganda. Fifty-nine percent, 51 percent and 71 percent of telephones are in the largest cities in these countries, however. Therefore, the average cost of a line should be much lower. Nonetheless, in Mozambique, the average cost of a main line has been estimated at US$4,500 (estimates for South Africa are closer to US$1,000). The recurrent costs of a telephone line are estimated at about US$600 for South Africa. The cost of installing a second line is - at least on more modern lines - considerably below that of installing the first. For Mozambique, it may be assumed as one-sixth of the cost, or US$500. According to a World bank study in Tanzania, exchange equipment amounted to about 25 percent of the cost of a line, suggesting a cost in Mozambique of about US$1,125.
The cost of providing the satellite and/ or leased line has to be calculated on a yearly basis. The cost of leased line provision to the PTT is likely to be significantly below the rates which it charges. Mozambique is charging US$250 per month for local
81

Economic Toolkit for African Policy Makers
82
leased line provision, suggesting cost to the telecommunications company of perhaps US$200 per month. USAID estimates suggest costs of US$2,000 a month for international leased line provision. For example, last mile costs will be little different from those of telephone connections. A 1.2 meter ground station with 64 kbs capacity costs US$10,000. Renting space on a satellite and a hub station costs about US$1,750 per month. Mike Jensen estimates a monthly cost of operating a 64 kbs VSAT at about US$4,000 to US$5,000 (of which about US$2,000 would go to the satellite company and hub station).
There are large economies of scale to international communication. Intelsat charges US$9,975 per month for a 2mps connection to an 11 meter dish, or about US$320 for each 64 kbs. This suggests that PTTs should be able to provide one half of a , 64 kbs satellite circuit at a cost to them of US$30,000 a year, with perhaps a further US$2,500 per month to foreign providers - a total of US$60,000 a year.
ISP details
All of these details are designed to be for a small "bare bones" operation. A small sized ISP is estimated to require a US$12,835 administrative computer with US$1,000 of associated costs (USAID estimates total computer costs for a larger system at US$55,000). Other setup costs are estimated at US$17,800. Connection charges to the Internet are mentioned above. Recurrent salary and maintenance are estimated by USAID to be US$21,000, and by Ruth to be US$11,000 for a smaller operation.
Assumptions
The first assumption is about the number of subscribers to each computer terminal. In the first part of the model, the assumption is that each user has his or her own computer. In the second part of the model, it is assumed that subscribers share computers. Evidence from the CABECA study suggests between four to eight users per terminal (or around two to four subscribers). This reduces user cost of access to the Internet. Another assumption considers the amount of time it takes to access an email account (as opposed to using the Web). A three-minute link up every business day could theoretically transmit 91,000 pages of information each year. Thus, the model assumes that the length of time spent accessing email is determined not by the amount of data transferred, but by the number of times during the day the email account is accessed, and the amount of time taken each time to do so. The CABECA survey suggests that the average African user accesses his or her account at least once a day. The time taken will be brief; here we have assumed three minutes.

As for the number of subscribers who are likely to obtain a second line dedicated to web access (measured in terms of terminals), in the U.S., this figure is as high as 40 percent of Internet users. In Africa, with lower incomes and long waiting times for installation, and between four to eight users per terminal, this figure is likely to be far lower. We assume here that five percent of subscribers manage to obtain a second line for Internet access.
It is assumed that an increased number of subscribers will increase the number of telephone lines, computers, size of leased line/VSAT connections and user support personnel required by the ISP. UEM has five technicians working for an estimated 5,000 users. In Uganda, the charge to users for training is US$8 initially with access to free courses every week. This suggests an annual per subscriber cost of perhaps US$10 to cover expenses. In the U.S., ISPs tend to have one phone line for 10 to 15 subscribers. NCS in Ghana has 100 dial-in lines for 2,500 subscribers. Here we have assumed one phone line for every 20 subscribers. USAID estimates suggest that a new computer will be needed for 1,000 subscribers. UEM is just now considering upgrading to a 128kbs link, at a level of approximately 2,000 subscribers, suggesting that at the moment 64kbs in Africa can provide the minimally acceptable level of access for around 3,000 users. As the comfortable capacity of a 64kbs line is only about 10 active Internet users at any one time (and figures for Mozambique already suggest that the average number of subscribers on line at any one time must be about 15), providing reasonably fast access even at this low level of usage will require greater bandwidth - perhaps 64kbs per 1,000 users.
It is also assumed that new web subscribers put more pressti.re on the telephone network, demanding extra switches. This is a matter of some debate in the U.S.: we have high and low estimates (0.1 and O) for the number of new switches required per subscriber, and the figure is likely to be toward the low end in Africa because of low levels of usage. Here we assume 0.01.
Finally, there are assumptions about the real cost of capital for telecommunications companies, ISPs and users, and depreciation rates for telecommunications equipment, computers and other items. In order to provide figures on savings and costs per year which include capital expenditures and depreciation rates, all capital expenditures and one-off payments on the debit side and all one-off receipts on the credit side have been converted into yearly costs using the formulae for perpetuities and annuities. YRC (yearly return to capital) rates equal the cost of capital for goods with long lives (E82 to E83) and the annuitized cost of capital for goods with shorter lives (calculated E84 to E86)). The model assumes that telecommunications companies have access to cheaper capital than ISPs and Internet users. It
83

Economic Toolkit for African Policy Makers
84
also assumes differing replacement rates for telecommunications, computer and other equipment. Based in part on USAID data, we have estimated a four-year replacement period for computer equipment and 10 years for other items, with a real cost of capital at 10 percent for telecommunications companies and 20 percent for· ISPs (in nominal terms, NCS Ghana pays 25 to 45 percent per year).
Equations for the model
Subscriber savings and telco revenues per page
The first section of the model estimates the costs to the subscriber and revenue streams to the telephone company based on sending a number of pages of information by voice, fax, locally connected email and regionally connected email. Across the top of the section are the number of pages sent locally (G7 to J7), regionally (L7 to N7) and internationally (H26 to J26), down the side the different methods of sending information, and the revenues received from the user by the PTT. In the case of international communication, there is a further section (F42 to J47) on the amount of revenue received by the PTT from overseas users contacting the home user utilizing different forms of communication (any telephone-based communication that is received from abroad is subject to accounting-rate charges by the home PTT).
The local section includes the fixed costs of operating different communications systems (ignoring the rental and installation charges for a telephone line, assumed already there), along with the extra costs associated with local calling charges. Under the 0 Pages sent/yr column (G9 to G20), the fixed costs of the various communications methods are calculated. For voice communication (G9), the additional fixed cost (above the rental and installation charges of the 'phone) is zero. For the fax (GlO), the additional cost per year (over the price of a basic phone connection) is the cost of a fax spread over its depreciation period. For email (Gll and G12), the additional cost per year is the annuitized or perpetuitized sum of connection fees and computer and modem costs and the yearly web connection charge. Given that computers are useful for far more than the Internet, this can be argued to over-estimate the equipment costs that should be associated with user access to the Internet alone.
The additional cost per local page sent by phone (HlO to J10) is the fixed cost plus the number of pages sent multiplied by the time taken to 'speak' one page in turn multiplied by the unit cost of calling time. The additional cost per local page sent by fax (Hll to Jll) is the number of pages sent multiplied by the time taken to fax them in turn multiplied by the unit cost of calling time. The additional cost per local page sent by local email

---------------------------------------------
(H12 to Jl2) is fixed. It is the local phone call cost of the daily connection time times the number of business days in a year (260). The additional cost per local page sent by regional email (i.e. the user has to make a regional call to access his email) is calculated in the same way (H13 to Jl3), but substituting the cost of a regional call for the cost of a local call in the daily connection time.
There is no additional cost to users for sending email to regional or international recipients (L19 to N20 and H31 to J32). For,voice and fax, the extra cost is calculated as above. For voice (L17 to N17 and H29 to J29), then, this is number of pages multiplied by time taken to speak a page multiplied by the unit cost of a regional or international call. For fax (L18 to N18 and H30 to J30), this is number of pages multiplied by time taken to speak (fax) a page multiplied by the unit cost of a regional or international call.
The phone company receives no revenue from fixed costs of communication (beyond the installation and rental of the phone line, which is excluded from the calculation). Revenue from local (G17 to J17) and regional (L17 to M17) voice calls is based purely on the length of connection time and the charges for calls made. This is the same with local (G18 to J18) and regional (L18 to ¥18) faxes.
In the case of international calls, the picture is complicated a little by accounting charges. The phone company has to pass on half of the accounting rate value of the call to the telco that provides the other half of the circuit. For voice (H29 to J29)and fax (H30 to J30), then, the calculation is the time taken to speak (fax) the number of pages multiplied by the unit cost of the call minus the time taken to speak (fax) the number of pages multiplied by half of the accounting rate paid to the foreign telecommunications company.
The telecommunications company also receives accounting rate payments from foreign telecommunications companies originating incoming voice and fax communication with the home user. For voice (H45 to J45) and fax (H46 to J46), this amounts to the time taken to speak (send) the number of pages multiplied by one half of the accounting rate.
For email, the amount that the telecommunications company receives from the user is fixed, as we saw above. For local access email (H12 to J12), and regional access email (H13 to Jl3),
· the receipts equal the by minute cost of the call multiplied by the time taken each day to access email multiplied by the number of business days in a year (260). This is the only incremental cost of email, whatever the destination or source of communication. Therefore, the extra costs associated with regional or international emailing is zero (L19 to N20, H38 to J39 and H37 to J37).
85

Economic Toolkit for African Policy Makers
86
----------- --- -----
Full impact on telecommunications companies, ISPs and subscribers
The second part of the model looks at the detailed effects on telecommunications and ISP revenue and user costs and savings of some fixed level of Internet usage. The ISP is assumed to be a monopoly provider, to simplify the model. This is a clear over-simplification. Already, much of Africa has multiple Internet service providers. The effect on the model of this simplification is to overestimate ISP profits and reduce telecommunications company revenue from ISPs (because of multiple leased lines, more phone lines and more licenses). This will also slightly overestimate telecommunications company revenue from users, because it is likely that, with more ISPs, a larger percentage of users can make a local call to connect to the Internet.
The section is divided in two. On the left (F49 to G93) is a static illustration of revenue gains and losses for Telecommunications companies and ISPs and summed costs and savings for users, based on the number of Internet users entered at C24 ("number of Internet users"). The second section is a model of the potential impact of the Internet on ISPs, telecommunications companies and users given different numbers of Internet users.
Telecommunications company revenue gained
Starting on the left, the first calculation is of telecommunications revenue gained from the present number of Internet users. Telecommunications companies will gain revenue from second Internet user lines. This will be based on the number of new lines (number of users multiplied the percentage who are estimated to take second lines) multiplied by the revenue (rental and installation) that these lines provide (G51).
Telecommunications companies will also receive revenues from expanded Internet traffic. The (smaller) part of this will come from users accessing email. As above, this is assumed to be a fixed length call every day. The first part of the equation calculates the cost of calls for accessing email for local and then regional users based on the number of users, the amount of time taken to access email, the number of business days and the cost of a local (regional) call of the duration inputted in E71 ("Email is accessed every business day for X minutes"). The second part of the equation calculates the cost of calls involved in accessing the web - average number of hours users access the Web (inputted in C30), multiplied by the cost of a local (regional) hourlong call.
Telecommunications companies are also assumed to make money from licensing ISPs. As the model assumes a monopoly provider, this equals the input from C44 ("License"). Telecom-

munications companies will also receive revenue from the rental costs of phone lines into ISPs. This is based on the assumption of the number of subscribers that can be handled per line (E75) multiplied by the revenue (rental and installation) that these lines provide (G55).
It is assumed that the telecommunications company provides the ISP's international connection. No matter how many web subscribers, it is assumed that email alone will not require the provision of an expanded leased line. The theoretical maximum data that could be transmitted by a 64 kbps line over one year is equivalent to 210 million minutes of voice communications (total outgoing telephone traffic from Mozambique totaled 16.4m minutes in 1995). This suggests that email (without the web) does not require large capacity (further evidence is that the NSFNET backbone in the US was only 56kbps as recently as five years ago). It is the increasing use of the web that will drive the need for ever-larger international Internet access capacity. As above, the equation (G55) is based on the assumption of the number of subscribers that can be handled per 64kbs of VSAT or leased line connection (E77) multiplied by the charge for that line. The model assumes a flat fee for each 64kbs of connection to the backbone by the telecommunications company and foreign providers. This is an over-simplification - telecommunications companies will charge less for a 128kbs connection than they would for two 64 connections.
Telecommunications company revenue lost
In calculating telecommunications revenue lost, we have assumed that there is no substitution between WWW access and phone or voice usage, the only substitution is via email. This is an obvious oversimplification. Accessing websites provides an alternative way of obtaining data, which might well substitute for a voice or fax communication to find the information. However, it is very difficult to estimate what percentage of web usage time is substituting for voice or fax, and it is even more difficult to calculate a "conversion rate" between Web downloads and fax or voice. It is, for example, questionable that a Website that uses frames and moving graphics imparts far more valuable information than a site created without these features. The difference in terms of data transfer can be immense, however. The effect of ignoring Web substitution while fully accounting for Web use will be to underestimate the revenue losses on telecommunications companies of Internet access.
Looking first at substitution of outgoing international calls (G60) this equation calculates the amount of international email traffic that is substituting for international outgoing voice traffic. First, the number of "pages" of email sent internationally in
87

Economic Toolkit for African Policy Makers
88
place of a telephone call is calculated. This is equal to the sum of the proportion of email that replace phone calls multiplied by the proportion of email going to an international destination in turn multiplied by the average number of email sent per year, their average length and the number of users. This number of pages estimate is multiplied by the revenue generated by one "page" of an international voice call -the cost of a call long enough to "speak" a page minus the accounting rate payment.
The international faxes out (G61) calculation follows the same procedure as above, only substituting the percentage of information sent by fax for the percentage of information sent by telephone, and using the number of kb in a three minute fax (144 kb) for the amount of information in a three minute voice call. The international calls and faxes in (G62 to G63) calculates accounting rate losses, assuming that international email communication into a country has the same percentage substitution rate for fax and voice (which might be an over-simplification). This calculation is a repeat of the ones above, except that it calculates the accounting rate charges lost by the home telecommunications company based on the amount of incoming email. The amount of incoming email is calculated by subtracting the average number of email sent locally and regionally from the average number of email received (each email sent locally or regionally must be received locally or regionally, so any residual from this calculation must be email received from abroad).
The rest of the equations follow the pattern set above, with the replacement of international data with regional and local data (C23 to G27 and G35 to G38) and the removal of the accounting rate adjustments.
International ISP
Next, international ISP costs and revenues are calculated (G77). The first equation calculates equipment costs. This includes number of computers and the size of the VSAT I leased line connection required to service the number of users (G76 to G77). The cost of administrative computers, fixed other computer costs and setup costs for the VSAT /LL connection (C59-C61) is multiplied by the yearly return requirement for computer equipment while other setup costs (assumed fixed) are multiplied by the return requirement for other equipment.
Internet and telecom charges (G78) include the cost of the yearly license fee, the backbone connection, the charge for the number of phone lines the ISP needs, the home charge for the VSAT or leased line connection required and the foreign country charge for the VSAT or leased line connection required. Salary and maintenance charges (G79) includes recurrent costs and maintenance costs (C65) and a calculation of the cost for user

support multiplied by the number of users (E74 and C24).
User costs, savings
User costs and savings are calculated for the total user base. Equipment costs (G87) amount to the yearly return cost value of the amount spent on modems and computers. Internet access (G88) paid to ISPs is thus the annualized cost of initial connection multiplied by the yearly fee. The charge for the "fixed costs" of web access and accessing email (G89) include the installation and rental of second lines and the calculation of regional and local call charges for 260 days of email access, as above, multiplied by the number of users. Web telephone charges (G90) amount to the cost of a local/ regional three minute call multiplied by twenty (to give an approximate cost of an hour-long call) multiplied by the number of hours on line, calculated for local and then regional users. For the user, telephone savings equal the revenue lost to the telecommunications company excluding the calculations made for accounting charges (G60 to G61 minus the accounting rate adjustment and G64 to G67).
The final part of the model calculates hypothetical cost and revenue streams from expanded Internet access (J51 to N75). These calculations are largely based on those above. We have assumed that future users will utilize the Internet as much as the first users on whom email substitution rates and Web access rates are based. Given that we would expect the first Internet users to be those with the most to gain in communications savings and Web access, this is an oversimplification. Later users will be those who make fewer international calls and have less interest in accessing the Web. These estimates exaggerate ISP equipment needs, telecom income losses from substitution and new equipment needs, telecom gains from time spent on the Web and user costs and benefits. Given the fixed costs of email, this will mean that user benefits from substitution are overestimated. As ISP revenues are (in this model) independent of usage, their profits will be higher. The negative effect of email substitution will be lower for telecommunications companies. The revenues from web surfing will be somewhat lower as will the costs of providing new equipment. Under usual circumstances, this suggests that the model will overestimate the negative effects of an expanded Internet on telecommunications companies.
ISP, hypothetical cost, revenue
ISP costs, as above, have a fixed component (K53). This consists of a license, phone installation and rental, basic computer equipment, other setup costs, fixed setup costs for the leased line/ VSAT, local telecommunications company charges for the VSAT I
89

Economic Toolkit for African Policy Makers
90
LL link, foreign charges for the VSAT I LL link and the cost of connection to the Internet backbone. As more users are added, costs go up (L53 to N53). New subscribers require more user support, more telephones, more computers and a larger VSAT / LL connection. ISP revenues (K54 to N54), as above, are a fixed connection fee and a fixed yearly fee multiplied by the number of users.
Telecommunications company income, revenue
The telecommunications company revenue calculation (K62 to N62) is made as above ((G51 to G55), taking account of new phone lines installed at the ISP and by users, ISP licenses, VSAT I LL charges and user telephone call charges. The cost to telecommunications companies (K63 to N63) is based on a new formula (above, we only calculated revenues). The calculation is based on the cost of installing and operating the telecommunications equipment involved in servicing ISPs and user. These costs in turn are: the cost of running the VSAT or leased line, the initial user line into the ISP, the cost of subsequent lines into the ISP and out of the users who order a second line, the cost of expanding VSAT connections or leased line connections and the cost of providing extra switch and transmit equipment to handle the longer calls made to access the Internet. The total of present actual phone company revenue lost from users switching to email (K65 to N65) calculated is scaled up from the earlier revenue lost calculation (G60 to G67) by the number of hypothetical users over present day users in the model, to give a straight-line estimate of revenue lost to email substitution. This is an over-simplification - as the number of email users in the country increases, the percentage of email with a local destination will increase. A straight-line estimate will thus over-estimate the scale of substitution losses to telecommunications companies.
User costs, revenue
User costs (K73 to N73) are calculated as above (at G87 to G90). User substitution (K75 to N75) is calculated as above (at G91). This does not include all user benefits. Unaccounted for are the benefits of email that is not substituting for fax or voice (i.e. the majority of email traffic) and the benefit of web access. Obviously, there is a large consumer surplus here.

Calculations
Assumptions
E82-83: To calculate the yearly return to capital required to pay the cost of capital (for goods for which do not need to be replaced) and depreciation (for goods that will have to be replaced), the following equations were used: The formula for a perpetuity is PV= C/ r, where PV is the present value, C the yearly cash payment and r the real cost of capital. The yearly cash payment required to cover a present value expenditure is C= PV*r. For one off payments for goods which have a very long life (for example, telephone connection for the recipient) or one-off receipts (for example, the payment for initial telephone connection for the telephone company), this formula was used to calculate the effective yearly cash cost or income of the present payment or receipt. Thus, the YRC (yearly return to capital) rate is equal to r, the cost of capital.
E84 to E86: The formula for an annuity is PV= C[l Ir -1 I r(l + r)At], where PV is the present value, C the yearly cash payment, r the real cost of capital and t the number of years over which the annuity is paid. The yearly cash payment required to cover a present value expenditure for a good that will need to be replaced int years is C= PV /[1/r - 1/r(l + r)At]. For one-off purchases of goods that have a short life (for instance, computers), this formula was used to calculate the effective yearly cash cost or income of the present purchase. Thus, the YRC (yearly return to capital) rate is equal to [1 I cost of capital - 1 /(cost of capital* ((1 + cost of capital) I\ number of years depreciation))]
User savings and telecommunications company revenues per page
Fixed cost to user per page
GlO: 0
GH: (Cost of fax machine)* (yearly return requirement for user computer equipment)2
G12: ((initial connection fee)* (user cost of capital))+ ((cost of computer plus modem) * (yearly return requirement for user computer equipment))+ (yearly web connection fee)
2 As calculated above, taking into account depreciation and the cost of capital.
91
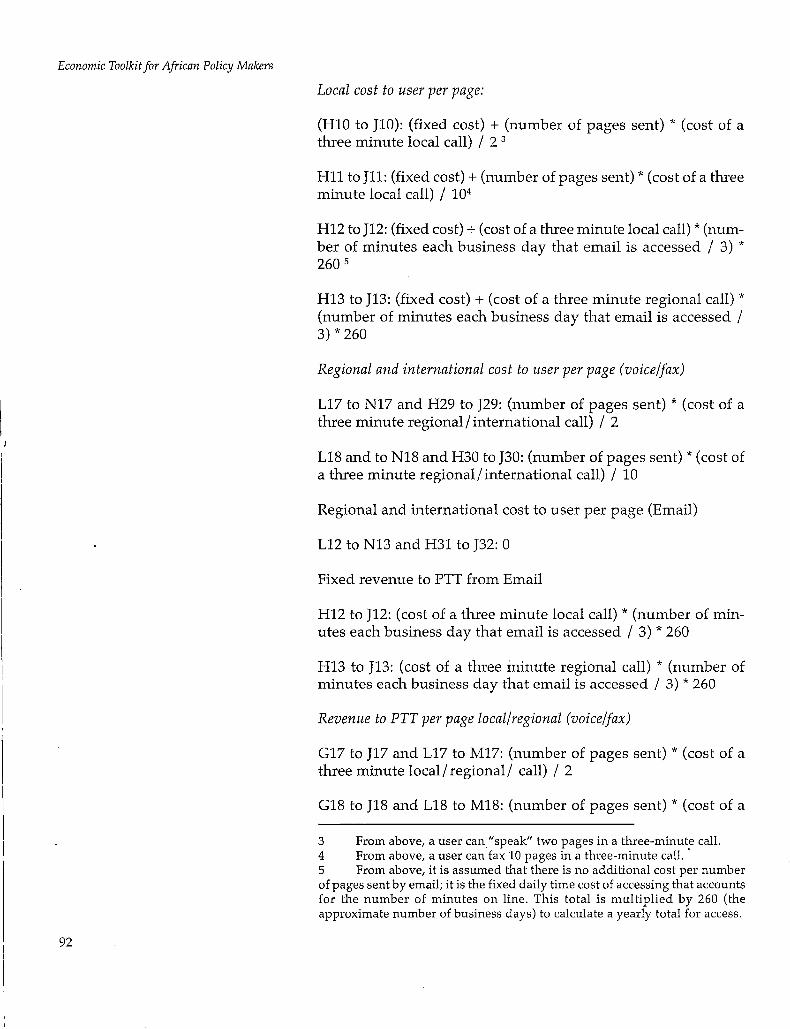
Economic Toolkit for African Policy Makers
92
Local cost to user per page:
(HlO to J10): (fixed cost) + (number of pages sent) * (cost of a three minute local call) / 2 3
H11 to J11: (fixed cost)+ (number of pages sent)* (cost of a three minute local call) / 104
H12 to J12: (fixed cost)+ (cost of a three minute local call)* (number of minutes each business day that email is accessed I 3) * 260 5
H13 to J13: (fixed cost) +(cost of a three minute regional call)* (number of minutes each business day that email is accessed I 3) * 260
Regional and international cost to user per page (voice/fax)
L17 to N17 and H29 to J29: (number of pages sent)* (cost of a three minute regional/ international call) I 2
L18 and to N18 and H30 to J30: (number of pages sent)* (cost of a three minute regional/ international call) I 10
Regional and international cost to user per page (Email)
L12 to N13 and H31 to J32: 0
Fixed revenue to PTT from Email
H12 to J12: (cost of a three minute local call)* (number of minutes each business day that email is accessed I 3) * 260
H13 to J13: (cost of a three minute regional call) * (number of minutes each business day that email is accessed / 3) * 260
Revenue to PTT per page local/regional (voice/fax)
G17 to J17 and L17 to M17: (number of pages sent)* (cost of a three minute local/ regional/ call) I 2
G18 to J18 and L18 to M18: (number of pages sent)* (cost of a
3 From above, a user can "speak" two pages in a three-minute call. 4 From above, a user can.fax 10 pages in a three-minute call. · 5 From above, it is assumed that there is no additional cost per number of pages sent by email; it is the fixed daily time cost of accessing that accounts for the number of minutes on line. This total is multiplied by 260 (the approximate number of business days) to calculate a yearly total for access.

three minute local/ regional call) / 10
Revenue to PTT per page from home user, international (voice/fax)
H29 to J29: (number of pages sent * cost of a three minute regional/ international call) I 2 - (one minute accounting rate* 3 *number of pages sent) / 4)6
H30 to J30: ((number of pages sent) * (cost of a three minute regional/ international call) / 2) - (one minute accounting rate* 3 *number of pages sent) / 20) 7
Revenue to PTT per page from overseas sender
H45 to J45: (one minute accounting rate* 3 *number of pages sent) I 4
H46 to J46: (one minute accounting rate * 3 * number of pages sent) I 20
· 1 Revenue to PTT from regional and international Email
L19 to N20, H38 to J39 and H37 to J37: 0
Telecommunications company revenue gained
G51: (ROUNDUP( average no. of second lines per user))* (number of web users)* ((yearly rental) +(installation*real cost of capital for telco))
G52: ((proportion of users with local access*number of web users*cost of 3 minute local call*length of email access each day(in minutes)/3*260)+((1-proportion of users with local access)*number of web users*cost of 3 minute regional call*length of email access each day /3*260)+( proportion of users with local access *average user hours of web access*number of users*20*cost of three minute local call+(l- proportion of users with local access)*average user hours of web access*number of users*20*cost of three minute regional call))8
6 The accounting rate calculation is divided by four rather than by two, because the telco only passes on half of the accounting rate to its international partner. 7 The accounting rate calculation is divided by 20 rather than by 10, because the telco only passes on half of the accounting rate to its international partner. 8 The cost of a three-minute call is multiplied by 30 in this calculation to give a cost per hour of the telephone call.
93

Economic Toolkit for African Policy Makers
J
)'
94
G53: (ISP licence)
G54: (((ROUNDUP((Number of users/ISP subscribers per line))))*(phone installation*telco cost of capital+phone yearly rental))9
G55: ((ROUNDUP((Number of users/ISP subscribers per 64 kbs of VSAT /LL connection))))*(charge for 64 kbs of VSAT /LL connection)
Telco revenue lost
G60: (((cost of three minute international call-1.5*accounting rate)*0.5)*(%email replacing phone/100)*(%email with international destination/lOO)*average no. email sent/yr*average length of email*no. of users)
G61: (((cost of three minute international call -1.5* accounting rate)*O.l)*( % email replacing fax/100)*( %email with international destination /100)* average no. email sent/yr*average length of email*no. of users)
G62: (((1.5* accounting rate)*0.5)*( %email replacing phone I 100)*( average no. of email received/year-(( average no. email sent/yr*(% email local destination +%email regional destination)/100)))* average length of email*no. of users)
G63: (((1.5* accounting rate)*O.l)*( % email replacing fax I 100)*( average no. of email received/year -((average no. email sent/ yr *( % email local destination+ %email regional destination) I 100)))* average length of email*no. of users)
G64: (((regional call cost)*0.5)*( %email replacing phone /100)*( %email regional destination /100)* average no. email sent/ yr*average length of email*no. of users)
G65: (((regional call cost)*0.1)*( % email replacing fax /100)*( %email regional destination /100)* average no. email sent/ yr* average length of email*no. of users)
G66: (((local call cost)*0.5)*( %email replacing phone /100)*( % email local destination I 100)* average no. email sent/ yr* average length of email*no. of users)
9 The "Round Up" command rounds up the result in brackets following tothe nearest whole number (since it is not possible to have half a telephone).
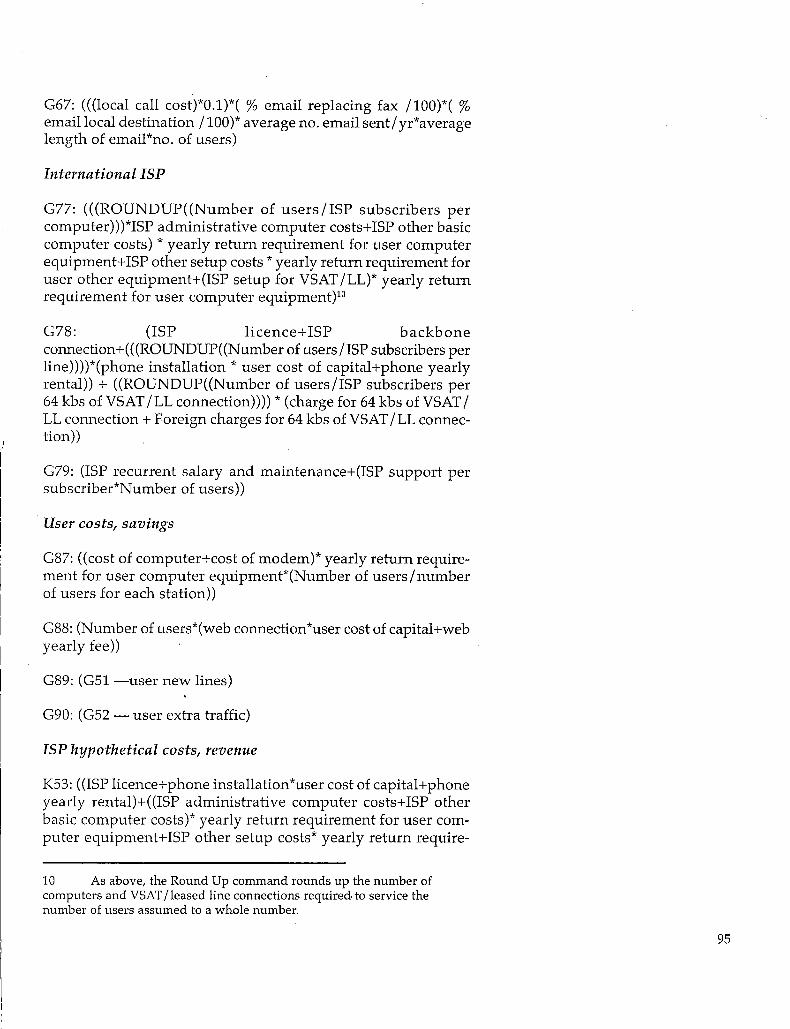
G67: (((local call cost)*0.1)*( % email replacing fax /100)*( % email local destination I 100)* average no. email sent/ yr* average length of email*no. of users)
International ISP
G77: (((ROUNDUP((Number of users/ISP subscribers per computer)))*ISP administrative computer costs+ ISP other basic computer costs)* yearly return requirement for user computer equipment+ ISP other setup costs* yearly return requirement for user other equipment+(ISP setup for VSAT /LL)* yearly return requirement for user computer equipment)10
G78: (ISP licence+ ISP backbone connection+(((ROUNDUP((Number of users/ISP subscribers per line))))*(phone installation *user cost of capital+phone yearly rental)) + ((ROUNDUP((Number of users/ISP subscribers per 64 kbs of VSAT /LL connection))))* (charge for 64 kbs of VSAT I LL connection+ Foreign charges for 64 kbs of VSAT /LL connection))
G79: (ISP recurrent salary and maintenance+(ISP support per subscriber*Number of users))
User costs, savings
G87: ((cost of computer+cost of modem)* yearly return requirement for user computer equipment*(Number of users I number of users for each station))
G88: (Number of users*(web connection*user cost of capital+web yearly fee))
G89: (G51 -user new lines)
G90: (G52 - user extra traffic)
ISP hypothetical costs, revenue
K53: ((ISP licence+phone installation*user cost of capital+phone yearly rental)+((ISP administrative computer costs+ISP other basic computer costs)* yearly return requirement for user computer equipment+ISP other setup costs* yearly return require-
10 As above, the Round Up command rounds up the number of computers and VSAT /leased line connections required. to service the number of users assumed to a whole number.
95
Economic Toolkit for African Policy Makers
96
ment for user other equipment+(ISP setup for VSAT /LL* yearly return requirement for user computer equipment)+charge for 64 kbs of VSAT /LL connection+ Foreign charges for 64 kbs of VSAT /LL connection+ISP recurrent salary and maintenance)+ ISP backbone connection)
L53 to N53: (ISP support per subscriber*no. users+((ROUNDUP((no. users /ISP subscribers per line))l))*(phone installation*user cost of capital+phone yearly rental)+((ROUNDUP((no. users/ISP subscribers per computer))l))*(ISP administrative computer costs* yearly return requirement for user computer equipment)+((ROUNDUP((no. users/ ISP subscribers per 64 kbs of VSAT /LL connection))-l))*(Foreign charges for VSAT /LL+charge for VSAT /LL)) K54 to N54: (no. users*(web connection*user cost of capital+web yearly fee))
Telecommunications company, income, revenue
K62 to N62: ((phone installation*telco cost of capital)+(charge for VSAT /LL+ ISP licence+phone yearly rental)) + ((ROUNDUP((no. users/ISP subscribers per line)))-l)*(phone installation*telco cost of capital+phone yearly rental)+((ROUNDUP((no. users/ISP subscribers per VSAT / LL)))-l)*(charge for VSAT /LL)+((ROUNDUP((no. users* Average second line per user)))-l)*(phone installation*telco cost of capital+phone yearly rental)+(Users with local access*no. users*(3 min local call*number of minutes each business day that email is accessed I 3*260+user web access yr*3 min local call*20))+((1-Users with local access)*no. users*(3 min regional call*number of minutes each business day that email is accessed /3*260+user web access yr*3 min regional cal1*20)))
K63 to N63: (Telco cost of VSAT /LL)+((Telco cost of main line, initial* yearly return requirement for telco equipment+ Telco cost of main line, recurring)) +(Telco cost of second main line, initial* yearly return requirement for telco equipment+ Telco cost of second main line, recurring)*((ROUNDUP((no. users /ISP subscribers per line))-l)+(ROUNDUP((no. users*Average second line per user))-l))+(ROUNDUP((no. users/ISP subscribers per 64 kbs of VSAT /LL))-l)*Telco cost of 64 kbs of VSAT / LL+((ROUNDUP((no. users*no. of switches for each user))l)*(Telco cost of switch and transmit, initial* yearly return requirement for telco equipment+ Telco cost of switch and transmit, recurring)))
K65 to N65: ((telco revenue lost in fixed model*no. users in hypothetical model)/Number of users in fixed model)

I I
! . I
I
Users, costs, benefits
K73 to N73: (hypothetical no. users*(((cost of computer+cost of modem) I number of users per terminal))* yearly return requirement for user computer equipment+web connection*user cost of capital +web yearly fee+telco revenue from user extra traffic in fixed model/Number of users in fixed model+user new lines in fixed model/Number of users in fxed model))
K75 to K95: ((savings in fixed model*no. users in hypothetical model)/Number of users in fixed model)
97


