
1
Why further eurozone integration could hurt Europe’s competitiveness
2
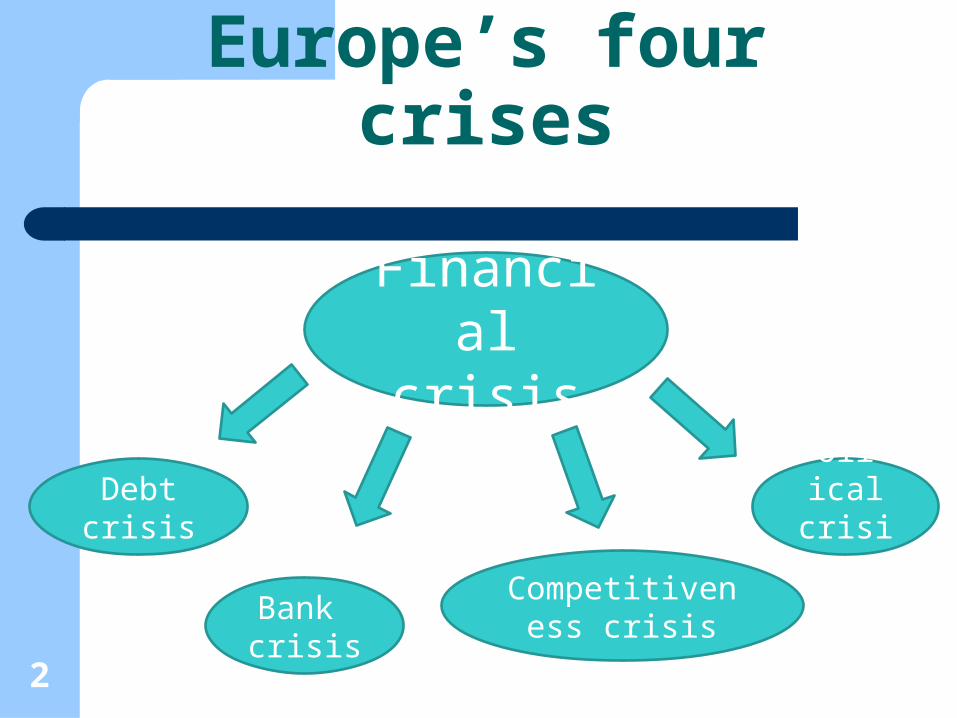
Financial crisis
Debt crisis
Bank crisis
Competitiveness crisis
Political crisis
Europe’s four crises

3
The role of the euro
The crisis started in the US
but... ...the euro locked it in:
– One-size-fits-all interest rates– Perverse incentives – Exposed tremendous imbalances– Political stalemate
4
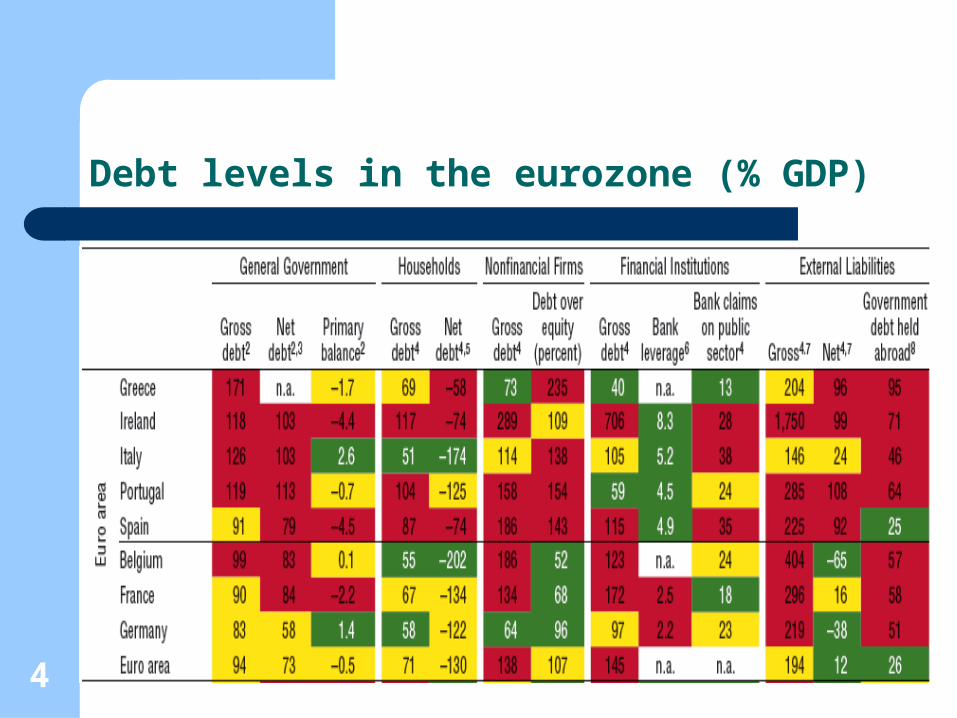
Debt levels in the eurozone (% GDP)

5
Debt crisis: Financing needs PIIGS 2013 - 2015 (€bn)
2013
2014
2015
0 50 100 150 200 250 300 350 400 450 500
GreeceIrelandItalyPortugalSpain
6
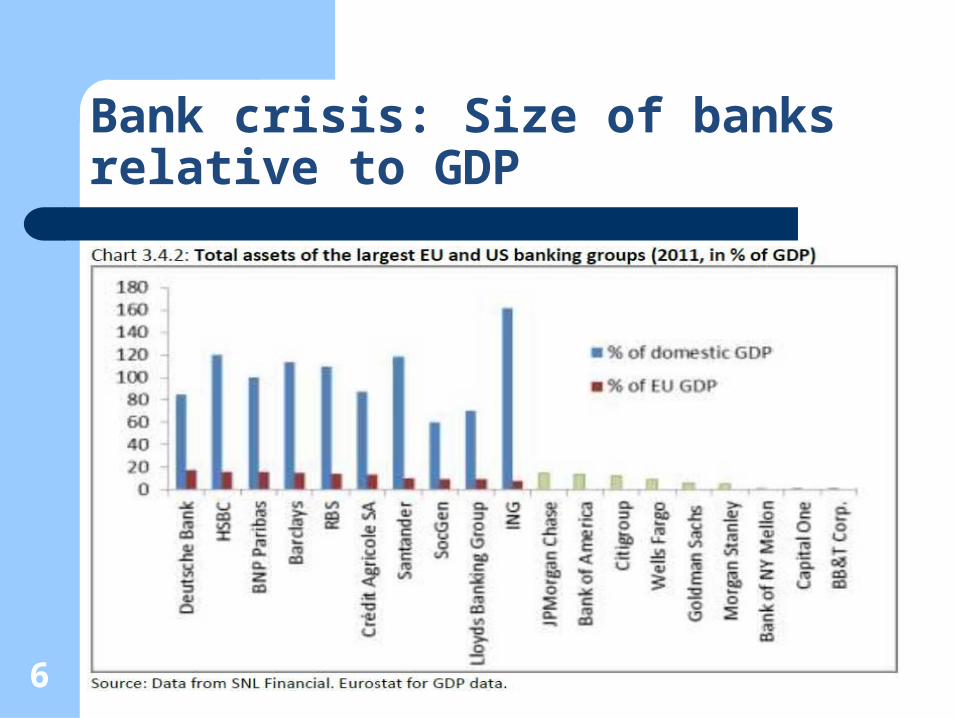
Bank crisis: Size of banks relative to GDP
7
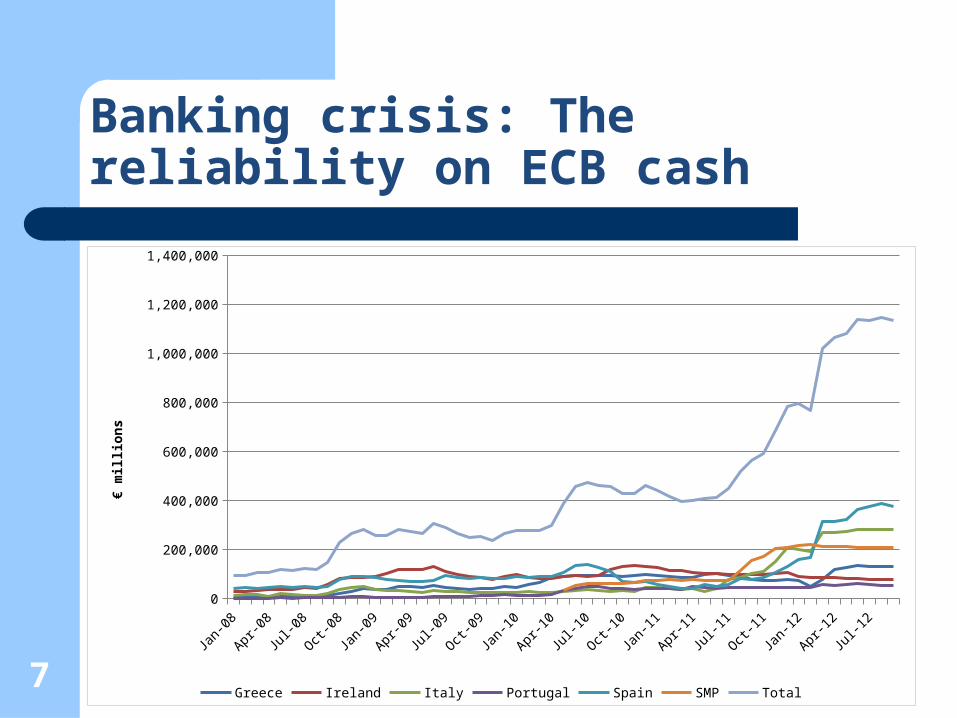
Banking crisis: The reliability on ECB cash
Jan-08
Mar-08
May-08
Jul-08
Sep-08
Nov-08Jan
-09
Mar-09
May-09
Jul-09
Sep-09
Nov-09Jan
-10
Mar-10
May-10
Jul-10
Sep-10
Nov-10Jan
-11
Mar-11
May-11
Jul-11
Sep-11
Nov-11Jan
-12
Mar-12
May-12
Jul-12
Sep-12
0
200,000
400,000
600,000
800,000
1,000,000
1,200,000
1,400,000
Greece Ireland Italy Portugal Spain SMP Total
€ m
illio
ns

8
Bank crisis / debt crisis: Net Balance within Eurosystem / Target [€bn]
Jan-07
May-07
Sep-07
Jan-08
May-08
Sep-08
Jan-09
May-09
Sep-09
Jan-10
May-10
Sep-10
Jan-11
May-11
Sep-11
Jan-12
May-12
-1,250,000
-750,000
-250,000
250,000
750,000
1,250,000
GIIPS
DNLF
DNLF = Germany, Netherlands, Luxembourg, FinlandGIIPS = Greece, Italy, Ireland, Portugal, Spain
Euro Crisis MonitorInstitute of Empirical Economic Research
Osnabrück University
9
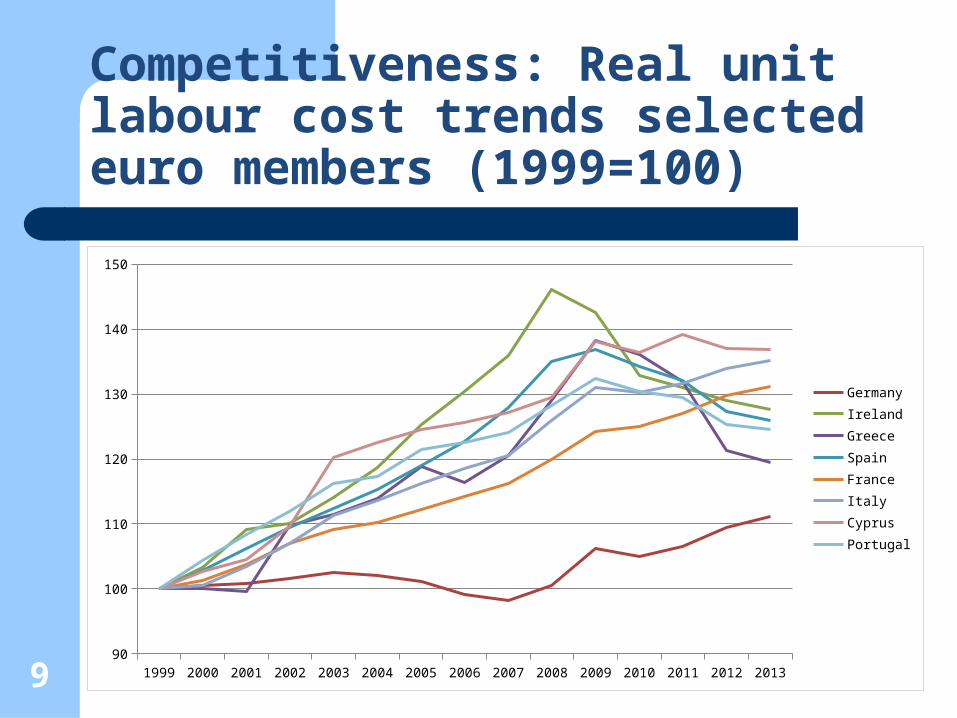
Competitiveness: Real unit labour cost trends selected euro members (1999=100)
1999 2000 2001 2002 2003 2004 2005 2006 2007 2008 2009 2010 2011 2012 201390
100
110
120
130
140
150
GermanyIrelandGreeceSpainFranceItalyCyprusPortugal

10
Competitiveness: Internal devaluation
Greece Ireland Italy Portugal Spain0
5
10
15
20
25
30
35
40
45
50
Peak20112012
Diffe
renc
e to
Ger
man
labo
ur co
sts (
%)

112000Q1
2000Q3
2001Q1
2001Q3
2002Q1
2002Q3
2003Q1
2003Q3
2004Q1
2004Q3
2005Q1
2005Q3
2006Q1
2006Q3
2007Q1
2007Q3
2008Q1
2008Q3
2009Q1
2009Q3
2010Q1
2010Q3
2011Q1
2011Q3
2012Q10
5
10
15
20
25
30
35
40
45
EU (Total) PIIGS (Total) EU (Youth) PIIGS (Youth)
Competitiveness: Unemployment levels (%)
12
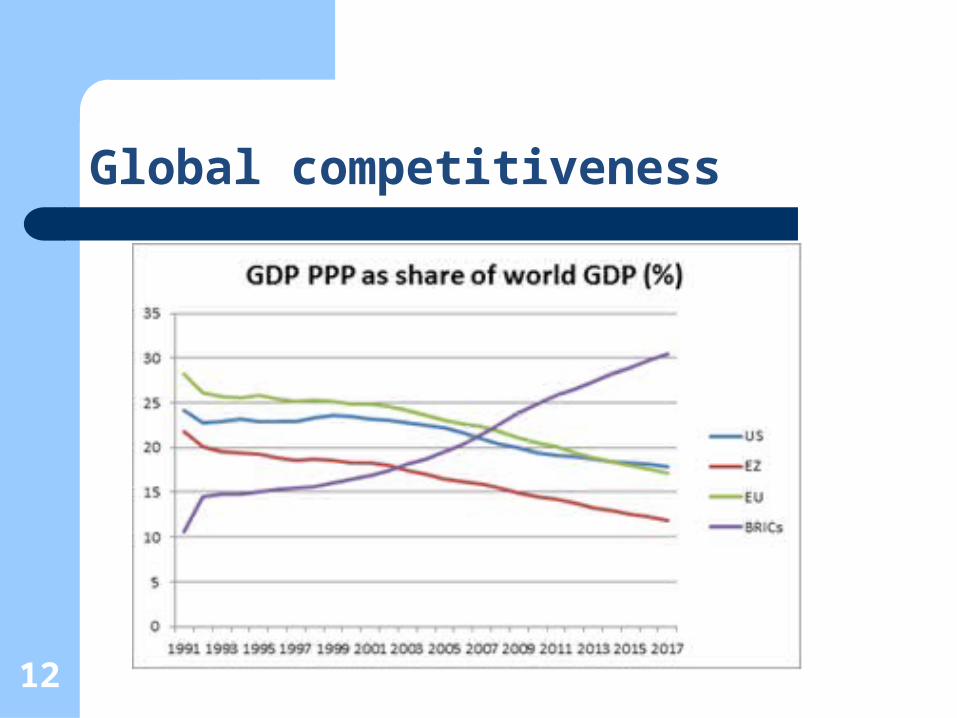
Global competitiveness

13
Global competitiveness
1995 1996 1997 1998 1999 2000 2001 2002 2003 2004 2005 2006 2007 2008 2009 2010 2011 2012 2013
-3.0
-2.0
-1.0
0.0
1.0
2.0
3.0
4.0
Labour productivity growth (%)
Euro area Total OECD
14
Is fiscal / banking union the answer?
“Inexorable logic” of the euro? Joint back stop for banks (deposit guarantee
scheme / resolution fund) Fiscal distribution (eurobonds / transfers)

15
1. Can Germany afford it?
Superman: "Easy, Miss, I've got you."
Lois Lane: "You...you've got me, who's got you?"

16
Germany’s demographic trends
2010 2020 2030 2050 20600.00
10.00
20.00
30.00
40.00
50.00
60.00
70.00
80.00
90.00
Figure: Eurozone population projections selected member states 2010 - 2060 (millions)
DE
FR
IT
ES

17
2. How to avoid moral hazard in a fiscal / banking union?
Will it be possible to incentivise reforms in a fully fledged fiscal / banking union?
How to avoid déjà vu? Berlin’s answer: strict central controls
18
Political crisis: 17 national democracies
17 national parliaments Electoral cycles Constitutional limitations Public opinion No demos
= Massive risk of political backlash
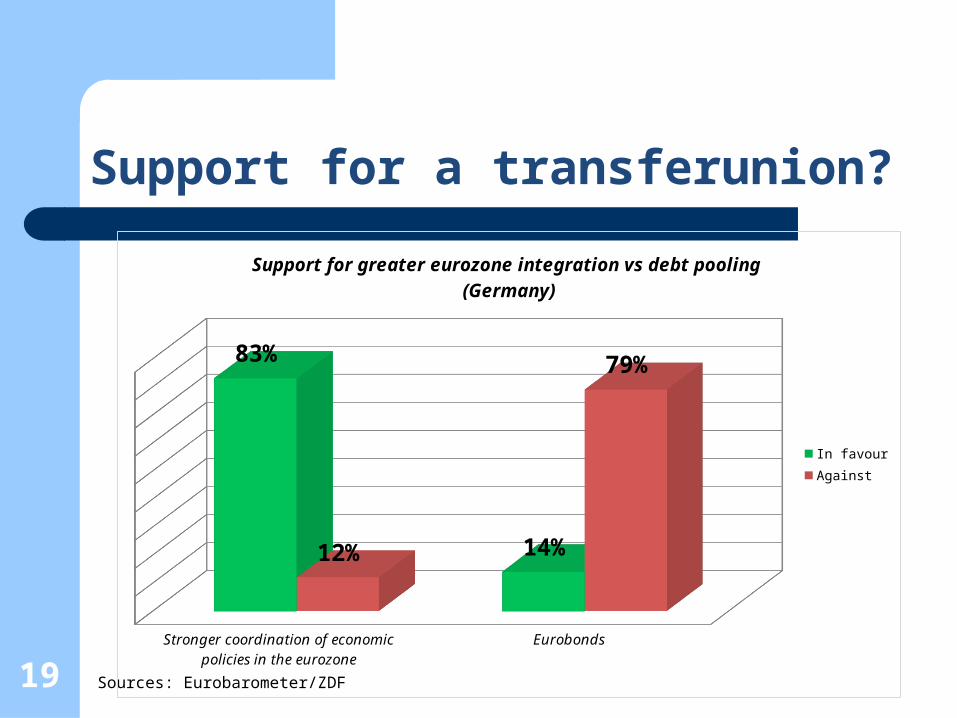
19
Support for a transferunion?
Sources: Eurobarometer/ZDFStronger coordination of economic policies
in the eurozone Eurobonds
83%
14%12%
79%
Support for greater eurozone integration vs debt pooling (Germany)
In favour
Against

20
Support for central fiscal controls?
2001 2002 2003 2004 2005 2006 2007 2008 2009 2010 2011 20120
10
20
30
40
50
60
70
80
Do you trust the EU (Portugal, Ireland, Italy, Greece, Spain)?
Trust Do not Trust

21
What alternatives?
Muddle through: Cash for austerity Transfer-union / bank-union: Who’ll be lender
of last resort? Political and economic price? Euro break-up: Greece or more countries?


