
What Matters to Individual Investors? Evidence from the Horse’s Mouth*
James J. Choi Yale University and NBER
Adriana Z. Robertson University of Toronto
August 31, 2018
Abstract
We survey a representative sample of U.S. individuals about how well leading academic theories
describe their financial beliefs and decisions. We find substantial support for many factors
hypothesized to affect portfolio equity share, particularly background risk, investment horizon,
rare disasters, transactional factors, and fixed costs of stock market participation. Individuals tend
to believe that past mutual fund performance is a good signal of stock-picking skill, actively
managed funds do not suffer from diseconomies of scale, value stocks are safer and do not have
higher expected returns, and high-momentum stocks are riskier and do have higher expected
returns.
* We thank Ravi Bansal, Nicholas Barberis, Sebastien Betermier, Hector Calvo Pardo, John Campbell, Raj Chetty, Joao Cocco, Lorenzo Garlappi, Richard Evans, Vincent Glode, William Goetzmann, Luigi Guiso, Jonathan Ingersoll, Ravi Jagannathan, Marcin Kacperczyk, Panu Kalmi, Raymond Kan, Alina Lerman, Tobias Moskowitz, Stefan Nagel, Monika Piazzesi, Jonathan Reuter, Thomas Rietz, Harvey Rosen, Robert Shiller, Tao Shu, Paolo Sodini, Matthew Spiegel, Adam Szeidl, Richard Thaler, Selale Tuzel, Raman Uppal, Annette Vissing-Jørgensen, Jessica Wachter, Stephen Wu, Amir Yaron, Jianfeng Yu, and seminar participants at the American Finance Association Annual Meeting, Canadian Economic Association Annual Conference, Baruch, Baylor, CEPR Household Finance Workshop, Cornell, Drexel, FIRS Conference, FSU SunTrust Beach Conference, Helsinki Finance Summit on Investor Behavior, University of Miami, NBER Behavioral Finance Meeting, NYU, USC, and Yale for their comments. All shortcomings in the survey and analysis are our own. This research was supported by a Whitebox Advisors research grant administered through the Yale International Center for Finance.

1
The finance literature offers no shortage of theories about investor motivations and beliefs,
which translate into choices and in aggregate determine asset prices. However, testing these
theories with observational data has been difficult. Finding exogenous empirical variation in a
hypothesized factor is usually impossible, and when exogeneity is present, identification
frequently relies upon the assumption of rational expectations, which may not hold. Even estimates
from valid instrumental variable designs are only local average treatment effects, often within
special subpopulations, making assessments of which factors are quantitatively most important in
general tenuous. If we abandon the search for exogeneity and evaluate models based on their ability
to match endogenous moments in the data, we run up against the difficulty that predictions of
competing models are often similar or identical (Fama, 1970; Cochrane, 2017; Kozak, Nagel, and
Santosh, 2017).1
We take a different approach in this paper: we ask a nationally representative sample of
1,013 U.S. individuals in the RAND American Life Panel how well leading academic theories
describe the way they decided what fraction of their portfolio to invest in equities, their beliefs
about actively managed mutual funds, and their beliefs about the cross-section of individual stock
returns. Our questions aim to test key assumptions of leading theories about investor motivations
and beliefs more directly than the usual method of trying to infer the validity of these assumptions
by examining downstream outcomes. Because we test a wide range of theories on the same sample
using the same research design, it is easier to make apples-to-apples comparisons of different
theories. High-wealth investors constitute only a small fraction of our sample, so our results are
more informative about individual choices and beliefs than asset prices. Nevertheless, our findings
may be relevant for reconciling the behavior of aggregate consumption with asset prices because
consumption is much more equally distributed than wealth.2
We find substantial support for many of the leading theories of how individuals determine
their portfolio’s equity share. Among motives coming from representative-agent asset pricing
models, we find especially strong support for fear of rare disasters, with 45% of respondents
1 Distinguishing between models that are observationally equivalent in existing data can be important because they may have different welfare or policy implications. For example, knowing that the stock market’s expected returns vary because of irrational cashflow forecasts instead of rational time-varying risk aversion would have profound implications. 2 In 2016, the 95th to 50th percentile ratio in the U.S. was 24.5 for wealth but only 3.1 for consumption (Fisher et al., 2018).
2
describing concern about economic disasters as a very or extremely important factor in
determining the current percentage of their investible financial assets held in stocks. However,
there is also significant evidence for the importance of long-run aggregate consumption growth
risk (30%), long-run aggregate consumption growth volatility risk (26%), consumption
composition risk (29%), loss aversion (28%), internal habit (27%), and ambiguity/parameter
uncertainty (27%). Consumption commitments, which can be a microfoundation for a
representative agent who has external habit utility, garner significant support as well (36%).
Thirty-five percent of respondents describe the stock market’s contemporaneous return covariance
with the marginal utility of money—the fundamental consideration in many modern asset pricing
and portfolio choice theories—as very or extremely important. Similar numbers describe return
covariance with contemporaneous aggregate consumption growth (30%), with contemporaneous
aggregate consumption growth volatility shocks (29%), and with their own marginal utility of
consumption (29%) as very or extremely important.
Moving to theories that have tended to be applied only at the individual level to portfolio
choice, we find strong support for the importance of time until retirement (48% of employed
respondents) and time until a significant non-retirement expense (36%). Background risks such as
health risk (47%), labor income risk (42% of employed respondents), and home value risk (29%
of homeowners) are frequently rated as very or extremely important. Many people say that
discomfort with the market is a very or extremely important determinant of their equity share,
citing lack of trust in market participants (37%), lack of knowledge about how to invest (36%),
and lack of a trustworthy adviser (31%). Transactional considerations which have received scant
consideration in the academic literature—needing to have enough cash on hand to pay for routine
expenses (47%) and concern that stocks take too long to convert to cash in an emergency (29%)—
are salient. Personal experience of living through stock market returns and personal experience
investing in the stock market are rated as very or extremely important by 27% and 26% of
respondents, respectively. Non-participation in the stock market is frequently driven by the fixed
costs of participation (49% of non-participants) and not liking to think about one’s finances (37%
of non-participants).
Although many factors appear to determine portfolio equity shares, the importance of each
factor is not distributed haphazardly within an individual. Among the 34 factors that were rated by
every respondent, only six principal components suffice to explain 54% of the variance in whether
3
they were rated as very or extremely important. These components can be roughly interpreted as
corresponding to neoclassical asset pricing factors; return predictability and retirement savings
plan defaults; consumption needs, habit, and human capital; discomfort with the market; advice;
and personal experience.
Turning to mutual funds, 51% of those who have purchased an actively managed equity
mutual fund say that the belief that the active fund would give them a higher average return than
a passive fund was very or extremely important in that purchase decision. However, 27% of active
fund investors say that a hedging motive—the belief that the active fund would have lower
unconditional expected returns than the passive fund but higher returns when the economy does
poorly—was very or extremely important. The recommendation of an investment adviser was very
or extremely important for 48% of active fund investors’ decision to buy an active fund. Consistent
with Berk and Green (2004), 46% of all respondents agree or strongly agree that a fund having
outperformed the market in the past is strong evidence that its manager has good stock-picking
skills. But inconsistent with Berk and Green (2004), only 18% agree or strongly agree that funds
have a harder time beating the market if they manage more assets.
Finally, regarding the cross-section of stock returns, collective expectations about the
normal relationship between a stock’s characteristics and its expected returns do not always match
the historical correlations. Twenty-eight percent of respondents expect value stocks to normally
have lower expected returns than growth stocks, a proportion not statistically distinguishable from
the 25% who believe the reverse. On the other hand, consistent with the historical relationship,
more respondents expect high-momentum stocks to normally have higher expected returns than
low-momentum stocks (24%) instead of the reverse (14%). Forty-four percent expect value stocks
to normally be less risky than growth stocks, while only 14% believe the opposite. Twenty-five
percent expect high-momentum stocks to normally be riskier, while 14% expect them to be less
risky.
Surveys on beliefs, motivations, and decision-making processes remain uncommon in
financial economics research despite the deep and enduring influence of Lintner’s (1956) classic
survey work on corporate dividend policy. Some notable recent exceptions in corporate finance
that each seek to test a wide range of academic theories in an area are Graham and Harvey (2001),
Brav et al. (2005), Graham, Harvey, and Rajgopal (2005), Gompers, Kaplan, and Mukharlyamov
(2016), and Gompers et al. (2016). Survey studies of investment professionals with a similarly

4
wide theoretical scope include Cheung and Wong (2000), Cheung and Chinn (2001), and Cheung,
Chinn, and Marsh (2004).3 We view our paper as a contribution to household finance in the spirit
of these earlier papers.4
Survey methodologies of course have weaknesses. Survey respondents might not be highly
motivated to give accurate responses, and the meaning of each response category (e.g., “very
important”) probably differs across respondents. However, to the extent that such measurement
error is white noise, the ordinal ranking of importance and agreement ratings will still be
informative. More fundamentally, individuals might not know the true motivations for their
decisions, either because they have not introspected seriously enough, their memory has faded, or
they were subliminally influenced. A related critique is the “as if” argument of Friedman (1956):
survey respondents may not regard a certain factor as important but nonetheless invest as if it were.
Under this view, the fact that an assumption about investors’ thought processes is false is
unimportant as long as it generates accurate predictions of behavior.
Our survey measures how individuals consciously perceive themselves to be making
financial decisions. Although individuals may not have full insight into the true reasons behind
their decisions, we argue that it is worthwhile to understand these perceptions for at least four
reasons. First, an individual’s perceptions of her decision-making process are unlikely to be
entirely unrelated to her true decision-making process. We suspect that even the most ardent
acolyte of Friedman does not dismiss conversations with friends and family members as
completely uninformative about their thinking and motivations. And ceteris paribus, a model based
on assumptions that are closer to the truth may be more likely to successfully predict behavior out
of sample. Harris and Keane (1999) find that relative to a model that tries to predict health
insurance plan choices using only plan attributes, adding individuals’ survey responses about how
important these health insurance plan attributes are to them doubles the model’s predictive power.
Hausman (1992) argues that having no interest in the accuracy of a theory’s assumptions is akin
to relying entirely on a road test to predict the future driving performance of a used car and
3 Other survey studies of investment professionals that each focus on a narrower set of practices, beliefs, or channels include Shiller and Pound (1989), Taylor and Allen (1992), Menkhoff and Schmidt (2005), Menkhoff, Schmidt, and Brozynski (2006), Drachter, Kempf, and Wagner (2007), Lütje and Menkhoff (2007), and Menkhoff (2010). 4 There is also a large number of papers that study survey data on individual investors’ return beliefs (e.g., Shiller, 2000; Vissing-Jørgensen, 2003; Bacchetta, Mertens, and van Wincoop, 2009; Kézdi and Willis, 2011; Malmendier and Nagel, 2011; Amromin and Sharpe, 2014; Greenwood and Shleifer, 2014; Kuhnen and Miu, 2017; Das, Kuhnen, and Nagel, 2017).

5
disregarding observations of what is under its hood. Second, individuals’ perceptions of their
decision-making process affect how they will forecast their future actions, which itself is an input
into their actions today. Third, these perceptions can affect an individual’s demand for debiasing
mechanisms, information, and advice. Finally, we believe that it is inherently interesting to know
what individuals believe about themselves and the reasons for their behavior. Barberis et al. (2015)
argue that theory should endeavor to match survey measures of investor beliefs.
The remainder of the paper proceeds as follows. Section 1 discusses the process of
designing our questions and our survey sample. Section 2 presents our questions and results
relating to individuals’ equity allocation decisions. Section 3 presents the same for actively
managed equity mutual funds. Section 4 discusses our questions and results regarding investors’
perceptions of value and momentum stocks. Section 5 concludes. An online appendix contains the
full survey text.
1. Survey design and sample Our goal was to test a broad swath of the leading theories on the determinants of portfolio
equity share and the reasons individuals invest in actively managed mutual funds, and to get a
general sense for how individuals think about the cross-section of stock returns. We designed each
question to map as closely as possible to the applicable theory or concept while excluding other
theories or concepts and remaining comprehensible to a layperson.
We pilot-tested our survey questions using U.S. respondents recruited on Amazon’s
Mechanical Turk online labor market platform. To confirm that our respondents understood the
questions, we included “I don’t understand” as an answer option. We also included a free response
question at the end of the equity allocation section that gave respondents an opportunity to write
in additional factors that we had not mentioned in the survey. Based on the responses, we revised
our questions and added several new ones to the survey. We then ran a second pilot using
Mechanical Turk to confirm that these new questions were understood by respondents.
Next, we solicited feedback on the questions from other researchers, particularly those
associated with theories we wished to test. After a second round of revisions, we ran a third
Mechanical Turk pilot to confirm that the new questions were clear to respondents. For the
overwhelming majority of the questions in our final pilot (61 out of 68), fewer than 1% of

6
respondents reported that they did not understand the question. Even the least understood question
had a “do not understand” rate of under 3% of respondents.
We conducted our final survey on the RAND American Life Panel (ALP), a sample of U.S.
individuals at least 18 years of age. Panelists are paid to answer survey questions. The payment
offered is based on the anticipated time it will take to answer the survey, at a rate of $40 per hour
and a minimum of $3 per survey. RAND charged us $34,500 to circulate a survey invitation to
2,148 members of the ALP, with a target sample size of about 1,000 survey completions. Because
we reached the target number of survey completions sooner than expected, the survey invitation
was closed early. Of those invited, 1,255 read our informed consent disclosure and 1,202 gave
consent. Out of the 1,202 who consented, 1,080 reported being “the person in your family most
knowledgeable about your assets, debts, and retirement planning,” which is a screen based on the
criterion used to identify the “financial respondent” in the Health and Retirement Study. An
additional 27 reported sharing that status equally with a spouse or partner. These 1,080 + 27 =
1,107 were then asked if they would like to answer additional questions in exchange for additional
monetary compensation.5 Of the 1,098 who opted to do, we drop 46 individuals because they did
not answer any of our substantive questions, and an additional 39 because they gave identical
responses to all the equity allocation factor questions, leaving 1,013 in our final sample.
The surveys were completed between December 14, 2016 and December 27, 2016. We
anticipated that the survey would take approximately 10 minutes to complete, and the median
respondent actually took 13 minutes. Responses are weighted using raked sample weights provided
by the ALP to form a nationally representative sample of primary financial decision-makers.6 All
percentages reported hereafter are weighted percentages.
5 When asking the question about financial knowledge, we gave no indication that identifying oneself as a primary financial decision-maker would result in an opportunity to earn more money. Consistent with our finding a high fraction of respondents reporting that they are the person most knowledgeable about their finances, a 2014 Money magazine survey that found that among married adults ages 25 or over with household income of at least $50,000, 97% of men and 79% of women say that they are the primary or co-equal decision-maker on investments (http://time.com/money/2800576/ love-money-by-the-numbers, accessed March 16, 2017). We have also computed the results separately for unmarried individuals and find that their answers are highly correlated with those of married individuals. For example, the correlation is 0.87 pooling across the fraction reporting that an equity allocation factor is very or extremely important, the fraction reporting that a factor is very or extremely important in the decision to buy an actively managed mutual fund, the fraction reporting that they agree or strongly agree with an empirical claim about actively managed mutual funds, the fraction responding that a cross-sectional factor is associated with higher risk, and the fraction responding that a cross-sectional characteristic is associated with higher expected returns. 6 Raking was based on gender, age, race/ethnicity, education, number of household members, and household income. See https://alpdata.rand.org/index.php?page=weights for more details.
7
2. Equity Share of Portfolio The first section of the survey asks about the factors that determine the fraction of the
individual’s wealth invested in equities. We begin by asking respondents the value of their
investible financial assets7 and what percentage of these assets is invested in stocks, either directly
or through mutual funds. We classify the 41% of respondents who report a zero allocation to
equities as non-participants, and the 59% who report a positive allocation as participants.8
We then ask participants, “How important are the following factors in determining the
percentage of your investable financial assets that is currently invested in stocks?” Non-
participants are asked, “How important are the following factors in causing you to not currently
own any stocks?” The answer options for each question are “not important at all,” “a little
important,” “moderately important,” “very important,” and “extremely important.”9
The factors are presented to all respondents in the same order. For the exposition that
follows, we group the factors into six categories: factors from neoclassical asset pricing models,
background risks and assets, nonstandard preferences, expected return beliefs, social and personal
factors, and miscellaneous factors. When the direction in which a particular factor should push the
equity share does not seem self-evident, we ask respondents follow-up questions regarding the
directional effect of the factor.
We begin with a high-level summary of the results across all categories, presented in Table
1, to see which factors are globally most important. The first column shows the percent of
respondents who report that each factor is very or extremely important. The second column shows
the percent who report each factor to be moderately, very, or extremely important. The third
column shows the mean rating where each possible response is given a numerical value between
1 and 5 (where 5 represents “extremely important”). The fourth column shows the average value
of a standardized variable designed to capture whether a respondent indicated that a factor is
7 We specify that this value should include “bank accounts, brokerage accounts, retirement savings accounts, investment properties, etc., but NOT the value of the home(s) you live in or any private businesses you own.” 8 This rate of stock market participation is somewhat higher than the 48.8% reported in the 2013 Survey of Consumer Finances (Bricker et al., 2014). Seven respondents did not answer the equity allocation question. They were asked about the factors determining the “percentage of your financial assets that is currently invested in stocks” and were not asked about any factors that were asked only of either participants or non-participants. 9 The answer options were presented in ascending order of importance to all respondents. There is some evidence that survey responses are biased towards answer options that appear earlier (e.g., Malhotra, 2008). Such a primacy effect would lead to a systematic underestimate of each factor’s importance.

8
important relative to the other factors. This variable is constructed by subtracting the mean
numerical value of the respondent’s ratings from the numerical value of each response and dividing
by the standard deviation of that respondent’s rating numerical values. The correlations between
the first measure and each of the other three are 0.90 or higher, so we will focus on the percent
who report a factor to be very or extremely important.
Table 1 shows that there is variation in ratings, but no single dominant factor drives equity
share decisions. Particularly important drivers specific to stock market non-participation are fixed
costs of participation (49% of non-participants say their wealth being too small to invest in stocks
is a very or extremely important factor) and not liking to think about one’s finances (37% of non-
participants). Across both participants and non-participants, investment horizon in the form of
years left until retirement (48% of employed respondents), background risk of expenses due to
illness/injury (47% of all respondents) and labor income (42% of employed respondents), the need
to maintain cash on hand to pay for routine expenses (47% of all respondents), concern about rare
economic disasters (45% of all respondents), and lack of trust in market participants (38% of all
respondents) are frequently cited as very or extremely important.
At the other end of the spectrum, external habit, stock market returns before the
respondent’s birth, advice from peers and media, rules of thumb, and a failure to follow through
on intentions to invest in stocks are particularly unlikely (16% of respondents or less) to be rated
as very or extremely important. We note that consumption commitments, which Chetty and Szeidl
(2016) argue are a microfoundation for a representative agent who has external habit utility,
garners significant support (36% of all respondents). A large number of other factors are very or
extremely important to between 17% and 36% of respondents.
How likely is the observed variance in responses to occur if respondents were choosing
randomly? Let {p1, …, p5} be the empirically observed probabilities of the five response options,
pooled across all the factors in Table 1. We conduct a Monte Carlo analysis where in each
simulation run, each respondent to a question draws a response randomly and independently from
a distribution where the probability of each response is represented by {p1, …, p5}. We
overwhelmingly reject the null hypothesis of independent and random choice—the actual data’s
across-factor standard deviation in the fraction responding very or extremely important is 2.5 times
larger than the highest simulated standard deviation in 1,000 runs. As discussed in Section 2.8, a
principal component analysis on the survey responses reveals a correlation structure among the
9
responses that is economically sensible. We interpret both of these results as evidence that
respondents are not simply choosing responses at random, but are answering our questions in
thoughtful and meaningful ways.
2.1. NEOCLASSICAL ASSET PRICING FACTORS
We investigate nine factors that have been hypothesized to affect the equity premium in
neoclassical asset pricing models with a representative agent. Because in equilibrium, the
representative agent must be willing to hold the market portfolio, these theories are implicitly
theories of portfolio choice. Table 2 contains the exact text used to describe each factor and the
percent of respondents who report that the factor is very or extremely important in determining
their current portfolio equity share. The table also shows this percentage for subsamples split by
stock market participation status, wealth, and educational attainment.
A foundational feature of standard asset pricing models is that assets that tend to have low
payoffs when the marginal utility of money is high are less attractive than assets that tend to have
low payoffs when the marginal utility of money is low. The consumption-based capital asset
pricing model (CCAPM) (Rubenstein, 1976; Breeden and Litzenberger, 1978; Lucas, 1978;
Breeden, 1979), where an asset’s return covariance with consumption growth determines its risk
premium, is a special case. To investigate whether individuals consciously think in these terms,
we ask each respondent to rate the importance of both of these factors (labeled in Table 2 as “return
covariance with marginal utility of money” and “return covariance with marginal utility of
consumption,” respectively). We did not want to tell respondents that the stock market’s return
actually covaries positively with, say, consumption growth; we wanted to elicit whether they
believed that this is true and this had a significant effect on their asset allocation. Therefore, we
ask respondents to rate the importance of their “concern” about this covariance. If a given
respondent believed that the stated object of concern was not true, then her natural response would
be to report that concern about it is not important.
The failure of the CCAPM is well-documented (Mehra and Prescott, 1985), leading to the
other models we test in this section. Motivated by the rare disaster model of Rietz (1988) and Barro
(2006), we ask our respondents about the importance of a concern that a dollar invested in stocks
will lose more money than a dollar deposited in a bank savings account during an economic
10
disaster (“rare disaster risk”).10 Using the cutoff of Barro and Ursúa (2012), we specify that the
disaster in question is one where the U.S. economy’s annual output drops by more than 10%.
In contrast to concerns about sudden drops in output during disasters, the long-run risk
model (Bansal and Yaron, 2004) emphasizes concerns that stock returns tend to be low when bad
news arrives about the expectation and volatility of consumption growth over the long run. We ask
separate questions about the importance of stock return covariance with news about aggregate
consumption growth over the next year (“risk of aggregate consumption over next year”)—which
could be viewed as a nearly contemporaneous covariance—and about the importance of stock
return covariance with news about aggregate consumption growth over the five-year period
starting one year in the future (“risk of long-run aggregate consumption”). We choose this five-
year period because the half-life of expected growth shocks is about 2.25 years in the Bansal, Kiku,
and Yaron (2012) calibration.
We ask analogous questions about economic uncertainty—the importance of stock return
covariance with news about aggregate consumption uncertainty over the next year (“risk of
aggregate consumption volatility over next year”) and stock return covariance with news about
aggregate consumption uncertainty over the ten-year period starting one year in the future (“risk
of long-run aggregate consumption volatility”). The decade-long period reflects the high
persistence of volatility in Bansal, Kiku, and Yaron (2012).
Piazzesi, Schneider, and Tuzel (2007) posit that households have nonseparable preferences
over housing and a numeraire good, which leads them to fear “composition risk”—changes to the
relative share of housing in their consumption basket. In their model, assets that have low
numeraire payoffs when housing consumption is low relative to numeraire consumption command
a higher risk premium. To capture composition risk, we ask about the importance of a concern that
stock returns will tend to be low when consumption from one’s physical living situation is
dropping more quickly than the rest of one’s consumption basket (“consumption composition
risk”).
Finally, we ask respondents about the role that consumption commitments play in their
allocation decision (“consumption commitments”). Chetty and Szeidl (2007) and Chetty, Sándor,
10 The equity premium literature compares the average stock market return to the average return on a short-term government bond. We ask respondents to compare the stock market’s return in a disaster to a bank savings account return because we were concerned that some respondents may not know what a government bond is. Because deposit accounts are insured by the government, they should have similar safety properties in a disaster.

11
and Szeidl (2017) show how components of the consumption bundle that are difficult to adjust in
the short run can cause individuals to invest less in risky assets. When a portion of one’s
consumption bundle cannot be easily adjusted, a negative shock must be accommodated entirely
through adjustment of uncommitted consumption (e.g., food). This raises the local curvature of
utility.
We found it difficult to succinctly describe the exact mechanism through which
consumption commitments affect portfolio choice in a manner understandable to a non-economist.
Therefore, we simply ask whether consumption commitments are an important factor in
determining the respondent’s equity share without stating the specific concerns consumption
commitments generate or the direction in which they would push equity share. We then ask
respondents who report that consumption commitments are at least moderately important a follow-
up question about whether an increase in consumption commitments as a fraction of their income
would increase, decrease, or have no effect on their equity share.
Table 2 shows that the rare disaster model has more support among our respondents than
any other neoclassical asset pricing factor: 45% of respondents say that concern about a disaster
played a very or extremely important role in determining their equity share.11 It is also the only
factor in this category that receives more support among the 39% of respondents with at least
$75,000 in investible assets than among respondents with less than $75,000 in investible assets
(49% versus 43%) and among stock market participants than among non-participants (47% versus
44%). The rare disaster model is an attempt to explain the equity premium within the CCAPM
framework, but both the marginal utility of cash and marginal utility of consumption factors draw
less support (35% and 29%, respectively) than the rare disaster factor. The fact that the majority
of respondents do not cite contemporaneous return covariance with marginal utility as very or
extremely important is consistent with the fact that much popular, practitioner, and academic
discussion of investing focuses on terminal wealth outcomes without reference to intermediate-
period consumption. But even an investor focused only on terminal wealth would be concerned
about economic disasters before the terminal period if returns are not strongly negatively
autocorrelated.
11 Although we have classified rare disasters as a neoclassical factor, beliefs about disaster likelihood and magnitude may not be rational (Goetzmann, Kim, and Shiller, 2016). A similar caveat applies to our other “neoclassical” factors.
12
The second most popular factor is consumption commitments, with 36% of respondents
describing them as very or extremely important. In the answers to the follow-up question (shown
in Table 3), among those who say that consumption commitments were very or extremely
important, over three times as many report that an increase in their consumption commitments as
a fraction of income would lead them to reduce their equity exposure (or in the case of stock market
non-participants, make them less likely to start participating in the stock market) rather than
increase it or make them more likely to participate (45% versus 13%), as Chetty and Szeidl (2007)
and Chetty, Sándor, and Szeidl (2016) predict.
Surprisingly, 31% of respondents who say that consumption commitments are very or
extremely important report that an increase in their consumption commitments would have no
effect on their equity allocation (or their likelihood of participating), and another 10% say that they
don’t know what the portfolio effect would be. There are several potential explanations for this
result. First, it may be that the optimal policy function with respect to consumption commitments
is locally flat for the 31%, even though it is not flat globally. We did not specify the amount of the
increase in consumption commitments. Therefore, it is possible that some respondents answered
the question under the scenario of a small increase in consumption commitments, so we are
measuring the locally flat portion of their policy function. Second, we did not specify over what
time horizon the portfolio change is being measured. It may be that even though an increase in
consumption commitments would cause some respondents to eventually change their equity share,
they would not do so during the time period assumed, or they did not know what time horizon we
had in mind and so felt they could not give a directional answer. Third, even though we intended
to measure the partial derivative of equity share with respect to consumption commitments,
respondents may be reporting the total derivative. Since changes in consumption commitments are
likely to be accompanied by other economic events, the total derivative may be zero even if the
partial derivative is not. Other respondents may have been able to compute the partial derivative
but felt that we were asking for the total derivative, and found themselves unable to integrate across
all the different scenarios to provide an unconditional average effect. Finally, it is possible that
some respondents did not understand the question or answered carelessly.
The two questions about stock return covariance with bad news about aggregate
consumption growth and volatility over the next year garner 29% to 30% support. Because they
describe covariances between returns and news about nearly contemporaneous consumption, these
13
questions can be interpreted as the aggregate consumption analogues of the marginal utility of
consumption question, which pertains to contemporaneous covariance with individual-specific
marginal utility. The questions testing long-run risk—stock return covariance with news about
expected consumption growth and volatility starting one year in the future—attract similar levels
of support: 30% and 26%, respectively. Composition risk involving one’s physical living situation
earns comparable ratings, with 29% of respondents describing it as very or extremely important.
2.2. BACKGROUND RISKS AND ASSETS
In this section, we explore how risks and assets outside the stock market affect allocations
to equity. The largest asset most people have is their human capital, which is subject to wage risk
and health risk. If these risks are correlated with stock returns, they should affect the willingness
to hold stocks (Bodie, Merton, and Samuelson, 1992). Even if the risks are uncorrelated with stock
returns, the optimal allocation to stocks could still fall in principle (Pratt and Zeckhauser, 1987;
Kimball, 1993; Gollier and Pratt, 1996). The empirical literature on background labor income risk
has generally found negative effects on equity allocations (Guiso, Jappelli, and Terlizzese, 1996;
Hochguertel, 2003; Angerer and Lam, 2009; Palia, Qi, and Wu, 2014; Schmidt, 2016; Fagereng,
Guiso, and Pistaferri, 2017), although the magnitude of these estimates is often small, perhaps due
to the econometric problems discussed by Fagereng, Guiso, and Pistaferri (2017). Rosen and Wu
(2004) also find that households in poor health hold less in risky assets. To capture portfolio effects
of human capital risk, we ask respondents who are currently employed about the importance of
unemployment and wage growth risk in their equity allocation decision (“labor income risk”). We
ask all respondents about the importance of the risk of expenses related to illness or injury to
themselves or a family member (“risk of illness/injury”).
A person’s human capital wealth generally falls with age, as there is less labor income that
can be expected in the future. This should affect the allocation of the financial portfolio because
the fraction that the financial portfolio comprises of the total wealth portfolio (financial plus human
capital wealth) is changing (Bodie, Merton, and Samuelson, 1992). We therefore ask employed
respondents about the importance of the number of years remaining until retirement (“years left
until retirement”). Because time until retirement can affect portfolio choice even if the respondent
is failing to consider the human capital portion of their total wealth—for example, due to a belief
in time diversification or negative serial correlation of stock returns (Barberis, 2000)—we
14
separately ask about the importance of wages remaining to be earned in one’s lifetime relative to
current financial wealth (“human capital”) to isolate the human capital channel. In a model with
intermediate-period consumption, Wachter (2002) shows that the time remaining until a significant
non-retirement expense can also affect portfolio risk-taking. Therefore, we also ask all
respondents, whether employed or not, about the importance of time remaining until a significant
non-retirement expense such as a car purchase, down payment, or school tuition (“time until
significant non-retirement expense”).
Housing represents a large portion of the typical homeowner’s wealth, and Flavin and
Yamashita (2002), Cocco (2004), and Yao and Zhang (2005) present models where housing affects
the demand for stocks. On the one hand, housing price risk crowds out stockholding as a fraction
of one’s total wealth portfolio. On the other hand, because the house diversifies against stock risk,
homeownership can raise stockholding as a fraction of one’s financial portfolio. We test both these
channels, asking homeowners about concern that one’s home value might fall (“home value risk”)
and asking stock market participants about the belief that one can take more risks in one’s financial
portfolio because one’s non-financial assets, such as a home or a small business, will serve as a
cushion against financial portfolio losses (“non-financial assets cushion losses in financial assets”).
We also ask about the importance of risk in non-financial assets other than the home, such as small
businesses (“non-financial risk”). Heaton and Lucas (2000) find that households with high and
volatile proprietary business income have lower stockholdings.
The final background risk we investigate is inflation. Although the notion that stocks are a
hedge against inflation has intuitive appeal because stocks are claims on real assets, early empirical
studies found that stock returns are negatively correlated with inflation (Lintner, 1975; Bodie,
1976; Nelson, 1976; Fama and Schwert, 1977; Gultekin, 1983). Later studies have found that a
long position in stocks hedges against inflation over longer horizons (e.g., Boudoukh and
Richardson, 1993; Solnik and Solnik, 1997). We ask stock market participants about the
importance of the belief that when their living expenses increase unexpectedly, the stock market
will tend to rise (“stocks are an inflation hedge”).
We ask one question only of non-participants: whether the amount of money that they have
available to invest is an important factor in their decision not to invest in stocks (“wealth too
small”). Vissing-Jørgensen (2003) has argued that fixed costs of stock market participation can

15
explain both non-participation and why it declines with wealth. We investigate what specifically
comprises these fixed costs in Section 2.7.
Table 4 summarizes the results for these factors. At the high end, 49% of non-participants
say that not having enough money available to invest in stocks was very or extremely important
in their decision not to invest in stocks. Somewhat surprisingly, 31% of non-participants with at
least $75,000 of investible assets also feel this way, although this could be because other factors
cause them to perceive the per-dollar benefit of stockholding to be very low, thus requiring large
amounts of wealth to make stockholding worthwhile.12
Among employed respondents, 48% report that the number of years remaining until
retirement was very or extremely important. Barberis (2000) shows that a longer investment
horizon can either increase the optimal equity allocation due to mean reversion or decrease it due
to greater parameter uncertainty. We therefore asked those who said this factor was at least
moderately important a follow-up question about how an increase in their time to retirement would
affect their equity allocation over the next year (for participants) or the likelihood of their investing
in stocks over the next year (for non-participants). Because we did not want the increase in working
life to be associated with a negative wealth shock, the scenario we presented was one where
tomorrow, the respondent decided to retire ten years later than previously planned because she
enjoyed working so much.
Table 5 shows the distribution of responses among those who reported that years until
retirement was very or extremely important. Respondents seemed to struggle with this scenario—
the non-response rate of 14% is unusually high, and another 9% responded “I don’t know”—
perhaps because it was an unfamiliar one that they had not considered before. Among those who
did respond, increases in equity share or equity investment likelihood were nearly ten times as
likely as decreases (39% versus 4%). Like with the follow-up question regarding consumption
commitments, a surprisingly high number (34%) said that this increase in investment horizon
would have no effect on their equity allocation percentage or equity investment likelihood over
12 We asked those who cited “wealth too small” as at least a moderately important factor, “What is the least amount of money you would need to have available to make it worthwhile to invest in stocks?” Among those who rated “wealth too small” to be very or extremely important, the median respondent chose the category “$1,000 - $4,999.” However, this response is difficult to interpret because 31% of these participants chose a category that is smaller than the category they indicated for the amount of investible wealth they had. One possibility is that some participants interpreted “available” money to mean something other than all their investible assets (for example, money they would not need to have on hand for expenditures like a down payment in the near future).

16
the next year. This response may reflect a locally flat relationship between investment horizon and
equity investment, a recognition that it would take the respondent longer than one year to act in
her portfolio, or some effect from working until an older age that nearly exactly offsets the effect
of a longer investment horizon.
Returning to Table 4, we find that the human capital fraction of total wealth is somewhat
less important than investment horizon, with 36% reporting that the amount of financial wealth
they have relative to expected future wages is a very or extremely important factor. Close behind
is the number of years until a large nonretirement expenditure, which 36% of respondents describe
as very or extremely important. Two background risks stand out from among the six we asked
about. Forty-seven percent report that the risk of illness or injury is very or extremely important,
even though this risk is unlikely to have much perceived or actual correlation with equity returns.
Close behind is labor income risk, at 42% of employed respondents. Home value risk is somewhat
less salient, but is still very or extremely important to 29% of homeowner respondents. The final
three background factors—stocks as an inflation hedge, non-financial assets as a cushion, and non-
financial risks—are each described as very or extremely important by 19% to 20% of the relevant
respondents.
2.3. NONSTANDARD PREFERENCES
We ask about four types of nonstandard preferences: loss aversion, ambiguity aversion
(which we do not separately identify from the effects of parameter uncertainty), internal habit, and
external habit. Loss aversion is frequently described as disliking losses more than enjoying gains
of equal magnitude (Kahneman and Tversky, 1979), but this property is true of risk-averse
individuals as well. Therefore, we focus on an implication of loss aversion that is not shared with
classical risk aversion: aversion to small gambles (Segal and Spivak, 1990; Rabin, 2000). We ask
respondents if worry about the possibility of even small losses on their stock investments was an
important factor in their equity allocation decision (“loss aversion”). Barberis, Huang, and Santos
(2001), Barberis and Huang (2001), and Barberis, Huang, and Thaler (2006) present models where
loss aversion reduces the demand for stocks.
Second, we ask about the role of ambiguity or parameter uncertainty, in the form of not
having a good sense of the average returns and risks of stocks, in their investment decisions
(“ambiguity/parameter uncertainty”). Bayesian investors will reduce their allocation to the risky
17
asset in the face of parameter uncertainty, and investors who are ambiguity averse in the sense of
Ellsberg (1961) will reduce their risky allocation even further (Barberis, 2000; Garlappi, Uppal,
and Wang, 2007; Kan and Zhou, 2007). Dow and Werlang (1992) were the first to show
theoretically that ambiguity aversion can generate stock market non-participation. Dimmock et al.
(2016) find that those who exhibit ambiguity aversion in a laboratory experiment are less likely to
hold stocks, and conditional on holding stocks, allocate less to them.
Third and fourth, we ask respondents questions about the role of internal habit and external
habit. In the Constantinides (1990) internal habit model, individuals derive utility from
consumption today relative to their own past consumption, whereas in the Campbell and Cochrane
(1999) external habit model, individuals derive utility from their own consumption today relative
to past aggregate consumption. In either case, the result is to increase an individual’s risk aversion
and hence decrease her willingness to hold stocks. To investigate whether investors are
consciously considering these factors, we ask respondents about the importance of the difference
between their current material standard of living and the level they are used to (“internal habit”)
and the importance of the difference between their current material standard of living and the level
everybody else around them has experienced recently (“external habit”).
Table 6 shows that loss aversion is described as very or extremely important by 28% of
respondents, internal habit by 27% of respondents, and ambiguity/parameter uncertainty by 27%
of respondents. There is relatively little support for external habit, which is deemed very or
extremely important by only 16% of respondents. This suggests that, to the extent that external
habit-like preferences are important, their microfoundation may be consumption commitments
(Chetty and Szeidl, 2016) rather than a psychological desire to keep up with the Joneses.
The internal habit, external habit, and ambiguity/parameter uncertainty factor question
wordings do not imply any directionality of the factors’ effects. In addition, Dimmock et al. (2016)
find that although 52% of American adults are ambiguity averse, 38% are ambiguity seeking.
Therefore, we ask follow-up questions regarding directionality to anybody who rated one of these
factors as at least moderately important. Table 7 shows the distribution of responses to these
follow-up questions among those who rated a factor very or extremely important. We find that
consistent with theory, people are much more likely to report decreasing their equity allocation or
becoming less likely to invest in equities rather than increasing their equity allocation or becoming
more likely to invest in equities in response to a fall in their material standard of living compared

18
to what they are used to (42% versus 8%), or a fall in their material standard of living compared
to what everyone around them has experienced recently (47% versus 12%). Similarly, having a
better sense of the average returns and risks of investing in stocks is much more likely to result in
increasing, rather than decreasing, equity allocations or the probability of investing in equities
(58% versus 8%). As with previous follow-up questions, a sizable fraction responded that they
would not change their equity allocation or likelihood of investing in equities or that they did not
know how they would change these (48% for internal habit, 38% for external habit, and 32% for
ambiguity/parameter uncertainty).13
2.4. EXPECTED RETURN BELIEFS
We ask about the role of four categories of beliefs about expected stock market returns.
We begin with the belief that low stock market returns tend to be followed by more low stock
market returns (“stock market returns have momentum”). DeBondt (1993), Fisher and Statman
(2000), Vissing-Jørgensen (2003), and Greenwood and Shleifer (2014) find robust survey evidence
that individuals hold extrapolative beliefs about aggregate stock market returns on average. If
individuals understand the logic of hedging and its applicability here, positive return
autocorrelation should cause the unconditional willingness to hold equities to decrease, since poor
stock returns are associated with worse future investment opportunities. Conversely, we also ask
our respondents whether a belief that low stock market returns tend to be followed by high stock
market returns played an important role in their portfolio choice (“stock market returns mean-
revert”). Mean reversion means that stocks are a hedge, so unconditionally, it should make people
more willing to hold stocks (Barberis, 2000).
If individuals believe that expected returns are time-varying, then their equity share at a
particular moment in time may be affected by their view that expected returns are particularly high
or low at that time. We therefore ask respondents whether a belief that the returns they can expect
to earn from investing in stocks right now are lower than usual played an important role in their
portfolio choice (“expected stock returns lower than usual right now”). We also ask stock market
13 For the ambiguity/parameter uncertainty follow-up question, answering that one did not know which way one would react to having more precise information might be the response we should expect, since the reaction should depend on what the additional information is.

19
participants only the reverse question about expected returns being higher than usual (“expected
stock returns higher than usual right now”).
None of these factors are rated by more than 25% of respondents as very or extremely
important. The most popular—the belief that expected returns are currently lower than usual—is
described as very or extremely important by 25% of respondents and 25% of stock market
participants. Right behind this is the converse, that expected returns are currently higher than usual,
with 24% support among stock market participants. This balance of opinions about the market risk
premium may be partially attributable to the fact that the S&P 500 return in 2016, the year of the
survey, was 12%, close to its historical arithmetic average. There is also little difference between
the fraction who say that positive return autocorrelation is very or extremely important (19%) and
those who say that negative return autocorrelation is very or extremely important (17%). Notably,
less educated respondents are substantially more likely to endorse the importance of all four
deviations from random-walk returns.
The fact that similar proportions report positive return autocorrelations and negative return
autocorrelations to be very or extremely important does not necessarily contradict the fact that
stock return expectations are extrapolative on average. Most individuals probably have not learned
the implications of return autocorrelations for hedging demand, and to the extent that non-zero
return autocorrelations are mentioned in popular financial advice, the emphasis is usually on
negative return autocorrelations which cause stocks to be less risky for long-run investors.
Individuals may also not realize that their beliefs generally follow an extrapolative pattern, but
instead reason that “this time is different” each time they revise their beliefs.
2.5. SOCIAL AND PERSONAL FACTORS
We ask our respondents about eleven social and personal factors. The first of these is
religion, which has been hypothesized to influence economic risk-taking since at least Weber
(1930). A large body of empirical literature has found that Catholics are less risk averse than
Protestants (Barsky et al., 1997; Hilary and Hui, 2009; Kumar, 2009; Kumar, Page, and Spalt,
2011; Shu, Sulaeman, and Yeung, 2012; Schneider and Spalt, 2016, 2017; Benjamin, Choi, and
Fisher, 2016). We therefore ask respondents whether their religious beliefs, values, and
experiences played an important role in their equity allocation decision (“religion”).
20
Many authors have argued that religion affects trust (e.g., Putnam, 1993; Guiso, Sapienza,
and Zingales, 2003; Benjamin, Choi, and Fisher, 2016), and Guiso, Sapienza, and Zingales (2008)
present evidence that lack of trust in other market participants is an important driver of reluctance
to invest in stocks. In light of this work, we ask respondents about the importance of the concern
that companies, managers, brokers, or other market participants might cheat them out of their
investments (“low trust in market participants”). Closely related is the difficulty of finding a
trustworthy investment adviser (“lack of trustworthy adviser”). We additionally ask about the
importance of advice specifically from a professional financial adviser the respondent hired
(“advice from professional financial adviser”), advice from a friend, family member, or coworker
(“advice from friend, family, or coworker”), advice from media sources (“advice from media”),
and a general lack of knowledge about how to invest (“lack of knowledge about how to invest”).
There is also a literature on the role of personal experience in financial decision making.
Malmendier and Nagel (2011) find evidence that households who have lived through high stock
market returns invest more in stocks. Vissing-Jørgensen (2003) finds that the idiosyncratic
component of an investor’s own portfolio return positively affects his expectation of future
aggregate stock market returns. To investigate whether individuals are conscious of these effects,
we ask our respondents about the importance of feelings, attitudes, and beliefs about the stock
market gotten from living through stock market returns, whether or not they were invested in stocks
at the time (“experience of living through returns”), and the importance of feelings, attitudes, and
beliefs about the stock market gotten from personal experiences of investing in the stock market
(“personal experience investing in stock market”).
We ask non-participants about two additional personal factors. First, we ask about the
importance of “financial phobia” (Burchell, 2003; Shapiro and Burchell, 2012) in causing their
non-participation (“don’t like to think about my finances”). Second, it is possible that respondents
hold no stock not because they do not want to, but because they have not gotten around to
participating, perhaps due to time-inconsistent procrastination (Laibson, 1997; O’Donoghue and
Rabin, 1999). We therefore ask about the importance of having intended to invest in stocks but not
having gotten around to it (“intended to invest in stocks but never got around to it”).
Table 9 shows that a general lack of comfort with financial markets is significant driver of
investment choices. The most commonly cited factor is low trust in market participants, which is
rated very or extremely important by 37.5% of respondents. Close behind are financial phobia

21
(37% of non-participants), a lack of knowledge about how to invest (36%), and lack of a
trustworthy adviser (31%). Experience of living though returns, advice from a professional
financial adviser, personal experience investing in the stock market, and religion are all rated as
very or extremely important by 26% to 27% of respondents. Relatively few people say that advice
from peers or media was very or extremely important (15% and 12%, respectively), and the least
important factor was delay despite an intention to invest in stock (3% of non-participants). Despite
evidence that individuals’ financial choices exhibit considerable inertia (Choi et al., 2002), people
do eventually move away from their status quo to what they perceive to be their optimum (Carroll
et al., 2009), even if it takes them a few years. Therefore, in a sample that includes many middle-
aged and older adults, it may not be unexpected that procrastination is a relatively small driver of
stock market non-participation.14
2.6. MISCELLANEOUS FACTORS
Finally, we ask respondents about the role of five other factors. The first is a rule of thumb
such as investing 100 minus age percent of assets in stocks, or investing one-third of one’s wealth
in each of stocks, bonds, and real estate (“rule of thumb”). The second is the default investment
allocation in their work-based retirement savings plan (“default allocation in retirement savings
plan”). Madrian and Shea (2001) and Choi et al. (2004) document that a sizeable fraction of
investors remain at the default asset allocation in their 401(k) plan if they are automatically
enrolled. Third and fourth, we ask about two transactional factors which were motivated by
answers to the free-response question in our initial pilot survey about important factors affecting
respondents’ equity choices that we had not asked about: the concern that stock investments will
take too long to convert into spendable cash in an emergency (“stocks take too long to convert to
cash in emergency”), and the amount of cash the respondent needs to have on hand to pay routine
expenses (“need cash on hand for routine expenses”). These concerns are related to those in the
model of Lagos (2010), where equities command a high expected return because they are less
14 To non-participants who rated “intended to invest but never got around to it” as at least moderately important, we asked follow-up questions about which factors were important in causing them to not get around to investing in stocks. Appendix Table 1 shows the distribution of answers for those who rated “intended to invest but never got around to it” as very or extremely important. Only 18% said that procrastination for no good reason was very or extremely important. The most salient drivers were having less money available now than when they originally planned on investing in stocks (42%) and discovering that it was costlier to invest in stocks than they expected (37%).

22
useful for facilitating exchange. Finally, we ask respondents about the importance of what they
know about the stock market’s returns during the decades before they were born (“stock market
returns before I was born”).
Table 10 reports that a large fraction of respondents (47%) say that needing to have cash
on hand to pay routine expenses was a very or extremely important factor. The need for emergency
liquidity also has substantial support, at 29% of respondents. Unsurprisingly, these factors are less
important among stock market participants and those with more wealth and education. However,
even among high-wealth and high-education respondents, the absolute levels of importance are
quite high—for example, 40% for needing cash on hand and 22% for stocks taking too long to
convert to cash among high-wealth respondents.
Only 26% of respondents identify the default investment allocation in a work-based
retirement savings plan as very or extremely important. Although this might seem low in light of
the evidence on how sticky defaults are, one must keep in mind that only about half of American
workers have access to a work-based “salary reduction plan” (predominantly 401(k) and 403(b)
plans), and only about half of 401(k)/403(b) plans automatically enroll their employees and hence
have an asset allocation default (Copeland, 2013; Vanguard, 2014).15
In accordance with the findings of Malmendier and Nagel (2011) that personally
experienced returns have a greater impact than returns one can only read about, only 16% of
respondents say that stock returns before their birth played a very or extremely important role in
their equity allocation decision, which is significantly lower than the 27% of respondents in Table
9 who said that stock market returns they had lived through were very or extremely important.
Untabulated results suggest that those younger than 40 are more likely to rate these pre-birth
returns as very or extremely important (20.3%, standard error = 5.3%) than those who are at least
60 (12.0%, standard error = 2.3%), although this difference is not statistically significant. Rules of
thumb receive relatively little support, with only 13% of respondents regarding them as very or
extremely important.
15 Table 1 reports that 54% of respondents say that a work-based retirement savings plan default asset allocation was at least moderately important. It is unlikely that 54% of American workers are subject to automatic 401(k) enrollment at their current employer. However, this 54% figure may not be implausible given that the question also asks about one’s spouse/partner’s workplace retirement savings plan default, and both the respondent and spouse/partner may be influenced by asset allocation defaults at past employers.
23
2.7. FIXED COSTS OF STOCK MARKET PARTICIPATION
Among stock market non-participants, 49% said that not having enough money to invest
in stocks was a very or extremely important factor in their decision not to participate, suggesting
that there are fixed participation costs. In this section, we explore what these fixed costs are. We
asked non-participants who rated “wealth too small” as at least a moderately important factor a
series of follow-up questions about how important various factors were in causing the amount of
money they have to be too small. We analyze the responses of those who rated “wealth too small”
as very or extremely important.
Vissing-Jørgensen (2003) suggests that fixed costs of stock market participation include
the entry costs of acquiring information about investing and setting up accounts, and the ongoing
costs of keeping abreast of the market, transacting, and preparing tax returns that are made more
complicated by stockholding. We therefore ask non-participants about the importance of the
amount of time, money, and/or effort it would take to learn about stocks (“costs of learning about
stocks”), hire an investment adviser (“costs of hiring an adviser”), set up an investment account
(“costs of setting up an account”), stay up-to-date on the stock market (“costs of staying up-to-
date”), maintain a relationship with an investment adviser after hiring him or her (“costs of
maintaining an adviser”), maintain an investment account after setting it up (“costs of maintaining
an account”), and deal with a tax return that is harder to prepare (“tax complexity”).
We ask one question to homeowners about whether owning a home is important in causing
them to not have enough money to make it worthwhile to invest in stocks (“home crowd-out”).
This question is motivated by the model of Cocco (2004), where the purchase of a house can leave
the individual with so little liquid wealth that paying the fixed cost to participate in the stock market
is not worthwhile. Although the purchase of a home will mechanically leave a household with less
money available to potentially invest in stocks, the household’s wealth may be sufficiently
inframarginal that the purchase does not push it from participation to non-participation.
Table 11 shows that information costs—both the costs of staying up-to-date about stocks
and the cost of learning about them in the first place—are the most important reasons why
respondents felt that the money they have available is not enough to make investing in stocks
worthwhile (45% and 41% rate these as very or extremely important, respectively). Costs of hiring
24
and maintaining an adviser are close behind, at 39% and 37%, respectively.16 The area where there
is the largest gap between the up-front fixed cost and the ongoing fixed cost is with respect to
investment accounts: 37% cite the costs of maintaining an account as very or extremely important,
while 31% cite the costs of setting one up. A smaller fraction (28%) cite tax complexity. Finally,
27% of homeowners who cite fixed costs as very or extremely important report that home
ownership is a very or extremely important factor in causing them not to have enough money to
make it worthwhile to invest in stocks.
2.8. PRINCIPAL COMPONENT ANALYSIS
Do people who find certain factors important for their equity share decision also tend to
find other related factors important? In this section, we describe the results of a principal
component analysis conducted on the equity share factors in Table 1 that were asked of every
respondent. The outcome variables are binary indicators for whether the respondent rated each
factor as very or extremely important.17
Using the common criterion of retaining only factors with an eigenvalue above 1, we find
that six factors capture 54% of the variation in the data. To aid interpretation, we perform an
orthogonal varimax rotation of the factors.18 Following the suggestion of Tabachnick and Fidell
(2007), we only consider loadings of at least 0.32 to be economically significant when interpreting
the factors. However, in Table 12, we show all factors whose loading on a principal component is
at least 0.199, a cutoff that causes every factor except non-financial asset risk to be associated with
at least one principal component.19
The first principal component seems to capture concern about neoclassical asset pricing
factors: the consumption CAPM, long-run risk, and return covariance with marginal utility. The
second principal component primarily captures belief that the aggregate stock market return is
16 Wealthy non-participants who rate fixed costs as very or extremely important are much more likely to cite the costs of staying up to date about stocks, learning about stocks, and hiring an advisor as very or extremely important. However, since there are only 57 wealthy non-participants who rate fixed costs as very or extremely important, these figures should be interpreted with caution. 17 The results are broadly similar if we instead use as outcome variables binary indicators for whether the respondent rated each factor as at least moderately important or the numerical coding of the factor ratings. Using the standardized numerical ratings as outcome variables yields rather different results, resulting in eleven principal components with an eigenvalue above 1. 18 An oblique promax rotation yields virtually identical results. 19 Non-financial asset risk loads most heavily (0.17) on the third principal component.

25
predictable. It loads on the belief that expected stock returns are lower than usual right now,
retirement savings plan defaults, the belief that stock market returns mean-revert, and the belief
that stock market returns have momentum. Although a positive association between these last two
factors might seem contradictory, this need not be so if, for example, respondents thought the
market is subject to both short-term reversals and long-run momentum—consistent with the
empirical fact that individuals are net sellers of stocks with high returns over the past quarter and
net buyers of stocks with more distant high past returns (Grinblatt and Keloharju, 2000, 2001;
Griffin et al., 2003; Kaniel et al., 2008; Barber et al., 2009).
The third principal component loads on consumption needs, habit, and human capital:
consumption commitments, time until a significant non-retirement expense, internal habit, and
human capital as a fraction of total wealth. The fourth principal component is associated with
discomfort with the market: a lack of knowledge about how to invest, ambiguity and parameter
uncertainty, a lack of a trustworthy adviser, and loss aversion. The fifth principal component loads
on advice: advice from the media and advice from a friend, family member, or coworker. The final
principal component loads on personal experience with returns and stock investing.
The fact that responses to the equity share factor questions have a sensible correlation
structure is further evidence that respondents were answering in a thoughtful, coherent manner.
For completeness, we explore via regression how individuals’ equity share relates to their
first six principal component scores. Table 13 shows that those who report that neoclassical asset
pricing factors and discomfort with the market were more important invest less in stocks, whereas
those who report that a belief in market return predictability, defaults, and personal experience
were more important invest more in stocks. The relationship of equity share with the third principal
component (consumption needs, habit, and human capital) and fifth principal component (advice)
scores is negative but insignificant. We caution that because a respondent’s principal component
scores may be correlated with other unobserved factors that affect portfolio allocation, such as risk
aversion, these regression coefficients should not necessarily be interpreted as the causal impact
of placing more weight on the factors in each principal component.
2.9. DESCRIPTION COMPLEXITY AND IMPORTANCE RATINGS
Although our pilot testing indicates that our questions were understood by nearly every
respondent, it is still possible that some factor descriptions created more confusion than others. If

26
people respond to a confusing factor description by rating the factor as less important than it really
is, our estimate of the factor’s overall importance will be downwardly biased. Conversely, a
confusing factor description could cause a respondent to rate it as more important than it really is
in order to try to appear sophisticated to the researchers, even though the survey was administered
remotely through the Internet with no respondent identities revealed to us.
We look for a relationship between factor importance ratings and factor description
complexity by measuring complexity in two ways: the number of words used to describe the factor,
and the factor description’s Fleisch-Kincaid grade level score.20 Taking all the factors in Table 1
for which every respondent gave an importance rating, we regress the fraction who said the factor
was very or extremely important on either the word count (standard deviation = 9.5) or the grade
level score (standard deviation = 4.0). There is no evidence of a significant relationship. The
coefficient is 0.14 with a t-statistic of 0.86 (p = 0.39) for word count, and 0.024 with a t-statistic
of 0.06 (p = 0.95) for grade level score (where the dependent variable’s units are such that 1% is
coded as 1, not 0.01). These null results suggest that our survey responses are not being driven by
the complexity of the questions.
3. Actively Managed Mutual Funds The second section of our survey explores the reasons why individuals purchase actively
managed equity mutual funds. The amount of investment in active management is puzzling given
that passive funds in aggregate outperform active funds (e.g., Gruber, 1996; French, 2008; Fama
and French, 2010). French (2008) hypothesizes that investors misperceive the relative returns to
active management versus passive management as a whole, or are overconfident about their ability
to pick outperforming active managers. Del Guercio and Reuter (2014) find that underperformance
in active management is concentrated in funds sold through brokers, suggesting that much
investment in active funds is the result of an agency problem that causes brokers to advise clients
to invest in poorly performing funds. Moskowitz (2000), Glode (2011), Kosowski (2011), and
Savov (2014) argue that investment in active funds could be rational despite their lower average
returns, since active funds outperform in states of the world where marginal utility is high. In the
model of Berk and Green (2004), active management should on average match passive
20 The Fleisch-Kincaid grade level is computed by the formula 0.39 × (total words/total sentences) + 11.8 × (total syllables/total words) – 15.59.
27
management returns. Managers have heterogeneous skill in generating alpha, and this skill has
decreasing returns to scale. In equilibrium, there is neither persistence in alphas nor
outperformance of active management because money rationally flows to funds with high past
returns (and exits funds with low past returns) up to the point where every manager’s alpha going
forward is the same in expectation.
We ask questions related to each of the above explanations. We begin by asking whether
the respondent knows what a mutual fund is. Fifty-five percent of respondents told us that they
did. We then show all respondents the definition of a mutual fund, an actively managed stock
mutual fund, and a passively managed stock mutual fund.21 We next ask whether respondents have
ever purchased shares in an actively managed stock mutual fund.22 The 35% who say yes are asked
to rate the importance of four factors in their decision to do so. First, we ask about the importance
of a belief that the active fund would give them higher returns on average than a passive fund
(“higher returns”). Second, we ask about the importance of the recommendations of an investment
adviser that they hired (“adviser recommendation”). Third, we ask about the importance of the
belief that even though the active fund would have lower returns than a passive fund on average,
it would have higher returns when the economy is doing poorly (“hedging”). Fourth, in light of the
importance of employer-sponsored retirement savings plans in many individuals’ financial lives,
we ask about the importance of a suitable passive fund not being available within the investment
menu of their employer-sponsored retirement savings plan (“passive not available”).
We ask all respondents, whether or not they had invested in an active fund before, how
much they agreed with the statement that when an actively managed stock mutual fund has had
significantly higher past returns than the overall stock market, this is strong evidence that its
manager has good stock-picking skills (“managerial skill”). Answer options are “strongly
disagree,” “disagree,” “neither agree nor disagree,” “agree,” and “strongly agree.” We also ask
how much respondents agreed with the statement that when an actively managed stock mutual
21 We give the following definitions: “A mutual fund is a company that brings together money from many people and invests it in stocks, bonds or other assets. In an actively managed stock mutual fund, the fund manager tries to beat the overall stock market’s return by picking stocks to buy. In contrast, a passively managed stock mutual fund (also known as a stock index fund) holds stocks in order to match the performance of a market benchmark (such as the S&P 500 stock market index) as closely as possible.” 22 Among respondents who reported not knowing what a mutual fund is, only 40 say they have bought an actively managed stock mutual fund after being told the definition of a mutual fund.

28
fund gets more money to manage, it becomes harder for it to generate higher returns than the
overall stock market (“decreasing returns to scale”).
The results are summarized in Table 14. By far the most important motivators of active
fund purchase are a belief that they would supply higher returns on average (cited as very or
extremely important by 51% of respondents who had experience with actively managed equity
mutual funds) and the recommendation of a financial adviser (cited by 48% of eligible
respondents). Hedging demand has non-trivial support, described as very or extremely important
by 27% of eligible respondents. A lack of passive funds in a retirement savings plan investment
menu is the least important factor, with only 18% describing this as very or extremely important.
Regarding the assumptions of Berk and Green (2004), 46% of respondents agree or
strongly agree that past returns are evidence of skill, but only 18% agree or strongly agree that
there are decreasing returns to scale in active money management. High-wealth respondents are
substantially more likely than low-wealth respondents to believe that high past returns are strong
evidence of skill (55% versus 40%), and modestly more likely to believe in decreasing returns to
scale (24% versus 14%).
4. Cross-Section of Equity Returns Differences in expected returns across stock portfolios formed on value and momentum
are well established (Fama and French, 1992; Jegadeesh and Titman, 1993), but whether these
differences are driven by mispricing or rational responses to risk remains controversial. In the final
section of the survey, we investigate what our respondents believe about the expected returns and
risks of value and momentum stocks.
We begin by asking respondents whether they are familiar with the terms “growth stock”
and “value stock.” Twenty-five percent report being familiar with both, 65% report not being
familiar with either term, and 5% report being familiar with only one of the terms. We then show
a simple definition of a growth stock and of a value stock.23
Next, we ask respondents to complete the following sentence about the relative risk of
growth versus value: “Compared to a growth stock, I expect a value stock to normally be…”
23 We give the following definitions: “A value stock is a stock that has a low price relative to its company’s current profits (and other fundamentals). A growth stock is a stock that has a high price relative to its company’s current profits (and other fundamentals).”
29
Respondents choose among four possible answers: “riskier over the next year, on average,”
“equally risky over the next year, on average,” “less risky over the next year, on average,” and “no
opinion.” We ask them to complete another sentence about the relative expected return of growth
versus value: “Compared to a growth stock, I expect a value stock to normally have...” Here, the
answer choices are “higher returns over the next year, on average,” “about the same returns over
the next year, on average,” “lower returns over the next year, on average,” and “no opinion.” We
also ask respondents to complete two similar sentences about the risk and expected returns of high-
versus low-momentum stocks, this time comparing “a stock whose price fell a lot over the past
year” to “a stock whose price rose a lot over the past year.”
Table 15 shows that respondents’ collective belief about the relationship between
value/growth and expected returns differs from the historical empirical relationship.24 Slightly
more expect value stocks to normally have lower returns (28%) rather than higher returns (25%),
but this difference is not statistically significant. More consistent with the historical data is
respondents’ tendency to expect high-momentum stocks to normally have higher returns rather
than lower returns (24% versus 14%). There is comparatively broad consensus that value stocks
are less risky (44%) rather than more risky (14%), while respondents are only modestly more likely
to expect high-momentum stocks to normally be riskier (25%) rather than less risky (14%). So in
aggregate, our respondents believe that value stocks are a good deal, having lower risk than but
similar expected returns to growth stocks, while the relative merits of high-momentum stocks are
more ambiguous. We note that for each of these questions, about a quarter of respondents state
they have no opinion.
The qualitative patterns do not change when we restrict the sample to those who have at
least $75,000 in investible assets. The largest quantitative differences are increases in the percent
who believe that growth stocks and value stocks have the same expected returns (from 20% in the
full sample to 30% in the high-wealth sample), the percent who believe that high- and low-
momentum stocks have the same risk (from 34% to 44%), and the percent that believe value stocks
are less risky than growth stocks (from 44% to 51%).
We investigate using regressions whether respondents’ answers to these questions vary
with demographics more generally. Betermier, Calvet, and Sodini (2017) find that older, wealthier,
24 This difference need not be irrational, since we ask about forward-looking expectations, and rational expectations of future returns may not coincide with historical realizations.

30
and female Swedish investors tend to exhibit greater portfolio tilts towards value stocks, whereas
investors with higher current labor income and education tend to exhibit greater portfolio tilts away
from value stocks. We construct three dummy variables for whether the respondent said that value
stocks have (1) higher expected returns than growth stocks, (2) higher risk than growth stocks, or
(3) higher expected returns than growth stocks without higher risk than growth stocks, or equal
expected returns as but lower risk than growth stocks.25 This third variable captures the perception
that value stocks have higher risk-adjusted expected returns than growth stocks.26 We construct
three analogous variables for high-momentum stocks relative to low-momentum stocks. The
explanatory variables are respondent age in years and dummies for having at least a bachelor’s
degree, having at least $75,000 in investible financial assets, having household income of at least
$75,000, and being female. The results are presented in Table 16.
We find no significant demographic correlates of stating that value stocks have higher
expected returns or that value stocks are riskier. However, we do find that wealthier respondents
are more likely to say that value stocks have higher risk-adjusted returns, consistent with the
holding pattern found by Betermeier, Calvet, and Sodini (2017). Of course, these sorts of
perceptions will have imperfect mappings to portfolio holdings, as individuals may misperceive
which stocks are value stocks, beliefs about value stocks in general may not apply to the particular
value stocks that an individual chooses to hold, and portfolio holdings in equilibrium depend not
just on perceptions of risk and return but also one’s risk tolerance relative to other investors.
Turning to momentum, we find no significant correlates of stating that high-momentum
stocks have higher expected returns, but male, younger, and more educated respondents are more
likely to regard high-momentum stocks to be riskier than low-momentum stocks. We also find that
older, low-wealth individuals are more likely to say that high-momentum stocks have better risk-
adjusted returns than low-momentum stocks.
5. Conclusion In our survey of primary household financial decision-makers in the U.S., we find that
individuals consider a wide variety of factors hypothesized in the academic literature when
25 The third dummy variable is coded as 0 if the respondent reported no opinion about or did not respond to the questions regarding relative expected returns and risk. 26 This variable does not, however, capture the perception that value stocks have higher risk-adjusted expected returns than growth stocks while also having higher risk than growth stocks.

31
deciding what fraction of their portfolio to invest in stocks. We find particularly strong support for
background risks, investment horizon, rare disasters, transactional factors, and fixed costs of stock
market participation, but many other factors garner significant support as well. The largest drivers
of investing in active equity mutual funds are a belief that they will provide higher average returns
than passive funds and the advice of a professional investment adviser. Households tend to believe
that past fund performance is a good signal of stock-picking skill, but contrary to Berk and Green
(2004), do not generally believe that funds suffer from diseconomies of scale. Regarding the cross-
section of stock returns, households tend to believe that value stocks will be safer and (contrary to
historical data) do not have higher expected returns, and that high-momentum stocks will be riskier
and (consistent with historical data) have higher expected returns.
References Amromin, Gene, and Steven A. Sharpe, 2014. “From the horse’s mouth: Economic conditions and investor expectations of risk and return.” Management Science 60, 845-866.
Angerer, Xiaohong, and Pok-Sang Lam, 2009. “Income risk and portfolio choice: An empirical study.” Journal of Finance 64, 1037-1055.
Bacchetta, Philippe, Elmar Mertens, and Eric van Wincoop, 2009. “Predictability in financial markets: What do survey expectations tell us?” Journal of International Money and Finance 28, 406-426.
Bansal, Ravi, Dana Kiku, and Amir Yaron, 2012. “An empirical evaluation of the long-run risks model for asset prices.” Critical Finance Review 1, 183-221.
Bansal, Ravi, and Amir Yaron, 2004. “Risks for the long run: A potential resolution of asset pricing puzzles.” Journal of Finance 59, 1481-1509.
Barber, Brad M., Yi-Tsung Lee, Yu-Jane Liu, and Terrance Odean, 2009. “Just how much do individual investors lose by trading?” Review of Financial Studies 22, 609-632.
Barberis, Nicholas, 2000. “Investing for the long run when returns are predictable.” Journal of Finance 55, 225-264.
Barberis, Nicholas, Robin Greenwood, Lawrence Jin, and Andrei Shleifer, 2015. “X-CAPM: An extrapolative capital asset pricing model.” Journal of Financial Economics 115, 1-24.
Barberis, Nicholas, and Ming Huang, 2008. “Stocks as lotteries: The implications of probability weighting for security prices.” American Economic Review 98, 2066-2100.
Barberis, Nicholas, Ming Huang, and Tano Santos, 2001. “Prospect theory and asset prices.” Quarterly Journal of Economics 116, 1-53.
32
Barberis, Nicholas, Ming Huang, and Richard H. Thaler, 2006. “Individual preferences, monetary gambles, and stock market participation: A case for narrow framing.” American Economic Review 96, 1069-1090.
Barro, Robert J., 2006. “Rare disasters and asset markets in the twentieth century.” Quarterly Journal of Economics 121, 823-866.
Barro, Robert J., and José F. Ursúa, 2012. “Rare macroeconomic disasters.” Annual Review of Economics 4, 83-109.
Barsky, Robert B., F. Thomas Juster, Miles S. Kimball, and Matthew D. Shapiro, 1997. “Preference parameters and behavioral heterogeneity: An experimental approach in the Health and Retirement Study.” Quarterly Journal of Economics 112, 537–579.
Benjamin, Daniel J., James J. Choi, and Geoffrey Fisher, 2016. “Religious identity and economic behavior.” Review of Economics and Statistics 98, 617-637.
Berk, Jonathan B., and Richard C. Green, 2004. “Mutual fund flows and performance in rational markets.” Journal of Political Economy 112, 1269-1295.
Betermier, Sebastien, Laurent E. Calvet, and Paolo Sodini, 2017. “Who are the value and growth investors?” Journal of Finance 72, 5-46.
Bodie, Zvi, 1976. “Common stocks as a hedge against inflation.” Journal of Finance 31, 459-470.
Bodie, Zvi, Robert C. Merton, and William F. Samuelson, 1992. “Labor supply flexibility and portfolio choice in a life cycle model.” Journal of Economic Dynamics and Control 16, 427-449.
Boudoukh, Jacob, and Matthew Richardson, 1993. “Stock returns and inflation: A long-horizon perspective.” American Economic Review 83, 1346-1355.
Brav, Alon, John R. Graham, Campbell R. Harvey, and Roni Michaely, 2005. “Payout policy in the 21st century.” Journal of Financial Economics 77, 483-527.
Breeden, Douglas T., 1979. “An intertemporal asset pricing model with stochastic consumption and investment opportunities.” Journal of Financial Economics 7, 265-296.
Breeden, Douglas T., and Robert H. Litzenberger, 1978. “Prices of state-contingent claims implicit in option prices.” Journal of Business 51, 621-651.
Bricker, Jesse, Lisa J. Dettling, Alice Henriques, Joanne W. Hsu, Kevin B. Moore, John Sabelhaus, Jeffrey Thompson, and Richard A. Windles, 2014. “Changes in U.S. family finances from 2010 to 2013: Evidence from the Survey of Consumer Finances.” Federal Reserve Bulletin 100(4).
Burchell, Brendan J., 2003. “Identifying, describing and understanding financial aversion: Financial phobes.” Report for EGG.
33
Campbell, John Y., and John H. Cochrane, 1999. “By force of habit: A consumption-based explanation of aggregate stock market behavior.” Journal of Political Economy 107, 205-251.
Carroll, Gabriel D., James J. Choi, David Laibson, Brigitte C. Madrian, and Andrew Metrick, 2009. “Optimal defaults and active decisions.” Quarterly Journal of Economics 124, 1639-1674.
Chetty, Raj, László Sándor, and Adam Szeidl, 2017. “The effect of housing on portfolio choice.” Journal of Finance 72, 1171-1212.
Chetty, Raj, and Adam Szeidl, 2007. “Consumption commitments and risk preferences.” Quarterly Journal of Economics 122, 831-877.
Chetty, Raj, and Adam Szeidl, 2016. “Consumption commitments and habit formation.” Econometrica 84, 855-890.
Cheung, Yin-Wong, and Menzie D. Chinn, 2001. “Currency traders and exchange rate dynamics: A survey of the US market.” Journal of International Money and Finance 20, 439-471.
Cheung, Yin-Wong, Menzie D. Chinn, and Ian W. Marsh, 2004. “How do UK-based foreign exchange dealers think their market operates?” International Journal of Finance and Economics 9, 289-306.
Cheung, Yin-Wong, and Clement Yuk-Pang Wong, 2000. “A survey of market practitioners’ views on exchange rate dynamics.” Journal of International Economics 51, 401-419.
Choi, James J., David Laibson, Brigitte C. Madrian, and Andrew Metrick, 2002. “Defined contribution pensions: Plan rules, participant choices, and the path of least resistance.” Tax Policy and the Economy 16, 67-113.
Choi, James J., David Laibson, Brigitte C. Madrian, and Andrew Metrick, 2004. “For better or for worse: Default effects and 401(k) savings behavior.” In David A. Wise, editor, Perspectives on the Economics of Aging. Chicago: University of Chicago Press, 81-121.
Cochrane, John H., 2017. “Macro-finance.” Review of Finance 21, 945-985.
Cocco, Joao F., 2005. “Portfolio choice in the presence of housing.” Review of Financial Studies 18, 535-567.
Constantinides, George M., 1990. “Habit formation: A resolution of the equity premium puzzle.” Journal of Political Economy 98, 519-543.
Copeland, Craig, 2013. “Retirement plan participation: Survey of Income and Program Participation (SIPP) data, 2012.” EBRI Notes 34(8).
Das, Sreyoshi, Camelia M. Kuhnen, and Stefan Nagel, 2017. “Socioeconomic status and macroeconomic expectations.” Working paper.

34
DeBondt, Werner, 1993. “Betting on trends: Intuitive forecasts of financial risk and return.” International Journal of Forecasting 9, 355-371.
Del Guercio, Diane, and Jonathan Reuter, 2014. “Mutual fund performance and the incentive to generate alpha.” Journal of Finance 69, 1673-1704.
Dimmock, Stephen G., Roy Kouwenberg, Olivia S. Mitchell, and Kim Peijnenburg, 2016. “Ambiguity aversion and household portfolio choice puzzles: Empirical evidence.” Journal of Financial Economics 119, 559-577.
Dow, James, and Sérgio Ribeiro da Costa Werlang, 1992. “Uncertainty aversion, risk aversion, and the optimal choice of portfolio.” Econometrica 60, 197-204.
Drachter, Kerstin, Alexander Kempf, and Michael Wagner, 2007. “Decision processes in German mutual fund companies: Evidence from a telephone survey.” International Journal of Managerial Finance 3, 49-69.
Ellsberg, Daniel, 1961. “Risk, ambiguity, and the Savage axioms.” Quarterly Journal of Economics 75, 643-669.
Fagereng, Andreas, Luigi Guiso, and Luigi Pistaferri, 2017. “Portfolio choices, firm shocks, and uninsurable wage risk.” Review of Economic Studies, forthcoming.
Fama, Eugene F., 1970. “Efficient capital markets: A review of theory and empirical work.” Journal of Finance 25, 383-417.
Fama, Eugene F., and Kenneth R. French, 1992. “The cross-section of expected stock returns.” Journal of Finance 47, 427-465.
Fama, Eugene F., and Kenneth R. French, 2010. “Luck versus skill in the cross-section of mutual fund returns.” Journal of Finance 65, 1915-1947.
Fama, Eugene F., and G. William Schwert, 1977. “Asset returns and inflation.” Journal of Financial Economics 5, 115-146.
Fisher, Kenneth, and Meier Statman, 2000. “Investor sentiment and stock returns.” Financial Analysts Journal 56(2), 16-23.
Fisher, Jonathan, David Johnson, Timothy Smeeding, and Jeffrey Thompson, 2018. “Inequality in 3-D: Income, consumption, and wealth.” Finance and Economics Discussion Series 2018-001. Washington: Board of Governors of the Federal Reserve System.
Flavin, Marjorie, and Takashi Yamashita, 2002. “Owner-occupied housing and the composition of the household portfolio.” American Economic Review 92, 345-362.
French, Kenneth R., 2008. “Presidential address: The cost of active investing.” Journal of Finance 63, 1537-1573.

35
Friedman, Milton, 1953. Essays in Positive Economics. Chicago, IL: University of Chicago Press.
Garlappi, Lorenzo, Raman Uppal, and Tan Wang, 2007. “Portfolio selection with parameter and model uncertainty: A multi-prior approach.” Review of Financial Studies 20, 41-81.
Glode, Vincent, 2011. “Why mutual funds ‘underperform.’” Journal of Financial Economics 99, 546-559.
Gollier, Christian, and John W. Pratt, 1996. “Risk vulnerability and the tempering effect of background risk.” Econometrica 64, 1109-1123.
Goetzmann, William N., Dasol Kim, and Robert J. Shiller, 2016. “Crash beliefs from investor surveys.” NBER Working Paper 22143.
Gompers, Paul, William Gornall, Steven N. Kaplan, and Ilya A. Strebulaev, 2016. “How do venture capitalists make decisions?” NBER Working Paper 22587.
Gompers, Paul, Steven N. Kaplan, and Vladimir Mukharlyamov, 2016. “What do private equity firms say they do?” Journal of Financial Economics 121, 449-476.
Graham, John R., and Campbell R. Harvey, 2001. “The theory and practice of corporate finance: Evidence from the field.” Journal of Financial Economics 60, 187-243.
Graham, John R., Campbell R. Harvey, and Shiva Rajgopal, 2005. “The economic implications of corporate financial reporting.” Journal of Accounting and Economics 40, 5-73.
Greenwood, Robin, and Andrei Shleifer, 2014. “Expectations of returns and expected returns.” Review of Financial Studies 27, 714-746.
Griffin, John M., Jeffrey H. Harris, and Selim Topaloglu, 2003. “The dynamics of institutional and individual trading.” Journal of Finance 58, 2285-2320.
Grinblatt, Mark, and Matti Keloharju, 2000. “The investment behavior and performance of various investor types: A study of Finland’s unique data set.” Journal of Financial Economics 55, 43-67.
Grinblatt, Mark, and Matti Keloharju, 2001. “What makes investors trade?” Journal of Finance 56, 589-616.
Gruber, Martin J., 1996. “Another puzzle: The growth in actively managed mutual funds.” Journal of Finance 51, 783-810.
Guiso, Luigi, Tullio Jappelli, and Daniele Terlizzese, 1996. “Income risk, borrowing constraints, and portfolio choice.” American Economic Review 86, 158-172.
Guiso, Luigi, Paola Sapienza, and Luigi Zingales, 2003. “People’s opium? Religion and economic attitudes.” Journal of Monetary Economics 50, 225-282.
Guiso, Luigi, Paola Sapienza, and Luigi Zingales, 2008. “Trusting the stock market.” Journal of Finance 63, 2557-2600.

36
Guletkin, N. Bulent, 1983. “Stock market returns and inflation: Evidence from other countries.” Journal of Finance 38, 49-65.
Harris, Katherine M., and Michael P. Keane, 1998. “A model of health plan choice: Inferring preferences and perceptions from a combination of revealed preference and attitudinal data.” Journal of Econometrics 89, 131-157.
Hausman, Daniel M., 1992. “Why look under the hood?” In Essays on Philosophy and Economic Methodology. Cambridge: Cambridge University Press, 70-73.
Heaton, John, and Deborah Lucas, 2000. “Portfolio choice and asset prices: The importance of entrepreneurial risk.” Journal of Finance 55, 1163-1198.
Hilary, Gilles, and Kai Wai Hui, 2009. “Does religion matter in corporate decision making in America?” Journal of Financial Economics 93, 455–473.
Hochguertel, Stefan, 2003. “Precautionary motives and portfolio decisions.” Journal of Applied Econometrics 18, 61-77.
Jegadeesh, Narasimhan, and Sheridan Titman, 1993. “Returns to buying winners and selling loser: Implications for stock market efficiency.” Journal of Finance 48, 65-91.
Kahneman, Daniel, and Amos Tversky, 1979. “Prospect theory: An analysis of decision under risk.” Econometrica 47, 263-292.
Kan, Raymond, and Guofu Zhou, 2007. “Optimal portfolio choice with parameter uncertainty.” Journal of Financial and Quantitative Analysis 42, 621-656.
Kaniel, Ron, Gideon Saar, and Sheridan Titman, 2008. “Individual investor trading and stock returns.” Journal of Finance 63, 273-310.
Kézdi, Gábor, and Robert J. Willis, 2011. “Household stock market beliefs and learning.” NBER Working Paper 17614.
Kimball, Miles S., 1993. “Standard risk aversion.” Econometrica 61, 589-611.
Kosowski, Robert, 2011. “Do mutual funds perform when it matters most to investors? US mutual fund performance and risk in recessions and expansions.” Quarterly Journal of Finance 1, 607-664.
Kozak, Serhiy, Stefan Nagel, and Shrihari Santosh, 2017. “Interpreting factor models.” Journal of Finance, forthcoming.
Kuhnen, Camelia M., and Andrei C. Miu, 2017. “Socioeconomic status and learning from financial information.” Journal of Financial Economics 124, 349-372.
Kumar, Alok, 2009. “Who gambles in the stock market?” Journal of Finance 64, 1889-1933.
37
Kumar, Alok, Jeremy Page, and Oliver Spalt, 2011. “Religious beliefs, gambling attitudes, and financial market outcomes.” Journal of Financial Economics 102, 671-708.
Lagos, Ricardo, 2010. “Asset prices and liquidity in an exchange economy.” Journal of Monetary Economics 57, 913-930.
Laibson, David, 1997. “Golden eggs and hyperbolic discounting.” Quarterly Journal of Economics 112, 443-477.
Lintner, John, 1956. “Distribution of incomes of corporations among dividends, retained earnings, and taxes.” American Economic Review 46, 97-113.
Lintner, John, 1975. “Inflation and stock returns.” Journal of Finance 30, 259-280.
Lucas, Robert E., 1978. “Asset prices in an exchange economy.” Econometrica 46, 1429-1445.
Lütje, Torben, and Lukas Menkhoff, 2007. “What drives home bias? Evidence from fund managers’ views.” International Journal of Finance and Economics 12, 21-35.
Madrian, Brigitte C., and Dennis F. Shea, 2001. “The power of suggestion: Inertia in 401(k) participation and savings behavior.” Quarterly Journal of Economics 116, 1149-1187.
Malhotra, Neil, 2008. “Completion time and response order effects in web surveys.” Public Opinion Quarterly 72, 914-934.
Malmendier, Ulrike, and Stefan Nagel, 2011. “Depression babies: Do macroeconomic experiences affect risk taking?” Quarterly Journal of Economics 126, 373-416.
Mehra, Rajnish, and Edward C. Prescott, 1985. “The equity premium: A puzzle.” Journal of Monetary Economics 15, 145-161.
Menkhoff, Lukas, 2010. “The use of technical analysis by fund managers: International evidence.” Journal of Banking & Finance 34, 2573-2586.
Menkhoff, Lukas, and Ulrich Schmidt, 2005. “The use of trading strategies by fund managers: Some first survey evidence.” Applied Economics 37, 1719-1730.
Menkhoff, Lukas, Ulrich Schmidt, and Torsten Brozynski, 2006. “The impact of experience on risk taking, overconfidence, and herding of fund managers: Complementary survey evidence.” European Economic Review 50, 1753-1766.
Moskowitz, Tobias, 2000. “Mutual fund performance: An empirical decomposition into stock-picking talent, style, transactions costs, and expenses: Discussion.” Journal of Finance 55, 1695-1703.
Nelson, Charles R., 1976. “Inflation and rates of return on commons stocks.” Journal of Finance 31, 471-483.

38
O’Donoghue, Ted, and Matthew Rabin, 1999. “Doing it now or later.” American Economic Review 89, 103-124.
Palia, Darius, Yaxuan Qi, and Yangru Wu, 2014. “Heterogeneous background risks and portfolio choice: Evidence from micro-level data.” Journal of Money, Credit and Banking 46, 1687-1720.
Piazzesi, Monika, Martin Schneider, and Selale Tuzel, 2007. “Housing, consumption and asset pricing.” Journal of Financial Economics 83, 531-569.
Pratt, John W., and Richard J. Zeckhauser, 1987. “Proper risk aversion.” Econometrica 55, 143-154.
Putnam, Robert, 1993. Making Democracy Work: Civic Traditions in Modern Italy. Princeton, NJ: Princeton University Press.
Rabin, Matthew, 2000. “Risk aversion and expected-utility theory: A calibration theorem.” Econometrica 68, 1281-1292.
Rietz, Thomas A., 1988. “The equity risk premium: A solution.” Journal of Monetary Economics 22, 117-131.
Rosen, Harvey S., and Stephen Wu, 2004. “Portfolio choice and health status.” Journal of Financial Economics 72, 457-484.
Rubenstein, Mark, 1976. “The valuation of uncertain income streams and the pricing of options.” Bell Journal of Economics 7, 407-425.
Savov, Alexi, 2014. “The price of skill: Performance evaluation by households.” Journal of Financial Economics 112, 213-231.
Schmidt, Lawrence D. W., 2016. “Climbing and falling off the ladder: Asset pricing implications of labor market event risk.” Working paper, University of Chicago.
Schneider, Christoph, and Oliver Spalt, 2016. “Conglomerate investment, skewness, and the CEO long shot bias.” Journal of Finance 71, 635-672.
Schneider, Christoph, and Oliver Spalt, 2017. “Acquisitions as lotteries: Do managerial gambling attitudes influence takeover decisions?” Critical Finance Review 6, 77-132.
Segal, Uzi, and Avia Spivak, 1990. “’First order versus second order risk aversion.” Journal of Economic Theory 51, 111-125.
Shapiro, Gilla K., and Brendan J. Burchell, 2012. “Measuring financial anxiety.” Journal of Neuroscience, Psychology, and Economics 5, 92-103.
Shiller, Robert J., 2000. “Measuring bubble expectations and investor confidence.” Journal of Psychology and Financial Markets 1, 49-60.
39
Shiller, Robert J., and John Pound, 1989. “Survey evidence on diffusion of interest and information among investors.” Journal of Economic Behavior and Organization 12, 47-66.
Shu, Tao, Johan Sulaeman, and P. Eric Yeung, 2012. “Local religious beliefs and mutual fund risk-taking behaviors.” Management Science 58, 1779-1796.
Solnik, Bruno, and Vincent Solnik, 1997. “A multi-country test of the Fisher model for stock returns.” Journal of International Financial Markets 7, 289-301.
Tabachnick, Barbara G., and Linda S. Fidell, 2007. Using Multivariate Statistics, 5th edition. Boston: Pearson Education, Inc.
Taylor, Mark P., and Helen Allen, 1992. “The use of technical analysis in the foreign exchange market.” Journal of International Money and Finance 11, 304-314.
Vanguard. 2014. How America saves 2014: A report on Vanguard 2013 defined contribution plan data. Valley Forge, PA: Vanguard Group.
Vissing-Jørgensen, Annette, 2003. “Perspectives on behavioral finance: Does ‘irrationality’ disappear with wealth? Evidence from expectations and actions.” NBER Macroeconomics Annual 18, 139-194.
Wachter, Jessica A., 2002. “Portfolio and consumption decisions under mean-reverting returns: An exact solution for complete markets.” Journal of Financial and Quantitative Analysis 37, 63-91.
Weber, Max, 1930. The Protestant Ethic and the Spirit of Capitalism. London: Allen and Unwin.
Yao, Rui, and Harold H. Zhang, 2005. “Optimal consumption and portfolio choices with risky housing and borrowing constraints.” Review of Financial Studies 18, 197-239.
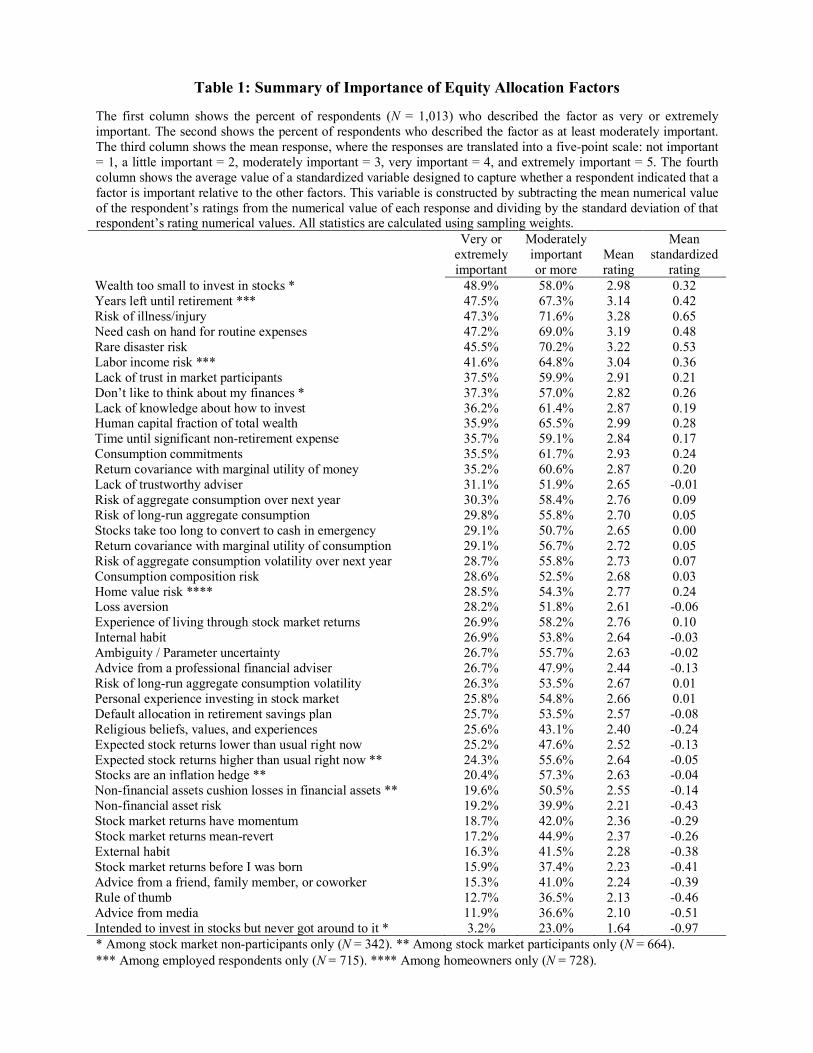
Table 1: Summary of Importance of Equity Allocation Factors
The first column shows the percent of respondents (N = 1,013) who described the factor as very or extremely important. The second shows the percent of respondents who described the factor as at least moderately important. The third column shows the mean response, where the responses are translated into a five-point scale: not important = 1, a little important = 2, moderately important = 3, very important = 4, and extremely important = 5. The fourth column shows the average value of a standardized variable designed to capture whether a respondent indicated that a factor is important relative to the other factors. This variable is constructed by subtracting the mean numerical value of the respondent’s ratings from the numerical value of each response and dividing by the standard deviation of that respondent’s rating numerical values. All statistics are calculated using sampling weights.
Very or extremely important
Moderately important or more
Mean rating
Mean standardized
rating Wealth too small to invest in stocks * 48.9% 58.0% 2.98 0.32 Years left until retirement *** 47.5% 67.3% 3.14 0.42 Risk of illness/injury 47.3% 71.6% 3.28 0.65 Need cash on hand for routine expenses 47.2% 69.0% 3.19 0.48 Rare disaster risk 45.5% 70.2% 3.22 0.53 Labor income risk *** 41.6% 64.8% 3.04 0.36 Lack of trust in market participants 37.5% 59.9% 2.91 0.21 Don’t like to think about my finances * 37.3% 57.0% 2.82 0.26 Lack of knowledge about how to invest 36.2% 61.4% 2.87 0.19 Human capital fraction of total wealth 35.9% 65.5% 2.99 0.28 Time until significant non-retirement expense 35.7% 59.1% 2.84 0.17 Consumption commitments 35.5% 61.7% 2.93 0.24 Return covariance with marginal utility of money 35.2% 60.6% 2.87 0.20 Lack of trustworthy adviser 31.1% 51.9% 2.65 -0.01 Risk of aggregate consumption over next year 30.3% 58.4% 2.76 0.09 Risk of long-run aggregate consumption 29.8% 55.8% 2.70 0.05 Stocks take too long to convert to cash in emergency 29.1% 50.7% 2.65 0.00 Return covariance with marginal utility of consumption 29.1% 56.7% 2.72 0.05 Risk of aggregate consumption volatility over next year 28.7% 55.8% 2.73 0.07 Consumption composition risk 28.6% 52.5% 2.68 0.03 Home value risk **** 28.5% 54.3% 2.77 0.24 Loss aversion 28.2% 51.8% 2.61 -0.06 Experience of living through stock market returns 26.9% 58.2% 2.76 0.10 Internal habit 26.9% 53.8% 2.64 -0.03 Ambiguity / Parameter uncertainty 26.7% 55.7% 2.63 -0.02 Advice from a professional financial adviser 26.7% 47.9% 2.44 -0.13 Risk of long-run aggregate consumption volatility 26.3% 53.5% 2.67 0.01 Personal experience investing in stock market 25.8% 54.8% 2.66 0.01 Default allocation in retirement savings plan 25.7% 53.5% 2.57 -0.08 Religious beliefs, values, and experiences 25.6% 43.1% 2.40 -0.24 Expected stock returns lower than usual right now 25.2% 47.6% 2.52 -0.13 Expected stock returns higher than usual right now ** 24.3% 55.6% 2.64 -0.05 Stocks are an inflation hedge ** 20.4% 57.3% 2.63 -0.04 Non-financial assets cushion losses in financial assets ** 19.6% 50.5% 2.55 -0.14 Non-financial asset risk 19.2% 39.9% 2.21 -0.43 Stock market returns have momentum 18.7% 42.0% 2.36 -0.29 Stock market returns mean-revert 17.2% 44.9% 2.37 -0.26 External habit 16.3% 41.5% 2.28 -0.38 Stock market returns before I was born 15.9% 37.4% 2.23 -0.41 Advice from a friend, family member, or coworker 15.3% 41.0% 2.24 -0.39 Rule of thumb 12.7% 36.5% 2.13 -0.46 Advice from media 11.9% 36.6% 2.10 -0.51 Intended to invest in stocks but never got around to it * 3.2% 23.0% 1.64 -0.97
* Among stock market non-participants only (N = 342). ** Among stock market participants only (N = 664). *** Among employed respondents only (N = 715). **** Among homeowners only (N = 728).
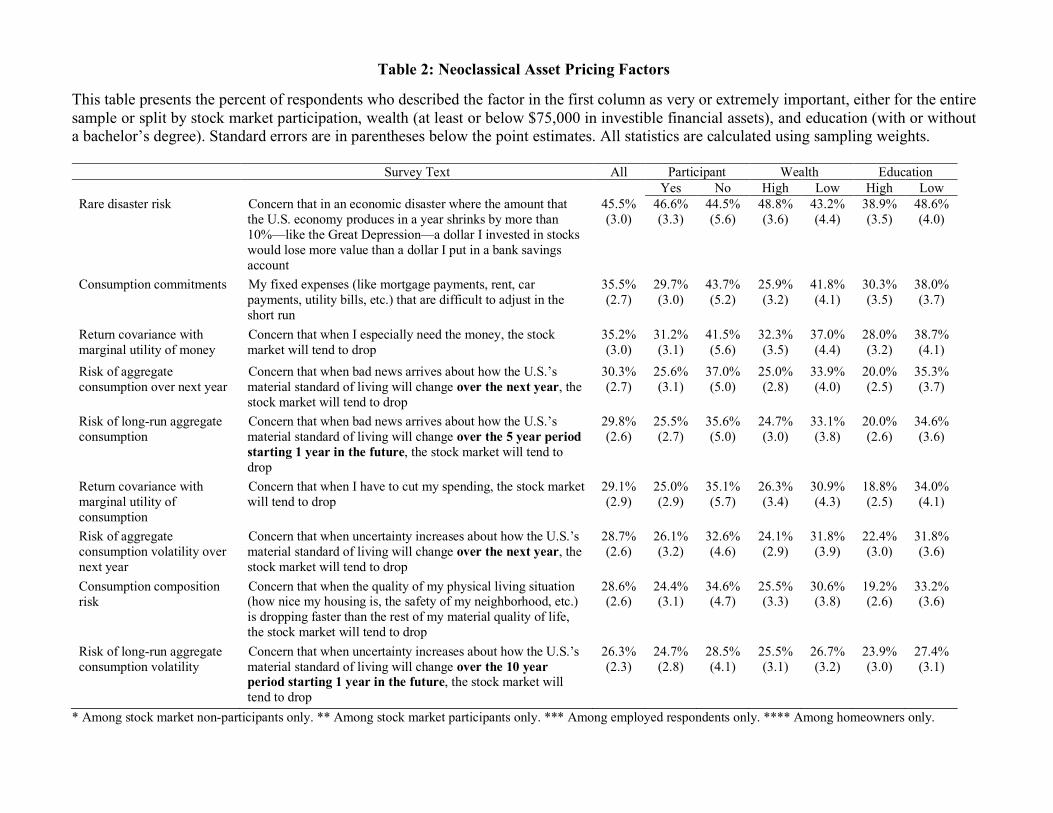
Table 2: Neoclassical Asset Pricing Factors
This table presents the percent of respondents who described the factor in the first column as very or extremely important, either for the entire sample or split by stock market participation, wealth (at least or below $75,000 in investible financial assets), and education (with or without a bachelor’s degree). Standard errors are in parentheses below the point estimates. All statistics are calculated using sampling weights.
Survey Text All Participant Wealth Education
Yes No High Low High Low
Rare disaster risk Concern that in an economic disaster where the amount that the U.S. economy produces in a year shrinks by more than 10%—like the Great Depression—a dollar I invested in stocks would lose more value than a dollar I put in a bank savings account
45.5% (3.0)
46.6% (3.3)
44.5% (5.6)
48.8% (3.6)
43.2% (4.4)
38.9% (3.5)
48.6% (4.0)
Consumption commitments My fixed expenses (like mortgage payments, rent, car payments, utility bills, etc.) that are difficult to adjust in the short run
35.5% (2.7)
29.7% (3.0)
43.7% (5.2)
25.9% (3.2)
41.8% (4.1)
30.3% (3.5)
38.0% (3.7)
Return covariance with marginal utility of money
Concern that when I especially need the money, the stock market will tend to drop
35.2% (3.0)
31.2% (3.1)
41.5% (5.6)
32.3% (3.5)
37.0% (4.4)
28.0% (3.2)
38.7% (4.1)
Risk of aggregate consumption over next year
Concern that when bad news arrives about how the U.S.’s material standard of living will change over the next year, the stock market will tend to drop
30.3% (2.7)
25.6% (3.1)
37.0% (5.0)
25.0% (2.8)
33.9% (4.0)
20.0% (2.5)
35.3% (3.7)
Risk of long-run aggregate consumption
Concern that when bad news arrives about how the U.S.’s material standard of living will change over the 5 year period starting 1 year in the future, the stock market will tend to drop
29.8% (2.6)
25.5% (2.7)
35.6% (5.0)
24.7% (3.0)
33.1% (3.8)
20.0% (2.6)
34.6% (3.6)
Return covariance with marginal utility of consumption
Concern that when I have to cut my spending, the stock market will tend to drop
29.1% (2.9)
25.0% (2.9)
35.1% (5.7)
26.3% (3.4)
30.9% (4.3)
18.8% (2.5)
34.0% (4.1)
Risk of aggregate consumption volatility over next year
Concern that when uncertainty increases about how the U.S.’s material standard of living will change over the next year, the stock market will tend to drop
28.7% (2.6)
26.1% (3.2)
32.6% (4.6)
24.1% (2.9)
31.8% (3.9)
22.4% (3.0)
31.8% (3.6)
Consumption composition risk
Concern that when the quality of my physical living situation (how nice my housing is, the safety of my neighborhood, etc.) is dropping faster than the rest of my material quality of life, the stock market will tend to drop
28.6% (2.6)
24.4% (3.1)
34.6% (4.7)
25.5% (3.3)
30.6% (3.8)
19.2% (2.6)
33.2% (3.6)
Risk of long-run aggregate consumption volatility
Concern that when uncertainty increases about how the U.S.’s material standard of living will change over the 10 year period starting 1 year in the future, the stock market will tend to drop
26.3% (2.3)
24.7% (2.8)
28.5% (4.1)
25.5% (3.1)
26.7% (3.2)
23.9% (3.0)
27.4% (3.1)
* Among stock market non-participants only. ** Among stock market participants only. *** Among employed respondents only. **** Among homeowners only.

Table 3: Responses to Increase in Consumption Commitments
This table presents the distribution of responses to the question “If your fixed expenses rose as a fraction of your income, would this rise cause you to increase or decrease the percentage of your investable financial assets held in stocks?” (for stock market participants) or “If your fixed expenses rose as a fraction of your income, would this rise make you more or less likely to invest in stocks?” (for stock market non-participants). In the first column, the population over which these percentages are calculated is all respondents who rated consumption commitments to be a very or extremely important factor in their equity allocation decision (N = 340). Subsequent columns report percentages over subsamples split by stock market participation, wealth (at least or below $75,000 in investible financial assets), and education (with or without a bachelor’s degree). Standard errors are in parentheses below the point estimates. All statistics are calculated using sampling weights.
All Participant Wealth Education Yes No High Low High Low Decrease equity allocation percentage / less likely to invest in equities
45.1% (4.6)
31.1% (5.3)
58.8% (6.5)
41.2% (7.5)
46.7% (5.8)
44.1% (6.9)
45.5% (5.8)
Neither increase nor decrease equity allocation percentage / neither more nor less likely to invest in equities
30.7% (3.7)
45.2% (5.8)
16.2% (3.9)
36.1% (6.3)
28.6% (4.6)
34.2% (6.9)
29.4% (4.4)
Increase equity allocation percentage / more likely to invest in equities
13.0% (3.4)
13.0% (5.2)
13.3% (4.4)
11.0% (4.6)
13.8% (4.4)
9.4% (4.7)
14.4% (4.3)
I don’t know
9.5% (2.2)
7.5% (2.9)
11.7% (3.5)
6.2% (2.9)
10.9% (2.9)
11.7% (4.7)
8.7% (2.5)
Did not respond 1.6% (1.4)
3.3% (2.9)
---
5.5% (4.8)
---
0.6% (0.6)
2.0% (2.0)

Table 4: Background Risks and Assets
This table presents the percent of respondents who described the factor in the first column as very or extremely important, either for the entire sample or split by stock market participation, wealth (at least or below $75,000 in investible financial assets), and education (with or without a bachelor’s degree). Standard errors are in parentheses below the point estimates. All statistics are calculated using sampling weights.
Survey Text All Participant Wealth Education
Yes No High Low High Low
Wealth too small* The amount of money I have available to invest in stocks is too small
48.9% (5.5)
--- 48.9% (5.5)
31.2% (9.9)
51.3% (6.0)
73.7% (5.9)
43.9% (6.5)
Years left until retirement***
The number of years I (and my spouse/partner, if applicable) have left until retirement
47.5% (3.5)
58.7% (3.7)
30.1% (5.3)
61.2% (4.0)
38.7% (4.7)
48.4% (4.4)
47.0% (4.8)
Risk of illness/injury The risk of expenses due to illness or injury to me or someone else in my family
47.3% (3.0)
47.7% (3.3)
46.9% (5.5)
44.8% (3.6)
49.0% (4.3)
36.9% (3.4)
52.3% (3.9)
Labor income risk*** Concern that I (or my spouse/partner, if applicable) might become unemployed, receive a pay cut, or not receive an expected pay increase
41.6% (3.7)
39.7% (3.9)
45.8% (7.1)
35.3% (4.2)
45.7% (5.2)
33.2% (3.9)
46.3% (5.0)
Human capital The difference between how much money I have available to invest right now and all the money I (and my spouse/partner, if applicable) expect to earn in wages over the rest of my life
35.9% (3.0)
31.5% (3.2)
42.4% (5.6)
34.3% (3.7)
36.9% (4.4)
30.9% (3.7)
38.3% (4.1)
Time until significant non-retirement expense
How soon I will have significant expenses (like a car purchase, a down payment on a home, school tuition, etc.)
35.7% (2.8)
36.1% (3.4)
35.6% (4.8)
28.8% (3.4)
40.3% (4.1)
38.2% (3.9%)
34.6% (3.7)
Home value risk**** Concern that my home value might fall 28.5% (2.7)
26.6% (3.1)
33.2% (5.3)
28.1% (3.4)
29.1% (4.2)
20.0% (2.9)
33.9% (3.9)
Stocks are an inflation hedge**
A belief that stocks are attractive because when my living expenses increase unexpectedly, the stock market will tend to rise
20.4% (2.9)
20.4% (2.9)
--- 19.8% (3.7)
21.3% (4.6)
11.5% (2.5)
27.6% (4.6)
Non-financial assets cushion losses in financial assets**
A belief that I can afford to take more risks in my financial portfolio because my non-financial assets (such as my home or small business) will cushion me against losses in my financial portfolio
19.6% (2.7)
19.6% (2.7)
--- 19.9% (3.2)
19.2% (4.6)
12.8% (2.4)
25.0% (4.3)
Non-financial risk Concern my non-financial assets other than my home—such as my small business—might lose value
19.2% (2.2)
16.2% (2.4)
23.5% (4.2)
16.1% (2.9)
21.1% (3.1)
13.0% (2.5)
22.2% (3.0)
* Among stock market non-participants only. ** Among stock market participants only. *** Among employed respondents only. **** Among homeowners only.
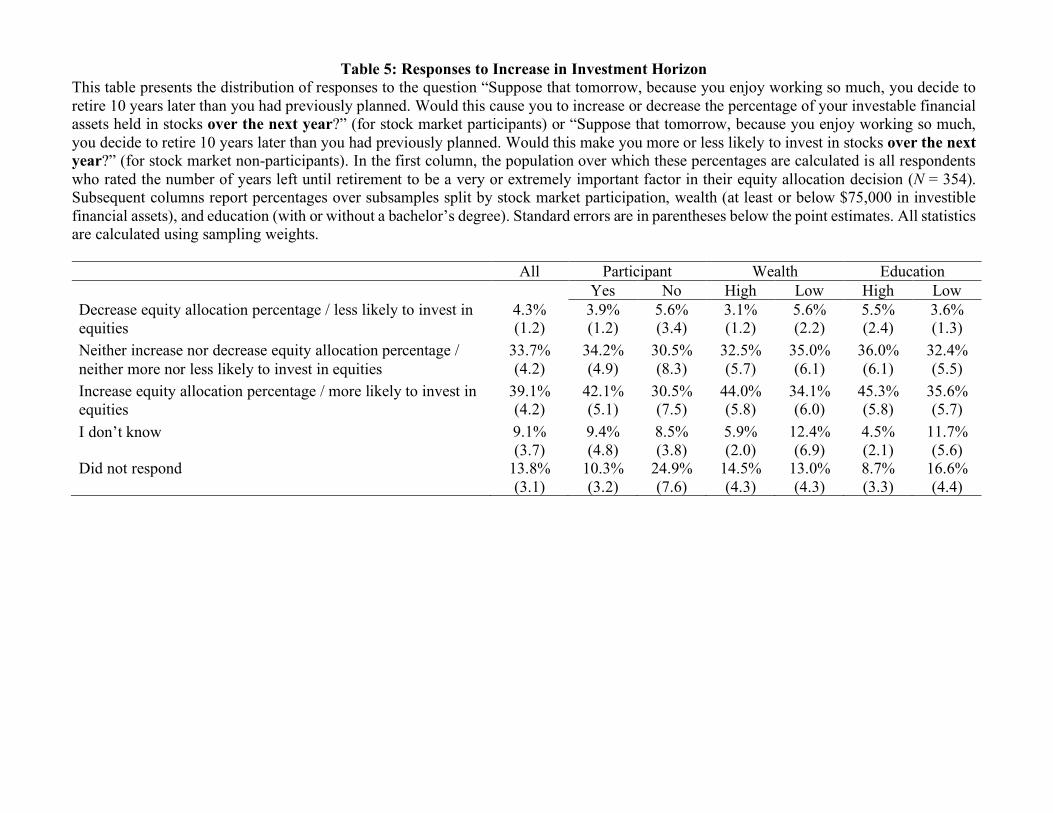
Table 5: Responses to Increase in Investment Horizon This table presents the distribution of responses to the question “Suppose that tomorrow, because you enjoy working so much, you decide to retire 10 years later than you had previously planned. Would this cause you to increase or decrease the percentage of your investable financial assets held in stocks over the next year?” (for stock market participants) or “Suppose that tomorrow, because you enjoy working so much, you decide to retire 10 years later than you had previously planned. Would this make you more or less likely to invest in stocks over the next year?” (for stock market non-participants). In the first column, the population over which these percentages are calculated is all respondents who rated the number of years left until retirement to be a very or extremely important factor in their equity allocation decision (N = 354). Subsequent columns report percentages over subsamples split by stock market participation, wealth (at least or below $75,000 in investible financial assets), and education (with or without a bachelor’s degree). Standard errors are in parentheses below the point estimates. All statistics are calculated using sampling weights.
All Participant Wealth Education Yes No High Low High Low
Decrease equity allocation percentage / less likely to invest in equities
4.3% (1.2)
3.9% (1.2)
5.6% (3.4)
3.1% (1.2)
5.6% (2.2)
5.5% (2.4)
3.6% (1.3)
Neither increase nor decrease equity allocation percentage / neither more nor less likely to invest in equities
33.7% (4.2)
34.2% (4.9)
30.5% (8.3)
32.5% (5.7)
35.0% (6.1)
36.0% (6.1)
32.4% (5.5)
Increase equity allocation percentage / more likely to invest in equities
39.1% (4.2)
42.1% (5.1)
30.5% (7.5)
44.0% (5.8)
34.1% (6.0)
45.3% (5.8)
35.6% (5.7)
I don’t know 9.1% (3.7)
9.4% (4.8)
8.5% (3.8)
5.9% (2.0)
12.4% (6.9)
4.5% (2.1)
11.7% (5.6)
Did not respond 13.8% (3.1)
10.3% (3.2)
24.9% (7.6)
14.5% (4.3)
13.0% (4.3)
8.7% (3.3)
16.6% (4.4)
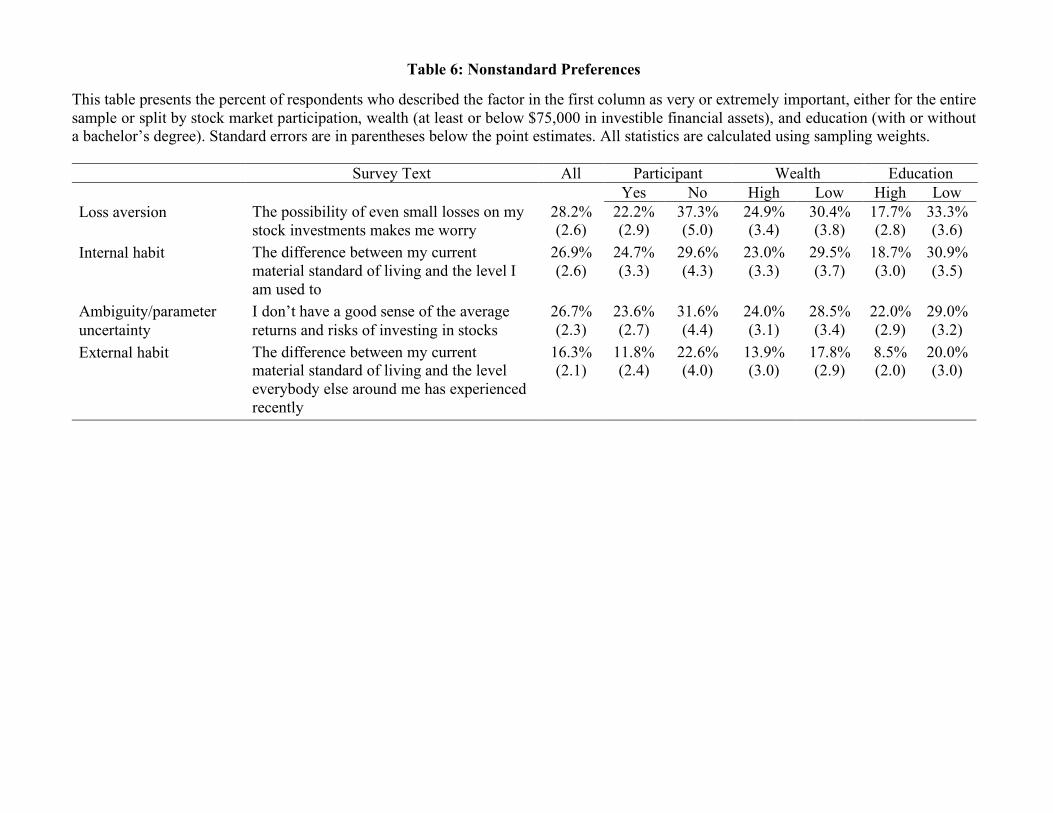
Table 6: Nonstandard Preferences
This table presents the percent of respondents who described the factor in the first column as very or extremely important, either for the entire sample or split by stock market participation, wealth (at least or below $75,000 in investible financial assets), and education (with or without a bachelor’s degree). Standard errors are in parentheses below the point estimates. All statistics are calculated using sampling weights. Survey Text All Participant Wealth Education
Yes No High Low High Low
Loss aversion The possibility of even small losses on my stock investments makes me worry
28.2% (2.6)
22.2% (2.9)
37.3% (5.0)
24.9% (3.4)
30.4% (3.8)
17.7% (2.8)
33.3% (3.6)
Internal habit The difference between my current material standard of living and the level I am used to
26.9% (2.6)
24.7% (3.3)
29.6% (4.3)
23.0% (3.3)
29.5% (3.7)
18.7% (3.0)
30.9% (3.5)
Ambiguity/parameter uncertainty
I don’t have a good sense of the average returns and risks of investing in stocks
26.7% (2.3)
23.6% (2.7)
31.6% (4.4)
24.0% (3.1)
28.5% (3.4)
22.0% (2.9)
29.0% (3.2)
External habit The difference between my current material standard of living and the level everybody else around me has experienced recently
16.3% (2.1)
11.8% (2.4)
22.6% (4.0)
13.9% (3.0)
17.8% (2.9)
8.5% (2.0)
20.0% (3.0)
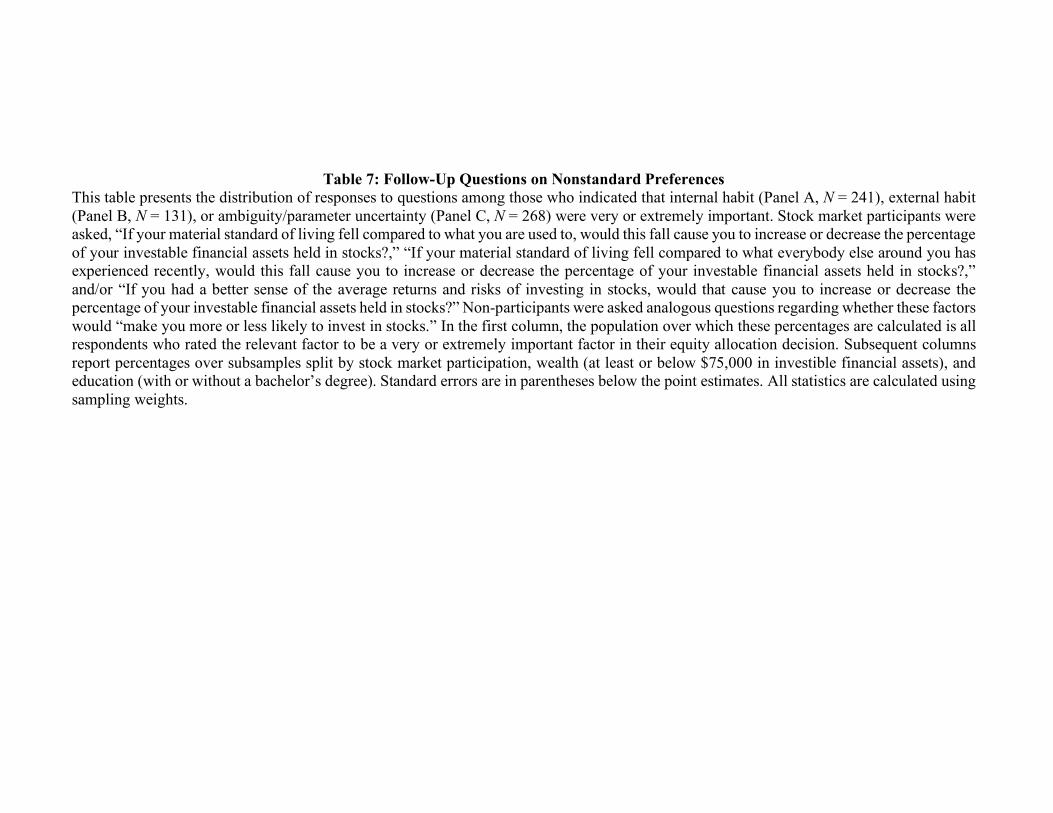
Table 7: Follow-Up Questions on Nonstandard Preferences This table presents the distribution of responses to questions among those who indicated that internal habit (Panel A, N = 241), external habit (Panel B, N = 131), or ambiguity/parameter uncertainty (Panel C, N = 268) were very or extremely important. Stock market participants were asked, “If your material standard of living fell compared to what you are used to, would this fall cause you to increase or decrease the percentage of your investable financial assets held in stocks?,” “If your material standard of living fell compared to what everybody else around you has experienced recently, would this fall cause you to increase or decrease the percentage of your investable financial assets held in stocks?,” and/or “If you had a better sense of the average returns and risks of investing in stocks, would that cause you to increase or decrease the percentage of your investable financial assets held in stocks?” Non-participants were asked analogous questions regarding whether these factors would “make you more or less likely to invest in stocks.” In the first column, the population over which these percentages are calculated is all respondents who rated the relevant factor to be a very or extremely important factor in their equity allocation decision. Subsequent columns report percentages over subsamples split by stock market participation, wealth (at least or below $75,000 in investible financial assets), and education (with or without a bachelor’s degree). Standard errors are in parentheses below the point estimates. All statistics are calculated using sampling weights.

All Participant Wealth Education Yes No High Low High Low
Panel A: Internal Habit – Response to fall in standard of living compared to what you are used to Decrease equity allocation percentage / less likely to invest in equities
41.9% (5.3)
39.0% (8.1)
44.3% (7.1)
42.4% (8.5)
41.7% (6.8)
60.6% (7.6)
36.4% (6.1)
Neither increase nor decrease equity allocation percentage / neither more nor less likely to invest in equities
26.1% (4.2)
29.3% (6.1)
22.9% (6.3)
38.8% (8.0)
19.6% (4.5)
28.5% (6.3)
25.4% (5.2)
Increase equity allocation percentage / more likely to invest in equities
7.6% (3.4)
4.4% (2.2)
11.6% (6.7)
2.4% (1.1)
10.2% (5.0)
4.3% (1.9)
8.5% (4.3)
I don’t know 22.3% (5.5)
23.4% (8.5)
21.1% (6.9)
10.2% (4.1)
28.5% (7.6)
5.7% (2.4)
27.2% (6.8)
Did not respond 2.1% (1.9)
3.9% (3.5)
--- 6.2% (5.4)
--- 1.0% (1.0)
2.4% (2.4)
Panel B: External Habit – Response to fall in standard of living compared to what everybody else around you has experienced recently Decrease equity allocation percentage / less likely to invest in equities
46.9% (7.1)
34.3% (11.1)
57.2% (9.5)
55.8% (11.7)
42.4% (8.4)
58.3% (11.1)
44.5% (8.1)
Neither increase nor decrease equity allocation percentage / neither more nor less likely to invest in equities
23.3% (5.9)
22.9% (6.7)
21.9% (9.0)
21.1% (7.0)
24.4% (8.0)
29.9% (9.3)
21.9% (6.9)
Increase equity allocation percentage / more likely to invest in equities
12.0% (5.2)
19.5% (11.1)
6.7% (2.8)
3.0% (2.3)
16.6% (7.5)
6.5% (5.0)
13.1% (6.2)
I don’t know 14.3% (4.9)
15.0% (6.4)
14.1% (7.2)
9.7% (5.9)
16.7% (6.6)
3.1% (2.4)
16.7% (5.8)
Did not respond 3.5% (3.1)
8.3% (7.1)
--- 10.3% (8.7)
--- 2.1% (2.2)
3.8% (3.7)
Panel C: Ambiguity / Parameter Uncertainty – Response to having a better sense of the average returns and risks of investing in stocks Decrease equity allocation percentage / less likely to invest in equities
8.1% (3.6)
3.9% (2.3)
12.6% (6.7)
2.6% (1.6)
11.2% (5.3)
1.3% (1.1)
10.6% (4.8)
Neither increase nor decrease equity allocation percentage / neither more nor less likely to invest in equities
17.3% (3.2)
17.1% (4.0)
17.6% (5.0)
19.1% (5.0)
16.4% (4.1)
19.6% (4.9)
16.5% (3.9)
Increase equity allocation percentage / more likely to invest in equities
57.7% (4.7)
60.0% (6.1)
55.5% (7.1)
55.5% (7.3)
59.1% (6.1)
61.4% (6.3)
56.3% (5.9)
I don’t know 14.6% (2.7)
14.8% (3.4)
13.9% (4.4)
16.8% (4.4)
13.1% (3.5)
16.9% (4.0)
13.7% (3.5)
Did not respond 2.3% (1.9)
4.1% (3.6)
0.3% (0.3)
6.0% (5.2)
0.3% (0.3)
0.8% (0.8)
2.8% (2.6)
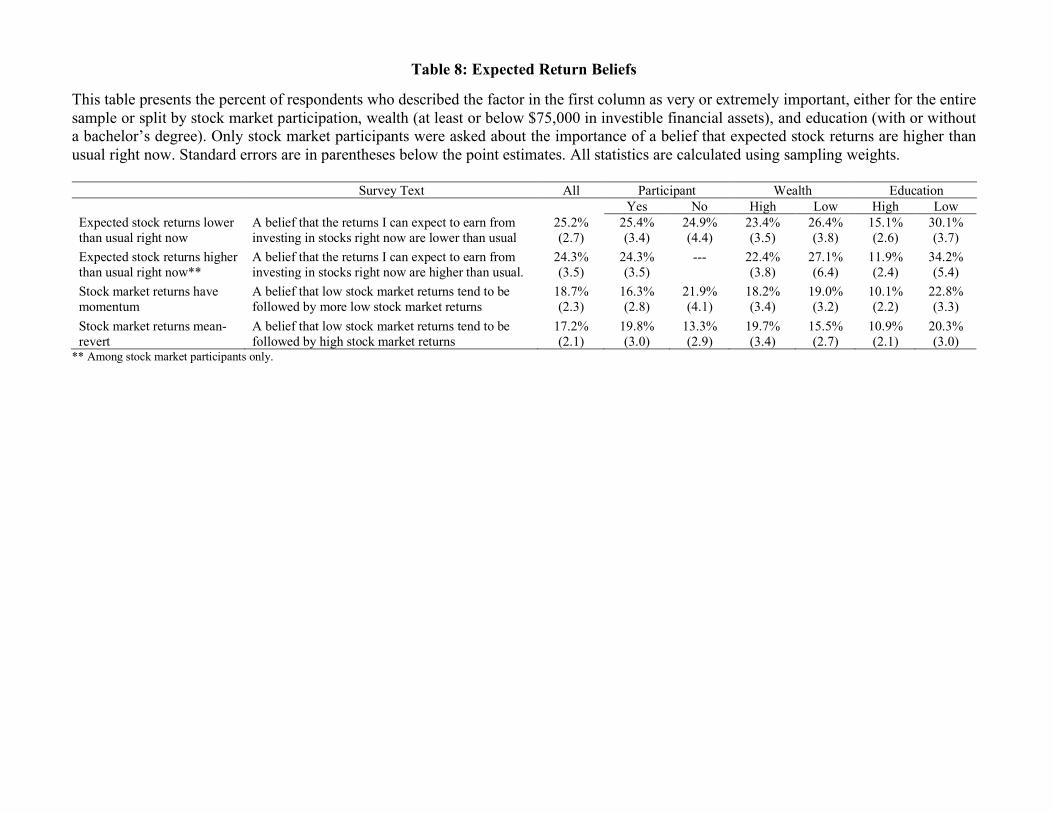
Table 8: Expected Return Beliefs
This table presents the percent of respondents who described the factor in the first column as very or extremely important, either for the entire sample or split by stock market participation, wealth (at least or below $75,000 in investible financial assets), and education (with or without a bachelor’s degree). Only stock market participants were asked about the importance of a belief that expected stock returns are higher than usual right now. Standard errors are in parentheses below the point estimates. All statistics are calculated using sampling weights.
Survey Text All Participant Wealth Education Yes No High Low High Low
Expected stock returns lower than usual right now
A belief that the returns I can expect to earn from investing in stocks right now are lower than usual
25.2% (2.7)
25.4% (3.4)
24.9% (4.4)
23.4% (3.5)
26.4% (3.8)
15.1% (2.6)
30.1% (3.7)
Expected stock returns higher than usual right now**
A belief that the returns I can expect to earn from investing in stocks right now are higher than usual.
24.3% (3.5)
24.3% (3.5)
--- 22.4% (3.8)
27.1% (6.4)
11.9% (2.4)
34.2% (5.4)
Stock market returns have momentum
A belief that low stock market returns tend to be followed by more low stock market returns
18.7% (2.3)
16.3% (2.8)
21.9% (4.1)
18.2% (3.4)
19.0% (3.2)
10.1% (2.2)
22.8% (3.3)
Stock market returns mean-revert
A belief that low stock market returns tend to be followed by high stock market returns
17.2% (2.1)
19.8% (3.0)
13.3% (2.9)
19.7% (3.4)
15.5% (2.7)
10.9% (2.1)
20.3% (3.0)
** Among stock market participants only.

Table 9: Social and Personal Factors
This table presents the percent of respondents who described the factor in the first column as very or extremely important, either for the entire sample or split by stock market participation, wealth (at least or below $75,000 in investible financial assets), and education (with or without a bachelor’s degree). Some factor ratings were elicited only from stock market non-participants. Standard errors are in parentheses below the point estimates. All statistics are calculated using sampling weights.
Survey Text All Participant Wealth Education Yes No High Low High Low
Low trust in market participants
Concern that companies, managers, brokers, or other market participants might cheat me out of my investments
37.5% (3.0)
34.2% (3.1)
42.2% (5.6)
36.8% (3.6)
37.9% (4.4)
26.0% (3.3)
43.1% (4.1)
Don’t like to think about my finances*
I don’t like to think about my finances 37.3% (5.0)
--- 37.3% (5.0)
33.3% (8.5)
37.8% (5.6)
29.6% (7.6)
38.8% (5.8)
Lack of knowledge about how to invest
My lack of knowledge about how to invest 36.2% (2.8)
33.3% (3.4)
39.4% (4.9)
32.2% (3.5)
38.9% (4.0)
28.1% (3.2)
40.2% (3.8)
Lack of trustworthy adviser
Difficulty in finding a trustworthy adviser 31.1% (2.6)
29.3% (3.0)
33.7% (4.7)
33.0% (3.4)
29.9% (3.6)
23.9% (3.0)
34.7% (3.5)
Experience of living through returns
The feelings, attitudes, and beliefs about the stock market I’ve gotten from living through stock market ups and downs (whether or not I was invested in stocks at the time)
26.9% (2.3)
30.5% (3.0)
22.5% (3.7)
36.2% (3.4)
20.9% (3.0)
30.9% (3.3)
25.0% (3.1)
Advice from professional financial adviser
Advice from a professional financial adviser I hired 26.7% (2.4)
34.0% (3.2)
16.3% (3.1)
33.7% (3.3)
22.2% (3.3)
27.5% (3.1)
26.4% (3.2)
Personal experience investing in stock market
The feelings, attitudes, and beliefs about the stock market I’ve gotten from my personal experiences of investing in the stock market
25.8% (2.4)
29.3% (3.0)
21.6% (3.7)
32.0% (3.4)
21.9% (3.1)
28.9% (3.3)
24.4% (3.1)
Religion My religious beliefs, values, and experiences 25.6% (2.4)
24.0% (2.8)
26.8% (4.4)
20.6% (2.7)
28.8% (3.7)
17.8% (3.0)
29.4% (3.4)
Advice from friend, family, or coworker
Advice from a friend, family member, or coworker 15.3% (2.2)
12.2% (2.5)
19.6% (4.0)
6.5% (1.9)
21.0% (3.3)
14.0% (3.2)
15.9% (2.8)
Advice from media Advice from a book or an article I read, or from somebody on TV, radio, or the internet
11.9% (2.0)
11.8% (2.6)
12.3% (3.0)
8.8% (2.3)
13.9% (2.9)
9.2% (2.7)
13.2% (2.6)
Intended to invest but never got around to it*
I intended to invest in stocks but never got around to it 3.2% (0.9)
--- 3.2% (0.9)
2.1% (1.3)
3.4% (1.0)
7.6% (3.6)
2.4% (0.8)
* Among stock market non-participants only.
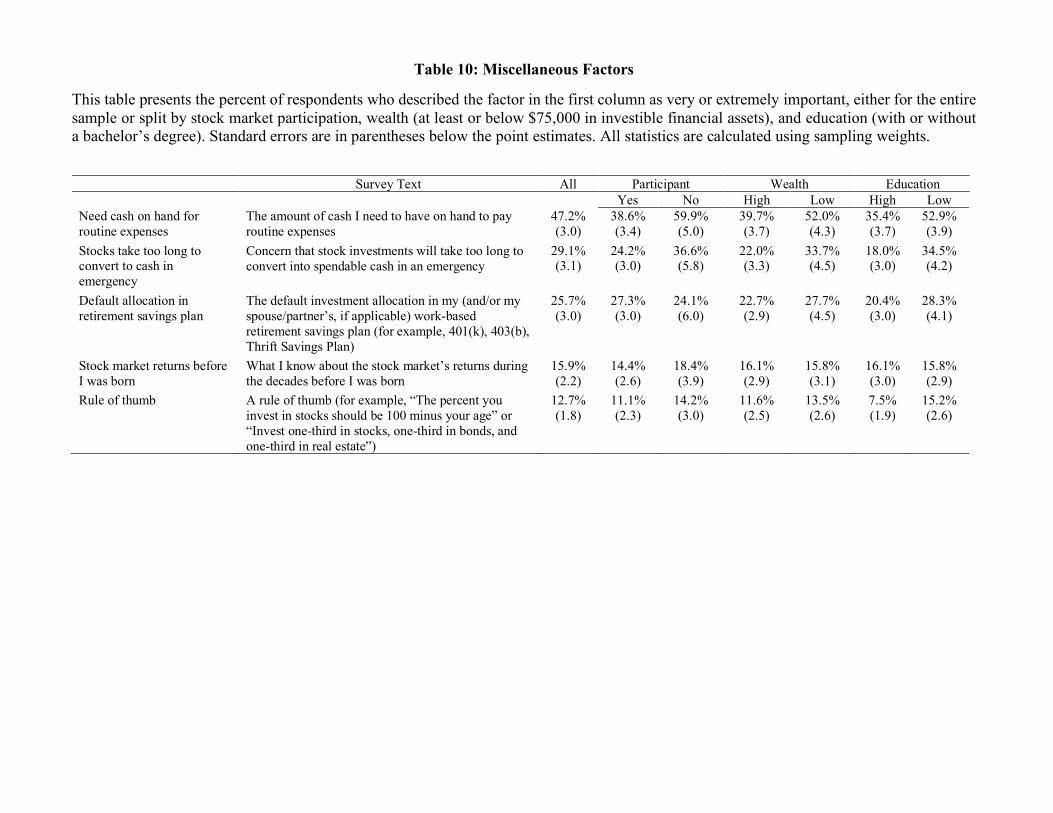
Table 10: Miscellaneous Factors
This table presents the percent of respondents who described the factor in the first column as very or extremely important, either for the entire sample or split by stock market participation, wealth (at least or below $75,000 in investible financial assets), and education (with or without a bachelor’s degree). Standard errors are in parentheses below the point estimates. All statistics are calculated using sampling weights.
Survey Text All Participant Wealth Education
Yes No High Low High Low Need cash on hand for routine expenses
The amount of cash I need to have on hand to pay routine expenses
47.2% (3.0)
38.6% (3.4)
59.9% (5.0)
39.7% (3.7)
52.0% (4.3)
35.4% (3.7)
52.9% (3.9)
Stocks take too long to convert to cash in emergency
Concern that stock investments will take too long to convert into spendable cash in an emergency
29.1% (3.1)
24.2% (3.0)
36.6% (5.8)
22.0% (3.3)
33.7% (4.5)
18.0% (3.0)
34.5% (4.2)
Default allocation in retirement savings plan
The default investment allocation in my (and/or my spouse/partner’s, if applicable) work-based retirement savings plan (for example, 401(k), 403(b), Thrift Savings Plan)
25.7% (3.0)
27.3% (3.0)
24.1% (6.0)
22.7% (2.9)
27.7% (4.5)
20.4% (3.0)
28.3% (4.1)
Stock market returns before I was born
What I know about the stock market’s returns during the decades before I was born
15.9% (2.2)
14.4% (2.6)
18.4% (3.9)
16.1% (2.9)
15.8% (3.1)
16.1% (3.0)
15.8% (2.9)
Rule of thumb A rule of thumb (for example, “The percent you invest in stocks should be 100 minus your age” or “Invest one-third in stocks, one-third in bonds, and one-third in real estate”)
12.7% (1.8)
11.1% (2.3)
14.2% (3.0)
11.6% (2.5)
13.5% (2.6)
7.5% (1.9)
15.2% (2.6)

Table 11: Fixed Costs of Stock Market Participation
This table presents, among respondents who said that “the amount of money I have available to invest in stocks is too small” is a very or extremely important factor in their not holding stocks, the percent who described the factor in the first column as very or extremely important in causing the amount of money they have to be too small. The percentages are calculated over either the entire subsample (N = 211) or over the subsample split by stock market participation, wealth (at least or below $75,000 in investible financial assets), and education (with or without a bachelor’s degree). The question about home crowd-out is asked only of homeowners in the subsample (N = 96). Standard errors are in parentheses below the point estimates. All statistics are calculated using sampling weights.
Survey Text All Wealth Education High Low High Low
Costs of staying up-to-date
The ongoing time, money, and/or effort it would take to stay up-to-date on the stock market
45.3% (7.2)
77.7% (13.5)
42.8% (7.4)
47.6% (10.1)
44.6% (8.9)
Costs of learning about stocks
The amount of time, money, and/or effort it would take to learn about stocks
41.2% (6.8)
77.0% (13.6)
38.5% (6.8)
40.8% (9.4)
41.4% (8.4)
Costs of hiring an adviser The amount of time, money, and/or effort it would take to hire an investment adviser
39.3% (6.7)
66.8% (15.8)
37.2% (6.8)
31.8% (8.5)
41.7% (8.5)
Costs of maintaining an account
The ongoing time, money, and/or effort it would take to maintain an investment account after setting it up
37.4% (6.4)
32.5% (16.4)
37.8% (6.8)
37.8% (9.3)
37.3% (7.9)
Costs of maintaining an adviser
The ongoing time, money, and/or effort it would take to maintain a relationship with an investment adviser after hiring him or her
37.4% (6.4)
33.6% (16.6)
37.7% (6.8)
35.5% (9.0)
38.0% (7.9)
Costs of setting up an account
The amount of time, money, and/or effort it would take to set up an investment account
30.8% (5.8)
33.6% (16.6)
30.6% (6.1)
24.0% (7.8)
32.9% (7.4)
Tax complexity Stock investments would make my tax returns harder to prepare
27.6% (5.4)
19.5% (11.1)
28.2% (5.8)
25.8% (8.6)
28.2% (6.6)
Home crowd-out**** You said you own your home. How important is that in causing you to not have enough money to make it worthwhile to invest in stocks?
26.6% (6.9)
46.0% (21.2)
23.2% (7.3)
26.0% (9.5)
26.9% (9.2)
**** Among homeowners only.
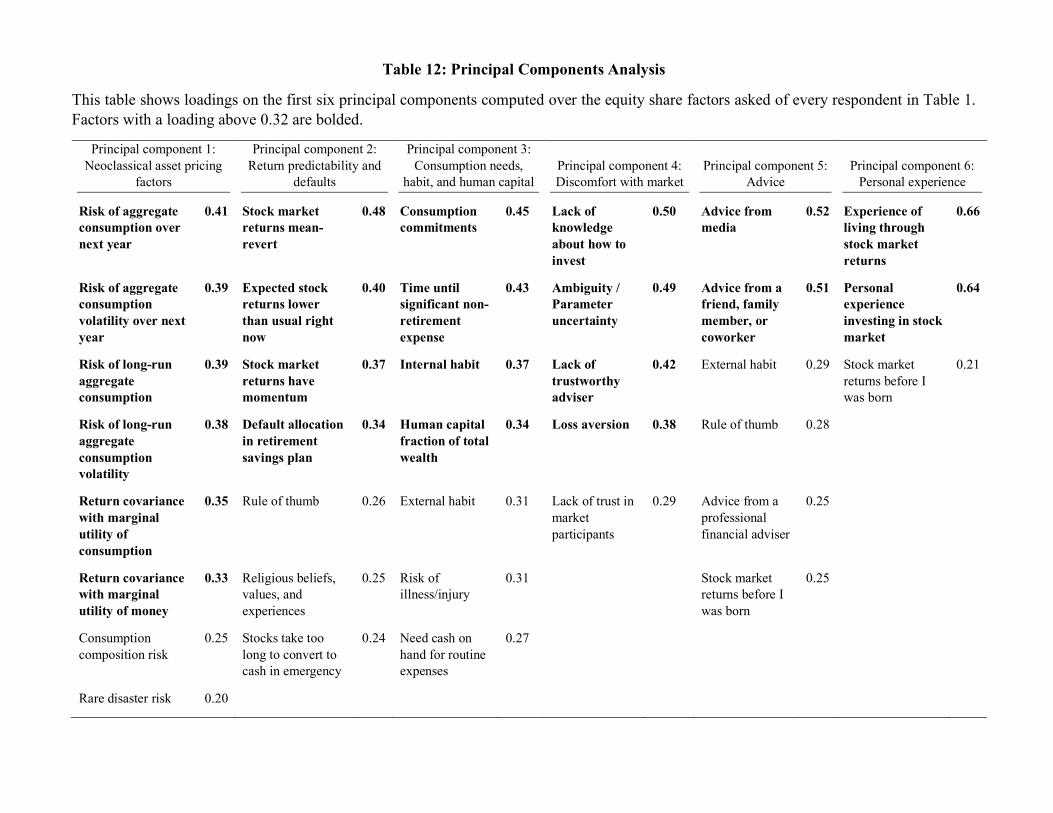
Table 12: Principal Components Analysis
This table shows loadings on the first six principal components computed over the equity share factors asked of every respondent in Table 1. Factors with a loading above 0.32 are bolded.
Principal component 1: Neoclassical asset pricing
factors
Principal component 2: Return predictability and
defaults
Principal component 3: Consumption needs,
habit, and human capital Principal component 4: Discomfort with market
Principal component 5: Advice
Principal component 6: Personal experience
Risk of aggregate consumption over next year
0.41 Stock market returns mean-revert
0.48 Consumption commitments
0.45 Lack of knowledge about how to invest
0.50 Advice from media
0.52 Experience of living through stock market returns
0.66
Risk of aggregate consumption volatility over next year
0.39 Expected stock returns lower than usual right now
0.40 Time until significant non-retirement expense
0.43 Ambiguity / Parameter uncertainty
0.49 Advice from a friend, family member, or coworker
0.51 Personal experience investing in stock market
0.64
Risk of long-run aggregate consumption
0.39 Stock market returns have momentum
0.37 Internal habit 0.37 Lack of trustworthy adviser
0.42 External habit 0.29 Stock market returns before I was born
0.21
Risk of long-run aggregate consumption volatility
0.38 Default allocation in retirement savings plan
0.34 Human capital fraction of total wealth
0.34 Loss aversion 0.38 Rule of thumb 0.28
Return covariance with marginal utility of consumption
0.35 Rule of thumb 0.26 External habit 0.31 Lack of trust in market participants
0.29 Advice from a professional financial adviser
0.25
Return covariance with marginal utility of money
0.33 Religious beliefs, values, and experiences
0.25 Risk of illness/injury
0.31 Stock market returns before I was born
0.25
Consumption composition risk
0.25 Stocks take too long to convert to cash in emergency
0.24 Need cash on hand for routine expenses
0.27
Rare disaster risk 0.20
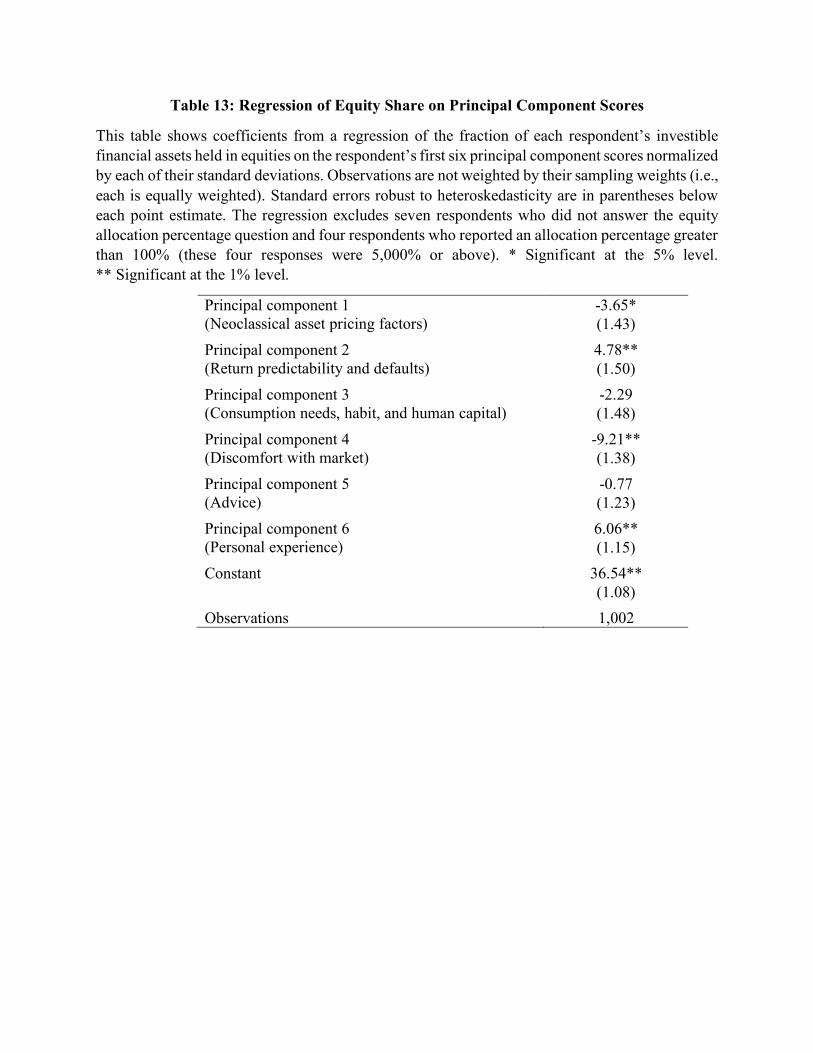
Table 13: Regression of Equity Share on Principal Component Scores
This table shows coefficients from a regression of the fraction of each respondent’s investible financial assets held in equities on the respondent’s first six principal component scores normalized by each of their standard deviations. Observations are not weighted by their sampling weights (i.e., each is equally weighted). Standard errors robust to heteroskedasticity are in parentheses below each point estimate. The regression excludes seven respondents who did not answer the equity allocation percentage question and four respondents who reported an allocation percentage greater than 100% (these four responses were 5,000% or above). * Significant at the 5% level. ** Significant at the 1% level.
Principal component 1 -3.65* (Neoclassical asset pricing factors) (1.43) Principal component 2 4.78** (Return predictability and defaults) (1.50) Principal component 3 -2.29 (Consumption needs, habit, and human capital) (1.48) Principal component 4 -9.21** (Discomfort with market) (1.38) Principal component 5 -0.77 (Advice) (1.23) Principal component 6 6.06** (Personal experience) (1.15) Constant 36.54** (1.08) Observations 1,002

Table 14: Actively Managed Mutual Funds
Panel A presents, among respondents who said that they had ever purchased shares in an actively managed stock mutual fund (N = 459), the percent who described the factor in the first column as very or extremely important in their decision to invest in an actively managed stock fund instead of a passive stock fund. Panel B presents, among all survey respondents (N = 1,013), the percent who agree or strongly agree with the statement in the first column. The percentages are calculated over either the entire sample for the panel or over the panel’s sample split by whether the respondent reported knowing what a mutual fund is, wealth (at least or below $75,000 in investible financial assets), and education (with or without a bachelor’s degree). Standard errors are in parentheses below the point estimates. All statistics are calculated using sampling weights.
Survey Text All Knew what mutual fund is
Wealth Education
Yes No High Low High Low Panel A: How important were the following factors in your decision(s) to invest in an actively managed stock fund instead of a passively managed stock fund?
Percent responding factor is very or extremely important Higher returns A belief that the actively managed stock
mutual fund would give me higher returns on average than a passively managed stock mutual fund
51.1% (4.0)
48.7% (4.2)
64.7% (10.3)
47.4% (4.6)
58.1% (7.2)
44.9% (5.0)
58.4% (6.0)
Adviser recommendation The recommendation of an investment adviser I hired
47.9% (4.0)
45.6% (4.2)
60.7% (11.9)
45.0% (4.5)
53.3% (7.5)
50.3% (5.0)
45.0% (6.2)
Hedging A belief that even though the actively managed stock mutual fund would have lower returns on average than a passively managed stock mutual fund, the actively managed fund would have higher returns than the passively managed fund when the economy does poorly (for example, during recessions or stock market crashes)
27.3% (3.5)
24.9% (3.6)
40.9% (11.3)
22.4% (3.4)
36.6% (7.4)
25.8% (4.8)
29.2% (5.3)
Passive not available A suitable passively managed stock mutual fund wasn’t available in my employer-sponsored retirement savings plan
18.2% (3.5)
16.4% (3.7)
28.1% (10.5)
14.5% (3.6)
25.0% (7.3)
15.1% (4.0)
21.8% (6.0)
Panel B: How much do you agree with the following statement? Percent responding agree or strongly agree Managerial skill When an actively managed stock mutual
fund has had significantly higher past returns than the overall stock market, this is strong evidence that its manager has good stock-picking skills
46.0% (2.9)
53.9% (3.3)
37.0% (4.7)
54.9% (3.5)
40.2% (4.0)
49.1% (3.8)
44.6% (3.8)
Decreasing returns to scale When an actively managed stock mutual fund gets more money to manage, it becomes harder for it to generate higher returns than the overall stock market
18.2% (2.2)
20.8% (2.7)
15.2% (3.8)
23.9% (3.2)
14.4% (3.0)
17.8% (2.6)
18.4% (3.1)

Table 15: Cross-Section of Stock Returns
This table presents the distribution of responses to questions about the expected returns and risks of value stocks versus growth stocks, and high-momentum stocks versus low-momentum stocks. The high wealth subsample is those with at least $75,000 of investible assets. Standard errors are in parentheses below the point estimates. All statistics are calculated using sampling weights.
Panel A: Expected returns
Compared to a growth stock, I expect a value stock to normally have… over the next year, on average
Compared to a stock whose price fell a lot over the past year, I expect a stock whose price rose a lot over the past year to normally have… over the next year on average
All High wealth All High wealth Higher returns 24.7%
(2.3) 25.0% (2.8)
24.3% (2.9)
27.5% (3.3)
About the same 20.3% (2.0)
29.7% (3.2)
32.1% (2.7)
31.9% (3.3)
Lower returns 28.1% (3.2)
24.0% (3.3)
14.2% (2.0)
19.0% (3.0)
No opinion 25.5% (2.4)
18.4% (2.7)
28.0% (2.5)
18.7% (2.3)
No response 1.4% (0.6)
2.9% (1.4)
1.4% (0.6)
2.9% (1.4)
Panel B: Risk
Compared to a growth stock, I expect a value stock to normally be… over the next year, on average
Compared to a stock whose price fell a lot over the past year, I expect a stock whose price rose a lot over the past year to normally be… over the next year on average
All High wealth All High wealth Riskier 14.0%
(1.7) 16.1% (2.7)
24.7% (3.1)
24.2% (3.4)
Equally risky 15.8% (1.9)
14.9% (2.4)
33.6% (2.5)
43.7% (3.6)
Less risky 43.9% (3.0)
51.2% (3.6)
14.3% (2.0)
12.6% (1.8)
No opinion 25.0% (2.4)
15.0% (2.1)
26.1% (2.5)
16.6% (2.2)
No response 1.4% (0.6)
2.9% (1.4)
1.4% (0.6)
2.9% (1.4)
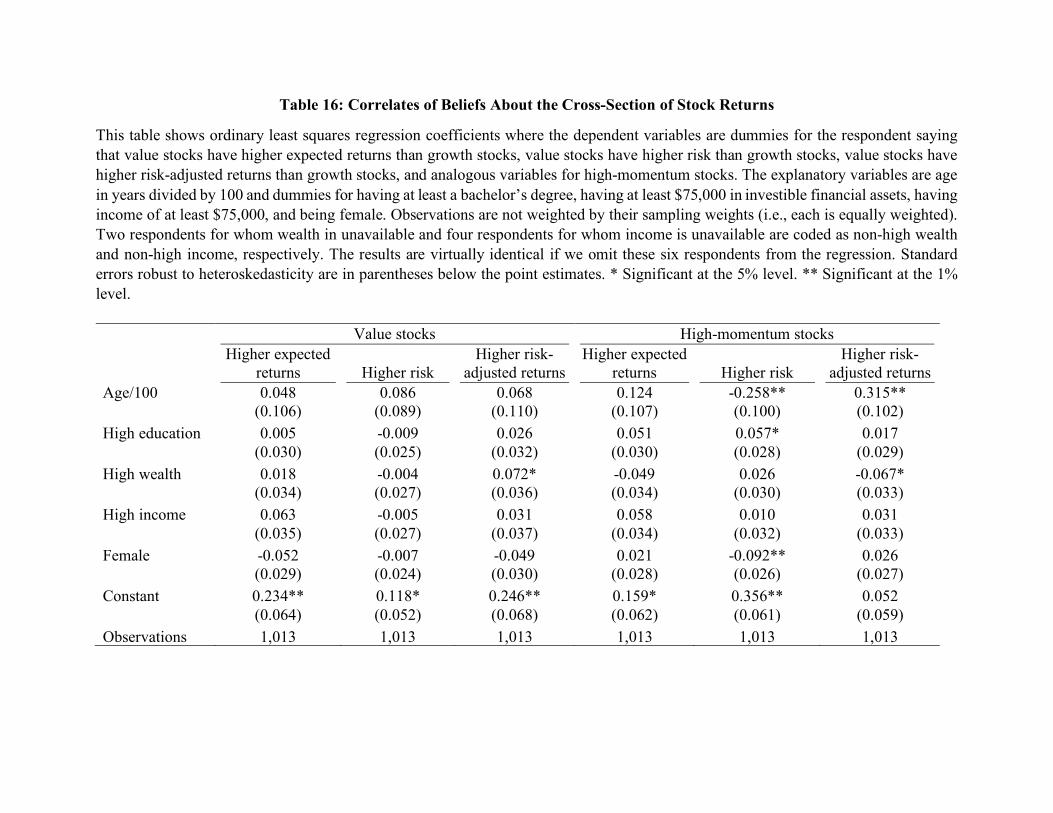
Table 16: Correlates of Beliefs About the Cross-Section of Stock Returns
This table shows ordinary least squares regression coefficients where the dependent variables are dummies for the respondent saying that value stocks have higher expected returns than growth stocks, value stocks have higher risk than growth stocks, value stocks have higher risk-adjusted returns than growth stocks, and analogous variables for high-momentum stocks. The explanatory variables are age in years divided by 100 and dummies for having at least a bachelor’s degree, having at least $75,000 in investible financial assets, having income of at least $75,000, and being female. Observations are not weighted by their sampling weights (i.e., each is equally weighted). Two respondents for whom wealth in unavailable and four respondents for whom income is unavailable are coded as non-high wealth and non-high income, respectively. The results are virtually identical if we omit these six respondents from the regression. Standard errors robust to heteroskedasticity are in parentheses below the point estimates. * Significant at the 5% level. ** Significant at the 1% level. Value stocks High-momentum stocks Higher expected
returns Higher risk Higher risk-
adjusted returns Higher expected
returns Higher risk Higher risk-
adjusted returns Age/100 0.048 0.086 0.068 0.124 -0.258** 0.315** (0.106) (0.089) (0.110) (0.107) (0.100) (0.102) High education 0.005 -0.009 0.026 0.051 0.057* 0.017
(0.030) (0.025) (0.032) (0.030) (0.028) (0.029) High wealth 0.018 -0.004 0.072* -0.049 0.026 -0.067*
(0.034) (0.027) (0.036) (0.034) (0.030) (0.033) High income 0.063 -0.005 0.031 0.058 0.010 0.031
(0.035) (0.027) (0.037) (0.034) (0.032) (0.033) Female -0.052 -0.007 -0.049 0.021 -0.092** 0.026 (0.029) (0.024) (0.030) (0.028) (0.026) (0.027) Constant 0.234** 0.118* 0.246** 0.159* 0.356** 0.052 (0.064) (0.052) (0.068) (0.062) (0.061) (0.059) Observations 1,013 1,013 1,013 1,013 1,013 1,013

Appendix Table 1: Why Did You Not Get Around to Investing in Stocks?
This table presents, among respondents who said that “I intended to invest in stocks but never got around to it” is a very or extremely important factor in their not holding stocks, the percent who described the factor in the first column as very or extremely important in causing them to not get around to investing in stocks. The percentages are calculated over either the entire subsample (N = 79) or over the subsample split by stock market participation, wealth (at least or below $75,000 in investible financial assets), and education (with or without a bachelor’s degree). Standard errors are in parentheses below the point estimates. All statistics are calculated using sampling weights.
Survey text All Wealth Education
High Low High Low Less money available now
I have less money available now than when I originally planned on investing in stocks
42.0% (13.4)
62.1% (21.0)
40.6% (13.8)
61.3% (13.4)
36.9% (14.8)
Too costly I discovered that it takes more time, money, and/or effort to invest in stocks than I expected
36.5% (12.0)
33.9% (22.6)
36.7% (12.8)
63.6% (12.8)
29.4% (12.4)
Procrastinated I procrastinated for no good reason 18.3% (7.0)
80.3% (14.8)
14.1% (6.1)
12.1% (6.8)
19.9% (9.1)
Too busy I was too busy 17.9% (7.0)
32.6% (21.7)
16.9% (7.1)
38.7% (14.2)
12.4% (6.2)
Not important enough
I decided it wasn’t important enough to think about it 12.6% (5.8)
21.6% (20.4)
12.0% (6.0)
29.1% (15.2)
8.2% (4.7)


