
American Psychological Association
What Can I Do With a Degree in Psychology?
What Can I Do With a Degree in Psychology?
Chair: Philip R. Magaletta, PhD
Presenters: Tanya A. Mulvey, MAPPCatherine L. Grus, PhD
August 14, 2010
© 2010 APA Center for Workforce Studies

American Psychological Association
CWS Mission Statement
The APA Center for Workforce The APA Center for Workforce Studies collects, analyzes, and Studies collects, analyzes, and
disseminates information relevant disseminates information relevant to psychology's workforce and to psychology's workforce and
education system.education system.

American Psychological Association
For Further Information…
www.apa.org/workforce/presentationsDownload a PDF of this presentation.

American Psychological Association
Overview• Education
• Employment
• Salaries
• Job Profiles
• Skills for the Workforce
• Challenges & Opportunities (Catherine Grus)

American Psychological Association
Education• Why study psychology?
• How many degrees are awarded each year?
• What are the most common subfields?
• How do subfields differ by gender?
• How much debt do students incur?

Top 5 Reasons Undergraduate Students Chose Psychology
• Help others, be of service• Interesting subject matter• Better understand myself and others• Career and/or salary potential• Conduct research
Source: 2008 APA Student Affiliate Survey. Compiled by the APA Center for Workforce Studies, July 2010.

5,296
21,431
92,587
0 20 40 60 80 100
BA/BS
MA/MS
Doctorate
Thousands
Number of Psychology Degrees Conferred by Level of Degree: 2008
Source: US Department of Education, National Center for Education Statistics. Integrated Postsecondary Data System (IPEDS), “Completion” Survey. Compiled by the APA Center for Workforce Studies. January 2010.
Note. Doctorate degree includes PsyDs.

Number of PhDs and PsyDs Awarded in Psychology
0
500
1,000
1,500
2,000
2,500
3,000
3,500
4,000
1988 1991 1994 1998 2000 2004 2006 2008
PhD PsyD
Source: Data are from APA’s Graduate Study in Psychology. Compiled by the APA Center for Workforce Studies, April, 2009Note. Data on PsyDs represent an undercount as several departments did not report number of PsyDs awarded.

Psychology PhDs Awarded by Fine Field: 2008
0
5
10
15
20
25
30
35
Clinical Counseling Personality/Social
I/O General Dev & Child Cognitive &Psycho-
linguistics
Human Dev& Family
Other
Fine Field
Perc
ent
Source: NSF/NIH/USED/NEH/USDA/NASA, Survey of Earned Doctorates 2008. Compiled by APA Center for Workforce Studies, June 2010.

Psychology PhDs by Fine Field and Gender: 2008
0 20 40 60 80 100Percent
Developmental & Child
Human Dev. & Family
Clinical
Counseling
Social/Personality
Other
I/O
General
Cognitive
Women Men
Source: NSF/NIH/USED/NEH/USDA/NASA, Survey of Earned Doctorates 2008. Compiled by APA Center for Workforce Studies, June 2010.Note: Data for the category “Other” are from 2007 as 2008 data were not available.

Level of Debt by Type of Degree for Recent Doctorates: 2007
0
10
20
30
<10K 10-20K 20-40K 40-60K 60-80K 80-100K 100-120K
>120K
Amount of Debt
Perc
ent
PhD (N=512) PsyD (N=230)
Source: 2007 Doctorate Employment Survey. Compiled by APA Center for Workforce Studies, June 2009.

American Psychological Association
Employment• Where do psychology degree recipients work?
• What work activities do they do?

Work Settings for PsychologyDegree Recipients: 2006
0 10 20 30 40 50
Other Educational Institutions
Federal Government
Self-Employed
Universities & 4-Year Colleges
Not-For-Profit Organizations
State or Local Government
For Profit Companies
Percent
BA/BS MA/MS PhDSource: National Science Foundation/Division of Science Resources Statistics, Various Surveys (2006). Compiled by the APA Center for Workforce Studies, January 2010. Notes. Psychologists earning PsyDs are not included here but are most often located in practice settings (self-employed and organized health care settings). The use of NSF data does not imply NSF endorsement of the research, research methods, or conclusions contained in this report.
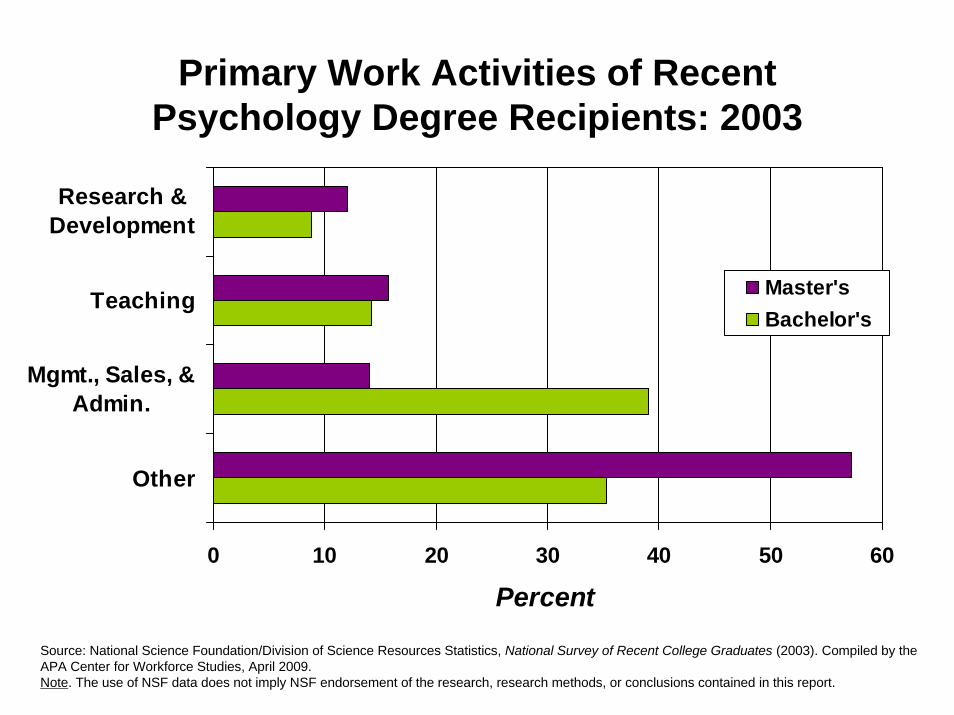
Primary Work Activities of Recent Psychology Degree Recipients: 2003
0 10 20 30 40 50 60
Other
Mgmt., Sales, &Admin.
Teaching
Research &Development
Percent
Master'sBachelor's
Source: National Science Foundation/Division of Science Resources Statistics, National Survey of Recent College Graduates (2003). Compiled by the APA Center for Workforce Studies, April 2009.Note. The use of NSF data does not imply NSF endorsement of the research, research methods, or conclusions contained in this report.
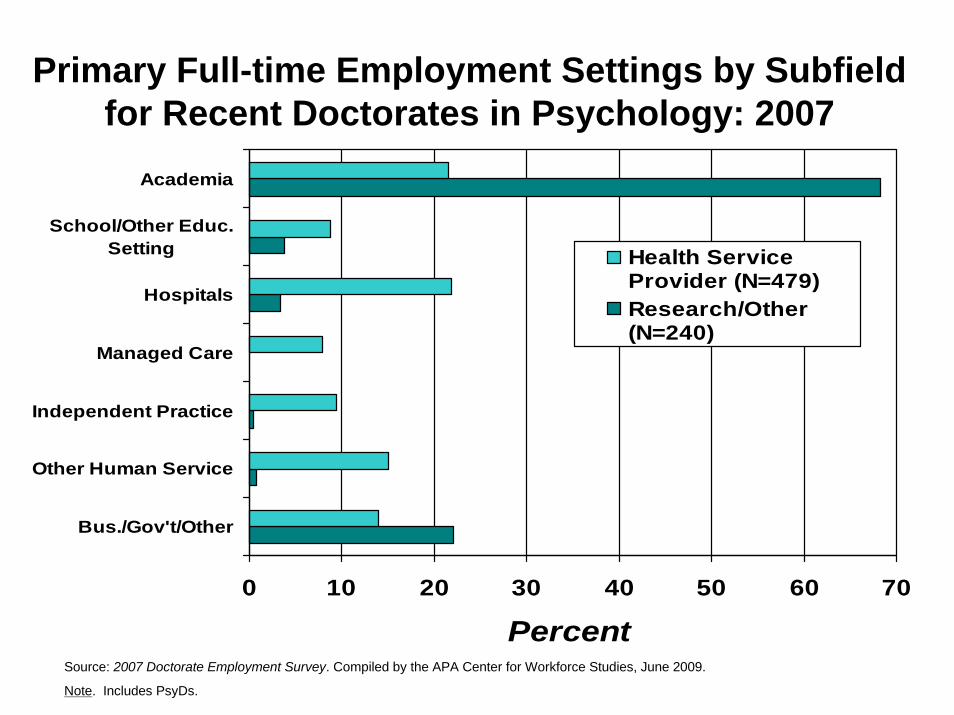
Primary Full-time Employment Settings by Subfield for Recent Doctorates in Psychology: 2007
0 10 20 30 40 50 60 70
Bus./Gov't/Other
Other Human Service
Independent Practice
Managed Care
Hospitals
School/Other Educ.Setting
Academia
Percent
Health ServiceProvider (N=479)Research/Other (N=240)
Source: 2007 Doctorate Employment Survey. Compiled by the APA Center for Workforce Studies, June 2009.
Note. Includes PsyDs.

Primary Employment Settings for Recent Doctorate Recipients in Psychology by Degree Type: 2007
Source: 2007 Doctorate Employment Survey. Compiled by the APA Center for Workforce Studies, June 2009.
Note. Table includes survey respondents with full- and part-time employment. Statistics are not included for settings where the total N is less than 20.
0 5 10 15 20 25 30 35
Business/Govt. & Other
Managed Care
Other Human Service
Hospital
Indep. Practice
Schools & Other Educ Settings
Other Acad. Settings
Medical School
Four-year Colleges
Univ. Settings
Percent
PhD
PsyD

Primary and Secondary Work Activities of Psychology PhDs: 2006
Source: NSF/NIH/USED/NEH/USDA/NASA, 2006 Survey of Doctorate Recipients. Compiled by the APA Center for Workforce Studies, April 2009.Note. The use of NSF data does not imply NSF endorsement of the research, research methods, or conclusions contained in this report.
0 10 20 30 40
Other
ProfessionalServices
Mgmt. & Admin.
Teaching
Research &Development
Percent
Primary
Secondary

American Psychological Association
Salaries in Psychology• How do salaries differ by degree level and
work position?
• What are average starting salaries?

Median Annual Full-time Salaries in Psychology By Degree Type: 2006
$70
$40
$30
$0$10$20$30$40$50$60$70$80
BA/BS MA/MS PhDDegree Type
Thou
sand
s
Source: Data derived from National Science Foundation/Division of Science Resources Statistics, 2006 National Survey of Recent College Graduates, and 2006 Survey of Doctorate Recipients. Compiled by the APA Center for Workforce Studies, April 2009.
Note. The use of NSF data does not imply NSF endorsement of the research, research methods, or conclusions contained in this report.

$0 $10 $20 $30 $40 $50 $60 $70 $80
Other type of position (N=18)
Direct human svcs (N=113)
Faculty position* (N=26)
Research (N=11)
Educational admin (N=8)
Admin of research (N=9)
Admin of human svcs (N=113)
Other admin position (N=18)
Applied psych (N=84)
All settings (N=308)
Median Annual Full-time Salaries by Employment Position for Master’s-Level APA Members in Psychology: 2009
Thousands
Source: 2009 APA Salary Survey. Compiled by the APA Center for Workforce Studies, June 2010.
*Faculty position is for all higher education, including undergraduate and community college. Salary is reported for a 9-10-month academic year. To calculate 11-12 month equivalent, multiply by 11/9.

Starting Salaries for Full-time Employment Positions of Recent Doctorates in Psychology: 2007
$0 $20 $40 $60 $80 $100
Educational Admin (N=10)
Direct human svcs (N=265)
Admin of human svcs (N=20)
Research positions (N=50)
Applied (N=64)
Lecturer/Instructor* (N=13)
Adjunct/Visiting faculty* (N=12)
Asst professor* (N=142)
Source: 2007 Doctorate Employment Survey. Compiled by the APA Center for Workforce Studies, June 2009.
Note. Graph includes first quartile, median, and third quartile values. Includes PsyDs.
* Faculty salaries are for all higher education, including undergraduate and community college. Salaries are reported for a 9-10-month academic year. To calculate 11-12 month equivalent, multiply by 11/9.
Thousands

American Psychological Association
Job Profiles• Academia
• Health Service Provider

Full-Time Faculty: U.S. Graduate Departments of Psychology, 2009-2010
Demographics
1%
1%
4%
5%
5%
84%
45%
55%
N.S.
Amer Ind/Multi
Hispanic
Black
Asian
White
-
Women
MenSettings
University/4-year/2-yearPrivate/Public
Traditional/Professional
Work ActivitiesTeachingResearchAdvising
AdministrationWriting
Source: 2009-2010 APA Faculty Salaries in Graduate Departments of Psychology Survey. Compiled by the APA Center for Workforce Studies, June 2010. Note. Includes PsyDs.
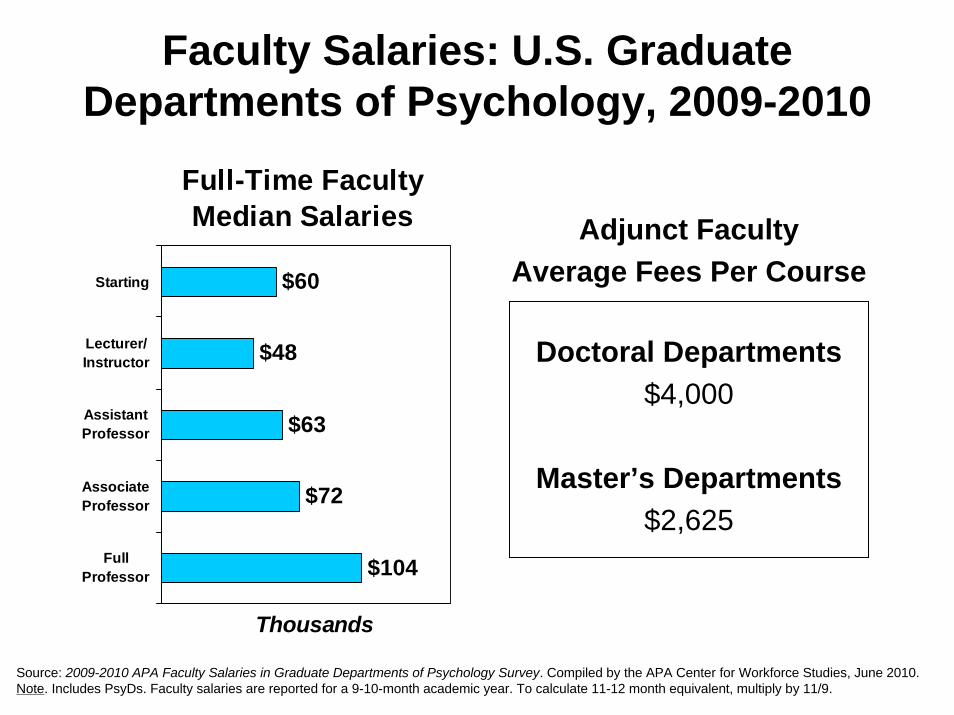
Faculty Salaries: U.S. Graduate Departments of Psychology, 2009-2010
Full-Time FacultyMedian Salaries
$104
$72
$63
$48
$60
FullProfessor
AssociateProfessor
AssistantProfessor
Lecturer/Instructor
Starting
Thousands
Adjunct FacultyAverage Fees Per Course
Doctoral Departments$4,000
Master’s Departments$2,625
Source: 2009-2010 APA Faculty Salaries in Graduate Departments of Psychology Survey. Compiled by the APA Center for Workforce Studies, June 2010. Note. Includes PsyDs. Faculty salaries are reported for a 9-10-month academic year. To calculate 11-12 month equivalent, multiply by 11/9.
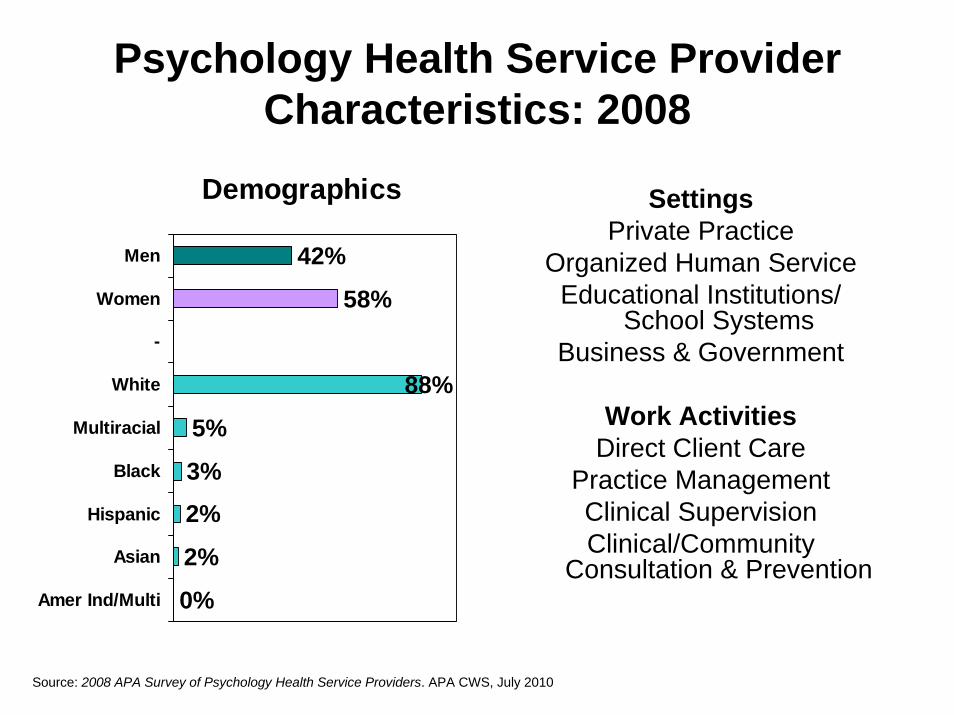
Psychology Health Service Provider Characteristics: 2008
Demographics
0%
2%
2%
3%
5%
88%
58%
42%
Amer Ind/Multi
Asian
Hispanic
Black
Multiracial
White
-
Women
Men
SettingsPrivate Practice
Organized Human ServiceEducational Institutions/
School SystemsBusiness & Government
Work ActivitiesDirect Client Care
Practice ManagementClinical SupervisionClinical/Community
Consultation & Prevention
Source: 2008 APA Survey of Psychology Health Service Providers. APA CWS, July 2010
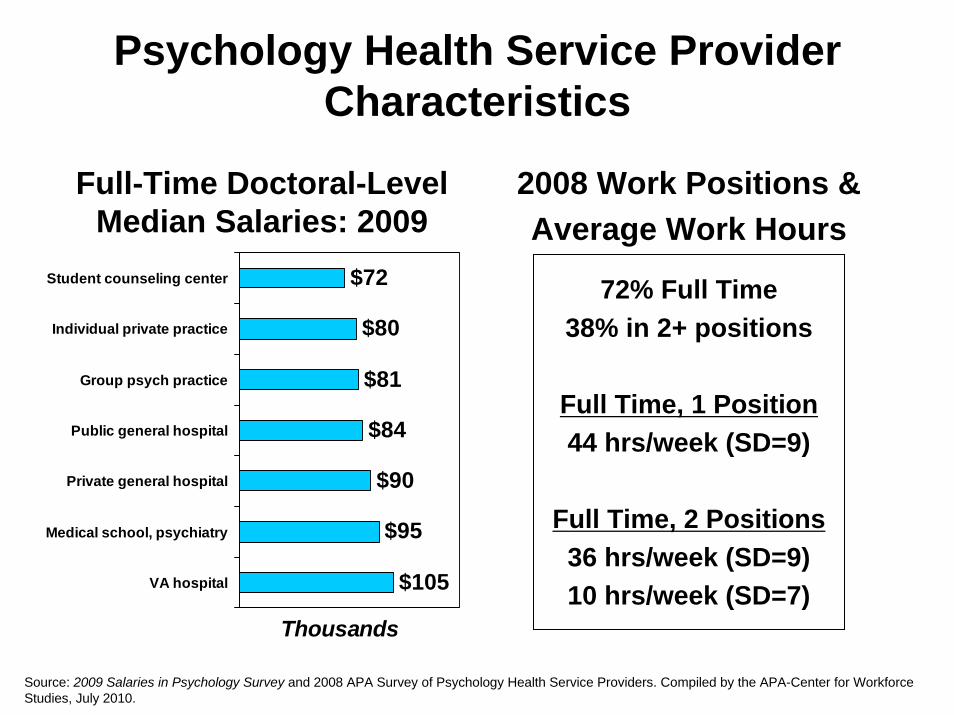
Psychology Health Service Provider Characteristics
$105
$95
$90
$84
$81
$80
$72
VA hospital
Medical school, psychiatry
Private general hospital
Public general hospital
Group psych practice
Individual private practice
Student counseling center
Thousands
2008 Work Positions &Average Work Hours
72% Full Time38% in 2+ positions
Full Time, 1 Position44 hrs/week (SD=9)
Full Time, 2 Positions36 hrs/week (SD=9) 10 hrs/week (SD=7)
Source: 2009 Salaries in Psychology Survey and 2008 APA Survey of Psychology Health Service Providers. Compiled by the APA-Center for Workforce Studies, July 2010.
Full-Time Doctoral-Level Median Salaries: 2009

Areas of Need/Opportunities for Those in the Field: Research and Practice
Underserved populationsIndividuals in correctional facilitiesChronically mentally Ill (Axis I diagnosis)Veterans/military/families of veteransYouth/childrenElderly/geriatric populationRetiring/Aging “baby boomer” generations psychology
Opportunities for prevention vs. interventionHealth Care Reform-medical “teams”Holistic care teams
American Psychological Association
Work Skills for Recent Doctorates
• What are important skills in general?
• What are particular important skills for health service providers?

Now That I Have a Doctorate in Psychology,What Skills are Most Useful?
What New Doctorates Have to Say.All Subfields• Collaborate with colleagues from other disciplines/fields• Communicate comprehensibly to non-psychologists via
workshops/ public speaking/ writing• Previous work experience (before & during graduate education),
internships for I/O, practica• Administrative skills, budgeting, management, program planning• Quantitative skills - applied statistics, methods, field research• Networking• Teaching skills• Bilingual - able to work in more than one language• Technology - what it is, how to use it to do your work• Communicate how psychology applies/self-promotion• Proactive/forward thinking

Now That I Have a Doctorate in Psychology,What Skills are Most Useful?
What New Doctorates Have to Say.
Health Service Provider Subfield• Business & Management: e.g., starting a practice and keeping it going• Marketing & Selling Oneself/proactive• Short-term/ brief therapy knowledge skills• Working/ communicating with MCOs, insurance companies: knowing
how to get on panels, time efficiency, insurance, documentation, taxes• Knowledge of health care delivery systems: A system-level
understanding of how it works and where it might be going• What careers are possible? A more realistic view of the profession and
the applications of psychology. What are emerging areas of practice?• Understanding of and knowledge about medical system/medical
outcomes. Communicating with Primary Care Providers• Practical experiences (MCOs and elsewhere)• Knowledge about integrated community service provisions/ cross-
disciplinary work/ multiple wraparound services/ how to work with multidisciplinary teams


