
Wet season (May-October) temperature (°C) trend over 1951-2010 period. Source: NASA GISS

Wet season (May-October) temperature (°C) trend over 1951-2010 period. Source: NASA GISS

City Wet Season (May-Oct.) Average Temperature
Wet Season (May-Oct.) Average Precipitation
Puebla 16.69°C 108 mm/month
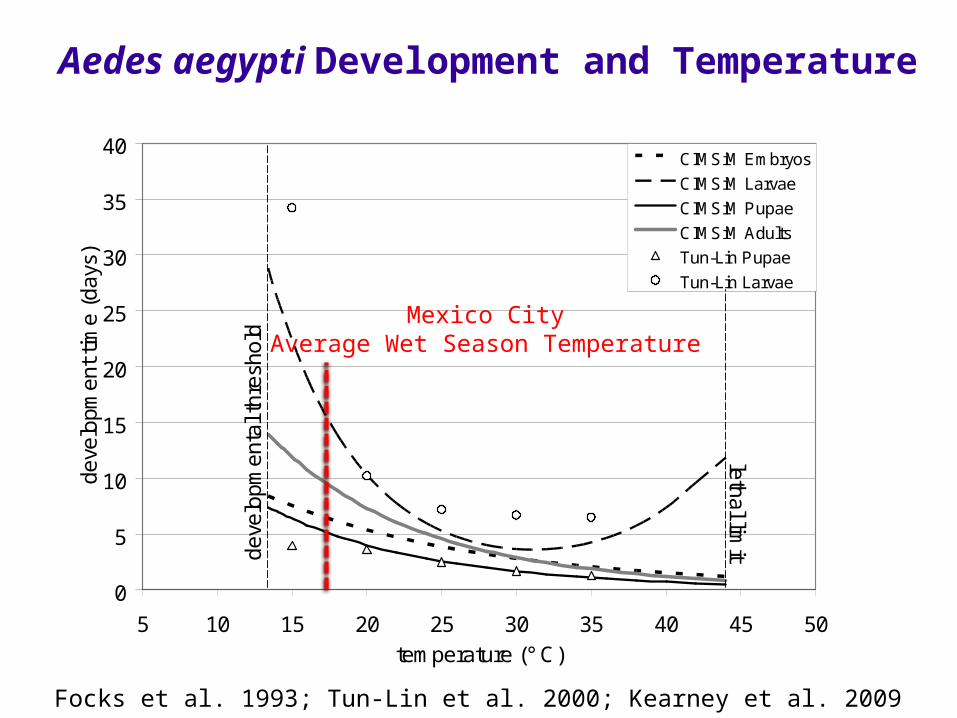
Mexico City 17.16°C 92 mm/month
0
5
10
15
20
25
30
35
40
5 10 15 20 25 30 35 40 45 50temperature (° C)
deve
lopm
ent
time
(day
s)
CIMSiM Embryos
CIMSiM Larvae
CIMSiM Pupae
CIMSiM Adults
Tun-Lin Pupae
Tun-Lin Larvae
deve
lopm
ent
al t
hres
hold
lethal limit
Aedes aegypti Development and Temperature
Focks et al. 1993; Tun-Lin et al. 2000; Kearney et al. 2009
Mexico CityAverage Wet Season Temperature

Precipitation trend for stations in and within 100 km of the state of Veracruz, have at least 59 years worth of records, 85% complete, and run through 2000, for 1977-2008. Source: Dr. Saúl Miranda Alonso, Centro de Estudios Climatológicos, Secretaría de Protección Civil, Gobierno del Estado de Veracruz, using data from Unidad del Servicio Meteorológico Nacional.
Veracruz

Stations with statistically significant summer (JJA) daily maximum temperature trends over 1970-2004 period. Positive trends orange, negative trends blue. Triangles indicate urban stations. Source: Pavia et al. 2009, Int. J. Climatol.

Ensemble average (from 17 different climate models in CMIP3 dataset) May difference in 2-m air temperature between A1B (2061-2090) minus 20th century (1961-1990). Source: Rauscher et al. 2008, Clim. Dyn.

Ensemble average (from 17 different climate models in CMIP3 dataset) summer (JJA) percent difference in precipitation between A1B (2061-2090) minus 20th century (1961-1990). Source: Rauscher et al. 2008, Clim. Dyn.

Number of models with A1B (2061-2090) minus 20C (1961-1990) ensemble average precipitation differences greater than (less than) 0.1 (-0.1) mm day-1 in green (brown). Source: Rauscher et al. 2008, Clim. Dyn.


