Wealth Management Outlook 4th Quarter 2017

What Lurks Around the Corner?
2
Executive Summary
Review of the year-to-date performance
What are the drivers of the stock and bond markets?
What might be in store?
What should investors do today?
3
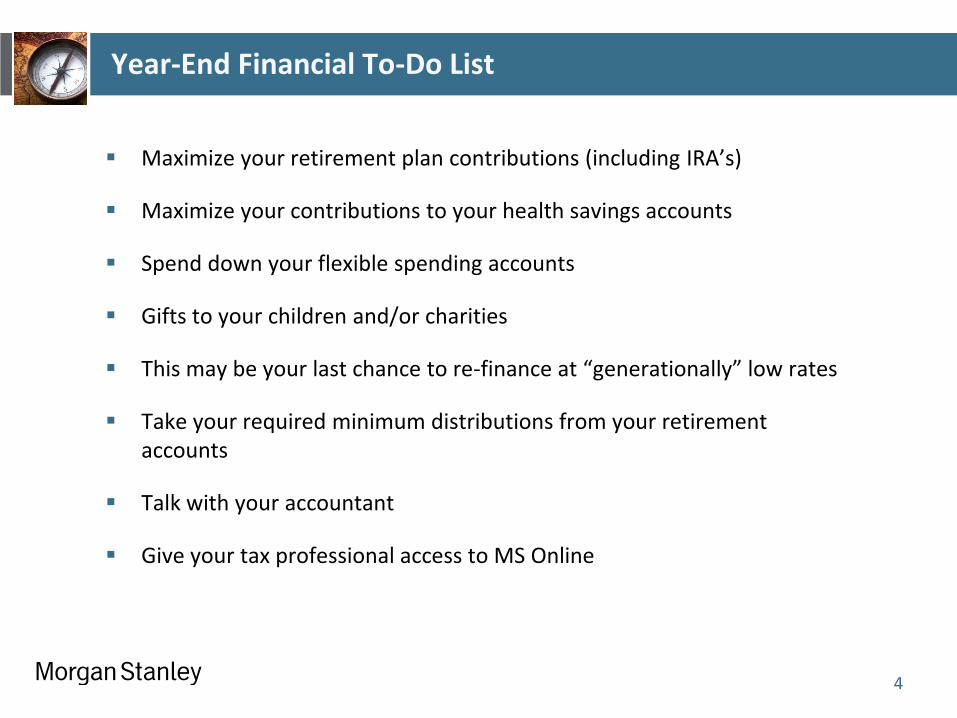
Year-End Financial To-Do List
4
Maximize your retirement plan contributions (including IRA’s)
Maximize your contributions to your health savings accounts
Spend down your flexible spending accounts
Gifts to your children and/or charities
This may be your last chance to re-finance at “generationally” low rates
Take your required minimum distributions from your retirement accounts
Talk with your accountant
Give your tax professional access to MS Online
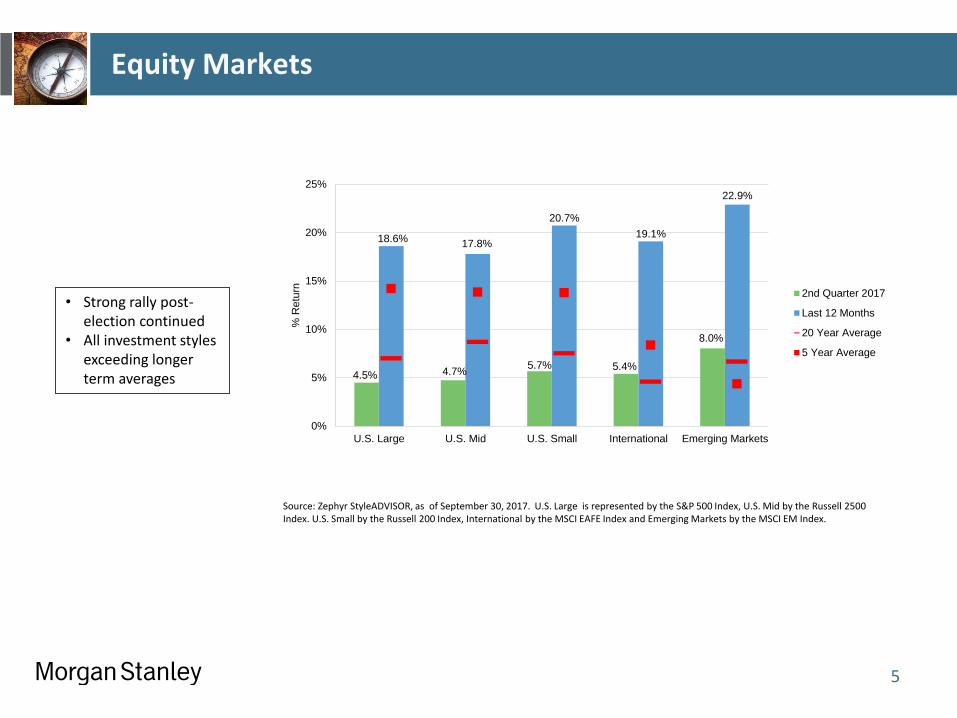
Equity Markets
Source: Zephyr StyleADVISOR, as of September 30, 2017. U.S. Large is represented by the S&P 500 Index, U.S. Mid by the Russell 2500 Index. U.S. Small by the Russell 200 Index, International by the MSCI EAFE Index and Emerging Markets by the MSCI EM Index.
• Strong rally post-election continued
• All investment styles exceeding longer term averages
5
4.5% 4.7% 5.7% 5.4%
8.0%
18.6% 17.8%
20.7%
19.1%
22.9%
0%
5%
10%
15%
20%
25%
U.S. Large U.S. Mid U.S. Small International Emerging Markets
% R
etu
rn
2nd Quarter 2017
Last 12 Months
20 Year Average
5 Year Average
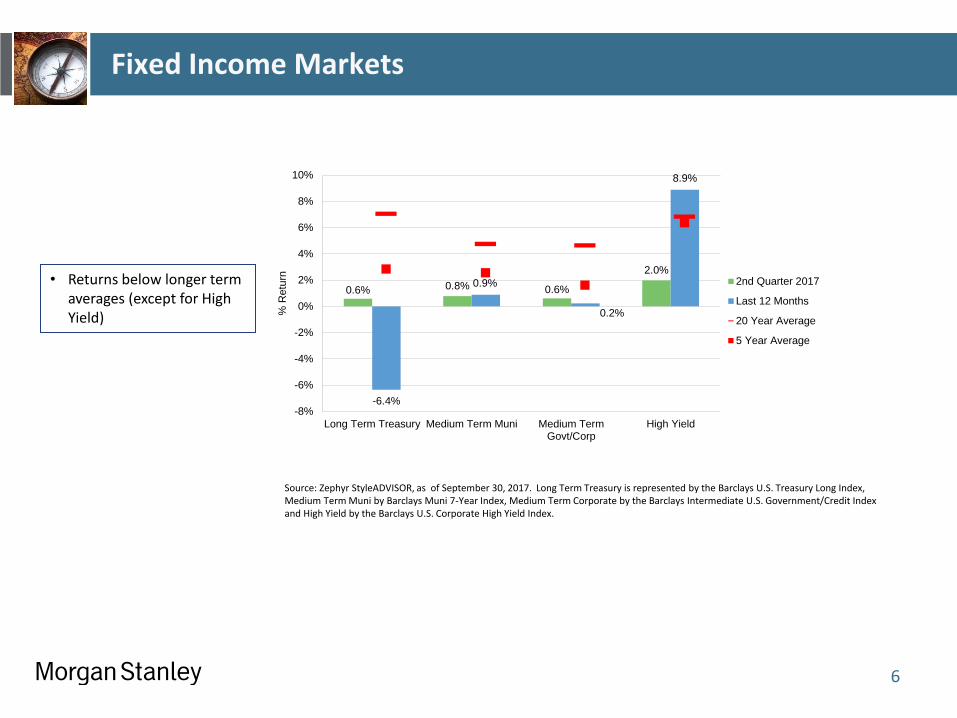
Fixed Income Markets
Source: Zephyr StyleADVISOR, as of September 30, 2017. Long Term Treasury is represented by the Barclays U.S. Treasury Long Index, Medium Term Muni by Barclays Muni 7-Year Index, Medium Term Corporate by the Barclays Intermediate U.S. Government/Credit Index and High Yield by the Barclays U.S. Corporate High Yield Index.
• Returns below longer term averages (except for High Yield)
6
0.6% 0.8% 0.6%
2.0%
-6.4%
0.9%
0.2%
8.9%
-8%
-6%
-4%
-2%
0%
2%
4%
6%
8%
10%
Long Term Treasury Medium Term Muni Medium TermGovt/Corp
High Yield
% R
etu
rn
2nd Quarter 2017
Last 12 Months
20 Year Average
5 Year Average
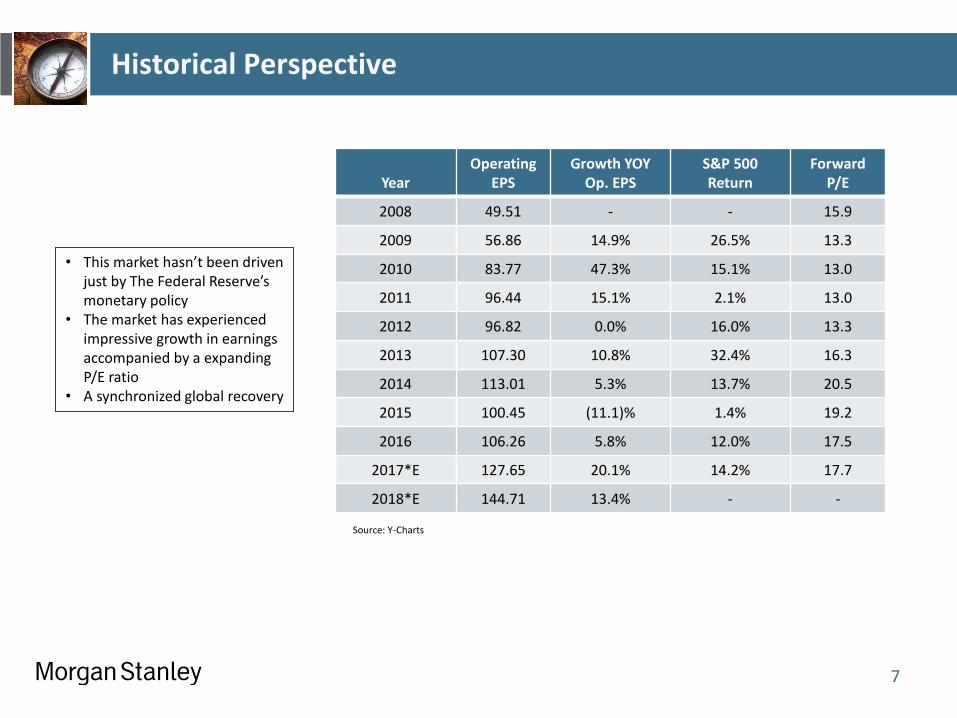
Historical Perspective
7
• This market hasn’t been driven just by The Federal Reserve’s monetary policy
• The market has experienced impressive growth in earnings accompanied by a expanding P/E ratio
• A synchronized global recovery
Source: Y-Charts
Year
Operating EPS
Growth YOY Op. EPS
S&P 500 Return
Forward P/E
2008 49.51 - - 15.9
2009 56.86 14.9% 26.5% 13.3
2010 83.77 47.3% 15.1% 13.0
2011 96.44 15.1% 2.1% 13.0
2012 96.82 0.0% 16.0% 13.3
2013 107.30 10.8% 32.4% 16.3
2014 113.01 5.3% 13.7% 20.5
2015 100.45 (11.1)% 1.4% 19.2
2016 106.26 5.8% 12.0% 17.5
2017*E 127.65 20.1% 14.2% 17.7
2018*E 144.71 13.4% - -
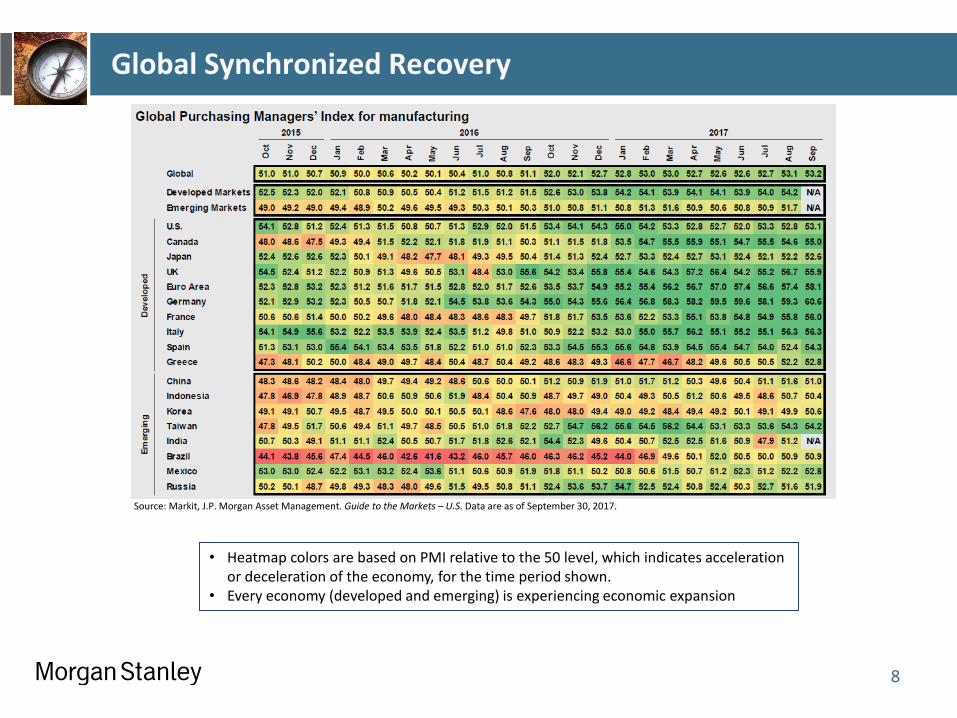
Global Synchronized Recovery
8
• Heatmap colors are based on PMI relative to the 50 level, which indicates acceleration or deceleration of the economy, for the time period shown.
• Every economy (developed and emerging) is experiencing economic expansion
Source: Markit, J.P. Morgan Asset Management. Guide to the Markets – U.S. Data are as of September 30, 2017.
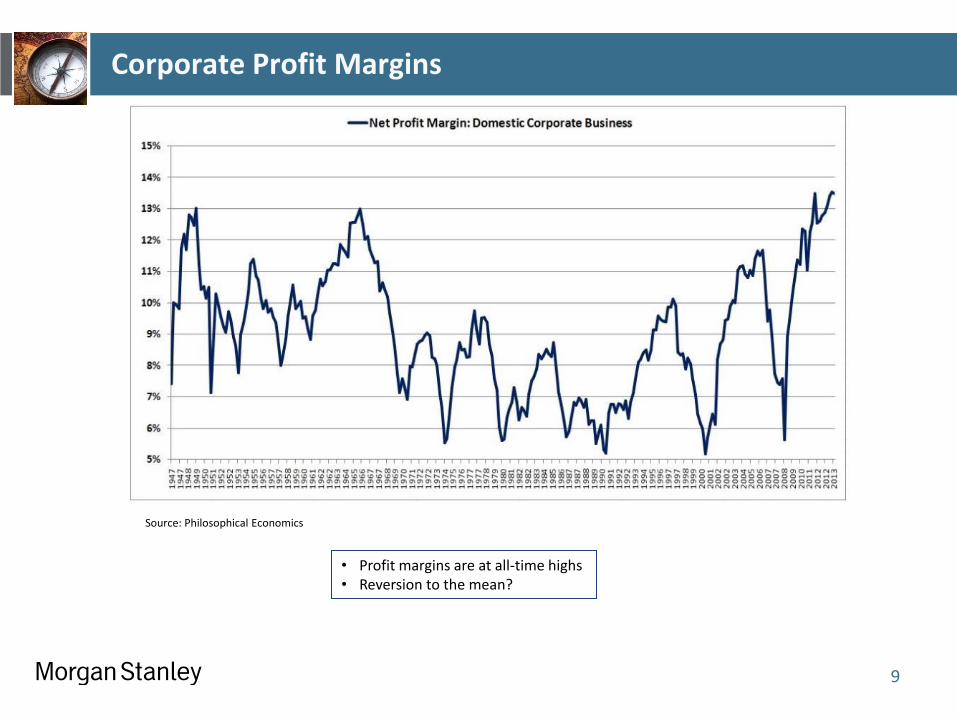
Corporate Profit Margins
9
• S&P 500 P/E (forward operating earnings) was 17.5x • 25-year average P/E is 15.9x
• Profit margins are at all-time highs • Reversion to the mean?
Source: Philosophical Economics
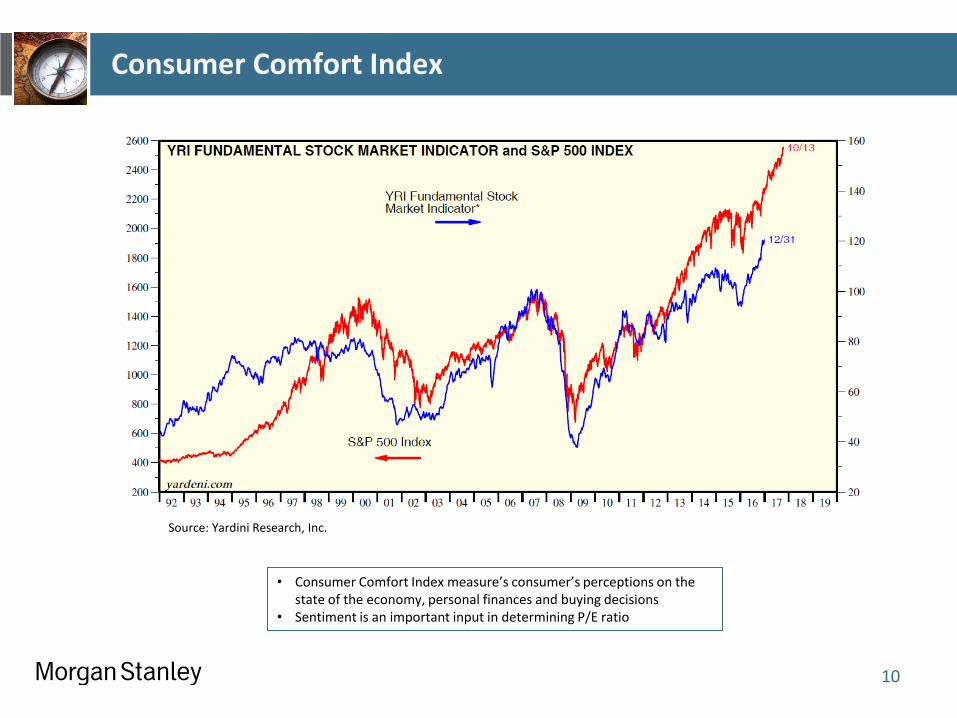
Consumer Comfort Index
10
• Consumer Comfort Index measure’s consumer’s perceptions on the state of the economy, personal finances and buying decisions
• Sentiment is an important input in determining P/E ratio
Source: Yardini Research, Inc.
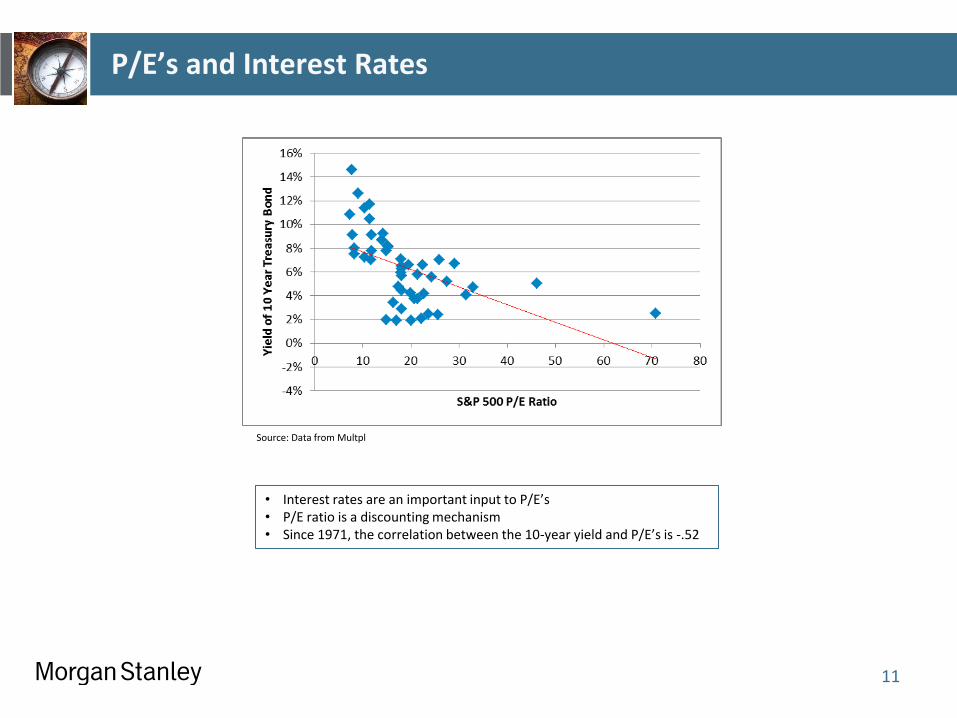
P/E’s and Interest Rates
11
Source: Data from Multpl
• Interest rates are an important input to P/E’s • P/E ratio is a discounting mechanism • Since 1971, the correlation between the 10-year yield and P/E’s is -.52
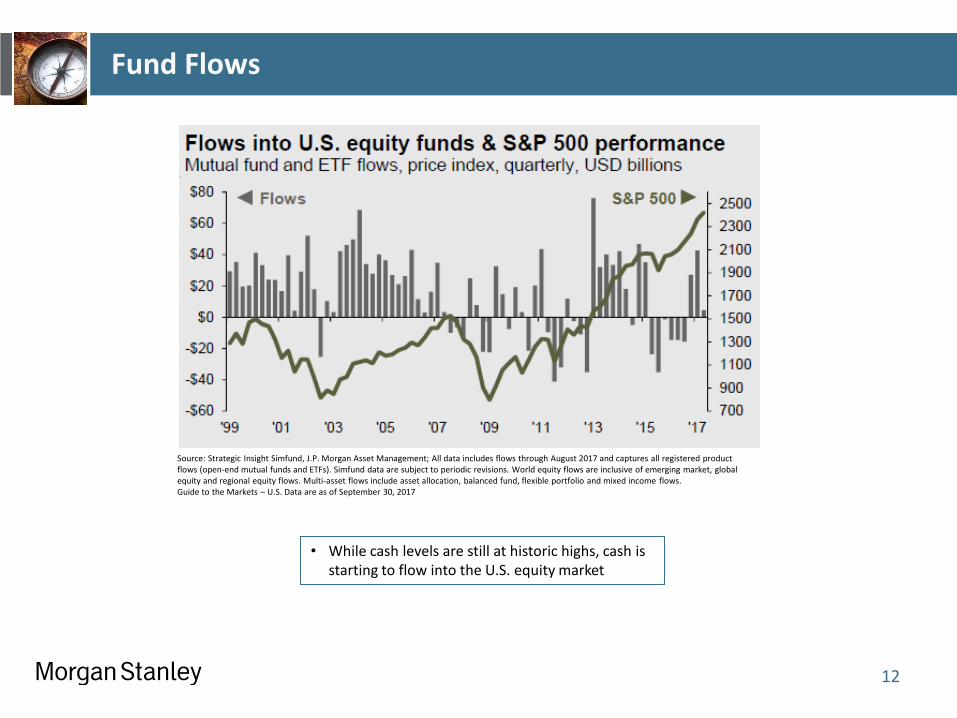
Fund Flows
12
• While cash levels are still at historic highs, cash is starting to flow into the U.S. equity market
Source: Strategic Insight Simfund, J.P. Morgan Asset Management; All data includes flows through August 2017 and captures all registered product flows (open-end mutual funds and ETFs). Simfund data are subject to periodic revisions. World equity flows are inclusive of emerging market, global equity and regional equity flows. Multi-asset flows include asset allocation, balanced fund, flexible portfolio and mixed income flows. Guide to the Markets – U.S. Data are as of September 30, 2017
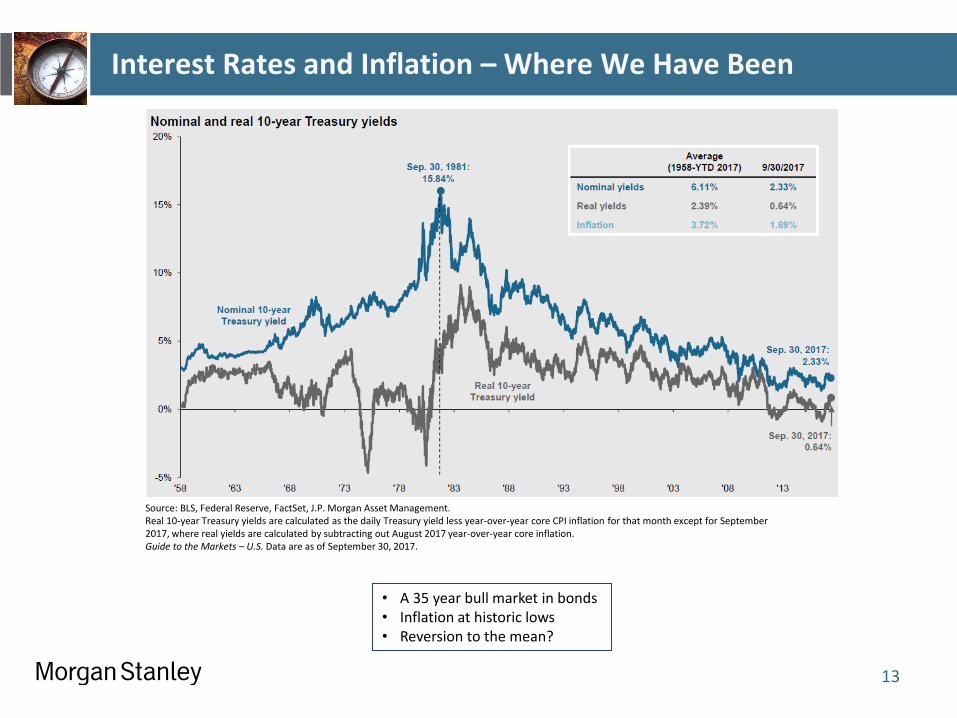
Interest Rates and Inflation – Where We Have Been
13
Source: BLS, Federal Reserve, FactSet, J.P. Morgan Asset Management. Real 10-year Treasury yields are calculated as the daily Treasury yield less year-over-year core CPI inflation for that month except for September 2017, where real yields are calculated by subtracting out August 2017 year-over-year core inflation. Guide to the Markets – U.S. Data are as of September 30, 2017.
• A 35 year bull market in bonds • Inflation at historic lows • Reversion to the mean?
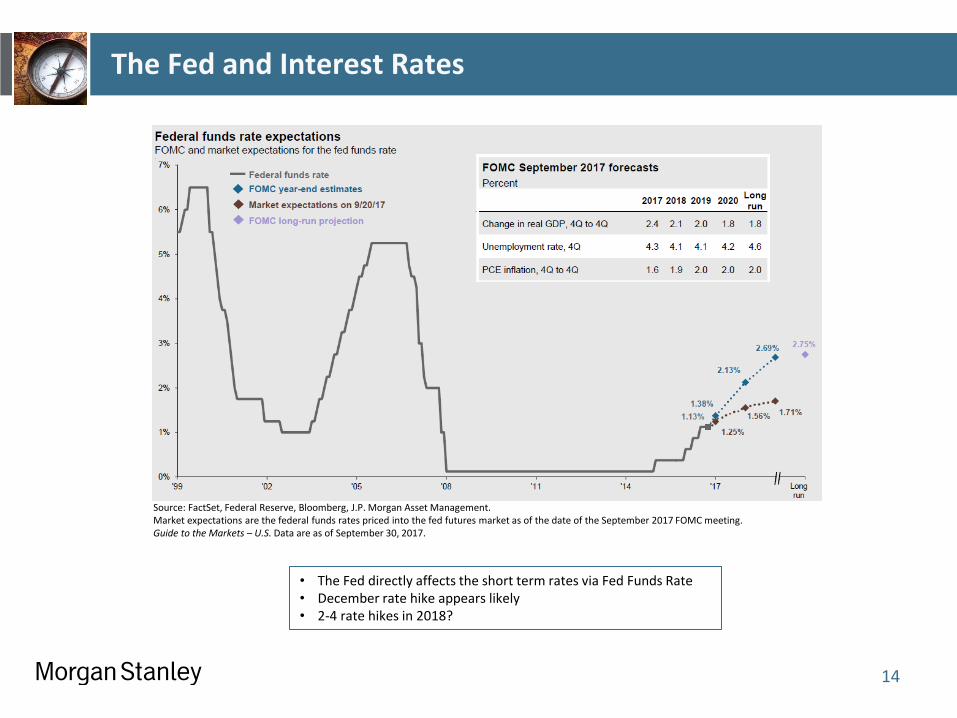
The Fed and Interest Rates
14
Source: FactSet, Federal Reserve, Bloomberg, J.P. Morgan Asset Management. Market expectations are the federal funds rates priced into the fed futures market as of the date of the September 2017 FOMC meeting. Guide to the Markets – U.S. Data are as of September 30, 2017.
• The Fed directly affects the short term rates via Fed Funds Rate • December rate hike appears likely • 2-4 rate hikes in 2018?
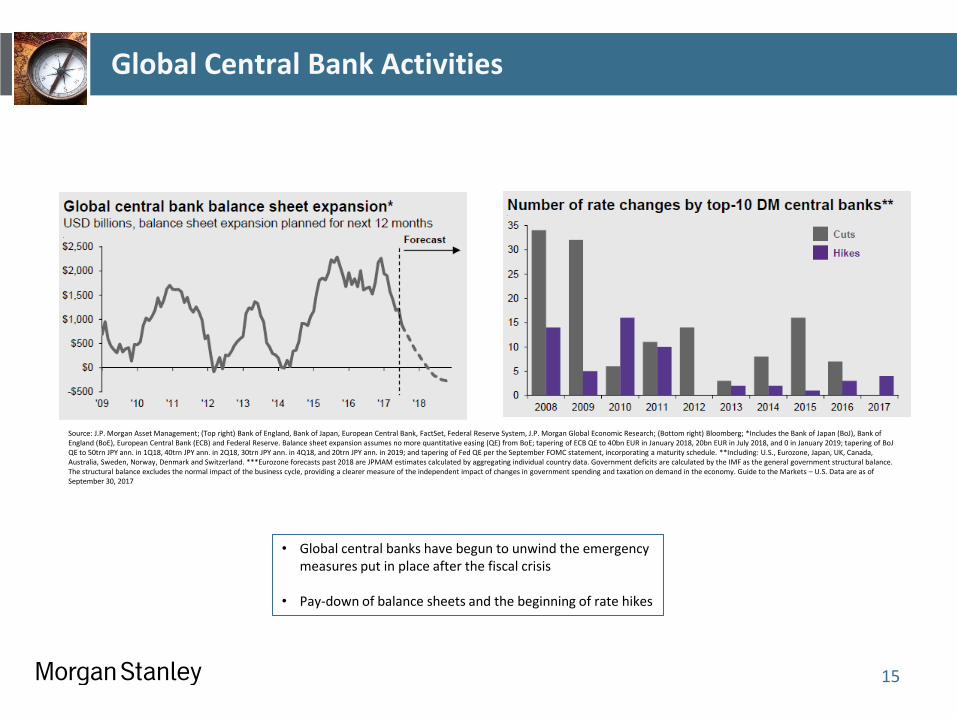
Global Central Bank Activities
15
• Global central banks have begun to unwind the emergency measures put in place after the fiscal crisis
• Pay-down of balance sheets and the beginning of rate hikes
Source: J.P. Morgan Asset Management; (Top right) Bank of England, Bank of Japan, European Central Bank, FactSet, Federal Reserve System, J.P. Morgan Global Economic Research; (Bottom right) Bloomberg; *Includes the Bank of Japan (BoJ), Bank of England (BoE), European Central Bank (ECB) and Federal Reserve. Balance sheet expansion assumes no more quantitative easing (QE) from BoE; tapering of ECB QE to 40bn EUR in January 2018, 20bn EUR in July 2018, and 0 in January 2019; tapering of BoJ QE to 50trn JPY ann. in 1Q18, 40trn JPY ann. in 2Q18, 30trn JPY ann. in 4Q18, and 20trn JPY ann. in 2019; and tapering of Fed QE per the September FOMC statement, incorporating a maturity schedule. **Including: U.S., Eurozone, Japan, UK, Canada, Australia, Sweden, Norway, Denmark and Switzerland. ***Eurozone forecasts past 2018 are JPMAM estimates calculated by aggregating individual country data. Government deficits are calculated by the IMF as the general government structural balance. The structural balance excludes the normal impact of the business cycle, providing a clearer measure of the independent impact of changes in government spending and taxation on demand in the economy. Guide to the Markets – U.S. Data are as of September 30, 2017
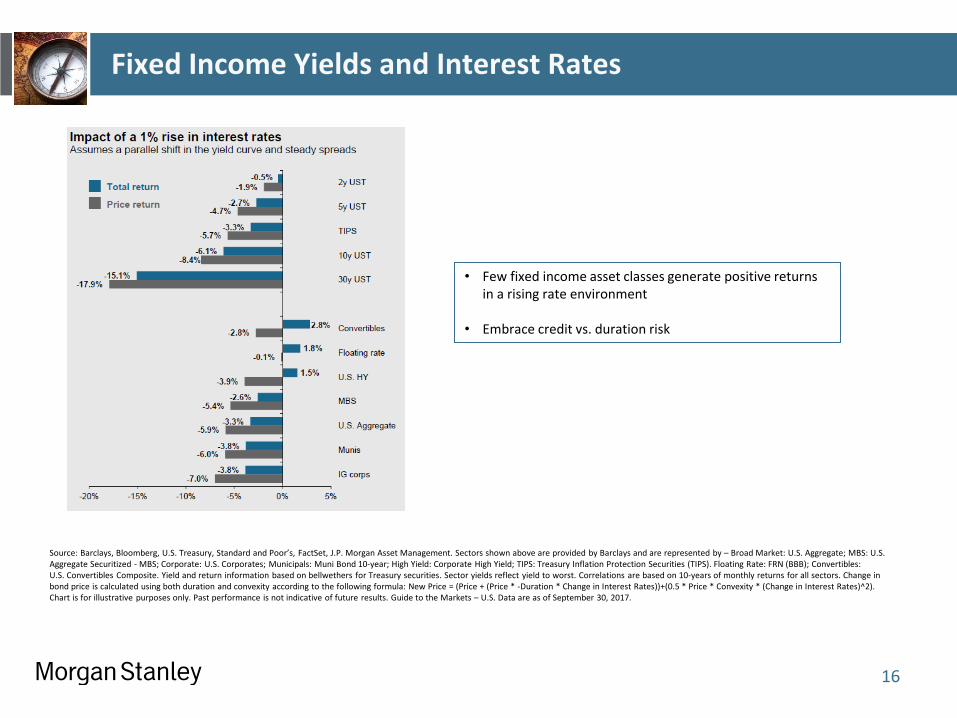
Fixed Income Yields and Interest Rates
16
• Few fixed income asset classes generate positive returns in a rising rate environment
• Embrace credit vs. duration risk
Source: Barclays, Bloomberg, U.S. Treasury, Standard and Poor’s, FactSet, J.P. Morgan Asset Management. Sectors shown above are provided by Barclays and are represented by – Broad Market: U.S. Aggregate; MBS: U.S. Aggregate Securitized - MBS; Corporate: U.S. Corporates; Municipals: Muni Bond 10-year; High Yield: Corporate High Yield; TIPS: Treasury Inflation Protection Securities (TIPS). Floating Rate: FRN (BBB); Convertibles: U.S. Convertibles Composite. Yield and return information based on bellwethers for Treasury securities. Sector yields reflect yield to worst. Correlations are based on 10-years of monthly returns for all sectors. Change in bond price is calculated using both duration and convexity according to the following formula: New Price = (Price + (Price * -Duration * Change in Interest Rates))+(0.5 * Price * Convexity * (Change in Interest Rates)^2). Chart is for illustrative purposes only. Past performance is not indicative of future results. Guide to the Markets – U.S. Data are as of September 30, 2017.
Conclusions
1. Know what you own
2. Validate and embrace your asset allocation
3. Understand the “typical” downside of your chosen asset allocation
4. Examine your debt/margin position
5. Stay invested
17
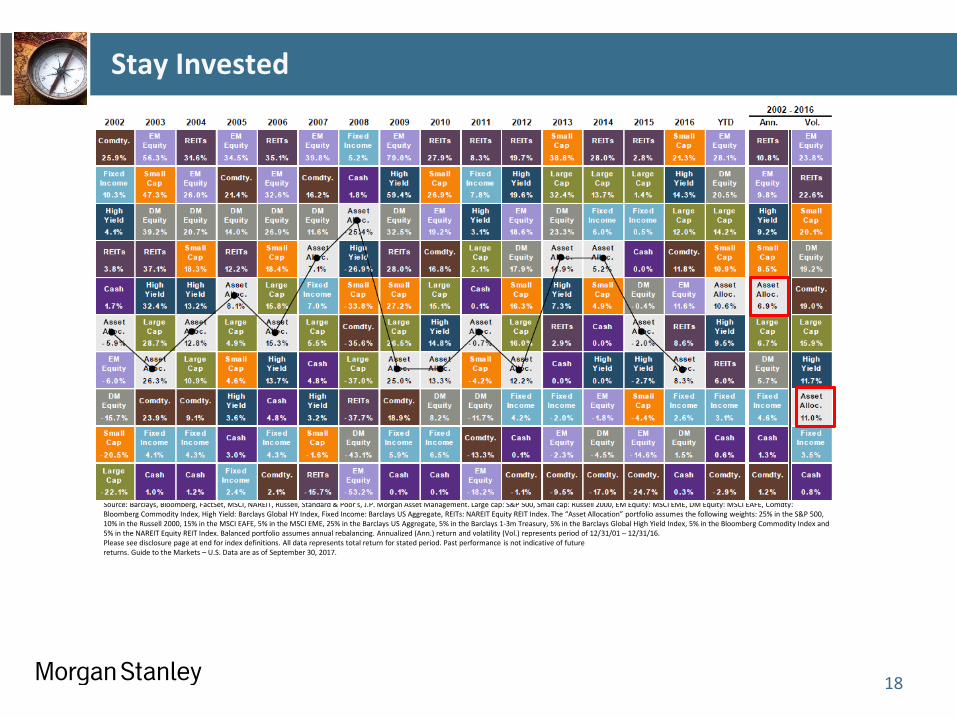
Stay Invested
18
Source: Barclays, Bloomberg, FactSet, MSCI, NAREIT, Russell, Standard & Poor’s, J.P. Morgan Asset Management. Large cap: S&P 500, Small cap: Russell 2000, EM Equity: MSCI EME, DM Equity: MSCI EAFE, Comdty: Bloomberg Commodity Index, High Yield: Barclays Global HY Index, Fixed Income: Barclays US Aggregate, REITs: NAREIT Equity REIT Index. The “Asset Allocation” portfolio assumes the following weights: 25% in the S&P 500, 10% in the Russell 2000, 15% in the MSCI EAFE, 5% in the MSCI EME, 25% in the Barclays US Aggregate, 5% in the Barclays 1-3m Treasury, 5% in the Barclays Global High Yield Index, 5% in the Bloomberg Commodity Index and 5% in the NAREIT Equity REIT Index. Balanced portfolio assumes annual rebalancing. Annualized (Ann.) return and volatility (Vol.) represents period of 12/31/01 – 12/31/16. Please see disclosure page at end for index definitions. All data represents total return for stated period. Past performance is not indicative of future returns. Guide to the Markets – U.S. Data are as of September 30, 2017.

Year-End Financial To-Do List
19
Maximize your retirement plan contributions (including IRA’s)
Maximize your contributions to your health savings accounts
Spend down your flexible spending accounts
Gifts to your children and/or charities
This may be your last chance to re-finance at “generationally” low rates
Take your required minimum distributions from your retirement accounts
Talk with your accountant
Give your tax professional access to MS Online
Sources
J.P Morgan Asset Management
Bloomberg Research
Business Insider
Philosophical Economics
Yardeni Research
Multipl
20
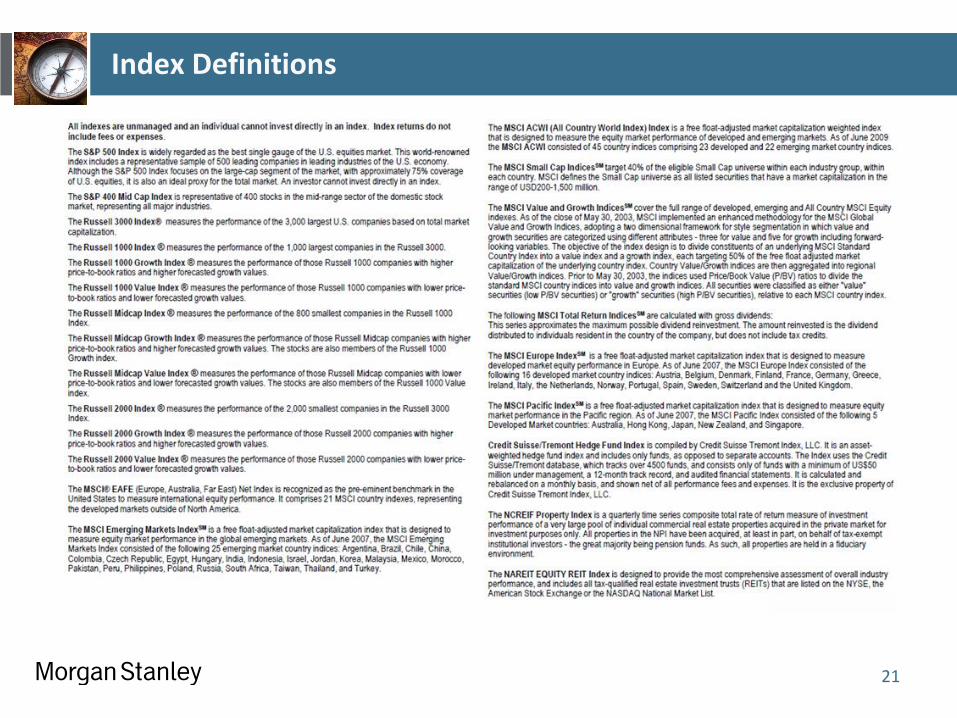
Index Definitions
21
J.P. Morgan Asset Management Disclosures
22
This document is intended solely to report on various investment views held by J.P. Morgan Asset Management. Opinions, estimates, forecasts and statements of financial market trends that are based on current market conditions constitute our judgment and are subject to change without notice. We believe the information provided here is reliable but should not be assumed to be accurate or complete. The views and strategies described may not be suitable for all investors. References to specific securities, asset classes and financial markets are for illustrative purposes only and are not intended to be, and should not be interpreted as, recommendations. Past performance is no guarantee of future results. Please note that investments in foreign markets are subject to special currency, political and economic risks.
The price of equity securities may rise or fall because of changes in the broad market or changes in a company’s financial condition, sometimes rapidly or unpredictably. These price movements may result from factors affecting individual companies, sectors or industries selected for the Fund’s portfolio or the securities market as a whole, such as changes in economic or political conditions. Equity securities are subject to “stock market risk,” meaning that stock prices in general (or in particular, the prices of the types of securities in which a fund invests) may decline over short or extended periods of time. When the value of a fund’s securities goes down, an investment in a fund decreases in value. The Fund may invest in derivatives, which may be riskier than other types of investments because they may be more sensitive to changes in economic or market conditions than other types of investments and could result in losses that significantly exceed the Fund’s original investment. Many derivatives create leverage, thereby causing the Fund to be more volatile than it would be if it had not used derivatives.
The S&P 500 Index is a capitalization-weighted index that measures the performance of 500 large-capitalization domestic stocks representing all major industries. All indexes are unmanaged and an individual cannot invest directly in an index. Index returns do not include fees or expenses.
J.P. Morgan Asset Management is the marketing name for the asset management businesses of JPMorgan Chase & Co. Those businesses include, but are not limited to, J.P. Morgan Investment Management Inc., Security Capital Research & Management Incorporated and J.P. Morgan Alternative Asset Management, Inc.
© JPMorgan Chase & Co., 2016
Important Morgan Stanley Disclosures
23
Indexes are not available for direct investment. Index returns consist of income and capital appreciation (or depreciation) and do not take into account fees, taxes, or other charges. Such fees and charges would reduce performance. Past performance is no guarantee of future results.
Although the statements of fact and data in this report have been obtained from, and are based upon, sources the firm believes reliable, we do not guarantee their accuracy, and any such information may be incomplete or condensed. All opinions included in this report constitute the firm’s judgment as of the date of this report and are subject to change without notice. This report is for informational purposes only and is not intended as an offer or solicitation with respect to the purchase or sale of any security.
Diversification does not guarantee a profit or protect against loss. Different asset classes present different risks. Some, but not all, of those risks are outlined below.
In general, fixed income and equities investments (domestic or foreign) face certain asset class specific risks, which could include, but are not limited to: market risk, credit risk, inflation risk, currency risk, default risk, interest rate risk and political risk. There are also additional risks and traits attributable to asset classes represented in certain indices.
Asset classes based on international investments have additional risks associated with international investing, including foreign economic, political, monetary and/or legal factors, changing currency exchange rates, foreign taxes and differences in financial and accounting standards. International investing may not be for everyone. These risks may be magnified in emerging markets.
With respect to real estate investments, property values can fall due to environmental, economic or other reasons, and change in interest rates can negatively impact the performance of real estate companies.
Bonds are affected by a number of risks, including fluctuations in interest rates, credit risk and prepayment risk. In general, as prevailing interest rates rise, fixed income securities prices will fall. Bonds face credit risk if a decline in an issuer's credit rating, or creditworthiness, causes a bond's price to decline. High yield bonds are subject to additional risks such as increased risk of default and greater volatility because of the lower credit quality of the issues. Finally, bonds can be subject to prepayment risk. When interest rates fall, an issuer may choose to borrow money at a lower interest rate, while paying off its previously issued bonds. As a consequence, underlying bonds will lose the interest payments from the investment and will be forced to reinvest in a market where prevailing interest rates are lower than when the initial investment was made. Depending on your state of residency, some bonds may be exempt from state and local taxes; however, interest may be subject to the federal alternative minimum tax.
Morgan Stanley Smith Barney and its affiliates do not provide tax or legal advice. To the extent that this material or any attachment concerns tax matters, it is not intended to be used and cannot be used by a taxpayer for the purpose of avoiding penalties that may be imposed by law. Any such taxpayer should seek advice based on the taxpayer's particular circumstances from an independent tax advisor.
Indexes are not available for direct investment. Index returns consist of income and capital appreciation (or depreciation) and do not take into account fees, taxes or other charges. Such fees and charges would reduce performance. © 2017 Morgan Stanley Smith Barney LLC. Member SIPC. Consulting Group and Portfolio Management Group are businesses of Morgan Stanley Smith Barney LLC.


