Download - Water retention curve and hydraulic conductivity function of highly compressible materials
Water retention curve and hydraulic conductivityfunction of highly compressible materials
Serge-Etienne Parent, Alexandre Cabral, and Jorge G. Zornberg
Abstract: A model capable of describing the suction-induced consolidation curve (void ratio function) and water retentioncurve (WRC) of highly compressible materials (HCM) is developed, validated, and finally applied to describe the WRC ofdeinking by-products (DBP). DBP are a highly compressible by-product of paper recycling used in geoenvironmentalapplications. Validation is conducted by modelling the WRC and the void ratio function for a well documented siltysand from Saskatchewan, Canada. The WRC and void ratio function were used to predict its hydraulic conductivityfunction (k-function). The water content, suction, and volumetric deformation data of DBP are obtained using anexperimental technique that allows determination of the WRCs of HCMs that is suitable for prediction of the DBPk-function. The results show that volumetric water contents are underestimated if volume changes are not accountedfor, leading to inaccuracies in the WRCs, thus inaccurately predicted k-functions. It is shown that the newly developedmodel is better suited for HCMs than currently available models, in particular for HCMs that continue to undergo sig-nificant volume changes when the applied suction exceeds the air-entry value.
Key words: water retention curve, hydraulic conductivity function, compressible materials, deinking by-products.
Resume : Un modele concu pour decrire la courbe de consolidation induite par la tension capillaire (fonction d’indice desvides) ainsi que la courbe de retention d’eau (CRE) des materiaux hautement compressibles (MHC) est developpe, valide,puis applique pour decrire la CRE des sous-produits de desencrages (SPD). Les SPD sont un sous-produit hautement com-pressible issus du procede de recyclage du papier utilise pour des applications geoenvironnementales. La validation du mo-dele est effectuee en modelisant la CRE et la fonction d’indice des vides d’un sable limoneux documente, provenant de laSaskatchewan, au Canada. La CRE et la fonction d’indice des vides ont ensuite ete utilisees pour predire sa fonction deconductivite hydraulique (FCH). Les donnees de teneur en eau, de tension capillaire et de deformation volumique des SPDsont obtenues grace a une procedure experimentale permettant de determiner la CRE des MHC. Les resultats montrent quela teneur en eau volumique est sous-estimee si les changements de volume de l’echantillon ne sont pas pris en compte,menant a des imprecisions dans la CRE, et, ainsi, dans la FCH predite. Il est demontre que le nouveau modele est plus ap-proprie pour les MHC que les modeles presentement disponibles, en particulier pour les MHC qui continuent a subir deschangements de volumes significatifs pour des valeurs de succions plus elevees que la valeur d’entree d’air.
Mots-cles : courbe de retention d’eau, fonction de conductivite hydraulique, materiaux compressibles, sous-produits de de-sencrage.
Introduction
Highly compressible materials (HCM) such as highly plas-tic clays and organic soils are being increasingly used in geo-environmental and agricultural applications (Paquet et al.1993; Nemati et al. 2002). In particular, deinking by-products(DBP), a material produced in the early stages of the paperrecycling process, have been successfully used as a covermaterial in both landfills (Moo-Young and Zimmie 1996;
Kraus et al. 1997; Kamon et al. 2002) and mining applications(Cabral et al. 1999) as well as a soil structural enhancementmaterial in agricultural applications (Nemati et al. 2000).
The water retention curve (WRC), also known as the soil-water characteristic curve, constitutes a basic relationshipbetween moisture and suction used for prediction of the me-chanical and hydraulic behaviour of unsaturated porous ma-terials. The experimental characterization of WRCs usingtraditional equipment, such as pressure plates (Smith andMullins 2001), and their representation using available mod-els (e.g., Brooks and Corey 1964; van Genuchten 1980;Fredlund and Xing 1994) may not be adequate for HCMsbecause these materials undergo significant volume changeswhen their pore structure is subjected to suction even forsuction values higher than the air-entry value. Huang et al.(1998) proposed a model to fit WRC data from HCMs.However, Huang et al.’s (Huang et al. 1998) model doesnot allow representation of some features that are relevantfor HCMs, such as nonlinear variation of the void ratio forsuctions lower than the air-entry value, partial desaturationthat occurs in the vicinity of the air-entry value, and varia-
Received 24 March 2006. Accepted 15 September 2007.Published on the NRC Research Press Web site at cgj.nrc.ca on30 November 2007.
S.-E. Parent and A. Cabral.1 Departement de genie civil,Faculte de genie, Universite de Sherbrooke, 2500, boul. del’Universite, Sherbrooke, QC J1K 2R1, Canada.J.G. Zornberg. Department of Civil Engineering, University ofTexas at Austin, 1 University Station, Austin, TX 78712-0280,USA.
1Corresponding author (e-mail:[email protected]).
1200
Can. Geotech. J. 44: 1200–1214 (2007) doi:10.1139/T07-091 # 2007 NRC Canada
tion of the void ratio for suctions higher than the air-entryvalue.
The hydraulic conductivity function, also known as the k-function, is the relationship between the hydraulic conduc-tivity function and suction. Because of experimental diffi-culties involved in its direct determination, conventionalpractice has been to indirectly estimate the k-function usingexperimental WRC data and Mualem’s (1976) analyticalrelationship (Fredlund et al. 1994; Leong and Rahardjo1997b; Huang et al. 1998; Fredlund 2002). Huang et al.(1998) proposed a minor modification to the Fredlund et al.(1994) k-function model, which was inspired by the Childsand Collis-George (1950) model, to account for volumechanges. The suitability of the k-function depends not onlyon the adopted k-function model, but also on the adequacyof the experimental WRC results and model used to derivethe k-function. However, the development to date of meth-ods suitable to determine the WRC and k-functions forHCMs has been, at best, limited.
This paper presents the details of an experimental techni-que used to determine the WRC of HCMs (updated fromCabral et al. 2004). The testing procedure is based on theaxis translation technique and allows for simultaneous andcontinuous determination of the volumetric water contentand void ratio of soil samples during desaturation. A modelis also developed to describe the suction-induced shrinkage,the WRC, and the k-function of HCMs. The proposed modelis based on a model originally proposed by Fredlund andXing (1994) and is initially validated using experimentaldata reported by Huang et al. (1998), who performed a ser-ies of tests on a compressible silty sand from Saskatchewan,Canada. The experimental results of representative tests per-formed to determine the WRC of DBP are subsequently pre-sented and evaluated. Finally, the k-functions for DBP,determined using the proposed WRC model, are obtainedand compared to results obtained using a method that doesnot consider volumetric changes.
Background
Water retention curveThe relationship between water content and suction in a
porous material provides the basis for understanding and pre-dicting the mechanical and hydraulic response of unsaturatedporous materials used in geotechnical and soil science appli-cations. Theoretical background useful for the prediction ofthe engineering behaviour of unsaturated soils using theWRC is presented by Barbour (1998). Leong and Rahardjo(1997a) summarize currently available models used to repre-sent the WRCs.
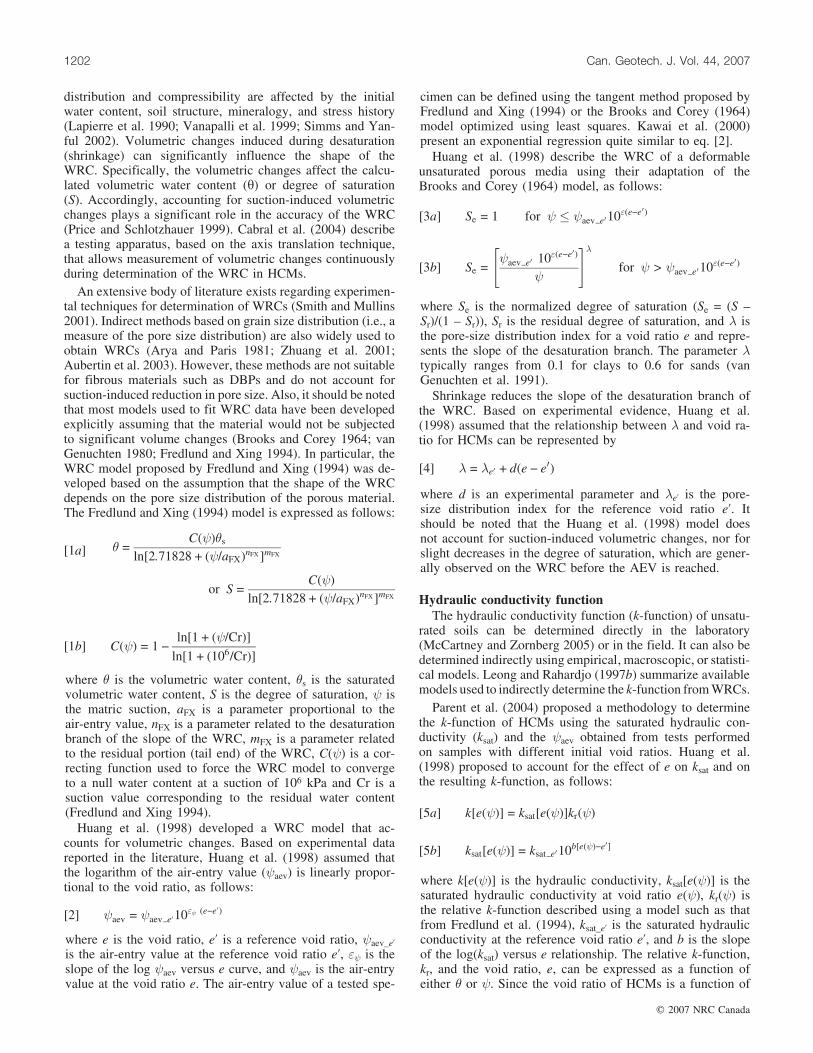
Figure 1 shows a schematic representation of a set ofWRCs for highly compressible specimens of the same mate-rial prepared to initial void ratios e0_i, e0_ii, and e0_iii. Theinitial saturated moisture content �s for the three specimensis different, but the various WRCs presented as y versus define a single desaturation branch (solid thick line inFig. 1) for suction levels exceeding the air-entry value( aev) of each specimen (Toll 1988). The aev is the suctionvalue where significant water losses are observed in thelargest pores of the specimen. As discussed later, the aevdepends on the initial void ratio and on the nature of voidratio changes with increasing suction. In the case of HCMs,the aev should be determined on a degree of saturation (S)versus suction ( ) relationship (also shown in Fig. 1), ratherthan on the volumetric water content versus suction curve,because the volumetric water content of a compressiblespecimen can start to decrease while the material remainssaturated. That is, since water is expelled from the pores be-cause of suction-induced changes in void ratio, the volumet-ric water content in compressible materials starts to decreasebefore the aev is reached while the degree of saturation re-mains constant (Fig. 1).
The shape of the WRC is mainly influenced by the soilpore size distribution and by the compressibility of the ma-terial (Smith and Mullins 2001). In turn, the soil pore size
Fig. 1. Schematic representation of WRCs for a material prepared at different initial void ratios.
Parent et al. 1201
# 2007 NRC Canada
distribution and compressibility are affected by the initialwater content, soil structure, mineralogy, and stress history(Lapierre et al. 1990; Vanapalli et al. 1999; Simms and Yan-ful 2002). Volumetric changes induced during desaturation(shrinkage) can significantly influence the shape of theWRC. Specifically, the volumetric changes affect the calcu-lated volumetric water content (y) or degree of saturation(S). Accordingly, accounting for suction-induced volumetricchanges plays a significant role in the accuracy of the WRC(Price and Schlotzhauer 1999). Cabral et al. (2004) describea testing apparatus, based on the axis translation technique,that allows measurement of volumetric changes continuouslyduring determination of the WRC in HCMs.
An extensive body of literature exists regarding experimen-tal techniques for determination of WRCs (Smith and Mullins2001). Indirect methods based on grain size distribution (i.e., ameasure of the pore size distribution) are also widely used toobtain WRCs (Arya and Paris 1981; Zhuang et al. 2001;Aubertin et al. 2003). However, these methods are not suitablefor fibrous materials such as DBPs and do not account forsuction-induced reduction in pore size. Also, it should be notedthat most models used to fit WRC data have been developedexplicitly assuming that the material would not be subjectedto significant volume changes (Brooks and Corey 1964; vanGenuchten 1980; Fredlund and Xing 1994). In particular, theWRC model proposed by Fredlund and Xing (1994) was de-veloped based on the assumption that the shape of the WRCdepends on the pore size distribution of the porous material.The Fredlund and Xing (1994) model is expressed as follows:
½1a� � ¼ Cð Þ�sln½2:71828 þ ð =aFXÞnFX �mFX
or S ¼ Cð Þln½2:71828 þ ð =aFXÞnFX �mFX
½1b� Cð Þ ¼ 1 � ln½1 þ ð =CrÞ�ln½1 þ ð106=CrÞ�
where � is the volumetric water content, �s is the saturatedvolumetric water content, S is the degree of saturation, isthe matric suction, aFX is a parameter proportional to theair-entry value, nFX is a parameter related to the desaturationbranch of the slope of the WRC, mFX is a parameter relatedto the residual portion (tail end) of the WRC, C( ) is a cor-recting function used to force the WRC model to convergeto a null water content at a suction of 106 kPa and Cr is asuction value corresponding to the residual water content(Fredlund and Xing 1994).
Huang et al. (1998) developed a WRC model that ac-counts for volumetric changes. Based on experimental datareported in the literature, Huang et al. (1998) assumed thatthe logarithm of the air-entry value ( aev) is linearly propor-tional to the void ratio, as follows:
½2� aev ¼ aev e010" ðe�e0Þ
where e is the void ratio, e’ is a reference void ratio, aev_e’is the air-entry value at the reference void ratio e’, " is theslope of the log aev versus e curve, and aev is the air-entryvalue at the void ratio e. The air-entry value of a tested spe-
cimen can be defined using the tangent method proposed byFredlund and Xing (1994) or the Brooks and Corey (1964)model optimized using least squares. Kawai et al. (2000)present an exponential regression quite similar to eq. [2].
Huang et al. (1998) describe the WRC of a deformableunsaturated porous media using their adaptation of theBrooks and Corey (1964) model, as follows:
½3a� Se ¼ 1 for � aev e010"ðe�e0Þ
½3b� Se ¼ aev e0 10
"ðe�e0Þ
" #�for > aev e010
"ðe�e0Þ
where Se is the normalized degree of saturation (Se = (S –Sr)/(1 – Sr)), Sr is the residual degree of saturation, and � isthe pore-size distribution index for a void ratio e and repre-sents the slope of the desaturation branch. The parameter �typically ranges from 0.1 for clays to 0.6 for sands (vanGenuchten et al. 1991).
Shrinkage reduces the slope of the desaturation branch ofthe WRC. Based on experimental evidence, Huang et al.(1998) assumed that the relationship between � and void ra-tio for HCMs can be represented by
½4� � ¼ �e0 þ dðe � e0Þ
where d is an experimental parameter and �e’ is the pore-size distribution index for the reference void ratio e’. Itshould be noted that the Huang et al. (1998) model doesnot account for suction-induced volumetric changes, nor forslight decreases in the degree of saturation, which are gener-ally observed on the WRC before the AEV is reached.
Hydraulic conductivity functionThe hydraulic conductivity function (k-function) of unsatu-
rated soils can be determined directly in the laboratory(McCartney and Zornberg 2005) or in the field. It can also bedetermined indirectly using empirical, macroscopic, or statisti-cal models. Leong and Rahardjo (1997b) summarize availablemodels used to indirectly determine the k-function from WRCs.
Parent et al. (2004) proposed a methodology to determinethe k-function of HCMs using the saturated hydraulic con-ductivity (ksat) and the aev obtained from tests performedon samples with different initial void ratios. Huang et al.(1998) proposed to account for the effect of e on ksat and onthe resulting k-function, as follows:
½5a� k½eð Þ� ¼ ksat½eð Þ�krð Þ
½5b� ksat½eð Þ� ¼ ksat e010b½eð Þ�e0�
where k[e( )] is the hydraulic conductivity, ksat[e( )] is thesaturated hydraulic conductivity at void ratio e( ), kr( ) isthe relative k-function described using a model such as thatfrom Fredlund et al. (1994), ksat_e’ is the saturated hydraulicconductivity at the reference void ratio e’, and b is the slopeof the log(ksat) versus e relationship. The relative k-function,kr, and the void ratio, e, can be expressed as a function ofeither � or . Since the void ratio of HCMs is a function of
1202 Can. Geotech. J. Vol. 44, 2007
# 2007 NRC Canada
suction (Khalili et al. 2004), it is convenient to use a k-function model described in terms of suction.
To determine kr, Fredlund et al. (1994) proposed the stat-istical model of eq. [6] based on the model developed byChilds and Collis-George (1950)
½6� krð Þ ¼Z lnð106Þ
lnð Þ
�ð2:71828yÞ � �ð Þ2:71828y
�0ð2:71828yÞdy" #
�Z lnð106Þ
0
�ð2:71828yÞ � �s2:71828y
�0ð2:71828yÞdy" #
where �’ is the derivative of the WRC model and y is adummy variable of integration representing suction.
It should be noted that the Childs and Collis-George(1950) k-function, used as a basis for eqs. [5] and [6], as-sumes that the soil structure is incompressible (Fredlund andRahardjo 1993). In fact, the function in the numerator ofeq. [6] involves an integral for suction values ranging from to the maximum suction value (106 kPa), while the de-nominator involves an integral for the entire suction range(from 0 to 106 kPa). However, the expression in the denomi-nator is sensitive to the initial void ratio. This is illustrated inFig. 1, which shows a schematic representation of threewater retention tests performed using different initial void ra-tios. For example, it is expected that at suction x samples iiand iii will reach the same void ratio, the same volumetricwater content, and consequently, the same hydraulic conduc-tivity. However, integration of the WRCs for samples ii andiii will lead to a greater value in the denominator of eq. [6]for sample ii (areas A+B+C) than for sample iii (areas B+C),leading to a different k-function. Improvements in the pre-diction of the k-functions for HCMs are beyond the scope ofthis paper and deserve further attention from researchers.
Materials and methods
Deinking by-productsDeinking by-products (DBP) are fibrous, highly compres-
sible residues from the paper recycling process. The inor-ganic components of DBP include calcite, metakaolinite,and rutile, while the organic components include cellulose,hemicellulose, and lignin (Panarotto et al. 1999). The maxi-mum dry unit weight obtained following standard Proctorprocedure ranges from 5.0 to 5.6 kN/m3, and optimumgravimetric water content ranges from 60% to 90%.
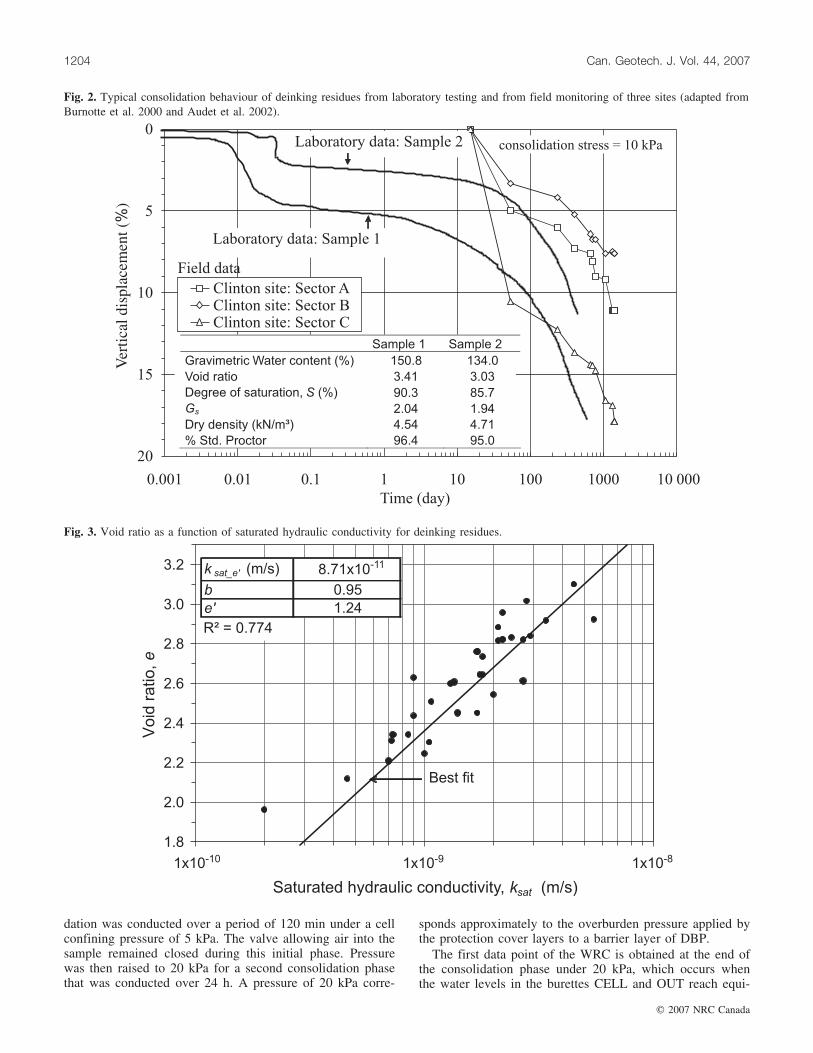
Figure 2 presents the consolidation curves of two DBPspecimens. The results show that DBP present a relativelyshort primary consolidation phase (barely perceptible inFig. 2) and a significantly larger secondary consolidation(creep) phase, a behaviour resembling that of highly or-ganic materials such as peat. Figure 2 also shows the time-dependent nature of the settlements in three sectors of theClinton mine cover, Quebec, Canada, illustrating that fieldbehaviour is consistent with the laboratory response. Specif-ically, the field results in Fig. 2 reveal that the short pri-mary consolidation phase involve only the initial twomonths, followed by a long creep phase (Bedard 2005).
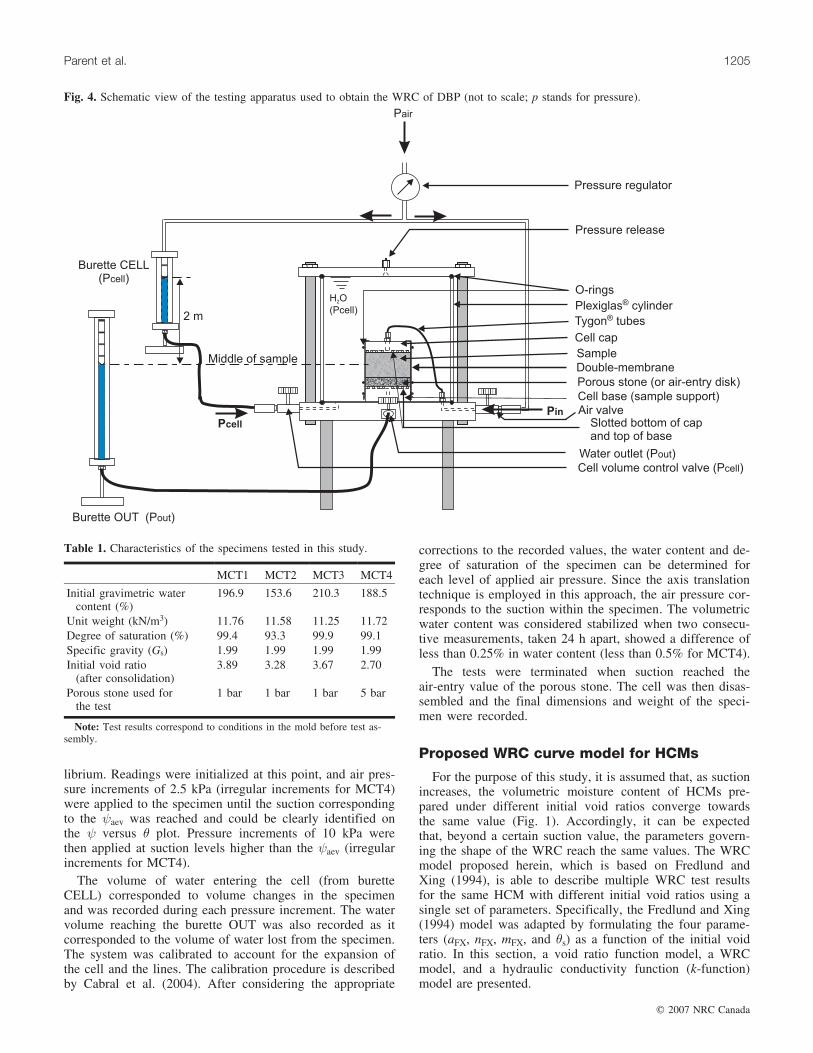
Hydraulic conductivity tests were performed in oedome-ters at the end of each consolidation step using laboratoryspecimens. Figure 3 shows the saturated hydraulic conductiv-
ity obtained for a series of tests performed using samples col-lected from different sites and prepared at an average initialgravimetric water content of approximately 138% (approxi-mately 60% above the optimum water content). As expected,the saturated hydraulic conductivity increased with increas-ing void ratio. The slope of the ksat versus e relationship (theparameter b in eq. [5b]) equals 0.95.
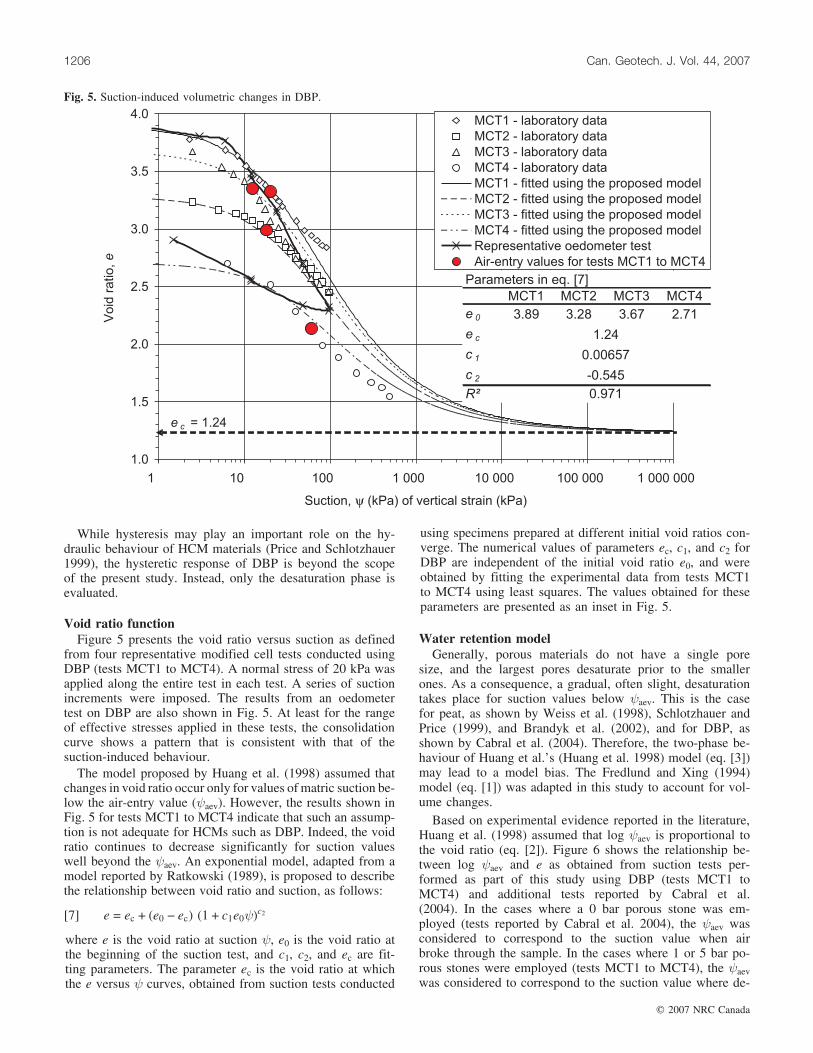
Testing equipmentFigure 4 shows a schematic view of the testing apparatus
used in this study to obtain the WRC of DBP. The systemconsists of a 115.4 mm high, 158.5 mm diameter Plexiglas1cell, a pressure regulator used to control air pressure appliedon the top of the specimen and on the burette CELL, andthree valves that allow control of air pressure, water inflow,and water outflow. As the air pressure applied on the top ofthe specimen is increased, water is expelled from the sampleand collected in burette OUT. Volume changes in the speci-men during pressure increases result in an equivalent watervolume entering the cell via the burette CELL. The contin-ued measurement of volume changes allows calculation ofthe water content at each suction level. Additional detailson the equipment characteristics and testing procedures areprovided by Cabral et al. (2004).
Cabral et al. (2004) used a porous stone of negligible air-entry value (0 bar porous stone, where 1 bar = 101.3 kPa).However, as suction increased beyond the aev of DBP, airbroke into the specimen, draining the porous stone and com-promising the results. In the present study, testing was per-formed using porous stones with air-entry values of 1 and5 bars. The use of porous stones of higher air-entry valuesallows determination of WRC data up to suction values of100 and 500 kPa, respectively. The time needed to reachequilibrium in the burettes OUT and CELL after each pres-sure increment was carefully evaluated. Consistent readingscould be obtained after 24 h where using the 0 bar porousstone and after 2 to 5 days where using the 1 bar and 5 barporous stones, depending on the level of applied pressure.
Specimen preparationSpecimen preparation involved initial autoclaving of the
DBP material to prevent biological activity during testing.Planchet (2001) observed that the use of microbiocide af-fects the pore structure of DBP by altering its fibres. Conse-quently, no microbiocide was added to the DBP specimenstested in this study.
Preliminary tests with DBP showed that the sample prep-aration procedure that led to the best reproducibility of re-sults involved compacting three 10 mm thick layers bytamping the material directly into the cell. For that purpose,a mould and small mortar were designed and constructed.The thickness of the layers was controlled using a speciallydesigned piston. Cabral et al. (2004) provide additional de-tails on the procedure used for sample preparation and com-paction. The characteristics of the samples of DBP preparedfor this study, modified cell tests (MCT1 to MCT4) are pre-sented in Table 1.
Testing procedure and calibrationFollowing specimen preparation, the apparatus was as-
sembled and the consolidation phase was initiated. Consoli-
Parent et al. 1203
# 2007 NRC Canada
dation was conducted over a period of 120 min under a cellconfining pressure of 5 kPa. The valve allowing air into thesample remained closed during this initial phase. Pressurewas then raised to 20 kPa for a second consolidation phasethat was conducted over 24 h. A pressure of 20 kPa corre-
sponds approximately to the overburden pressure applied bythe protection cover layers to a barrier layer of DBP.
The first data point of the WRC is obtained at the end ofthe consolidation phase under 20 kPa, which occurs whenthe water levels in the burettes CELL and OUT reach equi-
Fig. 2. Typical consolidation behaviour of deinking residues from laboratory testing and from field monitoring of three sites (adapted fromBurnotte et al. 2000 and Audet et al. 2002).
Fig. 3. Void ratio as a function of saturated hydraulic conductivity for deinking residues.
1204 Can. Geotech. J. Vol. 44, 2007
# 2007 NRC Canada
librium. Readings were initialized at this point, and air pres-sure increments of 2.5 kPa (irregular increments for MCT4)were applied to the specimen until the suction correspondingto the aev was reached and could be clearly identified onthe versus � plot. Pressure increments of 10 kPa werethen applied at suction levels higher than the aev (irregularincrements for MCT4).
The volume of water entering the cell (from buretteCELL) corresponded to volume changes in the specimenand was recorded during each pressure increment. The watervolume reaching the burette OUT was also recorded as itcorresponded to the volume of water lost from the specimen.The system was calibrated to account for the expansion ofthe cell and the lines. The calibration procedure is describedby Cabral et al. (2004). After considering the appropriate
corrections to the recorded values, the water content and de-gree of saturation of the specimen can be determined foreach level of applied air pressure. Since the axis translationtechnique is employed in this approach, the air pressure cor-responds to the suction within the specimen. The volumetricwater content was considered stabilized when two consecu-tive measurements, taken 24 h apart, showed a difference ofless than 0.25% in water content (less than 0.5% for MCT4).
The tests were terminated when suction reached theair-entry value of the porous stone. The cell was then disas-sembled and the final dimensions and weight of the speci-men were recorded.
Proposed WRC curve model for HCMs
For the purpose of this study, it is assumed that, as suctionincreases, the volumetric moisture content of HCMs pre-pared under different initial void ratios converge towardsthe same value (Fig. 1). Accordingly, it can be expectedthat, beyond a certain suction value, the parameters govern-ing the shape of the WRC reach the same values. The WRCmodel proposed herein, which is based on Fredlund andXing (1994), is able to describe multiple WRC test resultsfor the same HCM with different initial void ratios using asingle set of parameters. Specifically, the Fredlund and Xing(1994) model was adapted by formulating the four parame-ters (aFX, nFX, mFX, and �s) as a function of the initial voidratio. In this section, a void ratio function model, a WRCmodel, and a hydraulic conductivity function (k-function)model are presented.
Fig. 4. Schematic view of the testing apparatus used to obtain the WRC of DBP (not to scale; p stands for pressure).
Table 1. Characteristics of the specimens tested in this study.
MCT1 MCT2 MCT3 MCT4
Initial gravimetric watercontent (%)
196.9 153.6 210.3 188.5
Unit weight (kN/m3) 11.76 11.58 11.25 11.72Degree of saturation (%) 99.4 93.3 99.9 99.1Specific gravity (Gs) 1.99 1.99 1.99 1.99Initial void ratio
(after consolidation)3.89 3.28 3.67 2.70
Porous stone used forthe test
1 bar 1 bar 1 bar 5 bar
Note: Test results correspond to conditions in the mold before test as-sembly.
Parent et al. 1205
# 2007 NRC Canada
While hysteresis may play an important role on the hy-draulic behaviour of HCM materials (Price and Schlotzhauer1999), the hysteretic response of DBP is beyond the scopeof the present study. Instead, only the desaturation phase isevaluated.
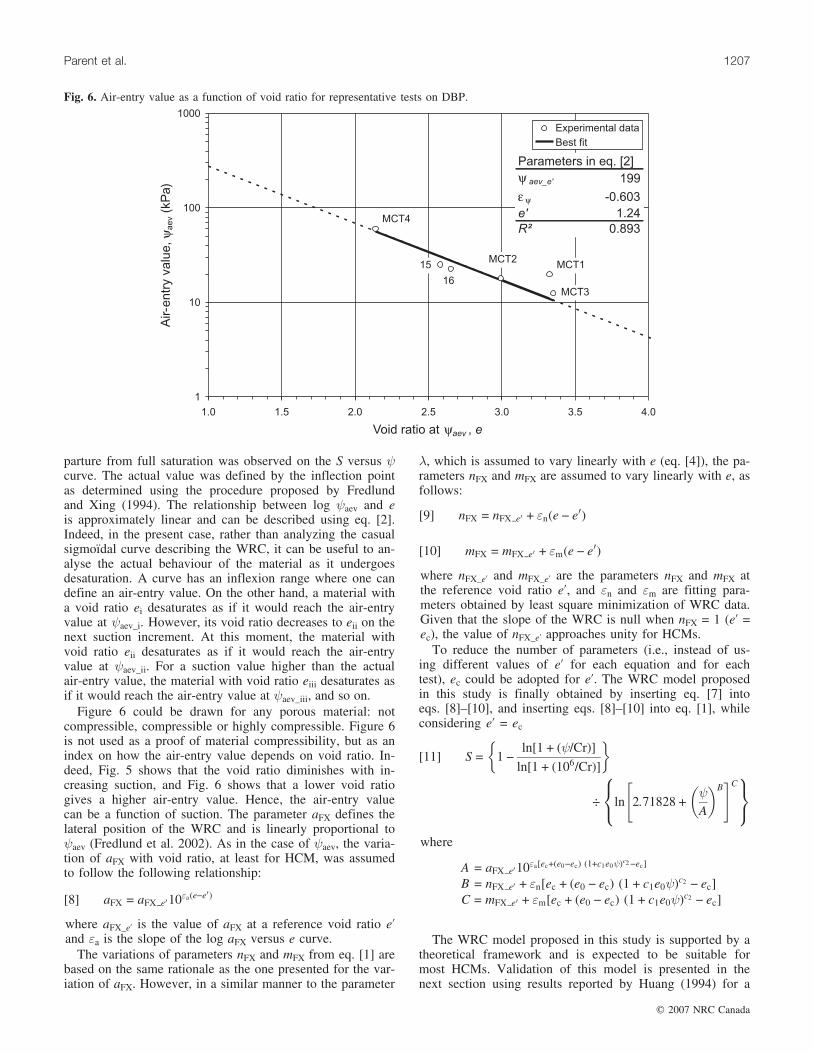
Void ratio functionFigure 5 presents the void ratio versus suction as defined
from four representative modified cell tests conducted usingDBP (tests MCT1 to MCT4). A normal stress of 20 kPa wasapplied along the entire test in each test. A series of suctionincrements were imposed. The results from an oedometertest on DBP are also shown in Fig. 5. At least for the rangeof effective stresses applied in these tests, the consolidationcurve shows a pattern that is consistent with that of thesuction-induced behaviour.
The model proposed by Huang et al. (1998) assumed thatchanges in void ratio occur only for values of matric suction be-low the air-entry value ( aev). However, the results shown inFig. 5 for tests MCT1 to MCT4 indicate that such an assump-tion is not adequate for HCMs such as DBP. Indeed, the voidratio continues to decrease significantly for suction valueswell beyond the aev. An exponential model, adapted from amodel reported by Ratkowski (1989), is proposed to describethe relationship between void ratio and suction, as follows:
½7� e ¼ ec þ ðe0 � ecÞ ð1 þ c1e0 Þc2
where e is the void ratio at suction , e0 is the void ratio atthe beginning of the suction test, and c1, c2, and ec are fit-ting parameters. The parameter ec is the void ratio at whichthe e versus curves, obtained from suction tests conducted
using specimens prepared at different initial void ratios con-verge. The numerical values of parameters ec, c1, and c2 forDBP are independent of the initial void ratio e0, and wereobtained by fitting the experimental data from tests MCT1to MCT4 using least squares. The values obtained for theseparameters are presented as an inset in Fig. 5.
Water retention modelGenerally, porous materials do not have a single pore
size, and the largest pores desaturate prior to the smallerones. As a consequence, a gradual, often slight, desaturationtakes place for suction values below aev. This is the casefor peat, as shown by Weiss et al. (1998), Schlotzhauer andPrice (1999), and Brandyk et al. (2002), and for DBP, asshown by Cabral et al. (2004). Therefore, the two-phase be-haviour of Huang et al.’s (Huang et al. 1998) model (eq. [3])may lead to a model bias. The Fredlund and Xing (1994)model (eq. [1]) was adapted in this study to account for vol-ume changes.
Based on experimental evidence reported in the literature,Huang et al. (1998) assumed that log aev is proportional tothe void ratio (eq. [2]). Figure 6 shows the relationship be-tween log aev and e as obtained from suction tests per-formed as part of this study using DBP (tests MCT1 toMCT4) and additional tests reported by Cabral et al.(2004). In the cases where a 0 bar porous stone was em-ployed (tests reported by Cabral et al. 2004), the aev wasconsidered to correspond to the suction value when airbroke through the sample. In the cases where 1 or 5 bar po-rous stones were employed (tests MCT1 to MCT4), the aevwas considered to correspond to the suction value where de-
Fig. 5. Suction-induced volumetric changes in DBP.
1206 Can. Geotech. J. Vol. 44, 2007
# 2007 NRC Canada
parture from full saturation was observed on the S versus curve. The actual value was defined by the inflection pointas determined using the procedure proposed by Fredlundand Xing (1994). The relationship between log aev and eis approximately linear and can be described using eq. [2].Indeed, in the present case, rather than analyzing the casualsigmoıdal curve describing the WRC, it can be useful to an-alyse the actual behaviour of the material as it undergoesdesaturation. A curve has an inflexion range where one candefine an air-entry value. On the other hand, a material witha void ratio ei desaturates as if it would reach the air-entryvalue at aev_i. However, its void ratio decreases to eii on thenext suction increment. At this moment, the material withvoid ratio eii desaturates as if it would reach the air-entryvalue at aev_ii. For a suction value higher than the actualair-entry value, the material with void ratio eiii desaturates asif it would reach the air-entry value at aev_iii, and so on.
Figure 6 could be drawn for any porous material: notcompressible, compressible or highly compressible. Figure 6is not used as a proof of material compressibility, but as anindex on how the air-entry value depends on void ratio. In-deed, Fig. 5 shows that the void ratio diminishes with in-creasing suction, and Fig. 6 shows that a lower void ratiogives a higher air-entry value. Hence, the air-entry valuecan be a function of suction. The parameter aFX defines thelateral position of the WRC and is linearly proportional to aev (Fredlund et al. 2002). As in the case of aev, the varia-tion of aFX with void ratio, at least for HCM, was assumedto follow the following relationship:
½8� aFX ¼ aFX e010"aðe�e0Þ
where aFX_e’ is the value of aFX at a reference void ratio e’and "a is the slope of the log aFX versus e curve.
The variations of parameters nFX and mFX from eq. [1] arebased on the same rationale as the one presented for the var-iation of aFX. However, in a similar manner to the parameter
�, which is assumed to vary linearly with e (eq. [4]), the pa-rameters nFX and mFX are assumed to vary linearly with e, asfollows:
½9� nFX ¼ nFX e0 þ "nðe � e0Þ
½10� mFX ¼ mFX e0 þ "mðe � e0Þ
where nFX_e’ and mFX_e’ are the parameters nFX and mFX atthe reference void ratio e’, and "n and "m are fitting para-meters obtained by least square minimization of WRC data.Given that the slope of the WRC is null when nFX = 1 (e’ =ec), the value of nFX_e’ approaches unity for HCMs.
To reduce the number of parameters (i.e., instead of us-ing different values of e’ for each equation and for eachtest), ec could be adopted for e’. The WRC model proposedin this study is finally obtained by inserting eq. [7] intoeqs. [8]–[10], and inserting eqs. [8]–[10] into eq. [1], whileconsidering e’ = ec
½11� S ¼ 1 � ln½1 þ ð =CrÞ�ln½1 þ ð106=CrÞ�
� �
� ln 2:71828 þ
A
� �B" #C8<
:9=;
where
A ¼ aFX e010"a½ecþðe0�ecÞ ð1þc1e0 Þc2�ec�
B ¼ nFX e0 þ "n½ec þ ðe0 � ecÞ ð1 þ c1e0 Þc2 � ec�C ¼ mFX e0 þ "m½ec þ ðe0 � ecÞ ð1 þ c1e0 Þc2 � ec�
The WRC model proposed in this study is supported by atheoretical framework and is expected to be suitable formost HCMs. Validation of this model is presented in thenext section using results reported by Huang (1994) for a
Fig. 6. Air-entry value as a function of void ratio for representative tests on DBP.
Parent et al. 1207
# 2007 NRC Canada
compressible silty sand and is followed by the use of themodel on DBP, using results obtained during this study.
Validation of the proposed modelTo validate the proposed model (eq. [11]), the procedure
for obtaining the WRC and predicting the k-function was ap-plied to the experimental data reported by Huang et al.(1998), which involved a series of tests on a compressiblesilty sand from Saskatchewan, Sask. The experimental datawere collected using pressure-plate cells. Since volumetricchanges were not recorded during testing, the variation ofvoid ratio with suction was obtained from the results offlexible-wall permeability tests performed by Huang et al.(1998) using specimens with similar initial void ratio.
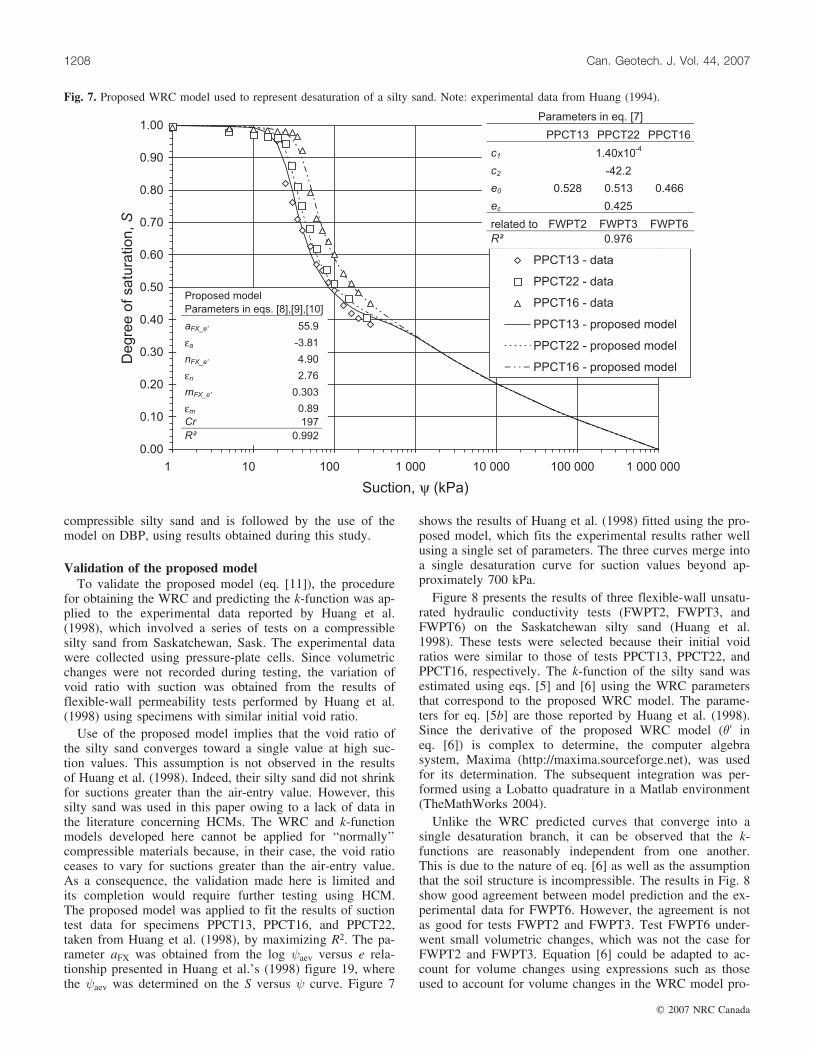
Use of the proposed model implies that the void ratio ofthe silty sand converges toward a single value at high suc-tion values. This assumption is not observed in the resultsof Huang et al. (1998). Indeed, their silty sand did not shrinkfor suctions greater than the air-entry value. However, thissilty sand was used in this paper owing to a lack of data inthe literature concerning HCMs. The WRC and k-functionmodels developed here cannot be applied for ‘‘normally’’compressible materials because, in their case, the void ratioceases to vary for suctions greater than the air-entry value.As a consequence, the validation made here is limited andits completion would require further testing using HCM.The proposed model was applied to fit the results of suctiontest data for specimens PPCT13, PPCT16, and PPCT22,taken from Huang et al. (1998), by maximizing R2. The pa-rameter aFX was obtained from the log aev versus e rela-tionship presented in Huang et al.’s (1998) figure 19, wherethe aev was determined on the S versus curve. Figure 7
shows the results of Huang et al. (1998) fitted using the pro-posed model, which fits the experimental results rather wellusing a single set of parameters. The three curves merge intoa single desaturation curve for suction values beyond ap-proximately 700 kPa.
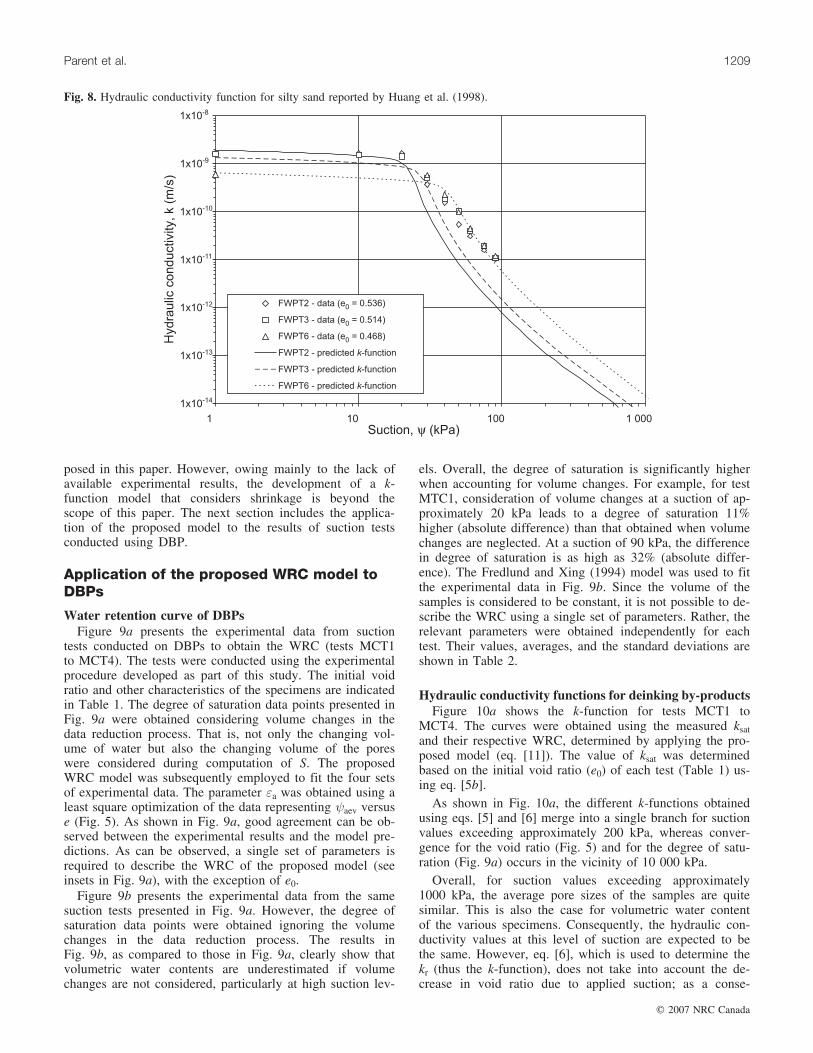
Figure 8 presents the results of three flexible-wall unsatu-rated hydraulic conductivity tests (FWPT2, FWPT3, andFWPT6) on the Saskatchewan silty sand (Huang et al.1998). These tests were selected because their initial voidratios were similar to those of tests PPCT13, PPCT22, andPPCT16, respectively. The k-function of the silty sand wasestimated using eqs. [5] and [6] using the WRC parametersthat correspond to the proposed WRC model. The parame-ters for eq. [5b] are those reported by Huang et al. (1998).Since the derivative of the proposed WRC model (�’ ineq. [6]) is complex to determine, the computer algebrasystem, Maxima (http://maxima.sourceforge.net), was usedfor its determination. The subsequent integration was per-formed using a Lobatto quadrature in a Matlab environment(TheMathWorks 2004).
Unlike the WRC predicted curves that converge into asingle desaturation branch, it can be observed that the k-functions are reasonably independent from one another.This is due to the nature of eq. [6] as well as the assumptionthat the soil structure is incompressible. The results in Fig. 8show good agreement between model prediction and the ex-perimental data for FWPT6. However, the agreement is notas good for tests FWPT2 and FWPT3. Test FWPT6 under-went small volumetric changes, which was not the case forFWPT2 and FWPT3. Equation [6] could be adapted to ac-count for volume changes using expressions such as thoseused to account for volume changes in the WRC model pro-
Fig. 7. Proposed WRC model used to represent desaturation of a silty sand. Note: experimental data from Huang (1994).
1208 Can. Geotech. J. Vol. 44, 2007
# 2007 NRC Canada
posed in this paper. However, owing mainly to the lack ofavailable experimental results, the development of a k-function model that considers shrinkage is beyond thescope of this paper. The next section includes the applica-tion of the proposed model to the results of suction testsconducted using DBP.
Application of the proposed WRC model toDBPs
Water retention curve of DBPsFigure 9a presents the experimental data from suction
tests conducted on DBPs to obtain the WRC (tests MCT1to MCT4). The tests were conducted using the experimentalprocedure developed as part of this study. The initial voidratio and other characteristics of the specimens are indicatedin Table 1. The degree of saturation data points presented inFig. 9a were obtained considering volume changes in thedata reduction process. That is, not only the changing vol-ume of water but also the changing volume of the poreswere considered during computation of S. The proposedWRC model was subsequently employed to fit the four setsof experimental data. The parameter "a was obtained using aleast square optimization of the data representing aev versuse (Fig. 5). As shown in Fig. 9a, good agreement can be ob-served between the experimental results and the model pre-dictions. As can be observed, a single set of parameters isrequired to describe the WRC of the proposed model (seeinsets in Fig. 9a), with the exception of e0.
Figure 9b presents the experimental data from the samesuction tests presented in Fig. 9a. However, the degree ofsaturation data points were obtained ignoring the volumechanges in the data reduction process. The results inFig. 9b, as compared to those in Fig. 9a, clearly show thatvolumetric water contents are underestimated if volumechanges are not considered, particularly at high suction lev-
els. Overall, the degree of saturation is significantly higherwhen accounting for volume changes. For example, for testMTC1, consideration of volume changes at a suction of ap-proximately 20 kPa leads to a degree of saturation 11%higher (absolute difference) than that obtained when volumechanges are neglected. At a suction of 90 kPa, the differencein degree of saturation is as high as 32% (absolute differ-ence). The Fredlund and Xing (1994) model was used to fitthe experimental data in Fig. 9b. Since the volume of thesamples is considered to be constant, it is not possible to de-scribe the WRC using a single set of parameters. Rather, therelevant parameters were obtained independently for eachtest. Their values, averages, and the standard deviations areshown in Table 2.
Hydraulic conductivity functions for deinking by-productsFigure 10a shows the k-function for tests MCT1 to
MCT4. The curves were obtained using the measured ksatand their respective WRC, determined by applying the pro-posed model (eq. [11]). The value of ksat was determinedbased on the initial void ratio (e0) of each test (Table 1) us-ing eq. [5b].
As shown in Fig. 10a, the different k-functions obtainedusing eqs. [5] and [6] merge into a single branch for suctionvalues exceeding approximately 200 kPa, whereas conver-gence for the void ratio (Fig. 5) and for the degree of satu-ration (Fig. 9a) occurs in the vicinity of 10 000 kPa.
Overall, for suction values exceeding approximately1000 kPa, the average pore sizes of the samples are quitesimilar. This is also the case for volumetric water contentof the various specimens. Consequently, the hydraulic con-ductivity values at this level of suction are expected to bethe same. However, eq. [6], which is used to determine thekr (thus the k-function), does not take into account the de-crease in void ratio due to applied suction; as a conse-
Fig. 8. Hydraulic conductivity function for silty sand reported by Huang et al. (1998).
Parent et al. 1209
# 2007 NRC Canada
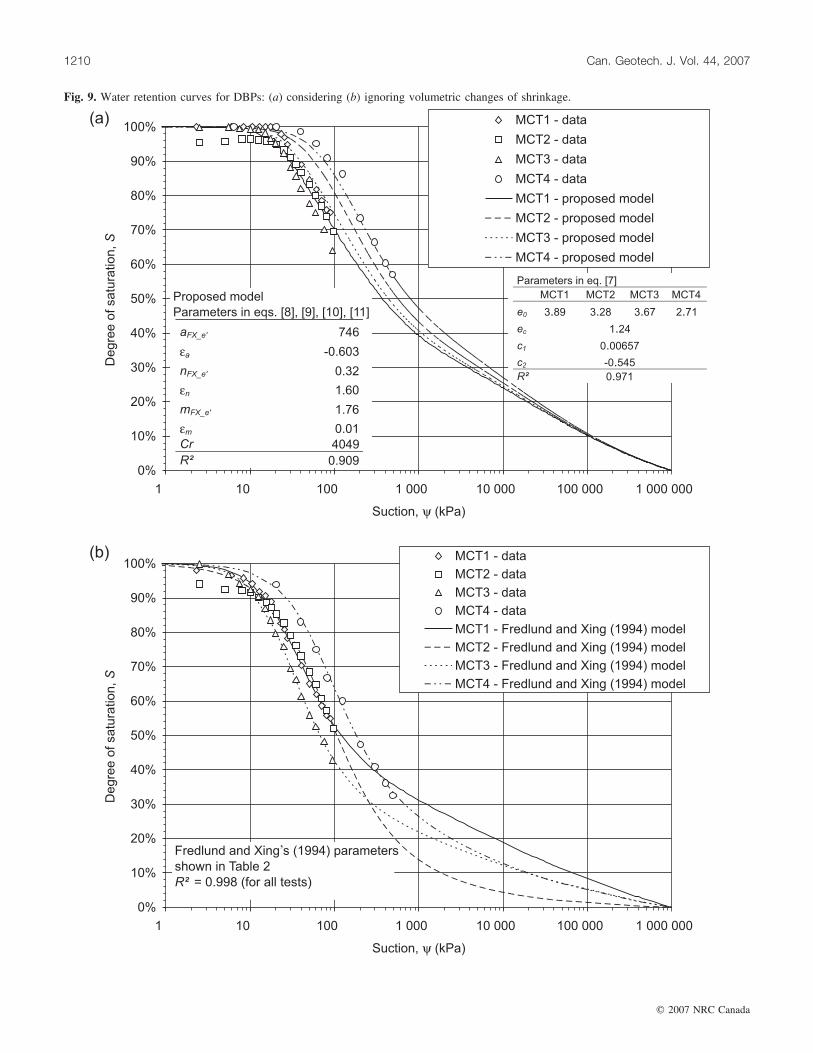
Fig. 9. Water retention curves for DBPs: (a) considering (b) ignoring volumetric changes of shrinkage.
1210 Can. Geotech. J. Vol. 44, 2007
# 2007 NRC Canada
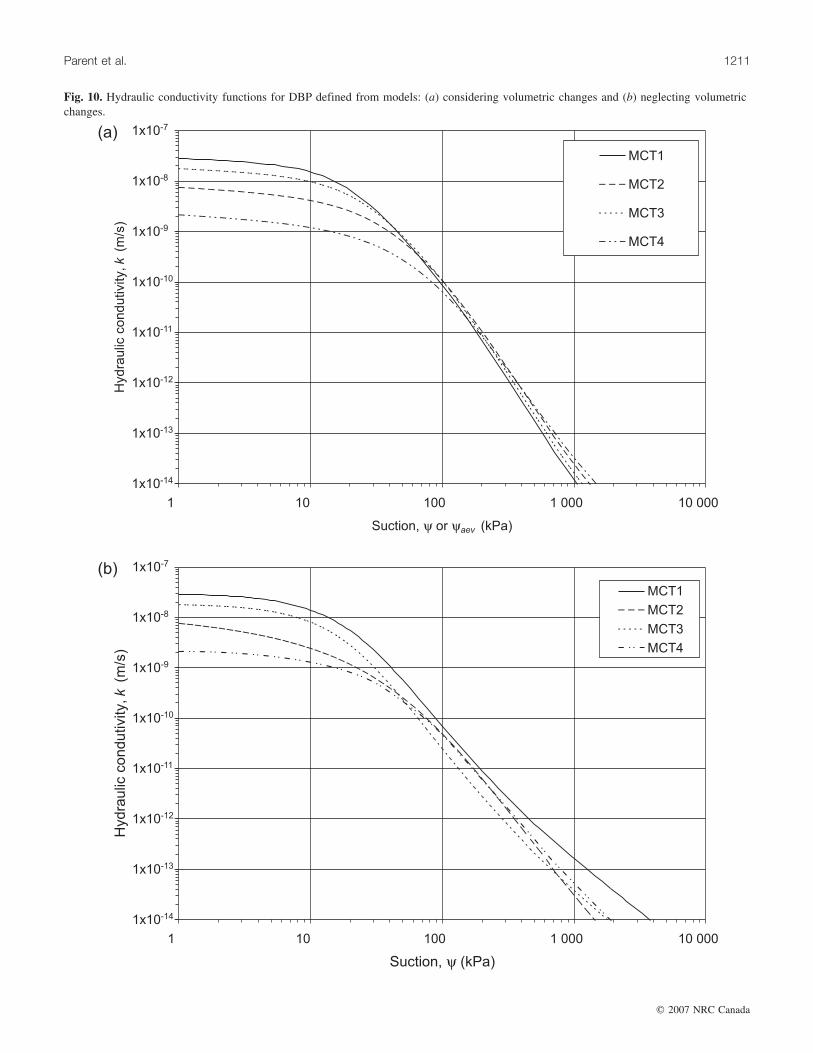
Fig. 10. Hydraulic conductivity functions for DBP defined from models: (a) considering volumetric changes and (b) neglecting volumetricchanges.
Parent et al. 1211
# 2007 NRC Canada
quence, one should not expect the k-functions to converge toa single branch because the denominator would be influ-enced by the initial void ratio. In the case of DBP, the lowstandard deviation for ei explains the observed convergence,whereas for the silty sand the initial void ratio values arerather different and convergence is not observed (Fig. 8).
Figure 10b presents the k-functions for DBP defined by ne-glecting volume changes using the parameters for the WRCas determined using the model (eq. [1]) proposed by Fredlundand Xing (1994) (parameters are presented in Table 2). Athigh suctions, convergence is not observed (Fig. 10b). Infact, four distinct curves are obtained for the four specimens.The differences in the values of the Fredlund and Xing (1994)parameters aFX, nFX, mFX, and Cr lead to differences in hy-draulic conductivity of over one order of magnitude for awide range of suction values.
Conclusions
A model was proposed to describe the water retentioncurve (WRC) of highly compressible materials (HCM). Theinput parameters needed for the model were obtained di-rectly from suction tests performed using an experimentalprocedure that allows determination of the WRCs of materi-als that undergo significant volume changes during applica-tion of suction (i.e., HCMs). Monitoring of volume changesin the specimen during suction application allows for contin-ued update of the volumetric water contents.
The proposed model was validated using experimentaldata from tests reported for a compressible silty sand fromSaskatchewan, Sask. Hydraulic conductivity functions (k-functions), obtained based on the proposed WRC model,show poor agreement with hydraulic conductivity valuesobtained experimentally for this silty sand due to the factthat the k-function model was developed for incompressiblestructures.
The proposed model was used to represent the experi-mental results of suction tests conducted using deinking by-products (DBP), a highly compressible industrial by-productthat can be used as alternative material in geoenvironmentalapplications. The proposed model was found to accuratelyfit the experimental WRC data. Volumetric water contentsare significantly underestimated if volumetric changes arenot accounted for in the data reduction process when deter-mining the WRC.
The void ratios of the DBP specimens tested were foundto converge to a single curve as the suction level increased.Consequently, their k-functions are also expected to super-impose at comparatively high suctions. The results obtainedin this study indicate that the k-functions defined using
WRC models that take into account volume changes con-verge to a single branch for relatively high suctions, despitethe fact that the k-function model was developed for incom-pressible structures. On the other hand, unrealistically differ-ent hydraulic conductivity branches were obtained at highsuctions if volumetric changes were not accounted for.
Questions can be raised about the unicity of parametersec, c1, and c2 (eq. [7]; Fig. 5). A way to improve the modelwould be to obtain the void ratio at, for example, zero watercontent (1 000 000 kPa) for different samples. The void ra-tio of different specimens would converge to this singlevalue of void ratio (ec). However, this convergence valuewould necessarily depend on the structure of the samples. Ifthey are the same (difficult to obtain for DBP samples), theconvergence void ratio would be the same. An eventual dif-ference in structure may induce some differences in the finalvoid ratio. Nonetheless, it is important to note that the im-portance of the actual convergence value (or the ‘‘unique’’value) is rather limited for the purposes of the model. In-deed, the value of ec does not affect the predictability of themodel in terms of obtaining the WRC and the k-function,particularly for low suction range. For the higher suctionrange, it may have a more significant effect.
AcknowledgementsFunding for this study was provided by Industries Cas-
cades Inc., Perkins Papers Ltd., and National Sciences andEngineering Research Council of Canada (NSERC) underUniversity–Industry Partnership grant number CRD 192179and by the second author’s Discovery Grant (NSERC). Sup-port received by the last author from the National ScienceFoundation (USA) is also greatly appreciated. The authorsalso acknowledge help provided by Jean-Guy Lemelin andEric Drouin in the design of the cell and the measuring sys-tem and with the experimental testing.
ReferencesArya, L.M., and Paris, J.F. 1981. A physicoempirical model to pre-
dict the soil moisture characteristic from particle-size distribu-tion and bulk density data. Soil Science Society of AmericaJournal, 45: 1023–1030.
Aubertin, M., Mbonimpa, M., Bussiere, B.R., and Chapuis, R.2003. A model to predict the water retention curve from basicgeotechnical properties. Canadian Geotechnical Journal, 40:1104–1122. doi:10.1139/t03-054.
Audet, C., Lefebvre, G., Cabral, A.R., and Burnotte, F. 2002. Stateof development in the valorization of deinking by-products as analternative to fine grained soils. In TAPPI 2002, Montreal, 6–10 April 2002. TAPPI, Norcross, Ga.
Barbour, S.L. 1998. Nineteenth Canadian Geotechnical Collo-quium: The soil-water characteristic curve: a historical perspec-tive. Canadian Geotechnical Journal, 35: 873–894. doi:10.1139/cgj-35-5-873.
Bedard, D. 2005. Effet du fluage a long terme des sous-produits dedesencrage du a la perte de masse et son effet sur la compres-sion et la conductivite hydraulique. M.Sc.A. thesis, Universitede Sherbrooke, Sherbrooke, Que.
Brandyk, T., Szatylowicz, J., Oleszczuk, R., and Gnatowski, T.2002. Water-related physical attributes of organic soils. In Or-ganic soils and peat materials for sustainable agriculture. CRCPress, Boca Raton, Fla. pp. 33–66.
Table 2. Parameters modelled for deinking by-product sampleswithout consideration of volume change (Fredlund and Xing 1994).
MCT1 MCT2 MCT3 MCT4 Ave. Std. dev.
aFX 19.9 60.3 19.0 51.9 37.8 21.4nFX 1.81 1.14 1.83 1.50 1.57 0.32mFX 0.570 1.615 0.742 0.857 0.946 0.461Cr 3000 3000 3000 3000 3000 0R2 0.998 0.999 0.999 0.998
1212 Can. Geotech. J. Vol. 44, 2007
# 2007 NRC Canada
Brooks, R.H., and Corey, A.T. 1964. Hydraulic properties of por-ous media. Hydrology Paper No. 3, Colorado State University,Fort Collins, Co.
Burnotte, F., Lefebvre, G., Cabral, A., Audet, C., and Veilleux, A.2000. Use of deinking residues for the final cover of a MSWlandfill. In Proceedings of the 53rd Canadian Geotechnical Con-ference, Montreal, 15–18 October 2000. BiTech Publishers Ltd.,Richmond, B.C. Vol. 1, pp. 585–591.
Cabral, A.R., Lefebvre, G., Burnotte, F., Panarotto, C.T., and Pas-tore, E. 1999. Use of pulp and paper residues as an alternativecover material to landfill and to acid generating tailings. In 28Seminario de Meio Ambiente em Industrias de Processo, SaoPaulo, Brazil, 29–30 June 1999. Associacao Brasileira Tecnicade celulise e papel. pp. 56–70.
Cabral, A.R., Planchet, L., Marinho, F.A., and Lefebvre, G. 2004.Determination of the soil water characteristic curve of highlycompressible materials: Case study of pulp and paper by-product.Geotechnical Testing Journal, 27: 154–162.
Childs, E.C., and Collis-George, G.N. 1950. The permeability ofporous materials. In Proceedings of the Royal Society of Lon-don, Series A. London, UK. pp. 392–405.
Fredlund, D.G. 2002. Use of soil-water characteristic curve in theimplementation of unsaturated soil mechanics. In Proceedingsof the 3rd International Conference on Unsaturated Soils,Recife, Brazil, 20–23 March 2002. Edited by J.F.T. Juca,T.M.P. Campos, and F.H.A. Marinho. A.A. Belkema, the Neth-erlands.
Fredlund, D.G., and Rahardjo, H. 1993. Soil mechanics for unsatu-rated soils. John Wiley & Sons, N.Y.
Fredlund, D.G., and Xing, A.Q. 1994. Equations for the soil-watercharacteristic curve. Canadian Geotechnical Journal, 31: 521–532.
Fredlund, D.G., Xing, A.Q., and Huang, S.Y. 1994. Predicting thepermeability function for unsaturated soils using the soil-watercharacteristic curve. Canadian Geotechnical Journal, 31: 533–546.
Fredlund, M.D., Wilson, G.W., and Fredlund, D.G. 2002. Use ofthe grain-size distribution for estimation of the soil-water char-acteristic curve. Canadian Geotechnical Journal, 39: 1103–1117.doi:10.1139/t02-049.
Huang, S. 1994. Evaluation and laboratory mesurement of the coef-ficient of permeability in deformable unsaturated soils. Ph.D.thesis, Department of Civil Engineering, University of Saskatch-ewan, Saskatoon, Sask.
Huang, S.Y., Barbour, S.L., and Fredlund, D.G. 1998. Developmentand verification of a coefficient of permeability function for adeformable unsaturated soil. Canadian Geotechnical Journal, 35:411–425. doi:10.1139/cgj-35-3-411.
Kamon, M., Inazumi, S., Rajasekaran, G., and Katsumi, T. 2002.Evaluation of waste sludge compatibility for landfill cover appli-cation. Journal of the Japanese Geotechnical Society of Soilsand Foundations, 42: 13–27.
Kawai, K., Karube, D., and Kato, S. 2000. The model of water reten-tion curve considering effects of void ratio. In Unsaturated soilsfor Asia. Edited by H. Rahardjo, D.G. Toll, and E.C. Leong.A.A. Balkema, Rotterdam, the Netherlands. pp. 329–334.
Khalili, N., Geiser, F., and Blight, G.E. 2004. Effective stress inunsaturated soils: Review with new evidence. International Jour-nal of Geomechanics, 4: 115–126. doi:10.1061/(ASCE)1532-3641(2004)4:2(115).
Kraus, J.F., Benson, C.H., Van Maltby, C., and Wang, X. 1997.Laboratory and field hydraulic conductivity of three compactedpaper mill sludges. Journal of Geotechnical and Geoenviron-mental Engineering, 123: 654–662. doi:10.1061/(ASCE)1090-0241(1997)123:7(654).
Lapierre, C., Leroueil, S., and Locat, J. 1990. Mercury intrusionand permeability of Louiseville clay. Canadian GeotechnicalJournal, 27: 761–773.
Leong, E.C., and Rahardjo, H. 1997a. Review of soil-water charac-teristic curve equations. Journal of Geotechnical and Geoenvir-onmental Engineering, 123: 1106–1117. doi:10.1061/(ASCE)1090-0241(1997)123:12(1106).
Leong, E.C., and Rahardjo, H. 1997b. Permeability functions forunsaturated soils. Journal of Geotechnical and Geoenvironmen-tal Engineering, 123: 1118–1126. doi:10.1061/(ASCE)1090-0241(1997)123:12(1118).
McCartney, J.S., and Zornberg, J.G. 2005. The centrifuge permea-meter for unsaturated soils. In Proceedings of the InternationalSymposium on Advanced Experimental Unsaturated Soil Mcha-nics, Experus 2005, Trento, Italy, 27–29 June 2005. Edited byA. Tarantino, E. Romero, and Y.J. Cui. pp. 299–304.
Moo-Young, H.K., Jr., and Zimmie, T.F. 1996. Effects of freezingand thawing on the hydraulic conductivity of paper mill sludgesused as landfill covers. Canadian Geotechnical Journal, 33: 783–792.
Mualem, Y. 1976. A new model for predicting the hydraulic con-ductivity of unsaturated porous media. Water Resources Re-search, 12: 513–522.
Nemati, M.R., Caron, J., and Gallichand, J. 2000. Using paper de-inking sludge to maintain soil structural form: Field measure-ments. Soil Science Society of America Journal, 64: 275–285.
Nemati, M.R., Caron, J., Banton, O., and Tardif, P. 2002. Deter-mining air entry value in peat substrates. Soil Science Societyof America Journal, 66: 367–373.
Panarotto, C.T., Robart, G., Cabral, A., Chartier, R., Burnotte, F.,and Lefebvre, G. 1999. Using deinking residues in cover sys-tems. In Proceedings of the 7th International Waste Managementand Landfill Symposium, 4–8 October 1999, S. Margherita diPula, Cagliari, Sardinia, Italy. Vol. III, pp. 357–364.
Paquet, J.M., Caron, J., and Banton, O. 1993. Insitu determinationof the water desorption characteristics of peat substrates. Cana-dian Journal of Soil Science, 73: 329–339.
Parent, S.-E., Cabral, A., Dell’Avanzi, E., and Zornberg, J.G. 2004.Determination of the hydraulic conductivity function of a highlycompressible material based on tests with saturated samples.Geotechnical Testing Journal, 27: 1–5.
Planchet, L. 2001. Utilisation des residus de desencrage commebarriere capillaire et evapotranspirative (ET) pour les parcs a re-sidus miniers producteurs de DMA. M.Sc.A. thesis, Universitede Sherbrooke, Sherbrooke, Que.
Price, J.S., and Schlotzhauer, S.M. 1999. Importance of shrinkageand compression in determining water storage changes in peat:the case of a mined peatland. Hydrological Processes, 13: 2591–2601. doi:10.1002/(SICI)1099-1085(199911)13:16<2591::AID-HYP933>3.0.CO;2-E.
Ratkowski, D.A. 1989. Handbook of nonlinear regression models.Marcel Dekker, N.Y.
Schlotzhauer, S.M., and Price, J.S. 1999. Soil water flow dynamicsin a managed cutover peat field, Quebec: Field and laboratoryinvestigations. Water Resources Research, 35: 3675–3683.doi:10.1029/1999WR900126.
Simms, P.H., and Yanful, E.K. 2002. Predicting soil-water charac-teristic curves of compacted plastic soils from measured pore-size distributions. Geotechnique, 52: 269–278.
Smith, K.A., and Mullins, C.E. 2001. Soil and environmental ana-lysis: physical methods. Marcel Dekker, N.Y.
TheMathWorks. 2004. MATLAB: Technical computing languageand interactive environment for algorithm development, data vi-sualization, data analysis, and numeric computation. Natick, Mass.
Parent et al. 1213
# 2007 NRC Canada
Toll, D.G. 1988. The behaviour of unsaturated compacted naturallyoccurring gravel. Thesis Imperial College of Science, Medicineand Technology, University of London.
van Genuchten, M.T. 1980. A closed-form equation for predictingthe hydraulic conductivity of unsaturated soils. Soil Science So-ciety of America Journal, 44: 892–898.
van Genuchten, M.T., Leij, F.J., and Yates, S.R. 1991. The RETCcode for quantifying the hydraulic functions of unsaturated soils,Report EPA/600/S2–91/065, U.S. Department of Agriculture,Agriculture Research Service. National Risk Management La-boratory, Office of Research and Development, U.S. Environ-mental Protection Agency, Cincinnati, Ohio. 103 pp.
Vanapalli, S.K., Fredlund, D.G., and Pufahl, D.E. 1999. The influ-ence of soil structure and stress history on the soil-water charac-teristics of a compacted till. Geotechnique, 49: 143–159.
Weiss, R., Alm, J., Laiho, R., and Laine, J. 1998. Modeling moist-ure retention in peat soils. Soil Science Society of America Jour-nal, 62: 305–313.
Zhuang, J., Jin, Y., and Miyazaki, T. 2001. Estimating water reten-tion characteristic from soil particle-size distribution using anon-similar media concept. Soil Science, 166: 308–321. doi:10.1097/00010694-200105000-00002.
1214 Can. Geotech. J. Vol. 44, 2007
# 2007 NRC Canada


![arXiv:0905.2872v1 [math.AP] 18 May 2009 · QIANGCHANG JU, FUCAI LI, AND HAILIANG LI Abstract. The quasineutral limit of compressible Navier-Stokes-Poisson sys-tem with heat conductivity](https://cdn.vdocuments.site/doc/165x107/5f6db2d85b65474dbd47d08b/arxiv09052872v1-mathap-18-may-2009-qiangchang-ju-fucai-li-and-hailiang-li.jpg)

