
Betsy McCall
1
Venn Diagrams and Set Notation
This handout illustrates the relationship between Venn diagrams and set notation. We’ll begin with the basics, and then we’ll work our way up to more complicated situations. This first section includes some basic notation and definitions with one or two sets. Set Notation Venn Diagram
𝐴
“Set A”
𝐴𝑐 “A complement” or
“Not A”
The above graphs illustrate how Venn diagrams can be used to talk about the whole set or group at once: everything in A, or everything not in A. Venn diagrams can also be used to talk about specific elements in a set, as shown in the next couple of examples. We start with the most general case, and then we’ll look at a specific example.
𝑨
𝑨

Betsy McCall
2
𝑥 𝜖 𝐴 “𝑥 is an element of
A” or “𝑥 in A”
𝑥 ∉ 𝐴 “𝑥 is not an element of A” or “𝑥 not in A”
We can also use Venn diagrams to display all the individual numbers in a set when the list is finite. For instance, suppose the Universal Set is all the integers between 1 and 10 (inclusive); i.e. {1,2,3,4,5,6,7,8,9,10}. If set A is the set of even numbers, we can illustrate this as shown below (we use set-builder notation here). This will be especially helpful when we compare two or more sets.
𝐴 = {𝑥|𝑥 is an even number between 1
and 10}.
“A is the set where 𝑥 is defined to be an
even number between 1 and 10”
or “A is the set of all 𝑥
such that 𝑥 is an even number
between 1 and 10”
Venn diagrams can be used to display the relationship between sets. We first look at the subset relationship.
𝑨
𝑥
𝑨
𝑥
𝑨
2, 4, 6, 8, 10
1, 3, 5, 7, 9
Betsy McCall
3
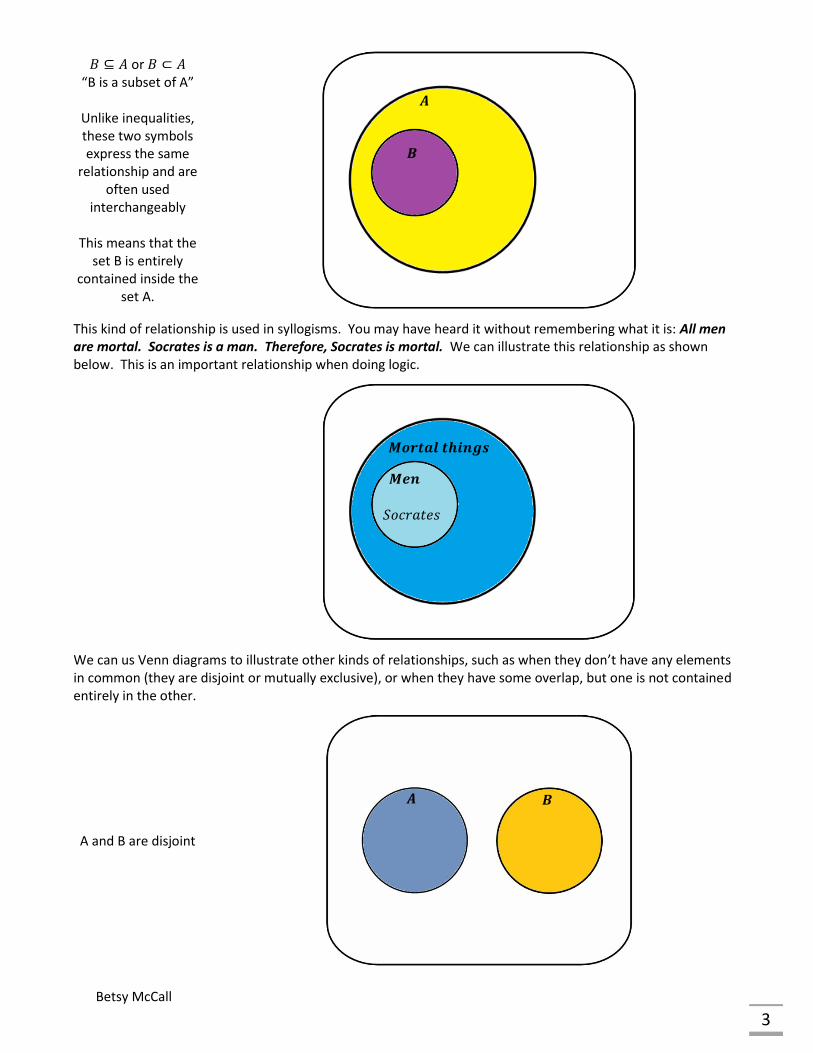
𝐵 ⊆ 𝐴 or 𝐵 ⊂ 𝐴 “B is a subset of A”
Unlike inequalities, these two symbols express the same
relationship and are often used
interchangeably
This means that the set B is entirely
contained inside the set A.
This kind of relationship is used in syllogisms. You may have heard it without remembering what it is: All men are mortal. Socrates is a man. Therefore, Socrates is mortal. We can illustrate this relationship as shown below. This is an important relationship when doing logic.
We can us Venn diagrams to illustrate other kinds of relationships, such as when they don’t have any elements in common (they are disjoint or mutually exclusive), or when they have some overlap, but one is not contained entirely in the other.
A and B are disjoint
𝑨
𝑩
𝑴𝒐𝒓𝒕𝒂𝒍 𝒕𝒉𝒊𝒏𝒈𝒔
𝑆𝑜𝑐𝑟𝑎𝑡𝑒𝑠
𝑴𝒆𝒏
𝑨 𝑩

Betsy McCall
4
A and B are not disjoint
We may use Venn diagrams to help us organize problems before we know if A and B are disjoint. In such cases, it’s better to assume there is an overlap (they are not disjoint). If the overlapping region turns out to contain no elements, the intersection is said to be empty. We’ll deal with intersections and union of two sets next.
𝐴 ∪ 𝐵
“A union B” or “the set of all elements in
either A or B”
𝐴 ∩ 𝐵
“A intersect B” or “the set of all
elements in both A and B”
The shaded regions in the previous two diagrams correspond to the meaning of union and intersection respectively. Let’s look at an example problem so we can see how this can be used with elements. Suppose we consider set A to be the set of all the letters in the name “McCall”, i.e. {𝑀, 𝐶, 𝐴, 𝐿} and the set B to be all the letters in the name “Clayton”, i.e. {𝐶, 𝐿, 𝐴, 𝑌, 𝑇, 𝑂, 𝑁}. (Note that we don’t repeat letters used more than once.) What is 𝐴 ∪ 𝐵, and what is 𝐴 ∩ 𝐵?
𝑨 𝑩
𝑨 𝑩
𝑨 𝑩

Betsy McCall
5
𝐴 ∪ 𝐵 = {𝐴, 𝐶, 𝐿, 𝑀, 𝑁, 𝑂, 𝑇, 𝑌}
𝐴 ∩ 𝐵 = {𝐴, 𝐶, 𝐿}
There is one more set notation that can be useful for expressing relationships between sets that is somewhat complicated to express with just the symbols we have so far.
𝐴 − 𝐵 or
𝐴 ∩ 𝐵𝑐
“A minus B” or “All the elements in A
that are not also in B”
In the illustration above, the orange area is the area of overlap (where set A is shaded red, and set 𝐵𝑐 is shaded yellow). Compare this region to the pink region in the diagram above it. It’s the same region. This notation isn’t a necessary one, but because we are familiar with the idea of subtraction, it can make these ideas easier to think about. We can now also combine notations, as we did with the above example, and generate other combinations of Venn diagrams, even with just the two sets. Things get much more interesting when we introduce a third set (or more). Aside from the complementation rule, all set notation operates on just two sets at a time, so we can build up to more complicated ideas from just these simple elements. [Note: normally, you will set parentheses around pairs of sets with an operator between them like: (𝐴 ∩ 𝐵) ∪𝐶, just like we do for many arithmetic problems, but not allways. Like arithmetic operations, set notation also has an order of operations: parentheses, complementation, intersection, and union. When we calculate probabilities, we’ll see some of the reasons why this order applies. If the parentheses are not present, then (𝐴 ∩ 𝐵) ∪ 𝐶 = 𝐴 ∩ 𝐵 ∪ 𝐶 are the same thing (since we do intersection first), and 𝐴 ∪ 𝐵 ∪ 𝐶 the order doesn’t
𝐴
𝐶
𝐿
𝑨 𝑩
𝑀
𝑌
𝑇
𝑂
𝑁
𝐵, 𝐷, 𝐸, 𝐹, 𝐺, 𝐻, 𝐼, 𝐽, 𝐾, 𝑃, 𝑄, 𝑅, 𝑆, 𝑈, 𝑉, 𝑊, 𝑋, 𝑍
𝑨 𝑩
𝑨 𝑩

Betsy McCall
6
matter since they are all the same, so choose any two to beging. In 𝐴 ∪ 𝐵𝑐, complementation comes first, and then do the union operation.]
𝐴 ∪ 𝐵 ∪ 𝐶
“A union B union C” or “all the elements in either sets A, B or
C”
𝐴 ∩ 𝐵 ∩ 𝐶
“A intersect B intersect C” or “all
the elements in A, B and C”
(𝐴 ∩ 𝐵) ∪ 𝐶
“A intersect B, union C” or “all the
elements shared by A and B, or is an element of C”
Let’s also just look at two examples with 4 sets.
(𝐴 ∪ 𝐵) ∩ (𝐶 ∪ 𝐷)
𝑨 𝑩
𝑪
𝑨 𝑩
𝑪
𝑨 𝑩
𝑪
𝑨 𝑩
𝑪 𝑫

Betsy McCall
7
The overlapping region in the middle shade of green is the resulting set (each union operation is shaded the same color: 𝐴 ∪ 𝐵 in the bluish shade, and 𝐶 ∪ 𝐷 in the yellower shade of green).
(𝐴 ∪ 𝐵)𝑐 − (𝐶 ∪ 𝐷)
In this last example the bright yellow region is the resulting set. All the shaded region was (𝐴 ∪ 𝐵)𝑐, and then we removed any additional elements in (𝐶 ∪ 𝐷) represented by the beige regions.
𝑨 𝑩
𝑪 𝑫


