
Vehicle energy efficiencies
IEA EGRD Workshop“Mobility: Technology Priorities and Strategic Urban Planning
Nils-Olof NylundVTT Technical Research Centre of Finland
Photo: VW

224/05/2013
Outline
General introductionWays to reduce fuel consumption
engine technologyreduced need for powerelectrification
Trends forpassenger carsbusesheavy-duty trucks
ICE vs. EVSummary

324/05/2013
Elements determiningthe environmental impacts of traffic
Community structure
Traffic volumes &choice of transport mode
Energy for transport
Vehicles and userbehaviour
Policy orientation Technology orientation

424/05/2013
Formation and control of CO2 emissions
* *Total emissionsTotal emissions Transport work(km)*
Transport work(km)*
Energy use(MJ/km)*
Energy use(MJ/km)*
Carbon intencity(g CO2/MJ)
Carbon intencity(g CO2/MJ)
Reduction oftraffic flows
Energy efficiencyEnergy efficiency& modal shift
Renewableenergy
Measures forreduction
*passenger/tonkilometre

5
Environmental friendlinessMulti-dimensional contemplation
A fluent intelligent transport systemService and safety
LocalemissionsNOx, PM
CO2emissions
Energyconsumption
Noise

624/05/2013
Current status of vehicles
The current passenger car is:reliablecomfortablerelatively safeenvironmentally friendly regarding regulated emissionsin most cases a ”high-performance” vehicle
What should be improved?fuel efficiencythe ability to use renewable or CO2-neutral energyrational use of cars
Traditionally heavy-duty vehicles have been fuel efficient but dirty, but with the JPN 2009, US2010 and Euro VI emission regulations the situation will change
724/05/2013
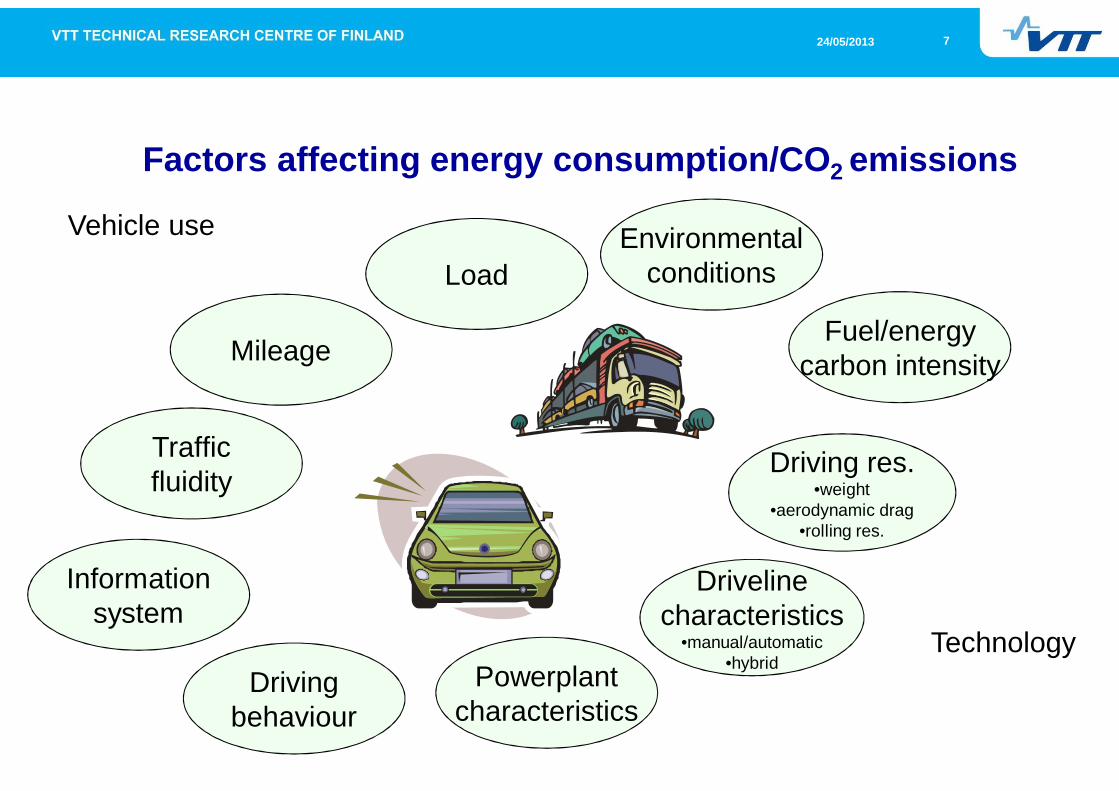
Factors affecting energy consumption/CO2 emissions
Mileage
Drivingbehaviour
Environmentalconditions
Powerplantcharacteristics
Load
Drivelinecharacteristics
•manual/automatic•hybrid
Driving res.•weight
•aerodynamic drag•rolling res.
Fuel/energycarbon intensity
Informationsystem
Trafficfluidity
Vehicle use
Technology

824/05/2013
Technical tool box for a cleaner future
Improved engine technologiesCombustion, AMT
Reduced need for powerAMT
HybridisationHEV
ElectrificationHEV, AFC
Fuel cell technologyAFC, HEV, Hydrogen
Alternative fuelsAMF, Bioenergy, Combustion, Hydrogen

924/05/2013
Improving engine efficiency
For all ICE types the pathway into the future includes :reducing the physical size of the engine andincreasing relative load (”downsizing”)improving boosting technologiesimplementation of direct fuel injectionreduction of frictionincrease in control parameterspowerful control systemselectrification of auxiliaries
The main challengesimultaneous reduction of fuel consumption and regulated exhaust emissions
Future possibilitiescombining the best features of Diesel and Otto (spark-ignited) engineswaste heat recovery(with a focus on heavy-duty engines)

Future Demand and QualityKenneth D Rose (CONCAWE)Reproduction permitted
with due acknowledgement10
Reducing CO2 Adds Cost to Vehicle Powertrain
Diesel
Gasoline
Hybrids
Euro 4/5 Gasoline
Euro 4/5 Diesel
Percentage Cost Increase (relative to Euro 4 Petrol Engine)
Perc
enta
ge N
EDC
CO
2Im
prov
emen
t (r
elat
ive
to E
uro
4 Pe
trol
Eng
ine)
Source: Ricardo analysis communicated to CONCAWE (2008)

1124/05/2013
Effect of engine type and curb weight onpassenger car fuel consumption

1224/05/2013
Reducing the need for power
We should reduce curb weight, rolling resistance and aerodynamic drag
Weight reduction can be acheved through reduction of size (passenger cars) and by utilizing lighter materials (all types of vehicles):
high-strength steelsaluminium and aluminium alloysmagnesium and magnesium alloystitanium and titanium alloyscarbon fiber compositesnanocomposites
The effect of weight:For passenger cars a weight reduction of 10 % reduces fuel consumption some6 – 7 %. For buses 1,000 kg of added weight as curb weight or passengers increases fuel consumption some 2.5 l/100 km (6 %) in city driving (e.g. Helsinki)
Aerodynamic drag becomes significant at higher speeds

1324/05/2013
More small cars needed?
smorvette
smerrari
smamborgini
smorsche

1424/05/2013
60 ton Tractor & Trailer, Full Payload, Freeway at 80 km/h
68 kW 41 % 12 kW 7 % 168 kW 100 %15 kW 9 %
371 kW100 %97 kW
82 kW
26 %
22 %193 kW52 %
15 kW
11 kW
4 %
4 %168 kW44 %
64 kW 38 %
142 kW 79 %
371100 %
20455 %
16844 %
100 %
154 %9 %
123 %7 %
10835 %77 %
6818 %41 %
6417 %38 %
kW
10 kW 6 %
103 %6 %
+
60 000 kg
44,5 L/100km
CombinedTotalMass
“Hysteresis” = irreversible losses in uphill/downhill driving
Heat Rejection
Losses CycleEfficiency
GasExchange
Losses EngineEfficiency
Fuel Feed in
Rolling Resistance Driveline & Tyre Losses
Engine OutAuxiliaries
ExhaustHeat
Internal Friction & Engine Accessories
Air Drag
Traction Work
“Hysteresis”
Fuel-feed
EngineLosses
EngineOut
Auxili-aries
DivelineLosses
TractionWork
RollingResistances
AirDrag
“Hyste-resis”

1524/05/2013
Improving aerodynaomics of HD vehicles
30 % smaller drag: fuel savings10 – 15 %

Steiner/VW 2010
17
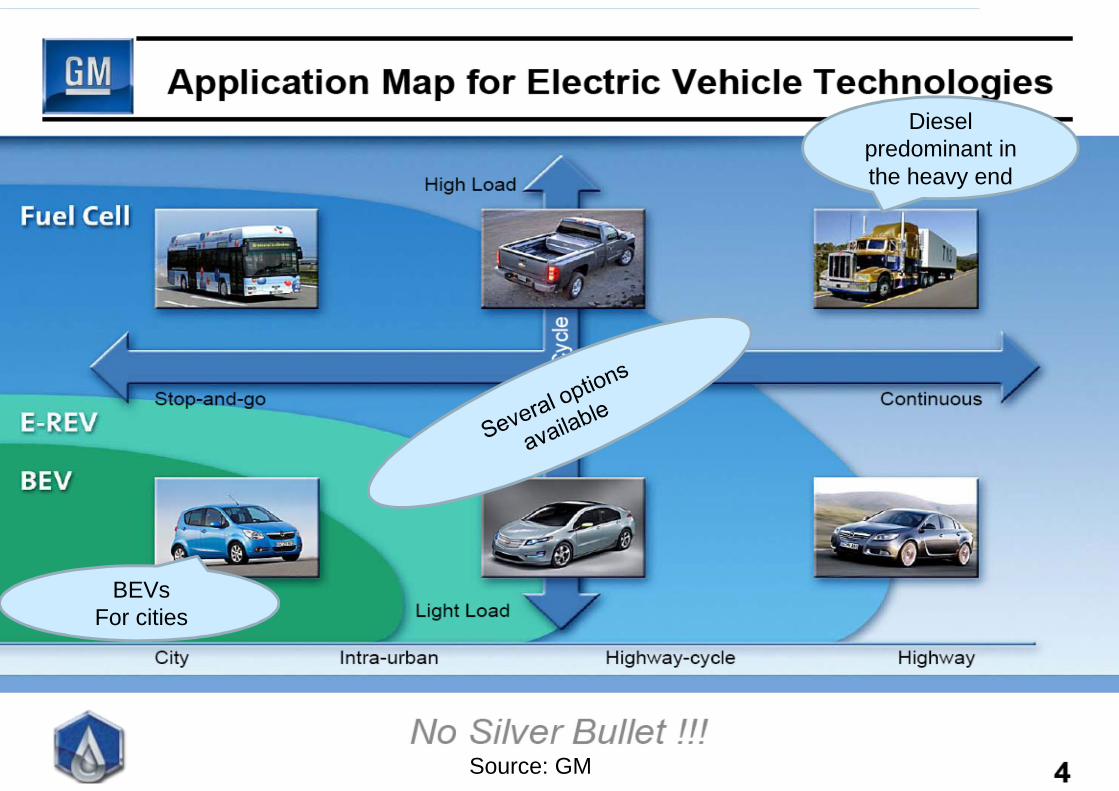
Source: GM
Diesel predominant in the heavy end
BEVsFor cities

1824/05/2013
Key technical measures to promote energy efficiencyfor various vehicle classes
Passenger cars:smaller and lighter vehiclesreduced performancehybridization, electrification
City buses:reduced weighthybridization, electrification
HD trucks for highway useimproved aerodynamics

19
Source: Tanaka/Toyota 2011
95 g/km(~4.0 l petrol
/100 km)
Development of CO2 limit values for passenger cars

2024/05/2013
Development of passenger car CO2 emissions in Europe
185 g CO2 ~ 7.9 l petrol/100 km140 g CO2 ~ 6.0 l petrol/100 km

Photo: Volvo Cars
Volvo V40 T5 automatic8,1 l/100 km
185 g CO2/km
Volvo V40 D23,6 l/100 km
94 g CO2/km
I.e. a reduction of 49 %!
What is the fuel consumption of a Volvo V40 ?It depends!.....
O. Hådell 2008, mod. 2012
Pick thelow-hanging
fruit first!

2224/05/2013
Technical progress
Displacement (l) 1.6 1.5 3.0 twin-turboMax output (kW) 77 37 230Torque (Nm) 250 84 650Max speed (km/h) 192 144 250 (limited)Acceleration 0 – 100 km/h (s) 10.7 18 5.3Curb weight 1295 780 1930Fuel consumption (EU comb. l/100 km) 3.8 6.4 6.4CO2 emission (g/km) 99 169 169Particulate filter yes no yes
What would have happened if the technical potential would have been usedfor fuel efficiency only (keeping performance and weight constant)?
VW Golf I diesel 1976 Audi A6 Avant 2013VW Golf VII diesel 2013

IEA Technology Network Cooperation:Fuel and Technology Alternatives for Buses
Overall energy efficiency and emission performance
SAE 2012 Commercial Vehicle Engineering CongressOctober 2-3, 2012
Rosemont, Illinois USAKati Koponen & Nils-Olof Nylund
VTT Technical Research Centre of Finland
SAE 2012-01-1981

2424/05/2013
Energy consumption of European vehiclesBraunschweig cycle
18.815.8 16.4
14.9 15.212.6 12.7
11.3 10.9 10.7
21.1 20.0
16.4 15.6
0
5
10
15
20
25
MJ/
km
Energy Consumption - Braunschweig

2524/05/2013
Fuel savings through hybridizationEuropean vehicles
103
5844
31 3529
64
36 3226
32 2738 37
2718
8 8
0
20
40
60
80
100
120
NYBUS ADEME BRA JE05 UDDS WHVC
FC l/
100
km, F
uel s
avin
gs %
Conventional Vehicles vs. Hybrids
AVG EEV AVG HYBRID FUEL SAVINGS %

Volvo Technology CorporationFuels and Lubricants, Anders Röj
STV seminar, Helsinki, December 15th, 2008
26
Reduced fuel consumptionVolvo FH12, 40 ton in traffic

27
Tested fuel consumption of 38/40 t truck combinations

NVF 20100203
28
Instant feed-back on driving behaviour in the instrument cluster
Tips given when good and bad events have been detected
Evaluated situationsHill-drivingBrake useAnticipationGear selection
Summary mode
Source: Göran Lingström/Scania

29
NVF 20100203
Releases accelerator before passing crest
Goes downhill at selected speed
Uses momentum for next hill by accelerating before reaching
bottom
Begins to accelerate uphillBrakes to reduce downhill speedAccelerates past crest
Source: Göran Lingström/Scania
3024/05/2013
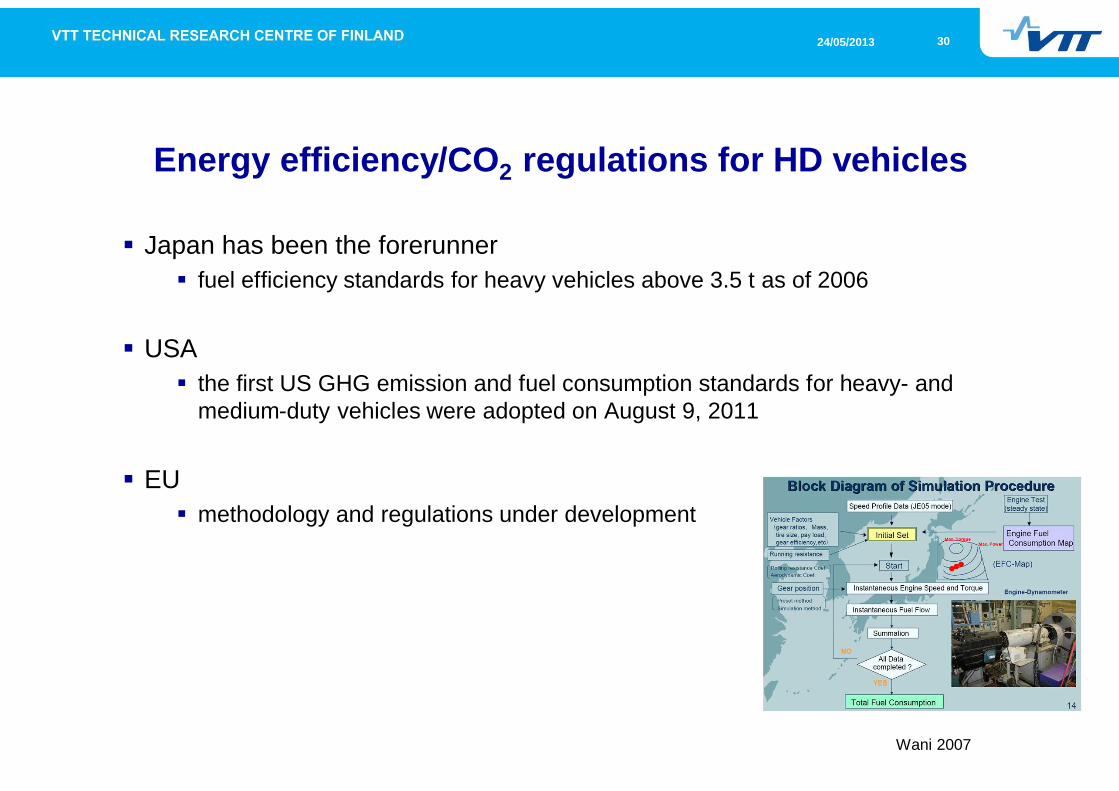
Energy efficiency/CO2 regulations for HD vehicles
Japan has been the forerunnerfuel efficiency standards for heavy vehicles above 3.5 t as of 2006
USAthe first US GHG emission and fuel consumption standards for heavy- and medium-duty vehicles were adopted on August 9, 2011
EUmethodology and regulations under development
Wani 2007

PERFORMANCE EVALUATION OF PASSENGER CAR, FUEL AND
POWERPLANT OPTIONS
IEA AMF Annex XLIII
IEA ExCo 44Jukka Nuottimäki
VTT Technical Research Centre of Finland

3224/05/2013
Annex 43:Content of the project
The core of the comparison consists of benchmarking a set of passenger cars of such make & model that offer multiple choices for engine, i.e. gasoline, flex-fuel, diesel, CNG/LPG and perhaps also some hybrid and EV variations
The project will also demonstrate the differences in efficiency arising from the engine type and size
The test matrix will allow some modulation of duty-cycle and ambient temperature in order to give more application/environment specific data
Making this kind of back-to-back comparison can ”neutralize” the vehicle itself from the equation, thus highlighting the role of the propulsion system
Combined to the results of the upstream fuel-cycle research conducted within the IEA Bus Project, this project can be enlarged to a comprehensive, full fuel-cycle evaluation

3324/05/2013
Finnish Results:Energy consumption of a medium sized vehicle on NEDC
Max 860 Wh/km (big gasoline engine), minimun 198 Wh/km (BEV)

3424/05/2013
Power generation profiles
Source: Ecofys 2010

3524/05/2013
Energy consumption EV vs. ICE
Electric vehicle Nissan Leafenergy consumption 0.21 kWh/km (motoring magazine TM 2012)transmission losses 5 % total energy consumption 0.22 kWh/km (well-to-wheel WTW, renewable electricity)total energy consumption 0.55 kWh/km (well-to-wheel WTW, gas turbine power plant)
Diesel car VW Golf 1.6 D Blue Motion Technology factual fuel consumption 5.0 l/100 km (own experience)energy consumption 1.80 MJ/km (0,50 kWh)total energy consumption 0.60 kWh/km (WTW)
Sources: Ecofys 2010, Climate Counter 2012
3624/05/2013
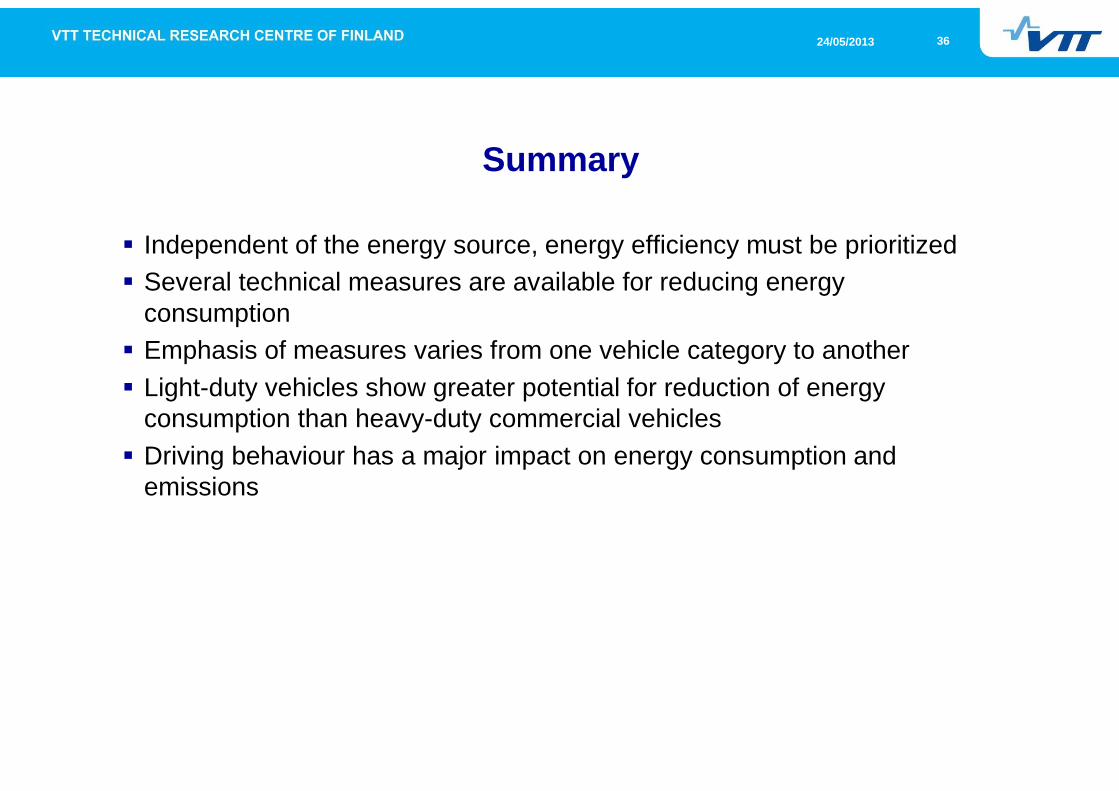
Summary
Independent of the energy source, energy efficiency must be prioritizedSeveral technical measures are available for reducing energy consumptionEmphasis of measures varies from one vehicle category to anotherLight-duty vehicles show greater potential for reduction of energy consumption than heavy-duty commercial vehiclesDriving behaviour has a major impact on energy consumption and emissions

3724/05/2013
VTT creates business from technology


