Using OMI cloud-sliced NO2 and GEOS-Chem to better understand dynamics of NOx in the upper troposphere
Eloise A. Marais University of Birmingham, UK
E. A. Marais, D. J. Jacob, S. Choi, J. Joiner, M. Belmonte-Rivas, R. C. Cohen, T. B.
Ryerson, A. J. Weinheimer, A. Volz-Thomas, L. T. Murray, V. Shah, L. Jaeglé, S. Beirlie
IGC8 Cambridge, MA 1 May 2017

Global UT OMI NO2: new dataset to better understand UT NOx
NO2 Atmosphere
NO2
Surface
APPROACH
[Choi et al., 2014]
Use cloud height variability to derive pseudoprofiles
NO2 VMR = DVCD
Dp ´
kBg
Rair
NO2 volume mixing ratio (VMR) between clouds at p1 and p2
Exploit differences in cloud height to retrieve partial NO2 columns (VCD) and calculate vertically resolved NO2 concentrations (VMR).
p1
p2 Cloud
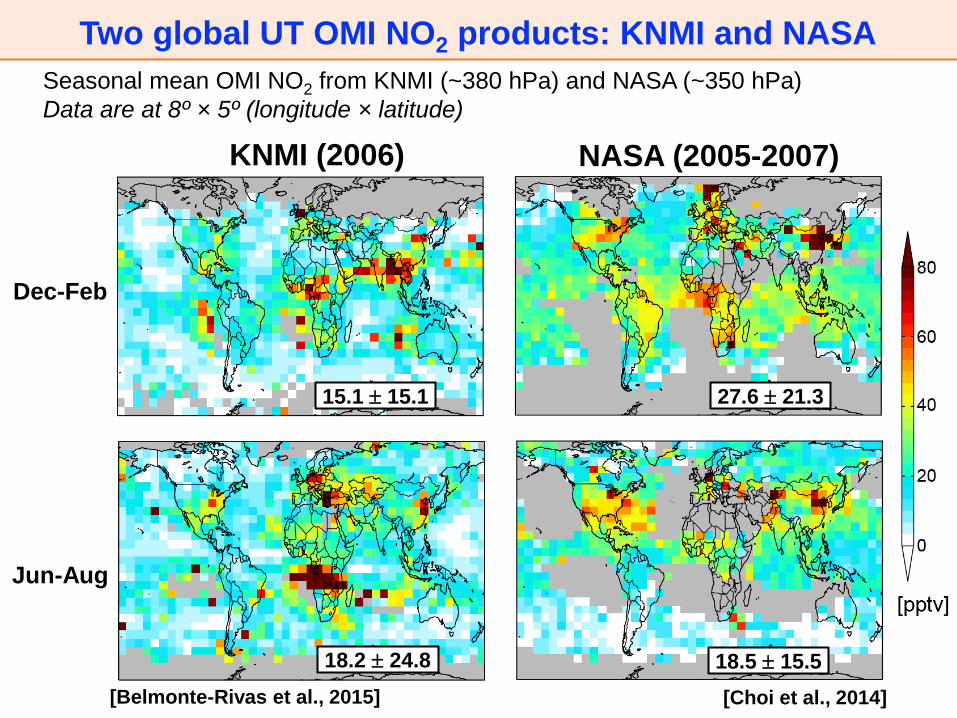
Two global UT OMI NO2 products: KNMI and NASA
[Choi et al., 2014] [Belmonte-Rivas et al., 2015]
Seasonal mean OMI NO2 from KNMI (~380 hPa) and NASA (~350 hPa)
Data are at 8º × 5º (longitude × latitude)
KNMI (2006) NASA (2005-2007)
Dec-Feb
Jun-Aug
15.1 15.1 27.6 21.3
18.2 24.8 18.5 15.5
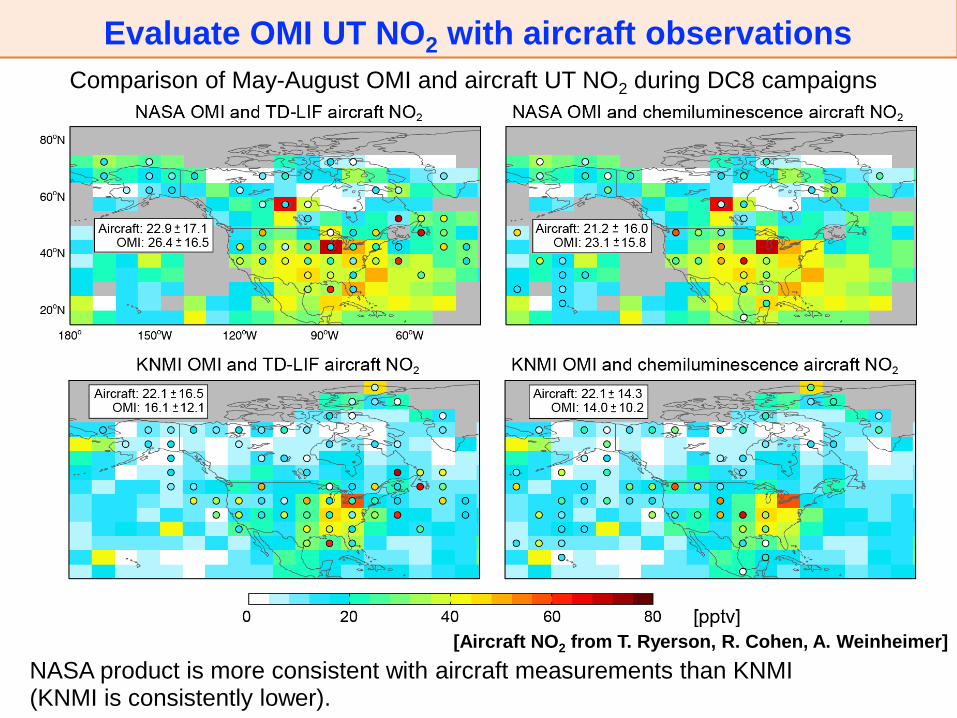
Evaluate OMI UT NO2 with aircraft observations
NASA product is more consistent with aircraft measurements than KNMI (KNMI is consistently lower).
Comparison of May-August OMI and aircraft UT NO2 during DC8 campaigns
[Aircraft NO2 from T. Ryerson, R. Cohen, A. Weinheimer]

Compare GEOS-Chem and NASA OMI UT NO2
BLUE: model too low RED: model too high
Difference between NASA OMI and GEOS-Chem UT NO2 (GEOS-Chem minus NASA)
Notable regional discrepancies
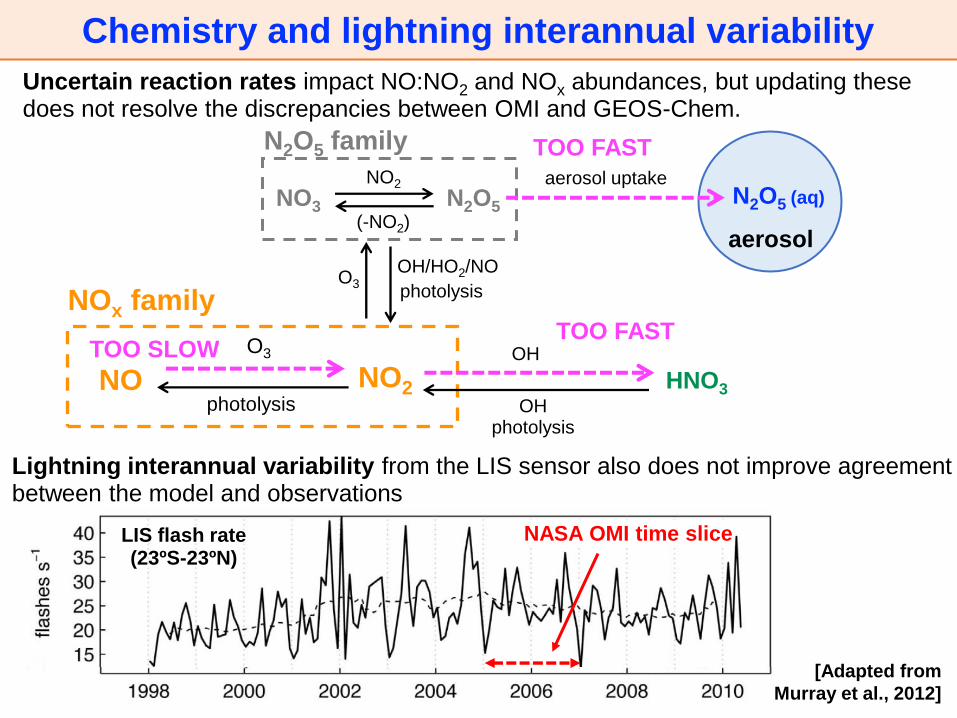
Chemistry and lightning interannual variability
NO2 NO photolysis
O3
NOx family
NO3
O3
OH/HO2/NO
N2O5
NO2
(-NO2)
N2O5 family
HNO3 OH
photolysis
OH
aerosol
N2O5 (aq) aerosol uptake
photolysis
TOO FAST
TOO FAST
TOO SLOW
Uncertain reaction rates impact NO:NO2 and NOx abundances, but updating these does not resolve the discrepancies between OMI and GEOS-Chem.
LIS flash rate (23ºS-23ºN)
NASA OMI time slice
Lightning interannual variability from the LIS sensor also does not improve agreement between the model and observations
[Adapted from
Murray et al., 2012]
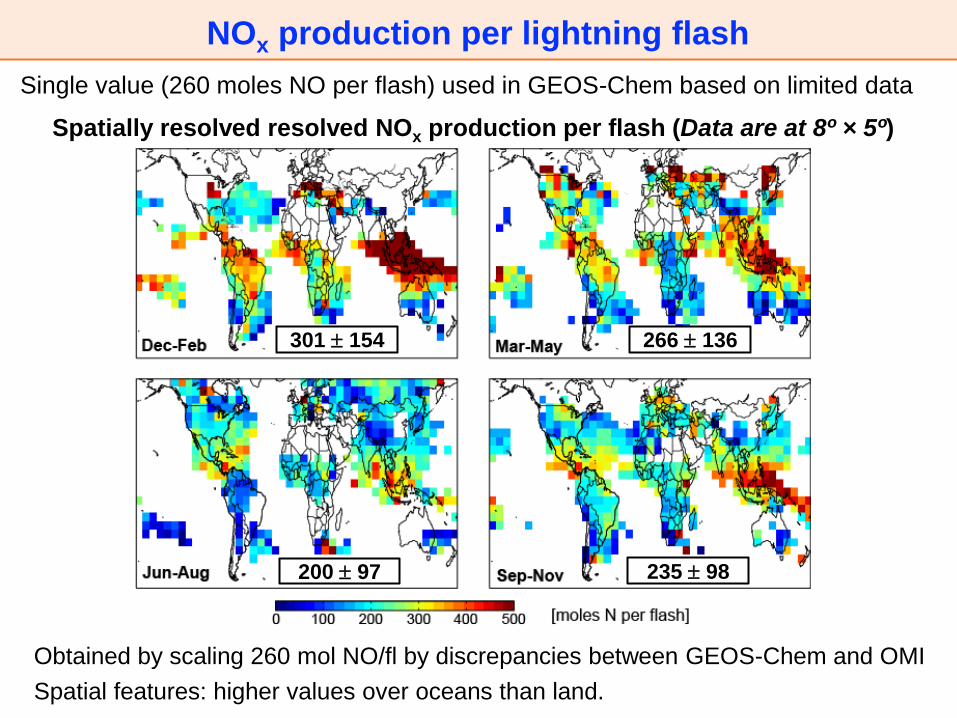
NOx production per lightning flash
Single value (260 moles NO per flash) used in GEOS-Chem based on limited data
Spatially resolved resolved NOx production per flash (Data are at 8º × 5º)
301 154 266 136
200 97 235 98
Obtained by scaling 260 mol NO/fl by discrepancies between GEOS-Chem and OMI
Spatial features: higher values over oceans than land.

NOx per flash as a function of lightning intensity
[Lighting flash footprint from Beirle et al. (2014)]
Large lightning footprint is associated with high flash intensity and long flash duration [Beirle et al., 2014]. The reason is not clear.
Linear relationship between lightning NOx production rate and flash footprint.
Potential to move towards a more mechanistic representation of NOx production rates.
Combine OMI-derived NO per flash and OTD- and LIS-derived lightning footprints
NOx production rate versus flash footprint LIS Lightning flash footprint
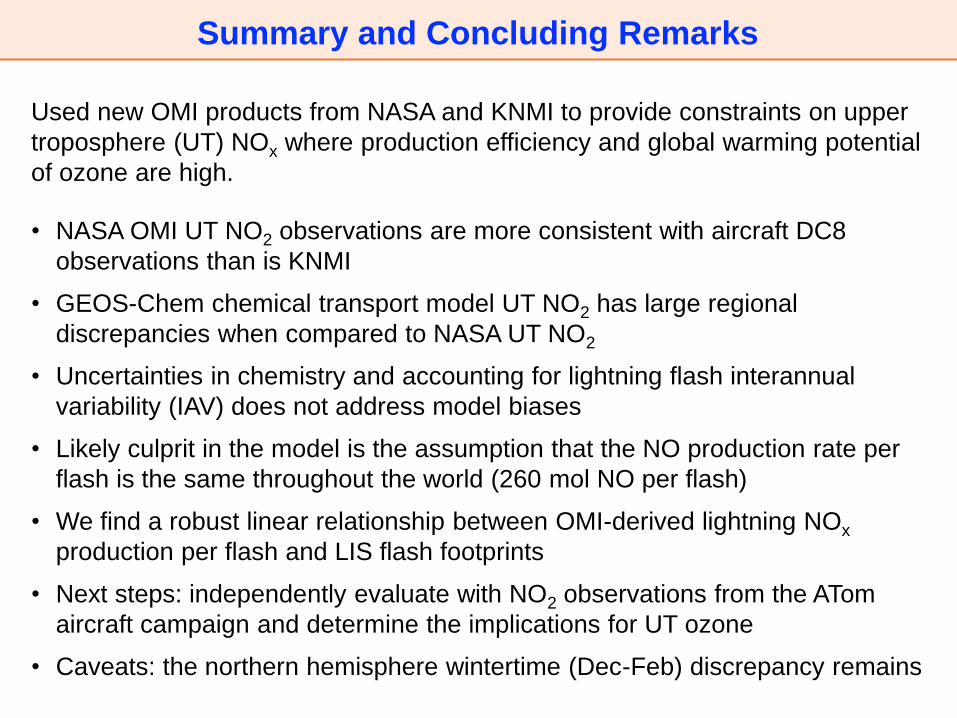
Summary and Concluding Remarks
Used new OMI products from NASA and KNMI to provide constraints on upper
troposphere (UT) NOx where production efficiency and global warming potential
of ozone are high.
• NASA OMI UT NO2 observations are more consistent with aircraft DC8
observations than is KNMI
• GEOS-Chem chemical transport model UT NO2 has large regional
discrepancies when compared to NASA UT NO2
• Uncertainties in chemistry and accounting for lightning flash interannual
variability (IAV) does not address model biases
• Likely culprit in the model is the assumption that the NO production rate per
flash is the same throughout the world (260 mol NO per flash)
• We find a robust linear relationship between OMI-derived lightning NOx
production per flash and LIS flash footprints
• Next steps: independently evaluate with NO2 observations from the ATom
aircraft campaign and determine the implications for UT ozone
• Caveats: the northern hemisphere wintertime (Dec-Feb) discrepancy remains
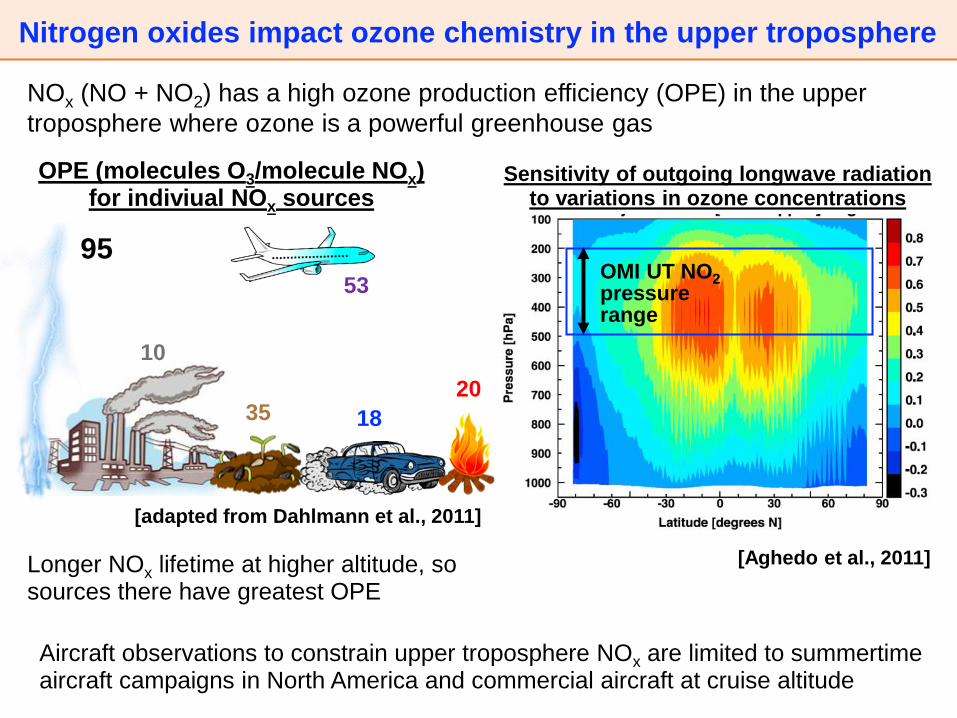
Nitrogen oxides impact ozone chemistry in the upper troposphere
NOx (NO + NO2) has a high ozone production efficiency (OPE) in the upper
troposphere where ozone is a powerful greenhouse gas
[Aghedo et al., 2011]
OMI UT NO2 pressure range
Aircraft observations to constrain upper troposphere NOx are limited to summertime aircraft campaigns in North America and commercial aircraft at cruise altitude
[adapted from Dahlmann et al., 2011]
Sensitivity of outgoing longwave radiation to variations in ozone concentrations
OPE (molecules O3/molecule NOx) for indiviual NOx sources
Longer NOx lifetime at higher altitude, so sources there have greatest OPE
95
10
53
35 18
20

Supplementary Slides
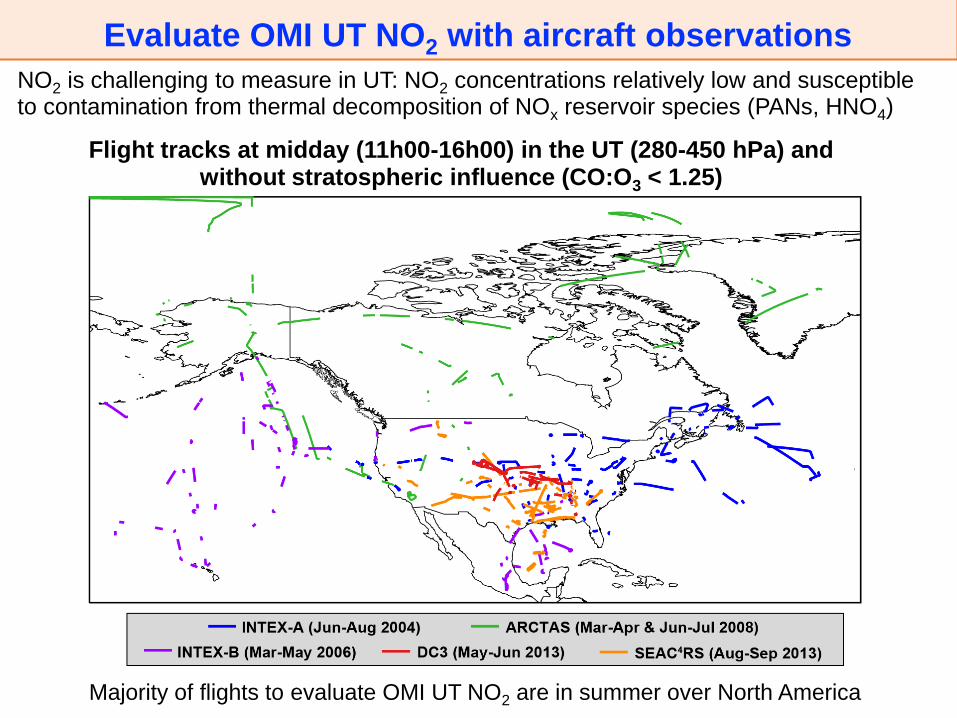
Evaluate OMI UT NO2 with aircraft observations
NO2 is challenging to measure in UT: NO2 concentrations relatively low and susceptible to contamination from thermal decomposition of NOx reservoir species (PANs, HNO4)
Flight tracks at midday (11h00-16h00) in the UT (280-450 hPa) and without stratospheric influence (CO:O3 < 1.25)
Majority of flights to evaluate OMI UT NO2 are in summer over North America
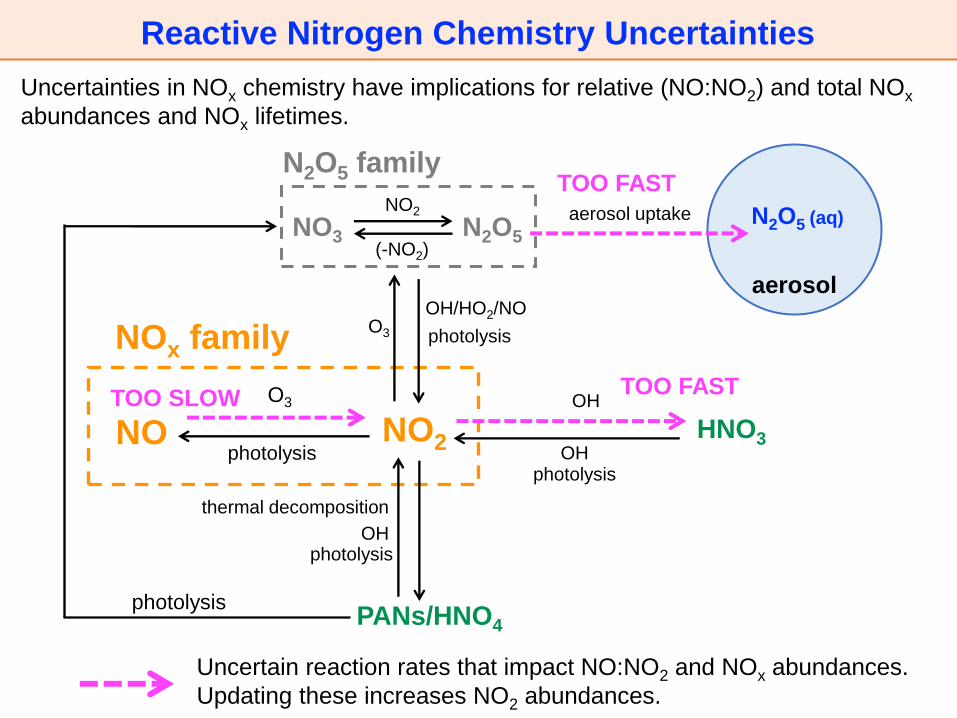
Reactive Nitrogen Chemistry Uncertainties
Uncertainties in NOx chemistry have implications for relative (NO:NO2) and total NOx
abundances and NOx lifetimes.
NO2 NO photolysis
O3
NOx family
NO3
O3
OH/HO2/NO
N2O5
NO2
(-NO2)
N2O5 family
PANs/HNO4
photolysis
thermal decomposition
OH
photolysis
HNO3 OH
photolysis
OH
Uncertain reaction rates that impact NO:NO2 and NOx abundances.
Updating these increases NO2 abundances.
aerosol
N2O5 (aq) aerosol uptake
photolysis
TOO FAST
TOO FAST
TOO SLOW
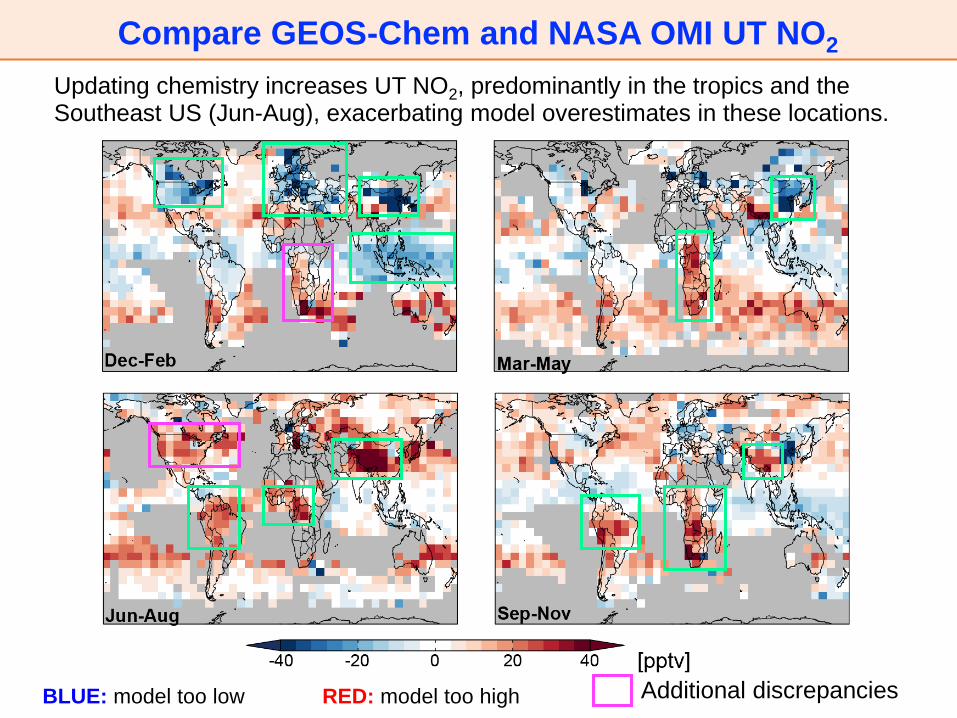
Compare GEOS-Chem and NASA OMI UT NO2
BLUE: model too low RED: model too high
Updating chemistry increases UT NO2, predominantly in the tropics and the Southeast US (Jun-Aug), exacerbating model overestimates in these locations.
Additional discrepancies
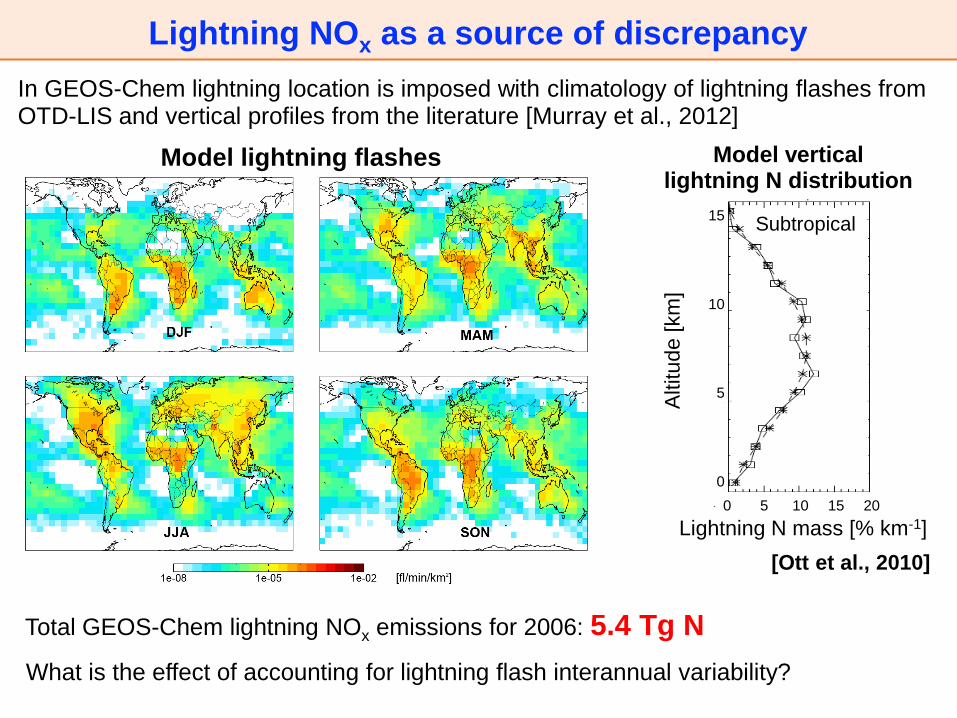
Lightning NOx as a source of discrepancy
Model vertical lightning N distribution
[Ott et al., 2010]
Subtropical
Lightning N mass [% km-1]
Altitude [km
]
15
10
5
0
0 5 10 15 20
Model lightning flashes
In GEOS-Chem lightning location is imposed with climatology of lightning flashes from OTD-LIS and vertical profiles from the literature [Murray et al., 2012]
Total GEOS-Chem lightning NOx emissions for 2006: 5.4 Tg N
What is the effect of accounting for lightning flash interannual variability?
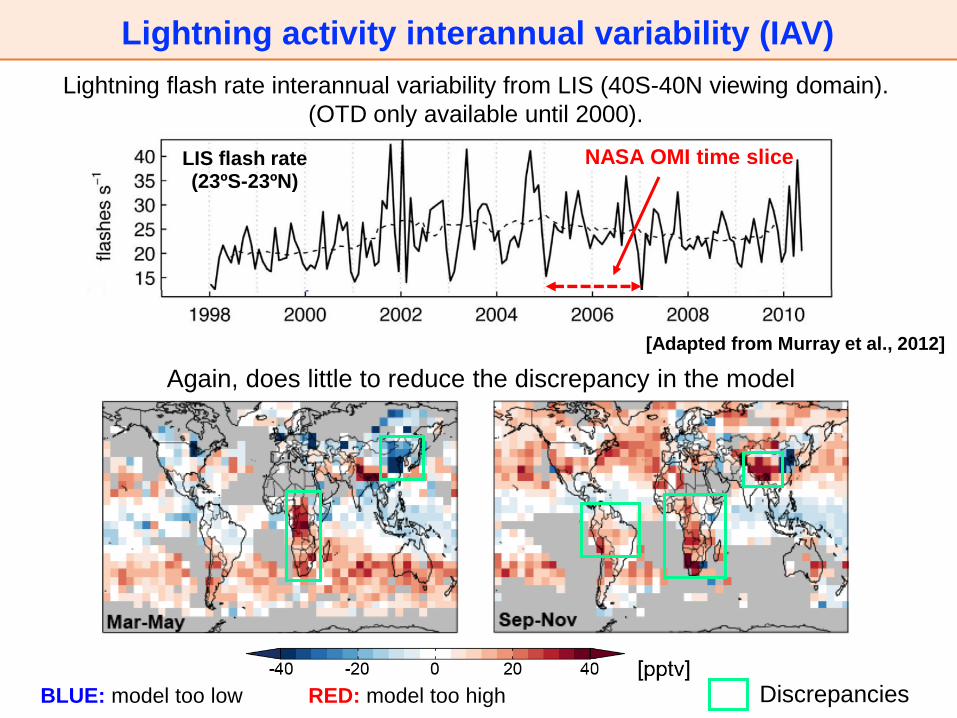
Lightning activity interannual variability (IAV)
Again, does little to reduce the discrepancy in the model
BLUE: model too low RED: model too high
[Adapted from Murray et al., 2012]
LIS flash rate (23ºS-23ºN)
NASA OMI time slice
Lightning flash rate interannual variability from LIS (40S-40N viewing domain).
(OTD only available until 2000).
Discrepancies


