Download - Urban India Infrastructure Report
:: Water Supply
:: Sewerage
:: Solid Waste Management
:: Storm Water Drains
:: Urban Roads
:: Urban Transport
:: Street Lighting
:: Traffic Support Infrastructure
Report on IndianUrban Infrastructure
and Services

Report on Indian Urban Infrastructure
and Services
March 2011

The High Powered Expert Committee (HPEC) for Estimating the Investment Requirements for Urban Infrastructure Services
ChairpersonDr. Isher Judge Ahluwalia,
Chairperson, Indian Council for Research on International Economic Relations
MemberShri Nasser Munjee,
Chairman, Development Credit Bank Limited
MemberDr. Nachiket Mor,
Chairman, IFMR Trust
MemberDr. M. Vijayanunni,
Former Chief Secretary, Kerala; Former Registrar General of India
MemberShri Sudhir Mankad, Former Chief Secretary, Government of Gujarat
MemberDr. Rajiv Lall,
Managing Director, Infrastructure Development Finance Corporation
MemberShri Hari Sankaran,
Vice Chairman and Managing Director, Infrastructure Leasing and Financial Services
MemberShri Ramesh Ramanathan,
Co-Founder, Janaagraha; National Technical Advisor of JNNURM
MemberProf. Om Prakash Mathur,
National Institute of Public Finance and Policy
Member SecretaryShri P. K. Srivastava,
Joint Secretary and Mission Director (JNNURM), Ministry of Urban Development,
Government of India

V
Preface
This Report on Indian Urban Infrastructure and Services is a result of over two years’ effort on the part of the High Powered Expert Committee (HPEC) for estimating the investment requirement for urban infrastructure services. The HPEC was set up by the Ministry of Urban Development in May, 2008, and I was invited to be the Chairperson of the Committee. The Committee’s Terms of Reference are presented in Annexure I.
The Report documents the nature of the urbanisation challenges facing India. Its central message is that urbanisation is not an option. It is an inevitable outcome of the faster rates of growth to which the economy has now transited. Indeed, urbanisation is itself a process that will support growth. The Committee has made recommendations on how to deal with these challenges of urbanisation.
The Committee has projected very large investment requirements for providing public services to specified norms and also supporting the growth process. The challenge of financing these investments is inextricably linked with the challenge of governing the cities and towns of India. The Committee has proposed a framework for governance and financing which will enable the municipal corporations, municipalities and nagar panchayats to discharge their responsibilities of delivering public services of specified standards to all including the poor. In doing so, they will have to be accountable to the people. Both the Government of India and state governments will have to play a major role in making this happen.
The members of the Committee have given their time generously, and we have also had enormous support from officials at all levels of government. I would particularly like to mention Dr M Ramachandran, former Secretary, Ministry of Urban Development, Mr Navin Kumar, current Secretary, Ministry of Urban Development and Ms Kiran Dhingra, Secretary, Ministry of Housing and Urban Poverty Alleviation, for their support to this Committee. Mr P K Srivastava, Joint Secretary and Mission Director (JNNURM) was also very helpful as Member Secretary in organising interactions with officials from state governments and urban local bodies and providing necessary information on plans and policies of the governments. The Committee has held several meetings with officials from the Government of India, state governments and local governments and also met with academicians and other stakeholders with interest and expertise in Indian urban issues.
The Committee was invited by the Asian Development Bank to Manila for an interaction with urban experts who briefed members on their assessment of the urbanisation experience in other Asian countries. The World Bank facilitated visits by delegations from South Africa and Brazil to Delhi to meet with the Committee members and share their experience of urbanisation in their countries. I would like to express the appreciation of the Committee to the managements of the ADB and the World Bank for making these exchanges in knowledge sharing possible.
VI
Reports like this one cannot be written without collective effort by a large number of persons. I would like to take this opportunity on behalf of the Committee to mention only a few names. First of all, I would like to record a special word of thanks to Dr P K Mohanty who provided very valuable professional and intellectual inputs and contributed ground level knowledge to the Committee’s work. Dr K P Krishnan and Mr Arbind Modi also gave their time generously in discussions and feedback to help the Committee resolve some of the complex issues in urban governance and financing. The Committee would like to put on record its thanks to Mr Arun Maira, Dr Kasturi Rangan, Dr Parthasarathi Shome, Dr Govinda Rao, Mr Anil Baijal, Mr Gajendra Haldea, Mr A K Mehta, Mr Vikram Kapur, Mr S K Lohia, Mr B I Singhal, Mr J B Kshirsagar, Mr Shankarnarayanan, Mr Dhinadayalan and Dr Dipak Roy Choudhury. Others who provided very useful inputs for the analysis and challenges of urbanisation in India included Dr Junaid Ahmed, Dr Patricia Annez, Dr Jessica Wallack, Prof Shivanand Swamy, Dr Bimal Patel, Mr O P Agarwal, Prof Srinivasa Chary, Ms Swati Ramanathan and Mr Shubhagato Dasgupta. Ms Elisa Muzzini of the World Bank helped with the preparation of the estimates of investment requirements.
I would like to acknowledge the professional contribution of Mr Ranesh R Nair who as a Consultant to the Committee for the past eighteen months helped with the preparation of the report. Dibyendu Samanta and Pavan Kumar Ankonapalli provided able research assistance. Shailee Raychaudhuri not only worked as a research assistant but also helped meticulously with editorial assistance. Shalini Shekhar provided editorial review and Deepa Gopalan provided secretarial support. I would like to thank Ajay Pereira and his team for the design and layout of the Report.
I am thankful to National Institute of Urban Affairs, particularly to its Director Prof Chetan Vaidya and Prof Usha Raghupathi who provided all assistance to the Committee in their capacity as secretariat to the Committee.
Isher Judge Ahluwalia Chairperson
VII
Contents
Abbreviations and Data Notes XIV
Summary and Recommendations XIX
Chapter-IUrbanisation and Economic Growth in India
1
1.1 Introduction 3
1.2 Economic growth and structural transformation 6
1.3 Contribution of migration from rural areas 10
1.4 Some evidence on urbanisation across the states of India 12
1.5 The challenge of urban poverty 16
1.6 Preparing India’s cities 18
i. Agglomeration vs congestion 18
ii. Creating synergy with rural development 20
1.7 Planning for urbanisation 22
1.8 JNNURM: An assessment 28
1.9 The Way Forward 35
1.10 Capacity Building 39
Chapter-IIThe State of Urban Service Delivery
41
2.1 Introduction 43
2.2 Service norms for Indian cities 43
2.3 State of urban service delivery 45
i. Water supply 46
ii. Sewerage and sanitation 50
iii. Solid waste management 53
iv. Urban transport and roads 56
2.4 Factors contributing to poor service delivery 61
i. Inadequate investments in urban infrastructure 61
ii. Poor maintenance of assets 62
iii. Fragmented institutional set up 62
iv. Capacity constraints 64
2.5 State of inclusive development 64
VIII
Chapter-IIIEstimates of Investment for Urban Infrastructure
67
3.1 Introduction 69
3.2 Methodology for urban infrastructure investment estimates 70
i. Service standards 72
ii. Data sources 73
iii. Per capita investment cost 73
iv. Computation of the service backlog 75
3.3 Estimates of investment in urban infrastructure: 2012-2031 75
i. Investment estimates for eight major sectors of urban infrastructure 75
ii. Investment estimates for urban infrastructure 78
iii. Investment for renewal and redevelopment including slums 78
iv. Investment for capacity building 79
3.4 Annual investment projections 80
3.5 Estimating operations and maintenance cost 82
Chapter-IVChallenges of Urban Governance
85
4.1 Introduction 87
4.2 Basic rules for local governance 88
4.3 Institutional framework for urban governance 89
4.4 Administrative reforms 92
i. Autonomy in city management 92
ii. Empowered Mayors with effective devolution 92
iii. One Ministry for Urban Affairs and Housing 94
iv. Convergence of institutional responsibilities 95
4.5 Reforming systems of delivery 96
i. Corporatisation of urban services 98
ii. Coming together to deliver 100
iii. Public private partnership 100
iv. Regulatory regime for urban services 102
v. Accountability and citizen participation 104
vi. e-Governance 105
4.6 Capacity building 107
4.7 Urban planning 111
4.8 Inclusion and focus on the poor 116
4.9 Fiscal reforms 117
i. Financial reporting, disclosures, and audits 118
ii. Fiscal devolution 119
IX
Chapter-VFinancing Urban Infrastructure
121
5.1 Introduction 123
5.2 Own revenue 126
i. Tax revenues: ‛Exclusive taxes’ for ULBs 131
a. Property tax 131
b. Profession tax 135
c. Entertainment tax 135
d. Advertisement tax/fee 135
e. Octroi and entry taxes 136
ii. Tax revenues: Other taxes 137
a. Motor vehicle tax 137
b. Stamp duty 138
iii. Tax revenues: ‛Revenue-shared taxes’ 138
iv. Non-tax revenues: User charges and fees 139
5.3 Inter-governmental transfers 143
5.4 External finance 145
i. Debt financing 145
ii. Public private partnership 147
iii. Role of financial intermediaries 148
5.5 Land-based financing instruments 149
5.6 Proposed financing framework 152
Boxes1.1 Varying Definitions of ‛Urban’ 4
1.2 Urbanisation and Growth: An International Perspective 5
1.3 Reshaping Economic Geography 19
1.4 JNNURM: An Introduction 29
1.5 JNNURM: An Agenda for Reform 30
2.1 State of Urban Water Service Delivery 46
2.2 Why Cities Should Deliver Continuous Water Supply 48
2.3 24x7 Water in Three Cities of Karnataka 49
2.4 State of Urban Sewerage and Sanitation 51
2.5 Alandur’s Sewerage Project with Citizen Participation 52
2.6 State of Solid Waste Management 53
2.7 A Report Card based on Municipal Solid Waste Rules 2000 in India 53
2.8 Waste to Wealth in Rajkot 55
2.9 State of Urban Transport and Roads 57
2.10 Two-wheeler Ownership 58
2.11 City Bus Services in Indore and Surat 59
X
3.1 City Classes by Population Size 72
3.2 The Phasing Plan 81
4.1 Functions under the 12th Schedule (Article 243W), 74th Constitutional Amendment Act 1992 89
4.2 Corporatisation of Water Utilities: Some International Experiences 98
4.3 Corporatisation of a Water Utility in India: A Beginning in Nagpur 99
4.4 Making Public Private Partnerships Work in Korea 102
4.5 Early Attempt at a Municipal Services Regulator, Maharashtra 2000 103
4.6 Using Mobile Phones and GPRS to Improve Governance: Hyderabad 106
4.7 Delhi-Mumbai Industrial Corridor 112
4.8 Institutional Structure for Urban Transport in London 113
4.9 Town Planning Scheme in Gujarat 115
4.10 Thirteenth Central Finance Commission Recommendations for Urban Local Bodies 117
5.1 Own Revenue for Local Governments 127
5.2 Restructuring South Africa’s Fiscal System 128
5.3 An Indicative Municipal Finance List 130
5.4 Introducing an Area-based System of Property Valuation: The Patna Model 132
5.5 Property Tax Reform in Bangalore 133
5.6 Assumptions Underlying the Proposed Financial Framework 155
Tables1.1 Growth Rates of GDP at Constant Prices 8
1.2 Growth of Urban Population by City Size 10
1.3 Population of the Eight Largest Metropolitan Cities 15
1.4 JNNURM: A Work in Progress 31
2.1 Summary of Service Norms 45
2.2 Vehicle Taxation in Indian Cities 59
2.3 Institutional Arrangements for Urban Water Supply 62
2.4 Institutional Arrangements for Urban Transport 63
3.1 Alternative Estimates of Urban Infrastructure 70
3.2 Per Capita Investment Cost by Sector 74
3.3 Per Capita Operations and Maintenance Cost (annual) by Sector 74
3.4 Capital Expenditure Estimates by Sector 76
3.5 Capital Expenditure Estimates by City Size Class 78
3.6 Operations and Maintenance Expenditure by Sector 83
5.1 Average Cost Recovery of Selected ULBs: 2007-08 141
5.2 Municipal Bonds in India 146
5.3 Municipal Revenue: 2007-08 153
5.4 Projected Municipal Revenue and Expenditure 154
XI
Charts1.1 GDP Growth at Constant Prices 61.2 Trends in Investment 71.3 Share of GDP by Sector 91.4 Share of Employment by Sector 91.5 Sources of Increase in Urban Population 111.6 Labour Productivity: Urban and Rural 111.7 Per Capita Income and Urbanisation Levels: States 121.8 Urbanisation Ranking: Top 10 Major States of India 13
1.9 Metropolitan Cities: Number and Population 14
1.10 Rural and Urban Population below Poverty Line 17
1.11 Urban Share of GDP 21
1.12 JNNURM: Funding from Government of India 31
1.13 JNNURM: Spending by Sector for UIG and UIDSSMT 32
2.1 Water Balance in a Typical Indian City 47
2.2 Coping Costs of Water Supply 48
2.3 Salient Features of National Urban Sanitation Policy 51
2.4 National Urban Transport Policy 60
3.1 Relative Shares of Sectors in Investment Requirement 76
3.2 Projected Investment Requirement for Urban Infrastructure 81
3.3 Projected Investment Requirement for Urban Infrastructure (per cent of GDP) 82
3.4 Annual Operations and Maintenance Cost 84
4.1 Institutional Arrangements in Bangalore 90
4.2 Institutional Framework for Better Governance for Service Delivery 91
4.3 Missing Convergence in Urban Planning 96
4.4 Reforms in System Delivery 97
5.1 Urban Expenditure Projections 124
5.2 Relative Share in Urban Expenditure 124
5.3 Municipal Finances: Declining Share of Own Revenue 125
5.4 Tax and Non-tax Revenues of ULBs 126
5.5 Re-engineering the ULB Revenue Model: Key Components 130
5.6 Overall Municipal Deficit 157
References 159
APPENDIX A:Statistical Appendix
165
Tables
A1 Urban Population in Indian States and Union Territories 167
XII
A2 Level of Urbanisation in Indian States and Union Territories 168
A3 Share of Urban Population of States and Union Territories 169
A4 Population Trends: Urban and Rural 170
A5 Number of Cities and Towns by City Size Class 171
A6 Population of Cities and Towns by City Size Class 172
A7 Area and Density of Population by City Size Class 173
A8 Number of Villages and Population in States/Union Territories 174
A9 Number of Towns, Population Density, and Area by States/Union Territories 175
A10 Number and Population of New Towns and Declassified Towns 176
A11 Population of Metropolitan Cities 177
A12 Number of Urban Local Bodies by Civic Status 178
A13 Population of Urban Local Bodies by Civic Status 179
A14 Share of Urban GDP by Sector 180
A15 Net State Domestic Product at 1999-2000 Prices 181
A16 Per Capita Net State Domestic Product at 1999-2000 Prices 184
A17 Share of State’s Income as a percentage of All India Total 187
A18 Percentage of Urban Population below the Poverty Line 190
A19 Slum Population in Metropolitan Cities 191
A20 JNNURM Funds Released by States and Union Territories 192A21 JNNURM Funds Released by States and Union Territories (per cent of Approved Funds) 193
A22 JNNURM Funds Released by Sector 194
A23 JNNURM Funds Released by City Size Class 194
A24 Status of State-level JNNURM Reforms 195
A25 Status of Urban Local Body-level JNNURM Reforms 196
A26 Norms and Standards for Urban Water Supply 197
A27 Norms and Standards for Urban Sewerage/Sanitation System 198
A28 Norms and Standards for Urban Solid Waste Management 199
A29 Norms and Standards for Urban Streetlights 200
A30 Norms and Standards for Urban Roads 201
A31 Current Status of Municipal Finances 202
A32 Own Revenue of Urban Local Bodies 203
A33 Total Revenue of Urban Local Bodies 204
A34 List of Urban Agglomerations by City Size Class 205
Appendix BAssumptions and Methodology for Estimation of Investment Requirements
217
B0 Methodology for population projections 219
B1 Water supply 221
B2 Sewerage 224
B3 Solid waste management 227
B4 Urban roads 229
XIII
B5 Storm water drains 232
B6 Urban transport 233
B7 Traffic support infrastructure 236
B8 Street lighting 238
Boxes
B1 Service Standards for Water Supply 221
B2 Key Assumptions in Water Supply Estimates 222
B3 Per Capita Cost for Water Supply 223
B4 Service Standards and Key Assumptions for Sewerage 225
B5 Per Capita Cost for Sewerage 226
B6 Service Standards and Key Assumptions for Solid Waste Management 228
B7 Per Capita Cost for Solid Waste Management 229
B8 Service Standards and Key Assumptions for Urban Roads 230
B9 Per Capita Cost for Urban Roads 231
B10 Service Standards and Key Assumptions for Storm Water Drains 233
B11 Per Capita Cost for Storm Water Drains 233
B12 Service Standards and Key Assumptions for Urban Transport 235
B13 Per Capita Cost for Urban Transport 235
B14 Estimate for Rolling Stock (Buses) 236
B15 Service Standards and Key Assumptions for Traffic Support Infrastructure 237
B16 Per Capita Cost for Traffic Support Infrastructure 237
B17 Service Standards and Key Assumptions for Street Lighting 238
B18 Per Capita Cost for Street Lighting 239
Tables
B1 Comparison of Size Class of Cities 219
B2 Urban Population 220
B3 Average Annual Growth Estimates for Urban Population 220
B4 Aggregate Cost for Water Supply 224
B5 Aggregate Cost for Sewerage 226
B6 Aggregate Cost for Solid Waste Management 229
B7 Aggregate Cost for Urban Roads 231
B8 Aggregate Cost for Storm Water Drains 233
B9 Aggregate Cost for Urban Transport 236
B10 Aggregate Cost for Traffic Support Infrastructure 238
B11 Aggregate Cost for Street Lighting 239
Annexure ITerms of Reference
241
Annexure IIMeetings and Consultations
245
Report on Indian Urban Infrastructure and Services
XIV
ABS Area Based System ADB Asian Development BankARV Annual Rental Value ASCI Administrative Staff College of IndiaATC Area Traffic ControlAUDA Ahmedabad Urban Development AuthorityBEST Brihanmumbai Electric Supply and Transport UndertakingBBMP Bruhat Bengaluru Mahanagara PalikeBDA Bangalore Development AuthorityBMLTA Bangalore Metropolitan Land Transport Authority BOT Build-Operate-Transfer BRTS Bus Rapid Transit SystemBSUP Basic Services for Urban PoorBTL Build-Transfer-LeaseBWSSB Bangalore Water Supply and Sewerage Board CAG Comptroller and Auditor General CDM Clean Development Mechanism CDP City Development PlanCEPT Centre for Environmental Planning and TechnologyCFC Central Finance CommissionCMP Comprehensive Mobility PlanCOPP Committee on Plan ProjectsCPCB Central Pollution Control BoardCPHEEO Central Public Health and Environmental Engineering OrganisationCRISIL Credit Rating Information Services of India LimitedCSO Central Statistical Organisation DALY Disability Adjusted Life YearDMIC Delhi Mumbai Industrial CorridorDMICDC Delhi Mumbai Industrial Corridor Development Corporation Ltd.DPC District Planning Committee DPR Detailed Project Report EWS Economically Weaker SectionFAR Floor Area RatioFSI Floor Space IndexGDP Gross Domestic ProductGHMC Greater Hyderabad Municipal CorporationGIS Geographical Information System GoI Government of IndiaGPRS Global Packet Radio ServicesGPS Global Positioning System
Abbreviations and Data Notes
Report on Indian Urban Infrastructure and Services
XV
GSDP Gross State Domestic ProductGST Goods and Services TaxGWSSB Gujarat Water Supply and Sewerage BoardHRD Human Resource DevelopmentHUDCO Housing and Urban Development Corporation LimitedIAS Indian Administrative ServiceIBNET International Benchmarking Network for Water and Sanitation UtilitiesICRIER Indian Council for Research on International Economic RelationsICT Information and Communication Technology ICTSL Indore City Transport Services LimitedIDFC Infrastructure Development Finance Company LimitedIHSDP Integrated Housing and Slum Development ProgrammeIIM Indian Institute of ManagementIIPS International Institute of Population ScienceIIT Indian Institute of TechnologyIL&FS Infrastructure Leasing & Financial Services LimitedIT Information TechnologyITS Intelligent Transport System IUT Institute of Urban Transport JNNURM Jawaharlal Nehru National Urban Renewal Mission JW Johannesburg WaterKUWASIP Karnataka Urban Water Sector Improvement ProjectKWA Kerala Water AuthorityKUWSDB Karnataka Urban Water Supply & Drainage BoardLIG Low Income Group MC Municipal CorporationMJP Maharashtra Jeevan PradhikaranMIA Middle Income AsianMoA Memorandum of AgreementMoST Ministry of Surface TransportMoUD Ministry of Urban Development MPC Metropolitan Planning CommitteeMRDA Metropolitan Regional Development AuthorityMRTS Mass Rapid Transit SystemMSW Municipal Solid Waste NESL Nagpur Environmental Services LimitedNGO Non Governmental OrganisationNIJNNURM New Improved Jawaharlal Nehru National Urban Renewal MissionNIUA National Institute of Urban AffairsNREGS National Rural Employment Guarantee SchemeNRHM National Rural Health MissionNRW Non-Revenue WaterNSSO National Sample Survey OrganisationNUIS National Urban Information SystemNUTIC National Urban Transport Information Centre
Report on Indian Urban Infrastructure and Services
XVI
O&M Operations and MaintenanceOECD Organisation for Economic Co-operation and DevelopmentPCIC Per Capita Investment CostPCOM Per Capita Operations and Maintenance CostPEARL Peer Experience and Reflective Learning PFDF Pooled Finance Development FundPHED Public Health Engineering DepartmentPMGSY Pradhan Mantri Gram Sadak YojanaPPP Public Private Partnership PPWSA Phnom Penh Water Supply AuthorityPRI Panchayati Raj InstitutionPSU Public Sector UndertakingPWD Public Works Department PWSSB Punjab Water Supply and Sewerage Board R&D Research and Development RAY Rajiv Awas YojanaRCC Reinforced Cement ConcreteRGI Registrar General of IndiaRPMC Reform and Performance Management CellRTA Road Transport AuthorityRTO Regional Transport OfficeRWA Resident Welfare AssociationSFC State Finance Commission SLA Service Level AgreementSPCB State Pollution Control BoardSPV Special Purpose VehicleSRTC State Road Transport CorporationTERI The Energy and Resources Institute TfL Transport for LondonTNUDF Tamil Nadu Urban Development FundTNUIFSL Tamil Nadu Urban Infrastructure Financial Services LimitedToR Terms of Reference TPS Town Planning Scheme TWAD Tamil Nadu Water Supply and Drainage Board UA Urban AgglomerationUIDSSMT Urban Infrastructure Development Scheme for Small and Medium TownsUIG Urban Infrastructure and GovernanceULB Urban Local BodyULCRA Urban Land Ceiling and Regulation ActUMIS Urban Management Information System UMTA Unified Metropolitan Transport Authority UN United NationsUNDP United Nations Development ProgrammeURIF Urban Reform Incentive Fund VAT Value Added Tax
Report on Indian Urban Infrastructure and Services
XVII
VGF Viability Gap Funding WSP Water and Sanitation Program
Data notes1 crore = 100 lakh = 10 million 1 million = 10 lakh 1 billion = 1000 million = 100 crore 1 trillion = 1000 billion = 1 lakh crore

Summary and Recommendations

XXI
Report 2009-2010Report on Indian Urban Infrastructure
and Services
XXI
Summary and Recommendations
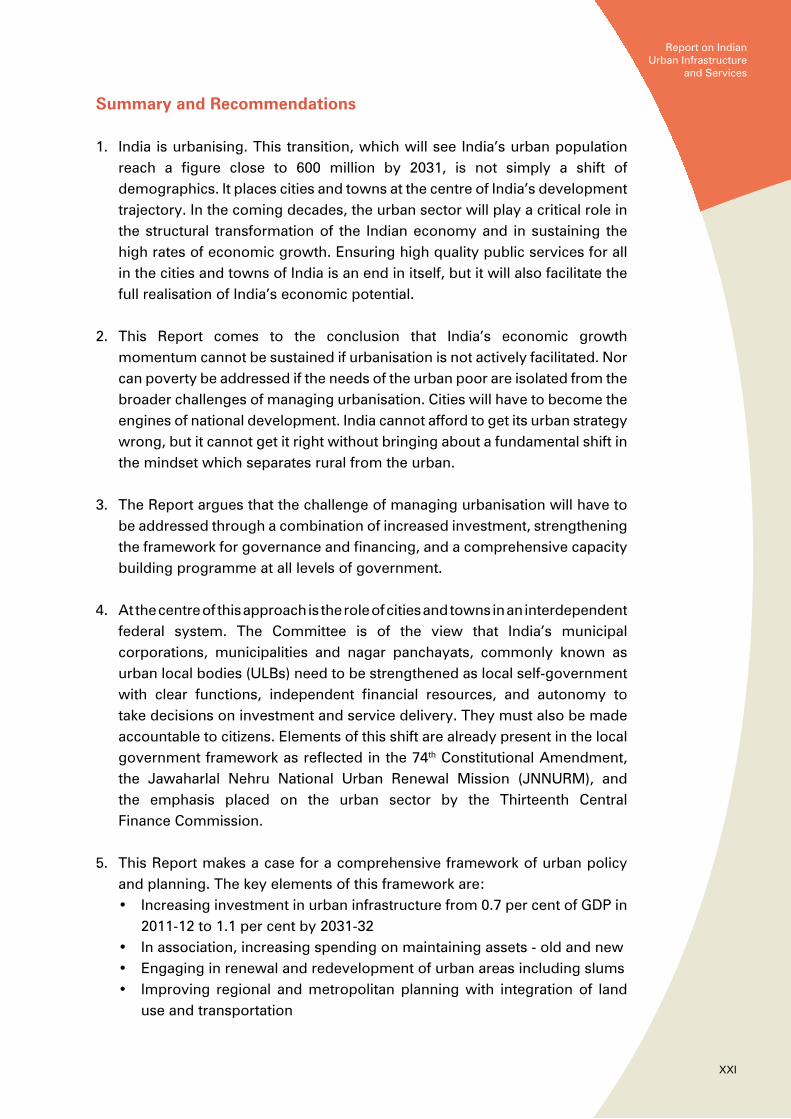
India is urbanising. This transition, which will see India’s urban population 1. reach a figure close to 600 million by 2031, is not simply a shift of demographics. It places cities and towns at the centre of India’s development trajectory. In the coming decades, the urban sector will play a critical role in the structural transformation of the Indian economy and in sustaining the high rates of economic growth. Ensuring high quality public services for all in the cities and towns of India is an end in itself, but it will also facilitate the full realisation of India’s economic potential.
This Report comes to the conclusion that India’s economic growth 2. momentum cannot be sustained if urbanisation is not actively facilitated. Nor can poverty be addressed if the needs of the urban poor are isolated from the broader challenges of managing urbanisation. Cities will have to become the engines of national development. India cannot afford to get its urban strategy wrong, but it cannot get it right without bringing about a fundamental shift in the mindset which separates rural from the urban.
The Report argues that the challenge of managing urbanisation will have to 3. be addressed through a combination of increased investment, strengthening the framework for governance and financing, and a comprehensive capacity building programme at all levels of government.
At the centre of this approach is the role of cities and towns in an interdependent 4. federal system. The Committee is of the view that India’s municipal corporations, municipalities and nagar panchayats, commonly known as urban local bodies (ULBs) need to be strengthened as local self-government with clear functions, independent financial resources, and autonomy to take decisions on investment and service delivery. They must also be made accountable to citizens. Elements of this shift are already present in the local government framework as reflected in the 74th Constitutional Amendment, the Jawaharlal Nehru National Urban Renewal Mission (JNNURM), and the emphasis placed on the urban sector by the Thirteenth Central Finance Commission.
This Report makes a case for a comprehensive framework of urban policy 5. and planning. The key elements of this framework are:
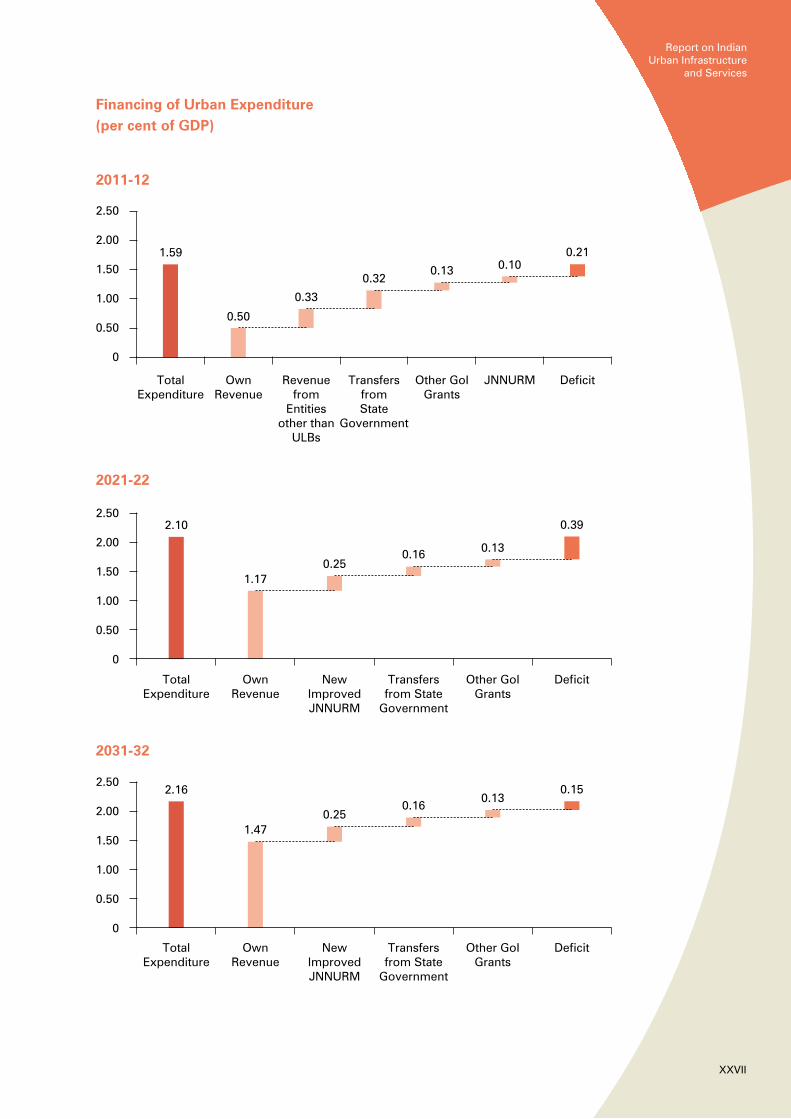
Increasing investment in urban infrastructure from 0.7 per cent of GDP in • 2011-12 to 1.1 per cent by 2031-32In association, increasing spending on maintaining assets - old and new • Engaging in renewal and redevelopment of urban areas including slums• Improving regional and metropolitan planning with integration of land • use and transportation
XXII
Report 2009-2010Report on Indian Urban Infrastructure and Services
XXII
Ensuring access to services for all including the poor to meet the • recommended norms Reforming systems of service delivery • Improving governance of cities and towns by a unified command under • a MayorStrengthening and securing the financial base of ULBs• State governments providing an enabling environment for ULBs to • discharge their enhanced responsibilities Government of India launching a New Improved JNNURM (NIJNNURM) • that focuses on capacity building and supports urban reforms within a programme approach
A. Summary
The major conclusions emerging from the documentation and analysis in the Report are presented below.
A.1 Urbanisation and Economic Growth
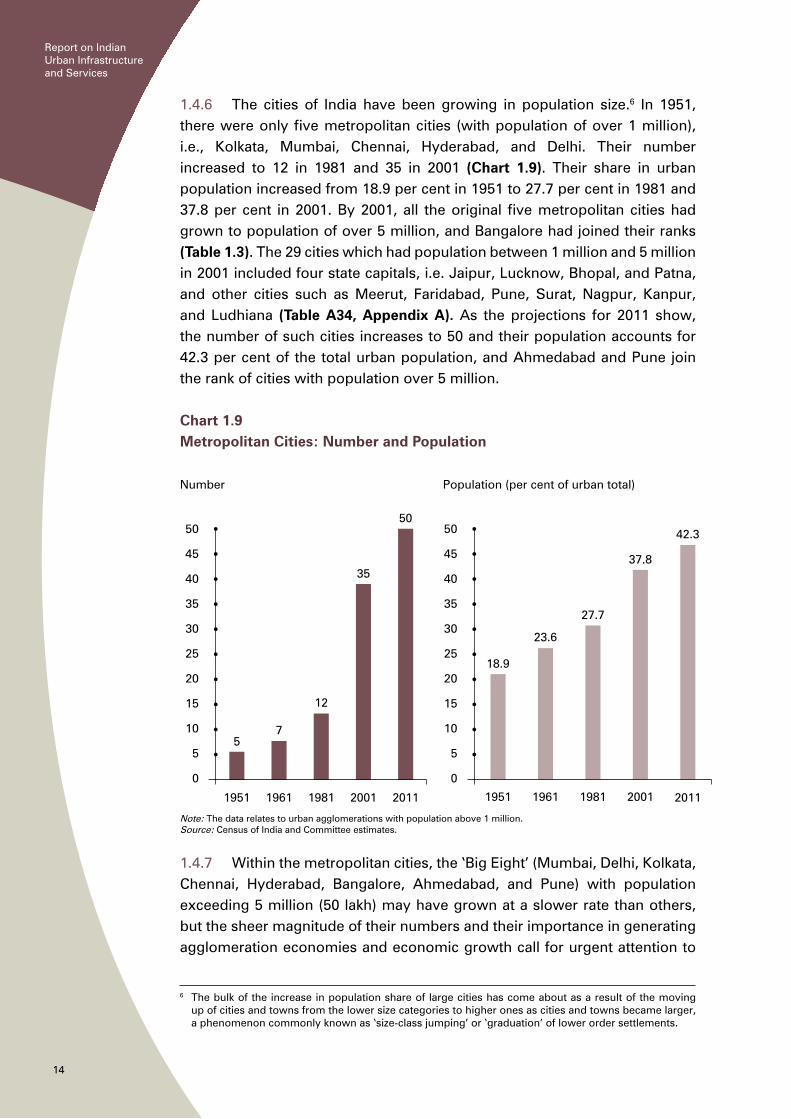
Only 30 per cent of India’s population lives in urban areas. This is much 6. lower than in China, Indonesia, South Korea, Mexico, and Brazil. Some of this may be due to much lower per capita incomes in India. The Committee’s projections suggest that India’s urban population as presently defined will be close to 600 million by 2031, more than double that in 2001. Already the number of metropolitan cities with population of 1 million and above has increased from 35 in 2001 to 50 in 2011 and is expected to increase further to 87 by 2031. The expanding size of Indian cities will happen in many cases through a process of peripheral expansion, with smaller municipalities and large villages surrounding the core city becoming part of the large metropolitan area.
Three decades of rapid economic growth would normally have propelled 7. migration from rural areas but growth in India has not had this effect thus far. This is because industrialisation has been capital intensive and the services boom fuelled by the knowledge economy has also been skill intensive. A few cities of India have acted as centres of knowledge and innovation. As more cities provide economies of agglomeration and scale for clusters of industries and other non-agricultural economic activity, the urban sector will become the principal engine for stimulating national economic growth. Industrialisation will absorb more people as India advances further in its integration with the world economy. At the present juncture, India faces the challenge of continuing on its high growth trajectory while making growth more broad-based and labour-intensive.
XXIII
Report 2009-2010Report on Indian Urban Infrastructure
and Services
XXIII
The fortunes of the agricultural sector are crucially linked to the manner 8. in which growth in the industry and services sectors unfolds. People living in rural areas typically tap the opportunities that cities provide for employment, entrepreneurial avenues, learning, and monetary repatriation. As urbanisation grows, demand for food items other than foodgrains, i.e. vegetables, lentils, milk, eggs, etc., also grows. This leads to investments in infrastructure, logistics, processing, packaging, and organised retailing. These investments and other economic inter-linkages connect and build synergy between rural and urban centres. Of course, government policy should also focus on enhancing the productive potential of the rural economy. This Report maintains that India’s urban future promises to be an inclusive one, with the benefits extending to rural areas as well. Already, there is evidence to suggest that rising standards of living in India’s urban areas in the post-reform period have had significant distributional effects favouring the country’s rural poor.
A.2 The State of Service Delivery
Cities and towns of India are visibly deficient in the quality of services 9. they provide, even to the existing population. Considering that the Indian economy is now one of the fastest growing economies in the world, and standards are rising, current service levels are too low relative to the needs of urban households. They are also low relative to what will be required to sustain the economic productivity of cities and towns.
The Committee believes that public services such as drinking water, 10. sewerage, solid waste management, roads, and street lights must be accessible to one and all to achieve the goals of inclusion. At the same time, they must meet the service norms as set out by the Ministry of Urban Development in 2008 to ensure the contribution of cities to economic growth. To achieve both inclusion and economic growth will, however, require shifting the focus of policy from creating physical infrastructure to delivering services. The challenge is to focus on reforming governance for service delivery. Without this, additional capital investments in urban infrastructure will not result in improvements in service delivery.
The Committee has taken note of the situation with respect to low income 11. housing and public transportation. The scarcity of affordable housing drives the poor and some non-poor to slums and most of these settlements lack even basic water and sanitation facilities. On average, 25 per cent of the population in many Indian cities lives in slums; in Greater Mumbai, slum dwellers account for 54 per cent of the total population. Not all slum dwellers are poor, and the complexity of these challenges is reviewed in the context of urban planning, infrastructure development and public service delivery for all.
XXIV
Report 2009-2010Report on Indian Urban Infrastructure and Services
XXIV
The challenge of urbanisation in India is to ensure service delivery at the 12. enhanced minimum standards that are necessary when planning ahead. This is particularly so in a situation when even the current urban population is inadequately served and total urban population is likely to increase by at least 250 million.
A.3 Estimates of Investment for Urban Infrastructure
This Committee’s terms of reference specified that it should estimate 13. investment requirements for eight major sectors of urban infrastructure over the period 2008-20, and suggest ways of financing the massive infrastructure deficit in the urban sector along with ensuring improved service delivery that meets the new specified norms.
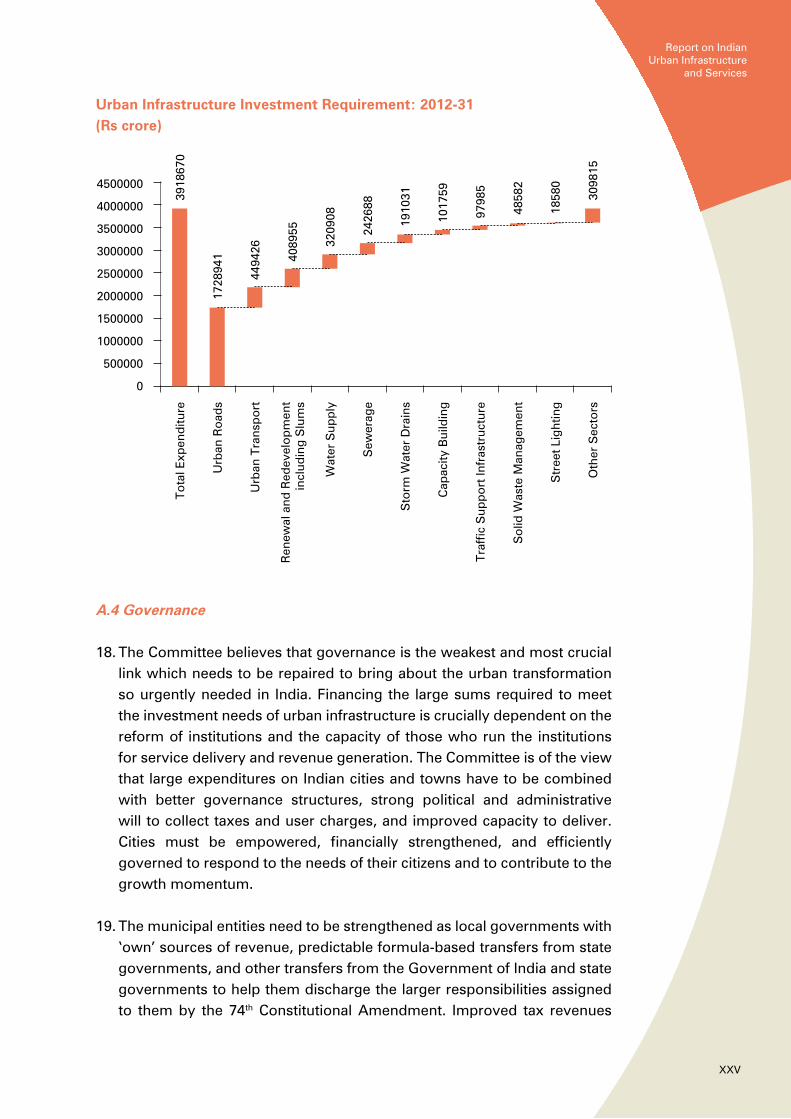
The Committee has interpreted its mandate in a broad manner by covering 14. all areas of urban infrastructure and extending the period to 2031. It has prepared detailed estimates of investment for eight sectors, i.e. water supply, sewerage, solid waste management, storm water drains, urban roads, urban transport, traffic support infrastructure, and street lighting, and these are presented in Chapter III. The Committee has also prepared an estimate of investment in urban infrastructure as a whole by suitably scaling up the estimates for these sectors. However, these would not cover the requirements of primary health, primary education, and electricity distribution, which are outside the terms of reference of the Committee.
The Committee has made projections for the period from the Twelfth Five 15. Year Plan to the Fifteenth Five Year Plan, i.e. 2012-31. Given the volatility of land prices, the estimates do not include the cost of land acquisition.
The investment for urban infrastructure over the 20-year period is estimated 16. at Rs 39.2 lakh crore at 2009-10 prices. Of this, Rs 17.3 lakh crore (or 44 per cent) is accounted for by urban roads. The backlog for this sector is very large, ranging from 50 per cent to 80 per cent across the cities of India. Sectors delivering urban services such as water supply, sewerage, solid waste management, and storm water drains will need Rs 8 lakh crore (or 20 per cent). The Committee has made explicit provision of Rs 4 lakh crore towards investment in renewal and redevelopment including slums.
Recognising that the focus of policy should be on provision of public 17. services which flow from infrastructure assets and not merely on creating the assets, the Committee has highlighted the importance of operations and maintenance (O&M) for the upkeep of the assets. The O&M requirements for new and old assets are projected at Rs 19.9 lakh crore over the 20-year period.
XXV
Report 2009-2010Report on Indian Urban Infrastructure
and Services
XXV
4500000
4000000
3500000
3000000
2500000
2000000
1500000
1000000
500000
0
Tota
l Exp
endi
ture
Urb
an R
oads
Urb
an T
rans
port
Rene
wal
and
Red
evel
opm
ent
incl
udin
g Sl
ums
Wat
er S
uppl
y
Sew
erag
e
Stor
m W
ater
Dra
ins
Cap
acity
Bui
ldin
g
Traf
fic S
uppo
rt In
fras
truc
ture
Solid
Was
te M
anag
emen
t
Stre
et L
ight
ing
Oth
er S
ecto
rs
3918
670
1728
941
4494
26
4089
55
3209
08
2426
88
1910
31
1017
59
9798
5
4858
2
1858
0
3098
15
Urban Infrastructure Investment Requirement: 2012-31(Rs crore)
A.4 Governance
The Committee believes that governance is the weakest and most crucial 18. link which needs to be repaired to bring about the urban transformation so urgently needed in India. Financing the large sums required to meet the investment needs of urban infrastructure is crucially dependent on the reform of institutions and the capacity of those who run the institutions for service delivery and revenue generation. The Committee is of the view that large expenditures on Indian cities and towns have to be combined with better governance structures, strong political and administrative will to collect taxes and user charges, and improved capacity to deliver. Cities must be empowered, financially strengthened, and efficiently governed to respond to the needs of their citizens and to contribute to the growth momentum.
The municipal entities need to be strengthened as local governments with 19. ‛own’ sources of revenue, predictable formula-based transfers from state governments, and other transfers from the Government of India and state governments to help them discharge the larger responsibilities assigned to them by the 74th Constitutional Amendment. Improved tax revenues
XXVI
Report 2009-2010Report on Indian Urban Infrastructure and Services
XXVI
combined with rational user charges will enable cities to leverage their own resources to incur debt and also access new forms of financing through public private partnership (PPP). Only then can they augment the urban infrastructure base, provide improved quality of services on a sustainable basis to their residents, and contribute to the growth momentum of the Indian economy.
A.5 Financing
Urban local governments in India are among the weakest in the world 20. both in terms of capacity to raise resources and financial autonomy. While transfers from state governments and the Government of India have increased in recent years, the tax bases of ULBs are narrow and inflexible and lack buoyancy, and they have also not been able to levy rational user charges for the services they deliver.
ULBs can borrow from the market only within limits and with explicit 21. approval of the state government. However, this has mostly not been a binding constraint since the real challenge in accessing external finance has been the precarious state of their own finances and poor governance.
The Committee believes that in view of the importance of urban 22. infrastructure for economic growth and inclusion, the Government of India and state governments will have to step in, both by providing substantial funds and by facilitating the use of additional mechanisms for funding, which will require the strengthening of own finances of ULBs. The latter, in turn, requires reforms in governance at all levels.
The Government of India will have to take a leadership role in financing a 23. major part of the programme and, at the same time, facilitate and encourage the involvement of state governments and ULBs. State governments will have to contribute by way of a constitutionally mandated revenue-sharing arrangement with the ULBs. On their part, the ULBs will carry out reforms in governance and financing to deliver public services of specified norms to all including the poor. This should be done within a framework of accountability. Rising aspirations of the increasing numbers of people in urban India will make further demands on ULBs, and community participation will be an important factor in ensuring accountability.
XXVII
Report 2009-2010Report on Indian Urban Infrastructure
and Services
XXVII
0.50
1.59
0.330.32 0.13 0.10
0.21
TotalExpenditure
OwnRevenue
Revenuefrom
Entitiesother than
ULBs
Transfers fromState
Government
Other GoIGrants
JNNURM Deficit
2.50
2.00
1.50
1.00
0.50
0
2011-12
TotalExpenditure
OwnRevenue
NewImprovedJNNURM
Transfersfrom State
Government
Other GoIGrants
Deficit
2.50
2.00
1.50
1.00
0.50
0
2.10
1.170.25
0.16 0.13
0.39
2021-22
TotalExpenditure
OwnRevenue
NewImprovedJNNURM
Transfersfrom State
Government
Other GoIGrants
Deficit
2.50
2.00
1.50
1.00
0.50
0
2.16
1.470.25
0.16 0.130.15
2031-32
Financing of Urban Expenditure(per cent of GDP)
XXVIII
Report 2009-2010Report on Indian Urban Infrastructure and Services
XXVIII
B. Recommendations
The major recommendations of the Committee are summarised below.
B.1 New Improved JNNURM (NIJNNURM)
The launch of the JNNURM in December 2005 by the Government of India 24. signalled the importance of the urban sector for the Indian economy. The Mission has certainly helped focus attention of policy makers in all three tiers of the government on the challenges facing the cities and towns of India and created dynamism in a sector which has long suffered neglect.
Progress in implementing reforms under the JNNURM has been slow, 25. and it has been difficult to enforce conditionality of overall reforms in a project-based financing approach for a variety of reasons. The Mission has more generally exposed the lack of capacity at local government level to prepare and implement projects in urban infrastructure.
The main features of the NIJNNURM are spelt out below:26.
Coverage • Accessible to all cities/towns – big and smallScale • 0.25 per cent of GDP annuallyDuration • 20 yearsCapacity Building • A strong programme of capacity creation Programme Approach • ULBs should be required to lay out a framework detailing action items, financial and operating plans, monitoring programme, and capacity building initiatives leading to reforms and achievement of service level standardsCity Differentials • Smaller cities and towns should be treated differently from larger cities and metros – for funding, capacity building and reform content and timelines ◦ Funds for smaller ULBs should be channelled through intermediary institutions, and they should be encouraged to go in for pooled financing ◦ For Municipal Corporations and Municipalities, in addition to a regular window, a special window should be created specifically for projects that could be financed and executed via PPP route, or by leveraging private sources of funding.Funding • Should be linked to a ULB-specific programme of development and reform
XXIX
Report 2009-2010Report on Indian Urban Infrastructure
and Services
XXIX
• Funding requirements to be routed through the state governments • State governments not required to make any financial contribution towards the NIJNNURM because of the Committee’s recommendation for devolution • Contribution of the smaller ULBs to be lower than that of the larger cities and metros.Governance • Monitoring of reforms at the state level • Focus on improvement in procurement systems by having standardised tender documents for key categories of urban infrastructure based on international best practices.
The detailed guidelines for the NIJNNURM and its differentiation 27. across city sizes will have to be put together by the Ministries of Urban Development, and Housing and Urban Poverty Alleviation, and other relevant government agencies.
A precondition for the success of the proposed programme-based approach 28. in the NIJNNURM is to strengthen capacity at all tiers of government beginning with the two apex ministries at national level or the proposed single Ministry. Of the total NIJNNURM funds, 5 per cent will be spent on building capacity. This would still meet only half the total funding requirements for capacity building over the entire 20-year programme: state governments, ULBs, and the private sector will have to partner in building capacity.
B.2 Governance
Administrative ReformsOne Ministry of Urban Affairs and Housing, Government of India and i. a unified Mission (NIJNNURM)One Department of Urban Affairs and Housing at state government level ii. and a unified Mission (NIJNNURM)Unified command under an empowered and accountable Mayoriii.
Planning of Cities/TownsCity level planning by ULBs through state legislative reformi. High Powered Expert Committee to be set up to study urban land use and ii. land market issues Housing for the poor to be planned within an integrated land use/transport iii. plan with focus on public transportation Densification of existing cities linked to development of infrastructure iv. facilities, especially public transport
XXX
Report 2009-2010Report on Indian Urban Infrastructure and Services
XXX
Funding of renewal and redevelopment including slums to be looked into v. by the proposed Committee on land reforms Innovative use of floor space index (FSI) charges to plan for compact and vi. efficient cities
Metropolitan and Regional planning District and Metropolitan plans to form part of state plansi. Integrating transport and land use planning at regional level ii. Strengthening Metropolitan Planning Committees (MPC) and District iii. Planning Committees (DPC) with Urban Development Authorities and Unified Metropolitan Transport Authorities as technical arms
Regulatory FrameworkTo set up:
Urban Utility Regulator, beginning with water and seweragei. Local Body Ombudsman for dispute resolution ii. Local Fund Audit Commission for independent and professional auditiii.
Reforms for Service DeliveryCorporatisation of service delivery institutionsi. Smaller ULBs to come together for scale economies through ii. inter-municipal cooperation State governments to amend their Municipal Acts or enact overarching iii. Acts to facilitate PPPsUse of e-governance and e-enabled smart technologies iv.
Community Participation and TransparencyImplementing Community Participation and Public Disclosure Lawi. Setting up and empowering Area Sabhas and Wards Committeesii. Preparing Citizen Report Cards and Social Auditsiii. Preparing Market Worthiness Disclosure Statements by ULBs iv.
B.3 Capacity Building
Institutional Capacity Building Set up five Indian Institutes of Urban Management through partnership i. between the Government of India, state governments and the private sector, either anchored in existing IIMs or as stand alone institutions of excellenceInfuse funds and new talent into existing Schools of Urban Planning ii. Promote think tank initiatives in urban policy through Centres of Excellence/iii. Innovation in existing institutionsCreate a Reform and Performance Management Cell (RPMC) in the iv. Government of India (and at state level and in large cities) with a multidisciplinary team undertaking activities such as:
XXXI
Report 2009-2010Report on Indian Urban Infrastructure
and Services
XXXI
Providing technical assistance to state governments, regulators, ◦and ULBs in planning, finance, operations, and monitoring of urban programmes Encouraging projects under PPPs through model concession ◦agreements, database, knowledge sharing, etc. Creating a dedicated Municipal Information Unit to collect, collate, ◦and analyse comparable data on municipal services and finances on an annual basisProviding assistance to State Finance Commissions ◦Developing a Performance Management System for evaluating cities ◦and towns
Human Resource Capacity Building Train 300 officers from the Indian Administrative Services (IAS) and i. other central services annually as urban specialists and place them systematically through deputation in cities and townsBuild/Reform Municipal cadres in all states with recruitment into the cadre ii. at entry level through a competitive examination Provide flexibility in lateral hiring of professionals with special skills into iii. the cadrePut in place a transparent search-cum-selection process in the appointment iv. of the Municipal CommissionerTenure of the management team to be a minimum of three yearsv. Develop dedicated IT cadre with a Chief Information Officer for the vi. larger cities
B.4 Financing
Tax ReformsIntroduce a i. ‛Local Bodies Finance List’ in the ConstitutionEmpower ULBs with ‛exclusive’ taxes ii. Constitutionally ensure sharing by the state governments of a pre-specified iii. percentage of their revenues from all taxes on goods and services with ULBs Provide for formula-based transfers and grants-in-aid to ULBs from the iv. divisible pool Abolish octroi and entry taxes in all states v. Undertake reforms in property tax so as to levy tax on constructed building vi. under an Area Based System and levy of vacant land tax on the basis of ready-reckoner capital value
Unlocking Land Value Tapping land-based financing sources including conversion charges, i. betterment charges, impact fees, and development charges
XXXII
Report 2009-2010Report on Indian Urban Infrastructure and Services
XXXII
Pricing of Floor Space Index (FSI) above a certain limit, within overall ii. planning guidelinesPreparing city-wide inventory of land assets iii. Putting in place a transparent and accountable mechanism for iv. monetisation of public land with due attention to the needs of the poor and the marginalised
Reforms to Strengthen Non-tax Revenues Municipal Service Regulator should be assigned the responsibility of i. revising user charges regularly. Even when different segments of the population are charged differently, the cross-subsidisation should be such that the overall O&M cost is recovered and a minimal surplus generated. Automatic indexation will ensure smooth increase over time without the challenge of having to defend cumulative adjustment every few years. User charges to be so structured as to meet O&M cost, debt servicing, ii. and depreciation towards the cost of the project. In addition, they must also generate some surplus to enable building the equity base of ULBs, supported, where appropriate, with viability gap funding (VGF)Levy water and sewerage charges separately rather than built into the iii. property taxIntroduce parking fee to enhance revenue streams and promote the use iv. of public transportCollect trade licensing fee on the basis of a self assessment returnv.
Other Reforms State governments to set up state financial intermediaries to work with i. small ULBs Government of India to create a ‛Regulatory Guidelines Handbook for ii. Municipal Borrowings’ ULBs to prepare ‛Intended Use Plans’, requiring them to prepare a iii. borrowing programme based on their investment needs and repayment capacityRemove fixed cap of 8 per cent on annual interest on municipal bonds to iv. make the bonds attractiveHUDCO to have a professional Board; to receive benefits available to v. infrastructure financing companies; and be regulated by the Reserve Bank of India
Chapter IUrbanisation and Economic Growth in India

3
Report on Indian Urban Infrastructure
and Services
1.1 Introduction
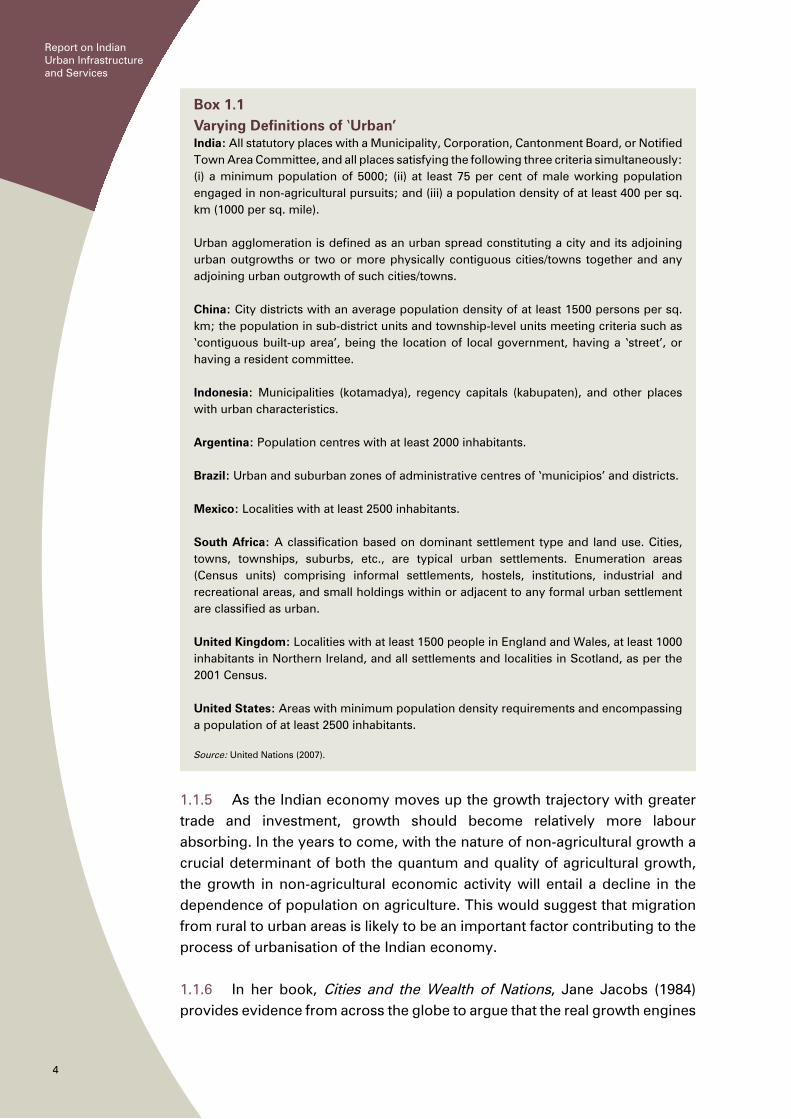
1.1.1 India has been slow to urbanise. As of 2010, 30 per cent of India’s population is conservatively classified as ‛urban’. This is much lower than in other major developing countries, e.g. 45 per cent in China, 54 per cent in Indonesia, 78 per cent in Mexico, and 87 per cent in Brazil. All these countries have much higher per capita incomes but differences in the definition of ‛urban’ also contribute to India’s low level of urbanisation (Box 1.1). If villages with more than 10,000 persons in India were to be classified as ‛urban’, this would imply a level of urbanisation in India in 2010 of over 35 per cent, but it would still be much lower than in other countries.1
1.1.2 Structural transformation is typically associated with urbanisation during the process of economic growth, and India is no exception (Box 1.2). However, the relatively high growth phase of the Indian economy since the beginning of the 1980s has been associated with less urbanisation than would be normally ‛expected’. The evidence assembled by this Committee suggests that India is at the cusp of rapid urbanisation.
1.1.3 The urban share of the gross domestic product (GDP) for the Indian economy is not available on a regular and consistent basis, and the underlying data base for estimating this share is very weak. Estimates by the Central Statistical Organisation (CSO), available for a few years, indicate that this share increased from 37.7 per cent in 1970-71 to 52 per cent in 1999-2000. The Mid-Term Appraisal of the Eleventh Five Year Plan puts the urban share of GDP at 62-63 per cent in 2009-10. The document further projects this share to increase to 75 per cent in 2030.
1.1.4 At India’s current stage of development, the industry and services sectors are the principal drivers of growth, with strong contribution from the private sector. Assuming that high-quality infrastructure for telecommunications, power, transport, etc. can be put in place in Indian cities, the scope for private sector participation in the growth process will further widen. This will create demand for employment – skilled as well as unskilled. India has the advantage of being at a stage in its demographic transition where the proportion of working-age population is still growing. By 2035, 69 per cent of India’s population will be between the ages of 15 and 65. If the educational system and vocational training are reoriented to create the skills in demand, and if labour laws are modernised to allow freer flow of labour in and out of firms so that labour use is not discouraged through government policies, rapidly growing sectors in urban areas should be generating rising employment opportunities.
1 By this new definition, in 2001 itself India would have urban population of 350 million which would be 34 per cent of the total population.
4
Report on Indian Urban Infrastructure and Services
Source: United Nations (2007).
Box 1.1Varying Definitions of ‛Urban’India: All statutory places with a Municipality, Corporation, Cantonment Board, or Notified Town Area Committee, and all places satisfying the following three criteria simultaneously: (i) a minimum population of 5000; (ii) at least 75 per cent of male working population engaged in non-agricultural pursuits; and (iii) a population density of at least 400 per sq. km (1000 per sq. mile).
Urban agglomeration is defined as an urban spread constituting a city and its adjoining urban outgrowths or two or more physically contiguous cities/towns together and any adjoining urban outgrowth of such cities/towns.
China: City districts with an average population density of at least 1500 persons per sq. km; the population in sub-district units and township-level units meeting criteria such as ‛contiguous built-up area’, being the location of local government, having a ‛street’, or having a resident committee.
Indonesia: Municipalities (kotamadya), regency capitals (kabupaten), and other places with urban characteristics.
Argentina: Population centres with at least 2000 inhabitants.
Brazil: Urban and suburban zones of administrative centres of ‛municipios’ and districts.
Mexico: Localities with at least 2500 inhabitants.
South Africa: A classification based on dominant settlement type and land use. Cities, towns, townships, suburbs, etc., are typical urban settlements. Enumeration areas (Census units) comprising informal settlements, hostels, institutions, industrial and recreational areas, and small holdings within or adjacent to any formal urban settlement are classified as urban.
United Kingdom: Localities with at least 1500 people in England and Wales, at least 1000 inhabitants in Northern Ireland, and all settlements and localities in Scotland, as per the 2001 Census.
United States: Areas with minimum population density requirements and encompassing a population of at least 2500 inhabitants.
1.1.5 As the Indian economy moves up the growth trajectory with greater trade and investment, growth should become relatively more labour absorbing. In the years to come, with the nature of non-agricultural growth a crucial determinant of both the quantum and quality of agricultural growth, the growth in non-agricultural economic activity will entail a decline in the dependence of population on agriculture. This would suggest that migration from rural to urban areas is likely to be an important factor contributing to the process of urbanisation of the Indian economy.
1.1.6 In her book, Cities and the Wealth of Nations, Jane Jacobs (1984) provides evidence from across the globe to argue that the real growth engines
5
Report on Indian Urban Infrastructure
and Services
Source: Urbanization and Growth (2009).
Box 1.2 Urbanisation and Growth: An International PerspectiveIn Urbanization and Growth, a volume prepared for the Growth Commission (2009), Annez and Buckley summarise the international experience on urbanisation and growth. Citing a study by the National Research Council (2003), they report that between 1980 and 1998, 86 per cent of the growth in value-added in developing countries came from the manufacturing and services sectors. In the initial phase of the evolution of these economies, productivity increases reflected shifting resources away from lower-productivity rural activities to the industry and services sectors. Beyond a point, rapid productivity gains mainly reflected improvements in the industry and services sectors.
The evidence suggests that in China, growth and urbanisation have occurred at very rapid rates in the past 30 years. However, a mutually reinforcing pattern of urbanisation and economic growth in China has been attained by investing in infrastructure and ‛managing’ the pace of urbanisation through policies such as the ‛hukou’ system of registration. Brazil’s experience seems to be an exception in that urbanisation continued to increase steadily from about 60 per cent at the end of the 1960s to 83 per cent in 2003 even though rapid growth occurred only in the 1970s and the Brazilian economy slipped into a long period of stagnation after that. Some African countries have also experienced urbanisation without growth.
It would be reasonable to argue in the light of this evidence that urbanisation in the sense of simply having people move to cities does not guarantee growth. The latter depends on the nature of urbanisation and the manner in which it is managed, i.e. on the absolute quality of urban opportunities. People move to the cities to seek better opportunities relative to rural ones, but it is the absolute quality of the opportunities in urban areas that determines the outcome in terms of growth.
and generators of national wealth are cities which nurture the fundamental processes leading to economic expansion or stagnation. Her analysis suggests that the wealth of nations is actually the wealth of its cities, and the roots of the ailments that plague nations can be traced to the state of their cities.
1.1.7 The cities of India will have to provide a receptive environment for innovation and productivity enhancement which can foster faster growth of the Indian economy and make room for larger migration from rural areas to higher-productivity sectors in urban areas. Government policy will have to address the challenges of an abysmal state of public services in Indian cities and towns.
1.1.8 The rural-urban divide in India has been a cause of major concern and not enough effort has been put in to build synergies between the urban and the rural parts of the economy. The ability to manage urbanisation and prepare cities for their new role is one of the biggest challenges facing India’s planners. The growth momentum cannot be sustained if urbanisation is not accommodated and facilitated.
6
Report on Indian Urban Infrastructure and Services
1.2 Economic growth and structural transformation
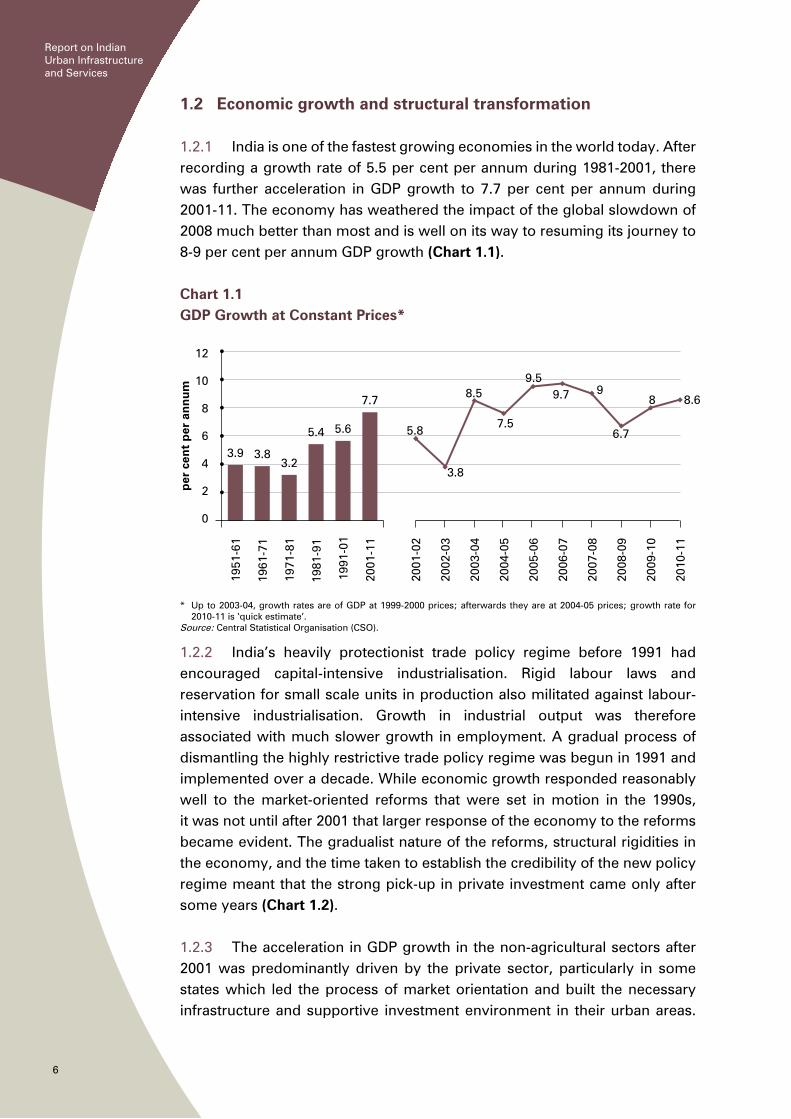
1.2.1 India is one of the fastest growing economies in the world today. After recording a growth rate of 5.5 per cent per annum during 1981-2001, there was further acceleration in GDP growth to 7.7 per cent per annum during 2001-11. The economy has weathered the impact of the global slowdown of 2008 much better than most and is well on its way to resuming its journey to 8-9 per cent per annum GDP growth (Chart 1.1).
Chart 1.1GDP Growth at Constant Prices*
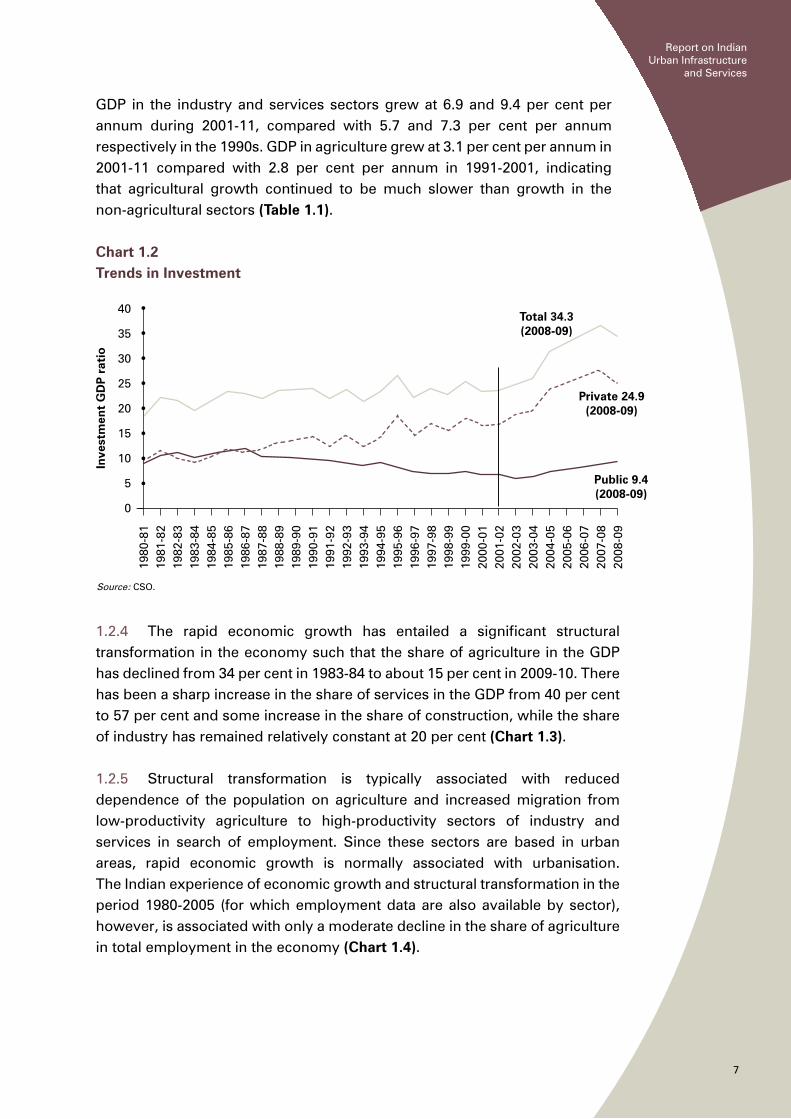
1.2.2 India’s heavily protectionist trade policy regime before 1991 had encouraged capital-intensive industrialisation. Rigid labour laws and reservation for small scale units in production also militated against labour-intensive industrialisation. Growth in industrial output was therefore associated with much slower growth in employment. A gradual process of dismantling the highly restrictive trade policy regime was begun in 1991 and implemented over a decade. While economic growth responded reasonably well to the market-oriented reforms that were set in motion in the 1990s, it was not until after 2001 that larger response of the economy to the reforms became evident. The gradualist nature of the reforms, structural rigidities in the economy, and the time taken to establish the credibility of the new policy regime meant that the strong pick-up in private investment came only after some years (Chart 1.2).
1.2.3 The acceleration in GDP growth in the non-agricultural sectors after 2001 was predominantly driven by the private sector, particularly in some states which led the process of market orientation and built the necessary infrastructure and supportive investment environment in their urban areas.
* Up to 2003-04, growth rates are of GDP at 1999-2000 prices; afterwards they are at 2004-05 prices; growth rate for 2010-11 is ‛quick estimate’.Source: Central Statistical Organisation (CSO).
12
10
8
6
4
2
0
per
cen
t p
er a
nnum
1951
-61
1961
-71
1971
-81
1981
-91
1991
-01
2001
-11
5.8
3.8
8.5
7.520
01-0
2
2002
-03
2003
-04
2004
-05
2005
-06
2006
-07
2007
-08
2008
-09
2009
-10
2010
-11
5.4 5.6
7.7
3.23.9 3.8
9.59.7 9
6.7
8 8.6
7
Report on Indian Urban Infrastructure
and Services
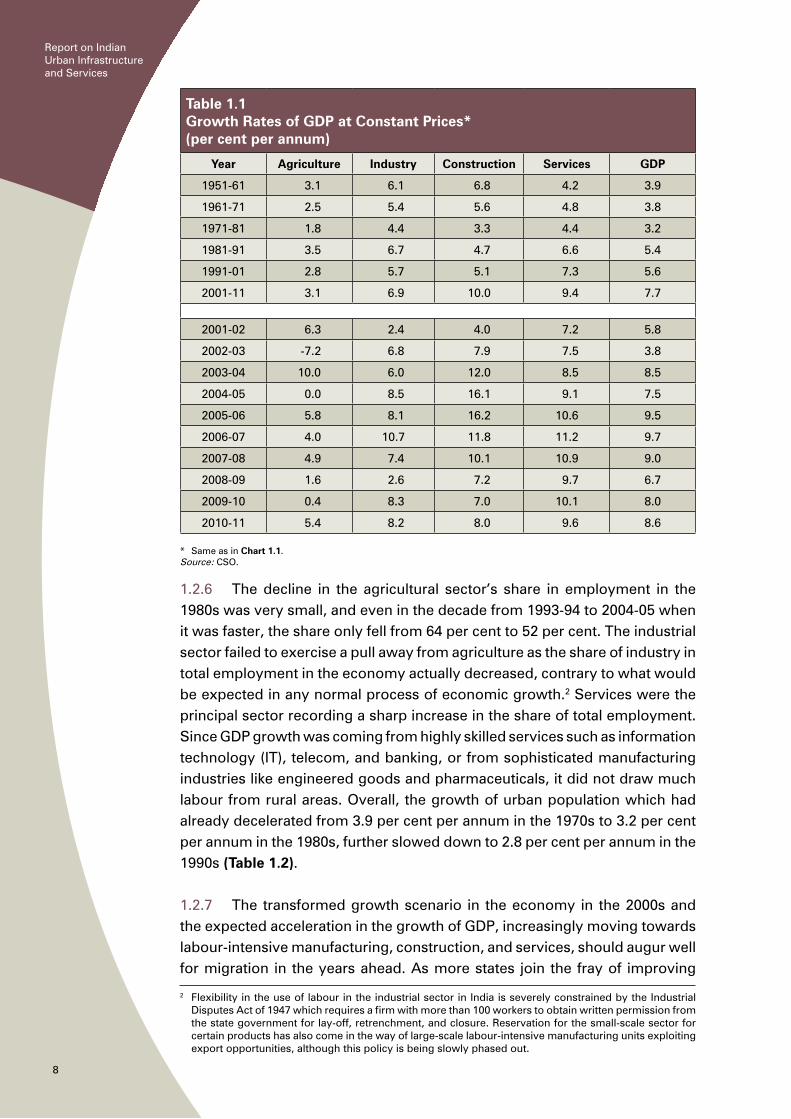
GDP in the industry and services sectors grew at 6.9 and 9.4 per cent per annum during 2001-11, compared with 5.7 and 7.3 per cent per annum respectively in the 1990s. GDP in agriculture grew at 3.1 per cent per annum in 2001-11 compared with 2.8 per cent per annum in 1991-2001, indicating that agricultural growth continued to be much slower than growth in the non-agricultural sectors (Table 1.1).
Chart 1.2Trends in Investment
Source: CSO.
1980
-81
1981
-82
1982
-83
1983
-84
1984
-85
1985
-86
1986
-87
1987
-88
1988
-89
1989
-90
1990
-91
1991
-92
1992
-93
1993
-94
1994
-95
1995
-96
1996
-97
1997
-98
1998
-99
1999
-00
2000
-01
2001
-02
2002
-03
2003
-04
2004
-05
2005
-06
2006
-07
2007
-08
2008
-09
Total 34.3(2008-09)
Private 24.9(2008-09)
Public 9.4(2008-09)
40
35
30
25
20
15
10
5
0
Inve
stm
ent
GD
P r
atio
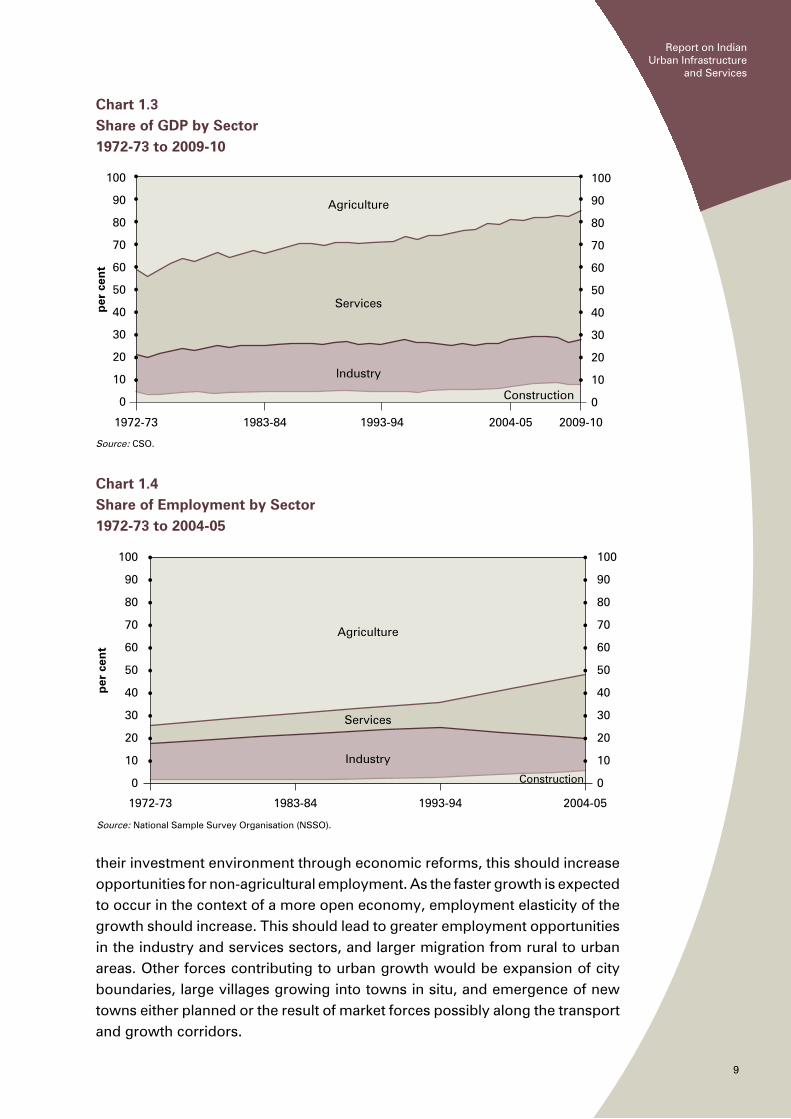
1.2.4 The rapid economic growth has entailed a significant structural transformation in the economy such that the share of agriculture in the GDP has declined from 34 per cent in 1983-84 to about 15 per cent in 2009-10. There has been a sharp increase in the share of services in the GDP from 40 per cent to 57 per cent and some increase in the share of construction, while the share of industry has remained relatively constant at 20 per cent (Chart 1.3).
1.2.5 Structural transformation is typically associated with reduced dependence of the population on agriculture and increased migration from low-productivity agriculture to high-productivity sectors of industry and services in search of employment. Since these sectors are based in urban areas, rapid economic growth is normally associated with urbanisation. The Indian experience of economic growth and structural transformation in the period 1980-2005 (for which employment data are also available by sector), however, is associated with only a moderate decline in the share of agriculture in total employment in the economy (Chart 1.4).
8
Report on Indian Urban Infrastructure and Services
2 Flexibility in the use of labour in the industrial sector in India is severely constrained by the Industrial Disputes Act of 1947 which requires a firm with more than 100 workers to obtain written permission from the state government for lay-off, retrenchment, and closure. Reservation for the small-scale sector for certain products has also come in the way of large-scale labour-intensive manufacturing units exploiting export opportunities, although this policy is being slowly phased out.
Table 1.1Growth Rates of GDP at Constant Prices*(per cent per annum)
Year Agriculture Industry Construction Services GDP
1951-61 3.1 6.1 6.8 4.2 3.9
1961-71 2.5 5.4 5.6 4.8 3.8
1971-81 1.8 4.4 3.3 4.4 3.2
1981-91 3.5 6.7 4.7 6.6 5.4
1991-01 2.8 5.7 5.1 7.3 5.6
2001-11 3.1 6.9 10.0 9.4 7.7
2001-02 6.3 2.4 4.0 7.2 5.8
2002-03 -7.2 6.8 7.9 7.5 3.8
2003-04 10.0 6.0 12.0 8.5 8.5
2004-05 0.0 8.5 16.1 9.1 7.5
2005-06 5.8 8.1 16.2 10.6 9.5
2006-07 4.0 10.7 11.8 11.2 9.7
2007-08 4.9 7.4 10.1 10.9 9.0
2008-09 1.6 2.6 7.2 9.7 6.7
2009-10 0.4 8.3 7.0 10.1 8.0
2010-11 5.4 8.2 8.0 9.6 8.6
* Same as in Chart 1.1.Source: CSO.
1.2.6 The decline in the agricultural sector’s share in employment in the 1980s was very small, and even in the decade from 1993-94 to 2004-05 when it was faster, the share only fell from 64 per cent to 52 per cent. The industrial sector failed to exercise a pull away from agriculture as the share of industry in total employment in the economy actually decreased, contrary to what would be expected in any normal process of economic growth.2 Services were the principal sector recording a sharp increase in the share of total employment. Since GDP growth was coming from highly skilled services such as information technology (IT), telecom, and banking, or from sophisticated manufacturing industries like engineered goods and pharmaceuticals, it did not draw much labour from rural areas. Overall, the growth of urban population which had already decelerated from 3.9 per cent per annum in the 1970s to 3.2 per cent per annum in the 1980s, further slowed down to 2.8 per cent per annum in the 1990s (Table 1.2).
1.2.7 The transformed growth scenario in the economy in the 2000s and the expected acceleration in the growth of GDP, increasingly moving towards labour-intensive manufacturing, construction, and services, should augur well for migration in the years ahead. As more states join the fray of improving
9
Report on Indian Urban Infrastructure
and Services
Chart 1.3Share of GDP by Sector1972-73 to 2009-10
Source: CSO.
1972-73 1983-84 1993-94 2004-05 2009-10
100
90
80
70
60
50
40
30
20
10
0
100
90
80
70
60
50
40
30
20
10
0
per
cen
t
Construction
Industry
Services
Agriculture
Source: National Sample Survey Organisation (NSSO).
Construction
Industry
per
cen
t
1972-73 1983-84 1993-94 2004-05
100
90
80
70
60
50
40
30
20
10
0
100
90
80
70
60
50
40
30
20
10
0
Agriculture
Services
Chart 1.4Share of Employment by Sector1972-73 to 2004-05
their investment environment through economic reforms, this should increase opportunities for non-agricultural employment. As the faster growth is expected to occur in the context of a more open economy, employment elasticity of the growth should increase. This should lead to greater employment opportunities in the industry and services sectors, and larger migration from rural to urban areas. Other forces contributing to urban growth would be expansion of city boundaries, large villages growing into towns in situ, and emergence of new towns either planned or the result of market forces possibly along the transport and growth corridors.
10
Report on Indian Urban Infrastructure and Services
3 Definition of migration does not include seasonal migration.4 A recent survey carried out by National Council for Applied Economic Research (NCAER) and Future
Capital Research (2008) suggests a much larger in-state migration in Coimbatore, Hyderabad, and Chennai compared with cities like Surat, Mumbai, and Bangalore.
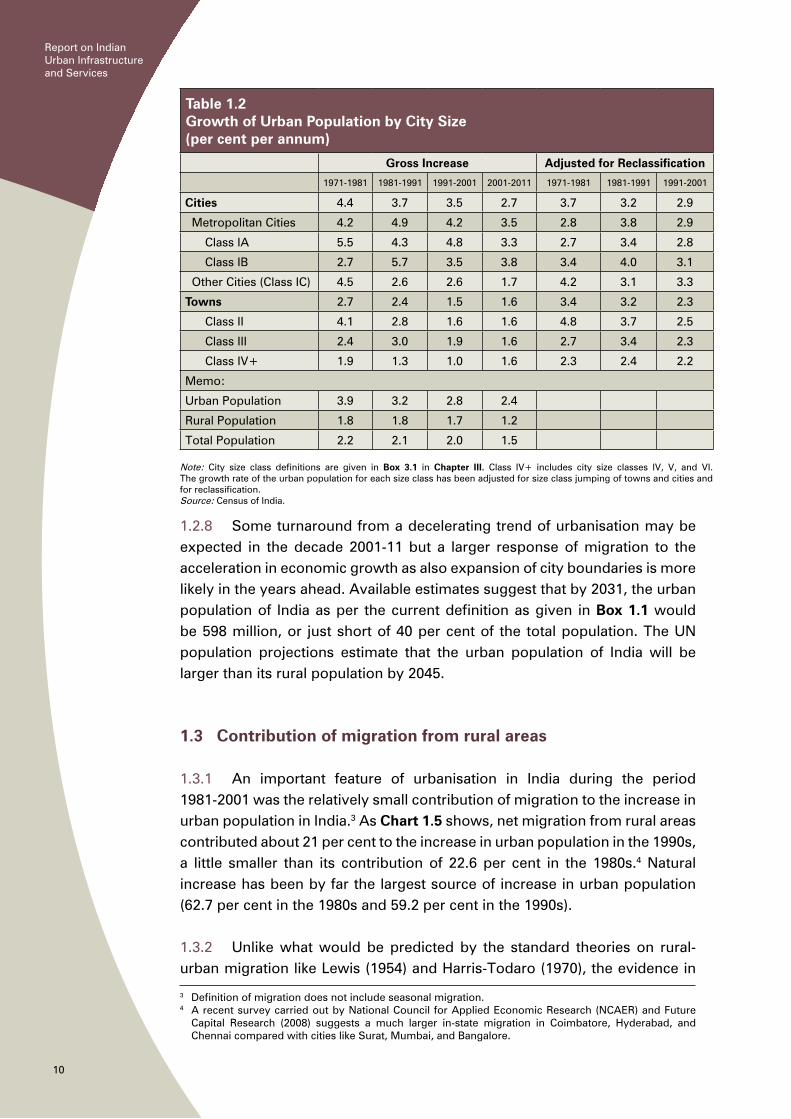
1.2.8 Some turnaround from a decelerating trend of urbanisation may be expected in the decade 2001-11 but a larger response of migration to the acceleration in economic growth as also expansion of city boundaries is more likely in the years ahead. Available estimates suggest that by 2031, the urban population of India as per the current definition as given in Box 1.1 would be 598 million, or just short of 40 per cent of the total population. The UN population projections estimate that the urban population of India will be larger than its rural population by 2045.
1.3 Contribution of migration from rural areas
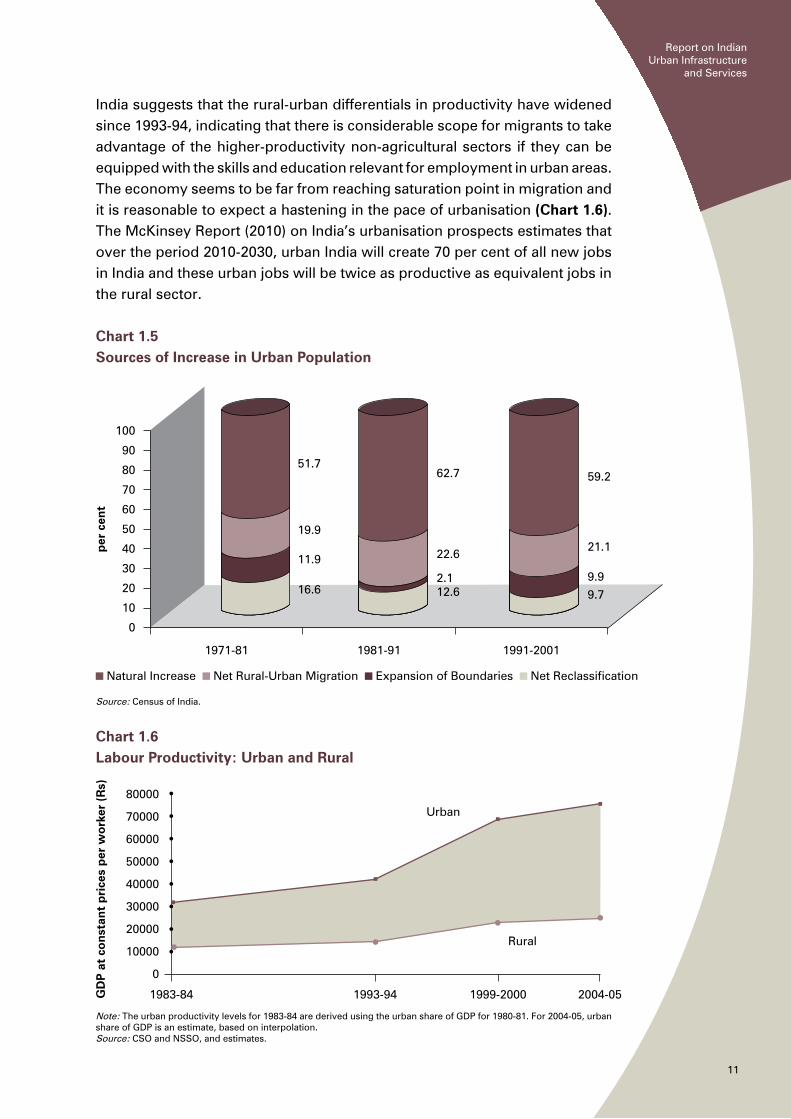
1.3.1 An important feature of urbanisation in India during the period 1981-2001 was the relatively small contribution of migration to the increase in urban population in India.3 As Chart 1.5 shows, net migration from rural areas contributed about 21 per cent to the increase in urban population in the 1990s, a little smaller than its contribution of 22.6 per cent in the 1980s.4 Natural increase has been by far the largest source of increase in urban population (62.7 per cent in the 1980s and 59.2 per cent in the 1990s).
1.3.2 Unlike what would be predicted by the standard theories on rural-urban migration like Lewis (1954) and Harris-Todaro (1970), the evidence in
Table 1.2Growth of Urban Population by City Size(per cent per annum)
Gross Increase Adjusted for Reclassification
1971-1981 1981-1991 1991-2001 2001-2011 1971-1981 1981-1991 1991-2001
Cities 4.4 3.7 3.5 2.7 3.7 3.2 2.9
Metropolitan Cities 4.2 4.9 4.2 3.5 2.8 3.8 2.9
Class IA 5.5 4.3 4.8 3.3 2.7 3.4 2.8
Class IB 2.7 5.7 3.5 3.8 3.4 4.0 3.1
Other Cities (Class IC) 4.5 2.6 2.6 1.7 4.2 3.1 3.3
Towns 2.7 2.4 1.5 1.6 3.4 3.2 2.3
Class II 4.1 2.8 1.6 1.6 4.8 3.7 2.5
Class III 2.4 3.0 1.9 1.6 2.7 3.4 2.3
Class IV+ 1.9 1.3 1.0 1.6 2.3 2.4 2.2
Memo:
Urban Population 3.9 3.2 2.8 2.4
Rural Population 1.8 1.8 1.7 1.2
Total Population 2.2 2.1 2.0 1.5
Note: City size class definitions are given in Box 3.1 in Chapter III. Class IV+ includes city size classes IV, V, and VI. The growth rate of the urban population for each size class has been adjusted for size class jumping of towns and cities and for reclassification.Source: Census of India.
11
Report on Indian Urban Infrastructure
and Services
Note: The urban productivity levels for 1983-84 are derived using the urban share of GDP for 1980-81. For 2004-05, urban share of GDP is an estimate, based on interpolation.Source: CSO and NSSO, and estimates.
GD
P a
t co
nsta
nt p
rice
s p
er w
ork
er (
Rs)
1983-84 1993-94 1999-2000 2004-05
Urban
Rural
80000
70000
60000
50000
40000
30000
20000
10000
0
India suggests that the rural-urban differentials in productivity have widened since 1993-94, indicating that there is considerable scope for migrants to take advantage of the higher-productivity non-agricultural sectors if they can be equipped with the skills and education relevant for employment in urban areas. The economy seems to be far from reaching saturation point in migration and it is reasonable to expect a hastening in the pace of urbanisation (Chart 1.6). The McKinsey Report (2010) on India’s urbanisation prospects estimates that over the period 2010-2030, urban India will create 70 per cent of all new jobs in India and these urban jobs will be twice as productive as equivalent jobs in the rural sector.
Chart 1.5Sources of Increase in Urban Population
Chart 1.6Labour Productivity: Urban and Rural
Source: Census of India.
per
cen
t
1971-81 1981-91 1991-2001
1009080706050403020100
Natural Increase Net Rural-Urban Migration Expansion of Boundaries Net Reclassification
51.7
19.9
16.6
11.9
62.7
22.6
12.62.1
59.2
21.1
9.79.9
12
Report on Indian Urban Infrastructure and Services
Note: PCGSDP stands for per capita gross state domestic product.Source: Estimates based on Census of India data and CSO.
Urb
anis
atio
n 20
08
60
50
40
30
20
10
log (PCGSDP) 2008
10000 20000 30000 40000 50000 60000 70000
60
50
40
30
20
10
Tamil Nadu
Maharashtra
Gujarat PunjabKarnataka
Madhya Pradesh
RajasthanJharkhandUttar Pradesh
West BengalUttarakhand
Chhattisgarh
Haryana
Andhra PradeshKerala
OrissaAssam
Bihar
1.4 Some evidence on urbanisation across the states of India
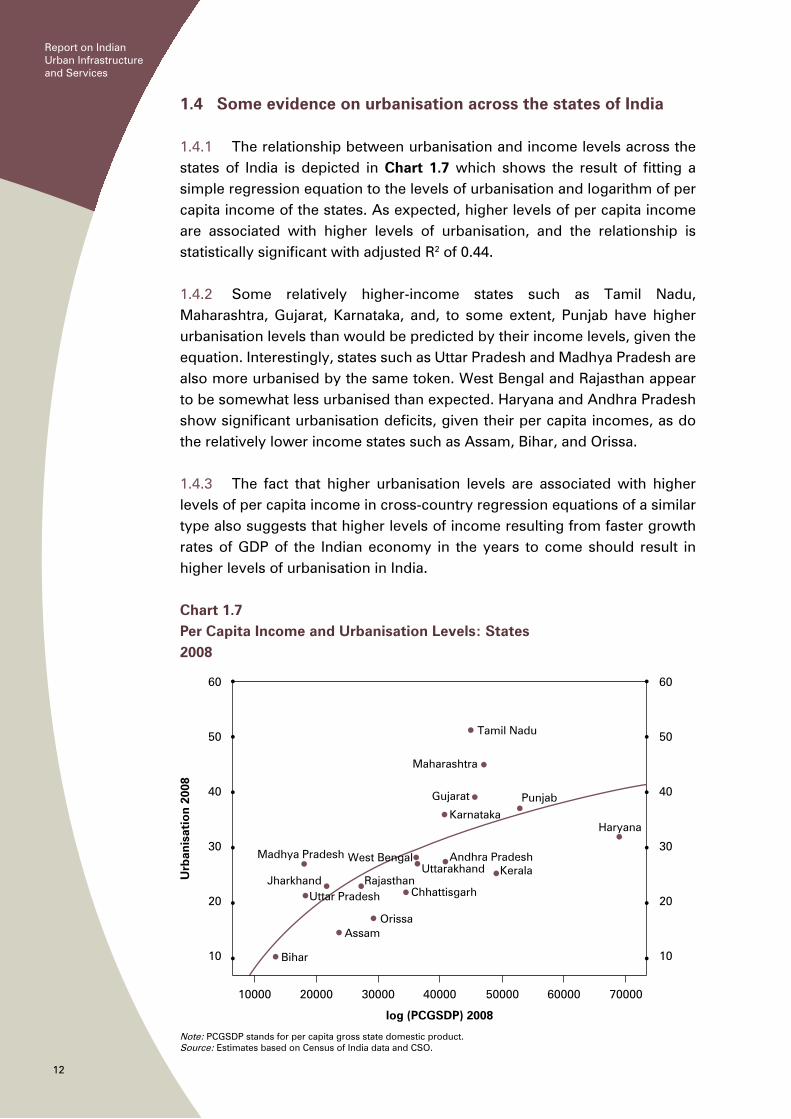
1.4.1 The relationship between urbanisation and income levels across the states of India is depicted in Chart 1.7 which shows the result of fitting a simple regression equation to the levels of urbanisation and logarithm of per capita income of the states. As expected, higher levels of per capita income are associated with higher levels of urbanisation, and the relationship is statistically significant with adjusted R2 of 0.44.
1.4.2 Some relatively higher-income states such as Tamil Nadu, Maharashtra, Gujarat, Karnataka, and, to some extent, Punjab have higher urbanisation levels than would be predicted by their income levels, given the equation. Interestingly, states such as Uttar Pradesh and Madhya Pradesh are also more urbanised by the same token. West Bengal and Rajasthan appear to be somewhat less urbanised than expected. Haryana and Andhra Pradesh show significant urbanisation deficits, given their per capita incomes, as do the relatively lower income states such as Assam, Bihar, and Orissa.
1.4.3 The fact that higher urbanisation levels are associated with higher levels of per capita income in cross-country regression equations of a similar type also suggests that higher levels of income resulting from faster growth rates of GDP of the Indian economy in the years to come should result in higher levels of urbanisation in India.
Chart 1.7Per Capita Income and Urbanisation Levels: States2008
13
Report on Indian Urban Infrastructure
and Services
Source: Estimates based on Census of India data.
Tamil Nadu
Maharashtra
Gujarat
Punjab
Karnataka
Haryana
West Bengal
Andhra Pradesh
Madhya Pradesh
Kerala
0 10 20 30 40 50 60Urban population (per cent)
5 Tamil Nadu got ahead of Maharashtra and Gujarat in the race to urbanisation in the Census of 2001 when more than 1000 rural settlements were classified as urban in all states of India, of which nearly 400 were in Tamil Nadu.
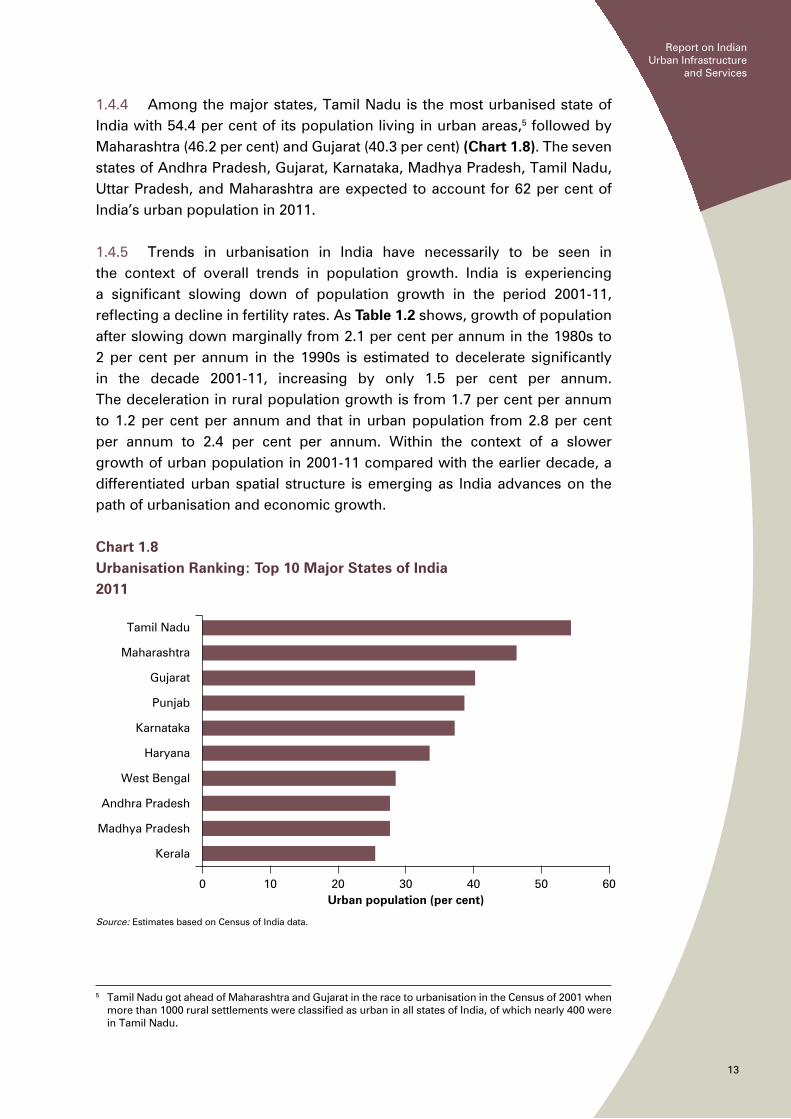
1.4.4 Among the major states, Tamil Nadu is the most urbanised state of India with 54.4 per cent of its population living in urban areas,5 followed by Maharashtra (46.2 per cent) and Gujarat (40.3 per cent) (Chart 1.8). The seven states of Andhra Pradesh, Gujarat, Karnataka, Madhya Pradesh, Tamil Nadu, Uttar Pradesh, and Maharashtra are expected to account for 62 per cent of India’s urban population in 2011.
1.4.5 Trends in urbanisation in India have necessarily to be seen in the context of overall trends in population growth. India is experiencing a significant slowing down of population growth in the period 2001-11, reflecting a decline in fertility rates. As Table 1.2 shows, growth of population after slowing down marginally from 2.1 per cent per annum in the 1980s to 2 per cent per annum in the 1990s is estimated to decelerate significantly in the decade 2001-11, increasing by only 1.5 per cent per annum. The deceleration in rural population growth is from 1.7 per cent per annum to 1.2 per cent per annum and that in urban population from 2.8 per cent per annum to 2.4 per cent per annum. Within the context of a slower growth of urban population in 2001-11 compared with the earlier decade, a differentiated urban spatial structure is emerging as India advances on the path of urbanisation and economic growth.
Chart 1.8Urbanisation Ranking: Top 10 Major States of India2011
14
Report on Indian Urban Infrastructure and Services
1.4.6 The cities of India have been growing in population size.6 In 1951, there were only five metropolitan cities (with population of over 1 million), i.e., Kolkata, Mumbai, Chennai, Hyderabad, and Delhi. Their number increased to 12 in 1981 and 35 in 2001 (Chart 1.9). Their share in urban population increased from 18.9 per cent in 1951 to 27.7 per cent in 1981 and 37.8 per cent in 2001. By 2001, all the original five metropolitan cities had grown to population of over 5 million, and Bangalore had joined their ranks (Table 1.3). The 29 cities which had population between 1 million and 5 million in 2001 included four state capitals, i.e. Jaipur, Lucknow, Bhopal, and Patna, and other cities such as Meerut, Faridabad, Pune, Surat, Nagpur, Kanpur, and Ludhiana (Table A34, Appendix A). As the projections for 2011 show, the number of such cities increases to 50 and their population accounts for 42.3 per cent of the total urban population, and Ahmedabad and Pune join the rank of cities with population over 5 million.
Chart 1.9Metropolitan Cities: Number and Population
Number
Note: The data relates to urban agglomerations with population above 1 million. Source: Census of India and Committee estimates.
57
1951 1961
12
1981 2001 2011
35
5050
45
40
35
30
25
20
15
10
5
02011
50
45
40
35
30
25
20
15
10
5
01951
18.9
1961
23.6
1981
27.7
2001
37.8
42.3
Population (per cent of urban total)
6 The bulk of the increase in population share of large cities has come about as a result of the moving up of cities and towns from the lower size categories to higher ones as cities and towns became larger, a phenomenon commonly known as ‛size-class jumping’ or ‛graduation’ of lower order settlements.
1.4.7 Within the metropolitan cities, the ‛Big Eight’ (Mumbai, Delhi, Kolkata, Chennai, Hyderabad, Bangalore, Ahmedabad, and Pune) with population exceeding 5 million (50 lakh) may have grown at a slower rate than others, but the sheer magnitude of their numbers and their importance in generating agglomeration economies and economic growth call for urgent attention to
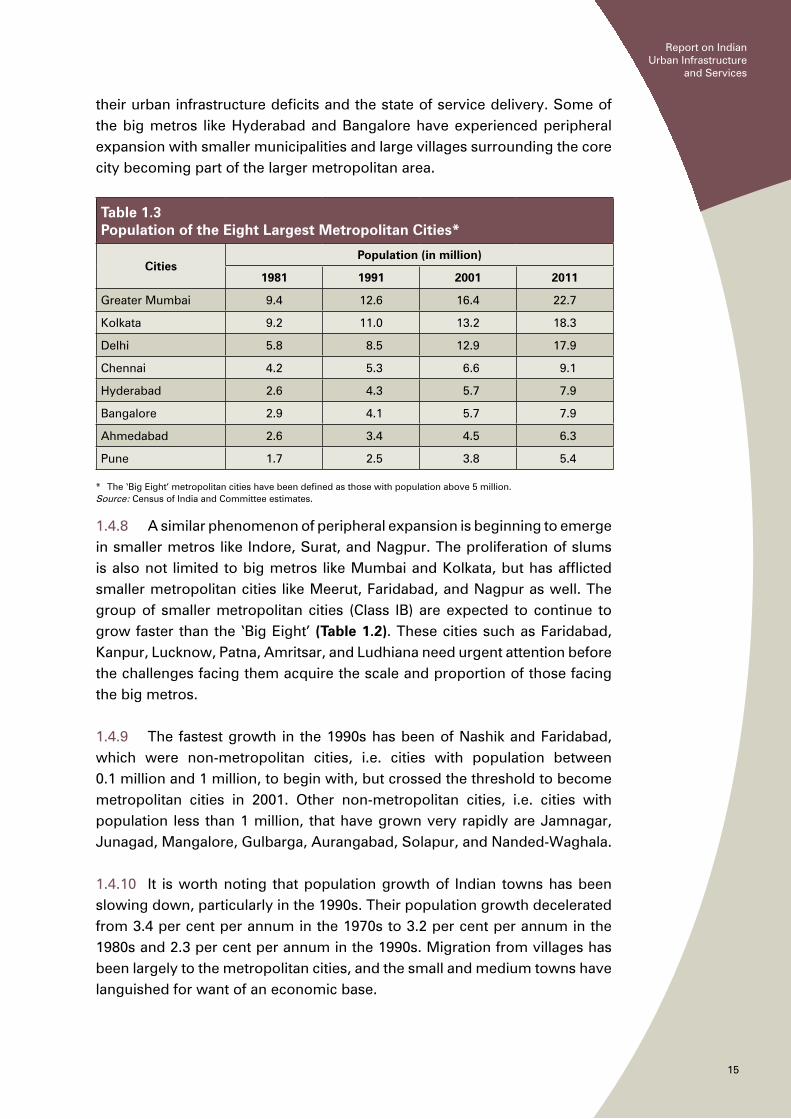
15
Report on Indian Urban Infrastructure
and Services
their urban infrastructure deficits and the state of service delivery. Some of the big metros like Hyderabad and Bangalore have experienced peripheral expansion with smaller municipalities and large villages surrounding the core city becoming part of the larger metropolitan area.
Table 1.3Population of the Eight Largest Metropolitan Cities*
CitiesPopulation (in million)
1981 1991 2001 2011
Greater Mumbai 9.4 12.6 16.4 22.7
Kolkata 9.2 11.0 13.2 18.3
Delhi 5.8 8.5 12.9 17.9
Chennai 4.2 5.3 6.6 9.1
Hyderabad 2.6 4.3 5.7 7.9
Bangalore 2.9 4.1 5.7 7.9
Ahmedabad 2.6 3.4 4.5 6.3
Pune 1.7 2.5 3.8 5.4
* The ‛Big Eight’ metropolitan cities have been defined as those with population above 5 million.Source: Census of India and Committee estimates.
1.4.8 A similar phenomenon of peripheral expansion is beginning to emerge in smaller metros like Indore, Surat, and Nagpur. The proliferation of slums is also not limited to big metros like Mumbai and Kolkata, but has afflicted smaller metropolitan cities like Meerut, Faridabad, and Nagpur as well. The group of smaller metropolitan cities (Class IB) are expected to continue to grow faster than the ‛Big Eight’ (Table 1.2). These cities such as Faridabad, Kanpur, Lucknow, Patna, Amritsar, and Ludhiana need urgent attention before the challenges facing them acquire the scale and proportion of those facing the big metros.
1.4.9 The fastest growth in the 1990s has been of Nashik and Faridabad, which were non-metropolitan cities, i.e. cities with population between 0.1 million and 1 million, to begin with, but crossed the threshold to become metropolitan cities in 2001. Other non-metropolitan cities, i.e. cities with population less than 1 million, that have grown very rapidly are Jamnagar, Junagad, Mangalore, Gulbarga, Aurangabad, Solapur, and Nanded-Waghala.
1.4.10 It is worth noting that population growth of Indian towns has been slowing down, particularly in the 1990s. Their population growth decelerated from 3.4 per cent per annum in the 1970s to 3.2 per cent per annum in the 1980s and 2.3 per cent per annum in the 1990s. Migration from villages has been largely to the metropolitan cities, and the small and medium towns have languished for want of an economic base.
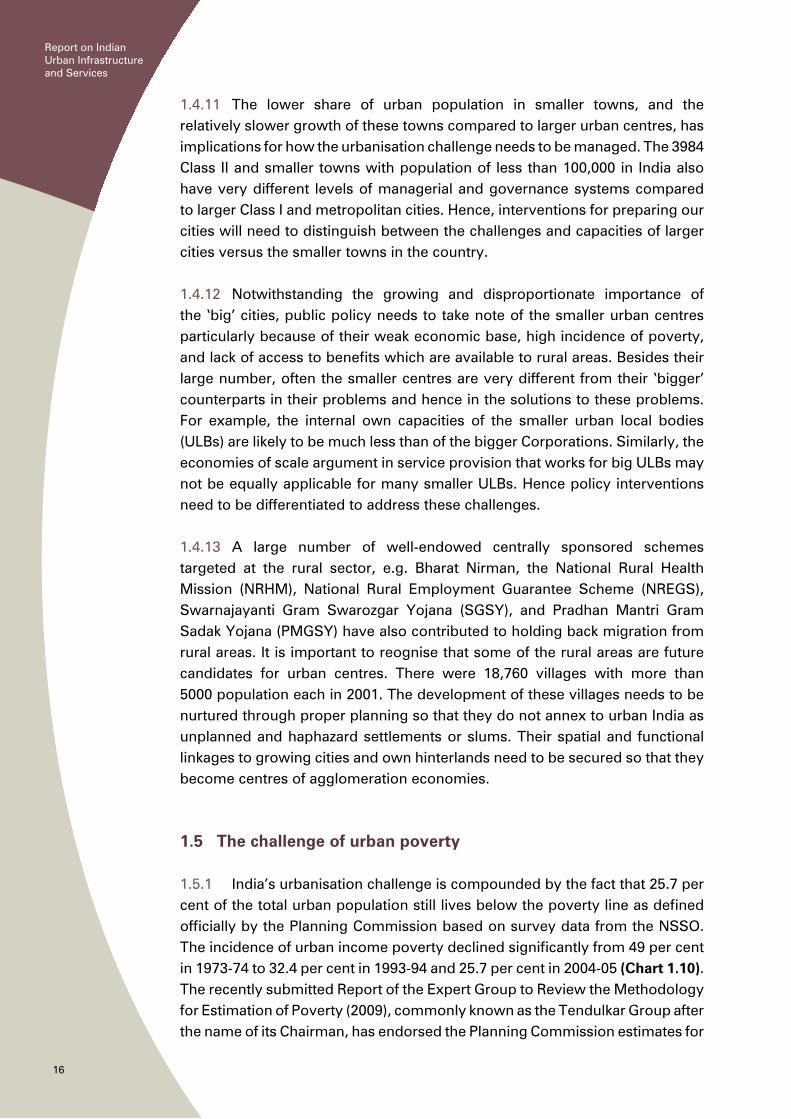
16
Report on Indian Urban Infrastructure and Services
1.4.11 The lower share of urban population in smaller towns, and the relatively slower growth of these towns compared to larger urban centres, has implications for how the urbanisation challenge needs to be managed. The 3984 Class II and smaller towns with population of less than 100,000 in India also have very different levels of managerial and governance systems compared to larger Class I and metropolitan cities. Hence, interventions for preparing our cities will need to distinguish between the challenges and capacities of larger cities versus the smaller towns in the country.
1.4.12 Notwithstanding the growing and disproportionate importance of the ‛big’ cities, public policy needs to take note of the smaller urban centres particularly because of their weak economic base, high incidence of poverty, and lack of access to benefits which are available to rural areas. Besides their large number, often the smaller centres are very different from their ‛bigger’ counterparts in their problems and hence in the solutions to these problems. For example, the internal own capacities of the smaller urban local bodies (ULBs) are likely to be much less than of the bigger Corporations. Similarly, the economies of scale argument in service provision that works for big ULBs may not be equally applicable for many smaller ULBs. Hence policy interventions need to be differentiated to address these challenges.
1.4.13 A large number of well-endowed centrally sponsored schemes targeted at the rural sector, e.g. Bharat Nirman, the National Rural Health Mission (NRHM), National Rural Employment Guarantee Scheme (NREGS), Swarnajayanti Gram Swarozgar Yojana (SGSY), and Pradhan Mantri Gram Sadak Yojana (PMGSY) have also contributed to holding back migration from rural areas. It is important to reognise that some of the rural areas are future candidates for urban centres. There were 18,760 villages with more than 5000 population each in 2001. The development of these villages needs to be nurtured through proper planning so that they do not annex to urban India as unplanned and haphazard settlements or slums. Their spatial and functional linkages to growing cities and own hinterlands need to be secured so that they become centres of agglomeration economies.
1.5 The challenge of urban poverty
1.5.1 India’s urbanisation challenge is compounded by the fact that 25.7 per cent of the total urban population still lives below the poverty line as defined officially by the Planning Commission based on survey data from the NSSO. The incidence of urban income poverty declined significantly from 49 per cent in 1973-74 to 32.4 per cent in 1993-94 and 25.7 per cent in 2004-05 (Chart 1.10). The recently submitted Report of the Expert Group to Review the Methodology for Estimation of Poverty (2009), commonly known as the Tendulkar Group after the name of its Chairman, has endorsed the Planning Commission estimates for
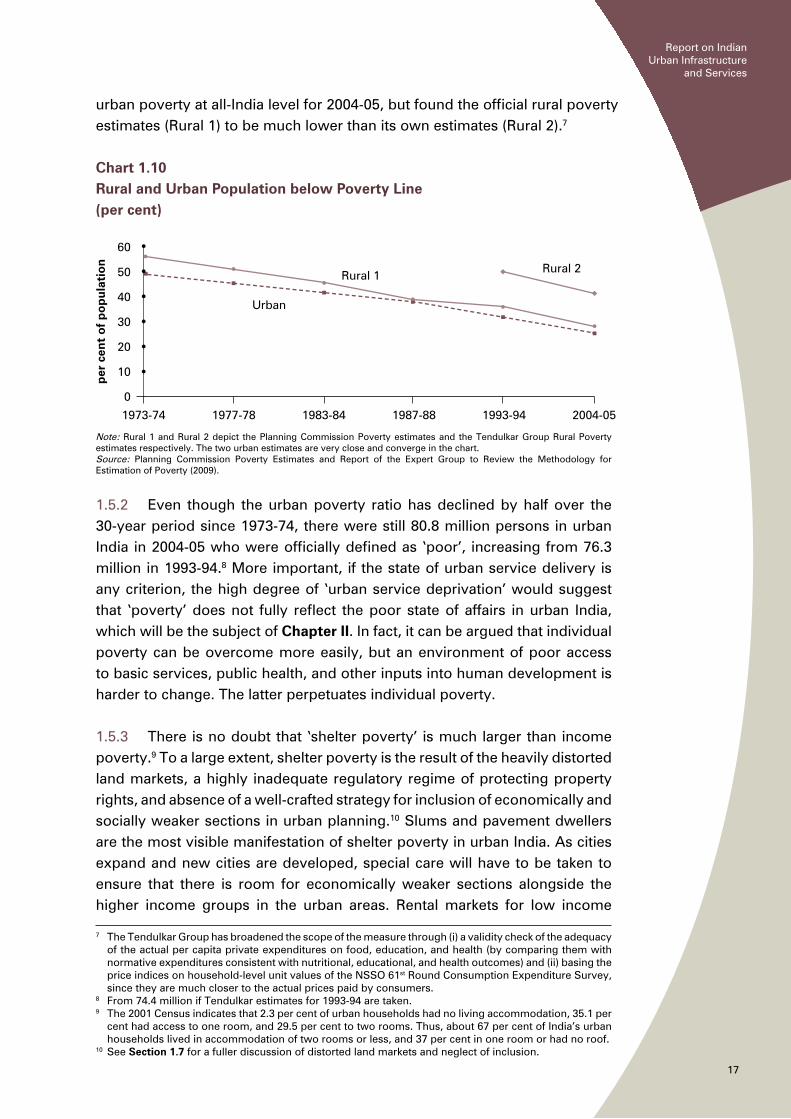
17
Report on Indian Urban Infrastructure
and Services
urban poverty at all-India level for 2004-05, but found the official rural poverty estimates (Rural 1) to be much lower than its own estimates (Rural 2).7
Chart 1.10Rural and Urban Population below Poverty Line(per cent)
7 The Tendulkar Group has broadened the scope of the measure through (i) a validity check of the adequacy of the actual per capita private expenditures on food, education, and health (by comparing them with normative expenditures consistent with nutritional, educational, and health outcomes) and (ii) basing the price indices on household-level unit values of the NSSO 61st Round Consumption Expenditure Survey, since they are much closer to the actual prices paid by consumers.
8 From 74.4 million if Tendulkar estimates for 1993-94 are taken.9 The 2001 Census indicates that 2.3 per cent of urban households had no living accommodation, 35.1 per
cent had access to one room, and 29.5 per cent to two rooms. Thus, about 67 per cent of India’s urban households lived in accommodation of two rooms or less, and 37 per cent in one room or had no roof.
10 See Section 1.7 for a fuller discussion of distorted land markets and neglect of inclusion.
Note: Rural 1 and Rural 2 depict the Planning Commission Poverty estimates and the Tendulkar Group Rural Poverty estimates respectively. The two urban estimates are very close and converge in the chart. Source: Planning Commission Poverty Estimates and Report of the Expert Group to Review the Methodology for Estimation of Poverty (2009).
60
50
40
30
20
10
0
Urban
Rural 1 Rural 2
2004-051993-941987-881983-841977-781973-74
per
cen
t o
f p
op
ulat
ion
1.5.2 Even though the urban poverty ratio has declined by half over the 30-year period since 1973-74, there were still 80.8 million persons in urban India in 2004-05 who were officially defined as ‛poor’, increasing from 76.3 million in 1993-94.8 More important, if the state of urban service delivery is any criterion, the high degree of ‛urban service deprivation’ would suggest that ‛poverty’ does not fully reflect the poor state of affairs in urban India, which will be the subject of Chapter II. In fact, it can be argued that individual poverty can be overcome more easily, but an environment of poor access to basic services, public health, and other inputs into human development is harder to change. The latter perpetuates individual poverty.
1.5.3 There is no doubt that ‛shelter poverty’ is much larger than income poverty.9 To a large extent, shelter poverty is the result of the heavily distorted land markets, a highly inadequate regulatory regime of protecting property rights, and absence of a well-crafted strategy for inclusion of economically and socially weaker sections in urban planning.10 Slums and pavement dwellers are the most visible manifestation of shelter poverty in urban India. As cities expand and new cities are developed, special care will have to be taken to ensure that there is room for economically weaker sections alongside the higher income groups in the urban areas. Rental markets for low income
18
Report on Indian Urban Infrastructure and Services
housing will have to be developed. There is also need for promoting access to home-ownership through necessary interventions in the market for low income housing.
1.5.4 In 1991, 21.3 per cent of the total urban population lived in slums according to the Census of India. In 2001, there was no complete Census but an enumeration of 1743 cities and towns by the Census Office showed that 23.5 per cent of the total urban population lived in slums. The proliferation of slums in metropolitan cities has become so extensive that as of 2001, 54 per cent of the total population of Mumbai lives in slums. Faridabad and Meerut are marginally trailing with 45 per cent of their population in slums. Even Aligarh, a non-metropolitan city, has 45 per cent of its population in slums.
1.5.5 Most of the slum settlements lack water and sanitation systems and are often located in high-risk areas of cities. In many cases, entire townships have emerged in slum developments operating within the framework of an informal economy. Not all slum dwellers are poor, however. Some non-poor live in slums because rent control laws have created extreme scarcity of housing for low income groups. All this has profound implications not only for environmental degradation but also for the productivity of those who live in slums with huge underprovision of basic urban services.
1.6 Preparing India’s cities
1.6.1 The cities of India need to be prepared for playing their new role of hosting rapid growth and providing services for an inclusive society. Not only do cities need much more by way of basic infrastructure but systems have to be put in place so that (i) a socio-economic environment can be created for innovation and investment, (ii) effective delivery of public services of specified standards is assured for all including the poor for whom it should be affordable, and (iii) affordable housing for the poor is also assured. This would require more public financial resources and more public goods, bringing the delivery of services to standard norms for all, greater willingness on the part of citizens and businesses to pay taxes and user charges for services, and a process of complementary urban-rural development.
i. Agglomeration vs congestion
1.6.2 As economies move to a more mature phase of development, they become more knowledge-based and service-oriented. Notwithstanding the IT revolution and ‛death of distance’ arguments, there are aspects of agglomeration and the resultant spatial concentration which remain intrinsic to the industry and services sectors.
19
Report on Indian Urban Infrastructure
and Services
Box 1.3Reshaping Economic GeographyCities, migration, and trade have been major catalysts of progress in the developed world over the past two centuries. These stories are now being repeated in the developing world’s most dynamic economies. Growing cities, ever more mobile people, and increasingly specialised products are integral to development. These changes have been most noticeable in North America, Western Europe, and Northeast Asia. But countries in East and South Asia and Eastern Europe are now experiencing changes that are similar in their scope and speed.
Just as a primary city forms the core of a country’s metropolitan area with adjacent cities, other large urban centres or secondary cities act as regional foci for both the economy and society. For example, they are the local centres for the financial sector, which serve the areas around them. Smaller cities within these areas constitute more specialised urban centres, typically focusing on manufacturing and the production of traditional and standardised items. Symbiosis is the ruling order. The larger cities depend on the smaller ones for the daily provision of workers through commuting. Towns draw sustenance from the agricultural activity of rural areas, but their prosperity also spills over to villages by providing non-farm employment opportunities. Towns act as market centres for agricultural and rural output, as stimulators of rural non-farm activity, as places of seasonal job opportunities for farmers, and as providers of secondary education and health care services.
Economic growth can be unbalanced. To try to spread out economic activity evenly is to discourage it. The way to get the benefits of uneven growth as well as inclusive development is through economic integration. Encouraging mobility of people is the priority, and institutions that make land markets work better and provide security, schools, streets, and sanitation should be the mainstay of integration policy.
The World Development Report 2009 argues that some places are doing well because they have promoted transformations along the three dimensions of economic geography:
Higher densities, as seen in the growth of cities;• Shorter distances, as workers and businesses migrate closer to density;• Fewer divisions, as countries thin their economic borders and enter world markets to • take advantage of scale and specialisation.
In places urbanising rapidly, governments must put in place, in addition to institutions, connective infrastructure so that the benefits of rising economic density are more widely shared.
1.6.3 Cities tend to be the reservoirs of skill and capital and centres of knowledge and innovation. The proximity of firms, individuals, and institutions gives rise to agglomeration economies that play an important role in lowering the costs of new firms as they enter the manufacturing and services sectors. Agglomeration economies arise from localisation and urbanisation. Box 1.3 presents the perspective of the World Development Report (2009) on the importance of economic integration through encouraging mobility of people and bringing about institutional reforms, which make land markets work better.
Source: World Development Report (2009).

20
Report on Indian Urban Infrastructure and Services
1.6.4 Localisation economies arise from the advantages of locating firms of an industry in a neighbourhood so that when the scale of an activity expands, the production of many intermediate services becomes profitable. This improves access of co-located firms to specialised suppliers of intermediate inputs of goods and services and also to a pool of skilled workers. Clustering of firms also reduces the uncertainty in the adoption of new technology through smooth flow of information and technology spillovers. Intra-industry spillovers are localisation externalities.
1.6.5 Urbanisation economies accrue to all firms located in an urban area and result from the scale and diversity of the entire urban area. The larger and more diverse markets enable greater division of labour. A large concentration of firms and individuals results in reduction of transactions costs, sharing of risks, and better matching of skills to jobs. Ease of contact and informational spillovers between firms and individuals make cities the centres of technological innovation and diffusion. An additional feature of urbanisation in developing economies is the creation of large urban informal sectors which are not captured by the standard sources of data.
1.6.6 Agglomeration economies rely on provision of basic urban infrastructure services in general, and urban transport infrastructure in particular. In the absence of the latter, diseconomies could set in from traffic congestion, environmental degradation, deterioration in civic services, and air and water pollution. In order for cities to perform their role as engines of economic growth and innovation, it is very important to integrate the competing demands of commerce, transport including public transport, and housing including affordable housing for the poor.11 The challenge lies in augmenting the agglomeration advantages of cities while minimising their congestion diseconomies.
ii. Creating synergy with rural development
1.6.7 In industrialised economies, economic activity in urban areas accounts for as much as 80 per cent of GDP. The urban share of economic activity in less-developed economies is typically around 50 per cent. In India, in 1999-2000, cities and towns contributed 51.7 per cent to the GDP, and the share is estimated to be around 62 per cent in 2009-10 (Chart 1.11).
1.6.8 By investing in urban infrastructure, putting in place systems of public service delivery which cater to the service norms for one and all, and planning for transport and housing with special attention to affordable housing for the poor, inclusive urbanisation can replace parasitic urbanisation which
11 Housing also acts as a source of agglomeration by its important role in generating economic activity through its multiple linkages with several sectors.

21
Report on Indian Urban Infrastructure
and Services
is otherwise inevitable. District Planning Committees (DPCs) can play a very important role in integrating rural and urban planning.12
1.6.9 As the agglomeration economies in cities energise industrial growth in a new competitive environment, there will be synergetic linkages with agriculture. The revival of the agricultural sector itself is crucially linked to the manner in which growth in the industry and services sectors unfolds. While investments in agricultural R&D (research and development), soil and water management, and biodiversity in the wake of climate change are important to realise the supply potential of agriculture in India, the quantum and quality of value addition in agriculture will be increasingly determined by growth of the non-agricultural sector. For example, in the high value agricultural sector (including fruits and vegetables, livestock, fishery), which accounts for about half of the value of agricultural produce in India, more than half the value addition takes place after these products leave the farms.
Chart 1.11Urban Share of GDP (per cent)
12 It appears that states are constituting DPCs mainly to ensure that the Backward Region Grant Fund from the Ministry of Panchayati Raj and the Jawaharlal Nehru National Urban Renewal Mission (JNNURM) Fund from the Ministries of Urban Development and Housing and Urban Poverty Alleviation are not stopped under reform conditionalities.
Source: CSO and Eleventh Five Year Plan.
70
60
50
40
30
20
10
0
per
cen
t
1970-71 1980-81 1993-94 1999-2000 2009-10
1.6.10 As urbanisation grows, food budgets of households will be spent more on fruit, vegetables, milk, etc., and more food will have to be transported from rural hinterlands to urban demand centres. This will lead to more investments in infrastructure, logistics, processing, packaging, and organised retailing. These investments connect and build synergy between rural India and urban centres. They ensure not only efficient supply lines but also seamless flow of goods from rural to urban areas and substantially increased incomes for farmers (Gulati et al. 2011).
1.6.11 People living in rural areas typically tap the opportunities that cities provide for employment, entrepreneurial avenues, learning, and monetary
22
Report on Indian Urban Infrastructure and Services
repatriation. The boundaries of urban settlements are usually more blurred than may be portrayed by administrative delimitations. Technologies like mobile phones and satellite television have further blurred the rural-urban divide. Policies can play an important role in generating an urban-rural synergy rather than fearing a rural-urban divide.
1.6.12 Cities perform a critical role in generating resources for both urban and rural development by creating an agglomeration-related tax base. Funding of rural programmes would simply not happen unless cities develop and generate revenues of central, state, and local governments for both urban and rural development. This is the basic argument for urbanisation as an engine of rural development and overall economic development.
1.6.13 Rising standards of living in India’s urban areas in the post-reform period appear to have had significant distributional effects favouring the country’s rural poor (Datt and Ravallion 2009). They document that the non-farm sectors that use unskilled labour more intensively, notably trade, construction, and ‛unorganised’ manufacturing, have seen higher employment growth in the post-reform period, because the urban and rural sectors are now positively interlinked in a number of ways through trade, migration, and transfers. While the rural poor have benefited more from urban economic growth in the post-reform period, they are also likely to be more vulnerable in the future to urban-based economic shocks. The fortunes of the rural and urban populations will be increasingly linked in the years to come.
1.6.14 Whether it is through agglomeration economies in existing and expanding cities or through location of industry in Industrial Corridors or Special Economic Zones or through developing new towns in the rural periphery, urban settlements and cities will play a very important role in India’s new dynamics of growth. India today is at a crossroads where Jane Jacobs’ message has supreme relevance. India’s policymakers and planners must ensure that cities are provided with infrastructure and governance systems so that they can perform their new role effectively. At India’s current stage of development, it is not only expected that there will be an increase in migration to cities in search of high-productivity jobs, but also that cities will act as engines of rural development.
1.7 Planning for urbanisation
1.7.1 Preparing India’s cities for a rapid growth scenario will require a paradigm shift in planning for urban infrastructure and reforming the institutions for service delivery. Regional and urban planning have an important role to play in generating new spaces and in rejuvenating existing city spaces

23
Report on Indian Urban Infrastructure
and Services
so that a healthy socio-economic environment can be created in which the fast-growing urban population of India can live with higher standards of public service delivery and contribute to growth.
1.7.2 In view of the fact that the Indian strategy of industrialisation was crucially anchored in a framework of centralised planning, it is ironic that planning was conspicuous by its absence in the urban sector, and that socio-economic planning was not linked to spatial planning. Even the limited attention that urban development received from central planners was conditioned by a misperception that large cities of India have grown very rapidly and that migration from rural areas to the large cities needs to be consciously diverted towards small and medium towns. Instead of exploiting ‛agglomeration economies’ to drive the efficiency of cities and thereby their growth potential and creativity, attention was focused on the rhetoric of ‛diversion’.13
1.7.3 The Fourth and the Fifth Five Year Plans covering the period 1969-79 explicitly envisaged the creation of smaller towns in order to prevent further growth of population in large cities. The National Commission on Urbanisation in its report in 1988 had stressed the need to reap the benefits of agglomeration economies. The Seventh Five Year Plan (1987-92) recognised that ‛urbanisation is a phenomenon which is part and parcel of economic development. Certain activities are best performed in, indeed require, agglomeration of people.’ Subsequently, at the time that India launched market-oriented economic reforms in the early 1990s, the Eighth Five Year Plan (1992-97) identified the widening gap between the demand and supply of urban services, the rapid growth of urban population aggravating the accumulated backlog of shortages of housing and infrastructure, and high incidence of urban poverty. But even then, urban planning received inadequate attention.
1.7.4 A beginning was made with the 74th Constitutional Amendment Act of 1992, which mandated the setting up of elected municipalities as ‛institutions of self-government’ thereby creating political space for ULBs within India’s federal framework, and recommended that state governments devolve a specified set of functions to the local governments. The ability of the ULBs to deliver urban services depends not only on devolution of functions (including planning of land use) and funds, which is very important, but also on helping them build capacities to fulfil their responsibilities. The Megacity Programme for Infrastructure Development in the Ninth Plan and the Urban Reform Incentive Fund (URIF) in the Tenth Plan were attempts at building capacity, but they proved to be ineffective and were short-lived.
13 The intervention in small and medium towns through the scheme of Integrated Development of Small and Medium Towns (IDSMT) was also half-hearted and state governments focused largely on bus-stands, shopping complexes, etc.

24
Report on Indian Urban Infrastructure and Services
1.7.5 As the Indian economy engages in major structural transformation, planning for urbanisation requires coordination at all levels of government. At present, state legislations for urban planning provide for an overbearing and overriding role of state governments. Most local-level decisions are subject to approval by the state government. Moreover, the state government is given overriding powers to alter urban plans. This not only robs cities of any autonomy in deciding their own future and thwarts innovation and change, but also considerably slows down the urban planning process.
1.7.6 The Constitution recommends that land use planning be transferred to ULBs, but in most states this is still entrusted to Development Authorities and/or Town Planning Departments of state governments, which are accountable only to state governments. Master Plans are technical exercises prepared by the Development Authorities, based on a spatial planning framework, segregating residential from commercial and institutional uses. A flexible approach will be to opt for mixed land use which may suit the requirements of many Indian cities.
1.7.7 The heavily distorted land market is a major challenge for planners as urbanisation gathers momentum in the context of sustained rapid growth of the economy. Zoning and development control rules in Indian cities limit the supply of land that can be devoted to commercial, industrial, or residential use. Significant holdings of public land keep large portions of well-located land outside of the market. Cumbersome and time-consuming rural-urban land conversion rules greatly increase the cost of expanding built spaces at the urban periphery and open up ‛rent-seeking’ opportunities. Laws such as the Urban Land Ceiling and Regulation Act (ULCRA) have put many properties under litigation and thus kept them outside the supply of developable urban space.14
1.7.8 The Committee is aware of the very high costs and the arduous and time-consuming processes of land acquisition. It recognises their importance for the planning of urban infrastructure and housing for the low income groups and the poor. Not including these costs in the calculations of the estimated investment requirements leads to a significant underestimation of these costs, but in the current scenario, these costs are inherently unpredictable. However, new models of land assembly are emerging with farmers as stakeholders, e.g. in Magarpatta (Pune), Vijaywada, Ahmedabad, and Jaipur.
1.7.9 Planning for urbanisation has to invest in building ‛compact cities’ which save on network infrastructure. A major challenge for urban planning in India is to allow the market to promote agglomeration and population density
14 Sridhar (2010) points out that of the 25,000 acres of land which is estimated to have been freed by the repeal of ULCRA, only 10,000 acres is in the developed zone, the rest falling in restricted zones, i.e. coastal zones or forest lands.

25
Report on Indian Urban Infrastructure
and Services
while specifying within a planned framework the maximum floor space that may be built in given neighbourhoods. The importance of density was highlighted as early as 1983 when the Task Force on Housing and Urban Development submitted its Report to the Planning Commission. In its words, ‛Most Indian cities, paradoxically enough, are not built densely enough, do not make use of modern construction technologies enough to augment their economic, manufacturing, servicing, wealth producing and residential viability. A very economical and practical way of rejuvenating such towns and cities....is to renew and redensify their inefficiently used space and derelict structures.’ In actual practice, the regulations with respect to maximum Floor Area Ratio (FAR)/Floor Space Index (FSI) prevailing in Indian cities essentially set the rate of substitution between capital and land at very low and inflexible levels, even in the largest cities. Maximum residential FAR/FSI in major cities around the world is above 10, while in India it does not exceed 4 and is often much lower. In the island city of Mumbai, one of the most expensive real estate locations in the country, it is set at a very low level of 1.33.
1.7.10 The FAR/FSI rules are also relaxed on a highly selective and non-transparent basis without ensuring that infrastructure is put in place to support the increased density. In Mumbai, for example, the rights of FAR/FSI exceptions are traded, and higher densities are allowed to spread arbitrarily through the city rather than in areas where infrastructure could be built to support the higher density. In actual practice, the FAR/FSI restrictions do not prevent density as they are intended to. They merely affect how much built space is formal and how much informal and illegal.
1.7.11 Master Plans of Indian cities have also typically not been inclusive in accommodating the needs of the low income groups and the poor. One exception is the Town Planning Scheme of Gujarat in which 10 per cent of land is reserved for socially and economically weaker sections. By contrast, when the Delhi Master Plan 2021 was announced in 2007, it envisaged inclusive development for the poor by reserving land for the lowest income segments for home and work but the provision is yet to be operationalised. In general, these Plans in Indian cities have made no reservation of space for the poor, even though the poor provide the much-needed semi-skilled and unskilled labour to match the needs of skilled labour and capital in the cities. The mandatory City Development Plan (CDP) under JNNURM was expected to incorporate some basic principles of land use and take an integrated view of public transport and housing including affordable housing for the poor, but the CDP became a hastily put together instrument for supporting project proposals.
1.7.12 The larger aspects of planning at the metropolitan, regional, and national levels have also received very little attention. Master Plans typically view cities in isolation from the larger region in which they are located.
26
Report on Indian Urban Infrastructure and Services
The procedures for the preparation and implementation of the Master Plans have tended to be rigid, time-consuming, and weak on the costing and financing of the future requirements of infrastructure. While cities are fast-growing and dynamic entities, Master Plans have remained largely static.
1.7.13 The Ministry of Urban Development, Government of India has taken a step in the right direction by requiring that all cities prepare Comprehensive Mobility Plans (CMPs) before accessing any funds from the Government of India, but this has not worked. The CMPs are mostly intricate modelling exercises which have a wish list of the city’s infrastructure needs rather than land use transportation integration plans. Urban planning has to go hand in hand with transport planning. For this, it is essential to think of a regional or metropolitan plan and not just a municipal plan. 1.7.14 The Report of the Expert Committee on Governance in the Bangalore Metropolitan Region and the Bruhat Bangalore Mahanagara Palike (2008) had emphasized the importance of a metropolitan-level institution for better strategic planning and coordination. The Report had not only recommended that the Metropolitan Planning Committee be vested with the necessary executive power by law but that it should have the statutory power to overrule plans of ULBs on issues which have regional significance. In a similar vein, Bombay First Report (2009) emphasized the importance of metropolitan planning for improving the quality of governance in Mumbai. A number of Metropolitan Regional Development Authorities have been set up, e.g. in Delhi, Mumbai, Hyderabad, Bangalore, Chennai, and Kolkata, but their regional vision and planning has remained more on paper than on the ground.
1.7.15 A growth region covers a number of cities/towns and the area between these cities/towns becomes a hub for investments – private or public, stimulated by market forces and/or policy thrust. This has become no-man’s-land as far as urban planning is concerned. At the current stage of India’s development where the private sector is playing an important role in driving the growth process, market forces will by and large shape the future of India’s cities. Urban planning needs to become dynamic and flexible to adjust to the changing realities.
1.7.16 Urban planning in India must also draw upon India’s rich heritage of culture and architecture. This is reflected in its urban morphology and building patterns that exist in the cities and towns of India. Cultural spaces to cater to the aesthetics of art, culture, theatre, music and dance are crucial for broadening mental horizons. Since theatre and the arts can engage in bridging the isolation of groups and communities, they can play an important role in contributing to inclusive development in a growing megapolis which is cosmopolitan in spirit. Also, community halls, civic spaces, public libraries, parks, playgrounds and open green spaces that act as lungs of the city, must
27
Report on Indian Urban Infrastructure
and Services
be provided adequate space and resources, because of their contribution to enhancing the quality of life of their citizens.
1.7.17 Another aspect of planning which requires special attention is the development and renewal of inner city areas in heritage towns/cities. These areas are often classified as slums, but the presence of heritage structures and traditional crafts adds a new dimension to their renewal. The Ministry of Urban Development and Ministry of Culture have jointly developed Model Bye-laws for the protection of heritage buildings and heritage areas, but urban planning has failed to include heritage as an important anchor in urban renewal. Bapat et al. (2010) provide a case study of Kacchpura, Agra where experts and non-governmental organisations (NGOs) worked closely with the community to redevelop the inner city area of Agra opposite the Taj Mahal.
1.7.18 Finally, urban planning has to take into account considerations of climate change which will gain further importance in the years ahead. The main areas that are relevant in this context are energy efficiency of buildings (e.g. harnessing solar energy) and public transport, and management of waste in urban areas. The scope for saving energy by appropriate design of buildings is very large and since urbanisation of India is expected to grow rapidly from a rather low level, India has the ‛advantage’ of not having yet built the urban infrastructure of tomorrow. Some estimates suggest that 70 per cent of the commercial buildings that will exist in Indian cities in 2030 have yet to be built. Incorporating energy efficiency as a prime consideration in the development of this capital stock can make a big difference to the total use of energy and carbon emissions. The Government of India can achieve the switch to energy-efficient buildings by setting an example in its own construction and by laying down building standards which promote the switch and provide incentives for doing so.
1.7.19 Equally important is the need to plan Indian cities so that they maximise the reliance on public transport which is much more energy efficient than private automobiles. Urban transport planning should consciously involve incentives to promote the use of public transport through the construction of high-quality public transport systems including bus rapid transit systems (BRTS) and metros. Private transport can be discouraged through congestion taxes and appropriate parking charges in all commercial areas.
1.7.20 The National Mission on Sustainable Habitat (2010) is one of the eight missions under the National Climate Change Action Plan. It aims to make cities sustainable through improvements in energy efficiency of buildings, management of solid waste, and shift to public transport. It will broadly cover (i) extension of the energy conservation building code, which addresses the design of new and large commercial buildings to optimise their energy demands, (ii) better urban planning and modal shift to public transport, i.e.
28
Report on Indian Urban Infrastructure and Services
making long-term transport plans to facilitate the growth of medium and small cities in such a way that ensures efficient and convenient public transport, and (iii) recycling of material and urban waste management, a special area of focus being the development of technology for producing power from waste. The National Mission will include a major R&D programme, focusing on biochemical conversion, waste-water use, sewage utilisation, and recycling options, wherever possible.
1.7.21 Policies at national level need to be supplemented with a number of initiatives by state governments and local governments. For example, local governments will need to develop building codes that incorporate efficiency in the use of energy and water and enforce the same. Mitigation would have major benefits not only in respect of reducing emissions of greenhouse gases but also in generating higher energy security for the country, lower levels of air pollution and therefore the attendant health benefits, and the likely gains in employment generation. Equally important is the need for cities to build capacity for adapting to the impacts of climate change. These would relate to dealing with changes in water availability, disaster management as well as coping with floods, droughts, heat waves, and extreme precipitation events. In some locations where the rising sea level presents a threat, adaptation measures including investment in appropriate infrastructure would be essential.
1.7.22 Surat has set a good example by constituting the Surat City Advisory Committee which will prepare a strategy to respond to the challenges of climate change. More than three-fourths of Surat’s population is in the coastal plains and is at risk from the overflowing of river Tapti, as witnessed during the floods of 2006. The city is one of the 10 cities selected under the Asian Cities Climate Change Resilience Network of the Rockefeller Foundation. Under this initiative, local institutions and experts are studying impacts of climate change on health, energy, transport, and housing.
1.8 JNNURM: An assessment
1.8.1 The Government of India has signalled the importance of the urban sector for the Indian economy by launching a major initiative in the form of the Jawaharlal Nehru National Urban Renewal Mission (JNNURM) in December 2005. The Mission aims at improving and augmenting the economic and social infrastructure of cities as well as affordable housing and basic services to the urban poor. In trying to make Indian cities economically productive, efficient, and inclusive, it promotes reforms at state and city levels by making the funding for JNNURM projects conditional on reforms. A major achievement of the JNNURM has been to highlight the urban agenda of reforms and create dynamism in a sector which has long suffered from neglect.
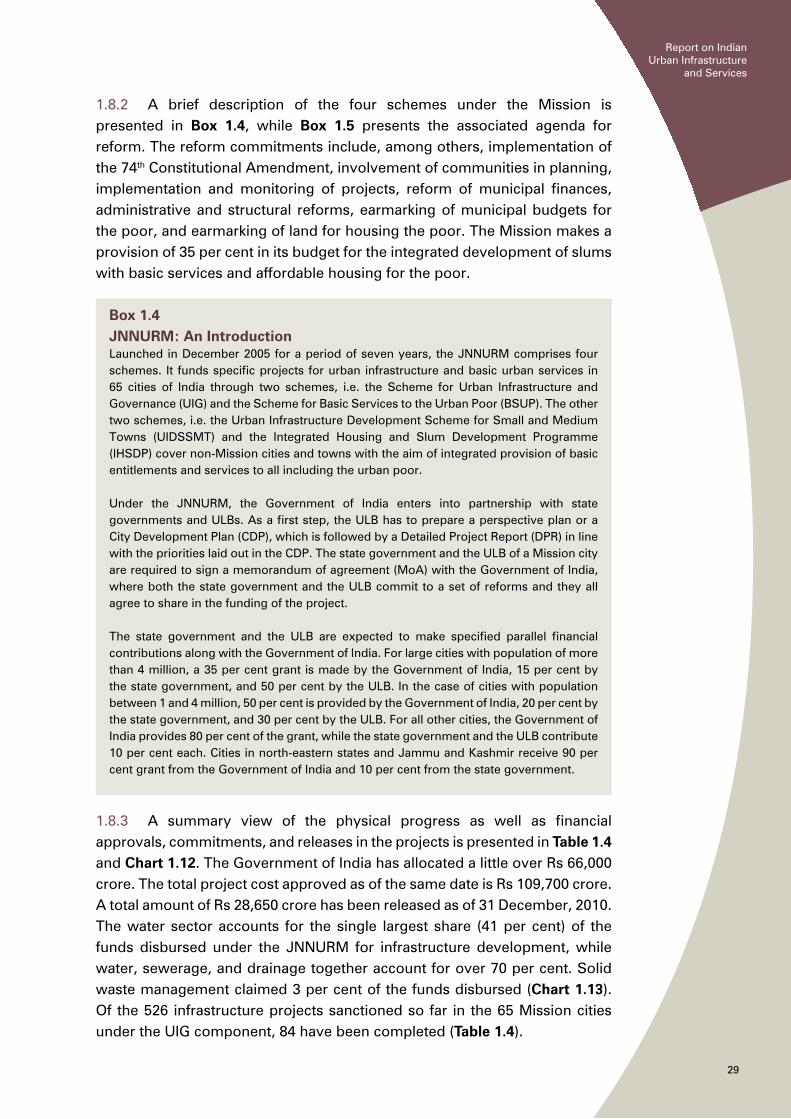
29
Report on Indian Urban Infrastructure
and Services
1.8.2 A brief description of the four schemes under the Mission is presented in Box 1.4, while Box 1.5 presents the associated agenda for reform. The reform commitments include, among others, implementation of the 74th Constitutional Amendment, involvement of communities in planning, implementation and monitoring of projects, reform of municipal finances, administrative and structural reforms, earmarking of municipal budgets for the poor, and earmarking of land for housing the poor. The Mission makes a provision of 35 per cent in its budget for the integrated development of slums with basic services and affordable housing for the poor.
Box 1.4JNNURM: An IntroductionLaunched in December 2005 for a period of seven years, the JNNURM comprises four schemes. It funds specific projects for urban infrastructure and basic urban services in 65 cities of India through two schemes, i.e. the Scheme for Urban Infrastructure and Governance (UIG) and the Scheme for Basic Services to the Urban Poor (BSUP). The other two schemes, i.e. the Urban Infrastructure Development Scheme for Small and Medium Towns (UIDSSMT) and the Integrated Housing and Slum Development Programme (IHSDP) cover non-Mission cities and towns with the aim of integrated provision of basic entitlements and services to all including the urban poor.
Under the JNNURM, the Government of India enters into partnership with state governments and ULBs. As a first step, the ULB has to prepare a perspective plan or a City Development Plan (CDP), which is followed by a Detailed Project Report (DPR) in line with the priorities laid out in the CDP. The state government and the ULB of a Mission city are required to sign a memorandum of agreement (MoA) with the Government of India, where both the state government and the ULB commit to a set of reforms and they all agree to share in the funding of the project.
The state government and the ULB are expected to make specified parallel financial contributions along with the Government of India. For large cities with population of more than 4 million, a 35 per cent grant is made by the Government of India, 15 per cent by the state government, and 50 per cent by the ULB. In the case of cities with population between 1 and 4 million, 50 per cent is provided by the Government of India, 20 per cent by the state government, and 30 per cent by the ULB. For all other cities, the Government of India provides 80 per cent of the grant, while the state government and the ULB contribute 10 per cent each. Cities in north-eastern states and Jammu and Kashmir receive 90 per cent grant from the Government of India and 10 per cent from the state government.
1.8.3 A summary view of the physical progress as well as financial approvals, commitments, and releases in the projects is presented in Table 1.4 and Chart 1.12. The Government of India has allocated a little over Rs 66,000 crore. The total project cost approved as of the same date is Rs 109,700 crore. A total amount of Rs 28,650 crore has been released as of 31 December, 2010. The water sector accounts for the single largest share (41 per cent) of the funds disbursed under the JNNURM for infrastructure development, while water, sewerage, and drainage together account for over 70 per cent. Solid waste management claimed 3 per cent of the funds disbursed (Chart 1.13). Of the 526 infrastructure projects sanctioned so far in the 65 Mission cities under the UIG component, 84 have been completed (Table 1.4).
30
Report on Indian Urban Infrastructure and Services
Note: ULCRA is Urban Land Ceiling and Regulation Act; LIG is low income groups; EWS is economically weaker sections; and HRD is human resource development.Source: MoUD, Government of India.
Box 1.5JNNURM: An Agenda for ReformA. Mandatory Reforms for State Governments:
Implementation of the 74• th Constitutional AmendmentElections to ULBs and transfer of 12 – th Schedule functions to ULBsFormation of District/Metropolitan Planning Committees (DPCs/MPCs) –
Assigning City Planning Functions to ULBs• Reform in Rent Control• Rationalisation of stamp duty to not more than 5 per cent• Repeal of ULCRA• Enactment of Community Participation Law• Enactment of Public Disclosure Law•
B. Mandatory Reforms for ULBs:Reforms for Municipal Finances:
Accounting Reforms• Introduction of accrual-based double-entry system –Preparation of annual balance sheets –
Property Tax Reforms• Introduction of Self-Assessment system –More than 85 per cent properties to be brought under tax record –More than 90 per cent tax collection –
Recovering User Charges• 100 per cent collection of operations and maintenance expenses for water supply –and solid waste management
E-Governance set up• Internal earmarking of funds for services to the urban poor• Provision of basic services to the urban poor•
C. Optional Reforms for State Governments:Introduction of Property Title Certification system in ULBs• Earmarking 20-25 per cent of developed land for LIG/EWS categories•
1.8.4 Ideally, an assessment of the JNNURM should focus on sustainable outcomes in terms of enhancements in service delivery and improvements in the quality of life of the citizens including slum dwellers. This is perhaps possible in respect of the slum improvement component, but not for the rest, because infrastructure projects typically take a long time to complete and it is difficult to make a full assessment of the outcomes before completion. The Mission focused on intermediate targets of urban infrastructure development and the expected outcomes were not specified as service delivery improvements.
Simplification of framework for conversion of land from agricultural to • non-agricultural purposes
D. Optional Reforms for ULBs:Computerised process of registration of land and property• Revision of building bye-laws to streamline approval process• Bye-laws for rain-water harvesting • Bye-laws for reuse of recycled water • Administrative reforms •
HRD policy covering recruitment, training, transfers, and promotions – Structural reforms•
Building municipal cadre –Encouraging public private partnerships (PPPs)•
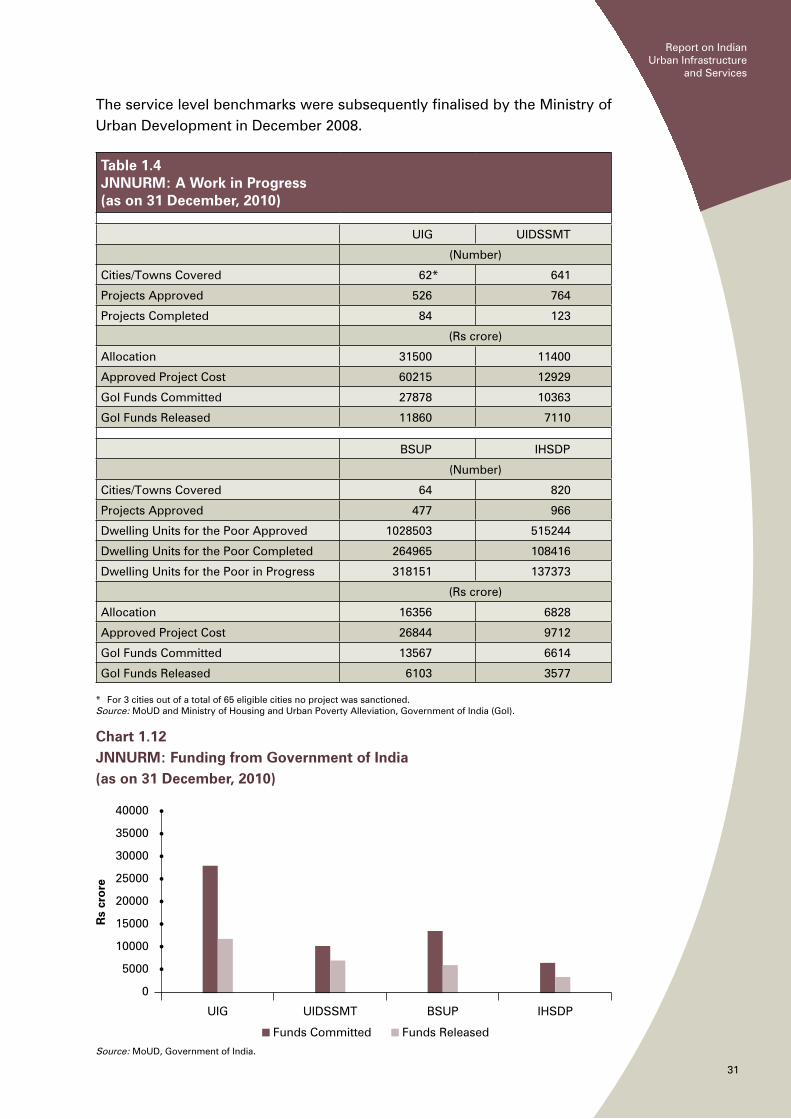
31
Report on Indian Urban Infrastructure
and Services
Table 1.4JNNURM: A Work in Progress(as on 31 December, 2010)
UIG UIDSSMT
(Number)
Cities/Towns Covered 62* 641
Projects Approved 526 764
Projects Completed 84 123
(Rs crore)
Allocation 31500 11400
Approved Project Cost 60215 12929
GoI Funds Committed 27878 10363
GoI Funds Released 11860 7110
BSUP IHSDP
(Number)
Cities/Towns Covered 64 820
Projects Approved 477 966
Dwelling Units for the Poor Approved 1028503 515244
Dwelling Units for the Poor Completed 264965 108416
Dwelling Units for the Poor in Progress 318151 137373
(Rs crore)
Allocation 16356 6828
Approved Project Cost 26844 9712
GoI Funds Committed 13567 6614
GoI Funds Released 6103 3577
Source: MoUD, Government of India.
Funds Committed Funds Released
Chart 1.12JNNURM: Funding from Government of India(as on 31 December, 2010)
The service level benchmarks were subsequently finalised by the Ministry of Urban Development in December 2008.
* For 3 cities out of a total of 65 eligible cities no project was sanctioned.Source: MoUD and Ministry of Housing and Urban Poverty Alleviation, Government of India (GoI).
Rs
cro
re
40000
35000
30000
25000
20000
15000
10000
5000
0
UIG UIDSSMT BSUP IHSDP
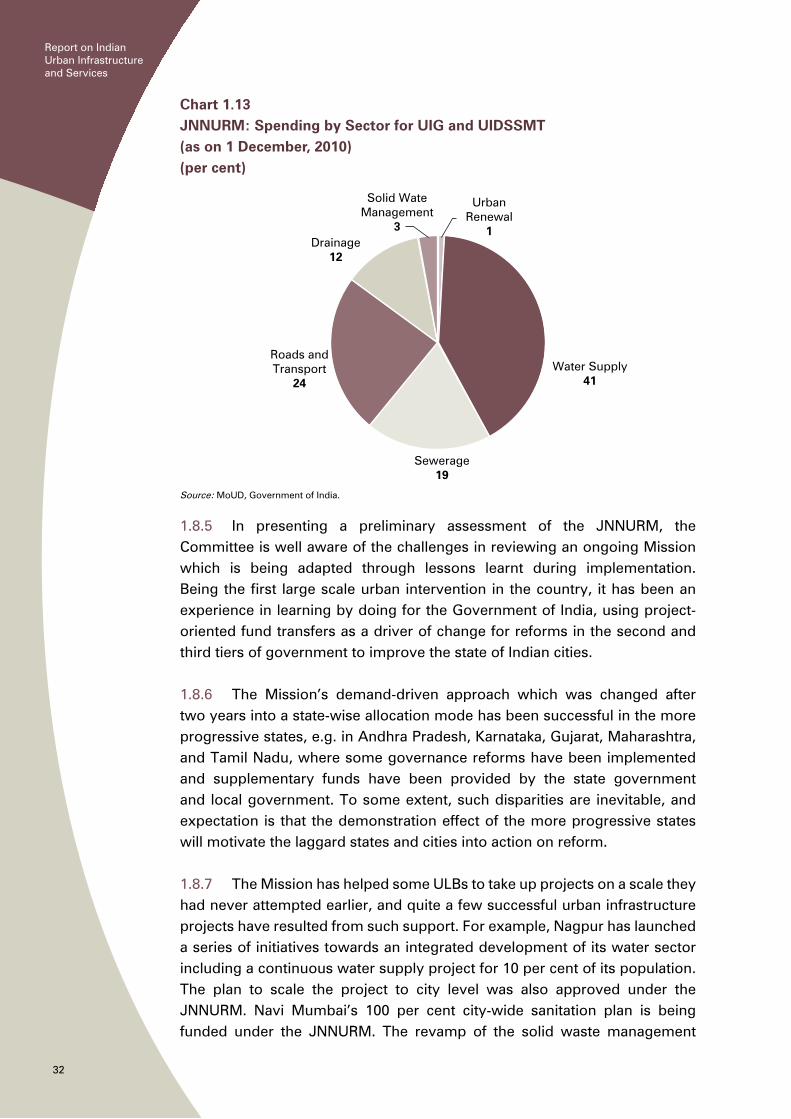
32
Report on Indian Urban Infrastructure and Services
Chart 1.13JNNURM: Spending by Sector for UIG and UIDSSMT(as on 1 December, 2010)(per cent)
UrbanRenewal
1
Water Supply 41
Sewerage 19
Roads andTransport
24
Drainage 12
Solid Wate Management
3
Source: MoUD, Government of India.
1.8.5 In presenting a preliminary assessment of the JNNURM, the Committee is well aware of the challenges in reviewing an ongoing Mission which is being adapted through lessons learnt during implementation. Being the first large scale urban intervention in the country, it has been an experience in learning by doing for the Government of India, using project-oriented fund transfers as a driver of change for reforms in the second and third tiers of government to improve the state of Indian cities.
1.8.6 The Mission’s demand-driven approach which was changed after two years into a state-wise allocation mode has been successful in the more progressive states, e.g. in Andhra Pradesh, Karnataka, Gujarat, Maharashtra, and Tamil Nadu, where some governance reforms have been implemented and supplementary funds have been provided by the state government and local government. To some extent, such disparities are inevitable, and expectation is that the demonstration effect of the more progressive states will motivate the laggard states and cities into action on reform.
1.8.7 The Mission has helped some ULBs to take up projects on a scale they had never attempted earlier, and quite a few successful urban infrastructure projects have resulted from such support. For example, Nagpur has launched a series of initiatives towards an integrated development of its water sector including a continuous water supply project for 10 per cent of its population. The plan to scale the project to city level was also approved under the JNNURM. Navi Mumbai’s 100 per cent city-wide sanitation plan is being funded under the JNNURM. The revamp of the solid waste management
33
Report on Indian Urban Infrastructure
and Services
system in Rajkot was facilitated through JNNURM funds, and it has transformed Rajkot into one of the cleanest cities in the country. India’s first full BRTS at Ahmedabad, which received many accolades both nationally and internationally, has also been funded through the JNNURM. Over the last six years, the renewed focus on the urban sector has resulted in a number of states initiating new programmes of urban development.
1.8.8 Notwithstanding excellent results in some cities, the Mission has more generally exposed the lack of capacity at local government level to prepare and implement projects in urban infrastructure. The Committee has observed, during its visits to several states, that in the last six years many of the problems faced in the implementation of the JNNURM projects seem to be due to inadequate capacity to prepare and implement the projects. Problems in implementation also seem to arise because the Mission Schemes link projects to overall reforms. In the Committee’s view, strengthening the capacity of ULBs to improve governance and enhance their ability to prepare, implement and manage projects, is crucial even when funds are not a constraint. Also, the very weak financial position of many cities has kept them away because of their inability to put in the amounts required as supplementary funding.
1.8.9 A close look at Box 1.5 highlights the fact that there was lack of clarity in the nature of the reforms and inadequate specification of the processes involved. While there was some delay on the part of the Ministries of Urban Development and Housing and Urban Poverty Alleviation in clarifying the content of reform, most state governments also did not take serious initiatives to implement and sustain the reforms. States were expected to design reforms in collaboration with cities, but the exercise often became one of satisfying the ‛technicalities’ of reform and drawing funds from the Government of India.
1.8.10 The CDP as envisaged in the design of the JNNURM was a ‛development plan’, which was expected to link spatial planning with socio-economic planning. In the absence of adequate capacity for either preparing such plans or evaluating the same, the infrastructure projects approved for funding under the JNNURM were often stand alone projects and not always part of an integrated vision for the development of the city. Lack of involvement of the community especially the slum dwellers and the elected ULB representatives, has also been a major criticism of the CDP process.
1.8.11 Discussion with institutions and experts who have been engaged in monitoring the reforms as well as a review of the available documents suggests that progress in implementing reforms under the JNNURM has been slow, and it has been difficult to enforce conditionality of overall reforms in a project-based financing approach for a variety of reasons. State governments and ULBs commit to many ambitious back-loaded reform measures and get commitments and sanctions under the JNNURM from the Government of
34
Report on Indian Urban Infrastructure and Services
India for financing specific projects. As physical implementation of the asset creation starts, and the time comes for real reform programme implementation, the state government and the ULB begin to drag their feet. When a state fails to meet its commitment on reforms, technically this means that the next instalment for an ongoing urban infrastructure project in the ULBs of these states should stop. Not releasing the next instalment would mean letting an infrastructure project languish, while releasing the instalment would create moral hazard for others who complied with the reform. In particular, in the case of slum upgradation projects, beneficiaries are mandated to contribute 10-12 per cent to the cost of affordable housing. If a slum upgradation project funding is suspended because state governments and ULBs are not implementing reforms, the burden of this decision will fall on the poor who often borrow money to meet their share of funding.
1.8.12 The JNNURM has had limited success in promoting PPP in urban infrastructure projects. Very little is being executed through PPP, and even that is largely in the form of outsourcing of services to the private sector. Financing from private partners has not come forth, mainly because ULBs have not been able to undertake reforms in a convincing manner. Perhaps revenue models which underpin access to external finance are not yet tested for India, and it was unrealistic to expect cities to have the track record and credibility to mobilise private counterpart funding. This has been a challenge both for municipal bonds and for PPP arrangements, and it underscores the importance of strengthening the revenue base of ULBs through reforms.
1.8.13 A Pooled Finance Development Fund (PFDF) was created by the Government of India at the same time as the JNNURM with a corpus of Rs 400 crore. It was expected to catalyse the municipal bond market and facilitate entry of market capital by providing credit enhancements to a pool of ULBs, particularly the weaker ones. This has not taken off as expected, except in Tamil Nadu and Karnataka. It may well be that the easy availability of substantial funds from the JNNURM for the Mission cities created an environment of soft budget constraint in which even the smaller municipalities which were untouched by the JNNURM became relatively more complacent and did not explore the pooled finance route to access market debt.
1.8.14 The JNNURM has certainly focused attention of the policymakers in all three tiers of the government on the challenges facing the cities and towns of India. It has succeeded in getting the state and city governments to commit in principle to reforms in governance and financing, but the commitments have not always been kept. The design of the programme makes it difficult to bind states and ULBs to their commitments, and both design and implementation have suffered from lack of capacity.
35
Report on Indian Urban Infrastructure
and Services
1.8.15 The Committee has projected investment requirement for urban infrastructure over the 20-year period at Rs 39.2 lakh crore at 2009-10 prices. The investment in the base year 2011-12 is projected at Rs 51,000 crore at 2009-10 prices. The phasing plan specifies an increase in investment of 15 per cent per annum, beginning with 2012-13 during the Twelfth Plan period, 12 per cent per annum during the Thirteenth Plan period, and 8 per cent per annum during the Fourteenth and Fifteenth Plan periods. The Committee’s recommendations have been so designed as to have the revenue and expenditure increases come in force in 2012-13. The year 2011-12 should be used on war footing to begin the urgent task of building capacity at all levels of government, and particularly at ULB level, to get the ULBs in position to prepare their development programme. The state governments should create the enabling environment and help ULBs to submit their programmes to the Government of India for funding.
1.9 The Way Forward
1.9.1 The Committee believes that given the enormous challenges of urbanisation as the Indian economy advances further on the path of faster and more inclusive growth, the Government of India will have to play a major proactive role in ensuring that the third tier can discharge the responsibilities assigned to it by the Constitutional Amendment Act of 1992. The Government of India will have to forge a partnership with state governments in doing so. The Committee welcomes the setting up of the National Development Council Sub-committee on Urban Development under the Chairmanship of Minister for Urban Development and membership of Minister for Housing and Urban Poverty Alleviation, Deputy Chairman, Planning Commission and a number of Chief Ministers. The Committee believes that the lessons learnt from the JNNURM can help shape the design of a New Improved JNNURM (NIJNNURM) with a strong component for capacity building and a strong but realistic and enforceable component of reform in governance.
1.9.2 In the light of the experience gained from the functioning of the JNNURM and in view of the need for the Government of India to push for urban infrastructure development because of its crucial role in supporting faster and more inclusive growth of the economy, the Committee proposes a substantially larger NIJNNURM with universal coverage. The new Mission should have a programme approach, designed to leverage its resources for urban infrastructure development with an identifiable link to improving service delivery. The Mission should extend over the 20-year period with funding from the Government of India equivalent to 0.25 per cent of GDP every year, which compares with the present level of 0.10 per cent. The state governments’ budgets currently absorb, one way or the other, losses of about 0.9 per cent of GDP in the distribution segment of the power sector alone.

36
Report on Indian Urban Infrastructure and Services
The Government of India, on its part, spends 1.25 per cent of GDP in subsidies on fertilisers and petroleum products. Admittedly, the funding support sought for the urban sector is large, but in an overall perspective in which both state governments and the Government of India are spending large amounts on subsidies, the Committee’s recommendation for the Government of India to commit 0.25 per cent of GDP towards urban development is not unreasonable.
1.9.3 The main features of the New Improved JNNURM (NIJNNURM) are spelt out below:
Coverage: • Must be accessible to all cities/towns – big and small.Capacity Building:•
Should have a strong programme of capacity creation and training ◦which should include creation of institutional and human resource capacity, which is needed at all levels but particularly for preparing the small ULBs for accessing NIJNNURM.Of the total NIJNNURM funds, 5 per cent will be spent on building capacity. ◦This would still meet only half of the total funding requirements of capacity building for the entire 20-year programme. State governments, ULBs and the private sector will have to play a partnership role in building capacity, particularly of ULBs for them to play a major role in transforming urban India.
Programme Approach:•ULBs should be required to lay out a programme detailing (i) the current ◦state of affairs at ULB level including service-level indicators, (ii) city vision, mission and end goal in terms of where the ULB will be at the time of completion of the programme including a number of municipal service indicators, (iii) the proposed asset-creation programme including the financing and operating plans, (iv) the proposed reforms including clear indicators of progress and timelines, (v) a framework for monitoring programme and associated reform, and (vi) the capacity available, the capacity needed, and the time by which it will be in place.
City Differentials:•Recognise that smaller cities and towns will need to be treated differently ◦from larger cities and metros – for funding, capacity building and reform content and timelines. Funds for smaller ULBs should be channelled through intermediary institutions which may be set up at regional level and they should be encouraged to go in for pooled financing to best leverage funds from the NIJNNURM. These ULBs must commit to progressive realisation of service level norms prescribed by the Ministry of Urban Development and progressive reforms in governance, e.g. progressive recovery of costs.For Municipal Corporations and Municipalities, in addition to a regular ◦window, a special window should be created specifically for projects that could be financed and executed via PPP route, or by leveraging

37
Report on Indian Urban Infrastructure
and Services
private sources of funding. Special infrastructure funding vehicles and PPP mechanisms should be designed and integrated into the process of project sanctioning and disbursal.
Funding:•Should be linked to a ULB-specific programme of development and ◦reform (which, of course, would be contingent on some reforms taking place at the state level) where the design of the reform should take note of the differences that exist on the ground between the governance structures of Municipal Corporations, Municipalities, and Nagar Panchayats. All funding requirements of the ULBs should be routed through the ◦state governments. State governments will not be required to make any financial contribution towards the NIJNNURM because of the proposal for devolution and state action to empower local bodies as the third tier (explained in detail in Chapter V). The contribution of the smaller ULBs should be lower than that of the larger cities and metros.
Governance and Efficiency Considerations:•Need for a state level mechanism for monitoring reforms at ULB ◦level, located at the Reform and Performance Management Cell in the state government.Focus on improvement in procurement systems by having standardised ◦tender documents for key categories of urban infrastructure based on international best practices.
1.9.4 The detailed guidelines for the NIJNNURM and its differentiation across city sizes will have to be put together by the Ministries of Urban Development, and Housing and Urban Poverty Alleviation, and other relevant government agencies.
1.9.5 Decentralisation is not possible without addressing the factors that lead to centralisation. States have the power to enact laws while municipalities do not. Thus, for the Community Participation Law, Public Disclosure Law, etc. it is state governments that have to take the lead because these subjects belong in the State list as specified in the Constitution. States will also need to proactively facilitate regional planning frameworks within which city governments can position themselves to be in charge of urban planning including town planning. States will also need to facilitate inter-jurisdictional initiatives like pooled financing, bond banks, and tax increment financing. The Government of India’s proactive approach to transforming the state of India’s cities and towns can only succeed if the state governments play the supportive role of creating an enabling environment in which governments at the third tier can discharge their responsibilities.
1.9.6 State level reforms are critically important. For example, land market reforms requiring removal of regulatory constraints on conversion of

38
Report on Indian Urban Infrastructure and Services
agricultural land to urban use, elimination of constraints on FSI, setting norms with regard to zoning and development control, and repeal or restructuring of rent control laws and ULCRA as well as reduction in stamp duty, would require strong action at state level.
1.9.7 ULBs which contribute their share of funding and agree to reforms should be covered under the NIJNNURM. The latter should recognise that the different categories of ULBs will move at different speeds and with different priorities in their approach to reforms. For example, very small ULBs will need to be given longer time and greater assistance from state governments and NIJNNURM to take over city planning functions, compared to bigger ULBs.
1.9.8 As regards the agenda of inclusion, using the JNNURM as a launching pad, the task of slum redevelopment has grown into a new programme, the Rajiv Awas Yojana (RAY). The Government of India has announced the goal of making India slum-free in a time-bound manner by preparing a strategy of redeveloping all existing slums and redressing the land and housing shortages to prevent growth of new slums. Within an agenda of legislative reforms for reserving 20-25 per cent of developed land in all new housing developments for economically weaker sections and low income groups and for granting security of tenure to slum dwellers, RAY proposes to attract the private sector for building small houses. Slum development under RAY and infrastructure development under NIJNNURM have to be planned together in order to avoid anomalies as in the present design of JNNURM.
1.9.9 In the light of the discussion above, the Government of India will have to restructure the Ministries at the centre, and equip them with capacities to manage a Mission of this magnitude and complexity. The current ministries have evolved from a very narrowly defined mandate for urban development in India, and the experiences of the JNNURM reflect this lack of capacity in the Ministries themselves, even before addressing capacities at state and local levels. Simultaneously, the Government of India will have to start a campaign of capacity building for the ULBs and state governments. For good programmes and projects to emerge from the cities and towns, there is urgent need for professional training in areas such as urban planning, engineering, finance, and management. At the level of evaluating these programmes and projects, again, there is the need to build professional capacity.
1.9.10 The JNNURM had an explicit component set aside for capacity building, but there has been very little utilisation. The demand for capacity may not be perceived on the part of the participants, but the Committee strongly emphasises the importance of capacity building. A possible approach would be to make available a Capacity Building window from the Government of India from which grants can be made available to ULBs for training, e.g., for double-entry book keeping. In this manner, a mechanism can be put in place
39
Report on Indian Urban Infrastructure
and Services
for ULBs to utilise funding support for capacity building. This is especially important for smaller ULBs. The Committee’s specific recommendations with respect to capacity building are spelt out in Chapter IV.
1.9.11 The major differences between JNNURM and NIJNNURM are: The JNNURM is largely directed at a selected few cities as is always the i. case with a pilot. The NIJNNURM will be open to all. The JNNURM is a project-based Mission. The NIJNNURM will have a ii. programme approach. The JNNURM linked a broad set of reforms to specific projects and was iii. not able to drive reforms through project lending. The NIJNNURM will give funding linked to a set of reforms which will be differentiated across different types of ULBs. The JNNURM has a separate funding window (UIDSSMT/IHSDP) for iv. smaller cities and towns. The NIJNNURM will differentiate between smaller cities and towns, on the one hand, and larger cities and metros, on the other, by specifying separate processes of capacity building, reform content and timelines as well.Recognising that ULBs need to be made reform-ready, the NIJNNURM v. places prime emphasis on capacity building.
1.10 Capacity Building
1.10.1 The JNNURM provided for capacity building on demand and found that there were few takers. The NIJNNURM gives a head start of one year to allow the Government of India, to help the state governments and ULBs to rebuild the basic structure of the local government institutions by putting the staff in place at ULB level, and prepare the groundwork for training while completing the ongoing projects for the JNNURM. This year should also be used for developing standards/templates, e.g. guidelines for municipal borrowing, procurement procedures, legal framework and model concession agreements for PPPs and IT infrastructure for delivery and monitoring of services – measures that will enable ULBs to hit the ground running by the beginning of the Twelfth Plan period. The Committee recommends as part of the NIJNNURM a strong programme (with 5 per cent of the total funding) for capacity building which should focus on strengthening institutions as well as human resources. The Committee expects state governments, ULBs and the private sector also to play a major role in capacity building.
1.10.2 A number of institutions at all three tiers of government will have to be engaged in making urban local bodies reform-ready. Institutional guidance and support will have to be provided by the Reform and Performance Management Cells in the Government of India and state governments, and
40
Report on Indian Urban Infrastructure and Services
the Urban Utility Regulators at state level – the institutions that have been recommended to be set up by the Committee.
1.10.3 Human resource development will require a twofold strategy. New Institutes of Urban Management will have to be set up and existing Schools of Urban Planning will have to be revitalised to prepare new urban managers/regulators/finance specialists/planners. At the same time, a large number of officials will have to be trained in urban planning, finance, project preparation, project implementation, project management, e-governance, etc. and also in developing systems of quality assurance and monitoring of reforms. Skills of the existing personnel will have to be enhanced through focused composite courses in urban management, etc. With a head start before the NIJNNURM takes off in 2012-13 and a concerted effort over the 20-year period, substantial capacity will have to be created to make ULBs ready for participating in the process of transforming urban India.
Chapter IIThe State of UrbanService Delivery

43
Report on Indian Urban Infrastructure
and Services
2.1 Introduction
2.1.1 The state of urban service delivery in India’s cities and towns is far poorer than is desirable for India’s current income levels. Considering that the Indian economy has been one of the fastest growing economies in the world for some time, and aspirations and standards are raising, the current state of service delivery is simply unacceptable. Floods, traffic jams, accumulated waste at roadsides, and people queuing up for water from standposts and tankers across cities and towns – all drive home the urgent need to address the challenges of delivering urban services in India.
2.1.2 Pollution of water, air, and land has contributed greatly to the proliferation of disease, e.g. dengue, malaria, chikungunya, swine flu, diarrhoea, asthma, and acute respiratory infections. A study by the Ministry of Urban Development, Government of India (2009b) finds that 23 million children below the age of 14 in urban India are at risk from poor sanitation. The same study finds that 8 million children in urban areas are at risk from poor water supply. Infant mortality at 42 deaths per 1000 live births, though lower than in rural areas, continues to be unacceptably high (IIPS 2005-06).
2.1.3 The environmental hazards and loss in productivity due to traffic congestion are only just beginning to be understood. The poor state of basic urban services prevents India’s cities from exploiting their potential for generating rapid economic growth and contributing to poverty reduction.
2.2 Service norms for Indian cities
2.2.1 In India, the first attempt at setting urban service norms and standards was made in 1963 by the Zakaria Committee, which laid down the physical norms and corresponding expenditure norms for five services, i.e. water supply, sewerage, storm water drainage, urban roads, and street lighting.1 The Zakaria Committee adopted a demand-driven approach for estimating service standards and per capita investment requirements for urban India. The standards were derived from the actual data collected on the quantum of basic urban services, demand for services, cost of provision, maintenance of services, and municipal finances from a sample of cities of different sizes. For example, the standards for per capita water consumption were estimated to range between 45 and 270 litres per day depending on city size.
2.2.2 Subsequently other government agencies/institutions like the Town and Country Planning Organisation (1974), Planning Commission (1983, 1999),
1 A Committee of Ministers constituted by the Central Council of Local Self Government.
44
Report on Indian Urban Infrastructure and Services
Operations Research Group (1989), Ministry of Urban Development, Government of India (1991), Central Public Health and Environmental Engineering Organisation (1999), and state governments have come up with norms for different services. The Zakaria Committee’s financial norms adjusted for inflation are still widely used as benchmarks for assessing infrastructure needs in urban areas, even though they are outdated and do not measure up to the standards relevant for an economy growing at 8 to 9 per cent per annum.
2.2.3 The pattern of consumption of urban services has changed significantly over time as a result of increase in income and technological advances. Rising aspirations in a rapidly growing economy also call for a new look at the norms for public service delivery. Recognising this need, the Ministry of Urban Development, Government of India has prescribed service-level benchmarks for a number of urban services. A consultative process with state governments and other stakeholders was initiated in 2006, which culminated in the final benchmarks published by the Ministry in December 2008.2 The benchmarks are important for shifting focus from the creation of physical infrastructure to service delivery because poor governance can create situations in which additional capital investments in urban infrastructure do not result in corresponding improvements in service delivery.
2.2.4 The Thirteenth Central Finance Commission has endorsed these benchmarks and has made compliance with them a necessary condition for urban local bodies (ULB) to obtain performance-linked grants. The Committee believes that the benchmark norms specified by the Ministry are consistent with the economic and social aspirations arising from India’s GDP growth targets of 8 to 9 per cent per annum. These norms have been used by the Committee for estimating infrastructure investments in this Report. Table 2.1 presents a summary of the service standards.
2.2.5 In arriving at the estimates for urban infrastructure, the Committee has adopted the principle of same standards for all citizens in a city/town without making any distinction between the urban poor, the non-poor, and the slum dweller. For example, 24x7 water supply and door-to-door collection of solid waste have been provided without distinguishing where or to whom the urban service is being delivered. The same service standards have been used for all city size classes for the basic services of water supply, sewerage, and solid waste management, while differential standards have been used for different size cities in urban transport-related sectors, including storm water drainage.
2 As part of the exercise, data was collected and analysed from 13 water supply and sanitation utilities across India in 2003, and from 16 more utilities in 2005. The Handbook of Service Level Benchmarking was released in 2008 reflecting the results of the detailed consultative exercises. The Ministry of Urban Development has completed a pilot programme of benchmarking in 28 Indian cities. Subsequently the Ministry also released Service Level Benchmarks for Urban Transport.
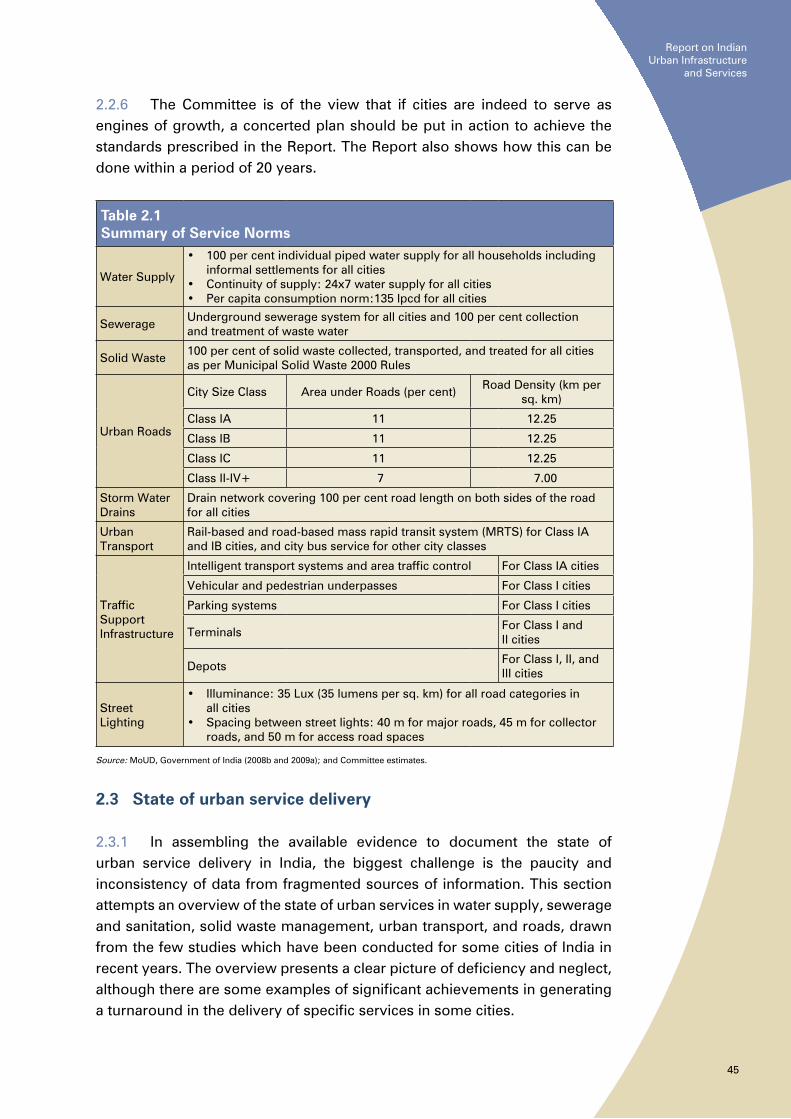
45
Report on Indian Urban Infrastructure
and Services
Table 2.1 Summary of Service Norms
Water Supply
100 per cent individual piped water supply for all households including • informal settlements for all cities Continuity of supply: 24x7 water supply for all cities • Per capita consumption norm:135 lpcd for all cities •
Sewerage Underground sewerage system for all cities and 100 per cent collection and treatment of waste water
Solid Waste 100 per cent of solid waste collected, transported, and treated for all cities as per Municipal Solid Waste 2000 Rules
Urban Roads
City Size Class Area under Roads (per cent) Road Density (km per sq. km)
Class IA 11 12.25
Class IB 11 12.25
Class IC 11 12.25
Class II-IV+ 7 7.00Storm Water Drains
Drain network covering 100 per cent road length on both sides of the road for all cities
Urban Transport
Rail-based and road-based mass rapid transit system (MRTS) for Class IA and IB cities, and city bus service for other city classes
Traffic SupportInfrastructure
Intelligent transport systems and area traffic control For Class IA cities
Vehicular and pedestrian underpasses For Class I cities
Parking systems For Class I cities
Terminals For Class I and II cities
Depots For Class I, II, and III cities
Street Lighting
Illuminance: 35 Lux (35 lumens per sq. km) for all road categories in • all cities Spacing between street lights: 40 m for major roads, 45 m for collector • roads, and 50 m for access road spaces
2.2.6 The Committee is of the view that if cities are indeed to serve as engines of growth, a concerted plan should be put in action to achieve the standards prescribed in the Report. The Report also shows how this can be done within a period of 20 years.
2.3 State of urban service delivery
2.3.1 In assembling the available evidence to document the state of urban service delivery in India, the biggest challenge is the paucity and inconsistency of data from fragmented sources of information. This section attempts an overview of the state of urban services in water supply, sewerage and sanitation, solid waste management, urban transport, and roads, drawn from the few studies which have been conducted for some cities of India in recent years. The overview presents a clear picture of deficiency and neglect, although there are some examples of significant achievements in generating a turnaround in the delivery of specific services in some cities.
Source: MoUD, Government of India (2008b and 2009a); and Committee estimates.
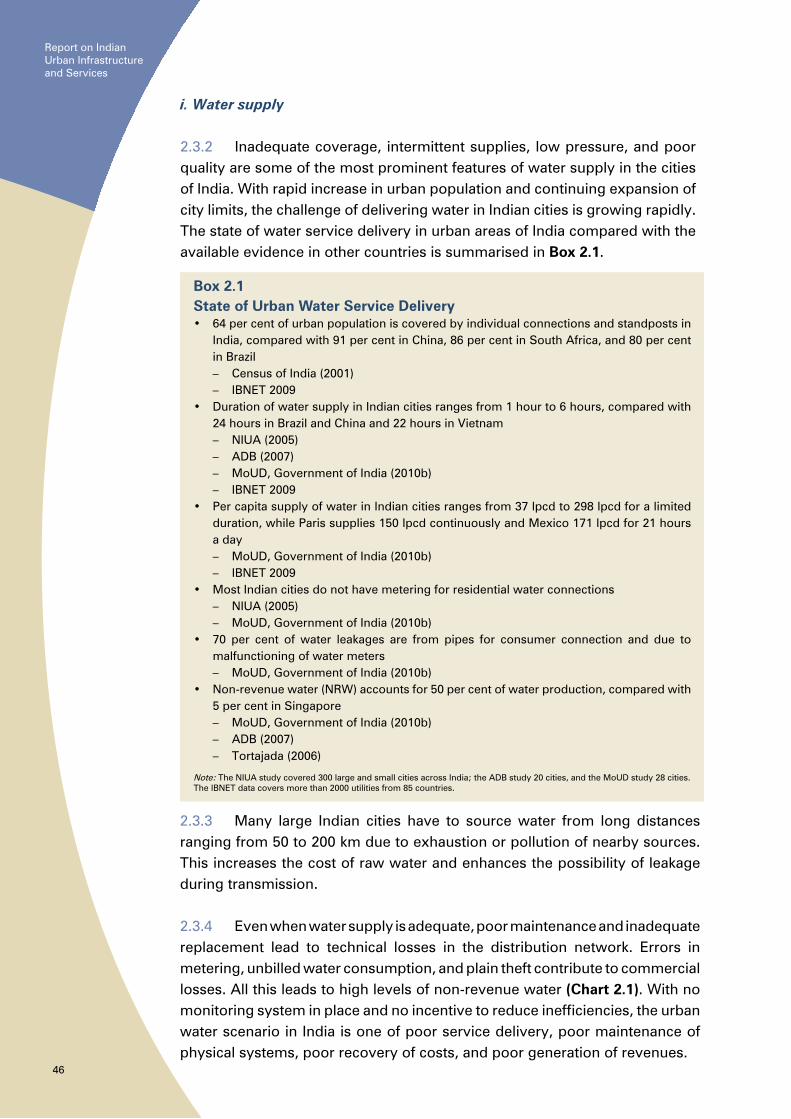
46
Report on Indian Urban Infrastructure and Services
i. Water supply
2.3.2 Inadequate coverage, intermittent supplies, low pressure, and poor quality are some of the most prominent features of water supply in the cities of India. With rapid increase in urban population and continuing expansion of city limits, the challenge of delivering water in Indian cities is growing rapidly. The state of water service delivery in urban areas of India compared with the available evidence in other countries is summarised in Box 2.1.
Box 2.1State of Urban Water Service Delivery
64 per cent of urban population is covered by individual connections and standposts in • India, compared with 91 per cent in China, 86 per cent in South Africa, and 80 per cent in Brazil
Census of India (2001) –IBNET 2009 –
Duration of water supply in Indian cities ranges from 1 hour to 6 hours, compared with • 24 hours in Brazil and China and 22 hours in Vietnam
NIUA (2005) –ADB (2007) –MoUD, Government of India (2010b) –IBNET 2009 –
Per capita supply of water in Indian cities ranges from 37 lpcd to 298 lpcd for a limited • duration, while Paris supplies 150 lpcd continuously and Mexico 171 lpcd for 21 hours a day
MoUD, Government of India (2010b) –IBNET 2009 –
Most Indian cities do not have metering for residential water connections• NIUA (2005) –MoUD, Government of India (2010b) –
70 per cent of water leakages are from pipes for consumer connection and due to • malfunctioning of water meters
MoUD, Government of India (2010b) –Non-revenue water (NRW) accounts for 50 per cent of water production, compared with • 5 per cent in Singapore
MoUD, Government of India (2010b) –ADB (2007) –Tortajada (2006) –
2.3.3 Many large Indian cities have to source water from long distances ranging from 50 to 200 km due to exhaustion or pollution of nearby sources. This increases the cost of raw water and enhances the possibility of leakage during transmission.
2.3.4 Even when water supply is adequate, poor maintenance and inadequate replacement lead to technical losses in the distribution network. Errors in metering, unbilled water consumption, and plain theft contribute to commercial losses. All this leads to high levels of non-revenue water (Chart 2.1). With no monitoring system in place and no incentive to reduce inefficiencies, the urban water scenario in India is one of poor service delivery, poor maintenance of physical systems, poor recovery of costs, and poor generation of revenues.
Note: The NIUA study covered 300 large and small cities across India; the ADB study 20 cities, and the MoUD study 28 cities.The IBNET data covers more than 2000 utilities from 85 countries.
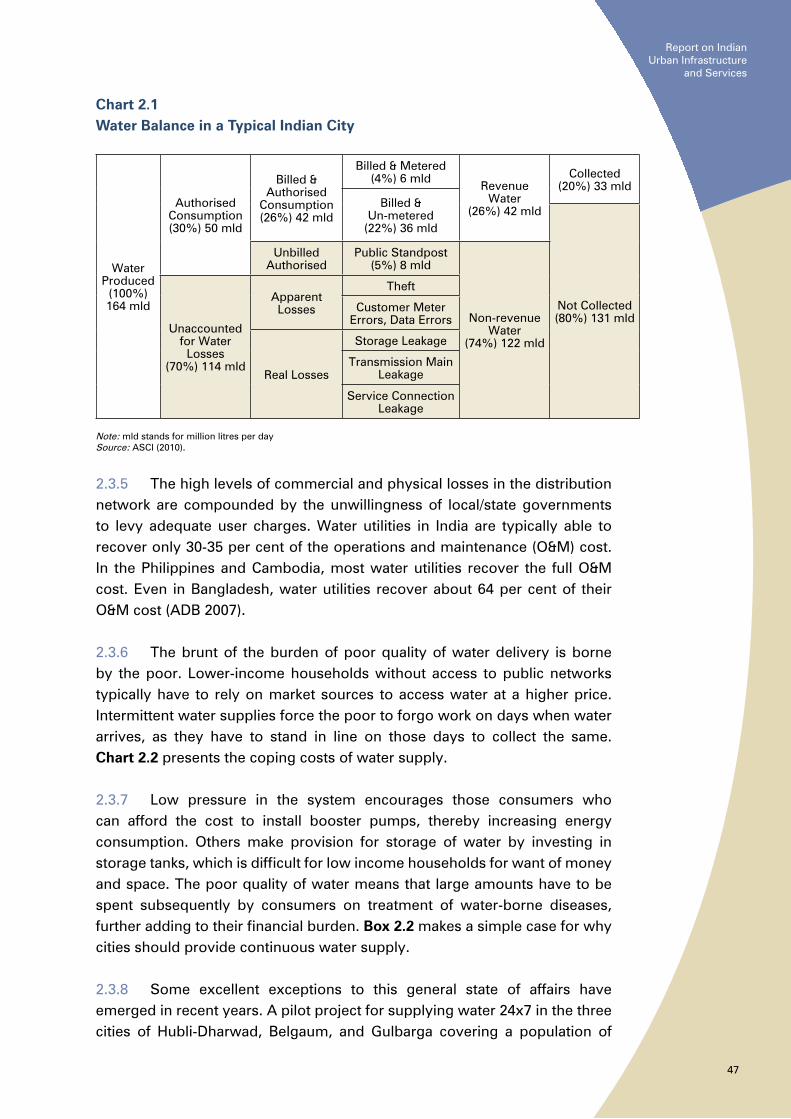
47
Report on Indian Urban Infrastructure
and Services
Water Produced
(100%) 164 mld
Authorised Consumption (30%) 50 mld
Billed & Authorised
Consumption (26%) 42 mld
Billed & Metered (4%) 6 mld Revenue
Water (26%) 42 mld
Collected (20%) 33 mld
Billed & Un-metered
(22%) 36 mld
Not Collected (80%) 131 mld
Unbilled Authorised
Public Standpost (5%) 8 mld
Non-revenue Water
(74%) 122 mldUnaccounted
for Water Losses
(70%) 114 mld
Apparent Losses
Theft
Customer Meter Errors, Data Errors
Real Losses
Storage Leakage
Transmission Main Leakage
Service Connection Leakage
Note: mld stands for million litres per daySource: ASCI (2010).
2.3.5 The high levels of commercial and physical losses in the distribution network are compounded by the unwillingness of local/state governments to levy adequate user charges. Water utilities in India are typically able to recover only 30-35 per cent of the operations and maintenance (O&M) cost. In the Philippines and Cambodia, most water utilities recover the full O&M cost. Even in Bangladesh, water utilities recover about 64 per cent of their O&M cost (ADB 2007).
2.3.6 The brunt of the burden of poor quality of water delivery is borne by the poor. Lower-income households without access to public networks typically have to rely on market sources to access water at a higher price. Intermittent water supplies force the poor to forgo work on days when water arrives, as they have to stand in line on those days to collect the same. Chart 2.2 presents the coping costs of water supply.
2.3.7 Low pressure in the system encourages those consumers who can afford the cost to install booster pumps, thereby increasing energy consumption. Others make provision for storage of water by investing in storage tanks, which is difficult for low income households for want of money and space. The poor quality of water means that large amounts have to be spent subsequently by consumers on treatment of water-borne diseases, further adding to their financial burden. Box 2.2 makes a simple case for why cities should provide continuous water supply.
2.3.8 Some excellent exceptions to this general state of affairs have emerged in recent years. A pilot project for supplying water 24x7 in the three cities of Hubli-Dharwad, Belgaum, and Gulbarga covering a population of
Chart 2.1Water Balance in a Typical Indian City
48
Report on Indian Urban Infrastructure and Services
200,000 (about 10 per cent of total population in each city) has successfully transformed the water supply scenario in the five demonstration zones of these cities from about one to two hours every five days to water round the clock (Box 2.3).
Chart 2.2Coping Costs of Water Supply
Note: Water from standposts is free, but its supply is erratic: private operators collect water in containers provided by households and deliver it to their doorstep at a transportation charge of Rs 6 for 25 litres. Source: Raghupathi (2003).
Mo
nthl
y co
st f
or
500
litre
s o
f w
ater
per
day
(R
s)
4000
3500
3000
2500
2000
1500
1000
500
050 200
1500
3600
Public Connection Private Connection Standpost (water transportation cost)
Private WaterTanker
Box 2.2Why Cities Should Deliver Continuous Water SupplyIn a continuously pressurised distribution system, contaminants surrounding the pipelines cannot penetrate even if there are breaks in the pipes and joints. Without continuous pressure, street run-off, drainage water, raw sewage from adjacent sewer lines and leaky septic tanks get sucked into the water mains.
Providing continuous water supply in cities results in system efficiency and economic benefits to citizens.
A distribution system which is operated under continuous supply conditions has longer life as it is subjected to fewer shocks (water hammer effect) and changes in pressure than one which is operated under intermittent supply conditions.
There is no need for households to invest in domestic storage, booster pumps, supplementary boreholes, domestic filters, and other treatment systems when water is in continuous supply. Also, there is no need to purchase water from private suppliers.
Continuous water supply reduces unregulated recourse to groundwater and is, therefore, environment-friendly.
2.3.9 The project essentially involves a performance-based contract with a private company for network upgradation and O&M of the system. It uses 10 to 15 per cent less bulk water and has attained efficiency through improvements in system design, revamp of the distribution network, and installing leakage
Source: ASCI (2010).
49
Report on Indian Urban Infrastructure
and Services
Box 2.324x7 Water in Three Cities of Karnataka The Government of Karnataka, with assistance from the World Bank, launched the Karnataka Urban Water Sector Improvement Project (KUWASIP) in 2005 in five selected zones in three cities (Belgaum, Gulbarga, and the twin cities of Hubli-Dharwad) to build and deliver an efficient and commercially viable 24x7 urban water supply system through PPP.
The project included investments to improve bulk water supply and commissioned a private operator to construct-operate-manage 24x7 urban water supply systems for two years, after a preparatory phase of 18 months. The contract was awarded to a joint venture of Compagnie Generale Des Eaux (CGE) and Veolia. The management fee of Rs 22 crore to the private operator had a fixed component of 60 per cent, while the remaining 40 per cent was linked to performance. The contract also included a maximum bonus of Rs 5.6 crore and a penalty of up to 10 per cent in case of failure to meet the performance targets.
The investment was made by the Karnataka Urban Water Supply and Drainage Board (KUWSDB) and the private operator was responsible for installation of meters, tariff collection, etc. The tariff structure was rationalised by introducing variable rates based on consumption. Significant reforms were carried out in public sector institutions such as the KUWSDB, and the Karnataka Urban Infrastructure Development and Finance Corporation. The standards of delivery were established by these institutions including pricing of services to cover the O&M cost and holding the private party accountable through the performance management contract. A proactive communications strategy involving all stakeholders at local level was rolled out to seek buy-in for the project.
Losses were reduced from 50 per cent to 7 per cent due to improvements in the transmission and distribution network, and improved metering. Over 25,000 households now receive 24x7 water supply.
In August 2009 the project was conferred the first prize in the PPP category of the National Urban Water Awards of the Ministry of Urban Development, Government of India.
detection systems. Average monthly water bills range from Rs 80 to Rs 150 depending on consumption, and are significantly lower than what residents used to pay earlier. Collection efficiencies have gone up as the ULB itself is collecting higher revenues from more satisfied customers. Customer service centres operate 24x7 to address customer complaints and queries. With the economic viability of the project confirmed, the ULBs of Hubli-Dharwad, Belgaum, and Gulbarga are now considering full city roll-outs.
2.3.10 By contrast, the Pune Municipal Corporation’s attempt at implementing a water supply and sewerage project through public private partnership (PPP) in 1998 failed to take off. The project was scrapped two weeks prior to the date when tenders from the private sector were to be opened for award of contract. It probably reflected lack of political backing from the state and local governments. There was also apprehension among local contractors about working with international partners who brought significant domain knowledge of the sector.
Source: KUWASIP (2010).
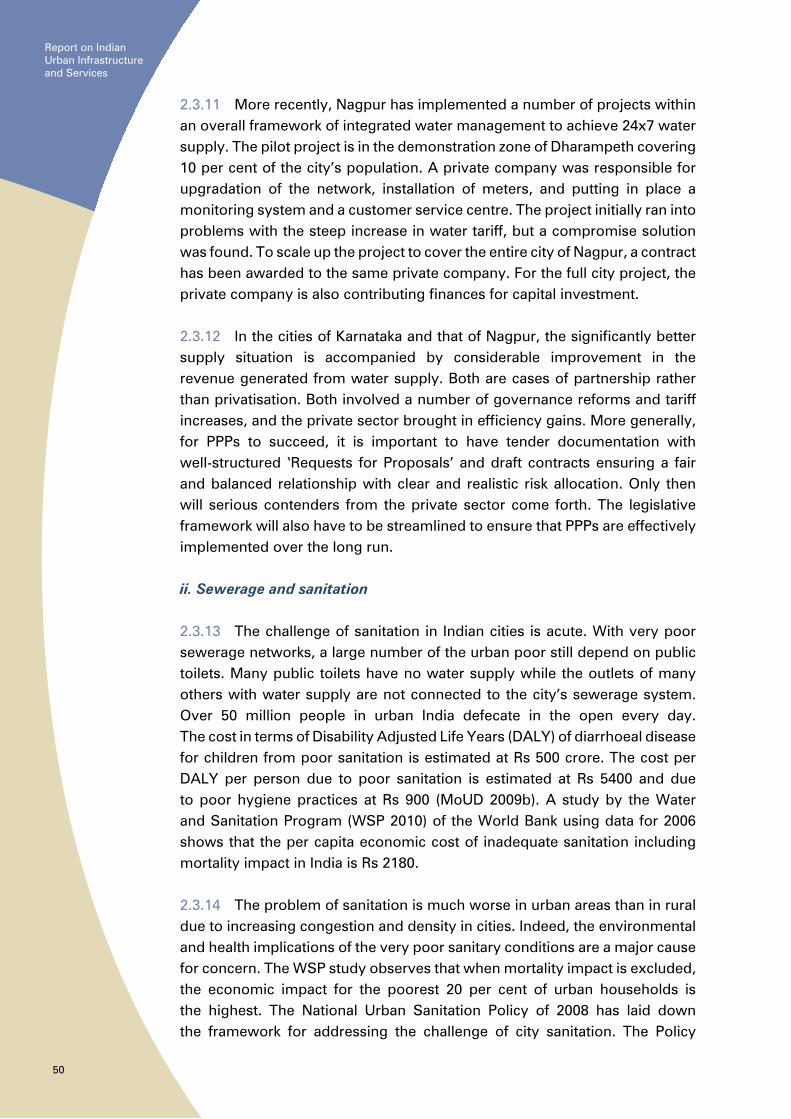
50
Report on Indian Urban Infrastructure and Services
2.3.11 More recently, Nagpur has implemented a number of projects within an overall framework of integrated water management to achieve 24x7 water supply. The pilot project is in the demonstration zone of Dharampeth covering 10 per cent of the city’s population. A private company was responsible for upgradation of the network, installation of meters, and putting in place a monitoring system and a customer service centre. The project initially ran into problems with the steep increase in water tariff, but a compromise solution was found. To scale up the project to cover the entire city of Nagpur, a contract has been awarded to the same private company. For the full city project, the private company is also contributing finances for capital investment.
2.3.12 In the cities of Karnataka and that of Nagpur, the significantly better supply situation is accompanied by considerable improvement in the revenue generated from water supply. Both are cases of partnership rather than privatisation. Both involved a number of governance reforms and tariff increases, and the private sector brought in efficiency gains. More generally, for PPPs to succeed, it is important to have tender documentation with well-structured ‛Requests for Proposals’ and draft contracts ensuring a fair and balanced relationship with clear and realistic risk allocation. Only then will serious contenders from the private sector come forth. The legislative framework will also have to be streamlined to ensure that PPPs are effectively implemented over the long run.
ii. Sewerage and sanitation
2.3.13 The challenge of sanitation in Indian cities is acute. With very poor sewerage networks, a large number of the urban poor still depend on public toilets. Many public toilets have no water supply while the outlets of many others with water supply are not connected to the city’s sewerage system. Over 50 million people in urban India defecate in the open every day. The cost in terms of Disability Adjusted Life Years (DALY) of diarrhoeal disease for children from poor sanitation is estimated at Rs 500 crore. The cost per DALY per person due to poor sanitation is estimated at Rs 5400 and due to poor hygiene practices at Rs 900 (MoUD 2009b). A study by the Water and Sanitation Program (WSP 2010) of the World Bank using data for 2006 shows that the per capita economic cost of inadequate sanitation including mortality impact in India is Rs 2180.
2.3.14 The problem of sanitation is much worse in urban areas than in rural due to increasing congestion and density in cities. Indeed, the environmental and health implications of the very poor sanitary conditions are a major cause for concern. The WSP study observes that when mortality impact is excluded, the economic impact for the poorest 20 per cent of urban households is the highest. The National Urban Sanitation Policy of 2008 has laid down the framework for addressing the challenge of city sanitation. The Policy
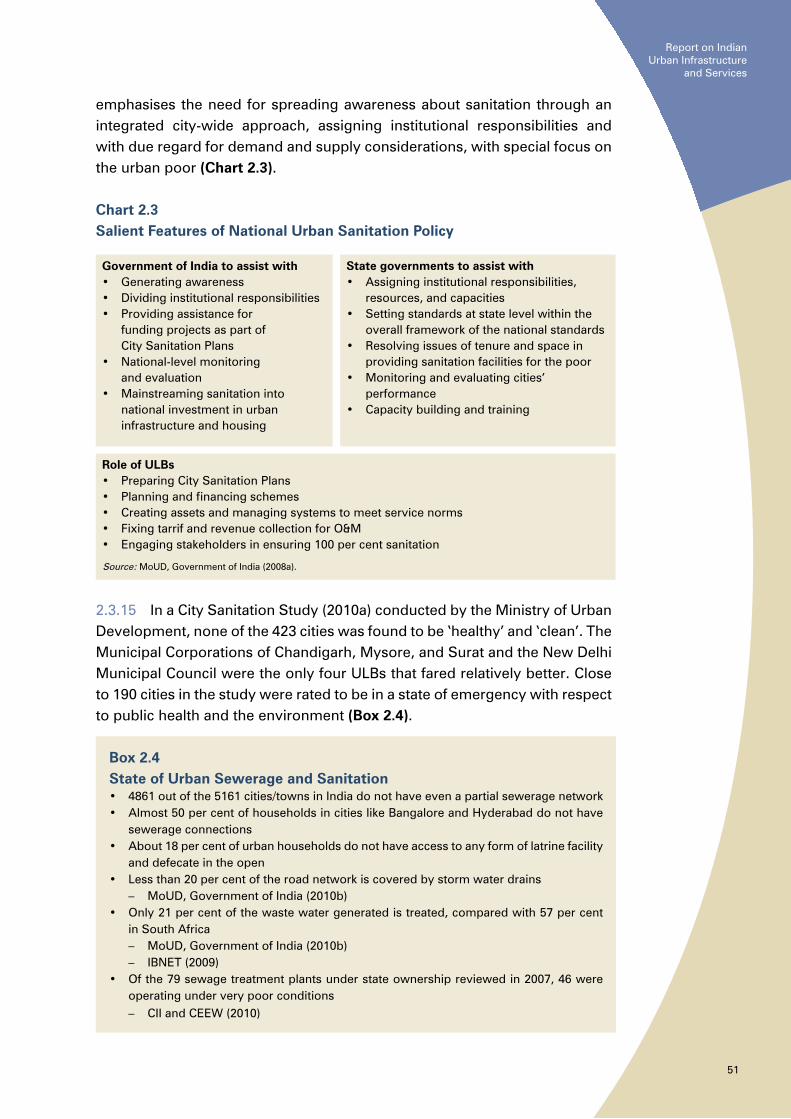
51
Report on Indian Urban Infrastructure
and Services
Government of India to assist withGenerating awareness• Dividing institutional responsibilities• Providing assistance for • funding projects as part of City Sanitation PlansNational-level monitoring • and evaluationMainstreaming sanitation into • national investment in urban infrastructure and housing
State governments to assist withAssigning institutional responsibilities, • resources, and capacitiesSetting standards at state level within the • overall framework of the national standardsResolving issues of tenure and space in • providing sanitation facilities for the poorMonitoring and evaluating cities’ • performanceCapacity building and training•
Role of ULBsPreparing City Sanitation Plans• Planning and financing schemes• Creating assets and managing systems to meet service norms• Fixing tarrif and revenue collection for O&M• Engaging stakeholders in ensuring 100 per cent sanitation•
emphasises the need for spreading awareness about sanitation through an integrated city-wide approach, assigning institutional responsibilities and with due regard for demand and supply considerations, with special focus on the urban poor (Chart 2.3).
Chart 2.3Salient Features of National Urban Sanitation Policy
2.3.15 In a City Sanitation Study (2010a) conducted by the Ministry of Urban Development, none of the 423 cities was found to be ‛healthy’ and ‛clean’. The Municipal Corporations of Chandigarh, Mysore, and Surat and the New Delhi Municipal Council were the only four ULBs that fared relatively better. Close to 190 cities in the study were rated to be in a state of emergency with respect to public health and the environment (Box 2.4).
Box 2.4State of Urban Sewerage and Sanitation
4861 out of the 5161 cities/towns in India do not have even a partial sewerage network • Almost 50 per cent of households in cities like Bangalore and Hyderabad do not have • sewerage connectionsAbout 18 per cent of urban households do not have access to any form of latrine facility • and defecate in the openLess than 20 per cent of the road network is covered by storm water drains•
MoUD, Government of India (2010b) –Only 21 per cent of the waste water generated is treated, compared with 57 per cent • in South Africa
MoUD, Government of India (2010b) –IBNET (2009) –
Of the 79 sewage treatment plants under state ownership reviewed in 2007, 46 were • operating under very poor conditions
CII and CEEW (2010) –
Source: MoUD, Government of India (2008a).
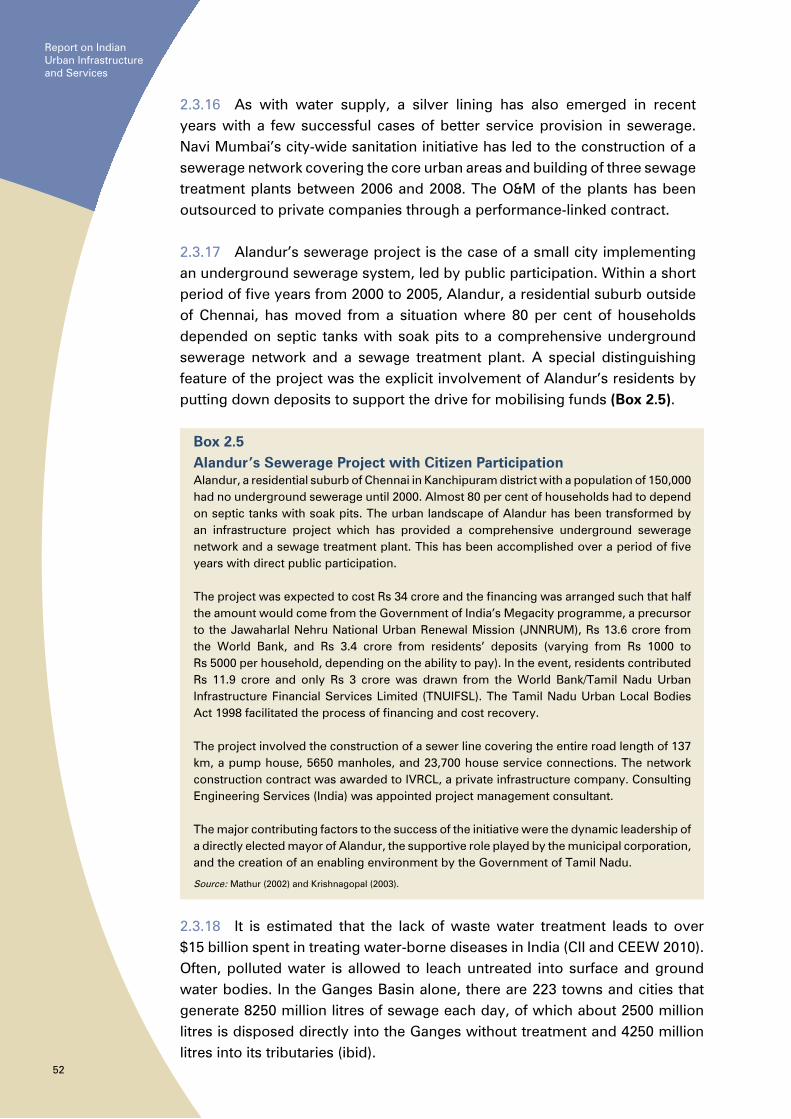
52
Report on Indian Urban Infrastructure and Services
2.3.16 As with water supply, a silver lining has also emerged in recent years with a few successful cases of better service provision in sewerage. Navi Mumbai’s city-wide sanitation initiative has led to the construction of a sewerage network covering the core urban areas and building of three sewage treatment plants between 2006 and 2008. The O&M of the plants has been outsourced to private companies through a performance-linked contract.
2.3.17 Alandur’s sewerage project is the case of a small city implementing an underground sewerage system, led by public participation. Within a short period of five years from 2000 to 2005, Alandur, a residential suburb outside of Chennai, has moved from a situation where 80 per cent of households depended on septic tanks with soak pits to a comprehensive underground sewerage network and a sewage treatment plant. A special distinguishing feature of the project was the explicit involvement of Alandur’s residents by putting down deposits to support the drive for mobilising funds (Box 2.5).
Box 2.5 Alandur’s Sewerage Project with Citizen ParticipationAlandur, a residential suburb of Chennai in Kanchipuram district with a population of 150,000 had no underground sewerage until 2000. Almost 80 per cent of households had to depend on septic tanks with soak pits. The urban landscape of Alandur has been transformed by an infrastructure project which has provided a comprehensive underground sewerage network and a sewage treatment plant. This has been accomplished over a period of five years with direct public participation.
The project was expected to cost Rs 34 crore and the financing was arranged such that half the amount would come from the Government of India’s Megacity programme, a precursor to the Jawaharlal Nehru National Urban Renewal Mission (JNNRUM), Rs 13.6 crore from the World Bank, and Rs 3.4 crore from residents’ deposits (varying from Rs 1000 to Rs 5000 per household, depending on the ability to pay). In the event, residents contributed Rs 11.9 crore and only Rs 3 crore was drawn from the World Bank/Tamil Nadu Urban Infrastructure Financial Services Limited (TNUIFSL). The Tamil Nadu Urban Local Bodies Act 1998 facilitated the process of financing and cost recovery.
The project involved the construction of a sewer line covering the entire road length of 137 km, a pump house, 5650 manholes, and 23,700 house service connections. The network construction contract was awarded to IVRCL, a private infrastructure company. Consulting Engineering Services (India) was appointed project management consultant.
The major contributing factors to the success of the initiative were the dynamic leadership of a directly elected mayor of Alandur, the supportive role played by the municipal corporation, and the creation of an enabling environment by the Government of Tamil Nadu.
2.3.18 It is estimated that the lack of waste water treatment leads to over $15 billion spent in treating water-borne diseases in India (CII and CEEW 2010). Often, polluted water is allowed to leach untreated into surface and ground water bodies. In the Ganges Basin alone, there are 223 towns and cities that generate 8250 million litres of sewage each day, of which about 2500 million litres is disposed directly into the Ganges without treatment and 4250 million litres into its tributaries (ibid).
Source: Mathur (2002) and Krishnagopal (2003).
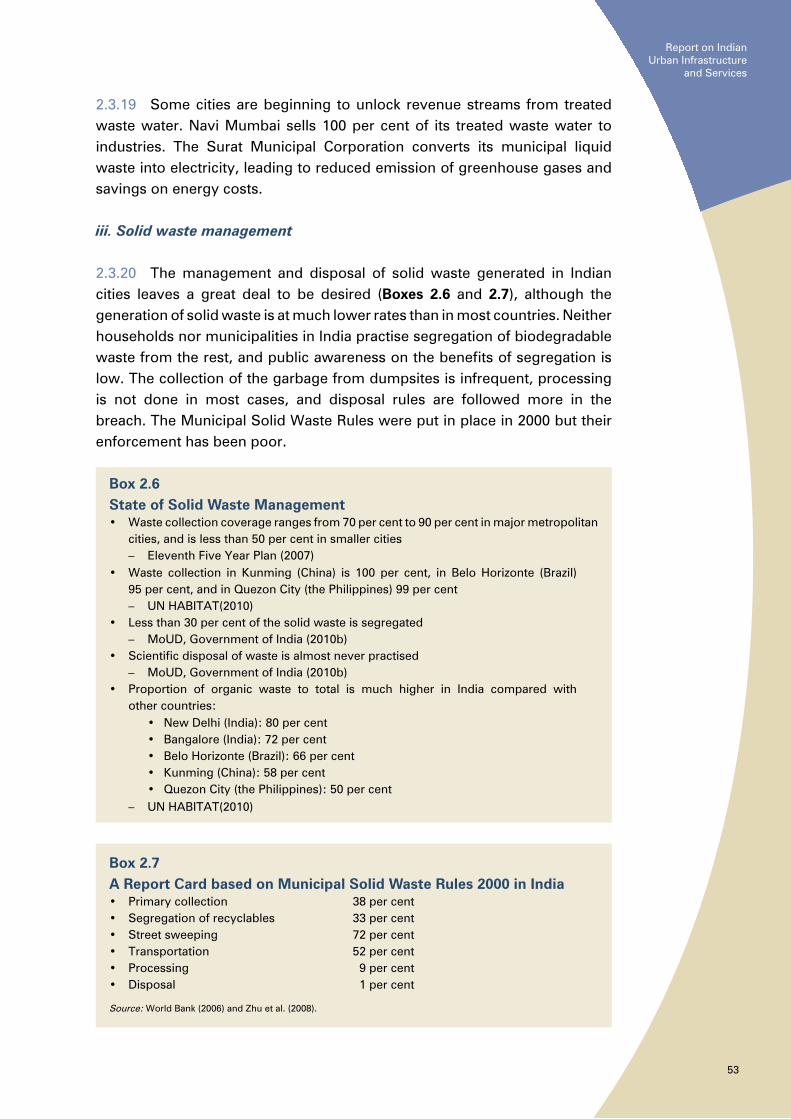
53
Report on Indian Urban Infrastructure
and Services
2.3.19 Some cities are beginning to unlock revenue streams from treated waste water. Navi Mumbai sells 100 per cent of its treated waste water to industries. The Surat Municipal Corporation converts its municipal liquid waste into electricity, leading to reduced emission of greenhouse gases and savings on energy costs.
iii. Solid waste management
2.3.20 The management and disposal of solid waste generated in Indian cities leaves a great deal to be desired (Boxes 2.6 and 2.7), although the generation of solid waste is at much lower rates than in most countries. Neither households nor municipalities in India practise segregation of biodegradable waste from the rest, and public awareness on the benefits of segregation is low. The collection of the garbage from dumpsites is infrequent, processing is not done in most cases, and disposal rules are followed more in the breach. The Municipal Solid Waste Rules were put in place in 2000 but their enforcement has been poor.
Box 2.6 State of Solid Waste Management
Waste collection coverage ranges from 70 per cent to 90 per cent in major metropolitan • cities, and is less than 50 per cent in smaller cities
Eleventh Five Year Plan (2007) –
Source: World Bank (2006) and Zhu et al. (2008).
Waste collection in Kunming (China) is 100 per cent, in Belo Horizonte (Brazil) • 95 per cent, and in Quezon City (the Philippines) 99 per cent
UN HABITAT(2010) –Less than 30 per cent of the solid waste is segregated•
MoUD, Government of India (2010b) –Scientific disposal of waste is almost never practised•
MoUD, Government of India (2010b) –Proportion of organic waste to total is much higher in India compared with • other countries:
New Delhi (India): 80 per cent• Bangalore (India): 72 per cent• Belo Horizonte (Brazil): 66 per cent• Kunming (China): 58 per cent• Quezon City (the Philippines): 50 per cent •
UN HABITAT(2010) –
Box 2.7 A Report Card based on Municipal Solid Waste Rules 2000 in India
Primary collection 38 per cent • Segregation of recyclables 33 per cent • Street sweeping 72 per cent • Transportation 52 per cent • Processing 9 per cent • Disposal 1 per cent•
54
Report on Indian Urban Infrastructure and Services
2.3.21 The Energy and Resources Institute (TERI) has estimated that by 2047, waste generation in Indian cities will increase five-fold to touch 260 million tonne per year, implying that the current solid waste generation is over 50 million tonne per year (Asnani 2006). A study by the World Bank (2006) puts India’s annual generation of municipal solid waste to be somewhat lower, i.e. in the range of 35 to 45 million tonne, amounting to about 100,000 to 120,000 metric tonne every day. Asnani (2006) estimates that the annual increase in overall quantity of solid waste in India’s cities will be at a rate of 5 per cent per annum.
2.3.22 The fact that a large part (over 60 per cent) of India’s waste is biodegradable, provides an opportunity for composting. While lifestyle changes, especially in the larger cities, are leading to increased use of packaging material, and per capita waste generation is increasing at about 1.3 per cent per annum, the biodegradable component is still expected to be much higher than in industrialised countries.
2.3.23 Besides ULBs, non-governmental organisations (NGOs), community-based organisations, and private companies are involved in the collection of solid waste, but little attention is paid to waste disposal. Chandigarh (96.2 per cent) and Surat (90.3 per cent) record the highest household coverage of solid waste collection in the country (MoUD, Government of India 2010b). Typically, collection of solid waste from roadside dustbins to transfer stations is done by ULBs with varying degree of efficiency. Transport of waste to transfer stations often takes place in open vehicles with manual loading. This is followed by transportation to open dumping grounds. The expansion of city limits has led to old dumping sites which were relatively remote, now becoming part of the city.
2.3.24 Disposal practices at the open dumping sites are highly unsatisfactory. The poor management of solid waste has led to contamination of groundwater and surface water through leachate and pollution of air through unregulated burning of waste. Unscientific practices in processing and disposal compound the environmental hazards posed by solid waste.
2.3.25 Even with current levels of highly inadequate service, solid waste management accounts for 25-50 per cent of a ULB’s expenditure (World Bank 2006), but cities recover less than 50 per cent of the O&M cost, according to a study by the Ministry of Urban Development, Government of India (2010b). The distribution of the expenditure is heavily loaded in favour of collection and transportation, and little attention is paid to processing and scientific disposal of the waste.
2.3.26 Once again, there are exceptions to the generally abysmal state of solid waste management. A few cities such as Surat and Rajkot have set up
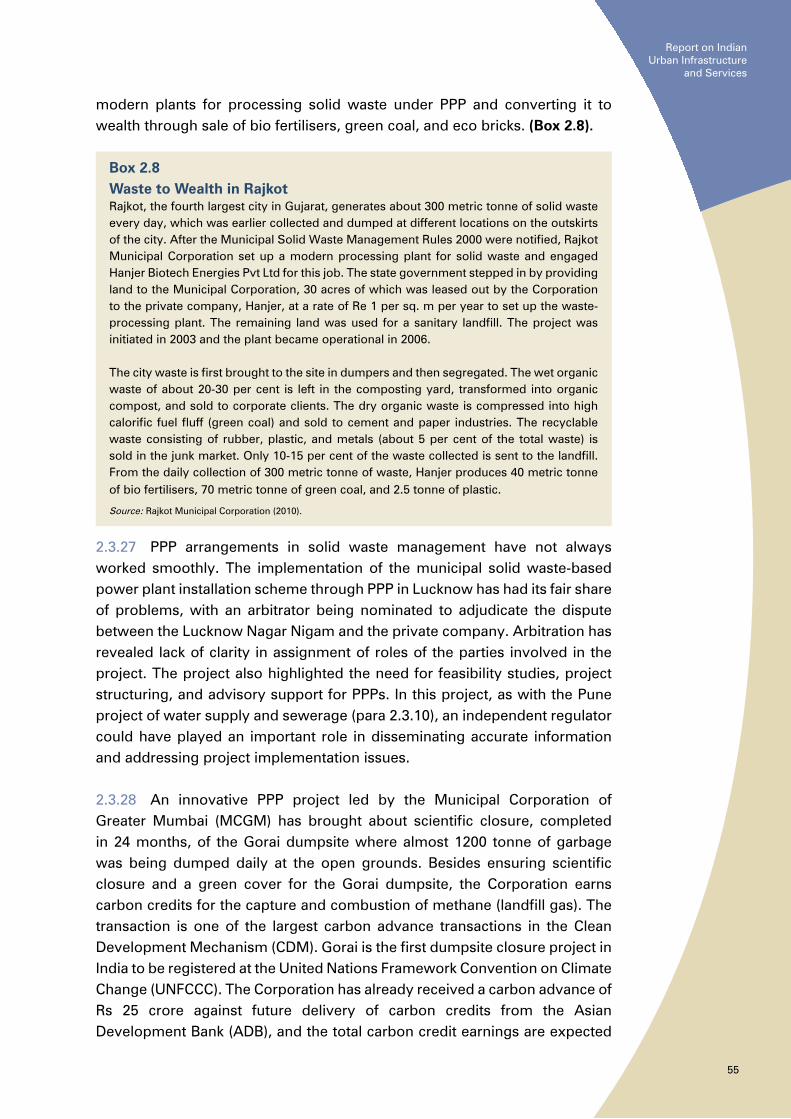
55
Report on Indian Urban Infrastructure
and Services
modern plants for processing solid waste under PPP and converting it to wealth through sale of bio fertilisers, green coal, and eco bricks. (Box 2.8).
Box 2.8Waste to Wealth in RajkotRajkot, the fourth largest city in Gujarat, generates about 300 metric tonne of solid waste every day, which was earlier collected and dumped at different locations on the outskirts of the city. After the Municipal Solid Waste Management Rules 2000 were notified, Rajkot Municipal Corporation set up a modern processing plant for solid waste and engaged Hanjer Biotech Energies Pvt Ltd for this job. The state government stepped in by providing land to the Municipal Corporation, 30 acres of which was leased out by the Corporation to the private company, Hanjer, at a rate of Re 1 per sq. m per year to set up the waste-processing plant. The remaining land was used for a sanitary landfill. The project was initiated in 2003 and the plant became operational in 2006.
The city waste is first brought to the site in dumpers and then segregated. The wet organic waste of about 20-30 per cent is left in the composting yard, transformed into organic compost, and sold to corporate clients. The dry organic waste is compressed into high calorific fuel fluff (green coal) and sold to cement and paper industries. The recyclable waste consisting of rubber, plastic, and metals (about 5 per cent of the total waste) is sold in the junk market. Only 10-15 per cent of the waste collected is sent to the landfill. From the daily collection of 300 metric tonne of waste, Hanjer produces 40 metric tonne of bio fertilisers, 70 metric tonne of green coal, and 2.5 tonne of plastic.
2.3.27 PPP arrangements in solid waste management have not always worked smoothly. The implementation of the municipal solid waste-based power plant installation scheme through PPP in Lucknow has had its fair share of problems, with an arbitrator being nominated to adjudicate the dispute between the Lucknow Nagar Nigam and the private company. Arbitration has revealed lack of clarity in assignment of roles of the parties involved in the project. The project also highlighted the need for feasibility studies, project structuring, and advisory support for PPPs. In this project, as with the Pune project of water supply and sewerage (para 2.3.10), an independent regulator could have played an important role in disseminating accurate information and addressing project implementation issues.
2.3.28 An innovative PPP project led by the Municipal Corporation of Greater Mumbai (MCGM) has brought about scientific closure, completed in 24 months, of the Gorai dumpsite where almost 1200 tonne of garbage was being dumped daily at the open grounds. Besides ensuring scientific closure and a green cover for the Gorai dumpsite, the Corporation earns carbon credits for the capture and combustion of methane (landfill gas). The transaction is one of the largest carbon advance transactions in the Clean Development Mechanism (CDM). Gorai is the first dumpsite closure project in India to be registered at the United Nations Framework Convention on Climate Change (UNFCCC). The Corporation has already received a carbon advance of Rs 25 crore against future delivery of carbon credits from the Asian Development Bank (ADB), and the total carbon credit earnings are expected
Source: Rajkot Municipal Corporation (2010).
56
Report on Indian Urban Infrastructure and Services
to be Rs 72 crore, higher than the project’s total capital cost of Rs 50 crore. The project is estimated to reduce greenhouse gases by 1.2 million tonne of carbon dioxide over a 10-year crediting period.
2.3.29 Modern practices of solid waste collection and management will have adverse impact on the livelihoods of ‛scavengers’ and ‛rag pickers’ who are currently engaged in large numbers in the task of collection and segregation of waste.3 Informal operations in recyclable materials have meant that items such as bottles, syringes, and needles find their way into the market, which is a health hazard. It is important to create new avenues of employment for these people in a rapidly growing economy, while efficient methods are sought for solid waste collection, segregation, and disposal.
iv. Urban transport and roads
2.3.30 Problems arising from inadequate investments in urban transport and roads over the years have been exacerbated by the increasing concentration of economic activity and human settlements in certain areas due to relative underpricing of hydrocarbon fuels.
2.3.31 Indian cities are increasingly faced with the twin challenges of providing adequate road space for future use and improving the poor condition of existing roads due to the neglect of maintenance over the years. Current road designs do not adequately provide for facilities such as footpaths and cycle tracks. The available road space gets encroached by commercial establishments, street vendors, and on-street parking due to poor enforcement of the existing regulations. The variety of vehicles on the roads moving at different speeds without any demarcated lanes also adds to the challenges of urban transport (Box 2.9).
2.3.32 The highly inadequate and poor quality of the public transport system in Indian cities not only poses a major challenge to realising the growth potential of the economy but also has adverse impact on the health and well-being of the people. Long hours spent on road journeys, lives lost in road accidents, and air pollution are only some of the effects of the acute problem of transportation facilities in and around cities.
2.3.33 The motor vehicle population in India has increased 100 times from 1951 to 2004, while the road network has expanded only eight times, and this does not even cover the period of sharp acceleration in vehicle purchases after 2003 (Uddin 2009). In 2007, Indians bought 1.5 million cars, which is more than double the number purchased in 2003. In addition, two-wheelers
3 The scale of this informal economy is not well understood, but it is certainly very large, one estimate suggesting that there are 75,000 waste pickers in Delhi (World Bank 2006).
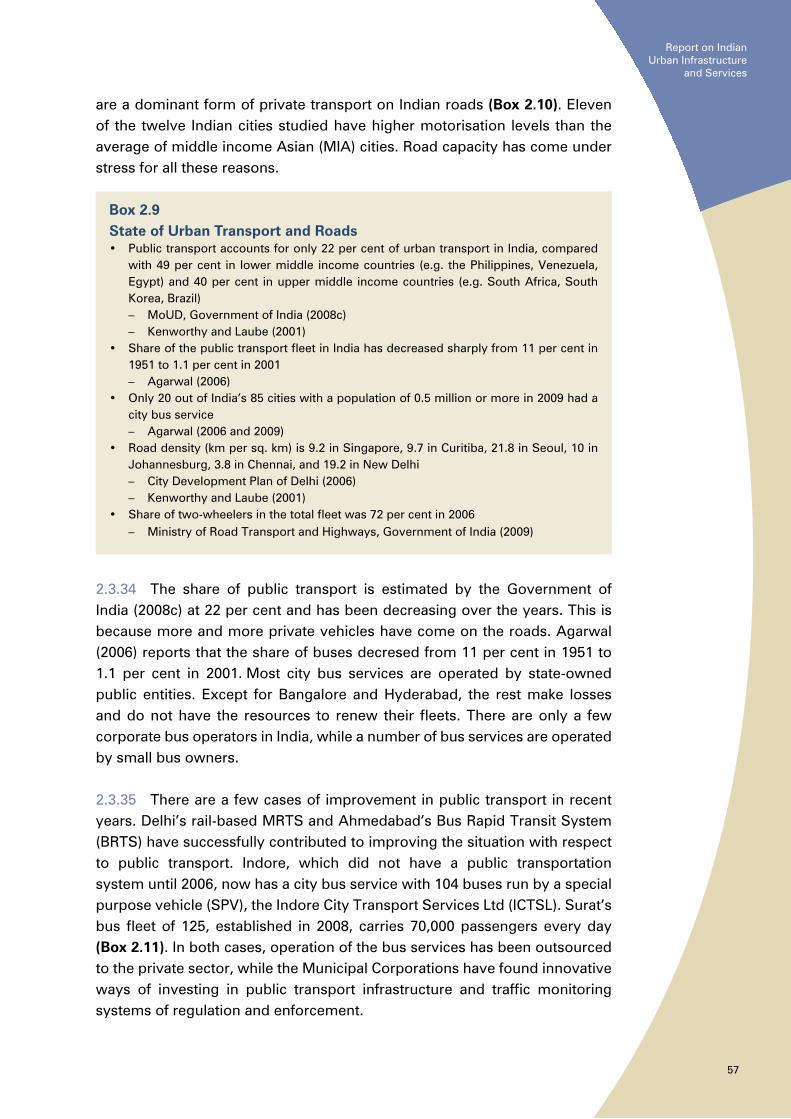
57
Report on Indian Urban Infrastructure
and Services
are a dominant form of private transport on Indian roads (Box 2.10). Eleven of the twelve Indian cities studied have higher motorisation levels than the average of middle income Asian (MIA) cities. Road capacity has come under stress for all these reasons.
Box 2.9 State of Urban Transport and Roads
Public transport accounts for only 22 per cent of urban transport in India, compared • with 49 per cent in lower middle income countries (e.g. the Philippines, Venezuela, Egypt) and 40 per cent in upper middle income countries (e.g. South Africa, South Korea, Brazil)
MoUD, Government of India (2008c) –Kenworthy and Laube (2001) –
Share of the public transport fleet in India has decreased sharply from 11 per cent in • 1951 to 1.1 per cent in 2001
Agarwal (2006) –Only 20 out of India’s 85 cities with a population of 0.5 million or more in 2009 had a • city bus service
Agarwal (2006 and 2009) –Road density (km per sq. km) is 9.2 in Singapore, 9.7 in Curitiba, 21.8 in Seoul, 10 in • Johannesburg, 3.8 in Chennai, and 19.2 in New Delhi
City Development Plan of Delhi (2006) –Kenworthy and Laube (2001) –
Share of two-wheelers in the total fleet was 72 per cent in 2006• Ministry of Road Transport and Highways, Government of India (2009) –
2.3.34 The share of public transport is estimated by the Government of India (2008c) at 22 per cent and has been decreasing over the years. This is because more and more private vehicles have come on the roads. Agarwal (2006) reports that the share of buses decresed from 11 per cent in 1951 to 1.1 per cent in 2001. Most city bus services are operated by state-owned public entities. Except for Bangalore and Hyderabad, the rest make losses and do not have the resources to renew their fleets. There are only a few corporate bus operators in India, while a number of bus services are operated by small bus owners.
2.3.35 There are a few cases of improvement in public transport in recent years. Delhi’s rail-based MRTS and Ahmedabad’s Bus Rapid Transit System (BRTS) have successfully contributed to improving the situation with respect to public transport. Indore, which did not have a public transportation system until 2006, now has a city bus service with 104 buses run by a special purpose vehicle (SPV), the Indore City Transport Services Ltd (ICTSL). Surat’s bus fleet of 125, established in 2008, carries 70,000 passengers every day (Box 2.11). In both cases, operation of the bus services has been outsourced to the private sector, while the Municipal Corporations have found innovative ways of investing in public transport infrastructure and traffic monitoring systems of regulation and enforcement.
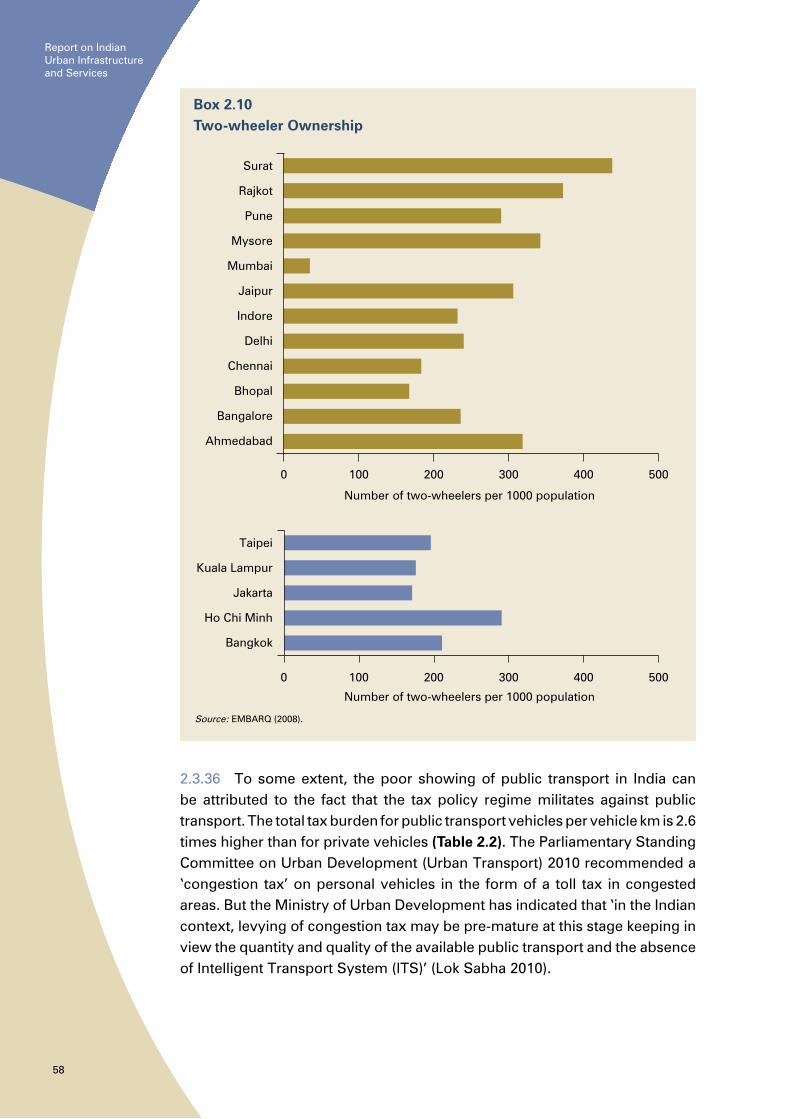
58
Report on Indian Urban Infrastructure and Services
Source: EMBARQ (2008).
Box 2.10Two-wheeler Ownership
0 100 200 300 400 500
Number of two-wheelers per 1000 population
Surat
Rajkot
Pune
Mysore
Mumbai
Jaipur
Indore
Delhi
Chennai
Bhopal
Bangalore
Ahmedabad
0 100 200 300 400 500Number of two-wheelers per 1000 population
Taipei
Kuala Lampur
Jakarta
Ho Chi Minh
Bangkok
2.3.36 To some extent, the poor showing of public transport in India can be attributed to the fact that the tax policy regime militates against public transport. The total tax burden for public transport vehicles per vehicle km is 2.6 times higher than for private vehicles (Table 2.2). The Parliamentary Standing Committee on Urban Development (Urban Transport) 2010 recommended a ‛congestion tax’ on personal vehicles in the form of a toll tax in congested areas. But the Ministry of Urban Development has indicated that ‛in the Indian context, levying of congestion tax may be pre-mature at this stage keeping in view the quantity and quality of the available public transport and the absence of Intelligent Transport System (ITS)’ (Lok Sabha 2010).
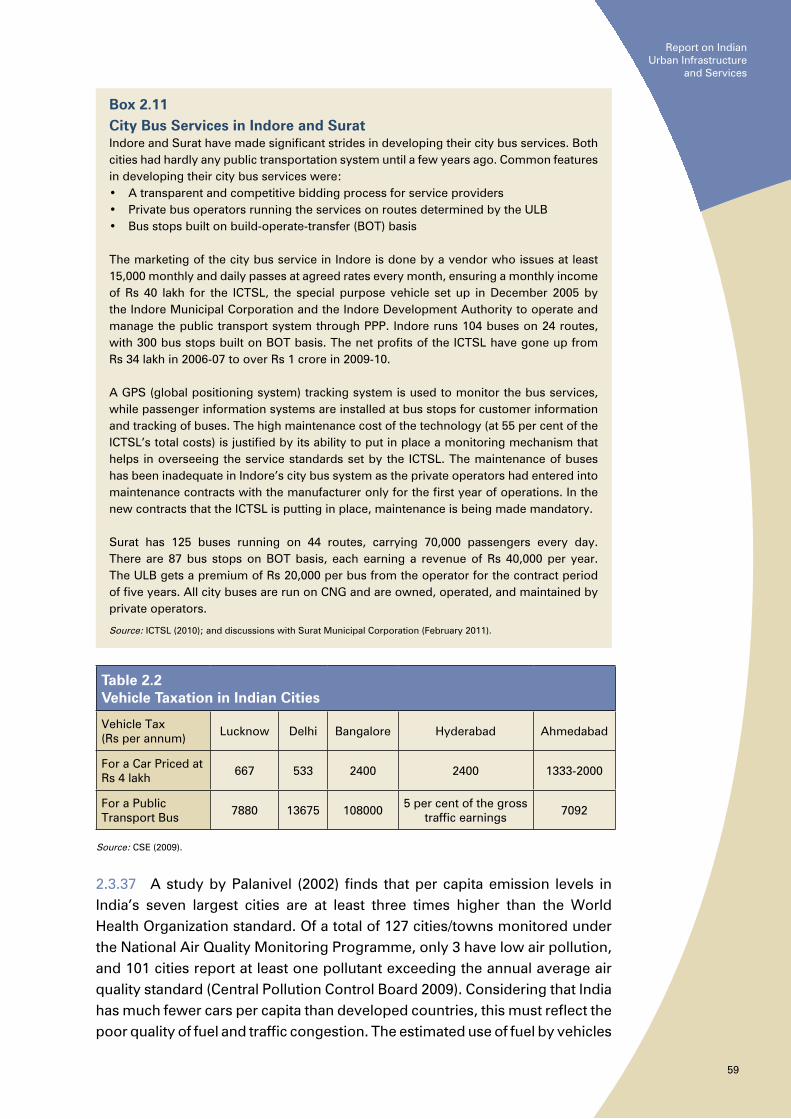
59
Report on Indian Urban Infrastructure
and Services
Table 2.2 Vehicle Taxation in Indian Cities
Vehicle Tax (Rs per annum) Lucknow Delhi Bangalore Hyderabad Ahmedabad
For a Car Priced at Rs 4 lakh 667 533 2400 2400 1333-2000
For a Public Transport Bus 7880 13675 108000 5 per cent of the gross
traffic earnings 7092
Source: CSE (2009).
Box 2.11City Bus Services in Indore and SuratIndore and Surat have made significant strides in developing their city bus services. Both cities had hardly any public transportation system until a few years ago. Common features in developing their city bus services were:
A transparent and competitive bidding process for service providers• Private bus operators running the services on routes determined by the ULB• Bus stops built on build-operate-transfer (BOT) basis•
The marketing of the city bus service in Indore is done by a vendor who issues at least 15,000 monthly and daily passes at agreed rates every month, ensuring a monthly income of Rs 40 lakh for the ICTSL, the special purpose vehicle set up in December 2005 by the Indore Municipal Corporation and the Indore Development Authority to operate and manage the public transport system through PPP. Indore runs 104 buses on 24 routes, with 300 bus stops built on BOT basis. The net profits of the ICTSL have gone up from Rs 34 lakh in 2006-07 to over Rs 1 crore in 2009-10.
A GPS (global positioning system) tracking system is used to monitor the bus services, while passenger information systems are installed at bus stops for customer information and tracking of buses. The high maintenance cost of the technology (at 55 per cent of the ICTSL’s total costs) is justified by its ability to put in place a monitoring mechanism that helps in overseeing the service standards set by the ICTSL. The maintenance of buses has been inadequate in Indore’s city bus system as the private operators had entered into maintenance contracts with the manufacturer only for the first year of operations. In the new contracts that the ICTSL is putting in place, maintenance is being made mandatory.
Surat has 125 buses running on 44 routes, carrying 70,000 passengers every day. There are 87 bus stops on BOT basis, each earning a revenue of Rs 40,000 per year. The ULB gets a premium of Rs 20,000 per bus from the operator for the contract period of five years. All city buses are run on CNG and are owned, operated, and maintained by private operators.
Source: ICTSL (2010); and discussions with Surat Municipal Corporation (February 2011).
2.3.37 A study by Palanivel (2002) finds that per capita emission levels in India’s seven largest cities are at least three times higher than the World Health Organization standard. Of a total of 127 cities/towns monitored under the National Air Quality Monitoring Programme, only 3 have low air pollution, and 101 cities report at least one pollutant exceeding the annual average air quality standard (Central Pollution Control Board 2009). Considering that India has much fewer cars per capita than developed countries, this must reflect the poor quality of fuel and traffic congestion. The estimated use of fuel by vehicles
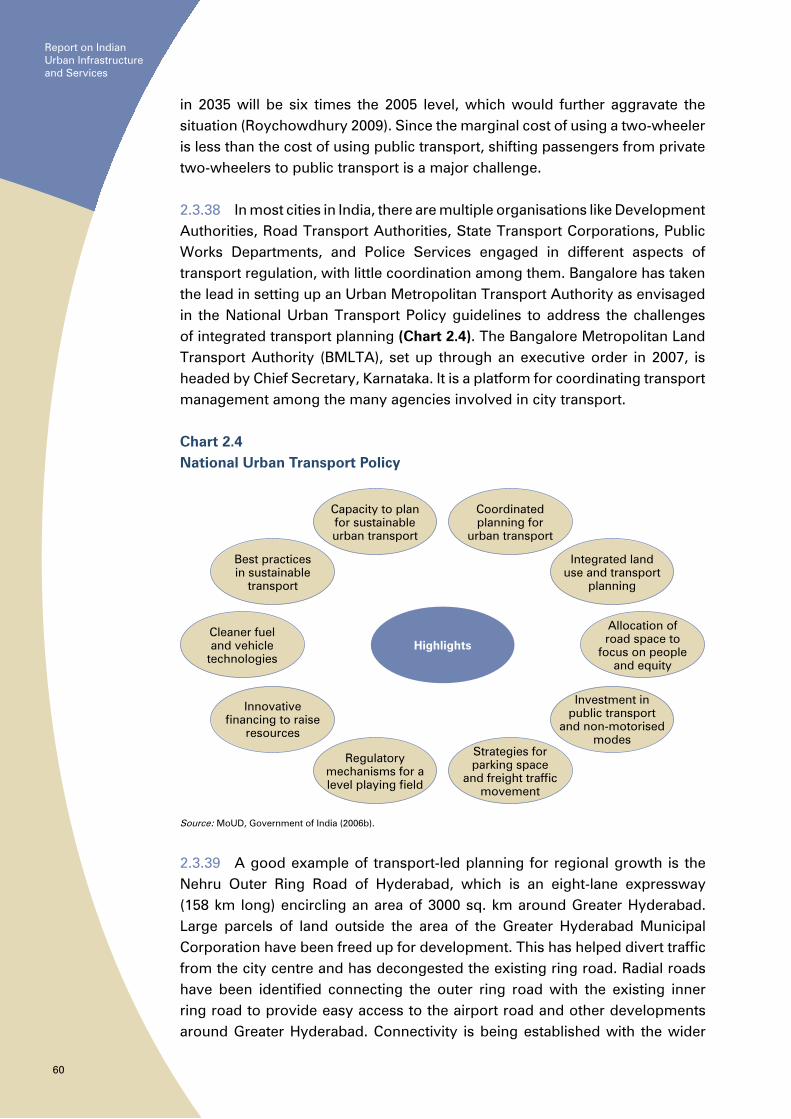
60
Report on Indian Urban Infrastructure and Services
in 2035 will be six times the 2005 level, which would further aggravate the situation (Roychowdhury 2009). Since the marginal cost of using a two-wheeler is less than the cost of using public transport, shifting passengers from private two-wheelers to public transport is a major challenge.
2.3.38 In most cities in India, there are multiple organisations like Development Authorities, Road Transport Authorities, State Transport Corporations, Public Works Departments, and Police Services engaged in different aspects of transport regulation, with little coordination among them. Bangalore has taken the lead in setting up an Urban Metropolitan Transport Authority as envisaged in the National Urban Transport Policy guidelines to address the challenges of integrated transport planning (Chart 2.4). The Bangalore Metropolitan Land Transport Authority (BMLTA), set up through an executive order in 2007, is headed by Chief Secretary, Karnataka. It is a platform for coordinating transport management among the many agencies involved in city transport.
Chart 2.4 National Urban Transport Policy
Capacity to plan for sustainable urban transport
Innovative financing to raise
resources
Cleaner fuel and vehicle
technologies
Best practices in sustainable
transport
Regulatory mechanisms for a level playing field
Highlights
Coordinated planning for
urban transport
Integrated land use and transport
planning
Allocation of road space to
focus on people and equity
Investment in public transport
and non-motorised modes
Strategies for parking space
and freight traffic movement
Source: MoUD, Government of India (2006b).
2.3.39 A good example of transport-led planning for regional growth is the Nehru Outer Ring Road of Hyderabad, which is an eight-lane expressway (158 km long) encircling an area of 3000 sq. km around Greater Hyderabad. Large parcels of land outside the area of the Greater Hyderabad Municipal Corporation have been freed up for development. This has helped divert traffic from the city centre and has decongested the existing ring road. Radial roads have been identified connecting the outer ring road with the existing inner ring road to provide easy access to the airport road and other developments around Greater Hyderabad. Connectivity is being established with the wider
61
Report on Indian Urban Infrastructure
and Services
region through alignment of radial roads with the National Highways and State Highways.
2.3.40 The Hyderabad Growth Corridor Limited has been set up to execute the outer ring road project with satellite townships planned along a growth corridor of 1 km on either side of the ring road to attract business parks, technology clusters, etc. Provision is also being made for a 25 km-long integrated network of metro rail and buses. The increased land values arising from the opening of the ring road can be channelised towards financing future infrastructure development along the growth corridor and in areas between the outer and inner ring roads; this should be a good example of financing urban infrastructure through unlocking land values.
2.3.41 Poor data resulting from the multiplicity of agencies in the transport sector is a problem observed across the world. The Institute of Urban Transport (IUT) has been trying to set up a National Urban Transport Information Centre (NUTIC) in India to collect and maintain urban transport data. This Institute can help in developing an integrated land and transport planning framework for Indian cities.
2.4 Factors contributing to poor service delivery
2.4.1 The near crisis situation with respect to urban service delivery in the cities of India is the result of (i) a long period of neglect of urban planning and infrastructure by state governments whose responsibility it was, (ii) lack of leadership from the Government of India, and (iii) fragmented and/or overlapping institutional responsibilities of the state government, ULBs, Development Authorities, parastatals, etc. Inadequate investment in urban infrastructure, poor maintenance of public infrastructure assets, weak administration, poor systems of delivery, inadequate autonomy for ULBs, and lack of accountability to the community have all contributed in good measure to bringing urban services to their present abysmal state. The rest of this chapter gives a brief overview of the factors contributing to the poor state of urban service delivery.
i. Inadequate investments in urban infrastructure
2.4.2 Municipal budgets in India have been heavily dependent on fiscal transfers from the higher tiers of government, which tend to be inadequate considering the needs of Indian cities. A study by Mohanty et al. (2007) shows that for 35 municipal corporations, there was, on average, underspending of 76 per cent on capital investments necessary to meet minimum standards of services. The study also finds that low cost recovery is typically associated with poor service quality.
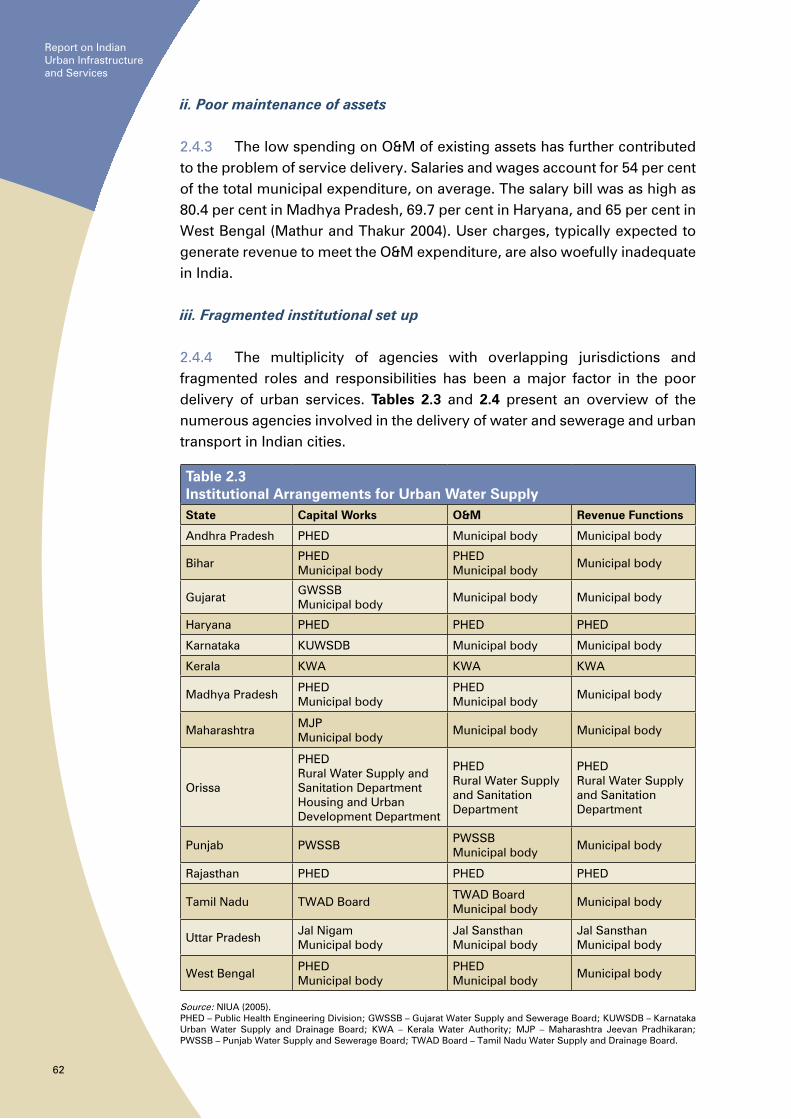
62
Report on Indian Urban Infrastructure and Services
Table 2.3Institutional Arrangements for Urban Water SupplyState Capital Works O&M Revenue Functions
Andhra Pradesh PHED Municipal body Municipal body
Bihar PHEDMunicipal body
PHEDMunicipal body Municipal body
Gujarat GWSSBMunicipal body Municipal body Municipal body
Haryana PHED PHED PHED
Karnataka KUWSDB Municipal body Municipal body
Kerala KWA KWA KWA
Madhya Pradesh PHEDMunicipal body
PHEDMunicipal body Municipal body
Maharashtra MJP Municipal body Municipal body Municipal body
Orissa
PHEDRural Water Supply and Sanitation Department Housing and Urban Development Department
PHEDRural Water Supply and Sanitation Department
PHEDRural Water Supply and Sanitation Department
Punjab PWSSB PWSSBMunicipal body Municipal body
Rajasthan PHED PHED PHED
Tamil Nadu TWAD Board TWAD BoardMunicipal body Municipal body
Uttar Pradesh Jal NigamMunicipal body
Jal SansthanMunicipal body
Jal SansthanMunicipal body
West Bengal PHEDMunicipal body
PHEDMunicipal body Municipal body
Source: NIUA (2005).PHED – Public Health Engineering Division; GWSSB – Gujarat Water Supply and Sewerage Board; KUWSDB – Karnataka Urban Water Supply and Drainage Board; KWA – Kerala Water Authority; MJP – Maharashtra Jeevan Pradhikaran; PWSSB – Punjab Water Supply and Sewerage Board; TWAD Board – Tamil Nadu Water Supply and Drainage Board.
ii. Poor maintenance of assets
2.4.3 The low spending on O&M of existing assets has further contributed to the problem of service delivery. Salaries and wages account for 54 per cent of the total municipal expenditure, on average. The salary bill was as high as 80.4 per cent in Madhya Pradesh, 69.7 per cent in Haryana, and 65 per cent in West Bengal (Mathur and Thakur 2004). User charges, typically expected to generate revenue to meet the O&M expenditure, are also woefully inadequate in India.
iii. Fragmented institutional set up
2.4.4 The multiplicity of agencies with overlapping jurisdictions and fragmented roles and responsibilities has been a major factor in the poor delivery of urban services. Tables 2.3 and 2.4 present an overview of the numerous agencies involved in the delivery of water and sewerage and urban transport in Indian cities.
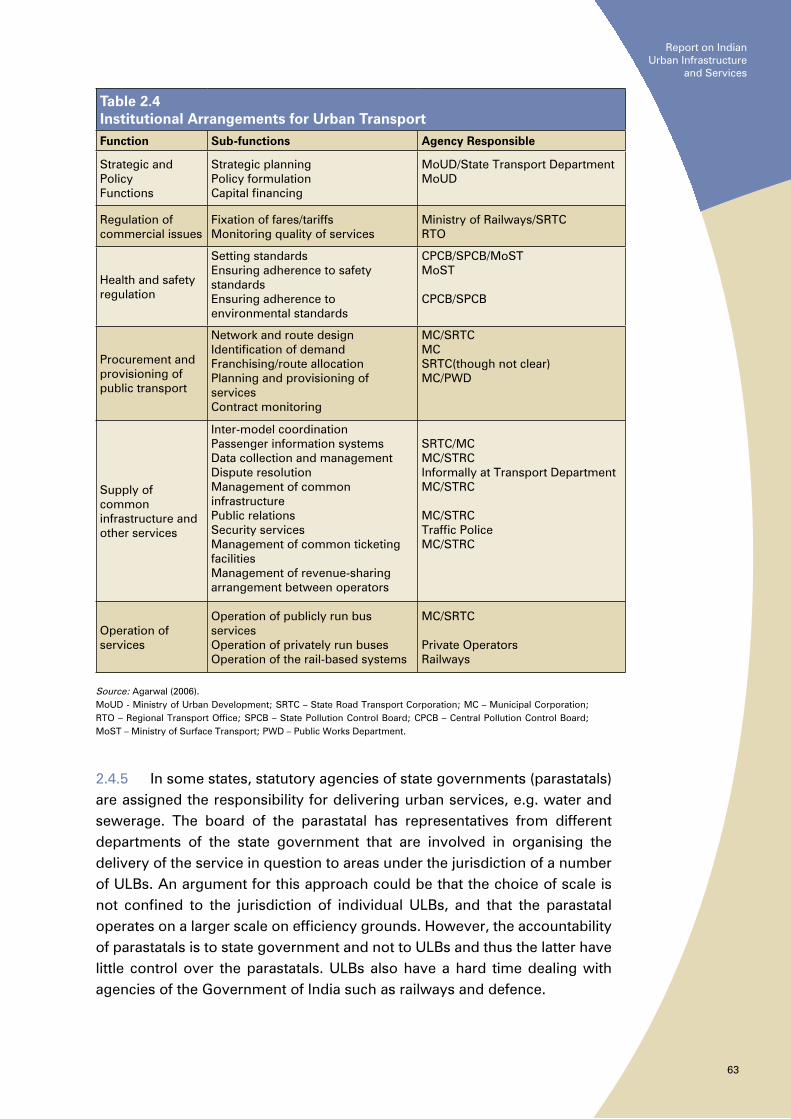
63
Report on Indian Urban Infrastructure
and Services
Table 2.4Institutional Arrangements for Urban Transport Function Sub-functions Agency Responsible
Strategic and Policy Functions
Strategic planningPolicy formulationCapital financing
MoUD/State Transport Department MoUD
Regulation ofcommercial issues
Fixation of fares/tariffsMonitoring quality of services
Ministry of Railways/SRTCRTO
Health and safety regulation
Setting standardsEnsuring adherence to safety standardsEnsuring adherence to environmental standards
CPCB/SPCB/MoSTMoST
CPCB/SPCB
Procurement and provisioning of public transport
Network and route designIdentification of demandFranchising/route allocationPlanning and provisioning of servicesContract monitoring
MC/SRTCMCSRTC(though not clear) MC/PWD
Supply of common infrastructure and other services
Inter-model coordinationPassenger information systemsData collection and managementDispute resolutionManagement of common infrastructurePublic relationsSecurity servicesManagement of common ticketing facilitiesManagement of revenue-sharing arrangement between operators
SRTC/MCMC/STRCInformally at Transport DepartmentMC/STRC
MC/STRCTraffic PoliceMC/STRC
Operation of services
Operation of publicly run bus servicesOperation of privately run busesOperation of the rail-based systems
MC/SRTC
Private OperatorsRailways
Source: Agarwal (2006).MoUD - Ministry of Urban Development; SRTC – State Road Transport Corporation; MC – Municipal Corporation; RTO – Regional Transport Office; SPCB – State Pollution Control Board; CPCB – Central Pollution Control Board; MoST – Ministry of Surface Transport; PWD – Public Works Department.
2.4.5 In some states, statutory agencies of state governments (parastatals) are assigned the responsibility for delivering urban services, e.g. water and sewerage. The board of the parastatal has representatives from different departments of the state government that are involved in organising the delivery of the service in question to areas under the jurisdiction of a number of ULBs. An argument for this approach could be that the choice of scale is not confined to the jurisdiction of individual ULBs, and that the parastatal operates on a larger scale on efficiency grounds. However, the accountability of parastatals is to state government and not to ULBs and thus the latter have little control over the parastatals. ULBs also have a hard time dealing with agencies of the Government of India such as railways and defence.
64
Report on Indian Urban Infrastructure and Services
2.4.6 Little accountability in city governance and the monopolistic nature of public services have compounded the crisis. With no competition or pressure from the community to raise the standards of delivery, and little monitoring in place, the absence of a regulatory regime has further aggravated the situation.
2.4.7 Cities could, in principle, improve their management skills and deliver better quality of services, but given the complex web of relationships, often infusion of a new organisation or private participation tends to catalyse success. Some of the successful initiatives highlighted in this chapter have seen participation from the private sector, mainly through outsourcing of services. These have been led either by a local champion and/or by state government creating an enabling environment.
2.4.8 Successful PPP initiatives that can bring in finances for capital investment for projects may well need more governance reforms rather than less, be it in the design of the project and managing the process of bidding and awarding of the contract or ensuring compliance with contract stipulations. It is critical to ensure that the right service delivery standards are maintained, whether provided by a public agency or through private participation.
iv. Capacity constraints
2.4.9 Municipal administration has typically suffered from overstaffing of untrained, unskilled manpower on the one hand and shortage of qualified technical staff and managerial supervisors on the other. It is not surprising then that ULBs have not been in a position to deliver current demand for urban services, let alone plan for the growing needs of cities.4
2.4.10 The staff and management at ULBs are typically not accustomed to innovation and taking up new tasks, and are more comfortable opting for traditional methods of procurement and working with government grants and loans. The need of the hour is to engage with the market in bridging infrastructure deficits and also with civil society in delivering services. Capacity for planning, project preparation, project implementation and project management has to be built through training and skill development.
2.5 State of inclusive development
2.5.1 Health and sanitation do not respect boundaries. The Committee views universalisation of services as an important step towards taking the inclusive
4 Water utilities in India employ an average of 12 persons per 1000 water connections, compared to the global best practice of 2-3 persons per 1000 connections (CII and CEEW 2010).
65
Report on Indian Urban Infrastructure
and Services
agenda forward. Besides addressing the need for basic public services, there is the question of low income housing and public transportation.
2.5.2 The Committee believes that public services of water, sewerage, solid waste collection, transportation and disposal, waste water treatment, storm water drainage, roads, public transport, street lights, etc. must be accessible to one and all, and must meet the norms set out in the Report. The mode of delivery may vary, and the ULB must be accountable for delivering the same standard of service to all including the poor.
2.5.3 In India, there has been little planning for meeting the housing needs of the urban poor and managing informal sector activities encompassing vendors, construction workers, and petty traders. Since slums in the country are habitats with informal economic activities where the poor live and work, slum redevelopment has to be seen as developing ‛mini townships’ that cater to the economic and social needs of the poor. Earlier interventions aimed at slum improvement focused on relocation, requiring slum dwellers to relocate to the periphery of cities with poor transport connectivity to the city. Experience suggests that such interventions lead to large-scale disruption of livelihoods and social networks built over time.
2.5.4 Along with housing for the poor, mobility is a major contributor to inclusive development. Transit-oriented development planning and trip-reduction zoning followed by countries like Singapore and the USA (e.g. locating the poor in high-density settlements on major metropolitan public transport nodes) are yet to be adopted in India. Planning for Indian cities has tended to ignore transportation. The master planning system has not focused on spatial planning for the urban poor to provide them ‛a place to live’, ‛a place to work’, ‛a place to sell’, and public transport to move from one place to another. Urban transport can also play a major role in increasing access to services like education and healthcare for the poor as well as strengthening social networks.
2.5.5 Recognising the importance of inclusive development, the Committee has made explicit provision for investment in renewal and redevelopment including slums. The Committee has also emphasized the need for inclusive planning which caters to the need for housing and public transport with special concern for low income groups and the poor.

Chapter IIIEstimates of Investment for Urban Infrastructure

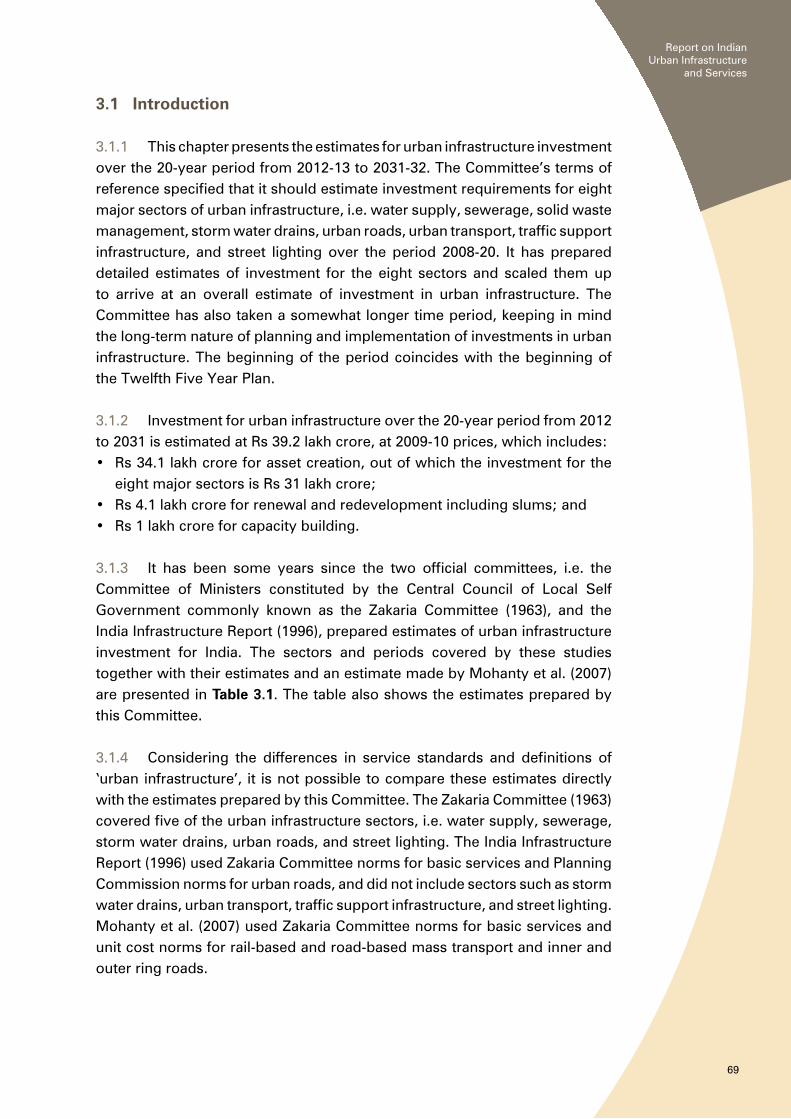
69
Report 2009-2010
69
Report on Indian Urban Infrastructure
and Services
3.1 Introduction
3.1.1 This chapter presents the estimates for urban infrastructure investment over the 20-year period from 2012-13 to 2031-32. The Committee’s terms of reference specified that it should estimate investment requirements for eight major sectors of urban infrastructure, i.e. water supply, sewerage, solid waste management, storm water drains, urban roads, urban transport, traffic support infrastructure, and street lighting over the period 2008-20. It has prepared detailed estimates of investment for the eight sectors and scaled them up to arrive at an overall estimate of investment in urban infrastructure. The Committee has also taken a somewhat longer time period, keeping in mind the long-term nature of planning and implementation of investments in urban infrastructure. The beginning of the period coincides with the beginning of the Twelfth Five Year Plan.
3.1.2 Investment for urban infrastructure over the 20-year period from 2012 to 2031 is estimated at Rs 39.2 lakh crore, at 2009-10 prices, which includes:
Rs 34.1 lakh crore for asset creation, out of which the investment for the • eight major sectors is Rs 31 lakh crore; Rs 4.1 lakh crore for renewal and redevelopment including slums; and• Rs 1 lakh crore for capacity building.•
3.1.3 It has been some years since the two official committees, i.e. the Committee of Ministers constituted by the Central Council of Local Self Government commonly known as the Zakaria Committee (1963), and the India Infrastructure Report (1996), prepared estimates of urban infrastructure investment for India. The sectors and periods covered by these studies together with their estimates and an estimate made by Mohanty et al. (2007) are presented in Table 3.1. The table also shows the estimates prepared by this Committee.
3.1.4 Considering the differences in service standards and definitions of ‛urban infrastructure’, it is not possible to compare these estimates directly with the estimates prepared by this Committee. The Zakaria Committee (1963) covered five of the urban infrastructure sectors, i.e. water supply, sewerage, storm water drains, urban roads, and street lighting. The India Infrastructure Report (1996) used Zakaria Committee norms for basic services and Planning Commission norms for urban roads, and did not include sectors such as storm water drains, urban transport, traffic support infrastructure, and street lighting. Mohanty et al. (2007) used Zakaria Committee norms for basic services and unit cost norms for rail-based and road-based mass transport and inner and outer ring roads.
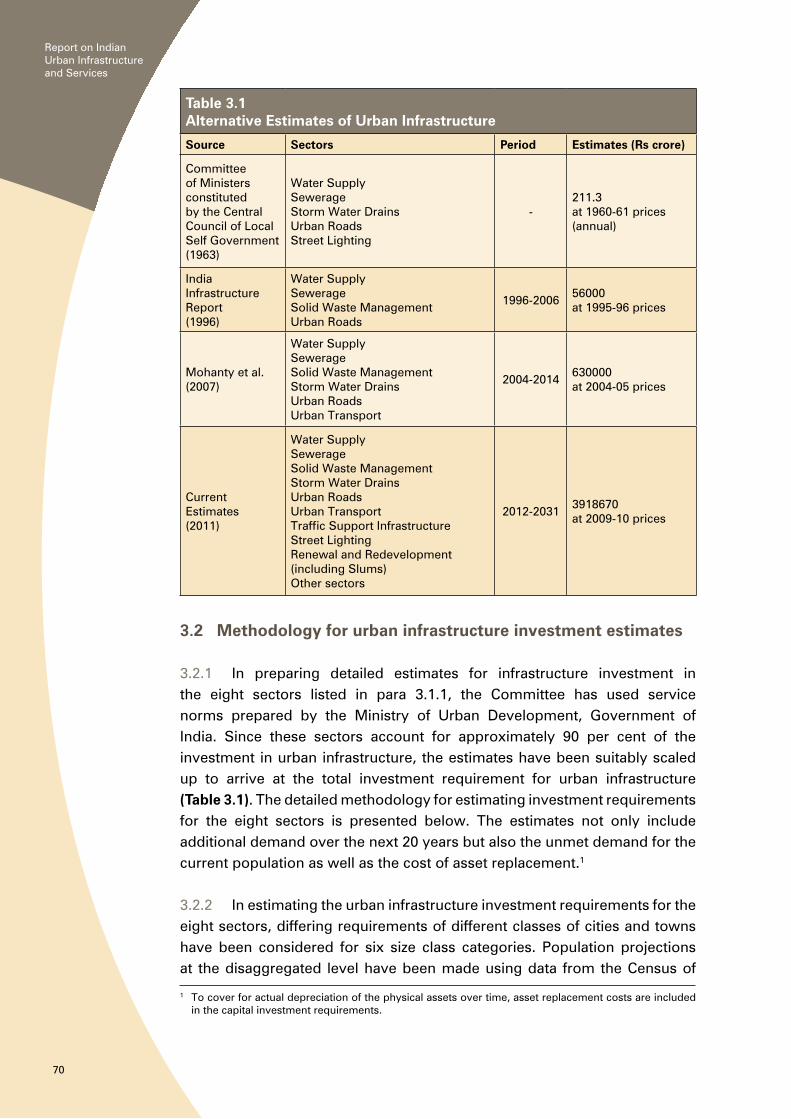
70
Report 2009-2010
70
Report on Indian Urban Infrastructure and Services
Table 3.1Alternative Estimates of Urban Infrastructure
Source Sectors Period Estimates (Rs crore)
Committee of Ministers constituted by the Central Council of Local Self Government (1963)
Water SupplySewerage Storm Water DrainsUrban RoadsStreet Lighting
-211.3at 1960-61 prices(annual)
IndiaInfrastructureReport(1996)
Water SupplySewerage Solid Waste ManagementUrban Roads
1996-2006 56000 at 1995-96 prices
Mohanty et al. (2007)
Water SupplySewerage Solid Waste ManagementStorm Water DrainsUrban Roads Urban Transport
2004-2014 630000 at 2004-05 prices
Current Estimates(2011)
Water SupplySewerage Solid Waste ManagementStorm Water DrainsUrban Roads Urban TransportTraffic Support InfrastructureStreet Lighting Renewal and Redevelopment (including Slums)Other sectors
2012-2031 3918670at 2009-10 prices
3.2 Methodology for urban infrastructure investment estimates
3.2.1 In preparing detailed estimates for infrastructure investment in the eight sectors listed in para 3.1.1, the Committee has used service norms prepared by the Ministry of Urban Development, Government of India. Since these sectors account for approximately 90 per cent of the investment in urban infrastructure, the estimates have been suitably scaled up to arrive at the total investment requirement for urban infrastructure (Table 3.1). The detailed methodology for estimating investment requirements for the eight sectors is presented below. The estimates not only include additional demand over the next 20 years but also the unmet demand for the current population as well as the cost of asset replacement.1
3.2.2 In estimating the urban infrastructure investment requirements for the eight sectors, differing requirements of different classes of cities and towns have been considered for six size class categories. Population projections at the disaggregated level have been made using data from the Census of
1 To cover for actual depreciation of the physical assets over time, asset replacement costs are included in the capital investment requirements.
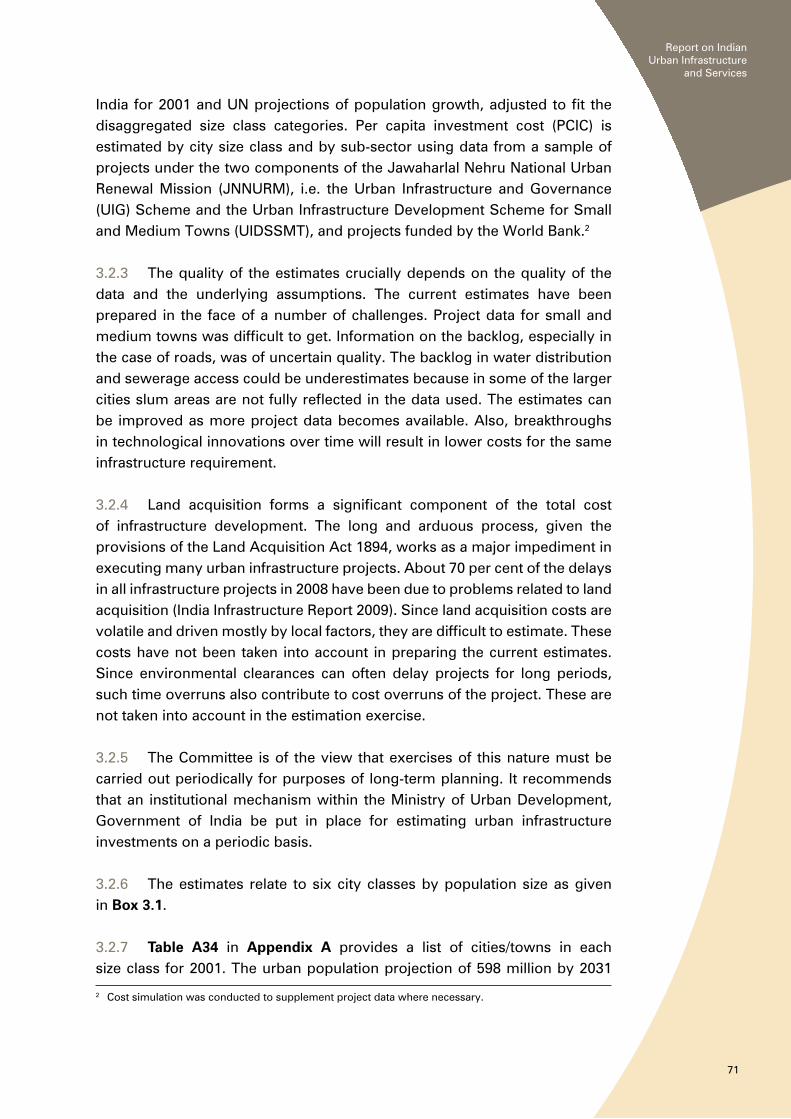
71
Report 2009-2010
71
Report on Indian Urban Infrastructure
and Services
India for 2001 and UN projections of population growth, adjusted to fit the disaggregated size class categories. Per capita investment cost (PCIC) is estimated by city size class and by sub-sector using data from a sample of projects under the two components of the Jawaharlal Nehru National Urban Renewal Mission (JNNURM), i.e. the Urban Infrastructure and Governance (UIG) Scheme and the Urban Infrastructure Development Scheme for Small and Medium Towns (UIDSSMT), and projects funded by the World Bank.2
3.2.3 The quality of the estimates crucially depends on the quality of the data and the underlying assumptions. The current estimates have been prepared in the face of a number of challenges. Project data for small and medium towns was difficult to get. Information on the backlog, especially in the case of roads, was of uncertain quality. The backlog in water distribution and sewerage access could be underestimates because in some of the larger cities slum areas are not fully reflected in the data used. The estimates can be improved as more project data becomes available. Also, breakthroughs in technological innovations over time will result in lower costs for the same infrastructure requirement.
3.2.4 Land acquisition forms a significant component of the total cost of infrastructure development. The long and arduous process, given the provisions of the Land Acquisition Act 1894, works as a major impediment in executing many urban infrastructure projects. About 70 per cent of the delays in all infrastructure projects in 2008 have been due to problems related to land acquisition (India Infrastructure Report 2009). Since land acquisition costs are volatile and driven mostly by local factors, they are difficult to estimate. These costs have not been taken into account in preparing the current estimates. Since environmental clearances can often delay projects for long periods, such time overruns also contribute to cost overruns of the project. These are not taken into account in the estimation exercise.
3.2.5 The Committee is of the view that exercises of this nature must be carried out periodically for purposes of long-term planning. It recommends that an institutional mechanism within the Ministry of Urban Development, Government of India be put in place for estimating urban infrastructure investments on a periodic basis.
3.2.6 The estimates relate to six city classes by population size as given in Box 3.1.
3.2.7 Table A34 in Appendix A provides a list of cities/towns in each size class for 2001. The urban population projection of 598 million by 2031 2 Cost simulation was conducted to supplement project data where necessary.
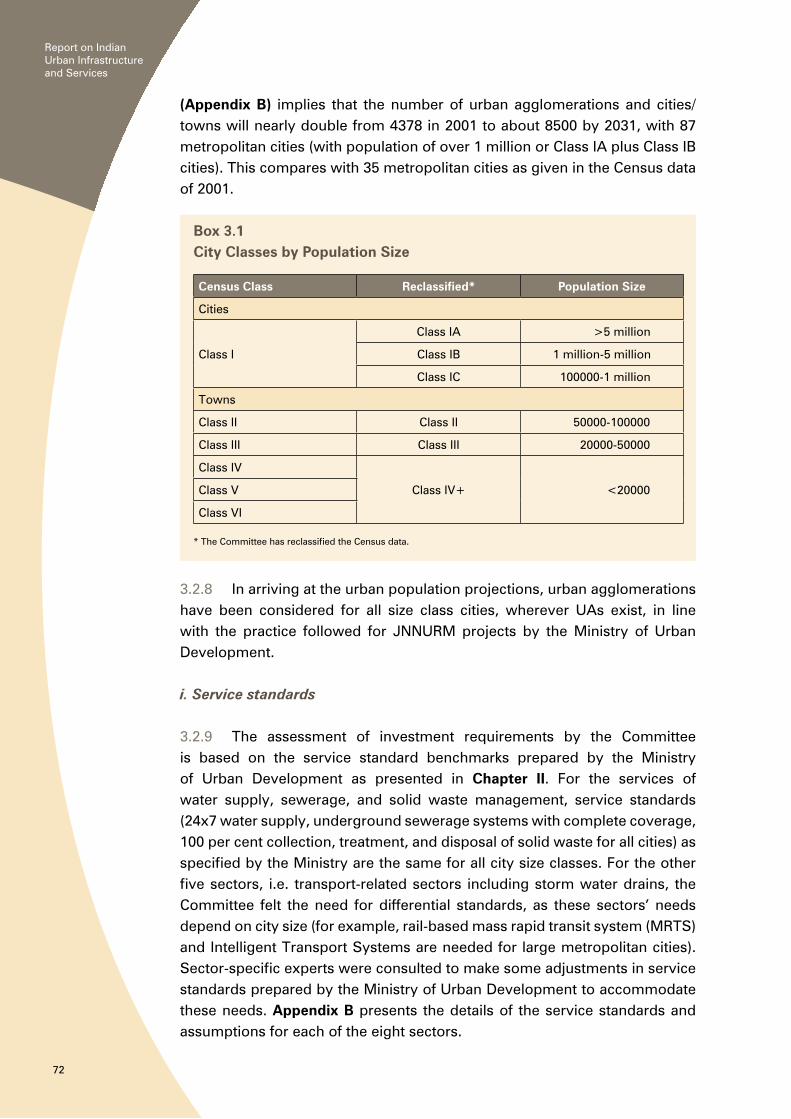
72
Report 2009-2010
72
Report on Indian Urban Infrastructure and Services
(Appendix B) implies that the number of urban agglomerations and cities/towns will nearly double from 4378 in 2001 to about 8500 by 2031, with 87 metropolitan cities (with population of over 1 million or Class IA plus Class IB cities). This compares with 35 metropolitan cities as given in the Census data of 2001.
* The Committee has reclassified the Census data.
Box 3.1City Classes by Population Size
3.2.8 In arriving at the urban population projections, urban agglomerations have been considered for all size class cities, wherever UAs exist, in line with the practice followed for JNNURM projects by the Ministry of Urban Development.
i. Service standards
3.2.9 The assessment of investment requirements by the Committee is based on the service standard benchmarks prepared by the Ministry of Urban Development as presented in Chapter II. For the services of water supply, sewerage, and solid waste management, service standards (24x7 water supply, underground sewerage systems with complete coverage, 100 per cent collection, treatment, and disposal of solid waste for all cities) as specified by the Ministry are the same for all city size classes. For the other five sectors, i.e. transport-related sectors including storm water drains, the Committee felt the need for differential standards, as these sectors’ needs depend on city size (for example, rail-based mass rapid transit system (MRTS) and Intelligent Transport Systems are needed for large metropolitan cities). Sector-specific experts were consulted to make some adjustments in service standards prepared by the Ministry of Urban Development to accommodate these needs. Appendix B presents the details of the service standards and assumptions for each of the eight sectors.
Census Class Reclassified* Population Size
Cities
Class I
Class IA >5 million
Class IB 1 million-5 million
Class IC 100000-1 million
Towns
Class II Class II 50000-100000
Class III Class III 20000-50000
Class IV
Class IV+ <20000Class V
Class VI
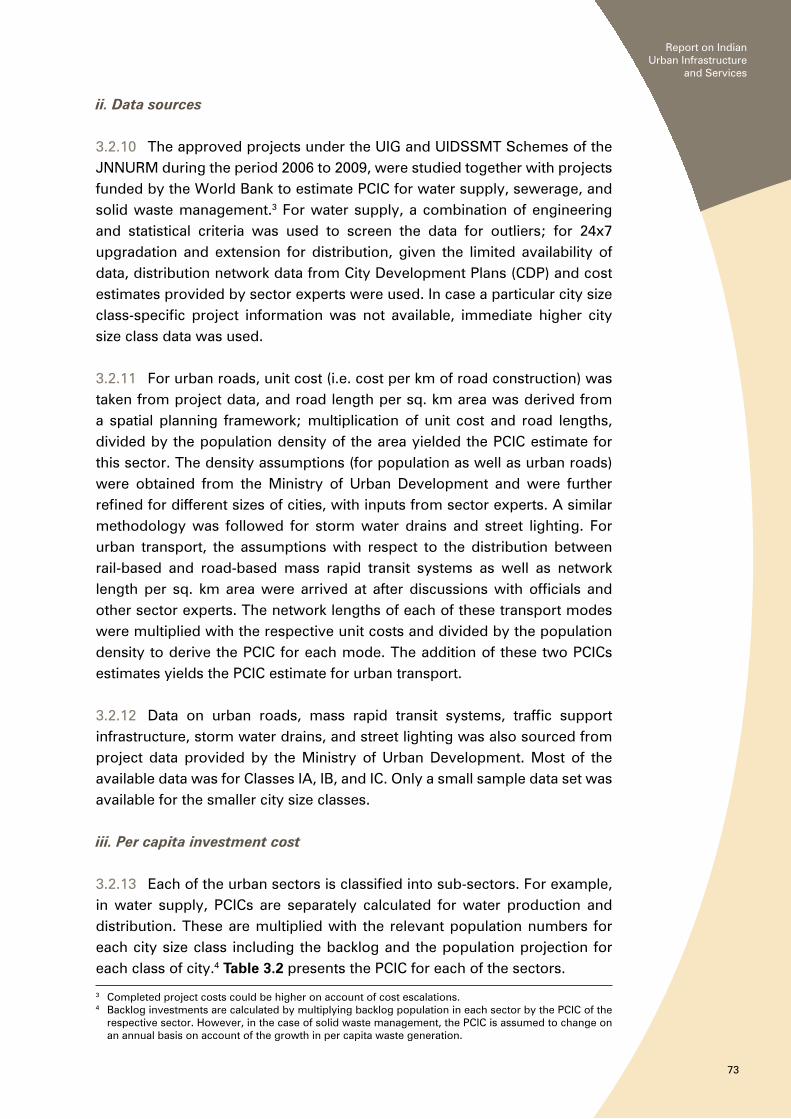
73
Report 2009-2010
73
Report on Indian Urban Infrastructure
and Services
ii. Data sources
3.2.10 The approved projects under the UIG and UIDSSMT Schemes of the JNNURM during the period 2006 to 2009, were studied together with projects funded by the World Bank to estimate PCIC for water supply, sewerage, and solid waste management.3 For water supply, a combination of engineering and statistical criteria was used to screen the data for outliers; for 24x7 upgradation and extension for distribution, given the limited availability of data, distribution network data from City Development Plans (CDP) and cost estimates provided by sector experts were used. In case a particular city size class-specific project information was not available, immediate higher city size class data was used.
3.2.11 For urban roads, unit cost (i.e. cost per km of road construction) was taken from project data, and road length per sq. km area was derived from a spatial planning framework; multiplication of unit cost and road lengths, divided by the population density of the area yielded the PCIC estimate for this sector. The density assumptions (for population as well as urban roads) were obtained from the Ministry of Urban Development and were further refined for different sizes of cities, with inputs from sector experts. A similar methodology was followed for storm water drains and street lighting. For urban transport, the assumptions with respect to the distribution between rail-based and road-based mass rapid transit systems as well as network length per sq. km area were arrived at after discussions with officials and other sector experts. The network lengths of each of these transport modes were multiplied with the respective unit costs and divided by the population density to derive the PCIC for each mode. The addition of these two PCICs estimates yields the PCIC estimate for urban transport.
3.2.12 Data on urban roads, mass rapid transit systems, traffic support infrastructure, storm water drains, and street lighting was also sourced from project data provided by the Ministry of Urban Development. Most of the available data was for Classes IA, IB, and IC. Only a small sample data set was available for the smaller city size classes.
iii. Per capita investment cost
3.2.13 Each of the urban sectors is classified into sub-sectors. For example, in water supply, PCICs are separately calculated for water production and distribution. These are multiplied with the relevant population numbers for each city size class including the backlog and the population projection for each class of city.4 Table 3.2 presents the PCIC for each of the sectors.3 Completed project costs could be higher on account of cost escalations.4 Backlog investments are calculated by multiplying backlog population in each sector by the PCIC of the
respective sector. However, in the case of solid waste management, the PCIC is assumed to change on an annual basis on account of the growth in per capita waste generation.
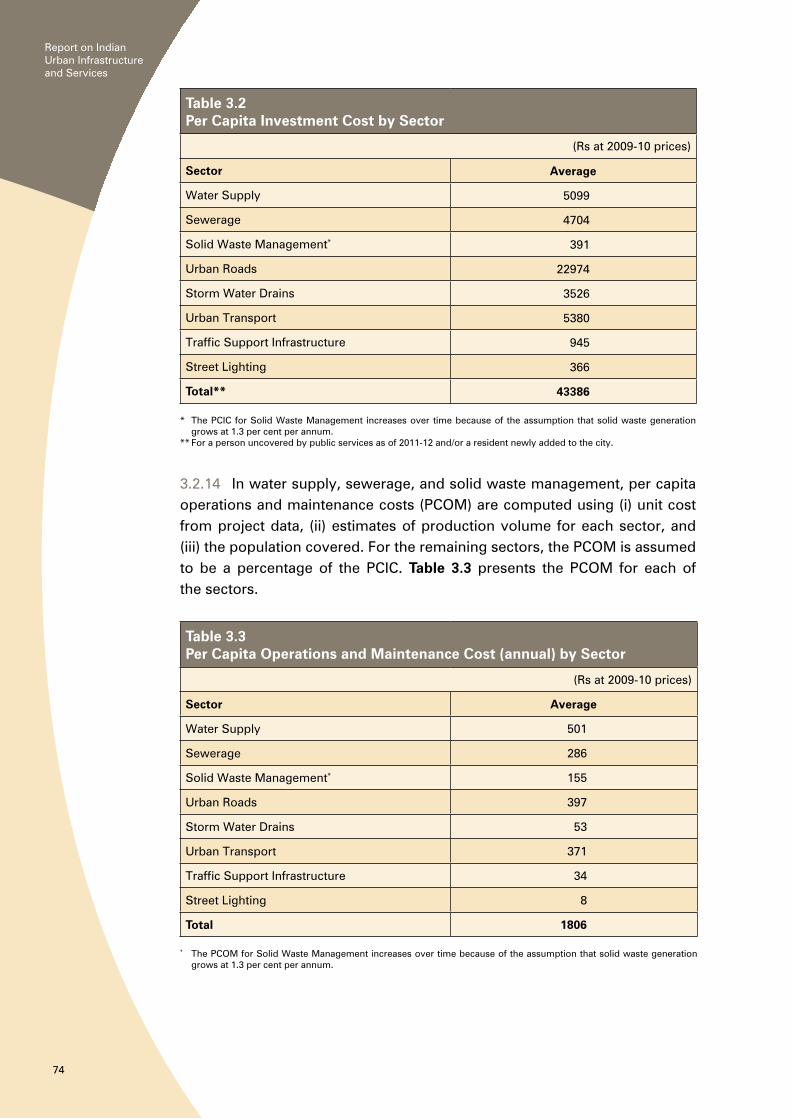
74
Report 2009-2010
74
Report on Indian Urban Infrastructure and Services
Table 3.3Per Capita Operations and Maintenance Cost (annual) by Sector
(Rs at 2009-10 prices)
Sector Average
Water Supply 501
Sewerage 286
Solid Waste Management* 155
Urban Roads 397
Storm Water Drains 53
Urban Transport 371
Traffic Support Infrastructure 34
Street Lighting 8
Total 1806
* The PCOM for Solid Waste Management increases over time because of the assumption that solid waste generation grows at 1.3 per cent per annum.
Table 3.2Per Capita Investment Cost by Sector
(Rs at 2009-10 prices)
Sector Average
Water Supply 5099
Sewerage 4704
Solid Waste Management* 391
Urban Roads 22974
Storm Water Drains 3526
Urban Transport 5380
Traffic Support Infrastructure 945
Street Lighting 366
Total** 43386
* The PCIC for Solid Waste Management increases over time because of the assumption that solid waste generation grows at 1.3 per cent per annum.** For a person uncovered by public services as of 2011-12 and/or a resident newly added to the city.
3.2.14 In water supply, sewerage, and solid waste management, per capita operations and maintenance costs (PCOM) are computed using (i) unit cost from project data, (ii) estimates of production volume for each sector, and (iii) the population covered. For the remaining sectors, the PCOM is assumed to be a percentage of the PCIC. Table 3.3 presents the PCOM for each of the sectors.
75
Report 2009-2010
75
Report on Indian Urban Infrastructure
and Services
5 CDP data has been cross-checked against data from Census of India 2001.6 This includes Rs 7.4 lakh crore of replacement cost.7 For sewerage, investment requirements for the collection and treatment of industrial waste water are not
included in the estimation exercise.
iv. Computation of the service backlog
3.2.15 CDPs are used to estimate the service backlog for water supply, sewerage, and solid waste management.5 For example, in water supply, the percentage of urban population with production allocation below 168 lpcd in 2011 is used for determining production requirements; for extension of distribution, the percentage of urban population without access to piped water supply within the premises in 2011 is used. For upgradation of distribution, the percentage of urban population without access to 24x7 water supply in 2011 is obtained from the project data.
3.2.16 Data from Comprehensive Mobility Plans is used in determining the backlog percentages for urban roads. The same backlog percentages are used for storm water drains and street lighting. For urban transport and traffic support infrastructure, backlog data is obtained through discussions with officials of the Ministry of Urban Development.
3.3 Estimates of investment in urban infrastructure: 2012-2031
i. Investment estimates for eight major sectors of urban infrastructure
3.3.1 The investment estimates for the eight sectors of urban infrastructure for the 20-year period from 2012 to 2031 amount to Rs 31 lakh crore at 2009-10 prices.6 The sector-wise estimates for the eight sectors are presented in Table 3.4. Sectors delivering urban services such as water supply, sewerage, solid waste management, and storm water drains account for 26 per cent (Rs 8 lakh crore) of the total investment requirement. The estimates indicate a higher investment requirement for water than sewerage, because provision has been made for upgradation of the distribution network for continuous water supply (Rs 88,000 crore) and metering of water connections (Rs 21,500 crore). The estimation for water requirements also includes an investment requirement of Rs 30,000 crore for industrial water.7
3.3.2 Urban roads constitute the highest share of urban infrastructure investment, i.e. 56 per cent of the total. It is worth noting that local and sub-local roads are included in the definition of roads for this exercise. In the Eleventh Five Year Plan and in many other estimates for roads that are normally presented, only collector roads and major roads are included in the definition, and local roads and sub-local roads are excluded. Investment in urban transport and traffic support infrastructure accounts for 17.7 per cent of the total infrastructure investment of Rs 31 lakh crore (Chart 3.1).
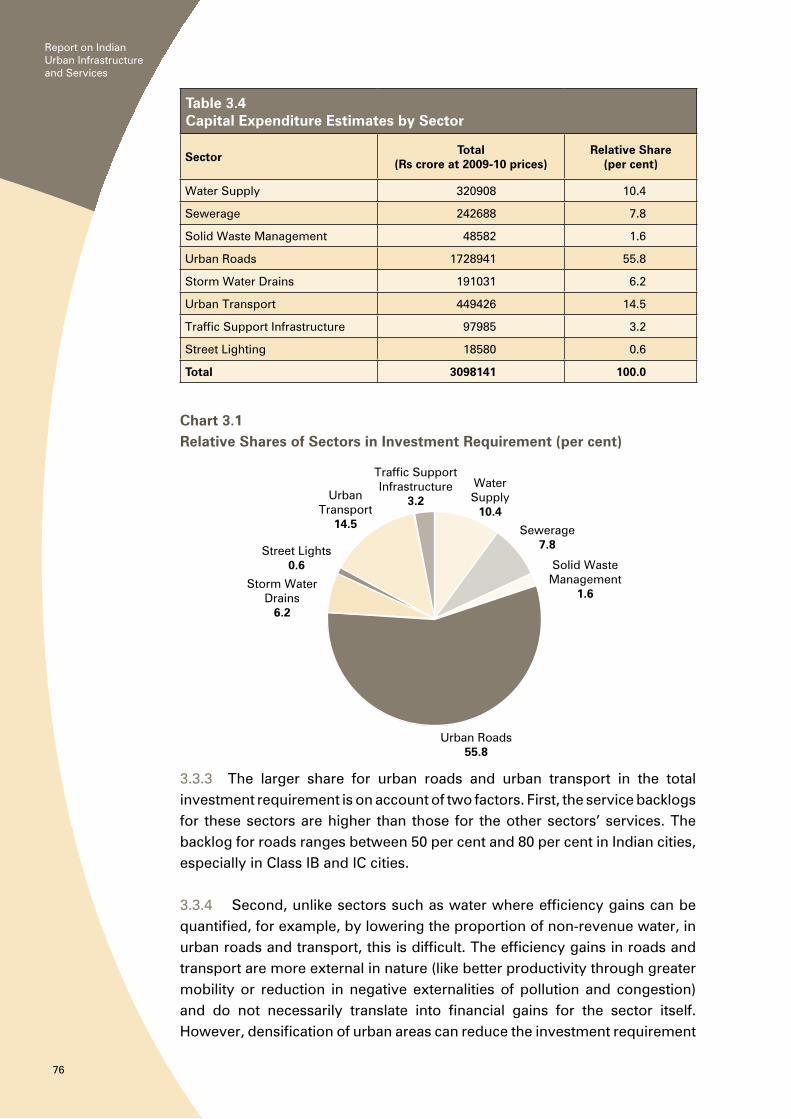
76
Report 2009-2010
76
Report on Indian Urban Infrastructure and Services
Table 3.4Capital Expenditure Estimates by Sector
SectorTotal
(Rs crore at 2009-10 prices)Relative Share
(per cent)
Water Supply 320908 10.4
Sewerage 242688 7.8
Solid Waste Management 48582 1.6
Urban Roads 1728941 55.8
Storm Water Drains 191031 6.2
Urban Transport 449426 14.5
Traffic Support Infrastructure 97985 3.2
Street Lighting 18580 0.6
Total 3098141 100.0
Water Supply
10.4
Sewerage 7.8
Solid Waste Management
1.6
Urban Roads 55.8
Storm Water Drains
6.2
Street Lights 0.6
Urban Transport
14.5
Traffic Support Infrastructure
3.2
Chart 3.1 Relative Shares of Sectors in Investment Requirement (per cent)
3.3.3 The larger share for urban roads and urban transport in the total investment requirement is on account of two factors. First, the service backlogs for these sectors are higher than those for the other sectors’ services. The backlog for roads ranges between 50 per cent and 80 per cent in Indian cities, especially in Class IB and IC cities.
3.3.4 Second, unlike sectors such as water where efficiency gains can be quantified, for example, by lowering the proportion of non-revenue water, in urban roads and transport, this is difficult. The efficiency gains in roads and transport are more external in nature (like better productivity through greater mobility or reduction in negative externalities of pollution and congestion) and do not necessarily translate into financial gains for the sector itself. However, densification of urban areas can reduce the investment requirement
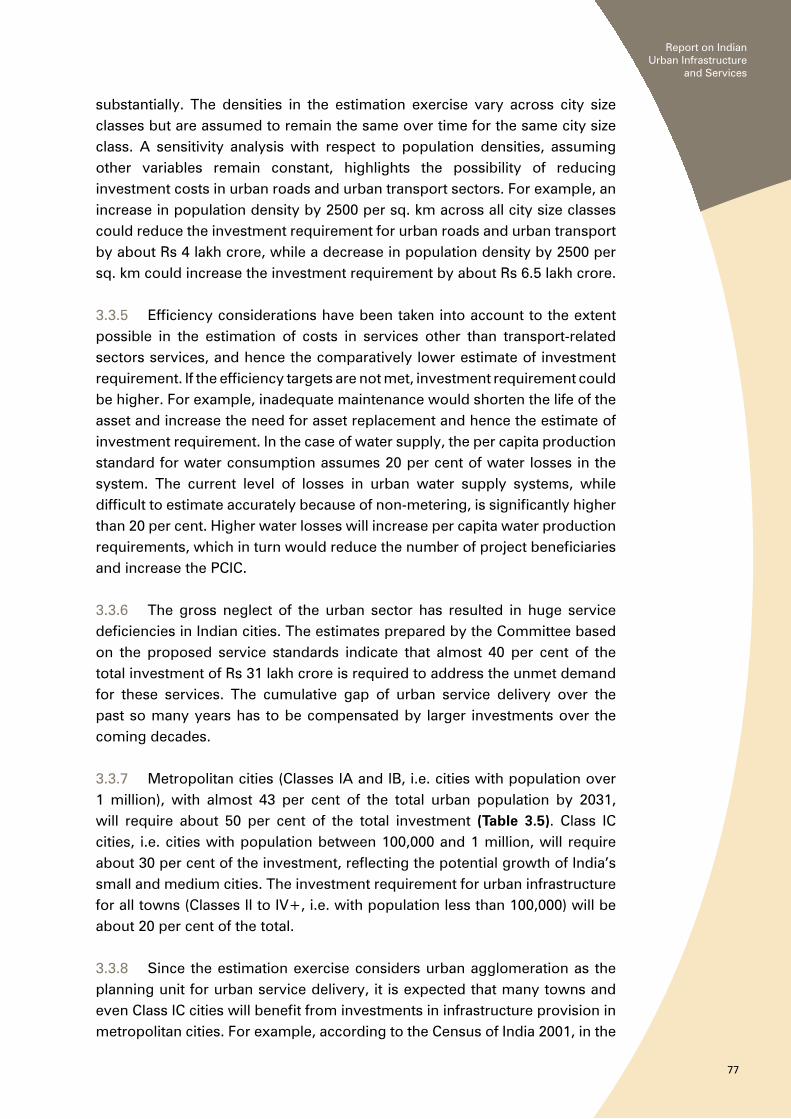
77
Report 2009-2010
77
Report on Indian Urban Infrastructure
and Services
substantially. The densities in the estimation exercise vary across city size classes but are assumed to remain the same over time for the same city size class. A sensitivity analysis with respect to population densities, assuming other variables remain constant, highlights the possibility of reducing investment costs in urban roads and urban transport sectors. For example, an increase in population density by 2500 per sq. km across all city size classes could reduce the investment requirement for urban roads and urban transport by about Rs 4 lakh crore, while a decrease in population density by 2500 per sq. km could increase the investment requirement by about Rs 6.5 lakh crore.
3.3.5 Efficiency considerations have been taken into account to the extent possible in the estimation of costs in services other than transport-related sectors services, and hence the comparatively lower estimate of investment requirement. If the efficiency targets are not met, investment requirement could be higher. For example, inadequate maintenance would shorten the life of the asset and increase the need for asset replacement and hence the estimate of investment requirement. In the case of water supply, the per capita production standard for water consumption assumes 20 per cent of water losses in the system. The current level of losses in urban water supply systems, while difficult to estimate accurately because of non-metering, is significantly higher than 20 per cent. Higher water losses will increase per capita water production requirements, which in turn would reduce the number of project beneficiaries and increase the PCIC.
3.3.6 The gross neglect of the urban sector has resulted in huge service deficiencies in Indian cities. The estimates prepared by the Committee based on the proposed service standards indicate that almost 40 per cent of the total investment of Rs 31 lakh crore is required to address the unmet demand for these services. The cumulative gap of urban service delivery over the past so many years has to be compensated by larger investments over the coming decades.
3.3.7 Metropolitan cities (Classes IA and IB, i.e. cities with population over 1 million), with almost 43 per cent of the total urban population by 2031, will require about 50 per cent of the total investment (Table 3.5). Class IC cities, i.e. cities with population between 100,000 and 1 million, will require about 30 per cent of the investment, reflecting the potential growth of India’s small and medium cities. The investment requirement for urban infrastructure for all towns (Classes II to IV+, i.e. with population less than 100,000) will be about 20 per cent of the total.
3.3.8 Since the estimation exercise considers urban agglomeration as the planning unit for urban service delivery, it is expected that many towns and even Class IC cities will benefit from investments in infrastructure provision in metropolitan cities. For example, according to the Census of India 2001, in the
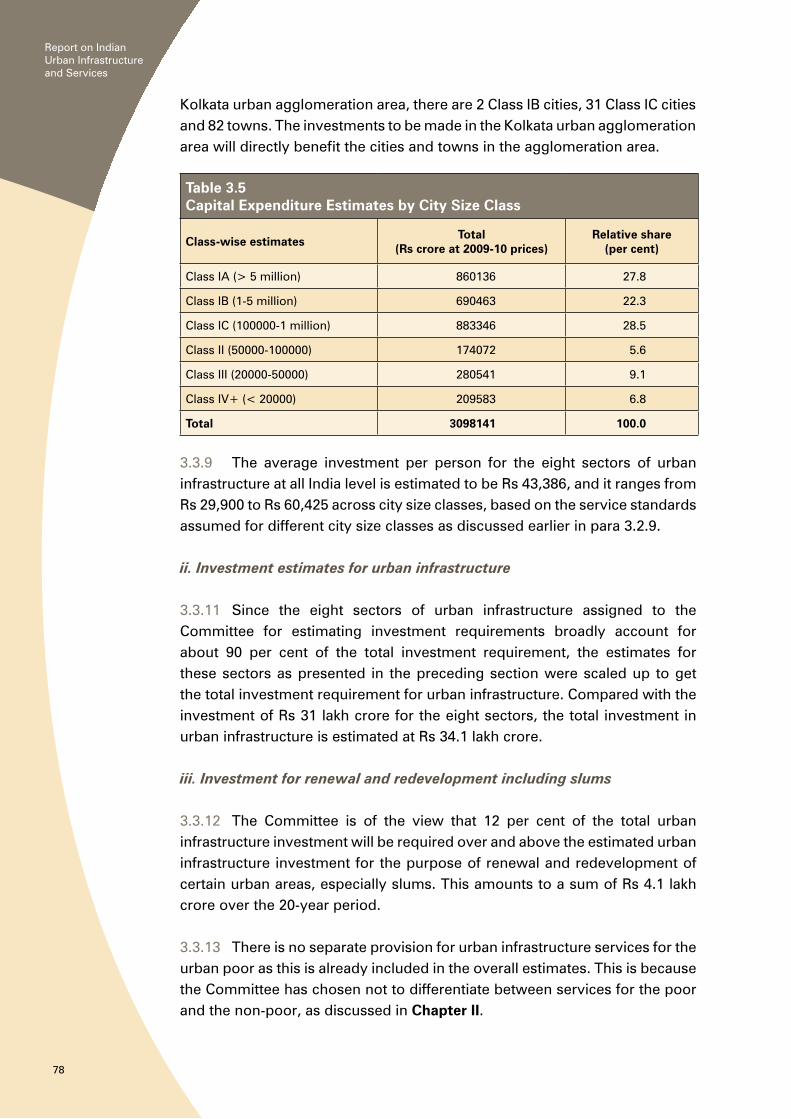
78
Report 2009-2010
78
Report on Indian Urban Infrastructure and Services
Kolkata urban agglomeration area, there are 2 Class IB cities, 31 Class IC cities and 82 towns. The investments to be made in the Kolkata urban agglomeration area will directly benefit the cities and towns in the agglomeration area.
Table 3.5Capital Expenditure Estimates by City Size Class
Class-wise estimatesTotal
(Rs crore at 2009-10 prices)Relative share
(per cent)
Class IA (> 5 million) 860136 27.8
Class IB (1-5 million) 690463 22.3
Class IC (100000-1 million) 883346 28.5
Class II (50000-100000) 174072 5.6
Class III (20000-50000) 280541 9.1
Class IV+ (< 20000) 209583 6.8
Total 3098141 100.0
3.3.9 The average investment per person for the eight sectors of urban infrastructure at all India level is estimated to be Rs 43,386, and it ranges from Rs 29,900 to Rs 60,425 across city size classes, based on the service standards assumed for different city size classes as discussed earlier in para 3.2.9.
ii. Investment estimates for urban infrastructure
3.3.11 Since the eight sectors of urban infrastructure assigned to the Committee for estimating investment requirements broadly account for about 90 per cent of the total investment requirement, the estimates for these sectors as presented in the preceding section were scaled up to get the total investment requirement for urban infrastructure. Compared with the investment of Rs 31 lakh crore for the eight sectors, the total investment in urban infrastructure is estimated at Rs 34.1 lakh crore.
iii. Investment for renewal and redevelopment including slums
3.3.12 The Committee is of the view that 12 per cent of the total urban infrastructure investment will be required over and above the estimated urban infrastructure investment for the purpose of renewal and redevelopment of certain urban areas, especially slums. This amounts to a sum of Rs 4.1 lakh crore over the 20-year period.
3.3.13 There is no separate provision for urban infrastructure services for the urban poor as this is already included in the overall estimates. This is because the Committee has chosen not to differentiate between services for the poor and the non-poor, as discussed in Chapter II.
79
Report 2009-2010
79
Report on Indian Urban Infrastructure
and Services
3.3.14 The Ministry of Housing and Urban Poverty Alleviation in its presentation to the National Development Council in 2008 highlighted the need for about Rs 9.7 lakh crore for low income housing and local infrastructure provision for the urban poor. Of this, Rs 3.2 lakh crore, i.e. one-third, was to be allocated towards local infrastructure provision. However, this was based on lower service standards than those prescribed by the Ministry of Urban Development in its Handbook of Service Level Benchmarking (2008). The Committee has not opted for lower service standards for low income households.
3.3.15 Given the total investment estimate of Rs 34.1 lakh crore for urban infrastructure and considering that 25 per cent of the urban population lives in slums, this yields Rs 8.5 lakh crore for slum population, assuming universal standards for all as well as universal provision for access and mobility. Since the majority of the urban poor live in Class I cities which require comparatively higher investments, the investment share targeted towards the urban poor may even be higher than Rs 8.5 lakh crore. The Committee has allocated a further sum of Rs 4.1 lakh crore towards renewal and redevelopment activities including redevelopment of slums. The Committee is of the view that the proposed levels of investment for the urban poor are critical for building inclusive cities.
iv. Investment for capacity building
3.3.16 For the infrastructure to be put in place, urban local bodies (ULBs) must have sufficient skill sets to design, develop, and manage the projects and the assets being created. The JNNURM allocated 5 per cent of project funding for capacity building, but little demand has come forth from ULBs. The South African Municipal Infrastructure Programme, an ambitious mission to ensure a basic level of urban services for all citizens, has earmarked 5 per cent of their project funds for training of contractors and workers for building local governments’ technical and managerial capacity. The Committee is aware of the relatively limited absorptive capacity for training and strengthening institutions in India. Considering that the NIJNNURM is two and half times as large as the JNNURM, the Committee is of the view that 2.5 per cent of the total capital requirement should be directed at building capacity to strengthen institutions and human resource capability in areas such as urban planning, regulation of land use, project preparation, implementation and management, finance and accounts, legal and administrative skills, regulatory aspects of urban management, etc. Of this, about half should come from NIJNNURM and the other half from state governments, ULBs, and the private sector. The Committee hopes that the gap year of 2011-12 will be used fully to start the process of building capacity at an accelerated pace. This should help in making more ULBs reform-ready before the Mission really takes off in 2012-13.
80
Report 2009-2010
80
Report on Indian Urban Infrastructure and Services
3.4 Annual investment projections
3.4.1 The investment requirement for all urban infrastructure sectors, renewal and redevelopment including slums, and capacity building as derived from the estimation exercise for the 20-year period from 2012-13 to 2031-32 is estimated at Rs 39.2 lakh crore.
3.4.2 The estimate of urban infrastructure investment in the base year 2011-12 is prepared using the available information from ULBs, Urban Development Authorities, and a number of major parastatals. An important point to note is that a significant part of investment expenditure in urban infrastructure at present is undertaken outside of the ULBs. Urban expenditure as provided by the Thirteenth Central Finance Commission (CFC) is limited to municipal expenditure and does not include the expenditure incurred by parastatals/state departments and authorities like Urban/Metropolitan Development Authorities, Water supply and Sewerage Boards, State Public Health Departments, Metro Transport/Transit Authorities, etc.8 The Thirteenth CFC data on capital expenditure in cities is therefore a gross underestimate of the actual capital spending in the urban sector, not to speak of the normative spending which should be much higher.
3.4.3 The latest data on ULB expenditure was taken from the Thirteenth CFC, and it relates to 2007-08. Discussions with officials, parastatal agencies, and representatives of multilateral institutions contributed to the preparation of the estimated/projected capital spending in urban infrastructure for the base year 2011-12. For example, information was procured from Hyderabad Metropolitan Water Supply & Sewerage Board (HMWSSB), Chennai Water & Sewerage Board, Delhi Jal Board, Mumbai Metropolitan Regional Development Authority, Haryana Development Authority, Jaipur Development Authority, Hyderabad Metropolitan Development Authority, etc. The Committee has come to the conclusion, based on this information, that capital expenditure of parastatals on the urban sector exceeds that of ULBs by a wide margin. The total urban capital expenditure for 2011-12 is estimated at Rs 51,000 crore.
3.4.4 The total investment requirement of Rs 39.2 lakh crore is spread over the 20-year period. The total, consisting of investment in urban infrastructure, renewal and redevelopment including slums, and capacity building, at 2009-10 prices, is projected to increase at 15 per cent per annum during the Twelfth Plan period (2012-13 to 2016-17), 12 per cent per annum during the Thirteenth Plan period (2017-18 to 2021-22), and 8 per cent per annum during the Fourteenth and Fifteenth Plan periods (2022-23 to 2031-32), respectively.
8 For example, in Mumbai, water supply is provided by the Municipal Corporation, while in Hyderabad, Chennai, Bangalore, and Delhi, water is delivered by parastatals. In many states, Public Health Departments undertake capital projects for water supply, sewerage, and drainage. These are executed from state budgets and handed over to the ULBs subsequently for maintenance. Much of the transport-related spending is also outside of the ULBs.
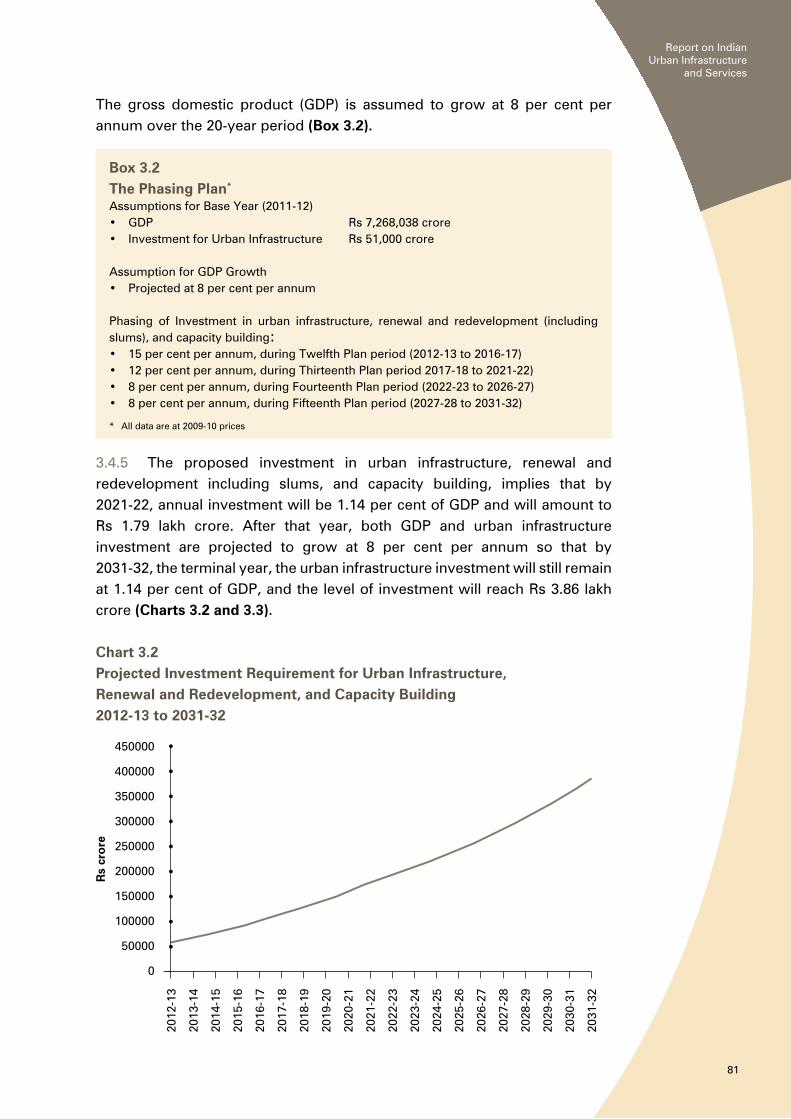
81
Report 2009-2010
81
Report on Indian Urban Infrastructure
and Services
The gross domestic product (GDP) is assumed to grow at 8 per cent per annum over the 20-year period (Box 3.2).
Box 3.2The Phasing Plan*
Assumptions for Base Year (2011-12) GDP Rs 7,268,038 crore • Investment for Urban Infrastructure Rs 51,000 crore •
Assumption for GDP Growth Projected at 8 per cent per annum•
Phasing of Investment in urban infrastructure, renewal and redevelopment (including slums), and capacity building:
15 per cent per annum, during Twelfth Plan period (2012-13 to 2016-17)• 12 per cent per annum, during Thirteenth Plan period 2017-18 to 2021-22)• 8 per cent per annum, during Fourteenth Plan period (2022-23 to 2026-27)• 8 per cent per annum, during Fifteenth Plan period (2027-28 to 2031-32)•
3.4.5 The proposed investment in urban infrastructure, renewal and redevelopment including slums, and capacity building, implies that by 2021-22, annual investment will be 1.14 per cent of GDP and will amount to Rs 1.79 lakh crore. After that year, both GDP and urban infrastructure investment are projected to grow at 8 per cent per annum so that by 2031-32, the terminal year, the urban infrastructure investment will still remain at 1.14 per cent of GDP, and the level of investment will reach Rs 3.86 lakh crore (Charts 3.2 and 3.3).
Chart 3.2 Projected Investment Requirement for Urban Infrastructure,Renewal and Redevelopment, and Capacity Building2012-13 to 2031-32
* All data are at 2009-10 prices
Rs
cro
re
450000
400000
350000
300000
250000
200000
150000
100000
50000
0
2012
-13
2013
-14
2014
-15
2015
-16
2016
-17
2017
-18
2018
-19
2019
-20
2020
-21
2021
-22
2022
-23
2023
-24
2024
-25
2025
-26
2026
-27
2027
-28
2028
-29
2029
-30
2030
-31
2031
-32
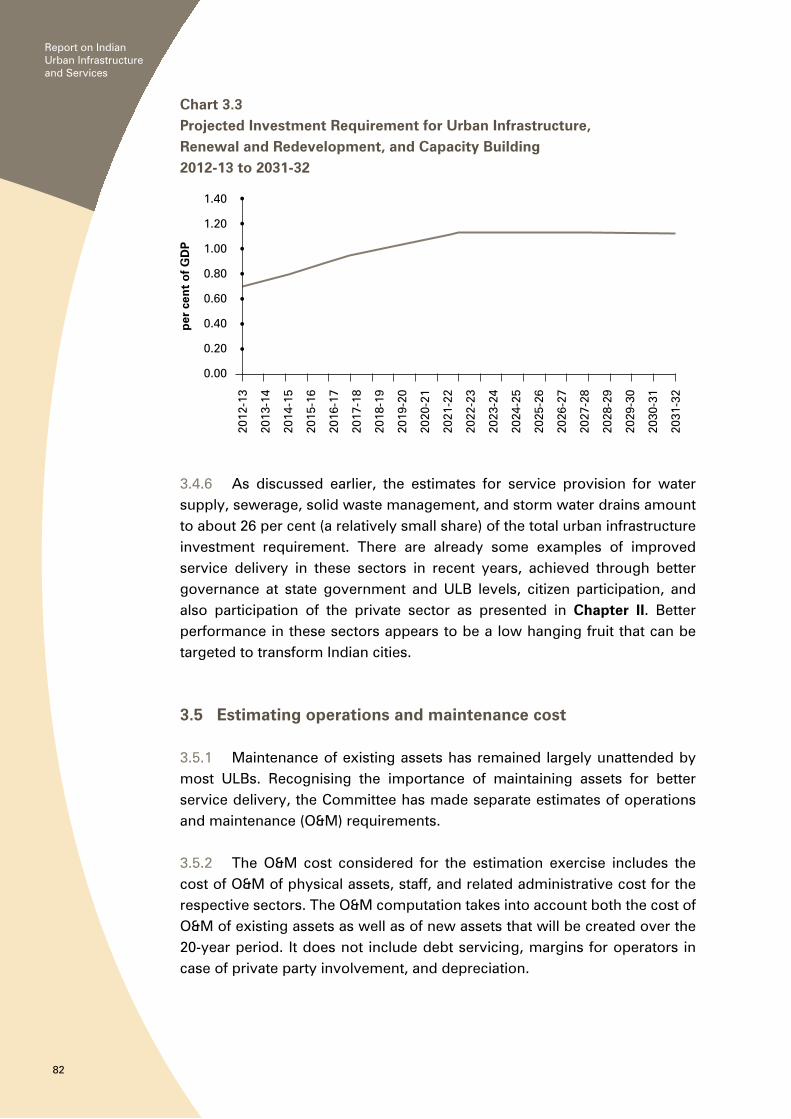
82
Report 2009-2010
82
Report on Indian Urban Infrastructure and Services
Chart 3.3Projected Investment Requirement for Urban Infrastructure,Renewal and Redevelopment, and Capacity Building2012-13 to 2031-32
per
cen
t o
f G
DP
1.40
1.20
1.00
0.80
0.60
0.40
0.20
0.00
2012
-13
2013
-14
2014
-15
2015
-16
2016
-17
2017
-18
2018
-19
2019
-20
2020
-21
2021
-22
2022
-23
2023
-24
2024
-25
2025
-26
2026
-27
2027
-28
2028
-29
2029
-30
2030
-31
2031
-32
3.4.6 As discussed earlier, the estimates for service provision for water supply, sewerage, solid waste management, and storm water drains amount to about 26 per cent (a relatively small share) of the total urban infrastructure investment requirement. There are already some examples of improved service delivery in these sectors in recent years, achieved through better governance at state government and ULB levels, citizen participation, and also participation of the private sector as presented in Chapter II. Better performance in these sectors appears to be a low hanging fruit that can be targeted to transform Indian cities.
3.5 Estimating operations and maintenance cost
3.5.1 Maintenance of existing assets has remained largely unattended by most ULBs. Recognising the importance of maintaining assets for better service delivery, the Committee has made separate estimates of operations and maintenance (O&M) requirements.
3.5.2 The O&M cost considered for the estimation exercise includes the cost of O&M of physical assets, staff, and related administrative cost for the respective sectors. The O&M computation takes into account both the cost of O&M of existing assets as well as of new assets that will be created over the 20-year period. It does not include debt servicing, margins for operators in case of private party involvement, and depreciation.
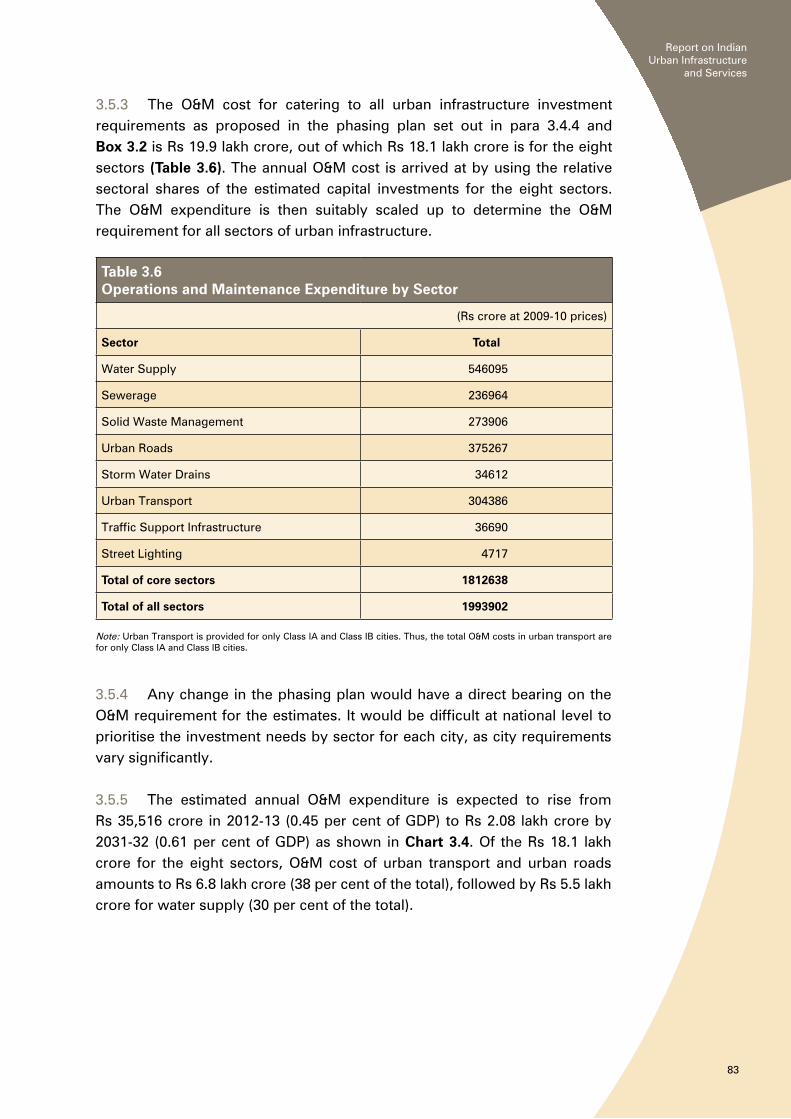
83
Report 2009-2010
83
Report on Indian Urban Infrastructure
and Services
3.5.3 The O&M cost for catering to all urban infrastructure investment requirements as proposed in the phasing plan set out in para 3.4.4 and Box 3.2 is Rs 19.9 lakh crore, out of which Rs 18.1 lakh crore is for the eight sectors (Table 3.6). The annual O&M cost is arrived at by using the relative sectoral shares of the estimated capital investments for the eight sectors. The O&M expenditure is then suitably scaled up to determine the O&M requirement for all sectors of urban infrastructure.
Table 3.6Operations and Maintenance Expenditure by Sector
(Rs crore at 2009-10 prices)
Sector Total
Water Supply 546095
Sewerage 236964
Solid Waste Management 273906
Urban Roads 375267
Storm Water Drains 34612
Urban Transport 304386
Traffic Support Infrastructure 36690
Street Lighting 4717
Total of core sectors 1812638
Total of all sectors 1993902
Note: Urban Transport is provided for only Class IA and Class IB cities. Thus, the total O&M costs in urban transport are for only Class IA and Class IB cities.
3.5.4 Any change in the phasing plan would have a direct bearing on the O&M requirement for the estimates. It would be difficult at national level to prioritise the investment needs by sector for each city, as city requirements vary significantly.
3.5.5 The estimated annual O&M expenditure is expected to rise from Rs 35,516 crore in 2012-13 (0.45 per cent of GDP) to Rs 2.08 lakh crore by 2031-32 (0.61 per cent of GDP) as shown in Chart 3.4. Of the Rs 18.1 lakh crore for the eight sectors, O&M cost of urban transport and urban roads amounts to Rs 6.8 lakh crore (38 per cent of the total), followed by Rs 5.5 lakh crore for water supply (30 per cent of the total).
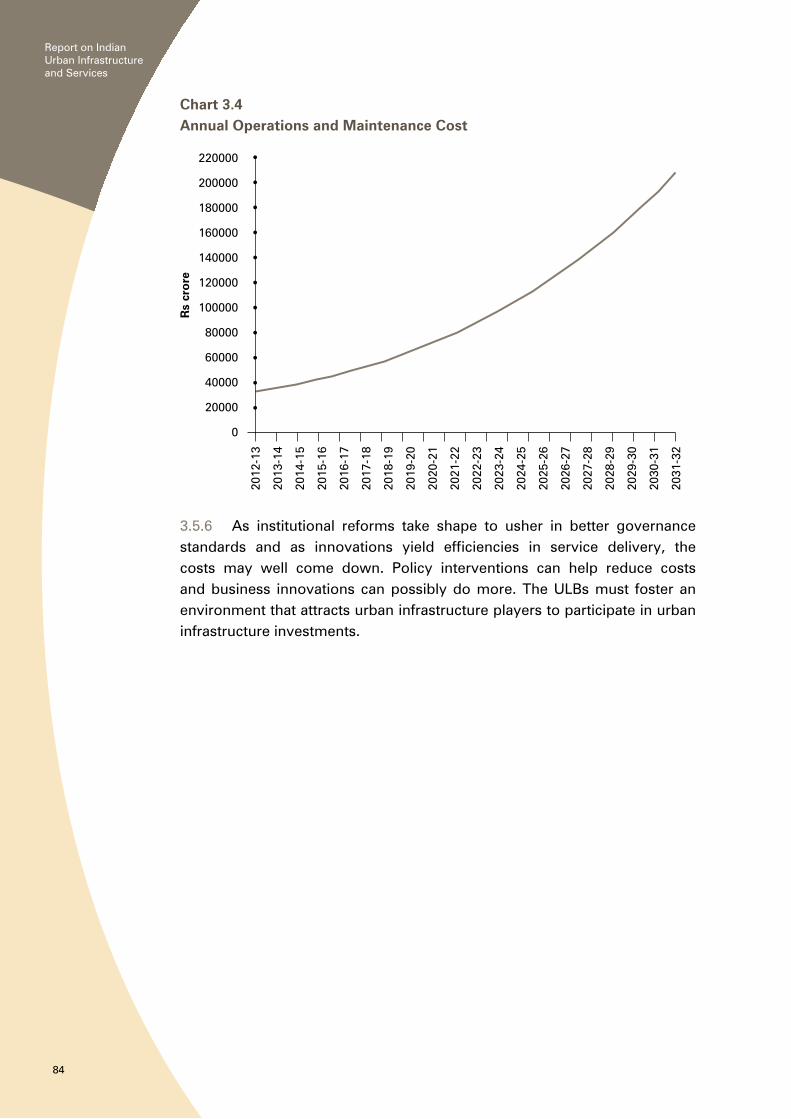
84
Report 2009-2010
84
Report on Indian Urban Infrastructure and Services
Chart 3.4 Annual Operations and Maintenance Cost
Rs
cro
re
220000
200000
180000
160000
140000
120000
100000
80000
60000
40000
20000
0
2012
-13
2013
-14
2014
-15
2015
-16
2016
-17
2017
-18
2018
-19
2019
-20
2020
-21
2021
-22
2022
-23
2023
-24
2024
-25
2025
-26
2026
-27
2027
-28
2028
-29
2029
-30
2030
-31
2031
-32
3.5.6 As institutional reforms take shape to usher in better governance standards and as innovations yield efficiencies in service delivery, the costs may well come down. Policy interventions can help reduce costs and business innovations can possibly do more. The ULBs must foster an environment that attracts urban infrastructure players to participate in urban infrastructure investments.
Chapter IVChallenges ofUrban Governance

87
Report 2009-2010
87
Report on Indian Urban Infrastructure
and Services
4.1 Introduction
4.1.1 Our ability to build the cities of tomorrow will require not only large investments in urban infrastructure but also a fundamental shift in the mechanisms of service delivery. Indeed, financing the large sums required to meet the investment needs of urban infrastructure is crucially dependent on the reform of institutions and on upgrading the skills of those who run the institutions which are responsible for service delivery and revenue generation. Residents of Indian cities have over decades accepted the poor and deteriorating quality of urban services without much protest. There is evidence to suggest that this is beginning to change especially over the past few years with rapid economic growth, rising aspirations, and increased demand for accountability.
4.1.2 Indian cities today are larger, with more diverse population, and are growing rapidly.1 They require technical skills to manage the delivery of urban services as well as provide a socio-economic environment in which the industry and services sectors can become globally competitive. Larger expenditures have to be combined with better governance structures, strong political and administrative will to collect taxes and user charges, and improved capacity to deliver. Cities must be empowered, financially strengthened, and efficiently governed to respond to the needs of their citizens.
4.1.3 State governments, which have the principal constitutional responsibility for urban development, have been severely deficient in building and maintaining urban infrastructure assets for service delivery, providing access to affordable housing for the poor, and improving conditions in the slums. They have also not empowered urban local bodies (ULB) to meet these challenges. The situation has not improved substantially after the 74th Constitutional Amendment Act of 1992, which formally recognised ULBs as the third tier of government, but only ‛recommended’ that state governments assign them a set of 18 functions under the Twelfth Schedule. The Amendment is even less clear on the devolution of finances to meet the revenue needs of ULBs for fulfilling these functions, leaving it to the discretion of state legislatures. State governments have only partially complied with devolution, and this has typically not been accompanied by the devolution of funds and functionaries.
4.1.4 Since ULBs have only limited powers to levy taxes and duties (and have not used even these effectively), and several of these taxes are not very elastic or buoyant, vertical imbalance is structurally built into their fiscal operations. Also, since their borrowing ability is constrained by their weak 1 The Committee recognises the different institutional realities of Municipal Corporations (Nagar Nigams),
Municipalities (Nagar Palikas) and Nagar Panchayats, and attempts to address the challenges of governance in the context of the differentiated institutional structure of the third tier.
88
Report 2009-2010
88
Report on Indian Urban Infrastructure and Services
financial position, they have to depend on resources from the Government of India and state governments to perform the tasks assigned to them by the Constitution and state legislatures. This chapter makes recommendations on urban governance including those relating to the interaction between different tiers of government.
4.2 Basic rules for local governance
4.2.1 A well-functioning local governance framework must satisfy the following basic prerequisites: (i) local governments should have functional autonomy, i.e. functions of local governments vis-à-vis state governments, and their entities must be unambiguous (ii) they should have financial autonomy and be required to be financially viable, i.e. local finances, including own revenue and inter-governmental transfers, must match local requirements and should be accompanied by the necessary autonomy to expend these resources; (iii) local functionaries must be competent to discharge the local functions effectively, i.e. an ongoing process of training and dissemination of knowledge must be built into the system of governance, (iv) functional outcomes, including authority for approving and disbursing moneys for approved projects, must match the finances allotted within a framework of transparency, accountability, and community participation; and (v) social accountability must be ensured.
4.2.2 The Committee recommends activity mapping for all the 18 functions listed in the Twelfth Schedule (Box 4.1), i.e. those that can be taken up by the ULBs themselves, those that need to be shared with state governments, and those that need to be performed concurrently by ULBs, state governments and the Government of India, e.g. planning for economic and social development and protection of the environment. The Ministry of Urban Development and Ministry of Housing and Urban Poverty Alleviation of the Government of India should facilitate this exercise. In the case of functions such as urban planning, regulation of land use, and socio-economic planning, the devolution to ULBs must be within a common framework laid out by the state government. The functions to be performed concurrently must be financed by sharing resources between the Government of India, state governments and ULBs. The ‛agency’ functions executed by ULBs on grounds of efficiency and proximity to clients must be funded by the Government of India and state governments.
4.2.3 A number of important redistributive functions like safeguarding the interests of weaker sections, slum improvement and upgradation, and urban poverty alleviation have been assigned to ULBs after the 74th Constitutional Amendment Act 1992. ULBs have neither the finances nor the capacity to discharge these responsibilities. The Committee believes that the Government of India and state governments must help finance these
89
Report 2009-2010
89
Report on Indian Urban Infrastructure
and Services
Box 4.1Functions under the 12th Schedule (Article 243W), 74th Constitutional Amendment Act 1992
Urban planning including town planning1. Regulation of land use and construction of buildings2. Planning for economic and social development3. Roads and bridges4. Water supply for domestic, industrial, and commercial purposes5. Public health, sanitation conservancy, and solid waste management6. Fire services7. Urban forestry, protection of the environment, and promotion of ecological aspects8. Safeguarding the interests of weaker sections of society, including the handicapped 9. and mentally retardedSlum improvement and upgradation10. Urban poverty alleviation11. Provision of urban amenities and facilities such as parks, gardens, playgrounds12. Promotion of cultural, educational, and aesthetic aspects13. Burials and burial grounds; cremations, cremation grounds, and electric 14. crematoriumsCattle pounds, and prevention of cruelty to animals15. Vital statistics including registration of births and deaths16. Public amenities including street lighting, parking lots, bus stops, and 17. public conveniencesRegulation of slaughter houses and tanneries18.
functions and make concerted efforts to help ULBs improve their competencies to discharge them.
4.2.4 The Committee believes that in view of the importance of urban infrastructure for economic growth and inclusion, the Government of India and state governments will have to step in, both by providing substantial funds and by facilitating the use of additional mechanisms for funding, which will require the strengthening of own finances of ULBs. The latter, in turn, requires reforms in governance at all levels.
4.3 Institutional framework for urban governance
4.3.1 The institutional framework for urban governance in India needs a major overhaul if cities are to play a dynamic role in the next phase of India’s development. The present institutional structure is politically weak and administratively cumbersome. Chart 4.1 provides an illustrative example of Bangalore. A radical change is needed if cities are to provide a socio-economic environment that will be inclusive, contribute to better quality of life, and sustain rapid growth.
4.3.2 The executive head of the city will need to be empowered to run an efficient system of delivering urban services in a manner which harnesses agglomeration economies, minimises congestion diseconomies, and creates
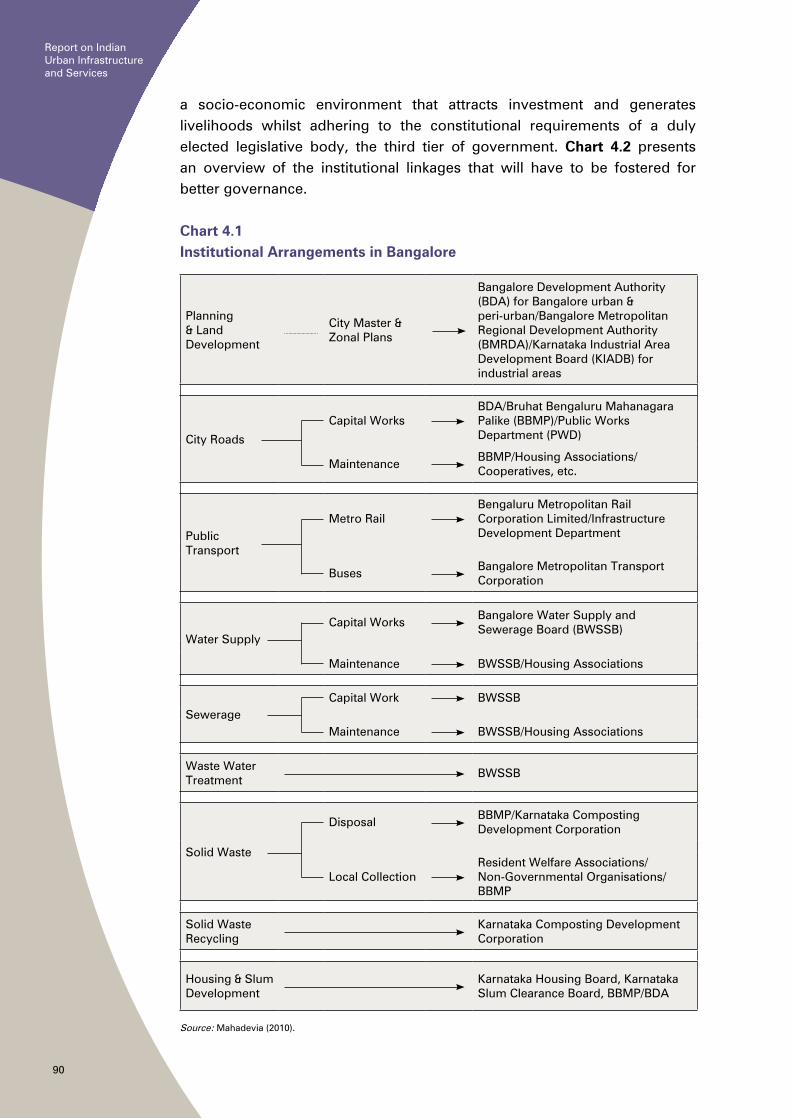
90
Report 2009-2010
90
Report on Indian Urban Infrastructure and Services
Source: Mahadevia (2010).
Planning & Land Development
City Master & Zonal Plans
Bangalore Development Authority (BDA) for Bangalore urban & peri-urban/Bangalore Metropolitan Regional Development Authority (BMRDA)/Karnataka Industrial Area Development Board (KIADB) for industrial areas
City RoadsCapital Works
BDA/Bruhat Bengaluru Mahanagara Palike (BBMP)/Public Works Department (PWD)
Maintenance BBMP/Housing Associations/Cooperatives, etc.
Public Transport
Metro RailBengaluru Metropolitan Rail Corporation Limited/Infrastructure Development Department
Buses Bangalore Metropolitan Transport Corporation
Water SupplyCapital Works Bangalore Water Supply and
Sewerage Board (BWSSB)
Maintenance BWSSB/Housing Associations
SewerageCapital Work BWSSB
Maintenance BWSSB/Housing Associations
Waste Water Treatment BWSSB
Solid Waste
Disposal BBMP/Karnataka Composting Development Corporation
Local CollectionResident Welfare Associations/ Non-Governmental Organisations/BBMP
Solid Waste Recycling
Karnataka Composting Development Corporation
Housing & Slum Development
Karnataka Housing Board, Karnataka Slum Clearance Board, BBMP/BDA
a socio-economic environment that attracts investment and generates livelihoods whilst adhering to the constitutional requirements of a duly elected legislative body, the third tier of government. Chart 4.2 presents an overview of the institutional linkages that will have to be fostered for better governance.
Chart 4.1Institutional Arrangements in Bangalore
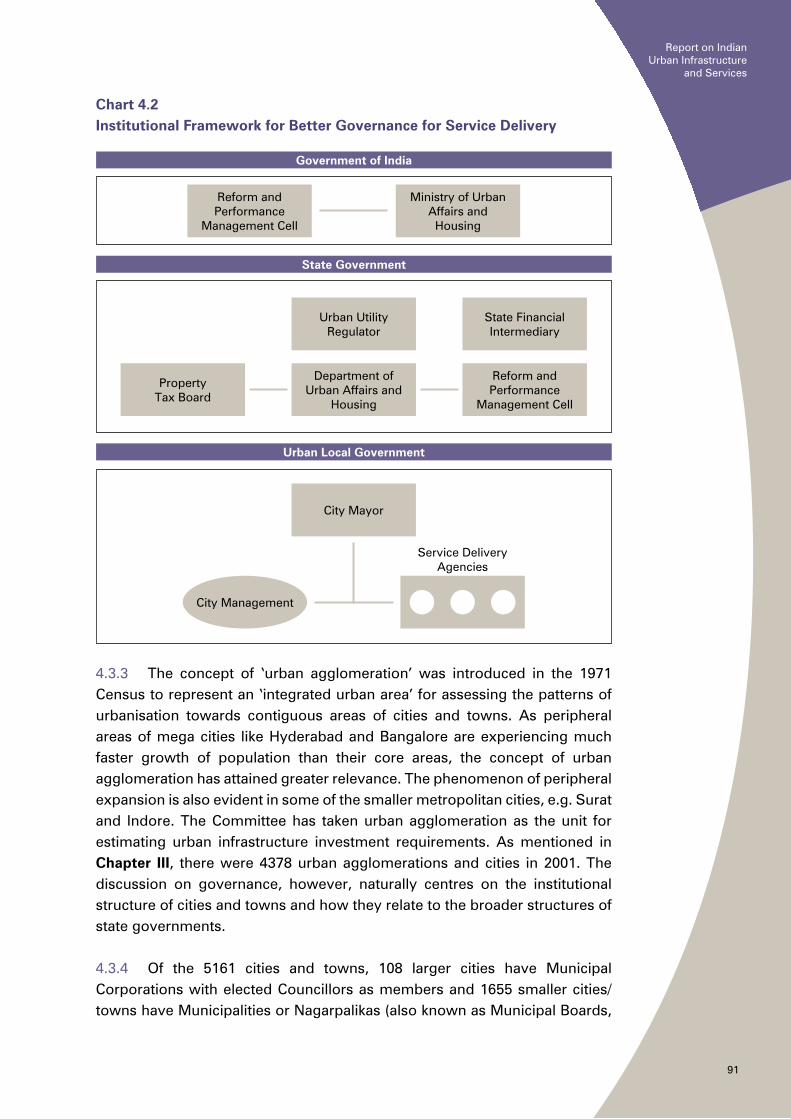
91
Report 2009-2010
91
Report on Indian Urban Infrastructure
and Services
Chart 4.2Institutional Framework for Better Governance for Service Delivery
Government of India
Reform and Performance
Management Cell
Ministry of Urban Affairs and
Housing
State Government
Department of Urban Affairs and
Housing
State Financial Intermediary
Urban Utility Regulator
Reform and Performance
Management Cell
PropertyTax Board
Urban Local Government
City Management
City Mayor
Service Delivery Agencies
4.3.3 The concept of ‛urban agglomeration’ was introduced in the 1971 Census to represent an ‛integrated urban area’ for assessing the patterns of urbanisation towards contiguous areas of cities and towns. As peripheral areas of mega cities like Hyderabad and Bangalore are experiencing much faster growth of population than their core areas, the concept of urban agglomeration has attained greater relevance. The phenomenon of peripheral expansion is also evident in some of the smaller metropolitan cities, e.g. Surat and Indore. The Committee has taken urban agglomeration as the unit for estimating urban infrastructure investment requirements. As mentioned in Chapter III, there were 4378 urban agglomerations and cities in 2001. The discussion on governance, however, naturally centres on the institutional structure of cities and towns and how they relate to the broader structures of state governments.
4.3.4 Of the 5161 cities and towns, 108 larger cities have Municipal Corporations with elected Councillors as members and 1655 smaller cities/towns have Municipalities or Nagarpalikas (also known as Municipal Boards,
92
Report 2009-2010
92
Report on Indian Urban Infrastructure and Services
Municipal Councils, or Municipal Committees). The Municipal Corporations as well as Municipalities are split into Wards with elected members, usually one for each Ward. In addition, there are 1937 Nagar Panchayats (areas in transition from rural to urban) which also have elected bodies with a Chairperson, 1374 Census towns, and 87 Cantonment Boards/Industrial Notified Areas/Estate Offices (Town Directory, Census 2001).
4.4 Administrative reforms
4.4.1 The Committee believes that major administrative reforms are urgently needed for bringing about greater efficiency in the management of infrastructure assets, delivery of urban services, and improvement in conditions for the poor so that Indian cities can provide a better quality of life, generate a better environment for growth, and be inclusive.
i. Autonomy in city management
4.4.2 Implementing city level autonomy requires demonstration of leadership by state governments in sharing power with the third tier of government. The Committee strongly recommends faster devolution of functions in line with the constitutional recommendation; it urges fiscal devolution so that the mandates of ULBs do not remain unfunded. The Committee also strongly recommends building the capacity of ULBs so that they can discharge their wider responsibilities. A municipal cadre for strengthening the professional base of ULBs is very important. Lateral hiring of professionals into the municipal cadre should help in fostering professionalism.
ii. Empowered Mayors with effective devolution
4.4.3 There was a time not so long ago when urban affairs in India attracted the best and the brightest. Jawaharlal Nehru, India’s first Prime Minister was the Mayor of Allahabad during 1924-1926 and Chittaranjan Das, another prominent national leader was the Mayor of Calcutta in 1924. Much earlier, Pherozeshah Mehta was the Mayor of Bombay.2 Admittedly, this was largely because municipal politics was the only form of electoral politics in which urban educated Indians could engage under the British rule. The time has come when India’s cities once again need leaders of that calibre, leaders who invest their energies in rebuilding cities which can host India’s transition from a low income to a middle income country, and erase the rural-urban divide with bold strokes of development.
2 Pherozeshah Mehta drafted the Bombay Municipal Act of 1872 and is considered the father of Bombay Municipality. He became the Municipal commissioner of Bombay Municipality in 1873 and its President four times – 1884, 1885, 1905 and 1911.
93
Report 2009-2010
93
Report on Indian Urban Infrastructure
and Services
4.4.4 At present, the Mayor’s role in city governance is largely ceremonial. The Mayor for each city is typically elected by Councillors in an indirect election, but in six to seven states, there is direct election by the state government residents of the city. The Municipal Commissioner, who is an official deputed by the state government and accountable to the state government and not the city, is the effective executive head of the city. The Commissioner is assisted by a few additional officers on deputation from the state government or sometimes from the municipal cadre. For the rest, the ULB staff consists of a small number of skilled personnel and a large mass of unskilled workers hired locally.
4.4.5 The Committee recommends a unified command under a Mayor for each city. The alternative systems of Mayor in Council and Executive Mayor have their strengths and weaknesses, and the choice should depend on the specific conditions in each ULB. The Mayor in Council is elected by the Councillors/Corporators in the local body, and is accountable within a framework of collective responsibility.3 The Executive Mayor, on the other hand, is directly elected by the residents of a city for a specified term, e.g. five years, and acts like the CEO of a corporate body.
4.4.6 It could be argued that Executive Mayors may be more suitable for local governments which are executive agencies mandated to deliver basic urban services. However, the Executive Mayor system brings with it political challenges including situations where a Mayor directly elected by the people may represent a particular political party while the majority of the Councillors may represent another party, as happened in the case of Jaipur in elections held in November 2009. It took six months before the Standing Committee (a Committee of Councillors which acts as a Cabinet) could be formed and the administration begin to function. This problem could have been handled had there been a legal stipulation in the Municipal Act that the Mayor would exercise the powers of the Standing Committee till the latter was in position. The city of London is run by a directly elected Executive Mayor within a Parliamentary political regime, and the system has shown very good results.
4.4.7 The Committee is of the view that local conditions should determine whether cities want to adopt a Mayor in Council system or an Executive Mayor system. But the spirit of ‛single point accountability’ of the Mayor as executive head of the city must prevail, in which the elected representatives of the people are given the power and autonomy to run the city for not too short a period. Once financial devolution and financial autonomy are granted to the ULB, and the Mayor is elected either directly or by the Councillors, it is important to ensure a five-year term instead of the one or two-year term currently in place for Mayors in most ULBs of the country. 3 The Model Municipal Law prepared by the Ministry of Urban Development in 2003 had suggested the
concept of an Empowered Standing Committee that is like a part-time Mayor in Council. Clause 22 of the Municipal Law provides that the executive power of a Municipality shall be exercised by the Empowered Standing Committee.
94
Report 2009-2010
94
Report on Indian Urban Infrastructure and Services
iii. One Ministry for Urban Affairs and Housing
4.4.8 There was only one Ministry of Urban Development in the Government of India until a few years ago. For the past seven to eight years, the Government of India has been trying to address the problem of urban poverty and housing for low income groups in a separate Ministry of Housing and Urban Poverty Alleviation, while urban development is being handled by the Ministry of Urban Development. The Committee is of the view that the problem of poverty and housing for low income groups be addressed within an integrated framework of planning for urban development, which focuses on building urban infrastructure for all and ensures the delivery of urban services of the same standard, also for all, and plans for affordable housing for the poor. Brazil, for example, has a single Ministry called the Ministry of Cities.
4.4.9 The Committee strongly believes that a single Ministry of Urban Affairs and Housing of the Government of India can take an integrated view of urban development bringing in elements of land use, transport, housing, and infrastructure for the delivery of urban services. The merger of the two Ministries of the Government of India, i.e. the Ministry of Urban Development and the Ministry of Housing and Urban Poverty Alleviation is a prerequisite for taking the agenda of better urban governance forward. For example, the two parts of the Jawaharlal Nehru National Urban Renewal Mission (JNNURM) separately dealt with by the two Ministries at present should be merged into a single Mission. As a prerequisite for a successful merger of the ministries, the latter should move towards a common Urban Management Information System (UMIS), which would effectively reorient both the Ministries towards sharing information and being consistent in their interventions in cities.
4.4.10 Focusing on the urban poor separately is an inappropriate strategy. The argument that a holistic framework of urban planning and policy will dilute the focus on the urban poor is flawed. The Committee is of the view that a single Ministry will be better equipped to deal with the pace and complexity of urbanisation in the future. City plans cannot be developed in isolation of the housing, transport, and livelihood needs of low income groups, and water demands cannot be planned without making provision for the urban poor. Systems of institutional governance, community participation, and unlocking land value for urban development require holistic planning involving all strata of society.
4.4.11 Similarly, many states have three and sometimes more Departments dealing with urban, municipal, and housing matters. For example, lack of coordination between the Revenue and Urban Development Departments in states has contributed significantly to inefficient functioning of urban
95
Report 2009-2010
95
Report on Indian Urban Infrastructure
and Services
land markets.4 Unified management of urban land is crucial for effective urban planning. Tamil Nadu has separate departments dealing with housing and town planning, municipal affairs, and slums. Uttar Pradesh has separate departments for municipal affairs, urban development, housing, and town planning. In West Bengal, municipal affairs, urban development, and housing are dealt with by three separate departments. Gujarat, however, has a single umbrella for all local government-related matters with focus on lending support to elected local governments. The Committee recommends that the multiple departments managing urban affairs at state level should be integrated into a single department. Their efforts and programmes should be directed at empowering ULBs. The Committee believes that a single unified governance structure along with universal service standards will be better equipped to manage the future course of urbanisation. Such an arrangement can also facilitate proper planning and delivery of services for new migrants, especially the economically weaker sections among them.
4.4.12 In addition to bringing all urban development functions under one Ministry at central and state levels, the Committee also recommends a process of coordination between the (proposed) Ministry of Urban Affairs and Housing and the Ministry of Rural Development, both at centre and state levels, to realise the synergies of a rural-urban continuum, as outlined in Chapter I of this Report. Many rural areas are future candidates for urban centres. The Town and Country Planning Department must be revitalised to include planning for future towns.
4.4.13 If a single Ministry is not feasible, then the Committee recommends having two Ministries: the Ministry of Urban Development looking after urban planning, urban infrastructure, the JNNURM, land use, housing, and poverty alleviation, and the Ministry of Works and Estates dealing with the Land and Development Office (for Delhi), Delhi Division (dealing primarily with the Delhi Development Authority), the Central Public Works Department (CPWD), Printing and Stationary, and Estates (dealing with allotment of houses to government servants and Members of Parliament/Ministers).
iv. Convergence of institutional responsibilities
4.4.14 A common refrain when discussing the challenges of urban infrastructure development and delivery of basic public services is the problem of fragmented and/or overlapping institutional responsibilities. It is important to ensure that responsibilities converge at the office of the empowered Mayor from below (intra-departmental coordination at the ULB) and from above (coordination with the state government and Government of India). 4 Traditionally, urban land management has been a (subsidiary) revenue function managed by the Revenue
Department according to provisions of the Revenue Act.
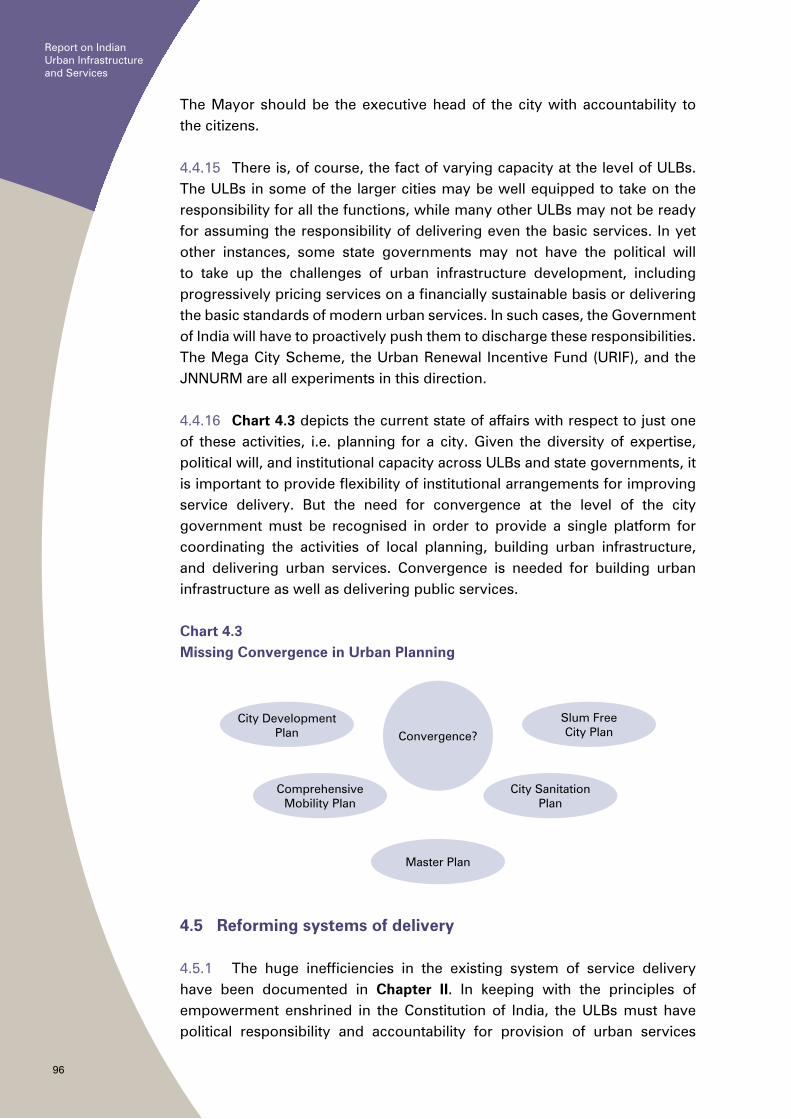
96
Report 2009-2010
96
Report on Indian Urban Infrastructure and Services
Convergence?City Development
Plan
Comprehensive Mobility Plan
Master Plan
City SanitationPlan
Slum FreeCity Plan
The Mayor should be the executive head of the city with accountability to the citizens.
4.4.15 There is, of course, the fact of varying capacity at the level of ULBs. The ULBs in some of the larger cities may be well equipped to take on the responsibility for all the functions, while many other ULBs may not be ready for assuming the responsibility of delivering even the basic services. In yet other instances, some state governments may not have the political will to take up the challenges of urban infrastructure development, including progressively pricing services on a financially sustainable basis or delivering the basic standards of modern urban services. In such cases, the Government of India will have to proactively push them to discharge these responsibilities. The Mega City Scheme, the Urban Renewal Incentive Fund (URIF), and the JNNURM are all experiments in this direction.
4.4.16 Chart 4.3 depicts the current state of affairs with respect to just one of these activities, i.e. planning for a city. Given the diversity of expertise, political will, and institutional capacity across ULBs and state governments, it is important to provide flexibility of institutional arrangements for improving service delivery. But the need for convergence at the level of the city government must be recognised in order to provide a single platform for coordinating the activities of local planning, building urban infrastructure, and delivering urban services. Convergence is needed for building urban infrastructure as well as delivering public services.
Chart 4.3Missing Convergence in Urban Planning
4.5 Reforming systems of delivery 4.5.1 The huge inefficiencies in the existing system of service delivery have been documented in Chapter II. In keeping with the principles of empowerment enshrined in the Constitution of India, the ULBs must have political responsibility and accountability for provision of urban services
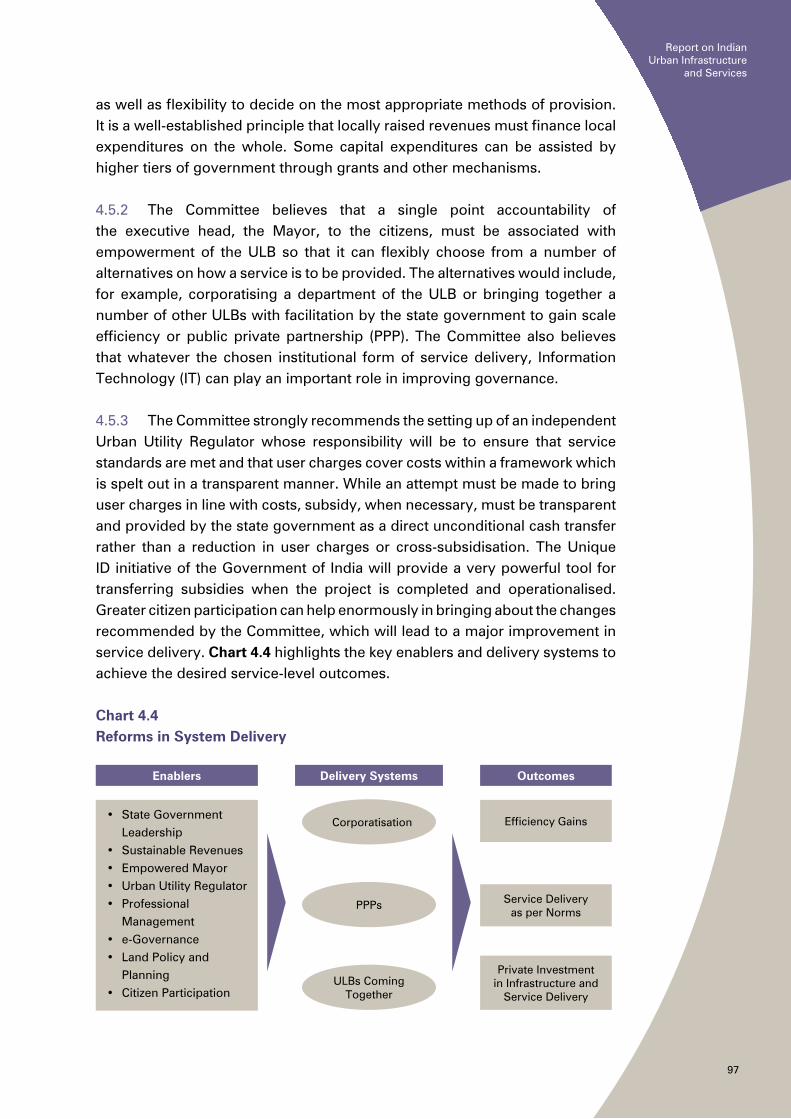
97
Report 2009-2010
97
Report on Indian Urban Infrastructure
and Services
as well as flexibility to decide on the most appropriate methods of provision. It is a well-established principle that locally raised revenues must finance local expenditures on the whole. Some capital expenditures can be assisted by higher tiers of government through grants and other mechanisms.
4.5.2 The Committee believes that a single point accountability of the executive head, the Mayor, to the citizens, must be associated with empowerment of the ULB so that it can flexibly choose from a number of alternatives on how a service is to be provided. The alternatives would include, for example, corporatising a department of the ULB or bringing together a number of other ULBs with facilitation by the state government to gain scale efficiency or public private partnership (PPP). The Committee also believes that whatever the chosen institutional form of service delivery, Information Technology (IT) can play an important role in improving governance.
4.5.3 The Committee strongly recommends the setting up of an independent Urban Utility Regulator whose responsibility will be to ensure that service standards are met and that user charges cover costs within a framework which is spelt out in a transparent manner. While an attempt must be made to bring user charges in line with costs, subsidy, when necessary, must be transparent and provided by the state government as a direct unconditional cash transfer rather than a reduction in user charges or cross-subsidisation. The Unique ID initiative of the Government of India will provide a very powerful tool for transferring subsidies when the project is completed and operationalised. Greater citizen participation can help enormously in bringing about the changes recommended by the Committee, which will lead to a major improvement in service delivery. Chart 4.4 highlights the key enablers and delivery systems to achieve the desired service-level outcomes.
Chart 4.4Reforms in System Delivery
Outcomes
Efficiency Gains
Service Delivery as per Norms
Private Investment in Infrastructure and
Service Delivery
Delivery Systems
Corporatisation
PPPs
ULBs Coming Together
Enablers
• State Government Leadership
• Sustainable Revenues• Empowered Mayor • Urban Utility Regulator• Professional
Management• e-Governance • Land Policy and
Planning • Citizen Participation
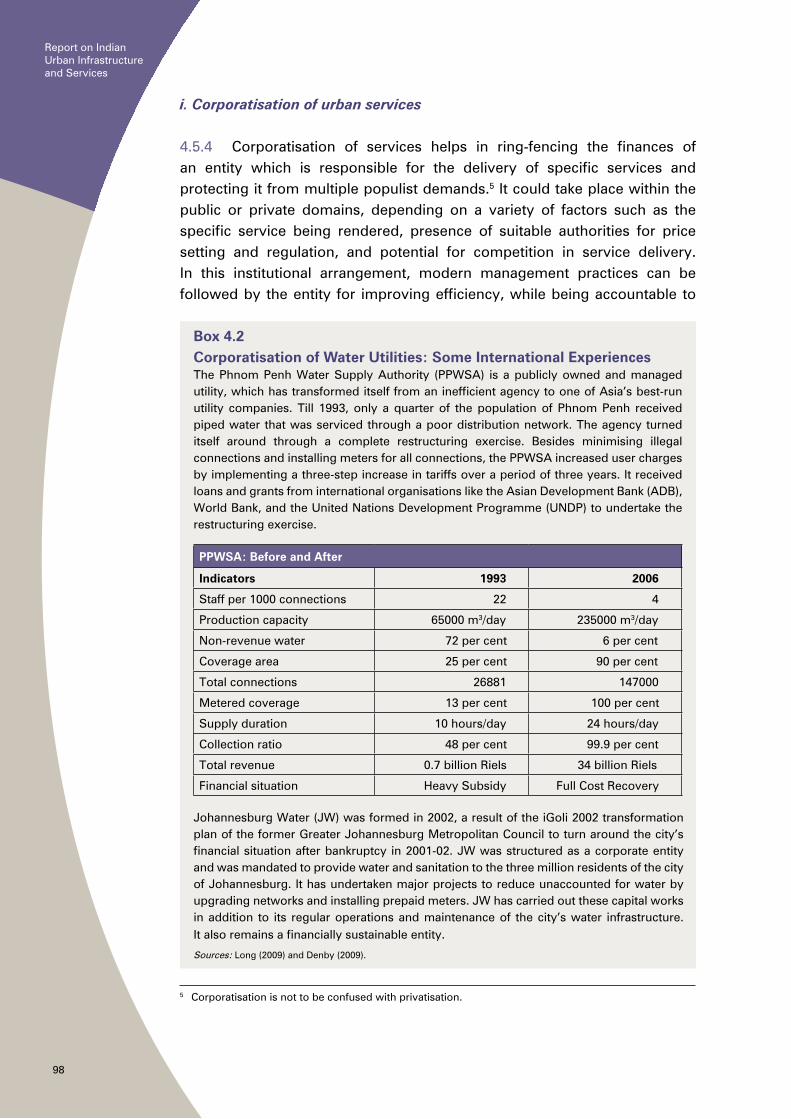
98
Report 2009-2010
98
Report on Indian Urban Infrastructure and Services
i. Corporatisation of urban services
4.5.4 Corporatisation of services helps in ring-fencing the finances of an entity which is responsible for the delivery of specific services and protecting it from multiple populist demands.5 It could take place within the public or private domains, depending on a variety of factors such as the specific service being rendered, presence of suitable authorities for price setting and regulation, and potential for competition in service delivery. In this institutional arrangement, modern management practices can be followed by the entity for improving efficiency, while being accountable to
PPWSA: Before and After
Indicators 1993 2006
Staff per 1000 connections 22 4
Production capacity 65000 m3/day 235000 m3/day
Non-revenue water 72 per cent 6 per cent
Coverage area 25 per cent 90 per cent
Total connections 26881 147000
Metered coverage 13 per cent 100 per cent
Supply duration 10 hours/day 24 hours/day
Collection ratio 48 per cent 99.9 per cent
Total revenue 0.7 billion Riels 34 billion Riels
Financial situation Heavy Subsidy Full Cost Recovery
5 Corporatisation is not to be confused with privatisation.
Box 4.2Corporatisation of Water Utilities: Some International ExperiencesThe Phnom Penh Water Supply Authority (PPWSA) is a publicly owned and managed utility, which has transformed itself from an inefficient agency to one of Asia’s best-run utility companies. Till 1993, only a quarter of the population of Phnom Penh received piped water that was serviced through a poor distribution network. The agency turned itself around through a complete restructuring exercise. Besides minimising illegal connections and installing meters for all connections, the PPWSA increased user charges by implementing a three-step increase in tariffs over a period of three years. It received loans and grants from international organisations like the Asian Development Bank (ADB), World Bank, and the United Nations Development Programme (UNDP) to undertake the restructuring exercise.
Johannesburg Water (JW) was formed in 2002, a result of the iGoli 2002 transformation plan of the former Greater Johannesburg Metropolitan Council to turn around the city’s financial situation after bankruptcy in 2001-02. JW was structured as a corporate entity and was mandated to provide water and sanitation to the three million residents of the city of Johannesburg. It has undertaken major projects to reduce unaccounted for water by upgrading networks and installing prepaid meters. JW has carried out these capital works in addition to its regular operations and maintenance of the city’s water infrastructure. It also remains a financially sustainable entity. Sources: Long (2009) and Denby (2009).
99
Report 2009-2010
99
Report on Indian Urban Infrastructure
and Services
Box 4.3Corporatisation of a Water Utility in IndiaA Beginning in NagpurAs part of its ambitious city-wide water supply programme, the Nagpur Municipal Corporation (NMC) is attempting to ring-fence the provision of water supply in the city.
The Nagpur Environmental Services Ltd. (NESL) has been registered under the Companies Act 1956 in October 2009 and has been assigned the responsibility for delivery and management of water facilities and waste water collection, treatment, and disposal for Nagpur city.
The proposed set up will have an asset-holding company and an operating company. Coordination for asset management will be the responsibility of the NESL, which is fully owned by the NMC. The operating equipment, consisting of all moveable assets, will be owned by the privately run company. A private operator will be made responsible for the provision of water supply services and renewal of all worn-out assets.
A 25-year lease contract governing the operation of the system has been finalised between the NMC, NESL, and a Special Purpose Company which will be formed by selected bidders specifically for the city-wide water project. The Special Purpose Company will sign a performance contract with the NESL which will take effect on the same date as the lease contract and run for the same duration (25 years). The contract contains provisions for review of the performance targets every five years. These targets take into account the responsibilities of both the operating company and the NESL with respect to obtaining finances and investment for water supply infrastructure and its maintenance, meeting standards for water quality, etc.
The asset-holding company shall be entrusted with ensuring the implementation of the investment programmes required for the development of the water supply infrastructure. The NESL shall be required to count on its own financial resources and not depend on municipal budget allocations. Under the concession agreement, the asset-holding company shall be granted the exclusive right to receive the net operating incomes generated by the efficient delivery of water supply services. It shall also be assigned the responsibility for approving investments, implementing expansion programmes, and overseeing the operating company.
Source: Nagpur Municipal Corporation (2010).
the ULB. The Phnom Penh Water Supply Authority (PPWSA) in Cambodia is an example of a publicly owned utility which has transformed itself through a focused restructuring programme that included initiatives in organisational development, improvements in operational efficiency and people management. Johannesburg Water (JW) in South Africa also restructured itself as a corporate entity to deliver operational efficiency, and become financially sustainable. In India, an example is provided by the Nagpur Municipal Corporation (NMC) which has set up a dedicated company for overseeing its water provision and waste water treatment and disposal functions. Boxes 4.2 and 4.3 present evidence on some successful examples of corporatisation – public and/or private.
100
Report 2009-2010
100
Report on Indian Urban Infrastructure and Services
ii. Coming together to deliver
4.5.5 At times municipal boundaries may have to give way to a larger scale of operations which may be optimal for the delivery of urban services. This is particularly true for small ULBs. A ‛water district’ then becomes more important than a ‛geographic district’. The state government can play the role of regional facilitator for the local governments to come together for service provision. A joint entity of a number of ULBs can take up the task of infrastructure development for the associated ULBs, but such an entity should be accountable only to the ULBs. It may be possible to carve out their areas of operation. For example, sourcing of water (production) for supply to the urban areas can be entrusted to such an entity and distribution of water within the cities can be the responsibility of ULBs. Should efficiency considerations warrant that service delivery is also entrusted to this entity, it must be subject to service-level agreements (SLAs) with ULBs. Also, the Boards of such institutions must have appropriate representation from ULBs. The Ministry of Urban Development should lead the effort in developing model SLAs.
4.5.6 In the past, scale economies and efficiency considerations have led to the setting up of parastatals by state governments for service delivery. Since parastatals can only be made formally accountable to state governments, it is preferable to choose the inter-ULB corporatisation route as discussed above.
iii. Public private partnership
4.5.7 The Committee views PPP as an important instrument for enhancing efficiency in the delivery of urban services and ensuring that controllable risks such as operations risks are transferred to the service provider. PPPs, which are structured around a robust revenue model (including user charges, targeted subsidies, and viability gap funding) and offer a good prospect of return on risk capital, can contribute to systemic gains and better management of urban services.
4.5.8 A distinction should be made between commercial PPP and ‛delivery partnership’ which is based on output-based contracts. It is entirely possible for the private sector in a PPP arrangement to provide specified services to constituencies that cannot pay for the services, if the government is subsidising the costs. Private management can reduce the cost of delivery, enhance efficiency, and provide value for money for government expenditure and services. There is a smooth continuum of PPPs from the public sector contracting service delivery to output-based contracts and commercial contracts. It may well be prudent to begin with output-based contracts and move gradually to full commercial contracts as the private and public sectors engage together and experience a working relationship.
101
Report 2009-2010
101
Report on Indian Urban Infrastructure
and Services
4.5.9 PPPs in the urban sector, still at a nascent stage and few in number, can bring about better service delivery outcomes if they are structured well and risks are appropriately assigned to the two parties. Weak governments cannot rely on private agents to overcome their weaknesses nor can they expect to make the best possible bargains for the public they represent. Borrowing from the public sector should not simply be replaced by (often more expensive) borrowing from the private sector without ensuring that it carries with it the additional risks that are transferred from the public sector to the private provider.
4.5.10 With strengthened ULB capacity, PPPs also serve as an instrument of governance and service delivery improvement. This is achieved by committing ULBs to legally binding contracts and pricing rules which cover costs through user charges. The efficiency gains can be realised both in the process of entering the partnership through a bidding process, which is competitive and transparent, and from operational efficiencies because of the commercial orientation of such an entity. This results in financial benefits for both the ULB and the private partner. When long-term maintenance is included as part of the obligation of the private partner, it brings an element of sustainability into the operation and also improves the quality of the infrastructure created.
4.5.11 A major deterrent to the entry of private firms in the urban sector in India is the commercial non-viability of projects. This is closely linked to the inability of ULBs to generate a strong internal revenue base. The relatively smaller size/value of projects also makes projects unattractive for private companies. There is also a great deal of inertia on the part of ULB officials in the delivery of urban services to move away from the familiar ways of doing business in the public sector to the new terrain of PPPs. This is combined with lack of capacity to develop and comprehend complex financial and legal agreements. In cases where the underlying projects/sectors have the potential to be commercially viable on a stand alone basis but have operational costs and governance risks (such as in the collection of user charges), state governments may clearly specify that PPP structures are preferred. This would entail that all projects be screened for viability and implementation on a PPP basis as a first step before being sanctioned for implementation through the conventional route. The Committee also recommends that contractual and financial arrangements such as build-operate-transfer (BOT), annuity, and viability gap funding (VGF) be more widely used in the delivery of urban services.
4.5.12 To create an enabling environment for the delivery of services through PPPs, the Committee recommends that state governments either amend their Municipal Acts or enact overarching Acts to facilitate PPPs. Gujarat and Karnataka have already done so. This must be supplemented by a robust regulatory environment. State financial intermediaries should take on the role of guiding ULBs on PPP initiatives. Financial planning and transparency become important as ULBs acquire greater autonomy in the management of their resources and
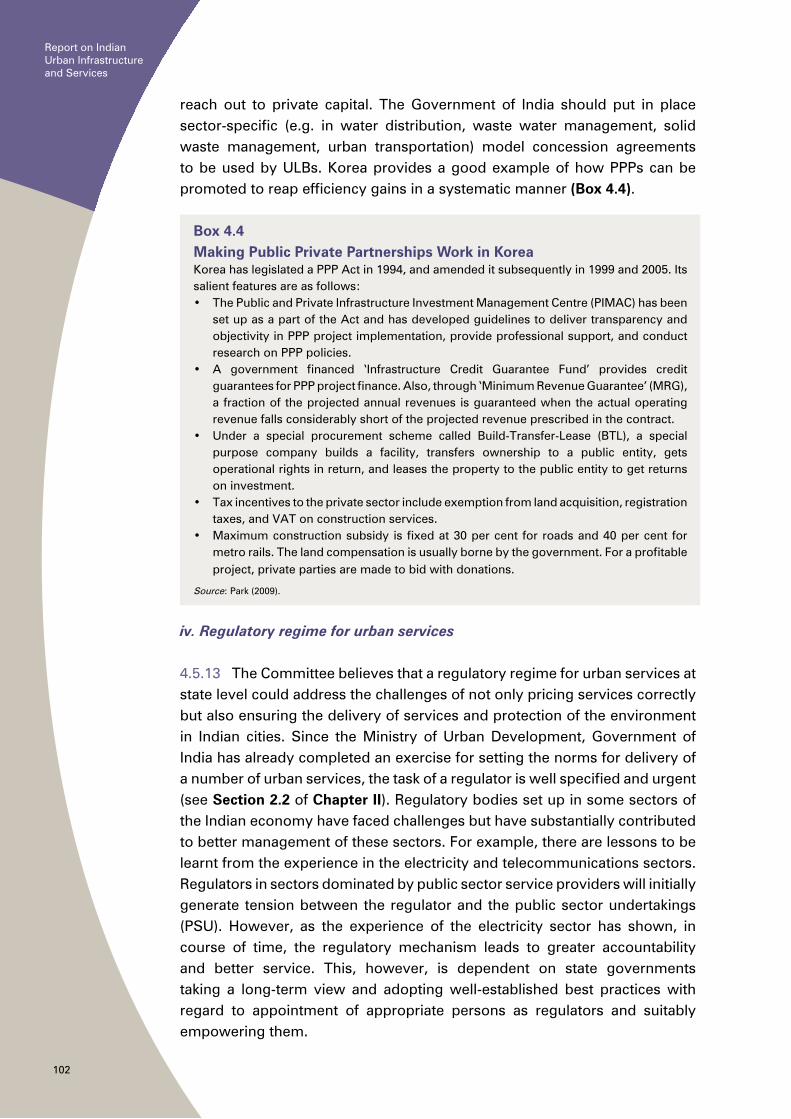
102
Report 2009-2010
102
Report on Indian Urban Infrastructure and Services
reach out to private capital. The Government of India should put in place sector-specific (e.g. in water distribution, waste water management, solid waste management, urban transportation) model concession agreements to be used by ULBs. Korea provides a good example of how PPPs can be promoted to reap efficiency gains in a systematic manner (Box 4.4).
Source: Park (2009).
Box 4.4Making Public Private Partnerships Work in KoreaKorea has legislated a PPP Act in 1994, and amended it subsequently in 1999 and 2005. Its salient features are as follows:
The Public and Private Infrastructure Investment Management Centre (PIMAC) has been • set up as a part of the Act and has developed guidelines to deliver transparency and objectivity in PPP project implementation, provide professional support, and conduct research on PPP policies.A government financed ‛Infrastructure Credit Guarantee Fund’ provides credit • guarantees for PPP project finance. Also, through ‛Minimum Revenue Guarantee’ (MRG), a fraction of the projected annual revenues is guaranteed when the actual operating revenue falls considerably short of the projected revenue prescribed in the contract.Under a special procurement scheme called Build-Transfer-Lease (BTL), a special • purpose company builds a facility, transfers ownership to a public entity, gets operational rights in return, and leases the property to the public entity to get returns on investment.Tax incentives to the private sector include exemption from land acquisition, registration • taxes, and VAT on construction services.Maximum construction subsidy is fixed at 30 per cent for roads and 40 per cent for • metro rails. The land compensation is usually borne by the government. For a profitable project, private parties are made to bid with donations.
iv. Regulatory regime for urban services
4.5.13 The Committee believes that a regulatory regime for urban services at state level could address the challenges of not only pricing services correctly but also ensuring the delivery of services and protection of the environment in Indian cities. Since the Ministry of Urban Development, Government of India has already completed an exercise for setting the norms for delivery of a number of urban services, the task of a regulator is well specified and urgent (see Section 2.2 of Chapter II). Regulatory bodies set up in some sectors of the Indian economy have faced challenges but have substantially contributed to better management of these sectors. For example, there are lessons to be learnt from the experience in the electricity and telecommunications sectors. Regulators in sectors dominated by public sector service providers will initially generate tension between the regulator and the public sector undertakings (PSU). However, as the experience of the electricity sector has shown, in course of time, the regulatory mechanism leads to greater accountability and better service. This, however, is dependent on state governments taking a long-term view and adopting well-established best practices with regard to appointment of appropriate persons as regulators and suitably empowering them.
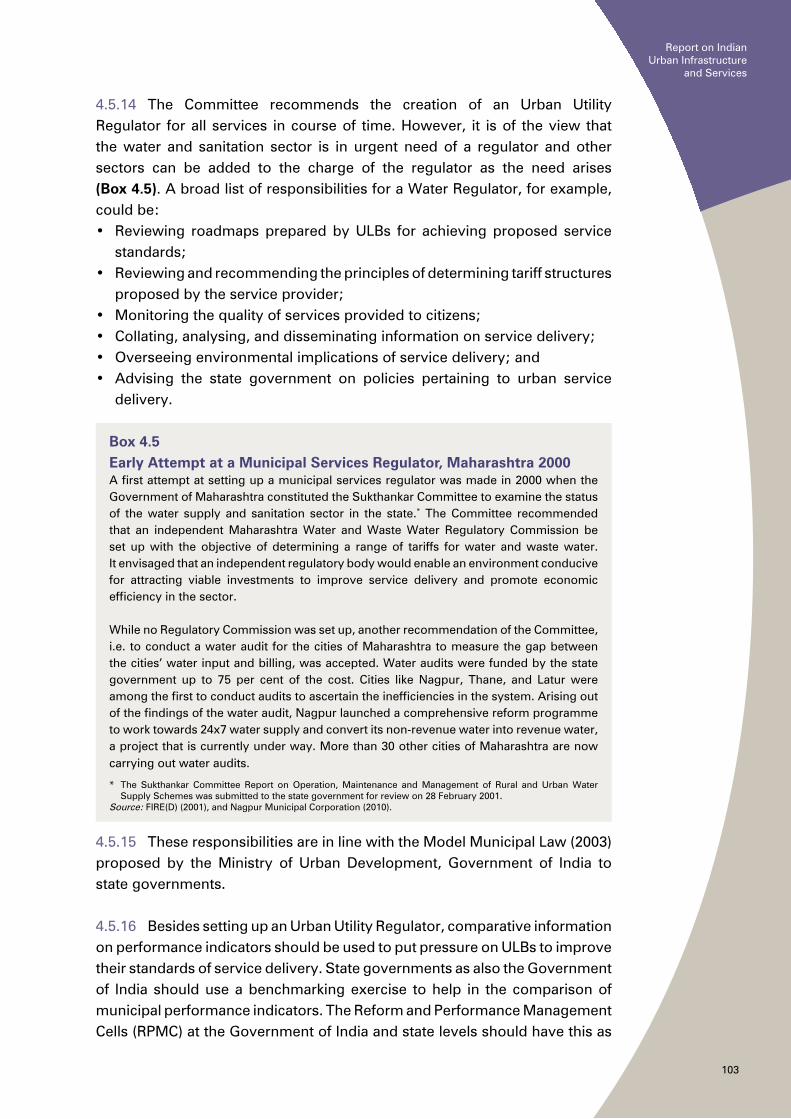
103
Report 2009-2010
103
Report on Indian Urban Infrastructure
and Services
Box 4.5Early Attempt at a Municipal Services Regulator, Maharashtra 2000A first attempt at setting up a municipal services regulator was made in 2000 when the Government of Maharashtra constituted the Sukthankar Committee to examine the status of the water supply and sanitation sector in the state.* The Committee recommended that an independent Maharashtra Water and Waste Water Regulatory Commission be set up with the objective of determining a range of tariffs for water and waste water. It envisaged that an independent regulatory body would enable an environment conducive for attracting viable investments to improve service delivery and promote economic efficiency in the sector.
While no Regulatory Commission was set up, another recommendation of the Committee, i.e. to conduct a water audit for the cities of Maharashtra to measure the gap between the cities’ water input and billing, was accepted. Water audits were funded by the state government up to 75 per cent of the cost. Cities like Nagpur, Thane, and Latur were among the first to conduct audits to ascertain the inefficiencies in the system. Arising out of the findings of the water audit, Nagpur launched a comprehensive reform programme to work towards 24x7 water supply and convert its non-revenue water into revenue water, a project that is currently under way. More than 30 other cities of Maharashtra are now carrying out water audits.
4.5.14 The Committee recommends the creation of an Urban Utility Regulator for all services in course of time. However, it is of the view that the water and sanitation sector is in urgent need of a regulator and other sectors can be added to the charge of the regulator as the need arises (Box 4.5). A broad list of responsibilities for a Water Regulator, for example, could be:
Reviewing roadmaps prepared by ULBs for achieving proposed service • standards;Reviewing and recommending the principles of determining tariff structures • proposed by the service provider;Monitoring the quality of services provided to citizens;• Collating, analysing, and disseminating information on service delivery;• Overseeing environmental implications of service delivery; and• Advising the state government on policies pertaining to urban service • delivery.
4.5.15 These responsibilities are in line with the Model Municipal Law (2003) proposed by the Ministry of Urban Development, Government of India to state governments.
4.5.16 Besides setting up an Urban Utility Regulator, comparative information on performance indicators should be used to put pressure on ULBs to improve their standards of service delivery. State governments as also the Government of India should use a benchmarking exercise to help in the comparison of municipal performance indicators. The Reform and Performance Management Cells (RPMC) at the Government of India and state levels should have this as
* The Sukthankar Committee Report on Operation, Maintenance and Management of Rural and Urban Water Supply Schemes was submitted to the state government for review on 28 February 2001.Source: FIRE(D) (2001), and Nagpur Municipal Corporation (2010).
104
Report 2009-2010
104
Report on Indian Urban Infrastructure and Services
one of their responsibilities (See Section 4.6 for detailed recommendations on RPMC). Incentives should be provided through performance grants to municipalities that achieve national standards of service delivery. As regards the regulation of taxes and tariffs, the regulator may set a floor while allowing municipalities to choose their level of tax rates and tariffs above this level.
v. Accountability and citizen participation
4.5.17 Citizen participation needs to be strengthened to create ‛citizen owned, citizen paid, and citizen managed’ cities. Setting up of Ward Committees and Area Committees is an important first step. The Model Community Participation Law and the Nagara Raj Bill 2006, a part of the JNNURM reforms on community participation, are steps in the right direction and need to be enhanced and enforced.
4.5.18 The Public Disclosure Law and Community Participation Law are important tools for driving transparency and accountability in governance. The Committee endorses the recommendation of the Second Administrative Reforms Commission and the Thirteenth Central Finance Commission for the creation of a Local Body Ombudsman that addresses corruption and efficiency issues. This will strengthen citizen participation in governance. The Ombudsman may look into corruption cases against officials as well as non-officials including Mayors. Social audit reports, independently verified by third parties and published on a regular basis, will serve as key levers in keeping city administration accountable. Citizen Report Cards like the ones prepared by the Public Affairs Centre in Bangalore must be replicated across all cities. Local television channels and newspapers can also make a big impact on city governance through independent reporting of news on the state of India’s cities.
4.5.19 The Committee recommends that each state should set up an inter-Municipal Council called State Council of Local Self-government headed by the Chief Minister of each state with Mayors and Municipal Chairpersons as members. This Council will meet at least once a year to discuss issues of local self-government.
4.5.20 Citizen forums that adopt an outcome-based approach to service delivery in measuring effectiveness of city management will help reduce the disconnect between people and city governance. Monthly town hall meetings involving local government officials and civil society should review the performance of urban service delivery, monitor the progress of projects under way, and prioritise future development of the city. The minutes of such meetings must be made available online on the ULB website with continuous monitoring and feedback by the local government and citizens. Use of Information and Communication Technology (ICT) and continuous monitoring
105
Report 2009-2010
105
Report on Indian Urban Infrastructure
and Services
based on mobile phones as is being currently practised in Greater Hyderabad Municipal Corporation, has to be strongly encouraged (Box 4.6).
4.5.21 Planning legislations have to be modernised to involve citizens in the planning process as also in plan implementation, review, and monitoring. It must be mandatory to make public disclosure of the plans and, more importantly, subsequent variations in the plans. This must be done at all critical stages of plan preparation with sufficient time assigned for citizen responses.
vi. e-Governance
4.5.22 The IT industry of India has successfully serviced multinational companies across the world and the corporate sector in India to help improve their productivity. It is high time IT is used for improving governance in public service delivery in Indian cities. In the last few years, there has been some progress in using IT in urban management, but ULBs are yet to leverage the power of e-Governance to the fullest extent.
4.5.23 By doing away with the discretionary powers vested in a few officials, e-Governance cuts at the roots of corruption and inefficiency. For example, geographical information system (GIS) can be used to improve urban land management and make it more transparent, as is being done in some cities of India. Similarly, supervisory control and data acquisition (SCADA) is being used successfully for better water management in cities such as Hyderabad, Bangalore, Tirupur, and Nagpur. The global positioning system (GPS) is being used to track and monitor bus services in Surat and Indore.
4.5.24 More recently, Greater Hyderabad Municipal Corporation has started combining the use of mobile phones with global packet radio services (GPRS) for off-site real time monitoring of delivering services such as solid waste management, street lighting, and building as per sanctions obtained. Since November 2010, using these instruments of high technology, building permissions are being given in the Greater Hyderabad area within four days, and construction is being monitored at regular intervals to ensure compliance (Box 4.6).
4.5.25 A number of ULBs have made progress on the basic aspects of e-Governance like creation of websites, uploading of information, and payment gateways for property tax, water bills, etc. States differ substantially in their e-readiness and approach to e-Governance. The availability of support infrastructure, reliability and reach of electricity, telecommunications links, band connectivity, and skills are crucial for making e-Governance effective. It needs to be supported by IT literacy with local language content and applications.
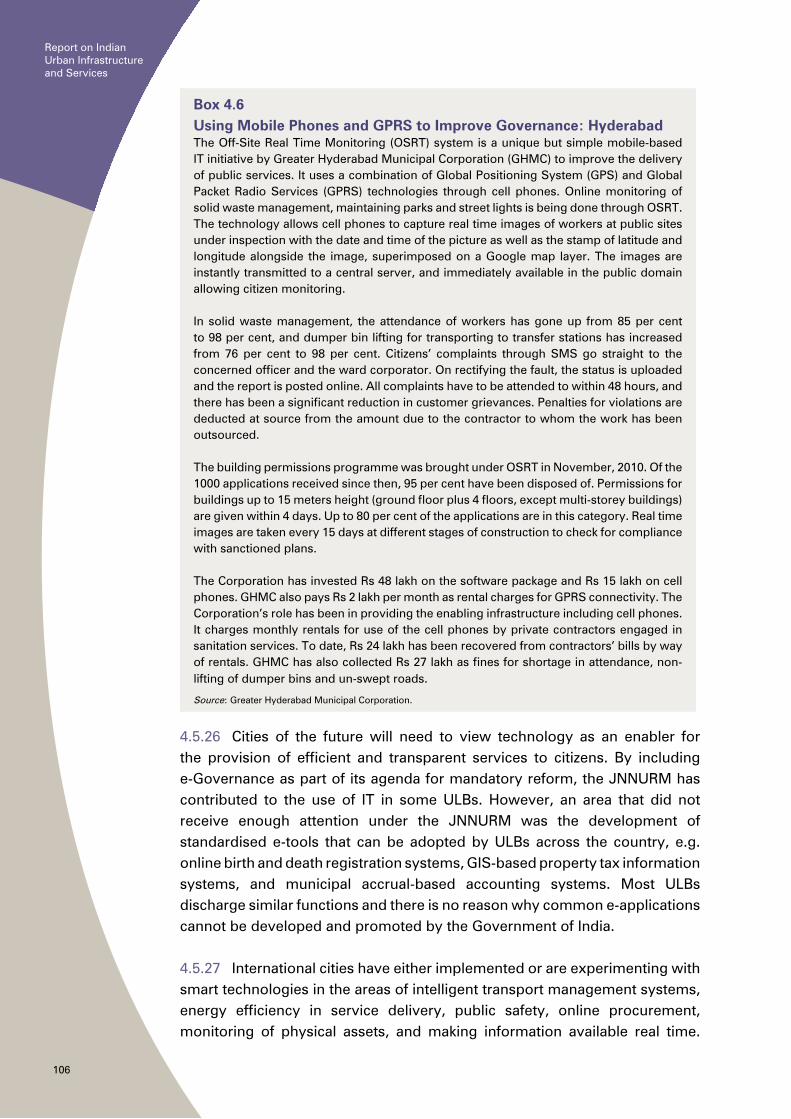
106
Report 2009-2010
106
Report on Indian Urban Infrastructure and Services
Box 4.6Using Mobile Phones and GPRS to Improve Governance: HyderabadThe Off-Site Real Time Monitoring (OSRT) system is a unique but simple mobile-based IT initiative by Greater Hyderabad Municipal Corporation (GHMC) to improve the delivery of public services. It uses a combination of Global Positioning System (GPS) and Global Packet Radio Services (GPRS) technologies through cell phones. Online monitoring of solid waste management, maintaining parks and street lights is being done through OSRT. The technology allows cell phones to capture real time images of workers at public sites under inspection with the date and time of the picture as well as the stamp of latitude and longitude alongside the image, superimposed on a Google map layer. The images are instantly transmitted to a central server, and immediately available in the public domain allowing citizen monitoring.
In solid waste management, the attendance of workers has gone up from 85 per cent to 98 per cent, and dumper bin lifting for transporting to transfer stations has increased from 76 per cent to 98 per cent. Citizens’ complaints through SMS go straight to the concerned officer and the ward corporator. On rectifying the fault, the status is uploaded and the report is posted online. All complaints have to be attended to within 48 hours, and there has been a significant reduction in customer grievances. Penalties for violations are deducted at source from the amount due to the contractor to whom the work has been outsourced.
The building permissions programme was brought under OSRT in November, 2010. Of the 1000 applications received since then, 95 per cent have been disposed of. Permissions for buildings up to 15 meters height (ground floor plus 4 floors, except multi-storey buildings) are given within 4 days. Up to 80 per cent of the applications are in this category. Real time images are taken every 15 days at different stages of construction to check for compliance with sanctioned plans.
The Corporation has invested Rs 48 lakh on the software package and Rs 15 lakh on cell phones. GHMC also pays Rs 2 lakh per month as rental charges for GPRS connectivity. The Corporation’s role has been in providing the enabling infrastructure including cell phones. It charges monthly rentals for use of the cell phones by private contractors engaged in sanitation services. To date, Rs 24 lakh has been recovered from contractors’ bills by way of rentals. GHMC has also collected Rs 27 lakh as fines for shortage in attendance, non-lifting of dumper bins and un-swept roads.
4.5.26 Cities of the future will need to view technology as an enabler for the provision of efficient and transparent services to citizens. By including e-Governance as part of its agenda for mandatory reform, the JNNURM has contributed to the use of IT in some ULBs. However, an area that did not receive enough attention under the JNNURM was the development of standardised e-tools that can be adopted by ULBs across the country, e.g. online birth and death registration systems, GIS-based property tax information systems, and municipal accrual-based accounting systems. Most ULBs discharge similar functions and there is no reason why common e-applications cannot be developed and promoted by the Government of India.
4.5.27 International cities have either implemented or are experimenting with smart technologies in the areas of intelligent transport management systems, energy efficiency in service delivery, public safety, online procurement, monitoring of physical assets, and making information available real time.
Source: Greater Hyderabad Municipal Corporation.
107
Report 2009-2010
107
Report on Indian Urban Infrastructure
and Services
The Committee recommends that the Ministry of Urban Development, Government of India take the lead in promoting the use of smart technologies in Indian cities by bringing together the stakeholders within and outside of government for knowledge sharing on city-specific technologies. Over time, the Ministry should look to putting in place a framework for city technology planning which links up with the city’s master/development plan and covers aspects like data security besides improving governance.
4.5.28 The Committee recommends the following steps to build IT capacity at ULB level to implement and manage e-Governance initiatives:
IT cadre should be developed separately and outside of the government • pay scale in order to attract and retain talent;Larger ULBs should have a Chief Information Officer to lead the • e-Governance initiatives of the city. For reasons of economy, small cities and towns may pool their resources to appoint a Chief Information Officer for leading their e-Governance initiatives; andULBs should draw upon local colleges providing IT courses as well as • external providers of training to attract talent.
4.5.29 The Government of India has initiated a nationwide e-District project under the National e-Governance Plan to scale up the best practices at national level. The project aims to e-enable the delivery of high-volume public services by creating a robust and scalable infrastructure so that ULBs can tap into this e-infrastructure, together with State Data Centres and State-wide Area Networks for service delivery.
4.6 Capacity building
4.6.1 The governance reforms outlined in the earlier sections require a radical change in the old ways of doing business at all levels of government. The JNNURM included a specific provision of 5 per cent of the project cost for capacity building for state governments and ULBs, but there were few takers. The Mid-Term Appraisal of the Eleventh Plan has proposed significant enhancement of this percentage.
4.6.2 The Committee believes that the urban sector in the Indian economy is currently going through a major and significant structural transformation. It calls for a concerted effort at strengthening the capacity of institutions and persons who will facilitate this process to deliver the faster and more inclusive growth of the economy. Given the large investment requirements of about Rs 38.2 lakh crore in urban infrastructure and renewal and redevelopment (including slums) projected by the Committee over the 20-year period, the Committee is of the view that 2.5 per cent of the total capital expenditure should be earmarked for capacity building by concerted efforts of the
108
Report 2009-2010
108
Report on Indian Urban Infrastructure and Services
Government of India, state governments, ULBs, and the private sector. If the Government of India commits to spend 5 per cent of its NIJNNURM funds towards capacity building, this could meet about half of the total requirement for capacity building. The other half will come from state governments, ULBs, and private sector.
4.6.3 The Committee understands that the Ministry of Housing and Urban Poverty Alleviation proposes to establish a network of national, regional, state, and city resource centres under a National Programme of Capacity Building for Improved Urban Governance and Poverty Alleviation. The Committee strongly endorses this proposal.
4.6.4 The Committee recommends that the Government of India in partnership with state governments and possibly the private sector, should set up five Indian Institutes of Urban Management. The Institutes can either be anchored in existing IIMs or be stand alone institutions of excellence. Their task will be to prepare a future generation of urban managers/regulators with state of the art training in urban issues. The Committee also recommends that the existing Schools of Urban Planning should be revitalised and strengthened with infusion of funds and new talent so that they can provide similar inputs for urban planning (including metropolitan and regional planning).
4.6.5 The Institutes of Urban Management and Schools of Planning should also be used for upgrading the skills of existing personnel in the urban sector by providing short and focused courses in urban management/finance/planning. Such courses would familiarise the present urban managers and officials with the use of new policy and technology tools, e.g. IT software, mobile phones, GPS, GIS, GPRS, etc. The system of employee training must move towards continuous education with a problem-solving approach that builds on concrete experiences. The Committee recommends that about 300 officers from the Indian Administrative Services (IAS) and other central services be trained annually as urban specialists. The trained officers should be placed systematically through deputation in cities and towns.
4.6.6 The Committee is of the view that the Government of India should support think tank initiatives in urban policy and promote Centres of Innovation in existing institutions designed to improve the quality of policy debate on urban issues through building knowledge and sharing it. This will generate wider awareness of the urban challenge and encourage comparative analysis of India’s urban performance and prospects with similar transitions being experienced in other developing countries. Following the recommendations of the Thirteenth Central Finance Commission, a Centre for Innovations in Public Policy has already been set up at the Administrative Staff College of India (ASCI). Similar Centres of Innovation must be set up in other national/regional institutes.
109
Report 2009-2010
109
Report on Indian Urban Infrastructure
and Services
4.6.7 The capacity deficit in the private sector for designing and implementing large-scale urban infrastructure projects also needs to be addressed. Putting in place standards for development/construction and enforcing these standards will encourage market players to develop capacity on a large scale for meeting the growing demand.
4.6.8 Better communication mechanisms and dissemination of knowledge about best practices among ULBs can help improve their performance. The Peer Experience and Reflective Learning (PEARL) initiative led by the National Institute of Urban Affairs (NIUA) is one such attempt by the Ministry of Urban Development. The Vibrant Governance programme implemented in a number of states is another example of a training programme to help government officials understand the priorities of governance and the importance of their role in it. There is also need to engage elected representatives at ULBs and state governments with issues of urban governance, both as a challenge and an opportunity.
4.6.9 The Committee strongly recommends the building/reforming of Municipal cadres in all states. The cadre should cover expertise in the areas of regional and city planning, finance and accounts, public works, project management, traffic and transportation, environmental conservation, e-governance, etc. The personnel requirements and the competencies needed for Municipal Corporations, Municipalities and Nagar Panchayats should be assessed and size of the cadres at the different levels determined. In doing so, due attention should be paid to the possibilities of corporatising, outsourcing, and entering into PPPs. Recruitment into the municipal cadre at the entry level should be through a competitive examination as in the case of civil services, and ULBs should also have flexibility in lateral hiring of professionals with special skills into the cadre.
4.6.10 The Committee recommends a transparent search-cum-selection process led by the Mayor for recruiting the city manager (Municipal Commissioner). State governments should facilitate consultations with the Mayor in the appointment of the Municipal Commissioner. The recruitment of the management team could either be from the civil services or from qualified professionals from outside the system. The Municipal Commissioner and other selected officers should be given a minimum tenure of three years.
4.6.11 The Committee recommends the creation of a Reform and Performance Management Cell (RPMC) in the Government of India that would be dedicated to providing assistance to state governments and ULBs. The multi-disciplinary team at the RPMC will be supported by the Institutes of Urban management, Schools of Planning, Centres of Excellence/ Innovation and other experts.
110
Report 2009-2010
110
Report on Indian Urban Infrastructure and Services
4.6.12 The Committee recommends that a dedicated Municipal Information Unit be set up within the RPMC to collect, collate, and analyse comparable data on municipal services and finances on an annual basis. The data generated should be available in the public domain. Instruments of e-governance, mobile (phone) governance, GIS, GPS, GPRS, etc., can be very powerful in improving governance.
4.6.13 In particular, the RPMC should lead initiatives towards fostering an enabling environment for PPPs including:
Preparing sector-specific model concession agreements;• Assisting local governments in the preparation of feasibility studies for PPP-• led urban development and designing appropriate financial instruments;Organising seminars and workshops on PPPs involving local and • multinational companies operating in the urban infrastructure space as well as multilateral agencies such as the ADB and the World Bank;Maintaining a database of PPP activities and providing policy advice;• Disseminating knowledge about technologies and best practices on PPPs • among ULBs; andAssisting the proposed Ministry of Urban Affairs and Housing, Government • of India in creating incentive structures for local governments that undertake PPP projects.
4.6.14 Besides providing technical support to ULBs in matters of finance, planning and operations, the RPMC should develop a Performance Management System, including a City Ratings Matrix, covering the key parameters for monitoring the performance of cities. Where required, the RPMC may also provide assistance to State Finance Commissions (SFC).
4.6.15 State governments should set up RPMC at state level to support ULBs in discharging their mandated responsibilities. But the Committee believes that given the limited attention paid to urban affairs over a very long period, state governments and ULBs will require considerable handholding by the Government of India in building capacity to carry out the necessary reforms and achieve the service delivery standards envisaged in the Report. Similar cells may also be established at larger and growing cities.
4.6.16 The principal elements of the capacity building programme of the Government of India through NIJNNURM will include:
RPMC at Government of India (Mission Directorate);• RPMC at state level;• Similar units at large/growing cities;• Five Indian Institutes of Urban Management;• Schools of Planning;• Centres of Excellence/Innovations in existing national/regional institutes;•
111
Report 2009-2010
111
Report on Indian Urban Infrastructure
and Services
Support to states/ULBs/regulators through expert advice in preparing • programmes, reforms, implementation and monitoring.
4.6.17 It is expected that state governments will champion similar efforts especially with respect to building capacity for ULBs.
4.7 Urban planning
4.7.1 Planning for India’s cities and towns has received little attention at all levels of government. The Planning Commission of the Government of India has focused on socio-economic planning in its dialogue with state governments. The Committee recommends that spatial planning be made an essential part of the state plans and that the Planning Commission provide incentives to state governments for integrating socio-economic planning with spatial planning.
4.7.2 As growth corridors are planned at all-India level, there is need for the state to plan for the trunks and nodes and for state governments to build synergies with national-level transport planning in preparing their state plans. The Delhi-Mumbai Industrial Corridor is a case in point (Box 4.7). Integrating spatial with economic planning is vital for the success of this project. There is also urgent need to introduce contemporary tools of regional planning that integrate traditional spatial planning with environmental, socio-economic, and cultural considerations.
4.7.3 The starting point for integrated socio-economic and spatial planning should be regional planning. Rather than focusing on expansion of towns in isolation from their hinterland, it is important to focus simultaneously on the watershed region. Within a region, the aim should be to identify towns or growing villages with locational or natural resource advantages, and focus future socio-economic and spatial growth by guiding investment of funds for infrastructure and industrial growth into such nodes. But regional planning in India has suffered from missing institutions.
4.7.4 The Committee strongly recommends the creation of Metropolitan Planning Committees (MPC)/District Planning Committees (DPC) as set out in the 74th Constitutional Amendment Act. DPCs have been constituted but not empowered to function in most states, while MPCs have not even been set up in most states. The Committee recommends that the MPCs/DPCs be operationalised and made the focal point for all activities related to regional planning. It is vital to have a certain number of eminent citizens on these Committees.
Programme/activity-based support for national/regional/state/city • resource centres;
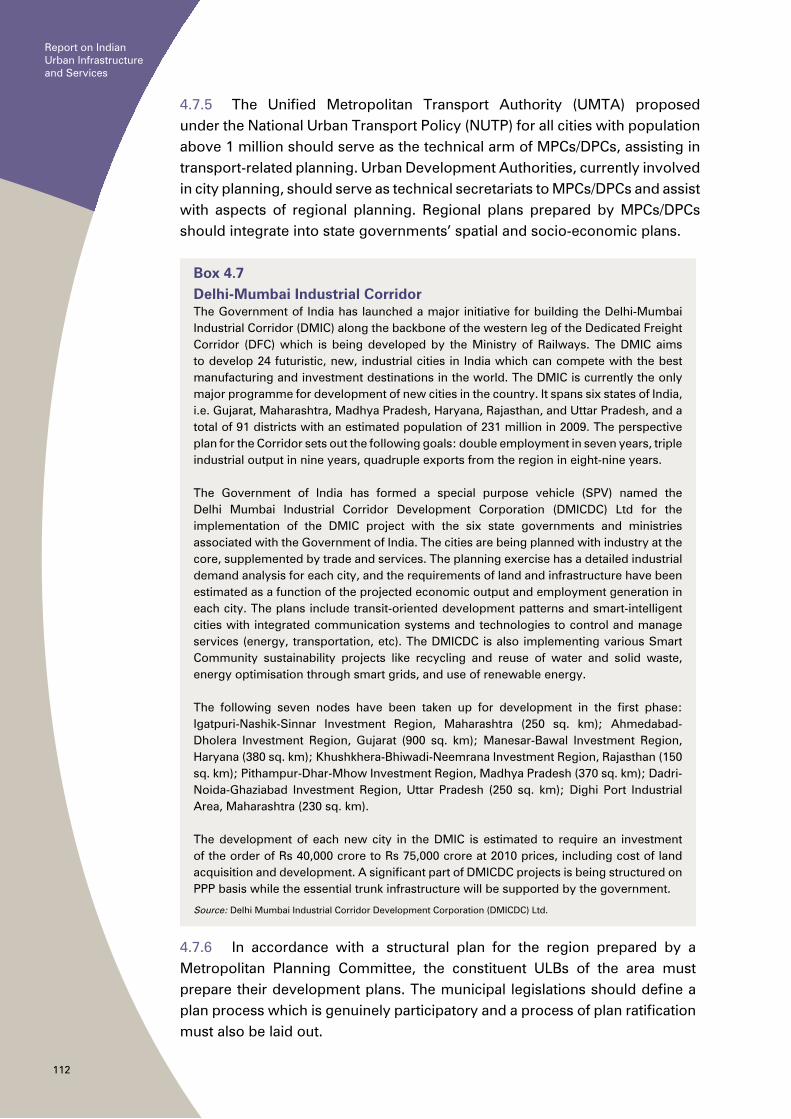
112
Report 2009-2010
112
Report on Indian Urban Infrastructure and Services
4.7.5 The Unified Metropolitan Transport Authority (UMTA) proposed under the National Urban Transport Policy (NUTP) for all cities with population above 1 million should serve as the technical arm of MPCs/DPCs, assisting in transport-related planning. Urban Development Authorities, currently involved in city planning, should serve as technical secretariats to MPCs/DPCs and assist with aspects of regional planning. Regional plans prepared by MPCs/DPCs should integrate into state governments’ spatial and socio-economic plans.
Box 4.7Delhi-Mumbai Industrial CorridorThe Government of India has launched a major initiative for building the Delhi-Mumbai Industrial Corridor (DMIC) along the backbone of the western leg of the Dedicated Freight Corridor (DFC) which is being developed by the Ministry of Railways. The DMIC aims to develop 24 futuristic, new, industrial cities in India which can compete with the best manufacturing and investment destinations in the world. The DMIC is currently the only major programme for development of new cities in the country. It spans six states of India, i.e. Gujarat, Maharashtra, Madhya Pradesh, Haryana, Rajasthan, and Uttar Pradesh, and a total of 91 districts with an estimated population of 231 million in 2009. The perspective plan for the Corridor sets out the following goals: double employment in seven years, triple industrial output in nine years, quadruple exports from the region in eight-nine years.
The Government of India has formed a special purpose vehicle (SPV) named the Delhi Mumbai Industrial Corridor Development Corporation (DMICDC) Ltd for the implementation of the DMIC project with the six state governments and ministries associated with the Government of India. The cities are being planned with industry at the core, supplemented by trade and services. The planning exercise has a detailed industrial demand analysis for each city, and the requirements of land and infrastructure have been estimated as a function of the projected economic output and employment generation in each city. The plans include transit-oriented development patterns and smart-intelligent cities with integrated communication systems and technologies to control and manage services (energy, transportation, etc). The DMICDC is also implementing various Smart Community sustainability projects like recycling and reuse of water and solid waste, energy optimisation through smart grids, and use of renewable energy.
The following seven nodes have been taken up for development in the first phase: Igatpuri-Nashik-Sinnar Investment Region, Maharashtra (250 sq. km); Ahmedabad-Dholera Investment Region, Gujarat (900 sq. km); Manesar-Bawal Investment Region, Haryana (380 sq. km); Khushkhera-Bhiwadi-Neemrana Investment Region, Rajasthan (150 sq. km); Pithampur-Dhar-Mhow Investment Region, Madhya Pradesh (370 sq. km); Dadri-Noida-Ghaziabad Investment Region, Uttar Pradesh (250 sq. km); Dighi Port Industrial Area, Maharashtra (230 sq. km).
The development of each new city in the DMIC is estimated to require an investment of the order of Rs 40,000 crore to Rs 75,000 crore at 2010 prices, including cost of land acquisition and development. A significant part of DMICDC projects is being structured on PPP basis while the essential trunk infrastructure will be supported by the government.
4.7.6 In accordance with a structural plan for the region prepared by a Metropolitan Planning Committee, the constituent ULBs of the area must prepare their development plans. The municipal legislations should define a plan process which is genuinely participatory and a process of plan ratification must also be laid out.
Source: Delhi Mumbai Industrial Corridor Development Corporation (DMICDC) Ltd.
113
Report 2009-2010
113
Report on Indian Urban Infrastructure
and Services
4.7.7 The current Master Planning models treat transportation as a residual. Transportation needs to be integrated with land use to take advantage of agglomeration economies and minimise likely congestion diseconomies. This must include provisions for housing for the poor along transit corridors so that they can avail of public transportation. Integration becomes possible if there are institutions that can coordinate the planning and management of land and transport investments. Examples from around the world, such as the Land Transport Authority in Singapore, Translink in Vancouver, and Transport for London have successfully demonstrated this (Box 4.8).
Box 4.8Institutional Structure for Urban Transport in London The transport network in London, managed through a host of government agencies in the early 1990s, faced multiple challenges including urgent need for upgradation and maintenance of the system. To address the issue, the government created Transport for London (TfL) in 2000 as part of the Greater London Authority (GLA) to bring about integration among the formerly fragmented agencies responsible for urban development and urban transport.
TfL combines the responsibilities of a department for transport, department for public works, several public transport agencies, a traffic management agency, and a local level body that looks after public space, walking, and cycling. The agency is run by a team appointed by the Mayor of London, who also sets the budget. The significant regulatory and budgetary powers vested in TfL have contributed to its success.
TfL manages travel demand and mobility patterns for the city, a successful example being congestion pricing in Central London. The proactive role of TfL in planning for urban transport in London has also allowed the city to commit to ambitious targets for tackling climate change. Though TfL has had success in many areas, bringing PPP for maintaining and upgrading the London underground network, oversight of the national rail operators who are not within the remit of TfL, and limited control over cross rail still remain challenges for it.
4.7.8 As cities grow and expand, agricultural lands surrounding them need to be converted to non-agricultural use to meet the demands of housing and commerce. Conversion of agricultural land to non-agricultural use falls under state land revenue laws. These laws discourage alienation and non-agricultural use of farm land. The growth of urbanisation and progress of industries and services sectors have increased the demand for conversion. The rules for conversion as prescribed under the old laws are restrictive, and as a result, proposals for conversion face many obstacles. This is also a major source of corruption.
4.7.9 There is urgent need to simplify the process of land conversion to facilitate the growing demand for urbanisation. The availability of urban land is also constrained by Rent Control Legislations in a number of states and the Urban Land Ceiling and Regulatory Act (ULCRA),1976, since repealed in all but
Source: Urban Age (2008).
114
Report 2009-2010
114
Report on Indian Urban Infrastructure and Services
two states. The high stamp duties in several states also raise the transactions costs in the land market. The JNNURM has drawn attention to the urgent need to repeal these Acts and lower the stamp duty to 5 per cent. The Committee strongly endorses these recommendations for reform.
4.7.10 In the peripheral areas of fast-growing urban agglomerations, which grow faster in the unregulated and unauthorised periphery than at the core, the Town and Country Planning legislation should lay down clear and simple guidelines for the rural hinterland of towns. The panchayats should be able to sanction buildings and impose a modicum of orderliness in the growth of village habitations and prevent them from becoming the slums of future urban areas.
4.7.11 The Committee believes that city planning should be an integral function of ULBs. To the extent that Development Authorities are engaged in local planning, this function should be transferred to ULBs. Earlier when there were no Development Authorities, ULBs (at least the large ones) had a planning and infrastructure development function. It was only during the 1970s that this function was severed from ULBs. Whatever the justification at the time, it is difficult to see its logic in the present context.
4.7.12 A common practice for land development by public intervention is through land readjustment schemes which compensate original owners of acquired land in kind, by returning portions of the serviced developed land. Such schemes have been used very efficiently in Korea, Taiwan, Japan, Australia, and West Germany. The Town Planning Scheme (TPS) of Gujarat is an example of land acquisition that does not get mired in court cases and leave dispossessed and uprooted families in its wake. Under the Scheme, once the area to be urbanised is identified in line with the strategic development plan, further land use planning and development is done by the Municipality.
4.7.13 Land readjustment schemes like the TPS of Gujarat are examples of citizen participation in the supply of land for infrastructure development at no cost to the local body (Box 4.9). Ahmedabad and Surat have completed more than 100 such schemes each, covering 300 sq. km and 137 sq. km respectively. Under the schemes, after the development authority of a town or city has drawn up a strategic development plan, the expansion area is divided into a number of smaller areas, typically between 1 and 2 sq. km each. These small areas are then developed through a framework of participative planning for infrastructure, with landowners being kept well informed at all stages of the project.6
6 The Ministry of Rural Development must engage in regular joint dialogue with the Ministry of Urban Development, and collaborate in the land readjustment schemes like the TPS for bringing in effective planned development in the regional context within the rural-urban continuum.
115
Report 2009-2010
115
Report on Indian Urban Infrastructure
and Services
Source: India Infrastructure Report (2009).
4.7.14 In another successful land readjustment model, landowners from a particular community organised themselves to set up the Magarpatta Township Development and Construction Company, which prepared a city plan for Magarpatta, an integrated township on the outskirts of Pune. They came together on a common platform as partners in town planning, i.e. land development for housing, infrastructure, and other public purposes. The Magar farmers pooled their land with each landowner becoming a shareholder in the company in proportion to the value of his/her land in the total, with the land cost being determined as a percentage of sale proceeds as and when accrued. The result is that Maharashtra has got an eco-city within the precincts of Pune. The town manages its own municipal services and yet pays its taxes to the Municipal Corporation. In course of time, a solution will have to be found for bringing Magarpatta within the folds of the federal democratic regime with accountability of elected representatives to the citizens.
Box 4.9Town Planning Scheme in GujaratThe TPS is a two-stage process with the two stages defined in the Gujarat Town Planning and Urban Development Act (GTPUDA) 1976 as a macro-planning stage and a micro-planning stage. The Development Authority draws up a statutory, decadal development plan (DP) for the city showing where it is expected to expand into the surrounding countryside. In these new expansion areas, which are usually mosaics of agricultural plots, a network of major roads and routes for trunk infrastructure is also drawn up. In the second stage, the expansion area is divided into a number of smaller areas usually between 1 and 2 sq. km each. The Development Authority takes up each of these smaller areas for the development of a TPS, which is a detailed land reconstitution, infrastructure development, and financing proposal rolled into one.
In Ahmedabad, the Sardar Patel Ring Road was developed in 2002, using the TPS. The proposed ring road was about 76 km long and 60 m wide. Typically, the right of way (RoW) for such roads is appropriated using the land acquisition method. The Ahmedabad Urban Development Authority (AUDA) has used a combination of minimal land acquisition and extensive use of the TPS mechanism. Under the latter, the AUDA proposed reconstitution of the land belonging to affected landowners and assured final plots in rectangular shape near the RoW of the ring road. Only 13.1 km of the total was acquired by the conventional land acquisition method where the TPS could not be declared, namely areas designated as ‛agricultural’ in the Master Plan. Land in an approximately 1 km-wide belt along the Ring Road was reorganised, creating this road. The AUDA spent Rs 130 crore from its own resources for development and obtained a loan of Rs 100 crores from a consortium of six nationalised banks. Out of the total land acquired, 60 per cent was returned to the landowners, 20 to 30 per cent used for the development of public amenities like roads, schools and gardens, and the rest sold as separate plots. Since the land value appreciated, the AUDA earned about Rs 600 crores from the sale of plots.
4.7.15 Legislation defining the ULBs e.g. Delhi Municipal Corporation Act and the Bombay Provincial Municipal Corporation Act or the Municipalities Act in Gujarat, should prescribe how, when, and who (within the ULB) should make the development plan. It should define a position for an urban planner within the ULB and the relationship of the planner with other functionaries and office holders within the ULB.
116
Report 2009-2010
116
Report on Indian Urban Infrastructure and Services
4.7.16 The vertical dimension of land is even more important. Floor space index (FSI) is one of the most abused terms in the Indian urban planning system, and the allocation of FSI in Indian cities is seldom made rationally. Restricted FSI and density norms have led to sprawling cities with spiralling costs of infrastructure development. Judicious use of FSI in the creation of ‛compact cities’ is extremely important. An examination of intra-city economic functions is needed in order to design appropriate policies to maximise efficiencies. This would require spatial planning that supports (and is not inimical to) economic efficiency and market responsiveness.
4.7.17 The Committee recommends the setting up of a High Powered Expert Committee to look into land market distortions and suggest legislative reforms and policy measures to make this market work so as to facilitate and accommodate the process of urbanisation which is imminent as India experiences rapid economic growth in the coming decades. The Government of India must also take the initiative to persuade state governments to amend their outdated revenue laws and make them relevant to contemporary times.
4.8 Inclusion and focus on the poor
4.8.1 An important area of planning which warrants special focus is housing for the poor. The housing needs of the poor and low income groups are not likely to be met by the play of market forces alone. But the solution also does not lie in the government engaging in building housing colonies for the poor. Better land management, good infrastructure, access to subsidised credit, and private players, all have a role in providing the solution. Financial sector reforms, coupled with innovations in project development and project management, can make the low income sector attractive to private players. Development of clarity in land titles will also have a big impact on housing for the low income population.
4.8.2 Master plans, with a 20-year perspective, are rather restrictive and do not address the housing problem of the poor effectively. There is need to have a re-look at the land-use model and allow mixed land use which could solve a part of the housing problem. Land along transport corridors could be used for housing the poor. This would provide them better access to transport.
4.8.3 Large private companies are already tapping the market potential at the bottom of the pyramid for a number of sectors, but the low income housing sector has not yet received due attention. New players are beginning to enter the market and substantial policy support will have to be provided to address the huge shortage of low income housing. Rental housing for low income groups must be encouraged. The Committee believes that an approach which creates an enabling environment for investing in low income housing will
117
Report 2009-2010
117
Report on Indian Urban Infrastructure
and Services
Source: Thirteenth Central Finance Commission.
help alleviate the shortage. PPPs should be explored to help manage the scale of the challenge.
4.8.4 Besides providing for urban services of universal standard norms for the entire urban population of India, the Committee recommends that certain funds be set aside for investing in re-zoning, re-planning, renewal, and redevelopment of urban areas where considerable efficiency and improvement to services can be effected through these efforts (set out in Chapter III). This will include schemes to redevelop slums. While the JNNURM provided for this, it has failed to implement the same. The proposed Committee on land reforms could also recommend how the allocation for redevelopment activities must be spent.
4.9 Fiscal reforms
4.9.1 Reforms in financial systems and accounting practices of ULBs become very important as ULBs gain more autonomy in the management of their resources and reach out to the markets for financing. Recognising the urgency of these reforms, the Thirteenth Central Finance Commission has offered performance grants to ULBs that are conditional on implementing a specific list of governance reforms (Box 4.10). The Committee strongly endorses these recommendations. It also believes that making a Market Worthiness Disclosure Statement in the public domain will help achieve the objective of pushing ULBs in the direction of reform.
Box 4.10Thirteenth Central Finance Commission Recommendations for Urban Local BodiesThe Thirteenth Central Finance Commission’s recommendations relating to local bodies aim at strengthening urban governance in India. The Commission allocated Rs 23,111 crore to ULBs – a quantum jump from the Rs 5000 crore allocated by the Twelfth Central Finance Commission. Making a departure from the previous Central Finance Commissions, the Thirteenth Central Finance Commission has divided the grants allocated to the local bodies into two components – general basic grant and general performance grant. The performance grant can be accessed by states only if they comply with the nine conditions stipulated by the Commission. A state government should:
Introduce a supplement to the budget incorporating plan-wise and non-plan-wise • classification of transfers to local bodies;Put in place an audit system for all local bodies;• Constitute an independent Local Body Ombudsman;• Electronically transfer grants provided by the Commission to local bodies in five days;• Prescribe through an Act qualifications of persons for appointment as members • of SFCs;Fully enable local bodies to levy property tax without hindrance;• Constitute a State Property Tax Board for assessing property tax;• Put in place standards for delivery of essential services; and• Require Municipal Corporations with more than a million population to put in place a • Fire Hazard Response and Mitigation Plan.
118
Report 2009-2010
118
Report on Indian Urban Infrastructure and Services
i. Financial reporting, disclosures, and audits
4.9.2 ULBs must adopt transparent budgeting practices based on double-entry bookkeeping, performance reporting, cost accounting, and auditing in order to be accountable to their citizens and also to become market-worthy so as to attract capital for investment.
4.9.3 The accrual-based accounting system is a mandatory reform for ULBs under the JNNURM, but only about 20 per cent of ULBs in India are implementing it (NIUA 2009). The Committee recommends that state governments make accrual-based double-entry accounting mandatory, and encourage ULBs to draw upon the Model Accounting System prepared by the Ministry of Urban Development, Government of India. Standardisation of financial statements and accounting practices will lower the costs of evaluating ULBs and facilitate comparison of city finances. Regular, timely, and standardised financial disclosures will help create a city information ecosystem for independent review and analysis by all stakeholders.
4.9.4 To meet the requirement of accessing capital markets and achieve greater transparency and public participation in decision making, the Committee proposes a Market Worthiness Disclosure Standard (MWDS), which should require cities to report data in a regular and timely manner in a Market Worthiness Disclosure Statement.
4.9.5 The Market Worthiness Disclosure Statement envisages the following reports to be prepared by ULBs and made available on their websites in a standardised format that enables easy comparison across ULBs and over time:
Cash flow statement, and key financial ratios;• Net revenue dynamics including economic data for predicting expenditures • and institutional arrangements that affect both revenue prospects and expenditure commitments; and City management capacity covering aspects like staff, institutional • framework, and information flow.
4.9.6 This will be in keeping with the provisions of the disclosure laws that have been enacted or are being enacted by states under the JNNURM. Initially, this should be enforced for all Municipal Corporations and over time, extended to ULBs of bigger towns as well.
4.9.7 The current status on ULB audits is that they are in a chronic state of arrears. The Committee strongly recommends that the state governments ensure that all ULBs conduct annual audits of their financial statements. Local fund audit is a very critical aspect of local administration.
119
Report 2009-2010
119
Report on Indian Urban Infrastructure
and Services
4.9.8 The Committee recommends the setting up of Local Fund Audit Commissions by state governments which, subject to transparent guidelines prescribed by the Comptroller and Auditor General of India (CAG), can provide for engagement of qualified chartered accountants for local fund audits, subject to payment of predetermined fees. The government auditors can compete with external chartered accountants or undertake audits where private sector chartered accountant firms are not forthcoming. In addition to external audits, systems of internal audit and performance audit must be put in place.
ii. Fiscal devolution
4.9.9 In the wake of the 74th Constitutional Amendment, SFCs have been set up by all state governments to spell out the principles for sharing/devolving a part of the revenue of the state government to local governments. The expectation was that SFCs will follow the worthy example of the Central Finance Commission which performs this task of devolution of funds from the Government of India to state governments, but this has not happened.
4.9.10 In order to improve the functioning of SFCs, the Thirteenth Central Finance Commission has proposed a template. The Committee endorses the use of the proposed template. It also emphasises the need for capacity building so that SFC recommendations are of high quality. This would require assistance from the Reform and Performance Management Cell of the Ministry of Urban Development, Government of India.

Chapter VFinancing UrbanInfrastructure

123
Report 2009-2010
123
Report on Indian Urban Infrastructure
and Services
5.1 Introduction
5.1.1 This chapter analyses how the projected investment requirements of Rs 39.2 lakh crore for urban infrastructure will be financed over the 20-year period from 2012-13 to 2031-32.1 Recognising that the focus of policy should be on provision of public services which flow from infrastructure assets and not merely on creating the assets, the Committee has highlighted the importance of operations and maintenance (O&M) for the upkeep of the assets. The O&M requirements for the new and the old assets are projected at Rs 19.9 lakh crore over the 20-year period. The Committee has emphasised the role of municipal personnel and also governance in the delivery of services. Establishment charges of urban local bodies (ULBs) are also projected for preparing a complete Revenue-Expenditure statement of municipal finances.
5.1.2 The Committee is of the view that financing capital expenditure in the urban sector cannot be analysed independently of the revenue expenditure of ULBs. The dividing line between the two kinds of expenditure is relatively thin, and it is better to analyse capital expenditure in the urban sector within a complete expenditure perspective while looking for sources to finance this expenditure.
5.1.3 A challenge in estimating and projecting capital expenditure in the urban sector from the municipal finance data arises from the fact that a significant proportion of this expenditure is incurred by parastatals and state government departments, and not by ULBs. The Committee has prepared an estimate of total investment in the urban sector in 2011-12 by putting together the evidence on capital spending by ULBs and by ‛other entities’.
5.1.4 Chart 5.1 presents the projections of total urban spending requirements including capital spending, O&M spending, and establishment charges of ULBs at 2009-10 prices for 2011-12 (the base year of the estimation exercise), 2021-22 (the mid-point of the period), and 2031-32 (the terminal year). Chart 5.2 presents the relative shares of the three components in the total spending. It conveys the enormity of the challenge by highlighting the very steep increases in the level of capital spending required over the period.
5.1.5 Of the very low level of capital spending projected for 2011-12, a substantial amount is by parastatals. If the recommendations of this Committee are followed, then capital spending by parastatals will be replaced with spending by ULBs. By 2021-22, the total expenditure of ULBs at 2009-10 prices will be almost three times as much as in 2011-12. Of this much larger 1 The explicit mandate of the Committee as set out in the Terms of Reference was to prepare the estimates
of investment needed in eight specified sectors. The methodology for preparing these estimates as well as the basis for scaling them up to arrive at an estimate of the total investment in urban infrastructure was presented in Chapter III. All estimates are at 2009-10 prices.
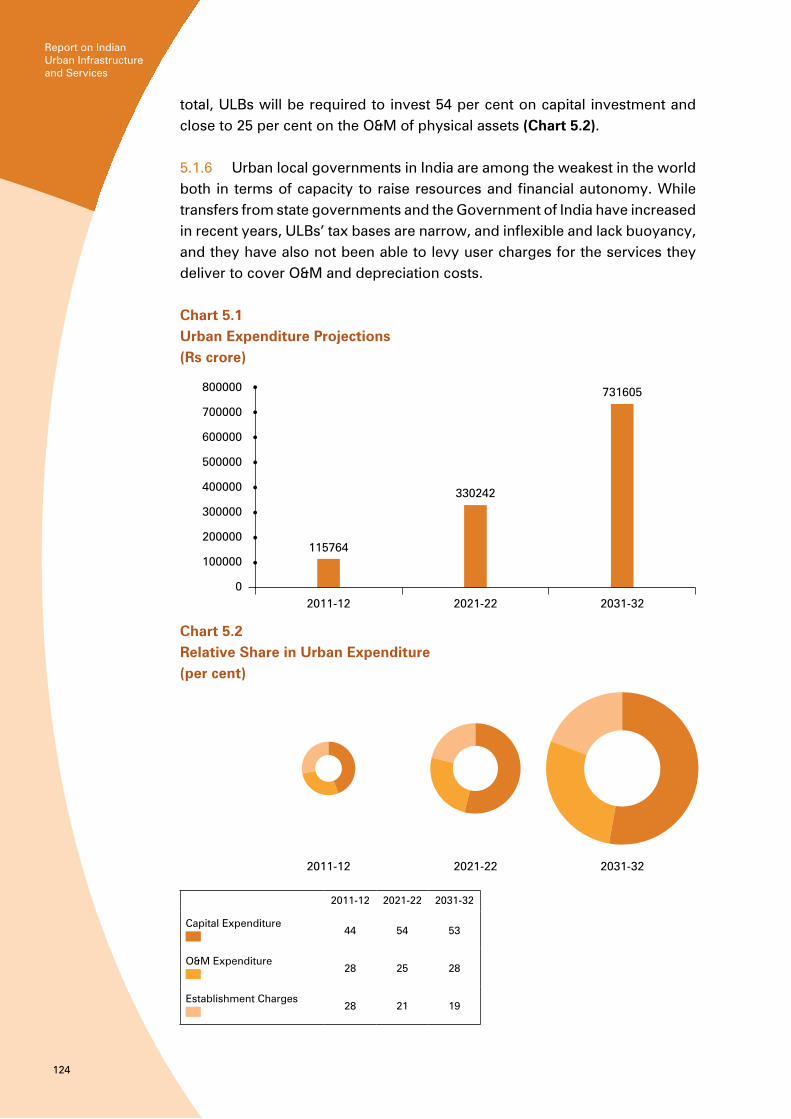
124
Report 2009-2010
124
Report on Indian Urban Infrastructure and Services
total, ULBs will be required to invest 54 per cent on capital investment and close to 25 per cent on the O&M of physical assets (Chart 5.2).
5.1.6 Urban local governments in India are among the weakest in the world both in terms of capacity to raise resources and financial autonomy. While transfers from state governments and the Government of India have increased in recent years, ULBs’ tax bases are narrow, and inflexible and lack buoyancy, and they have also not been able to levy user charges for the services they deliver to cover O&M and depreciation costs.
Chart 5.1Urban Expenditure Projections(Rs crore)
Chart 5.2Relative Share in Urban Expenditure(per cent)
800000
700000
600000
500000
400000
300000
200000
100000
02011-12
115764
330242
731605
2021-22 2031-32
2011-12 2021-22 2031-32
2011-12 2021-22 2031-32
Capital Expenditure44 54 53
O&M Expenditure28 25 28
Establishment Charges28 21 19
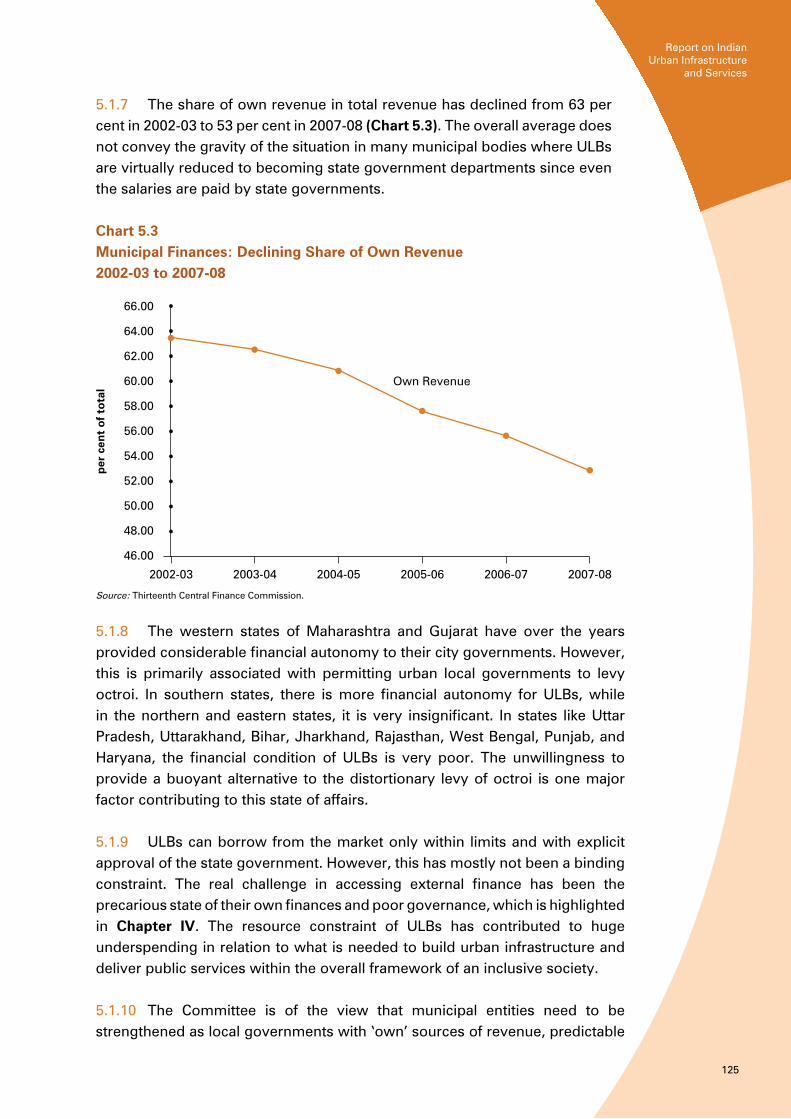
125
Report 2009-2010
125
Report on Indian Urban Infrastructure
and Services
5.1.7 The share of own revenue in total revenue has declined from 63 per cent in 2002-03 to 53 per cent in 2007-08 (Chart 5.3). The overall average does not convey the gravity of the situation in many municipal bodies where ULBs are virtually reduced to becoming state government departments since even the salaries are paid by state governments.
Chart 5.3Municipal Finances: Declining Share of Own Revenue 2002-03 to 2007-08
Source: Thirteenth Central Finance Commission.
per
cen
t o
f to
tal
66.00
64.00
62.00
60.00
58.00
56.00
54.00
52.00
50.00
48.00
46.002002-03 2003-04 2004-05 2005-06 2006-07 2007-08
Own Revenue
5.1.8 The western states of Maharashtra and Gujarat have over the years provided considerable financial autonomy to their city governments. However, this is primarily associated with permitting urban local governments to levy octroi. In southern states, there is more financial autonomy for ULBs, while in the northern and eastern states, it is very insignificant. In states like Uttar Pradesh, Uttarakhand, Bihar, Jharkhand, Rajasthan, West Bengal, Punjab, and Haryana, the financial condition of ULBs is very poor. The unwillingness to provide a buoyant alternative to the distortionary levy of octroi is one major factor contributing to this state of affairs.
5.1.9 ULBs can borrow from the market only within limits and with explicit approval of the state government. However, this has mostly not been a binding constraint. The real challenge in accessing external finance has been the precarious state of their own finances and poor governance, which is highlighted in Chapter IV. The resource constraint of ULBs has contributed to huge underspending in relation to what is needed to build urban infrastructure and deliver public services within the overall framework of an inclusive society.
5.1.10 The Committee is of the view that municipal entities need to be strengthened as local governments with ‛own’ sources of revenue, predictable
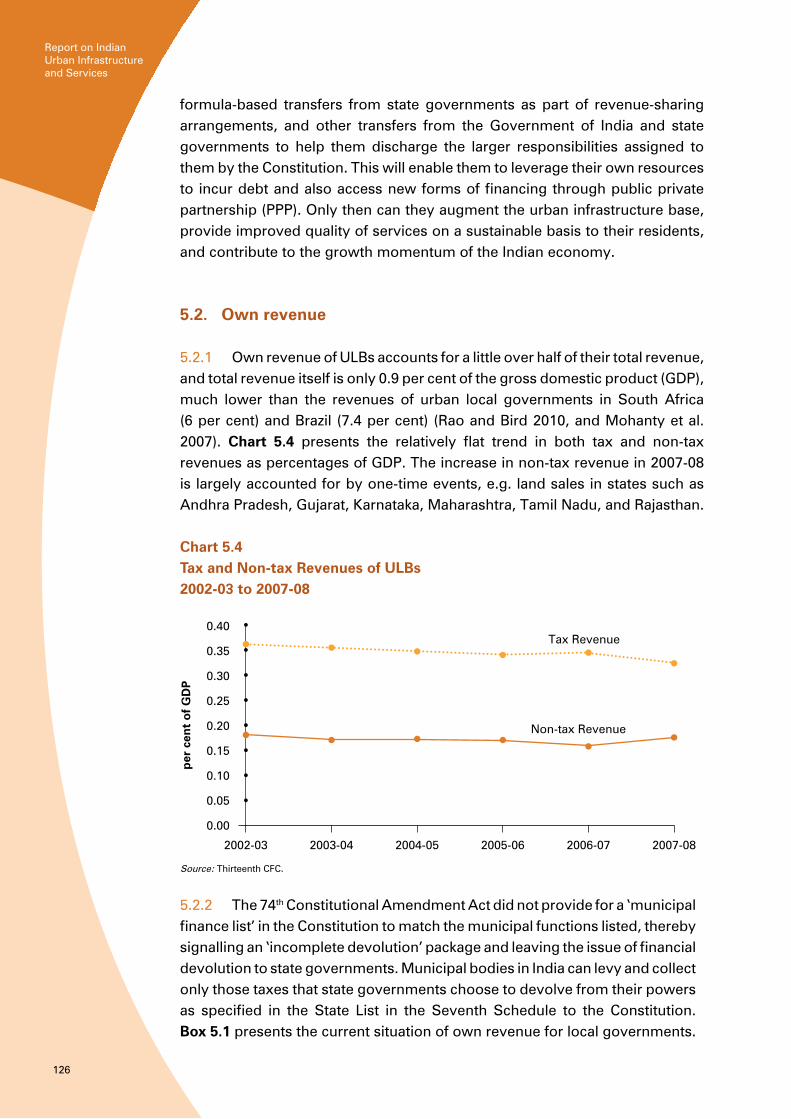
126
Report 2009-2010
126
Report on Indian Urban Infrastructure and Services
formula-based transfers from state governments as part of revenue-sharing arrangements, and other transfers from the Government of India and state governments to help them discharge the larger responsibilities assigned to them by the Constitution. This will enable them to leverage their own resources to incur debt and also access new forms of financing through public private partnership (PPP). Only then can they augment the urban infrastructure base, provide improved quality of services on a sustainable basis to their residents, and contribute to the growth momentum of the Indian economy.
5.2. Own revenue
5.2.1 Own revenue of ULBs accounts for a little over half of their total revenue, and total revenue itself is only 0.9 per cent of the gross domestic product (GDP), much lower than the revenues of urban local governments in South Africa (6 per cent) and Brazil (7.4 per cent) (Rao and Bird 2010, and Mohanty et al. 2007). Chart 5.4 presents the relatively flat trend in both tax and non-tax revenues as percentages of GDP. The increase in non-tax revenue in 2007-08 is largely accounted for by one-time events, e.g. land sales in states such as Andhra Pradesh, Gujarat, Karnataka, Maharashtra, Tamil Nadu, and Rajasthan.
Chart 5.4Tax and Non-tax Revenues of ULBs2002-03 to 2007-08
Source: Thirteenth CFC.
Tax Revenue
Non-tax Revenue
0.40
0.35
0.30
0.25
0.20
0.15
0.10
0.05
0.00
per
cen
t o
f G
DP
2002-03 2003-04 2004-05 2005-06 2006-07 2007-08
5.2.2 The 74th Constitutional Amendment Act did not provide for a ‛municipal finance list’ in the Constitution to match the municipal functions listed, thereby signalling an ‛incomplete devolution’ package and leaving the issue of financial devolution to state governments. Municipal bodies in India can levy and collect only those taxes that state governments choose to devolve from their powers as specified in the State List in the Seventh Schedule to the Constitution. Box 5.1 presents the current situation of own revenue for local governments.
127
Report 2009-2010
127
Report on Indian Urban Infrastructure
and Services
Box 5.1Own Revenue for Local GovernmentsIn most developing countries, central governments have been reluctant to confer powers of taxation on subnational governments. There are potentially sound and productive taxes that subnational governments could use: property taxes, personal income tax surcharges, taxes on the use of motor vehicles, payroll taxes, value-added taxes and local ‛business value’ taxes. But the subnational tax share in total taxes in developing countries is only about 10 per cent in comparison to 20 per cent in developed countries. These figures have changed little in the last 30 years.*
The present assignment of taxes in countries such as India, Brazil, Pakistan, and Russia is far from ideal. One common problem is that there is a significant vertical imbalance between expenditure and revenue, with consequent implications for autonomy, efficiency, and accountability. This, in turn, results in significant costs of administration and compliance as well as those arising from tax-induced inefficiencies in the allocation of scarce resources.
Important lessons can be learnt from developed countries. Local governments in the USA and Canada have almost complete autonomy in choosing any tax base as long as there is no interference with inter-state commerce. In Denmark and Sweden, local taxes account for nearly one-half of local government spending. Revenues from subnational government taxes in Switzerland are greater in amount than revenue received from grants. Japan introduced a local financial system reform called the ‛trinity reform’ in 2002, under which three reforms have been carried out as a package: (i) reform in the transfer of tax revenue sources from the central government to local governments, (ii) reform of the ‛national treasury subsidy and obligatory share’, and (iii) reform of local allocation tax.
5.2.3 The delegation of tax revenue powers has not been consistent with the expenditure needs of municipal bodies, thereby increasing the vertical fiscal imbalance.2 A devolution from state governments to ULBs in a structured and predictable manner is absolutely necessary if ULBs are to perform the functions that have been assigned to them by the 74th Amendment to the Constitution in 1992.
5.2.4 The Amendment introduced two features to strengthen the finances of ULBs: (i) a provision for the setting up of State Finance Commissions (SFC) every five years, and (ii) a requirement that the Central Finance Commission (CFC) suggest measures to augment the Consolidated Fund of states for supplementing the resources of ULBs on the basis of SFC recommendations.
5.2.5 The idea behind setting up SFCs and making recommendations every five years was to bring about certainty, clarity, and consolidation in the transfers to local governments. Certainty could be achieved through ensuring revenue sharing of taxes on goods and services. Clarity could be achieved if SFCs formulated more transparent, formula-based processes for sharing taxes.
* Calculated from International Monetary Fund (IMF), Government Finance Statistics Yearbook, various years, and from country studies (Bahl and Wallace 2005).Source: Bird and Bahl (2008).
2 A vertical fiscal imbalance occurs when the revenues of different levels of government do not match their expenditure responsibilities. This necessitates transfer payments from the overendowed party to the underendowed party, which is referred to as vertical fiscal equalisation.
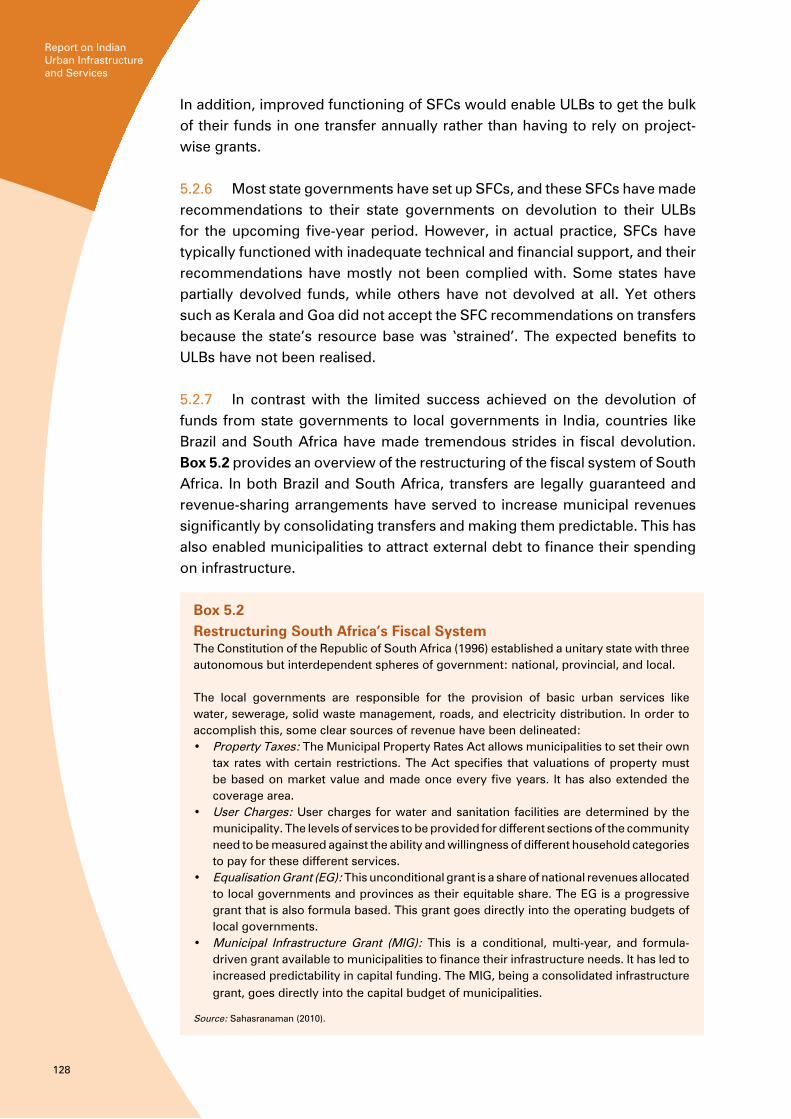
128
Report 2009-2010
128
Report on Indian Urban Infrastructure and Services
In addition, improved functioning of SFCs would enable ULBs to get the bulk of their funds in one transfer annually rather than having to rely on project-wise grants.
5.2.6 Most state governments have set up SFCs, and these SFCs have made recommendations to their state governments on devolution to their ULBs for the upcoming five-year period. However, in actual practice, SFCs have typically functioned with inadequate technical and financial support, and their recommendations have mostly not been complied with. Some states have partially devolved funds, while others have not devolved at all. Yet others such as Kerala and Goa did not accept the SFC recommendations on transfers because the state’s resource base was ‛strained’. The expected benefits to ULBs have not been realised.
5.2.7 In contrast with the limited success achieved on the devolution of funds from state governments to local governments in India, countries like Brazil and South Africa have made tremendous strides in fiscal devolution. Box 5.2 provides an overview of the restructuring of the fiscal system of South Africa. In both Brazil and South Africa, transfers are legally guaranteed and revenue-sharing arrangements have served to increase municipal revenues significantly by consolidating transfers and making them predictable. This has also enabled municipalities to attract external debt to finance their spending on infrastructure.
Box 5.2Restructuring South Africa’s Fiscal SystemThe Constitution of the Republic of South Africa (1996) established a unitary state with three autonomous but interdependent spheres of government: national, provincial, and local.
The local governments are responsible for the provision of basic urban services like water, sewerage, solid waste management, roads, and electricity distribution. In order to accomplish this, some clear sources of revenue have been delineated:
Property Taxes:• The Municipal Property Rates Act allows municipalities to set their own tax rates with certain restrictions. The Act specifies that valuations of property must be based on market value and made once every five years. It has also extended the coverage area.User Charges: • User charges for water and sanitation facilities are determined by the municipality. The levels of services to be provided for different sections of the community need to be measured against the ability and willingness of different household categories to pay for these different services.Equalisation Grant (EG):• This unconditional grant is a share of national revenues allocated to local governments and provinces as their equitable share. The EG is a progressive grant that is also formula based. This grant goes directly into the operating budgets of local governments.Municipal Infrastructure Grant (MIG):• This is a conditional, multi-year, and formula-driven grant available to municipalities to finance their infrastructure needs. It has led to increased predictability in capital funding. The MIG, being a consolidated infrastructure grant, goes directly into the capital budget of municipalities.
Source: Sahasranaman (2010).
129
Report 2009-2010
129
Report on Indian Urban Infrastructure
and Services
5.2.8 The Thirteenth CFC has made a bold recommendation in facilitating devolution of funds. It has recommended that funds be automatically transferred to local governments through a percentage of the divisible pool of taxes being converted into a grant-in-aid. Under this system, state governments should make an unconditional, consolidated, and formula-driven ‛basic’ grant available to all local governments. In addition, a conditional, consolidated, formula-driven ‛performance’ grant is proposed on the fulfilment of certain governance and financing reforms. Predictability of the basic grant encourages sound financial planning, while performance-linked grants provide an incentive to improve governance through reforms. 5.2.9 With a view to correcting the vertical imbalance in the functions and finances of ULBs and in line with the recommendations of the Thirteenth CFC, the Committee recommends strengthening of own revenues of ULBs through state governments sharing revenue with ULBs.
5.2.10 Within the existing provisions, some states are sharing the revenues from motor vehicle tax and stamp duty. The Committee recommends that all states follow this example and share their revenue derived from motor vehicle tax and stamp duty.
5.2.11 The Committee recommends more broad-based revenue sharing by states with ULBs through appropriate amendments of the Constitution/other measures so as to:
Insert a ‛Local Bodies Finance List’ (LBFL) along the lines of the Union and a. State Lists;3
Empower ULBs to exclusively levy property tax, profession tax, entertainment b. tax, and advertisement tax and retain the whole of their proceeds (hereinafter referred to as ‛exclusive taxes’).4 In case states continue to levy and collect profession tax or entertainment tax, then the entire revenues, net of collection cost, should be passed on to the ULBs;Constitutionally ensure sharing of a pre-specified percentage of revenues c. from all taxes on goods and services (including motor vehicle tax and stamp duty) which are levied by states to enable ULBs to meet their functional responsibilities assigned to them by the 74th Amendment (hereinafter collectively referred to as ‛revenue-shared taxes’);Provide for formula-based sharing of the divisible pool with the ULBs and d. also grants-in-aid to ULBs from the divisible pool for bridging, wherever necessary, horizontal fiscal imbalance;5 andProvide that the devolution in (c) above shall be on the basis of a formula e. designed by the SFC, taking into account the level of economic activity,
3 This list would cover Panchayati Raj Institutions (PRI) as well as the ULBs. An indicative Municipal Finance List is presented in Box 5.3.
4 If advertisement tax and entertainment tax are subsumed in the goods and service tax (GST), ULBs will cease to have the power to levy these taxes.
5 Divisible pool for this purpose shall be total taxes collected by the state, minus the amount of ‛revenue-shared taxes’ transferred to local bodies.
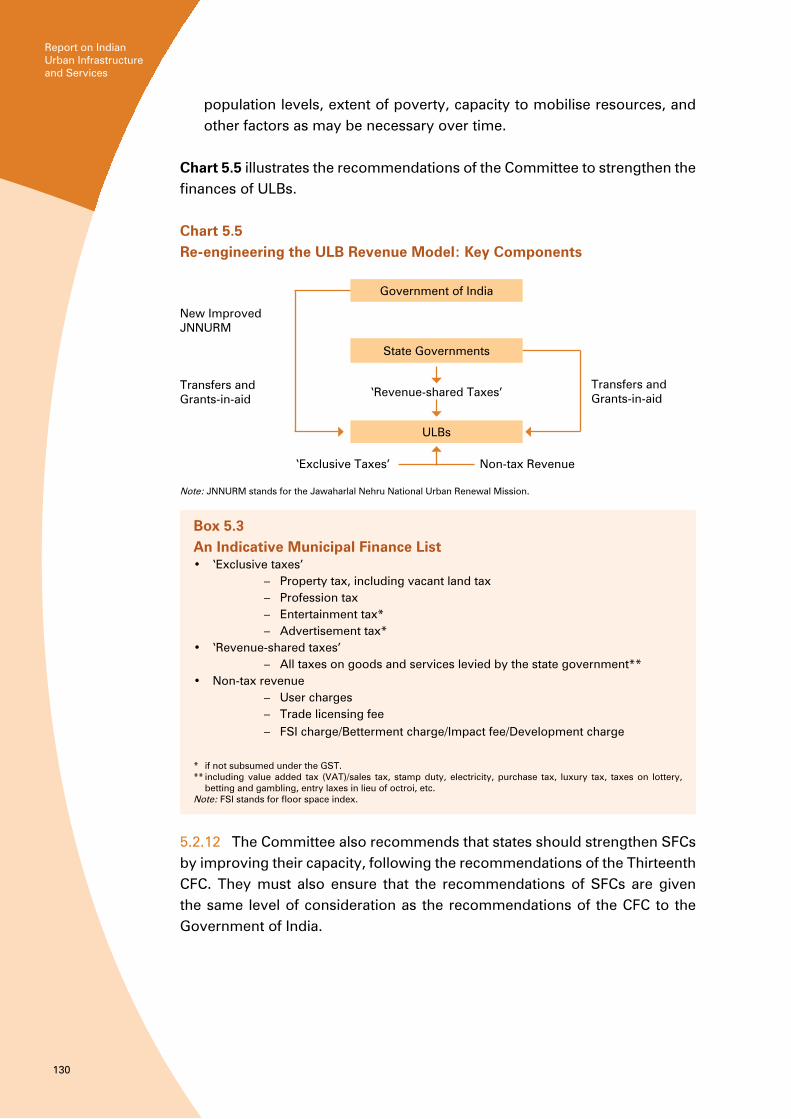
130
Report 2009-2010
130
Report on Indian Urban Infrastructure and Services
population levels, extent of poverty, capacity to mobilise resources, and other factors as may be necessary over time.
Chart 5.5 illustrates the recommendations of the Committee to strengthen the finances of ULBs.
Chart 5.5Re-engineering the ULB Revenue Model: Key Components
Government of India
New ImprovedJNNURM
Transfers and Grants-in-aid
Transfers and Grants-in-aid
‛Exclusive Taxes’ Non-tax Revenue
State Governments
‛Revenue-shared Taxes’
ULBs
Note: JNNURM stands for the Jawaharlal Nehru National Urban Renewal Mission.
Box 5.3An Indicative Municipal Finance List
‛Exclusive taxes’ • – Property tax, including vacant land tax – Profession tax – Entertainment tax* – Advertisement tax*
‛Revenue-shared taxes’• – All taxes on goods and services levied by the state government**
Non-tax revenue • – User charges – Trade licensing fee – FSI charge/Betterment charge/Impact fee/Development charge
* if not subsumed under the GST.** including value added tax (VAT)/sales tax, stamp duty, electricity, purchase tax, luxury tax, taxes on lottery, betting and gambling, entry laxes in lieu of octroi, etc.Note: FSI stands for floor space index.
5.2.12 The Committee also recommends that states should strengthen SFCs by improving their capacity, following the recommendations of the Thirteenth CFC. They must also ensure that the recommendations of SFCs are given the same level of consideration as the recommendations of the CFC to the Government of India.
131
Report 2009-2010
131
Report on Indian Urban Infrastructure
and Services
i. Tax revenues: ‛Exclusive taxes’ for ULBs
a. Property tax
5.2.13 Typically, the most important tax levied at local level is property tax. The responsibility of designing the property tax system in India rests with state governments, while ULBs are allowed to fix tax rates within a band and prepare a collection strategy. However, property tax is actually controlled by state governments. This effectively takes away the prime funding instrument from the control of the municipality as was evidenced in the last few years when Haryana and Rajasthan abolished/diluted their property tax in all cities of their states in two separate instances.6 The fact that states can take such a decision suddenly and arbitrarily, creates political risk that is damaging for the ULBs’ ability to access market finance.
5.2.14 Currently, property tax revenues in different states of India are in the range of 0.16 to 0.24 per cent of the GDP. By contrast, many developing countries collect around 0.6 per cent of the GDP from property taxes (Mathur et al. 2009).7 This tax has generally not realised its full potential in developing countries. While all efforts must be directed at realising its potential in India, it is important to recognise that property tax is a relatively income-inelastic tax. In developed countries like Canada and the US, property tax revenues reach up to 3 to 4 per cent of GDP (OECD 2010).
5.2.15 A recent study based on a survey of 36 largest cities in India shows that the major factors contributing to poor realisation from property tax are poor assessment rate (56 per cent of the properties covered), weak collection efficiency (37 per cent of the property tax demand raised), flawed methods for property valuation, loss on account of exemptions (11.7 per cent), and poor enforcement (Mathur et al. 2009).
5.2.16 The implementation of geographical information system (GIS) to map all properties in a city can significantly improve coverage as it provides the municipal administration with a visual spatial tool for identifying the location of all properties. Bangalore, Surat, Ahmedabad, Hyderabad, Delhi, and Mumbai have completed GIS mapping and are beginning to use it for property tax assessment, although it needs to be supplemented with an updated register of assessees, on which the progress is slow. The National Urban Information System (NUIS) under the Ministry of Urban Development is engaged in an effort to develop GIS maps of the scale of 1:10000 and 1:2000 and utility maps for 152 cities.
6 Punjab had agreed in December 2006 under the JNNURM to withdraw the exemption from property tax for self-occupied properties by December 2008 but did not do so.
7 If levied and collected efficiently, property tax could be an important source of revenue as shown by the Kalyan-Dombivili Municipality through a rational and comprehensive re-zoning exercise.
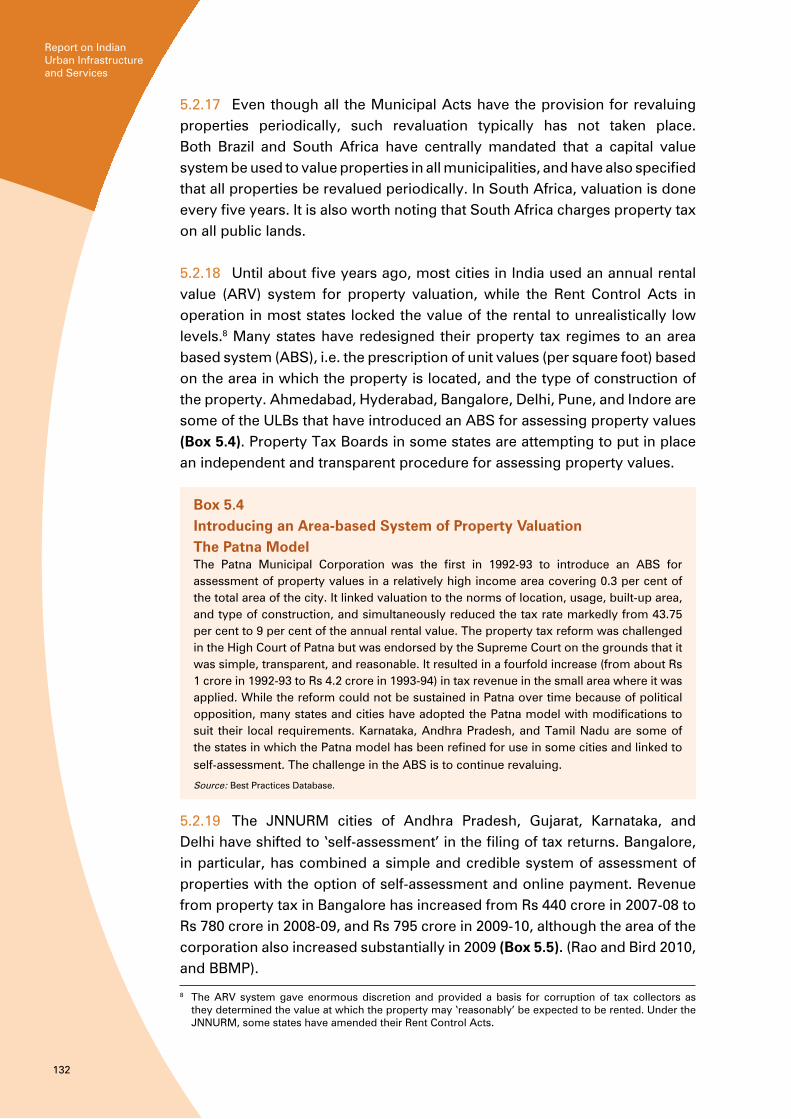
132
Report 2009-2010
132
Report on Indian Urban Infrastructure and Services
Source: Best Practices Database.
5.2.17 Even though all the Municipal Acts have the provision for revaluing properties periodically, such revaluation typically has not taken place. Both Brazil and South Africa have centrally mandated that a capital value system be used to value properties in all municipalities, and have also specified that all properties be revalued periodically. In South Africa, valuation is done every five years. It is also worth noting that South Africa charges property tax on all public lands.
5.2.18 Until about five years ago, most cities in India used an annual rental value (ARV) system for property valuation, while the Rent Control Acts in operation in most states locked the value of the rental to unrealistically low levels.8 Many states have redesigned their property tax regimes to an area based system (ABS), i.e. the prescription of unit values (per square foot) based on the area in which the property is located, and the type of construction of the property. Ahmedabad, Hyderabad, Bangalore, Delhi, Pune, and Indore are some of the ULBs that have introduced an ABS for assessing property values (Box 5.4). Property Tax Boards in some states are attempting to put in place an independent and transparent procedure for assessing property values.
Box 5.4Introducing an Area-based System of Property ValuationThe Patna ModelThe Patna Municipal Corporation was the first in 1992-93 to introduce an ABS for assessment of property values in a relatively high income area covering 0.3 per cent of the total area of the city. It linked valuation to the norms of location, usage, built-up area, and type of construction, and simultaneously reduced the tax rate markedly from 43.75 per cent to 9 per cent of the annual rental value. The property tax reform was challenged in the High Court of Patna but was endorsed by the Supreme Court on the grounds that it was simple, transparent, and reasonable. It resulted in a fourfold increase (from about Rs 1 crore in 1992-93 to Rs 4.2 crore in 1993-94) in tax revenue in the small area where it was applied. While the reform could not be sustained in Patna over time because of political opposition, many states and cities have adopted the Patna model with modifications to suit their local requirements. Karnataka, Andhra Pradesh, and Tamil Nadu are some of the states in which the Patna model has been refined for use in some cities and linked to self-assessment. The challenge in the ABS is to continue revaluing.
8 The ARV system gave enormous discretion and provided a basis for corruption of tax collectors as they determined the value at which the property may ‛reasonably’ be expected to be rented. Under the JNNURM, some states have amended their Rent Control Acts.
5.2.19 The JNNURM cities of Andhra Pradesh, Gujarat, Karnataka, and Delhi have shifted to ‛self-assessment’ in the filing of tax returns. Bangalore, in particular, has combined a simple and credible system of assessment of properties with the option of self-assessment and online payment. Revenue from property tax in Bangalore has increased from Rs 440 crore in 2007-08 to Rs 780 crore in 2008-09, and Rs 795 crore in 2009-10, although the area of the corporation also increased substantially in 2009 (Box 5.5). (Rao and Bird 2010, and BBMP).

133
Report 2009-2010
133
Report on Indian Urban Infrastructure
and Services
Box 5.5Property Tax Reform in BangaloreThe Bangalore City Corporation introduced the Optional Self-Assessment of Property Tax Scheme in the year 2000. Under this scheme, properties were classified into location zones based on the published guidance value notified by the Department of Stamps and Registration. For each zone, the rent per sq. ft was determined linking buildings to location, type, quality of construction, and age.
The city was divided into six land value zones. A street could fall in a zone in the municipal jurisdiction depending on the rental value assigned. Residential properties were divided into five categories, while non-residential properties were categorised into 11. The expected rents were predetermined for rented and self-occupied properties, depending on the zones. The City Corporation brought out a handbook containing guidelines on how any property was to be assessed; this increased transparency and efficiency. It also encouraged Resident Welfare Associations to assist in the implementation of the scheme.
The tax revenue yield increased by 33 per cent in 2001 reflecting an increase in the collection rates and coverage, as well as higher tax per property. About one-third of the increase was due to revision in value with taxpayers often paying as much as 2.5 times more than previously. Compliance costs decreased as taxpayers were willing to pay more for the simplification.
5.2.20 Vacant land tax, a variant of property tax, is not levied in most states of India but is commonly used internationally. Latin American countries, for example, levy about 3 per cent tax on capital value. While ULBs in some states of India are empowered to levy vacant land tax, in others there is no explicit legal provision for the levy of this tax. Experience of some states indicates that a tax rate of 0.5 to 1 per cent on capital value of vacant land could be a major source of financing trunk infrastructure which would, in turn, enhance the value of the vacant land. Such a tax will also promote housing if the tax rate on built-up land is lower than on vacant premises.
5.2.21 Most Municipal Acts include vacant land under the definition of property, and therefore vacant land tax can be levied even as a variant of property tax. Vacant land tax levied in Tamil Nadu varies from 0.7 to 2 per cent of the market value of the plot of land (Government of Tamil Nadu 1975). In Andhra Pradesh vacant land tax was reduced from 2 per cent of capital value to 0.5 per cent, but it still yields substantial revenue. The assessment can be made through a self-assessment procedure, as in the case of the Hyderabad Municipal Corporation. The Committee recommends vacant land tax as a major financing instrument for cities and towns.
5.2.22 The Committee recommends that time-bound comprehensive reform of property tax should be undertaken by all states. The key elements of the reform should be the following:
Property tax should be decomposed into a general tax and a service a. component. Property tax should be retained as a general benefit tax, and
Source: NIUA (2009).
134
Report 2009-2010
134
Report on Indian Urban Infrastructure and Services
its components such as water tax and sewerage tax should be replaced by appropriate ‛user charges’;Property tax should be levied on all immovable properties, i.e. constructed b. buildings and vacant land. Alternatively, the property tax on vacant land could be a separate tax termed ‛vacant land tax’. This will ensure that there is no perverse incentive to hoard land. Any reference to ‛property tax’ hereafter shall include ‛vacant land tax’;Property tax on constructed property should be levied under an ABS c. whereby there is a slab rate per square foot, based on location, type of construction, and type of use. However, vacant land tax should be levied on the basis of the ready-reckoner capital value;All government properties whether belonging to the Government of India, d. state governments, or any local body should form part of the tax base. In case of sovereign properties on which tax levy is not possible due to Constitutional embargo, appropriate service charges may be levied;9
The base for levying property tax should be revalued every five years. e. In the interim, some minimal annual indexation for inflation adjustment should be made to allow for a smooth transition to the new value of the property;ULBs should have the flexibility to fix the tax rate with respect to property f. tax on constructed buildings, subject to a floor specified under the law. This rate should not be changeable by state governments, though they can specify the rate band. The vacant land tax should be levied at a fixed rate of 0.5 per cent, i.e. one-half per cent of the ready-reckoner capital value; The Government of India should get the Indian Space Research g. Organisation (ISRO)/National Remote Sensing Agency (NRSA) to assist ULBs in implementing GIS mapping of all properties in the area of a ULB within a stipulated time frame. A large number of private firms are also available with the capabilities to develop services on this data base;An active and accurate register of taxpayers should be maintained to h. minimise leakages;Close coordination should be developed between the Revenue and Town i. Planning Departments so that buildings can be brought into the tax net soon after plan approval and completion;Tax assessment should be based on self-assessment and tax collection j. should be through online payment/computerised centres, e.g. eSeva in Hyderabad, and BangaloreOne in Bangalore;Service charges should be collected for the use of city services on k. unauthorised buildings on which property tax is not levied;Ward Committees and Area Sabhas should play a significant role in l. increasing compliance in property tax collections, as required by the Community Participation Law under the JNNURM. Community organisations
9 The 1954 Circular of the Ministry of Finance (subsequently amended) must be clarified to ensure that if a Government of India property avails of all municipal services in general, it shall pay 75 per cent of the aggregate of the property tax payable by a similar private property as service charges. If services are partly accessed, then the service charge shall be 50 per cent. In case no services are accessed, the Government of India will still be liable to pay 33 per cent towards contribution to general municipal services. However, central public sector undertakings (PSUs) do not come under this Constitutional protection.
135
Report 2009-2010
135
Report on Indian Urban Infrastructure
and Services
and Resident Welfare Associations should be incentivised by additional services or concessions for prompt payment of taxes; andA Property Tax Board should be set up in every state as recommended m. by the Thirteenth Finance Commission, to make recommendations for assessment and valuation of properties.
5.2.23 These measures should enable ULBs to substantially increase their property tax revenue from the current 0.2 per cent of GDP. The Thirteenth CFC came to the conclusion that ‛if all-India property assessment rates and collection efficiencies were both at 85 per cent, the revenues generated by property taxes would be around 0.68 per cent of GDP, compared with 0.2 per cent as of now.’ The recommendations of the Committee should help move the revenues from property tax in the right direction.
b. Profession tax
5.2.24 Profession tax is levied by 24 states. It is typically collected by state governments and reluctantly shared with ULBs. In Andhra Pradesh, a major share of the revenue from profession tax was passed on to local governments, but more recently, in a step that reduces the autonomy of municipalities, the state government took over salary payments of the municipalities and stopped sharing profession tax except with large municipal corporations. Gujarat has delegated the collection of profession tax to local bodies (except for government servants whose tax is deducted from their salaries) which retain 100 per cent of their collection. A number of states, e.g. Bihar, Kerala, and Rajasthan, have delegated levy of profession tax to ULBs. The Committee recommends that in cases where state governments collect profession tax, the proceeds net of administrative costs should entirely devolve to ULBs.
c. Entertainment tax
5.2.25 Entertainment taxes which include taxes on cinemas, amusement, and betting are mostly levied by state governments, and a portion of the revenue is transferred to ULBs. At all-India level, entertainment taxes yielded Rs 1080 crore in 2007-08. The Committee recommends that the entire collection from this tax net of collection charges should be passed on to ULBs, until the time it is subsumed under the GST.
d. Advertisement tax/fee
5.2.26 ULBs are empowered to levy taxes on advertisements excluding those in print or electronic media. In the light of India’s transition to a high-growth economy with much greater market orientation, advertising assumes a very important role, particularly in cities where the middle classes tend to converge. Beneficial both for the advertiser and the ULB, advertisement
136
Report 2009-2010
136
Report on Indian Urban Infrastructure and Services
tax/fee for public places is convenient to administer, and unlikely to face much opposition. Advertisement potential from urban transport infrastructure should also be tapped, especially in the larger cities. Bus stops, metro terminals, and corridors offer excellent scope for advertising. The Hyderabad Municipal Corporation witnessed unprecedented increase in its collection of advertisement fees by more than 230 per cent during the period 1998-2000, demonstrating the potential of this instrument for ULBs (Mohanty 2003).
5.2.27 The Committee recommends that the exclusive power to levy advertisement fees should rest with ULBs till such time that the GST is introduced. As and when the GST is introduced, the tax element of advertisement fees should be subsumed under it.
e. Octroi and entry taxes
5.2.28 Octroi was an important source of municipal revenue in many states of India. Since this tax is distortionary and is a hindrance to free inter-state trade and commerce, besides being a major source of corruption, all states except Maharashtra have abolished it.10 Some states have experimented with entry tax which is as much an impediment to internal trade.11 Even in the few cases where state governments have compensated ULBs for the loss of revenue from octroi, the payments have been too small and not indexed for inflation. The abolition of octroi simply increased the size of the unfunded mandates confronting municipal governments. State governments have not been able to find an alternative buoyant and non-distortionary source of revenue for ULBs.
5.2.29 The Report of the Committee on The Abolition of Octroi (1985), constituted by the then Ministry of Urban Development, Government of India, had recommended that ‛Octroi should be replaced with taxes, the incidence of which would be on the transport sector. The alternatives…include surcharge on sales tax, entry tax, terminal tax, road tax, tax on motor vehicles, etc. If the revenue realised on account of these taxes is inadequate, augmentation measures through property tax, entertainment tax, profession tax, etc. might be considered. If the revenue remains inadequate even after the imposition of these taxes, only then special grants-in-aid should be provided. Grants-in-aid should not be considered in isolation without augmentation of the tax base of local bodies as this would take away their initiative and autonomy.’ Subsequently, there has been a lot of discussion and debate, but no alternative to octroi has emerged.
5.2.30 In some states like Andhra Pradesh, entry tax has been declared unconstitutional by the High Court, and the state government has appealed 10 The experience of Maharashtra suggests that the yield from octroi for cities on average is two to three times
that from property tax. 11 Both octroi and entry tax are levies imposed on goods which are imported into a geographical area for
consumption. Octroi is collected at the entry point into the geographical area through physical control of vehicles, while the collection of entry tax is account-based and does not involve physical control.
137
Report 2009-2010
137
Report on Indian Urban Infrastructure
and Services
to the Supreme Court. At the same time, Orissa continues to levy entry tax. In Orissa in 2009-10, entry tax yielded Rs 802 crore which is about 10 per cent of the total yield of value added tax (VAT), entry tax, and central sales tax. Discussions with ULBs in Orissa suggest that they cannot function without entry tax which brings in revenues that are much larger than those from property tax. In Maharashtra, which is still levying octroi, the collection from octroi was Rs 9100 crore – about 30 per cent of the VAT collection which amounted to Rs 32,153 crore in 2009-10.
5.2.31 The Committee is of the view that both octroi and entry tax are undesirable and distortionary and therefore need to be completely abolished in all states. However, ULBs in India need to be provided access to an alternate major source of revenue which would adequately compensate them for the revenue loss on account of such abolition. The Committee’s recommendations on ‛revenue-shared taxes’ in the subsequent section will serve this purpose. Moreover, subsequent SFCs will have to ensure further sharing of revenue with ULBs so as to help them finance their increasing responsibilities as they drive the growth momentum and meaningfully discharge their constitutionally assigned functional responsibilities. The implementation of these recommendations will significantly augment the own revenue of ULBs.
5.2.32 Federal countries usually have tax handles other than property tax. Indian cities have to be endowed with a second major tax source in addition to property tax if cities are to act as engines of economic growth. This could be achieved through appropriate constitutionally guaranteed revenue sharing of state governments’ taxes on goods and services. The Committee’s recommendations on revenue sharing are set out in para 5.2.11.
ii. Tax revenues: Other taxes
a. Motor vehicle tax
5.2.33 Motor vehicle tax was a tax levied by local bodies in many states. Subsequently, partly because of challenges in collection, it was taken over by state governments and the proceeds were shared with local bodies. In the absence of any constitutional mandate, gradually the sharing also stopped. The Report of the Committee on the Abolition of Octroi on sharing motor vehicle tax with ULBs was largely ignored. While motor vehicle tax in almost all the states is with the state government, only Andhra Pradesh, Karnataka, and West Bengal share the tax with local bodies. The erosion of tax revenue suffered by ULBs on this account should be reversed by all states sharing motor vehicle tax revenue with ULBs.
138
Report 2009-2010
138
Report on Indian Urban Infrastructure and Services
b. Stamp duty
5.2.34 Stamp duty on registration of land/property is levied by state governments and shared with ULBs in some states. Under the reform agenda of the JNNURM, state governments are required to reduce stamp duty to 5 per cent. While some states have abolished property tax levied by ULBs, they continue to derive significant revenues from stamp duty on transfer of property. The Committee recommends that, in any case, a major portion of the stamp duty should be devolved to ULBs because it is their activities towards developing infrastructure which lead to increases in land values and consequently to registration of land and property, on which stamp duty is charged.
iii. Tax revenues: ‛Revenue-shared taxes’
5.2.35 International experience of reforming countries like Brazil, Colombia, and South Africa suggests that the scope for municipal-level economic participation is much higher in these countries than in India. As the Committee’s Report has shown, there is a very large urban infrastructure deficit in India, which has to be covered by ULBs in the next two decades. While their own revenues must be strengthened, states should also make substantial resources available to them.
5.2.36 At present, the power to levy taxes on goods and services is fragmented across levels of government, and across the production and distribution chain of goods and services. The powers are derived by the Government of India and state governments from the Union List and State List of the Seventh Schedule to the Constitution respectively.
5.2.37 The principal taxes on goods and services levied by the Government of India are excise duties, service tax, customs duty, additional customs duty, and a number of surcharges and cesses. Similarly, the principal taxes levied by states are VAT/sales tax (including central sales tax and purchase tax), stamp duty, taxes on vehicles, goods and passengers, and on electricity, entertainment, entry taxes not in lieu of octroi, purchase tax, luxury tax, taxes on lottery, betting and gambling, and a number of cesses and surcharges.
5.2.38 The Government of India and the states are currently negotiating the contours of a harmonised comprehensive domestic consumption tax in the nature of a dual GST, to be levied over a common base. The GST base will include all goods and services and will subsume within its fold all prevailing taxes on goods and services (other than customs duty and taxes on ‛sin’ goods) levied by the Government of India. Similarly, all taxes on goods and services (other than those on ‛sin’ goods) which are levied by state governments will be subsumed under the GST either immediately or in a phased manner.
139
Report 2009-2010
139
Report on Indian Urban Infrastructure
and Services
5.2.39 There is no constitutional mandate for sharing of states’ own tax revenues with local bodies except on the basis of the recommendations of SFCs. As stated earlier, while state governments have set up SFCs, their technical capacity needs to be strengthened. Their recommendations have by and large remained unimplemented thereby thwarting the mechanism for correcting the vertical fiscal imbalance. Therefore, providing a predictable and stable ‛own’ source of revenue to the third tier of government is extremely critical for sustainable development and institutional capacity building at grassroots level.
5.2.40 The Committee recommends that local bodies (both Panchayats and ULBs) should be partners in constitutionally guaranteed revenue sharing with the states with respect to revenues arising from taxes on all transactions in goods and services levied by states, irrespective of the form of such taxes.12
The recommendation is spelt out in para 5.2.11.
5.2.41 The Committee’s recommendations will provide a stream of additional revenue to ULBs for financing their much needed urban infrastructure as well as for the New Improved JNNURM (NIJNNURM), where ULBs have to contribute their share, in addition to the funds provided by the Government of India. These revenue streams, coupled with the institutional and public management reforms outlined in other chapters, would dramatically improve the prospects for better service delivery and bridge the urban infrastructure deficit. However, the Committee is also of the view that the administrative capacity of ULBs will need to be significantly strengthened in order to effectively absorb these revenue flows.
iv. Non-tax revenues: User charges and fees
5.2.42 If own tax revenues of ULBs are much below their potential, the performance with respect to user charges is as bad if not worse. The core local financing principle suggests that users, beneficiaries, polluters, and congesters pay. User charges are the first-best instruments for meeting the cost of public services. User charges for the services delivered by ULBs in India are far below their operating costs. Since municipal finances cannot bear this subsidy, it results in poor service delivery and inadequate maintenance, thus decreasing asset life and adding to the pressures for further asset creation.
5.2.43 The fundamental importance of user charges for municipal finances cannot be overstressed. Urban services such as water supply, sewerage, and garbage collection require not only major investments in urban infrastructure assets but also regular maintenance for efficient operation 12 In case of an agreement on GST between the Government of India and state governments, the Committee’s
recommendations with respect to revenue sharing will translate into a sharing in the revenue from the GST for all local bodies including ULBs.
140
Report 2009-2010
140
Report on Indian Urban Infrastructure and Services
and effective delivery. User charges for these services ensure that the assets are maintained and delivery of services sustained. Because the services are delivered directly to households, and there are no ‛spillover’ effects, levying user charges is eminently desirable. Given the proximity to the population and the predominance of ‛private good’ characteristics of many of these services, levying user charges on the beneficiaries is also feasible. User charges are especially important as they signal to consumers the scarcity value of the services and to service providers the quantum of demand that needs to be met. But user charges have typically not been used by ULBs in India to cover costs.
5.2.44 A study by Mohanty et al. (2007) shows that cost recovery was higher in cities in which the estimated normative underspending was lower. There are various potential explanations for the correlation, but it is not unreasonable to find that poor service quality is associated with low cost recovery. While periodic revisions in user charges are required in order to recover the costs incurred in service provision, this needs to be accompanied by perceptible improvements in service delivery in order to ensure that the fee increase is palatable to the paying public.
5.2.45 In practice, user charges cover less than 50 per cent of the O&M cost of basic infrastructure services in India, on an average (Table 5.1). Tariffs for water supply and sewerage have remained largely unchanged since 2005. The situation is even worse where solid waste management is concerned. Information available under the JNNURM indicates that only eight cities, i.e. Vishakhapatnam, Nashik, Pune, Greater Mumbai, Chennai, Coimbatore, Bangalore, and Madurai, have achieved cost recovery of O&M for water supply and sewerage services, while only six cities, i.e. Vishakhapatnam, Hyderabad, Nashik, Pune, Greater Mumbai, and Chennai, have achieved full cost recovery of O&M in solid waste management services (Table A25, Appendix A).
5.2.46 In recent years, there have been examples of projects where user charges were raised to cover costs and this has been combined with better delivery of services. The pilot project of 24x7 water in Gulbarga, Karnataka, is a good example of upward tariff revision. All houses in the project demonstration area were metered, a continuous water supply network was established, and a pricing system relating the tariff to the volume of water consumption was put in place. For the first six months of the operation of the pilot project, customers received their bills based on actual consumption but were allowed to pay the fixed charge that they were paying in the earlier regime. After they were convinced that the new charge was lower than the earlier cost paid by them, including the fixed charge, and after experiencing the superior service of a continuous water supply system, the customers willingly accepted the new system of consumption-based payments. In another example, the city
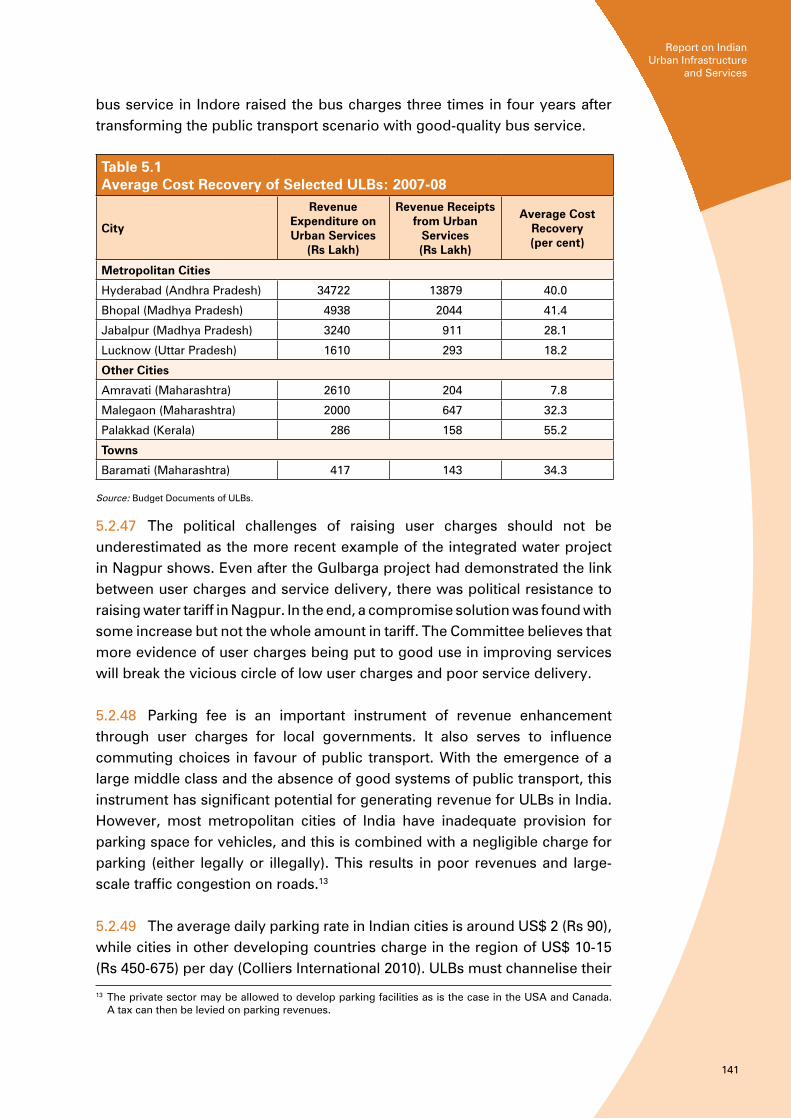
141
Report 2009-2010
141
Report on Indian Urban Infrastructure
and Services
bus service in Indore raised the bus charges three times in four years after transforming the public transport scenario with good-quality bus service.
13 The private sector may be allowed to develop parking facilities as is the case in the USA and Canada. A tax can then be levied on parking revenues.
Table 5.1Average Cost Recovery of Selected ULBs: 2007-08
City
Revenue Expenditure on Urban Services
(Rs Lakh)
Revenue Receipts from Urban
Services(Rs Lakh)
Average Cost Recovery (per cent)
Metropolitan Cities
Hyderabad (Andhra Pradesh) 34722 13879 40.0
Bhopal (Madhya Pradesh) 4938 2044 41.4
Jabalpur (Madhya Pradesh) 3240 911 28.1
Lucknow (Uttar Pradesh) 1610 293 18.2
Other Cities
Amravati (Maharashtra) 2610 204 7.8
Malegaon (Maharashtra) 2000 647 32.3
Palakkad (Kerala) 286 158 55.2
Towns
Baramati (Maharashtra) 417 143 34.3
Source: Budget Documents of ULBs.
5.2.47 The political challenges of raising user charges should not be underestimated as the more recent example of the integrated water project in Nagpur shows. Even after the Gulbarga project had demonstrated the link between user charges and service delivery, there was political resistance to raising water tariff in Nagpur. In the end, a compromise solution was found with some increase but not the whole amount in tariff. The Committee believes that more evidence of user charges being put to good use in improving services will break the vicious circle of low user charges and poor service delivery.
5.2.48 Parking fee is an important instrument of revenue enhancement through user charges for local governments. It also serves to influence commuting choices in favour of public transport. With the emergence of a large middle class and the absence of good systems of public transport, this instrument has significant potential for generating revenue for ULBs in India. However, most metropolitan cities of India have inadequate provision for parking space for vehicles, and this is combined with a negligible charge for parking (either legally or illegally). This results in poor revenues and large-scale traffic congestion on roads.13
5.2.49 The average daily parking rate in Indian cities is around US$ 2 (Rs 90), while cities in other developing countries charge in the region of US$ 10-15 (Rs 450-675) per day (Colliers International 2010). ULBs must channelise their
142
Report 2009-2010
142
Report on Indian Urban Infrastructure and Services
efforts towards introducing parking facilities which are appropriately priced and enforce the regime of parking charges, thereby also shifting commuter choice towards public transport in line with the National Urban Transport Policy. PPPs can play an important role in creating and maintaining better parking infrastructure, particularly in the central business districts of major metropolitan cities. 5.2.50 Congestion pricing under Indian conditions may not be feasible.
14 International experience indicates that cities which have efficient and integrated public transport systems have considered the economic pricing route of managing travel demand. Given the low levels of public transport in Indian cities, it is imperative that at least one alternative public transport system be put in place, before considering pricing mechanism to manage travel demand.
However, it may be desirable to have a city surcharge on motor vehicle tax to discourage private transportation.14
5.2.51 Almost all ULBs in India have been levying trade licensing fees under their municipal laws. Collections from trade licensing fee in municipal corporations like Hyderabad indicate that this fee could be a major source of non-tax revenue for ULBs.
5.2.52 The Committee recommends the following with respect to user charges:
Where services can be measured and beneficiaries identified, user a. charges must apply rather than taxes. Where beneficiaries are not easily identifiable or benefits not easily measured, the cost of services should be recouped through a surrogate tax on an appropriate base. Therefore, water charges should be levied separately rather than built into the property tax. Similarly, sewerage charges should be collected separately and not built into the property tax; User charges should be so structured as to meet O&M cost, debt servicing, b. and depreciation towards the cost of the project. In addition, they must also generate some surplus to enable building the equity base of ULBs, supported, where appropriate, with viability gap funding (VGF);Since ULBs have to get the approval of state governments for levying c. user charges, this limits their autonomy and has an adverse impact on their ability to deliver urban services. The Committee recommends that the Municipal Service Regulator be assigned the responsibility of revising user charges regularly. Even when different segments of the population are charged differently, the cross-subsidisation should be such that the overall O&M cost is recovered and a minimal surplus generated. Automatic indexation will ensure smooth increase over time without the challenge of having to defend cumulative adjustment every few years;To enhance revenue streams and promote the use of public transport, d. ULBs should introduce parking fees; andTrade licensing fee should be collected on the basis of a self-e. assessment return.

143
Report 2009-2010
143
Report on Indian Urban Infrastructure
and Services
5.2.53 Strengthening their own revenue base is absolutely essential for all classes of cities. Cities must work towards ensuring that their user charges cover their O&M expenses plus return on capital. Given the lumpy nature of investment, there may be cases which require VGF-type support. The ability to build a stable internal revenue base is crucial for the feasibility of tapping external sources of funding. In the current scenario, there are very few cities that are able to do this. Certain investments at municipal level, such as slum upgradation, urban roads, sewerage networks, waste water treatment, and sanitary landfills will require at least partial subsidies to ensure that these investments with significant externalities are not squeezed out at the expense of more easily bankable investments. It is essential that states create programmes for subsidising priority investments and that these subsidies be delivered in a form that is easy to access for smaller cities and towns with weak technical and financial capacity. Dedicated municipal funds with government support have been used in this way in most European countries during their urban transitions.
5.3 Inter-governmental transfers
5.3.1 Even after correcting the vertical fiscal imbalance, there will remain horizontal fiscal imbalance between different local entities, e.g. fiscal disability arising from poor taxable capacity, large presence of the poor/slum dwellers in some jurisdictions necessitating disproportionately larger transfers for these jurisdictions, historic backlog in infrastructure and service provision, and difficult geographic terrain, which would require intervention through transfers. Inter-jurisdictional spillovers of costs and benefits also justify transfers. Transfers from SFCs and the CFC will be needed to address horizontal imbalance, and correcting new vertical imbalances arising with the passage of time.
5.3.2 Cities are the engines of economic growth; vibrant cities will not only contribute to inclusive growth but will be vital for augmenting the exchequers of central and state governments for national development including rural development. Inter-governmental transfers not only play an important role in ensuring a national minimum standard of public services, eradicating poverty, and reducing regional disparities, but they can also play an important role in urban development through facilitating the development of city, peripheral and inter-city infrastructure.
5.3.3 The key principles for a good inter-governmental transfer system for local governments include the following:
Local governments must be an integral part of revenue mobilisation a. (the Committee has tried to address this through the concept of ‛exclusive taxes’).
144
Report 2009-2010
144
Report on Indian Urban Infrastructure and Services
Local governments should have clearly defined responsibility, performance b. framework, and accountability.Medium-term expenditure and revenue frameworks should be put in place c. for all ULBs.The quantum and frequency of inter-governmental transfers should d. be predictable.Increased transfers must be matched by a local contribution – however e. small that contribution may be in the poorest communities – so that the full efficiency benefits of decentralisation are realised.Transfers, while aiming for inter-jurisdictional equity, should not bail out f. the incompetent and the irresponsible. Hard budget constraint should be the rule.
5.3.4 The Committee recommends that regardless of the revenue adequacy or otherwise of ‛exclusive taxes’ and ‛revenue-shared taxes’ of local bodies, the states should continue to set up SFCs every five years to recommend a formula-based devolution, and grants-in-aid.
5.3.5 Even after allowing for transfers through the CFC and SFCs, there is need at this juncture for the Government of India to use additional transfers as mechanisms for helping speed up the process of development, rejuvenation, and renewal of the cities and towns of India.
5.3.6 Given the national role of cities in hosting and promoting rapid economic growth, improving rural development prospects, and augmenting the exchequers of the Government of India as well as state governments through tax resources, the Committee is of the view that the task of meeting the growing needs of a resurgent economy and an expanding urban sector accommodating almost 300 million additional population in the next two decades cannot just be left to the existing municipal entities. The Government of India should put in place a New Improved JNNURM (NIJNNURM), which builds on the success of the JNNURM of the past 5-6 years and presents a new design which is programme-based rather than project-based and outcome-linked rather than being stuck in streamlined procedures. There is need for a strong partnership between city, state and national governments in building a modern urban India that is economically productive, socially just, and environmentally sustainable.
5.3.7 In the Committee’s view, transfers from the Government of India should be in the nature of (i) support for poverty alleviation, and (ii) strategic intervention for urban development aimed at inclusive growth. In the latter category, the Committee recommends a New Improved JNNURM as proposed in Chapter I. The New Improved JNNURM (NIJNNURM) should amount to 0.25 per cent of GDP per year, over the 20-year period. The Committee recommends that 5 per cent of the NIJNNURM funding be directed towards
145
Report 2009-2010
145
Report on Indian Urban Infrastructure
and Services
capacity building. This would still leave at least half of the capacity building requirement of the investment programme to be funded by state governments, ULBs, and the private sector.
5.4. External finance
5.4.1 Almost all Municipal Acts in India impose restrictions on the power of ULBs to borrow funds. These laws make it mandatory for ULBs to balance their current budgets and seek permission of the state government before borrowing. These permissions are project-based and are granted on an ad hoc basis.
5.4.2 Recognising the enormous financing requirements of urban infrastructure, the Government of India has launched a few initiatives in recent years for funding and facilitating market engagement in infrastructure.15 As discussed in Chapter I, ‛promotion of public private partnership’ was one of the objectives of the JNNURM. Another initiative was the Pooled Finance Development Fund (PFDF) which aims to catalyse the municipal bond market for the ULB sector. However, a number of regulatory and policy constraints continue to restrict both the demand and supply aspects of debt financing and PPPs in India.
i. Debt financing
5.4.3 Debt financing has the advantage of bringing an element of discipline to the service provider. With an obligation to repay, ULBs are compelled to judiciously plan, design, and execute projects that can maximise revenues, minimise O&M cost, and generate a surplus over the O&M cost in a sustained manner throughout the lifespan of an asset. Grants, on the other hand, tend to impose soft budget constraints, thereby encouraging profligacy.
5.4.4 The market for municipal bonds in India is almost non-existent unlike countries such as the US where this is the principal mode of financing urban infrastructure. Developing countries like South Africa, Hungary, Russia, and Mexico also have relatively well developed municipal bond markets. By contrast, the municipal bond market in India has been marked by very modest borrowing levels, which have further stagnated or declined over the past 5-6 years. One of the possible reasons for this could be the easy availability of ‛soft money’ route for project financing through the JNNURM.
15 The Model Municipal Law has made a provision for framing by the state government of a Comprehensive Debt Limitation Policy applicable in case of loans to be raised by the Municipalities, laying down inter-alia, the general principles governing the raising of loans, the limit of loans which any Municipality may raise in regard to its financial capacity, the rate of interest to be paid for such loans, and the terms and conditions including the period of repayment thereof.
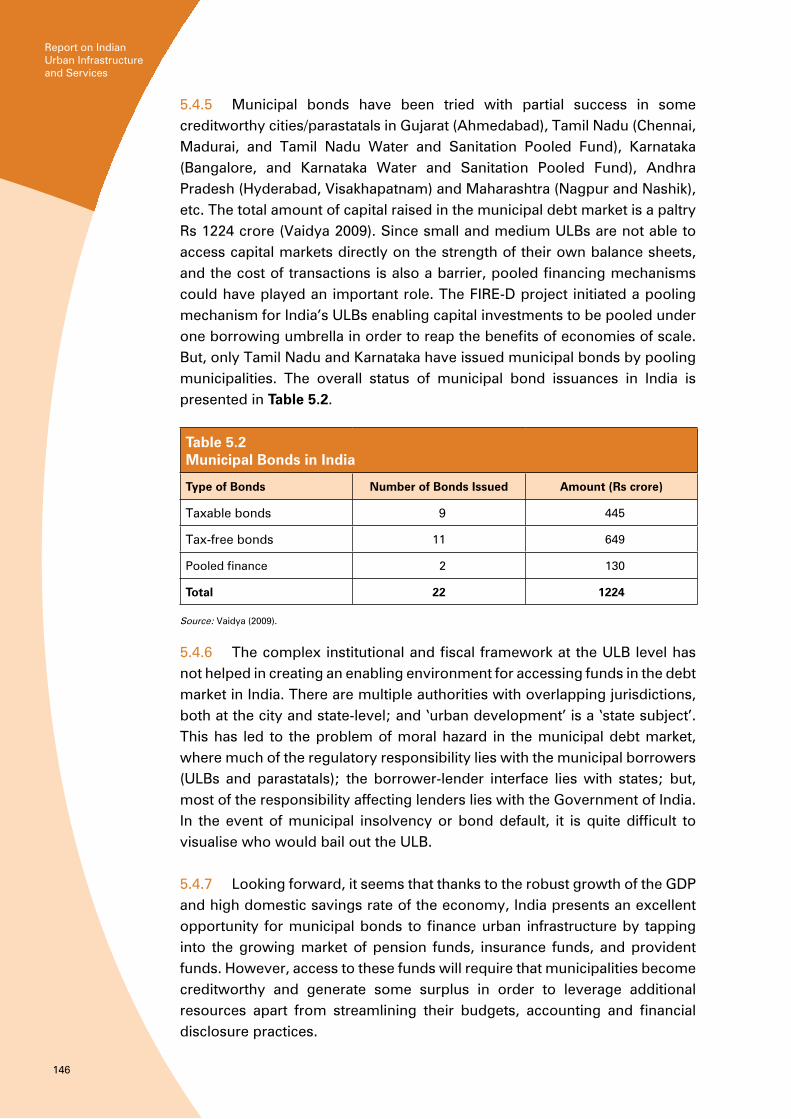
146
Report 2009-2010
146
Report on Indian Urban Infrastructure and Services
5.4.5 Municipal bonds have been tried with partial success in some creditworthy cities/parastatals in Gujarat (Ahmedabad), Tamil Nadu (Chennai, Madurai, and Tamil Nadu Water and Sanitation Pooled Fund), Karnataka (Bangalore, and Karnataka Water and Sanitation Pooled Fund), Andhra Pradesh (Hyderabad, Visakhapatnam) and Maharashtra (Nagpur and Nashik), etc. The total amount of capital raised in the municipal debt market is a paltry Rs 1224 crore (Vaidya 2009). Since small and medium ULBs are not able to access capital markets directly on the strength of their own balance sheets, and the cost of transactions is also a barrier, pooled financing mechanisms could have played an important role. The FIRE-D project initiated a pooling mechanism for India’s ULBs enabling capital investments to be pooled under one borrowing umbrella in order to reap the benefits of economies of scale. But, only Tamil Nadu and Karnataka have issued municipal bonds by pooling municipalities. The overall status of municipal bond issuances in India is presented in Table 5.2.
Table 5.2Municipal Bonds in India
Type of Bonds Number of Bonds Issued Amount (Rs crore)
Taxable bonds 9 445
Tax-free bonds 11 649
Pooled finance 2 130
Total 22 1224
Source: Vaidya (2009).
5.4.6 The complex institutional and fiscal framework at the ULB level has not helped in creating an enabling environment for accessing funds in the debt market in India. There are multiple authorities with overlapping jurisdictions, both at the city and state-level; and ‛urban development’ is a ‛state subject’. This has led to the problem of moral hazard in the municipal debt market, where much of the regulatory responsibility lies with the municipal borrowers (ULBs and parastatals); the borrower-lender interface lies with states; but, most of the responsibility affecting lenders lies with the Government of India. In the event of municipal insolvency or bond default, it is quite difficult to visualise who would bail out the ULB.
5.4.7 Looking forward, it seems that thanks to the robust growth of the GDP and high domestic savings rate of the economy, India presents an excellent opportunity for municipal bonds to finance urban infrastructure by tapping into the growing market of pension funds, insurance funds, and provident funds. However, access to these funds will require that municipalities become creditworthy and generate some surplus in order to leverage additional resources apart from streamlining their budgets, accounting and financial disclosure practices.
147
Report 2009-2010
147
Report on Indian Urban Infrastructure
and Services
5.4.8 A clearly defined fiscal and regulatory framework, adequate capacity at the local level and commercially viable projects are also essential to develop an active market for municipal bonds. The Committee is of the view that the proposed municipal financing framework including ‛revenue-shared taxes’ will provide the contours of a robust fiscal framework. On the capacity building front, the proposed Reform and Performance Management Cell should facilitate dialogue between state governments and ULBs with principal players to build the debt market. The proposed Ministry of Urban Affairs and Housing will have to lead an urgent, time-bound initiative of putting in place a regulatory framework for building the municipal bond market.
5.4.9 The Committee recommends that:A Government of India led initiative be launched for creating a ‛Regulatory a. Guidelines Handbook for Municipal Borrowings’ through consultations with key stakeholders, within the next one year, dealing with:
Regulations relating to lenders and lending instruments, which fall • under the responsibility of the Government of IndiaRegulations involving mixed or shared authority and responsibility • between the national and state governments Regulations relating to rules regarding the ex ante borrowing activities • of municipalities and ex post procedures relating to municipal default and insolvency;
State financial intermediaries should be set up in each state with a view b. to assisting ULBs to make use of capital markets for meeting their infrastructure investment requirements. It will help reduce transactions costs, particularly for smaller ULBs who, on their own, are unable to access capital markets. The Tamil Nadu Urban Development Fund (TNUDF) has been working as a financial intermediary for small cities and towns. A number of other states like Rajasthan, West Bengal, Karnataka, and Orissa are also in the process of establishing similar intermediaries. These entities should be set up in a PPP mode as in the case of the TNUDF;The city programme to be developed under the New Improved JNNURM c. (NIJNNURM) should make it mandatory for cities to prepare ‛Intended Use Plans’, requiring ULBs to prepare a borrowing programme based on their investment needs and repayment capacity; andIn order to strengthen the municipal bond markets to support leveraging d. of funds for urban infrastructure, the fixed cap of 8 per cent on annual interest on municipal bonds should be removed to allow market conditions to fix the interest rate and make the bonds attractive.
ii. Public private partnership
5.4.10 The Committee’s views on the use and role of PPP in developing urban infrastructure have been spelt out in Chapter IV. The Committee stresses
148
Report 2009-2010
148
Report on Indian Urban Infrastructure and Services
the need for capacity at all tiers of government to design and manage PPP, and recommends that the Reform and Performance Management Cell of the Ministry of Urban Development, Government of India assist in promoting PPP at ULB level.
5.4.11 The experience with PPP in the urban sector has been reviewed in the context of service delivery in Chapter II. Success stories in the urban infrastructure sectors such as water supply, sewerage, solid waste management, and urban transport are few and far between.
5.4.12 Sectors which are relatively easily amenable to PPP should be encouraged to explore this route. Tools like the Public Sector Comparator, as used in the UK, can aid in determining the amenability of projects to PPP. Based on the experiences of current projects, the Committee recommends that the PPP mode be tried out in sectors like water distribution, sewage treatment plants, solid waste management, and urban transport.
iii. Role of financial intermediaries
5.4.13 In many countries like South Africa, the United States, Canada, and the United Kingdom, municipal banks have played a dual role in providing subsidised credit to municipalities and building their capacity. As the state-directed low cost funding taps dried up over time, these municipalities were able to approach commercial debt markets on their own.
5.4.14 In India, the government-backed Housing and Urban Development Corporation (HUDCO) was designed to perform the job of providing subsidised credit to municipalities/urban authorities and develop municipal capacities for the long term. While HUDCO was set up with the mandate to serve as the prime agency for housing, especially low income housing, and urban infrastructure projects, it has suffered heavily from deficient management. In recent years, its focus has shifted to financing power, gas, and other large infrastructure projects. Admittedly, part of the problem lies in the poor creditworthiness of ULBs and the lack of good projects in urban infrastructure and housing. In the new economic environment and policy dispensation, sources of cheap funds to HUDCO have dried up, and urban infrastructure projects financed by HUDCO are being cross-subsidised through its profitable lending to large infrastructure sectors.
5.4.15 It is high time HUDCO refocuses attention on its original mandate of financing housing and urban infrastructure projects. This would require, first and foremost, that there be a professional Board and modern management structure in place. Since it will be engaged in long-term financing of urban infrastructure and housing, it should have access to long-tenor finance including external commercial borrowing (ECB). The Committee also endorses
149
Report 2009-2010
149
Report on Indian Urban Infrastructure
and Services
the recommendations made by the High Powered Committee (2008) that the equity base of HUDCO should be enhanced in order to help rejuvenate the institution. Once these mechanisms are put in place, and modern management and effective governance assured, HUDCO should be able to perform its role as a key financier of urban infrastructure and low income housing.
5.4.16 Investments by HUDCO must be based on its own assessment of the credit risk associated with ULBs, backed by a credit rating where available. HUDCO can thereby expose the ULBs’ true creditworthiness to the market, thus providing transparency and incentivising ULBs to address their governance and service delivery challenges. This will require playing an important role in building capacities at ULB level to prepare projects and help implement reforms so that ULBs are made market-worthy.
5.4.17 The Committee recommends that HUDCO should:Have a professional Board and modern management structure in line with a. the major players in the infrastructure and housing sector;Receive the benefits available to infrastructure financing companies; andb. Be regulated by the Reserve Bank of India.c.
5.5 Land-based financing instruments
5.5.1 The wide variety of land-based instruments for financing urban infrastructure currently in use in many Indian cities can be classified into three groups: monetary exactions (e.g. betterment charges, impact fees), land exactions (e.g. Town Planning Scheme of Gujarat), and monetisation of underutilised public land assets. There is a much larger potential for further unlocking of land values. While some successful international examples of land sales for urban infrastructure financing have been provided by McKinsey (2010), and they have recommended the use of this instrument for financing urban infrastructure, the Committee is of the view that monetisation of public land is a potentially significant source of financing for urban infrastructure development. However, it needs to be used carefully, and not as a one-time resource for gap filling exercise. 5.5.2 Conversion charges, betterment charges, impact fees, and development charges are the most frequently used levies in India. The land-based charges/fees are generally levied by Development Authorities in Indian cities. ULBs can use these instruments, but they need approval from the state government and typically the charges are much lower. The Committee is of the view that ULBs should have control over the levy of these charges/fees.
5.5.3 Conversion charges are generally levied by Development Authorities and collected at the time of land use conversion, e.g. from rural to urban use,
150
Report 2009-2010
150
Report on Indian Urban Infrastructure and Services
and from residential to commercial use. Sometimes ULBs also levy conversion charges after obtaining approval from the state government. Several countries levy a more general land use institution tax, which taxes those who benefit from land value appreciation because of acts of re-zoning and planning.
5.5.4 Betterment charges are levied on grounds that land value is ‛bettered’ by public infrastructure investments. However, it is very difficult to determine the increase in land value resulting from infrastructure investments, given the widespread use of cash money in land transactions and the consequent unavailability of accurate, useable land price data. Several southern cities have tapped betterment charges through collection at the time of according approval of lay-outs/building permissions.
5.5.5 Impact fees distinguish between differing impacts that buildings have on urban infrastructure and are charged at the time of giving building permission. Ideally, they should be calculated as the incremental cost of infrastructure provision for servicing development at different locations in the city, which is extremely difficult. Sometimes separate rates are prescribed for residential and commercial buildings.
5.5.6 As regards development charges, usually fixed/flat charges per unit of floor area of a building are exacted when a landowner/developer is granted a lay-out development/building permission. Because they are linked to infrastructure costs, development charges are usually pegged low and are therefore not very effective in unlocking the value of land.
5.5.7 Another possible source of land-based financing is pricing the floor space index (FSI) beyond a certain minimum which can be claimed as a right. Such charges can be pegged higher because they get associated with land costs and the cost of developed property. In Hyderabad’s ‛city level impact fees for high-rise buildings’, permission to build floor space is sold and the price is fixed with reference to land prices. These are, in effect, FSI charges. In Ahmedabad, in certain well-defined situations, developers are allowed to buy a limited amount (0.45) of additional development rights from development authorities, and these are referred to as ‛buying additional FSI’. The charge for the additional FSI is specified with reference to the land-price zone that the building is located in, and ranges from Rs 1000 per sq. m in suburban areas to Rs 2500 per sq. m in more central areas. In both cases, the strategy adopted is to vary the price of FSI according to the price of land. In Mumbai, in 2008, the upper limit on FSI in suburbs was increased from 1 to 1.33 and it was decided to charge a ‛premium’ for the additional FSI. The premium is related to the value of the land as per stamp duty legislation, and ranges from Rs 4900 per sq. m in Manori to Rs 23,000 per sq. m in Bandra.
151
Report 2009-2010
151
Report on Indian Urban Infrastructure
and Services
5.5.8 The Committee recommends that besides giving some minimum FSI as development rights, it is reasonable to charge for FSI. Use of FSI charge should go hand in hand with measures to ease the many constraints on land supply that exist in cities. Charging for higher FSI should be part of a balanced strategy for expanding the effective supply of well-located land, while ensuring funding for the infrastructure improvements that are needed to support the high densities in Indian cities and improve accessibility to well-located land.
5.5.9 Since the value of land is dependent on how much one can build on it, and since density regulations determine how much one can build, people are willing to pay for density authorisations. This has some implications for urban planning. Expanding the use of FSI charges will require amending planning legislations to empower ULBs to be able to ‛sell’ development rights within a prescribed framework.
5.5.10 The Committee is of the view that higher land prices should be seen as demand for space and good location; this demand should be entertained if it can be technically supported by the provision of additional infrastructure and the infrastructure can be paid for by unlocking the value of land. Adopting a rule for density allocation which is sensitive to land prices will raise compliance with building regulations and reduce the need for strict enforcement. Expanding supply of built space where there is demand, by permitting higher densities, can also help keep property prices in check.
5.5.11 It is common to find, at the core of many Indian cities, large underutilised tracts of land belonging to central, state, and local government agencies. In many cases, these tracts of land, when originally appropriated, were at the periphery of a town or city. Today they are in strategic city centre areas and are often very valuable. Public agencies have no incentive or compulsion to make the best use of their land assets. Large underutilised public land assets in the middle of Indian cities also contribute significantly to inefficient urban growth. When land use in city centre areas cannot be made denser, cities are forced to grow outwards into the periphery. Monetising such land assets unlocks precious funds which can be used for infrastructure development. But these sources are normally available only in large metropolitan cities. The requirement for public amenities like roads, open spaces, and housing for the poor will need to be catered to in the monetisation model.
5.5.12 In any case, monetising underutilised public land assets can be a source of generating finances, but this source only provides a one-time solution. Also, unlike improving ‛own revenue’, selling land does not have a cascading effect on governance and/or productivity. However, given the extent of public lands, this one-time solution could provide a very substantial element in a finance
152
Report 2009-2010
152
Report on Indian Urban Infrastructure and Services
plan for network infrastructure improvement over 10-20 years, especially for public goods that are not amenable to PPPs. Shanghai’s example shows this.
5.5.13 The Committee calls for judicious and transparent use of the instrument of unlocking land value and recommends that the following steps be taken before ‛sale of land’ is used as an instrument for financing urban infrastructure:
A systematic city-wide inventory of land assets must be made to be able • to identify core and non-core land assets, and proposing the best use of public land assets must be part of comprehensive planning for the city;A transparent and accountable mechanism for sale of public land must be • put in place;Proceeds from land sales must be used only for capital investment projects/• housing for the poor via the creation of a ‛Land Capital Fund’, whose governance and operational mechanisms are designed in such a manner as to ensure total transparency; andA mechanism for sharing revenues between the public agency owning the • land and the infrastructure development agency must be established.
5.5.14 The Committee also reiterates its recommendation on vacant land tax which has great potential considering that cities are expanding boundaries, and land values of erstwhile rural lands are appreciating very fast.
5.5.15 While private developers should be encouraged, government should adequately tax the developers to ensure that the increased land values are used for development of infrastructure in and around the developed areas.
5.6 Proposed financing framework
5.6.1 The preceding sections provide a review of the municipal finances and an analysis of the role of institutional players other than ULBs in urban infrastructure in India. The governance and financing challenges cannot be looked at in isolation from one another. The framework set out in this section attempts to piece together, the implications of the recommendations of the Committee as set out in the preceding sections of this chapter and in Chapter IV so as to present the magnitude of the challenge and identify potential solutions.
5.6.2 The status of municipal finances is available from the successive CFCs. Despite their best efforts, the data is neither consistent across the CFCs for the different time periods nor of good quality because of gaps in the basic information available from the municipalities. Notwithstanding the limitations imposed by the data, the Thirteenth CFC has provided a break-up of the total revenue of ULBs for the period from 2002-03 to 2007-08 (Table A31,
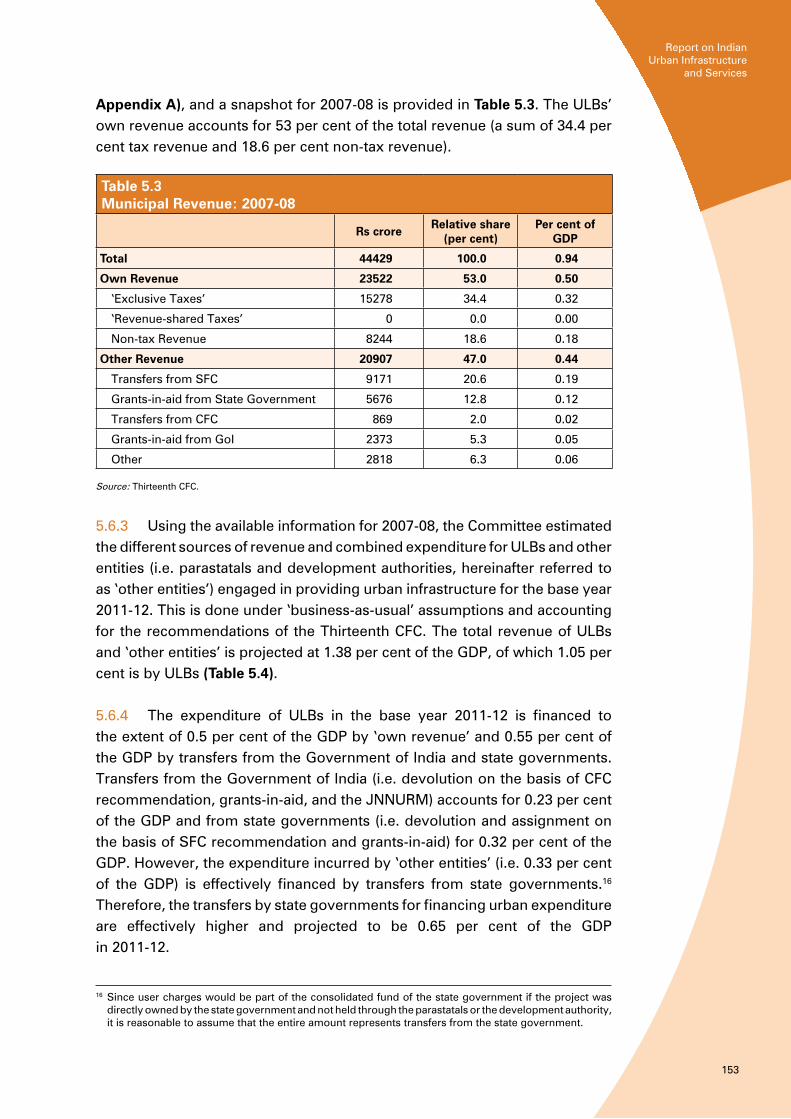
153
Report 2009-2010
153
Report on Indian Urban Infrastructure
and Services
Appendix A), and a snapshot for 2007-08 is provided in Table 5.3. The ULBs’ own revenue accounts for 53 per cent of the total revenue (a sum of 34.4 per cent tax revenue and 18.6 per cent non-tax revenue).
Table 5.3Municipal Revenue: 2007-08
Rs croreRelative share
(per cent)Per cent of
GDP
Total 44429 100.0 0.94
Own Revenue 23522 53.0 0.50
‛Exclusive Taxes’ 15278 34.4 0.32
‛Revenue-shared Taxes’ 0 0.0 0.00
Non-tax Revenue 8244 18.6 0.18
Other Revenue 20907 47.0 0.44
Transfers from SFC 9171 20.6 0.19
Grants-in-aid from State Government 5676 12.8 0.12
Transfers from CFC 869 2.0 0.02
Grants-in-aid from GoI 2373 5.3 0.05
Other 2818 6.3 0.06
Source: Thirteenth CFC.
5.6.3 Using the available information for 2007-08, the Committee estimated the different sources of revenue and combined expenditure for ULBs and other entities (i.e. parastatals and development authorities, hereinafter referred to as ‛other entities’) engaged in providing urban infrastructure for the base year 2011-12. This is done under ‛business-as-usual’ assumptions and accounting for the recommendations of the Thirteenth CFC. The total revenue of ULBs and ‛other entities’ is projected at 1.38 per cent of the GDP, of which 1.05 per cent is by ULBs (Table 5.4).
5.6.4 The expenditure of ULBs in the base year 2011-12 is financed to the extent of 0.5 per cent of the GDP by ‛own revenue’ and 0.55 per cent of the GDP by transfers from the Government of India and state governments. Transfers from the Government of India (i.e. devolution on the basis of CFC recommendation, grants-in-aid, and the JNNURM) accounts for 0.23 per cent of the GDP and from state governments (i.e. devolution and assignment on the basis of SFC recommendation and grants-in-aid) for 0.32 per cent of the GDP. However, the expenditure incurred by ‛other entities’ (i.e. 0.33 per cent of the GDP) is effectively financed by transfers from state governments.16 Therefore, the transfers by state governments for financing urban expenditure are effectively higher and projected to be 0.65 per cent of the GDP in 2011-12.
16 Since user charges would be part of the consolidated fund of the state government if the project was directly owned by the state government and not held through the parastatals or the development authority, it is reasonable to assume that the entire amount represents transfers from the state government.
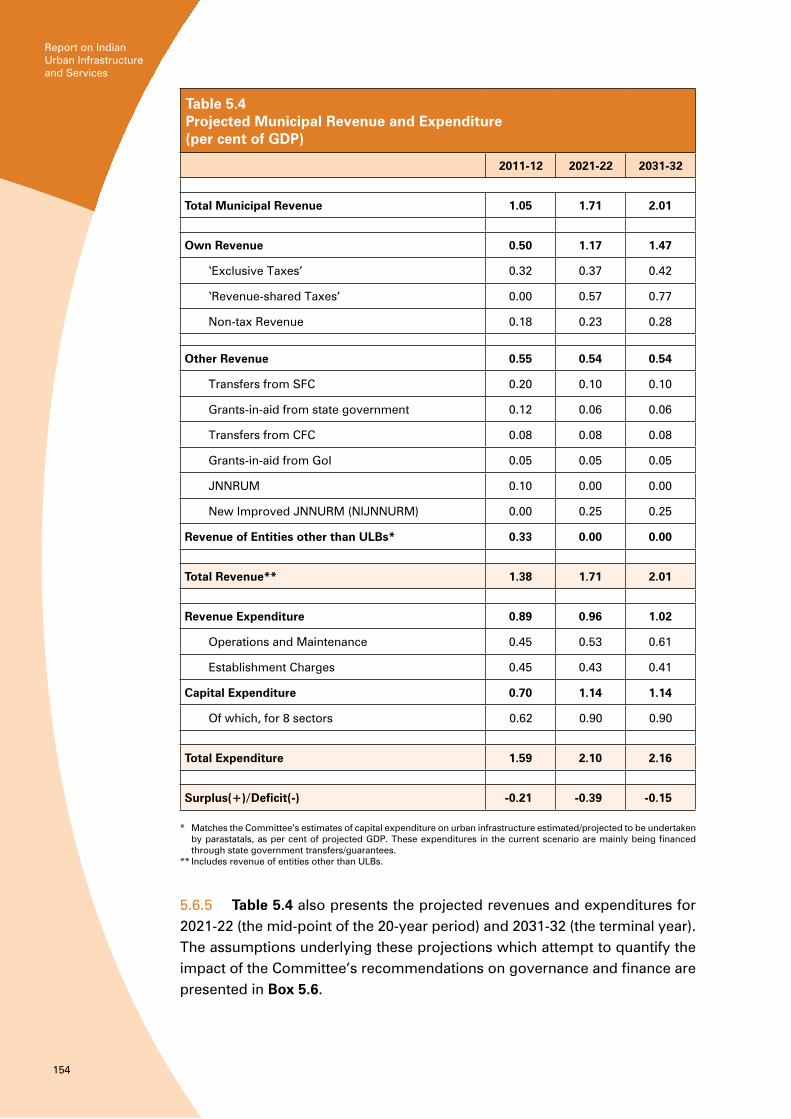
154
Report 2009-2010
154
Report on Indian Urban Infrastructure and Services
* Matches the Committee’s estimates of capital expenditure on urban infrastructure estimated/projected to be undertaken by parastatals, as per cent of projected GDP. These expenditures in the current scenario are mainly being financed through state government transfers/guarantees.** Includes revenue of entities other than ULBs.
Table 5.4Projected Municipal Revenue and Expenditure(per cent of GDP)
2011-12 2021-22 2031-32
Total Municipal Revenue 1.05 1.71 2.01
Own Revenue 0.50 1.17 1.47
‛Exclusive Taxes’ 0.32 0.37 0.42
‛Revenue-shared Taxes’ 0.00 0.57 0.77
Non-tax Revenue 0.18 0.23 0.28
Other Revenue 0.55 0.54 0.54
Transfers from SFC 0.20 0.10 0.10
Grants-in-aid from state government 0.12 0.06 0.06
Transfers from CFC 0.08 0.08 0.08
Grants-in-aid from GoI 0.05 0.05 0.05
JNNRUM 0.10 0.00 0.00
New Improved JNNURM (NIJNNURM) 0.00 0.25 0.25
Revenue of Entities other than ULBs* 0.33 0.00 0.00
Total Revenue** 1.38 1.71 2.01
Revenue Expenditure 0.89 0.96 1.02
Operations and Maintenance 0.45 0.53 0.61
Establishment Charges 0.45 0.43 0.41
Capital Expenditure 0.70 1.14 1.14
Of which, for 8 sectors 0.62 0.90 0.90
Total Expenditure 1.59 2.10 2.16
Surplus(+)/Deficit(-) -0.21 -0.39 -0.15
5.6.5 Table 5.4 also presents the projected revenues and expenditures for 2021-22 (the mid-point of the 20-year period) and 2031-32 (the terminal year). The assumptions underlying these projections which attempt to quantify the impact of the Committee’s recommendations on governance and finance are presented in Box 5.6.
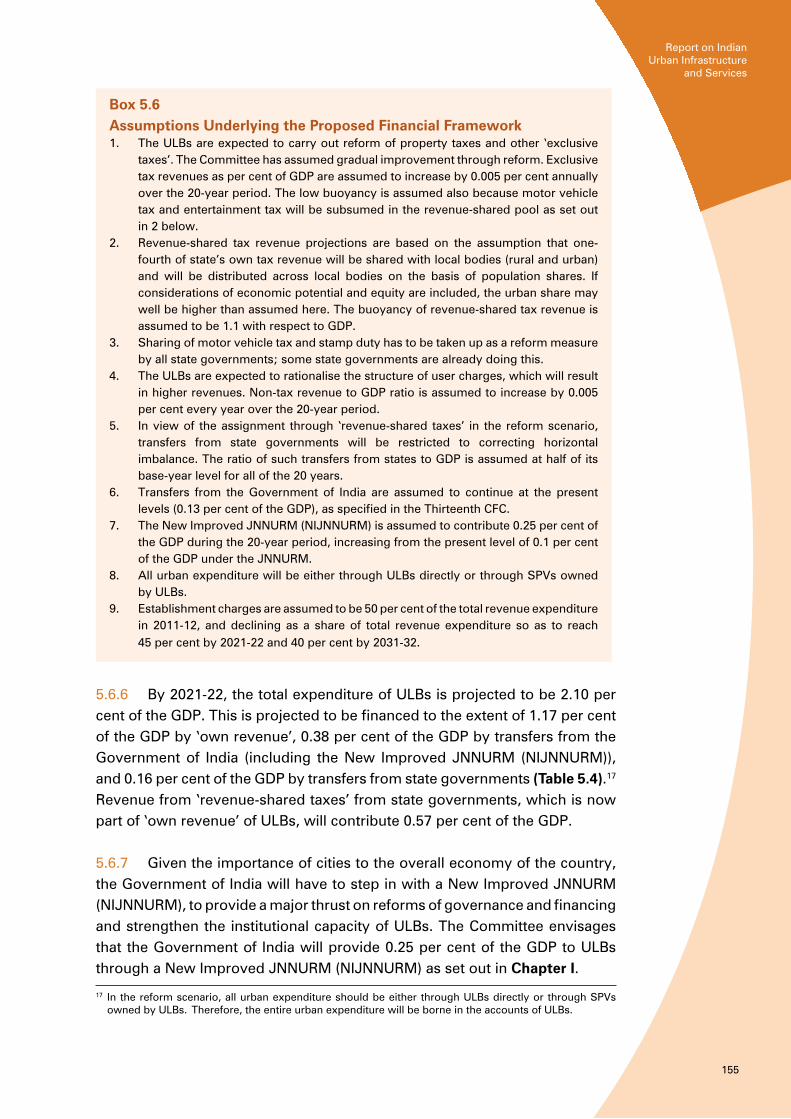
155
Report 2009-2010
155
Report on Indian Urban Infrastructure
and Services
Box 5.6Assumptions Underlying the Proposed Financial Framework
The ULBs are expected to carry out reform of property taxes and other ‛exclusive 1. taxes’. The Committee has assumed gradual improvement through reform. Exclusive tax revenues as per cent of GDP are assumed to increase by 0.005 per cent annually over the 20-year period. The low buoyancy is assumed also because motor vehicle tax and entertainment tax will be subsumed in the revenue-shared pool as set out in 2 below.Revenue-shared tax revenue projections are based on the assumption that one-2. fourth of state’s own tax revenue will be shared with local bodies (rural and urban) and will be distributed across local bodies on the basis of population shares. If considerations of economic potential and equity are included, the urban share may well be higher than assumed here. The buoyancy of revenue-shared tax revenue is assumed to be 1.1 with respect to GDP.Sharing of motor vehicle tax and stamp duty has to be taken up as a reform measure 3. by all state governments; some state governments are already doing this.The ULBs are expected to rationalise the structure of user charges, which will result 4. in higher revenues. Non-tax revenue to GDP ratio is assumed to increase by 0.005 per cent every year over the 20-year period.In view of the assignment through ‛revenue-shared taxes’ in the reform scenario, 5. transfers from state governments will be restricted to correcting horizontal imbalance. The ratio of such transfers from states to GDP is assumed at half of its base-year level for all of the 20 years.Transfers from the Government of India are assumed to continue at the present 6. levels (0.13 per cent of the GDP), as specified in the Thirteenth CFC.The New Improved JNNURM (NIJNNURM) is assumed to contribute 0.25 per cent of 7. the GDP during the 20-year period, increasing from the present level of 0.1 per cent of the GDP under the JNNURM.All urban expenditure will be either through ULBs directly or through SPVs owned 8. by ULBs. Establishment charges are assumed to be 50 per cent of the total revenue expenditure 9. in 2011-12, and declining as a share of total revenue expenditure so as to reach 45 per cent by 2021-22 and 40 per cent by 2031-32.
5.6.6 By 2021-22, the total expenditure of ULBs is projected to be 2.10 per cent of the GDP. This is projected to be financed to the extent of 1.17 per cent of the GDP by ‛own revenue’, 0.38 per cent of the GDP by transfers from the Government of India (including the New Improved JNNURM (NIJNNURM)), and 0.16 per cent of the GDP by transfers from state governments (Table 5.4).17 Revenue from ‛revenue-shared taxes’ from state governments, which is now part of ‛own revenue’ of ULBs, will contribute 0.57 per cent of the GDP.
5.6.7 Given the importance of cities to the overall economy of the country, the Government of India will have to step in with a New Improved JNNURM (NIJNNURM), to provide a major thrust on reforms of governance and financing and strengthen the institutional capacity of ULBs. The Committee envisages that the Government of India will provide 0.25 per cent of the GDP to ULBs through a New Improved JNNURM (NIJNNURM) as set out in Chapter I. 17 In the reform scenario, all urban expenditure should be either through ULBs directly or through SPVs
owned by ULBs. Therefore, the entire urban expenditure will be borne in the accounts of ULBs.
156
Report 2009-2010
156
Report on Indian Urban Infrastructure and Services
5.6.8 Transfers and grants-in-aid from states are projected to decline from 0.32 per cent of the GDP in the base year to 0.16 per cent of the GDP in 2021-22 because under the reform scenario, the hitherto discretionary transfers for correcting the vertical imbalance on the basis of SFC recommendations will be substituted by a new mechanism. Besides recommending a share in the revenue from motor vehicle tax and stamp duty by all states, the Committee recommends that a certain pre-specified percentage of own tax revenue of state governments (referred to as ‛revenue-shared taxes’) will be constitutionally assigned to the local bodies. This percentage is assumed to be 25 per cent. If an adjustment is made for this change, the relative share of transfers by state governments will not be very different. The quality of transfers, however, will undergo a significant change by way of providing greater autonomy to ULBs.
5.6.9 The share of own revenues of ULBs in their total revenues will increase from 48 per cent in 2011-12 to 68.5 per cent in 2021-22 and 73 per cent in 2031-32 (Table 5.4). Consequently, ULBs will have greater access to stable and assured sources of revenues which will provide them with significant financial flexibility.
5.6.10 As estimated by the Committee for the base year 2011-12, there is a gap of 0.21 per cent of the GDP between the total expenditure on the urban sector and the total revenue of ULBs and ‛other entities’. In an unreformed scenario this gap will be required to be filled in by state governments through discretionary transfers. The investment growth rates as projected by the Committee and implications of the reforms as recommended by the Committee are applied to the base year revenue and expenditure of 2011-12. The resulting scenario is presented for 2021-22 and 2031-32 in Table 5.4. The overall deficit is expected to steadily increase to a peak level of 0.39 per cent of the GDP in 2021-22 and thereafter steadily decline to 0.15 per cent of the GDP in 2031-32. To the extent that the total projected expenditure by ULBs does not include expenditure on land to be provided/acquired for urban infrastructure, the actual deficit will be substantially higher than the projected deficit. ULBs will therefore continue to face a hard budget constraint.
5.6.11 With a view to financing their deficits, ULBs will have to resort to market borrowings (pooled finance, municipal bonds, institutional finance, etc.) and new project execution mechanisms like PPP, and land-based financing instruments in accordance with the Committee’s recommendations. These alternative means of financing will entail a revenue model which calls for improving the finances of ULBs through reforms in financing and governance.
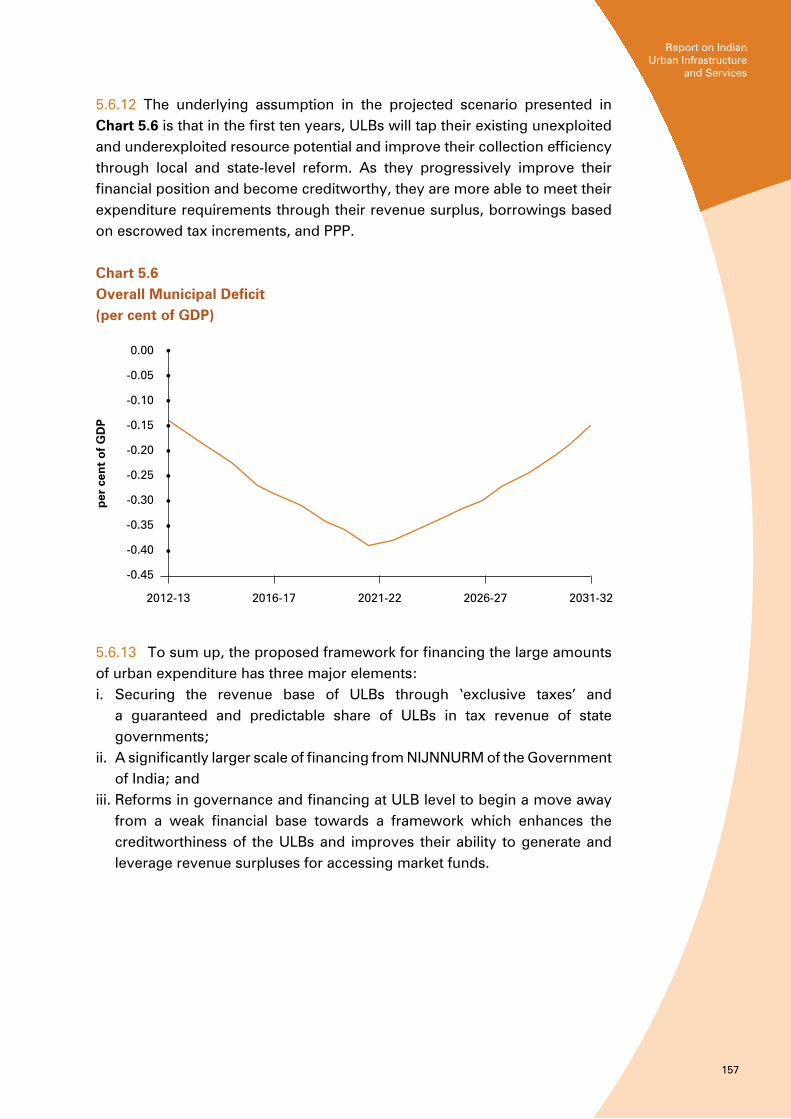
157
Report 2009-2010
157
Report on Indian Urban Infrastructure
and Services
per
cen
t o
f G
DP
0.00
-0.05
-0.10
-0.15
-0.20
-0.25
-0.30
-0.35
-0.40
-0.45
2012-13 2016-17 2021-22 2026-27 2031-32
5.6.12 The underlying assumption in the projected scenario presented in Chart 5.6 is that in the first ten years, ULBs will tap their existing unexploited and underexploited resource potential and improve their collection efficiency through local and state-level reform. As they progressively improve their financial position and become creditworthy, they are more able to meet their expenditure requirements through their revenue surplus, borrowings based on escrowed tax increments, and PPP.
Chart 5.6Overall Municipal Deficit (per cent of GDP)
5.6.13 To sum up, the proposed framework for financing the large amounts of urban expenditure has three major elements:
Securing the revenue base of ULBs through ‛exclusive taxes’ and i. a guaranteed and predictable share of ULBs in tax revenue of state governments;A significantly larger scale of financing from NIJNNURM of the Government ii. of India; andReforms in governance and financing at ULB level to begin a move away iii. from a weak financial base towards a framework which enhances the creditworthiness of the ULBs and improves their ability to generate and leverage revenue surpluses for accessing market funds.


References

161
Report on Indian Urban Infrastructure and Services
Administrative College of India. (2010). • ASCI Training Manual. Hyderabad: Administrative Staff College of India.Agarwal, O. P. (2006). • Urban Transport. In India Infrastructure Report 2006. New Delhi: 3i Network, Oxford University Press.─ ─• (2009). Sustainable Urban Transport in India:Current Challenges and Directions for the Future. New Delhi: Urban Mass Transit Company Limited. Asian Development Bank. (2007). • Benchmarking and Data Book of Water Utilities in India. Asian Development Bank and Ministry of Urban Development, Government of India.Asnani, P. U. (2006). • Solid Waste Management. In India Infrastructure Report 2006. New Delhi: 3i Network, Oxford University Press.Bapat, J., Khosla, R., Kumar, M. (2010). • Community based Approach for Historic Settlements: Kachhpura Agra. Context: Built, Living and Natural. Journal of the Development and Research Organization for Nature, Arts and Heritage, 7(2).Bird, R.M., & Bahl, R. (2008). • Sub national Taxes in Developing Countries: The Way Forward, Institute for International Business Working Paper No.16, University of Toronto.Bombay First (2009). • My Bombay – My Dream: Governance in the Mumbai Metropolitan Region, Bombay First, Mumbai.Central Council of Local Self Government. (1963). • Augmentation of Financial Resources of Urban Local Bodies. Government of India.Central Pollution Control Board. (2009). • Annual Report for 2008-09. Government of India.Central Public Health and Environmental Engineering Organisation (CPHEEO) (1999), • Manual on Water Supply and Treatment, Ministry of Urban Development and Poverty Alleviation, Government of India.Central Statistical Organisation. • National Accounts Statistics. various issues, Government of India.Centre for Science and Environment. (2009). • Taxing the Public not the Private: An Analysis of the Current Vehicle Taxes. Briefing paper 2a . New Delhi: Centre for Science and Environment.Colliers International (2010). • Parking Rate Survey, retrieved on January 17, 2010 from http://www.colliers.com/Country/UnitedStates/content/globalcolliersparkingratesurvey2010.pdfCommission on Growth and Development. (2009). • Urbanization and Growth. Spence, M., Annez, P., & Buckley, R. (eds.).Confederation of Indian Industry (CII) and Council for Energy, Environment, and Water (CEEW). (2010). • Second India Water Dialogue - Outcomes and Recommendations. Confederation of Indian Industry and Council for Energy, Environment, and Water.Datt, G., & Ravallion, M. (2009). • Has India’s Economic Growth become More Pro-Poor in the Wake of Economic Reforms? World Bank Research Working Paper No.5103, World Bank, Washington D.C .Denby, J. (2009). • Supplying the City of Johannesburg’s Water needs. Retrieved December 21, 2010, from Energy Digital Magazine: http://www.energydigital.com/site-search/company_reports?type=All&keys=Johannesburg+Water:+Supplying+the+City+of+Johannesburg%E2%80%99s+Water+NeedsDepartment of Urban Development (2006). • City Development Plan of Delhi. Department of Urban Development, Government of NCT of Delhi.EMBARQ. (2008). • Transport in Cities: India Indicators. Washington, DC: World Resource Institute.Finance Commission of India. (2010). • Report of the Thirteenth Finance Commission. Government of India.Financial Institutions Reform and Expansion Project - Debt Market Component. (2001). • An Independent Regulatory Framework for Water and Waste Water in Maharashtra. Retrieved October 10, 2010, from www.dec.orgFlor, M. A. (2009). • MWSS Privatisation: Lessons on Good Governance. Manila: Asian Development Bank.Government of Gujarat (1976). • Gujarat Town Planning and Urban Development Act: General Development Control Regulations for Ahmedabad, Government of Gujarat.─ ─• (1989). Papers on Perspective Plan, Government of Gujarat.Government of India (2008). • Report of the High Powered Committee to rejuvenate Housing and Urban Development Corporation, Ministry of Housing and Poverty Alleviation, Government of India.─ ─• (1983). National Master Plan (NMP), India and International Water Supply and Sanitation Decade: 1981-90, Ministry of Urban Affairs and Employment, Government of India.─ ─• (1985). Report of the Committee on the Abolition of Octroi. Ministry of Urban Affairs and Employment, Government of India.
Report on Indian Urban Infrastructure and Services
162
─ ─• (1988). Report of the National Commission on Urbanisation. Ministry of Urban Affairs and Employment, Government of India.─ ─• (1991). Manual on Water Supply and Urban Development, Ministry of Urban Development, Government of India.─ ─• (1992). The Constitution (Seventy-Fourth) Amendment Act 1992. Government of India.─ ─• (1996). National Training Policy. Ministry of Personnel, Public Grievances and Pensions, Government of India.─ ─• (1996). Urban Development Plan Formulation and Implementation Guidelines. Ministry of Urban Affairs and Employment, Government of India.─ ─• (2000). Municipal Solid Waste Rules 2000. Ministry of Urban Development, Government of India.─ ─• (2003). Model Municipal Law. Ministry of Urban Development, Government of India.─ ─• (2005). Jawaharlal Nehru National Urban Renewal Mission Overview. Ministry of Urban Development and Ministry of Housing and Urban Poverty Alleviation, Government of India.─ ─• (2006). Road Transport Year Book. Ministry of Road Transport & Highways, Government of India.─ ─• (2006a). Nagara Raj Bill 2006. Ministry of Urban Development, Government of India.─ ─• (2006b). National Urban Transport Policy. Ministry of Urban Development, Government of India.─ ─• (2008). Road Accidents in India. Ministry of Road Transport & Highways, Government of India.─ ─• (2008a). National Urban Sanitation Policy. Ministry of Urban Development, Government of India.─ ─• (2008b). Handbook of Service Level Benchmarking. Ministry of Urban Development, Government of India.─ ─• (2008c). Traffic and Transportation Policies and Strategies in Urban Areas in India. Ministry of Urban Development, Government of India.─ ─• (2009). Basic Road Statistics of India (2004-05 to 2007-08). Ministry of Road Transport & Highways, Government of India.─ ─• (2009a). Service Level Benchmarks for Urban Transport. Ministry of Urban Development, Government of India.─ ─• (2009b). National Urban Sanitation Policy: A Perspective. Ministry of Urban Development, Government of India.─ ─• (2010). National Mission on Sustainable Habitat. Ministry of Urban Development, Government of India.─ ─• (2010a). National Rating and Award Scheme for Sanitation for Indian Cities. Ministry of Urban Development, Government of India.─ ─• (2010b). Improving Service Outcomes 2008-09. Ministry of Urban Development, Government of India.Government of Karnataka (2002). • Ad hoc Committee on Normative Standards and Financial Requirements for Core Urban Civic Services, Government of Karnataka.─ ─• (2008). Report of the Expert Committee on Governance in the Bangalore Metropolitan Region and Bruhat Bangalore Mahanagara Palike, Government of Karnataka.Gulati, A., Ganguly, K., & Cummings, R. (2011). • Plate to Plough. Unpublished book manuscript.Harris, J. & Todaro, M. (1970). Migration, Unemployment and Development: A Two Sector Analysis. American • Economic Review. Issue No. 60.India Infrastructure Report. (1996). • Report on the Commercialisation of Infrastructure. Government of India.India Infrastructure Report 2009, 3i Network. (2009). • Land - A Critical Resource for Infrastructure. New Delhi: Oxford University Press.Indore City Transport Services Limited. (2010). • Public Transport Operation and Bus Rapid Transit System in Indore. Indore City Transport Services Limited.International Institute for Population Sciences (IIPS). (2005-06). • National Family Health Survey-3. Mumbai: International Institute for Population Sciences.Jacobs, J. (1984). • Cities and the Wealth of Nations: Principles of Economic Life. New York: Random House.Kenworthy, J., & Laube, F. (2001). • The Millenium Cities Database for Sustainable Transport. Brussels and Perth: International Union of Public Transport (UITP) and Institute for Sustainability and Technology Policy (ISTP).Krishnagopal, C. (2003). • People’s Participation in Underground Sewerage Project in Alandur Municipality. Retrieved December 17, 2010, from India Best Practices Catalogue 2003, Enroute to Urban Reforms: 124.30.164.71/.../MOA%20Best%20Practices/.../PPP%20in%20Undergrnd%20Sewerage%20Project-Alandur.pdf
163
Report on Indian Urban Infrastructure and Services
KUWASIP. (2010). • Karnataka Urban Water Sector Improvement Project. Government of Karnataka.Lewis, A. (1954). Economic Development with Unlimited Supplies of Labour. The Manchester School. Issue No. 22.• Lok Sabha. (2010). • Report of the Parliamentary Standing Committee on Urban Development (Urban Transport). Government of India.Long, N. (2009). • Pnomh Penh Water Supply Authority: Turning Water Operations in Difficult Environment. Manila: Asian Development Bank.Mahadevia, D. (2010). • Urban Reforms in Three Cities: Bangalore, Ahmedabad and Patna. In Chand.V (eds.), Public Service Delivery in India: Understanding the Reform Process. Oxford University Press.Mathur, M. (2002). • Alandur Sewerage Project: A Sucess Story of Public-Private Partnership Arrangements. In India Infrastructure Report 2002. 3i Network, Oxford University Press.Mathur, O. P., & Thakur, S. (2004). • India’s Municipal Sector: A Study for the Twelfth Finance Commission. New Delhi: National Institute of Public Finance and Policy.Mathur, O. P., Thakur, D., & Rajadhyaksha, N. (2009). • Urban Property Tax Potential in India. New Delhi: National Institute of Public Finance and Policy.McKinsey Global Institute (2010), • India’s Urban Awakening: Building Inclusive Cities, Sustaining Economic Growth, McKinsey and Company Mohanty, P.K. (2003). • Reforming Property Tax: The Approach of Municipal Corporation of Hyderabad, Working Paper No: 2, Centre for Good Governance, Hyderabad.Mohanty, P. K., Misra, B. M., Goyal, R., & Jeromi, P. D. (2007). • Municipal Finance in India: An Assessment. Mumbai: Department of Economic Analysis and Policy, Reserve Bank of India.Nagpur Municipal Corporation (NMC). (2010). • 24x7 Pilot Project of Dharampeth Nagpur: A Review. Rajkot Municipal Corporation, Government of Maharashtra.National Council of Applied Economic Research (NCAER) and Future Capita Research. (2008). • The Next Urban Frontier: Twenty Cities to Watch. New Delhi: National Council of Applied Economic Research (NCAER) and Future Capita Research.National Institute of Urban Affairs (NIUA). (2005). • Status of Water Supply, Sanitation and Solid Waste Management in Urban Areas. Research Series No. 80, National Institute of Urban Affairs, New Delhi.─ ─• (2009). Documentation of Best Practices, Urban Reforms under Peer Experience and Reflective Learning. Volume 2, National Institute of Urban Affairs, New Delhi.National Research Council (2003). • Cities Transformed: Demographic Change and Its Implications for the Developing World. Panel on Urban Population Urbanization and Growth Dynamics, Montgomery, M. M., Stern, R., Cohen, B., & Reed, H. E.(eds.) Committee on Population, Division of Behavioral and Social Sciences and Education. Washington, DC: National Academies Press.National Sample Survey Organisation. • Employment & Unemployment in India. Various Rounds, Government of India.─ ─• Level and Pattern of Consumer Expenditure. Various Rounds, Government of India.Operations Research Group (ORG) (1989). • Delivery and Financing of Urban Services, ORG-Marg Research Limited, New Delhi.Palanivel, T. (2002). • Improving the Management of Sustainable Development: Towards a New Strategic Framework for Large Developing Countires: China, India and Indonesia. United Nations University.Park, H. (2009). • Public-Private Partnerships in Korea. Manila: Asian Development Bank.Patel, B., & Ballaney, S. (2009). • Using the ‛Development Plan - Town Planning Scheme’ Mechanism to Appropriate Land and Build Urban Infrastructure. In India Infrastructure Report 2009. 3i Network, Oxford University Press.Planning Commission. • Five Year Plan Documents. Government of India.─ ─ • Planning Commission Poverty Estimates. Various Years, Government of India.─ ─ (1983). • Reports of the Task Force on Housing and Urban Development, Government of India.─ ─ • (2001). National Human Development Report. Government of India.─ ─ • (2009). Report of the Expert Group to Review the Methodology for Estimation of Poverty. Governement of India.─ ─ • (2010). Mid Term Appraisal for Eleventh Five Year Plan. Government of India.Raghupathi, U. (2003). • Small-Scale Private Water Providers - A growing Reality. Urban Finance Newsletter, National Institute of Urban Affairs, New Delhi.
Report on Indian Urban Infrastructure and Services
164
Rajkot Municipal Corporation (RMC). (2010). • Best Practices in City Governance. Rajkot Municipal Corporation, Government of Gujarat.Rao, G., & Bird, R.M. (2010). • Urban Governance and Finance in India. Working Paper No.68, New Delhi: National Institute of Public Finance and Policy.Registrar General of India. • Census of India. various years, Government of India.─ ─ • Population Projection of India and States 2001-2026. Government of India.Roychowdhury, A. (2009). • Seeking Solutions to Air Pollution, Congestion and Climate: The Role of Transportation and Mobility. New Delhi: Centre for Science and Environment.Sahasranaman, A. (2009). • Pragmatic Municipal Finance Reform: Lessons from policy in South Africa and select experiences in India, Chennai: IFMR Trust.Sridhar, K. S. (2010). • Impact of Land Use Regulations: Evidence from India’s Cities. Urban Studies, 47 (7), 1541-1569.Tortajada, C. (2006). • Water Management in Singapore. Water Resources Development, 22 (2), 227-240.Town and Country Planning Organisation (1973), • Committee on Plan Projects for Industrial Townships, Town and Country Planning Organisation, Ministry of Works and Housing, Government of India. ─ ─• (1974). Report on Norms and Space Standards for Planning Public Sector Project Towns, Town and Country Planning Organisation, Ministry of Works and Housing, Government of India. Uddin, A. (2009). • Traffic congestion in Indian Cities: Challenges of a Rising Power. Retrieved December 17, 2010, from www.visionwebsite.eu/UserFiles/.../Draft_koc_Azeem%20Uddin.pdfUNHABITAT. (2010). • Solid Waste Management in the World’s Cities: Water and Sanitation in the World’s Cities 2010. Earth Scan and UNHABITAT.United Nations. (2007). • World Urbanisation Prospects: The 2007 Revision. Department of Economic and Social Affairs, United Nations.Urban Age. (2008). • Integrated City Making Report. London: Cities Programme, London School of Economics.Vaidya, C. (2009). • Urban Issues, Reforms and Way Forward, Working paper No.4, Department of Economic Affairs, Ministry of Finance, Government of India.Water and Sanitation Program (WSP). (2010). • The Economic Impacts of Inadequate Sanitation in India. New Delhi: World Bank.World Bank• (2006). Improving Management of Municipal Solid Waste in India: Overview and Challenges. World Bank.─ ─ • (2009). World Development Report 2009: Reshaping Economic Geography, Washington, DC: World Bank.Zhu, D., Asnani, P. U., Zurbrugg, C., Anapolsky, S., & Mani, S. (2008). • Improving Municipal Solid Waste Management in India: A Sourcebook for Policy Makers and Practitioners. Washington: World Bank.
Websites
Best Practices database, http://www.bestpractices.org/bpbriefs/urban_economics.htmlBruhat Bengaluru Mahanagara Palike, http://www.bbmp.gov.in/index.php?option=com_content&view=article&id=136&Itemid=68’Delhi Mumbai Industrial Corridor Development Corporation (DMICDC) Ltd., www.dmic.co.inGreater Hyderabad Municipal Corporation, http://www.ghmc.gov.in/Housing and Urban Development Corporation, http://www.hudco.org/HudcoIndex.aspx?lan=endIndia Urban Portal, National Institute of Urban Affairs, www.indiaurbanportal.in Jawaharlal Nehru National Urban Renewal Mission, http://jnnurm.nic.in/ Ministry of Urban Development, http://urbanindia.nic.in/Ministry of Housing and Urban Poverty Alleviation, http://mhupa.gov.in/ National Institute of Urban Affairs, http://www.niua.org/default.aspOrganisation for Economic Co-operation and Development (OECD), www.oecd.orgPeer Experience and Reflective Learning, National Institute of Urban Affairs, http://www.vstl123.com/niuaentry/The International Benchmarking Network for Water and Sanitation Utilities (IBNET), www.ib-net.org
APPENDIX A:Statistical Appendix

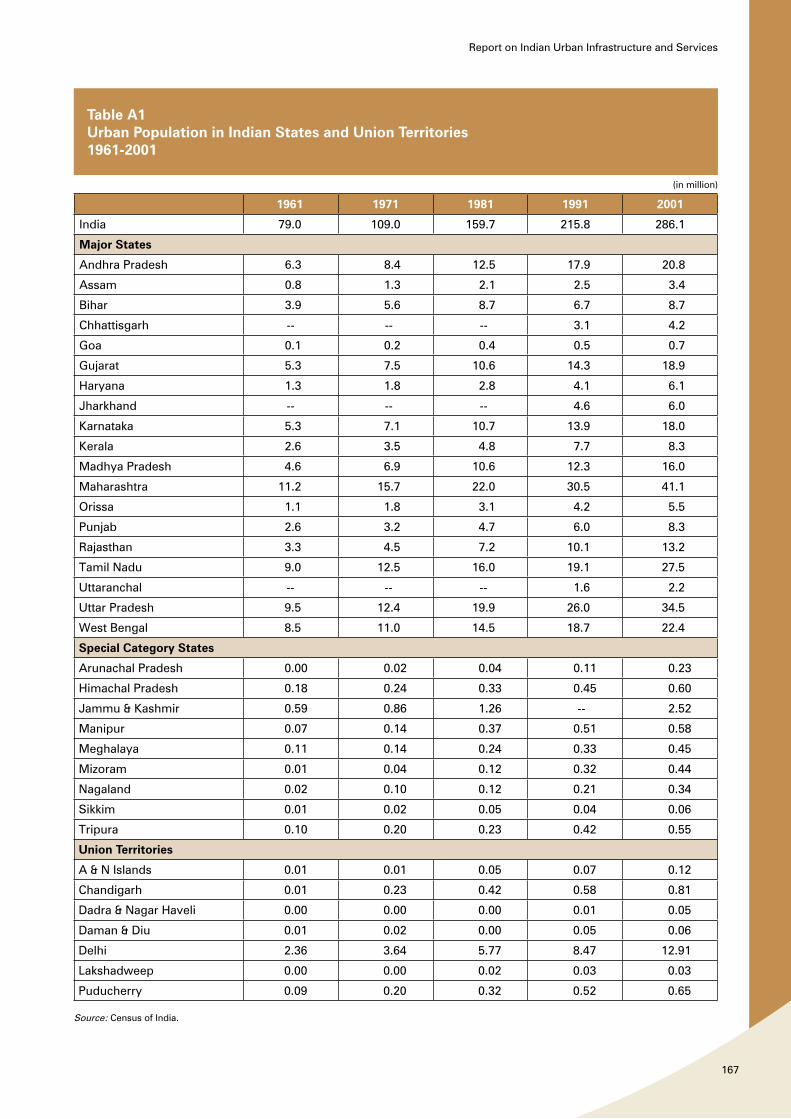
167
Report on Indian Urban Infrastructure and Services
1961 1971 1981 1991 2001
India 79.0 109.0 159.7 215.8 286.1
Major States
Andhra Pradesh 6.3 8.4 12.5 17.9 20.8
Assam 0.8 1.3 2.1 2.5 3.4
Bihar 3.9 5.6 8.7 6.7 8.7
Chhattisgarh -- -- -- 3.1 4.2
Goa 0.1 0.2 0.4 0.5 0.7
Gujarat 5.3 7.5 10.6 14.3 18.9
Haryana 1.3 1.8 2.8 4.1 6.1
Jharkhand -- -- -- 4.6 6.0
Karnataka 5.3 7.1 10.7 13.9 18.0
Kerala 2.6 3.5 4.8 7.7 8.3
Madhya Pradesh 4.6 6.9 10.6 12.3 16.0
Maharashtra 11.2 15.7 22.0 30.5 41.1
Orissa 1.1 1.8 3.1 4.2 5.5
Punjab 2.6 3.2 4.7 6.0 8.3
Rajasthan 3.3 4.5 7.2 10.1 13.2
Tamil Nadu 9.0 12.5 16.0 19.1 27.5
Uttaranchal -- -- -- 1.6 2.2
Uttar Pradesh 9.5 12.4 19.9 26.0 34.5
West Bengal 8.5 11.0 14.5 18.7 22.4
Special Category States
Arunachal Pradesh 0.00 0.02 0.04 0.11 0.23
Himachal Pradesh 0.18 0.24 0.33 0.45 0.60
Jammu & Kashmir 0.59 0.86 1.26 -- 2.52
Manipur 0.07 0.14 0.37 0.51 0.58
Meghalaya 0.11 0.14 0.24 0.33 0.45
Mizoram 0.01 0.04 0.12 0.32 0.44
Nagaland 0.02 0.10 0.12 0.21 0.34
Sikkim 0.01 0.02 0.05 0.04 0.06
Tripura 0.10 0.20 0.23 0.42 0.55
Union Territories
A & N Islands 0.01 0.01 0.05 0.07 0.12
Chandigarh 0.01 0.23 0.42 0.58 0.81
Dadra & Nagar Haveli 0.00 0.00 0.00 0.01 0.05
Daman & Diu 0.01 0.02 0.00 0.05 0.06
Delhi 2.36 3.64 5.77 8.47 12.91
Lakshadweep 0.00 0.00 0.02 0.03 0.03
Puducherry 0.09 0.20 0.32 0.52 0.65
Source: Census of India.
(in million)
Table A1 Urban Population in Indian States and Union Territories 1961-2001

Report on Indian Urban Infrastructure and Services
168
1961 1971 1981 1991 2001
India 18.0 19.9 23.3 25.7 27.8
Major States
Andhra Pradesh 17.4 19.3 23.3 26.9 27.3
Assam -- -- 10.3 11.1 12.9
Bihar 8.4 10.0 12.5 13.1 10.5
Chhattisgarh -- -- -- -- 20.1
Goa 14.8 25.6 32.4 41.0 49.8
Gujarat 25.8 28.1 31.1 34.5 37.4
Haryana 17.2 17.7 21.9 24.6 28.9
Jharkhand -- -- -- -- 22.2
Karnataka 22.3 24.3 28.9 30.9 34.0
Kerala 15.1 16.2 18.7 26.4 26.0
Madhya Pradesh 14.3 16.3 20.3 23.2 26.5
Maharashtra 28.2 31.2 35.0 38.7 42.4
Orissa 6.3 8.4 11.8 13.4 15.0
Punjab 23.1 23.7 27.7 29.6 33.9
Rajasthan 16.3 17.6 21.1 22.9 23.4
Tamil Nadu 26.7 30.3 33.0 34.2 44.0
Uttaranchal -- -- -- -- 25.7
Uttar Pradesh 12.9 14.0 18.0 19.8 20.8
West Bengal 24.5 24.8 26.5 27.5 28.0
Special Category States
Arunachal Pradesh 0.0 3.7 6.6 12.8 20.8
Himachal Pradesh 6.3 7.0 7.6 8.7 9.8
Jammu & Kashmir 16.7 18.6 21.1 -- 24.8
Manipur 8.7 13.2 26.4 27.5 26.6
Meghalaya 15.3 14.6 18.1 18.6 19.6
Mizoram 5.4 11.4 24.7 46.1 49.6
Nagaland 5.2 10.0 15.5 17.2 17.2
Sikkim 4.2 9.4 16.2 9.1 11.1
Tripura 9.0 10.4 11.0 15.3 17.1
Union Territories
A & N Islands 22.2 22.8 26.3 26.7 32.6
Chandigarh 82.8 90.6 93.6 89.7 89.8
Dadra & Nagar Haveli -- -- 6.7 8.5 22.9
Daman & Diu 36.4 37.6 -- 46.8 36.3
Delhi 88.8 89.7 92.7 89.9 93.2
Lakshadweep -- -- 46.3 56.3 44.5
Puducherry 24.1 42.0 52.3 64.0 66.6
Source: Census of India.
Table A2Level of Urbanisation in Indian States and Union Territories(Urban Population as per cent of Total Population of State/Union Territory)1961-2001

169
Report on Indian Urban Infrastructure and Services
1961 1971 1981 1991 2001
Major States
Andhra Pradesh 8.0 7.7 7.8 8.3 7.3
Assam 1.0 1.2 1.3 1.2 1.2
Bihar 4.9 5.1 5.4 3.1 3.0
Chhattisgarh -- -- -- 1.4 1.5
Goa 0.1 0.2 0.3 0.2 0.2
Gujarat 6.7 6.9 6.6 6.6 6.6
Haryana 1.6 1.7 1.8 1.9 2.1
Jharkhand -- -- -- 2.1 2.1
Karnataka 6.7 6.5 6.7 6.4 6.3
Kerala 3.3 3.2 3.0 3.6 2.9
Madhya Pradesh 5.8 6.3 6.6 5.7 5.6
Maharashtra 14.2 14.4 13.8 14.1 14.4
Orissa 1.4 1.7 1.9 1.9 1.9
Punjab 3.3 2.9 2.9 2.8 2.9
Rajasthan 4.2 4.1 4.5 4.7 4.6
Tamil Nadu 11.4 11.5 10.0 8.9 9.6
Uttaranchal -- -- -- 0.7 0.8
Uttar Pradesh 12.0 11.4 12.5 12.0 12.1
West Bengal 10.8 10.1 9.1 8.7 7.8
Special Category States
Arunachal Pradesh 0.00 0.02 0.03 0.05 0.08
Himachal Pradesh 0.23 0.22 0.21 0.21 0.21
Jammu & Kashmir 0.75 0.79 0.79 -- 0.88
Manipur 0.09 0.13 0.23 0.24 0.20
Meghalaya 0.14 0.13 0.15 0.15 0.16
Mizoram 0.01 0.04 0.08 0.15 0.15
Nagaland 0.03 0.09 0.08 0.10 0.12
Sikkim 0.01 0.02 0.03 0.02 0.02
Tripura 0.13 0.18 0.14 0.19 0.19
Union Territories
A & N Islands 0.01 0.01 0.03 0.03 0.04
Chandigarh 0.01 0.21 0.26 0.27 0.28
Dadra & Nagar Haveli 0.00 0.00 0.00 0.00 0.02
Daman & Diu 0.01 0.02 0.00 0.02 0.02
Delhi 2.99 3.34 3.61 3.92 4.51
Lakshadweep 0.00 0.00 0.01 0.01 0.01
Puducherry 0.11 0.18 0.20 0.24 0.23
Source: Census of India.
Table A3Share of Urban Population of States and Union Territories(per cent of Urban Population of India)1961-2001
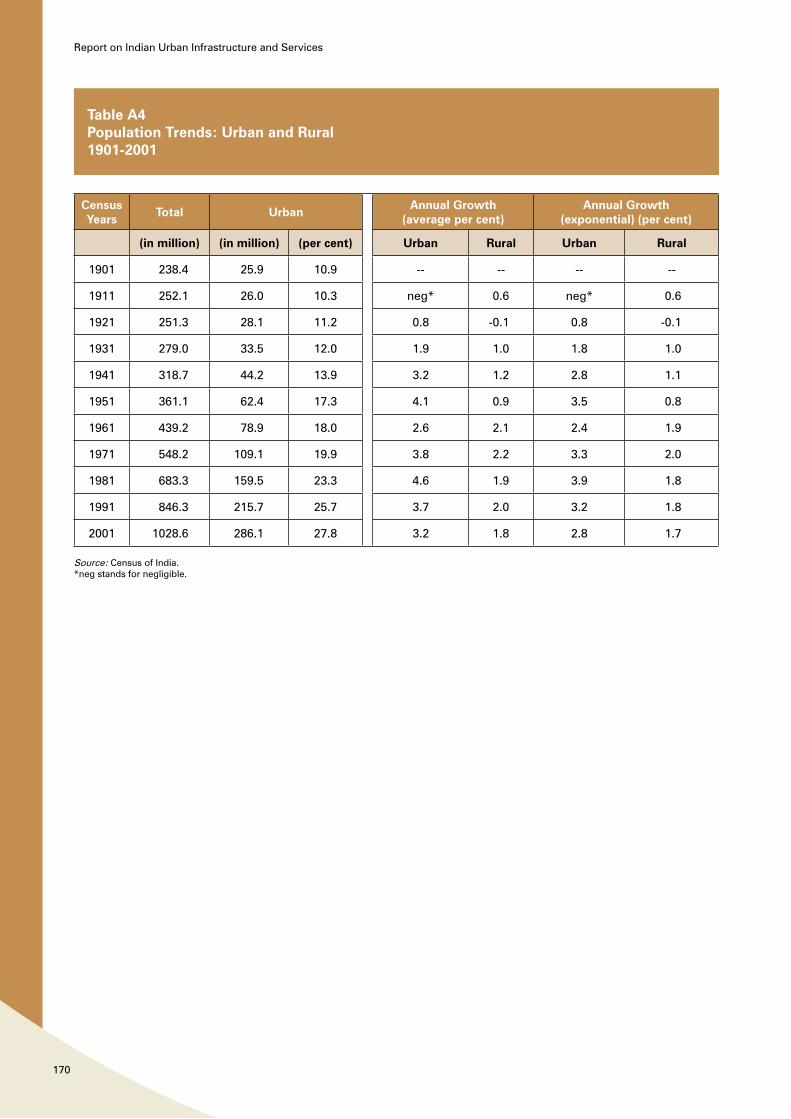
Report on Indian Urban Infrastructure and Services
170
Census Years
Total Urban Annual Growth
(average per cent)Annual Growth
(exponential) (per cent)
(in million) (in million) (per cent) Urban Rural Urban Rural
1901 238.4 25.9 10.9 -- -- -- --
1911 252.1 26.0 10.3 neg* 0.6 neg* 0.6
1921 251.3 28.1 11.2 0.8 -0.1 0.8 -0.1
1931 279.0 33.5 12.0 1.9 1.0 1.8 1.0
1941 318.7 44.2 13.9 3.2 1.2 2.8 1.1
1951 361.1 62.4 17.3 4.1 0.9 3.5 0.8
1961 439.2 78.9 18.0 2.6 2.1 2.4 1.9
1971 548.2 109.1 19.9 3.8 2.2 3.3 2.0
1981 683.3 159.5 23.3 4.6 1.9 3.9 1.8
1991 846.3 215.7 25.7 3.7 2.0 3.2 1.8
2001 1028.6 286.1 27.8 3.2 1.8 2.8 1.7
Source: Census of India.*neg stands for negligible.
Table A4Population Trends: Urban and Rural1901-2001
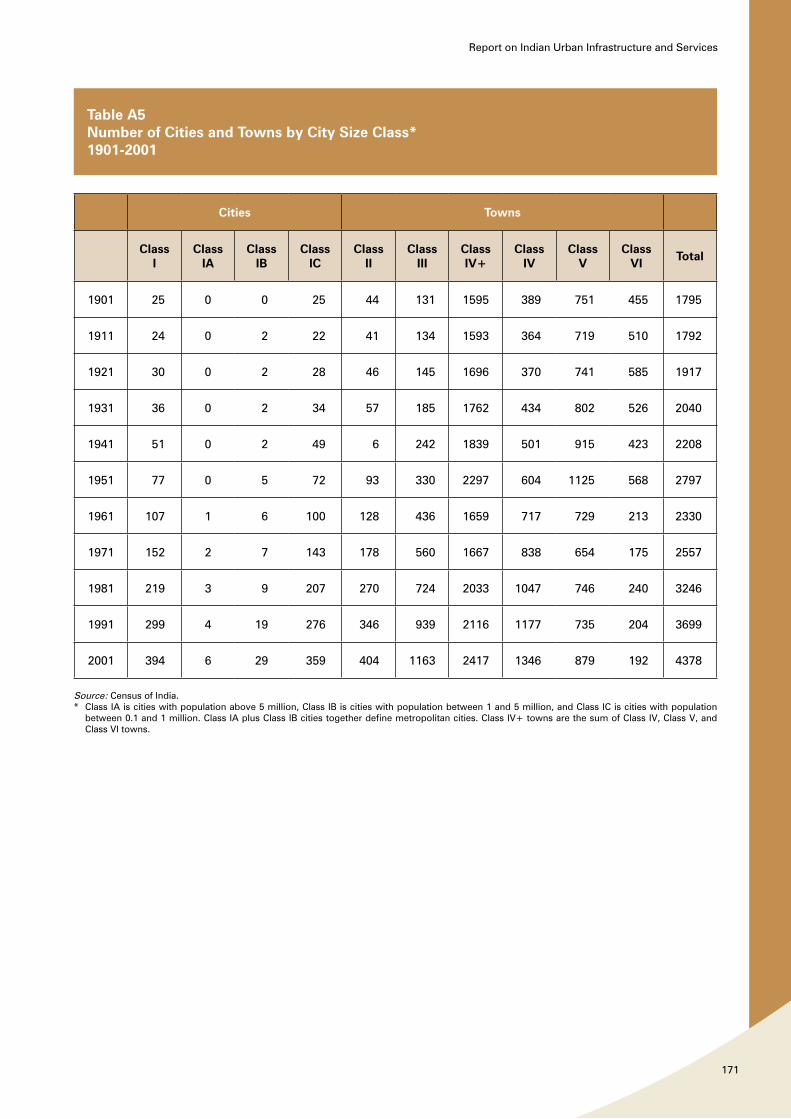
171
Report on Indian Urban Infrastructure and Services
Cities Towns
ClassI
Class IA
ClassIB
ClassIC
ClassII
ClassIII
ClassIV+
ClassIV
ClassV
ClassVI
Total
1901 25 0 0 25 44 131 1595 389 751 455 1795
1911 24 0 2 22 41 134 1593 364 719 510 1792
1921 30 0 2 28 46 145 1696 370 741 585 1917
1931 36 0 2 34 57 185 1762 434 802 526 2040
1941 51 0 2 49 6 242 1839 501 915 423 2208
1951 77 0 5 72 93 330 2297 604 1125 568 2797
1961 107 1 6 100 128 436 1659 717 729 213 2330
1971 152 2 7 143 178 560 1667 838 654 175 2557
1981 219 3 9 207 270 724 2033 1047 746 240 3246
1991 299 4 19 276 346 939 2116 1177 735 204 3699
2001 394 6 29 359 404 1163 2417 1346 879 192 4378
Source: Census of India.* Class IA is cities with population above 5 million, Class IB is cities with population between 1 and 5 million, and Class IC is cities with population between 0.1 and 1 million. Class IA plus Class IB cities together define metropolitan cities. Class IV+ towns are the sum of Class IV, Class V, and Class VI towns.
Table A5Number of Cities and Towns by City Size Class*1901-2001
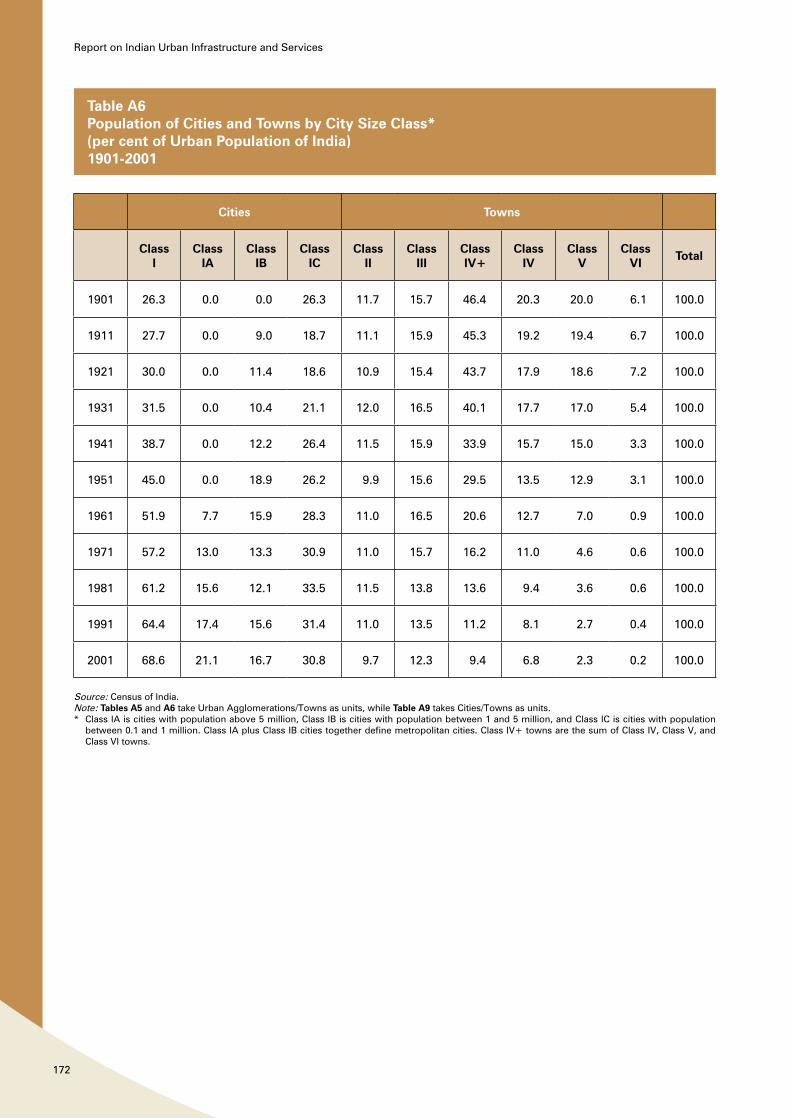
Report on Indian Urban Infrastructure and Services
172
Cities Towns
ClassI
Class IA
ClassIB
ClassIC
ClassII
ClassIII
ClassIV+
ClassIV
ClassV
ClassVI
Total
1901 26.3 0.0 0.0 26.3 11.7 15.7 46.4 20.3 20.0 6.1 100.0
1911 27.7 0.0 9.0 18.7 11.1 15.9 45.3 19.2 19.4 6.7 100.0
1921 30.0 0.0 11.4 18.6 10.9 15.4 43.7 17.9 18.6 7.2 100.0
1931 31.5 0.0 10.4 21.1 12.0 16.5 40.1 17.7 17.0 5.4 100.0
1941 38.7 0.0 12.2 26.4 11.5 15.9 33.9 15.7 15.0 3.3 100.0
1951 45.0 0.0 18.9 26.2 9.9 15.6 29.5 13.5 12.9 3.1 100.0
1961 51.9 7.7 15.9 28.3 11.0 16.5 20.6 12.7 7.0 0.9 100.0
1971 57.2 13.0 13.3 30.9 11.0 15.7 16.2 11.0 4.6 0.6 100.0
1981 61.2 15.6 12.1 33.5 11.5 13.8 13.6 9.4 3.6 0.6 100.0
1991 64.4 17.4 15.6 31.4 11.0 13.5 11.2 8.1 2.7 0.4 100.0
2001 68.6 21.1 16.7 30.8 9.7 12.3 9.4 6.8 2.3 0.2 100.0
Source: Census of India.Note: Tables A5 and A6 take Urban Agglomerations/Towns as units, while Table A9 takes Cities/Towns as units.* Class IA is cities with population above 5 million, Class IB is cities with population between 1 and 5 million, and Class IC is cities with population between 0.1 and 1 million. Class IA plus Class IB cities together define metropolitan cities. Class IV+ towns are the sum of Class IV, Class V, and Class VI towns.
Table A6Population of Cities and Towns by City Size Class* (per cent of Urban Population of India)1901-2001
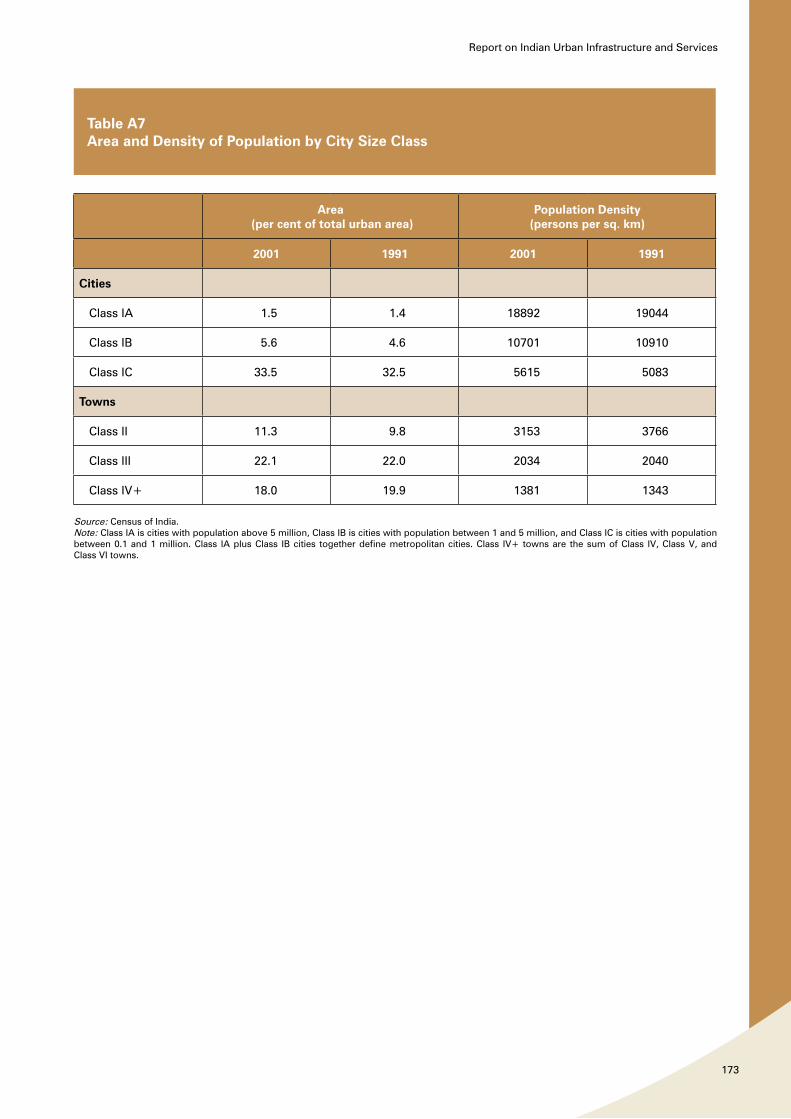
173
Report on Indian Urban Infrastructure and Services
Source: Census of India.Note: Class IA is cities with population above 5 million, Class IB is cities with population between 1 and 5 million, and Class IC is cities with population between 0.1 and 1 million. Class IA plus Class IB cities together define metropolitan cities. Class IV+ towns are the sum of Class IV, Class V, and Class VI towns.
Area (per cent of total urban area)
Population Density (persons per sq. km)
2001 1991 2001 1991
Cities
Class IA 1.5 1.4 18892 19044
Class IB 5.6 4.6 10701 10910
Class IC 33.5 32.5 5615 5083
Towns
Class II 11.3 9.8 3153 3766
Class III 22.1 22.0 2034 2040
Class IV+ 18.0 19.9 1381 1343
Table A7Area and Density of Population by City Size Class
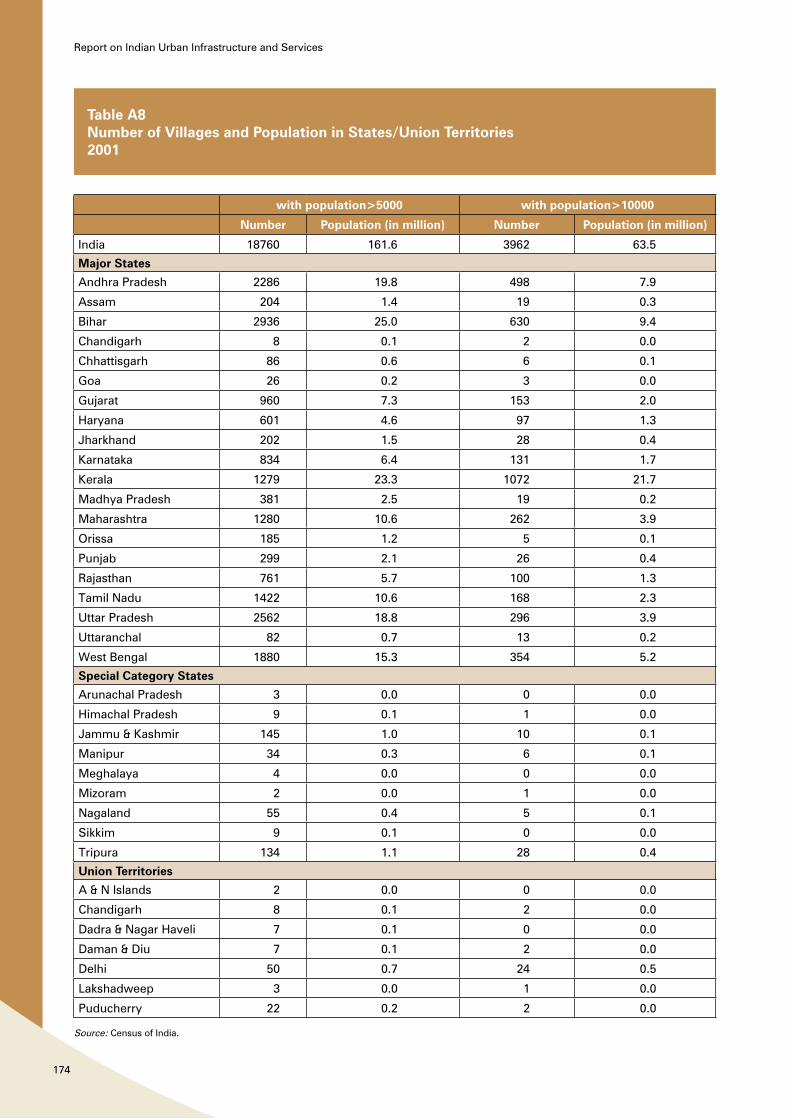
Report on Indian Urban Infrastructure and Services
174
with population>5000 with population>10000
Number Population (in million) Number Population (in million)
India 18760 161.6 3962 63.5Major States
Andhra Pradesh 2286 19.8 498 7.9
Assam 204 1.4 19 0.3
Bihar 2936 25.0 630 9.4
Chandigarh 8 0.1 2 0.0
Chhattisgarh 86 0.6 6 0.1
Goa 26 0.2 3 0.0
Gujarat 960 7.3 153 2.0
Haryana 601 4.6 97 1.3
Jharkhand 202 1.5 28 0.4
Karnataka 834 6.4 131 1.7
Kerala 1279 23.3 1072 21.7
Madhya Pradesh 381 2.5 19 0.2
Maharashtra 1280 10.6 262 3.9
Orissa 185 1.2 5 0.1
Punjab 299 2.1 26 0.4
Rajasthan 761 5.7 100 1.3
Tamil Nadu 1422 10.6 168 2.3
Uttar Pradesh 2562 18.8 296 3.9
Uttaranchal 82 0.7 13 0.2
West Bengal 1880 15.3 354 5.2Special Category States
Arunachal Pradesh 3 0.0 0 0.0
Himachal Pradesh 9 0.1 1 0.0
Jammu & Kashmir 145 1.0 10 0.1
Manipur 34 0.3 6 0.1
Meghalaya 4 0.0 0 0.0
Mizoram 2 0.0 1 0.0
Nagaland 55 0.4 5 0.1
Sikkim 9 0.1 0 0.0
Tripura 134 1.1 28 0.4Union Territories
A & N Islands 2 0.0 0 0.0
Chandigarh 8 0.1 2 0.0
Dadra & Nagar Haveli 7 0.1 0 0.0
Daman & Diu 7 0.1 2 0.0
Delhi 50 0.7 24 0.5
Lakshadweep 3 0.0 1 0.0
Puducherry 22 0.2 2 0.0
Source: Census of India.
Table A8Number of Villages and Population in States/Union Territories2001
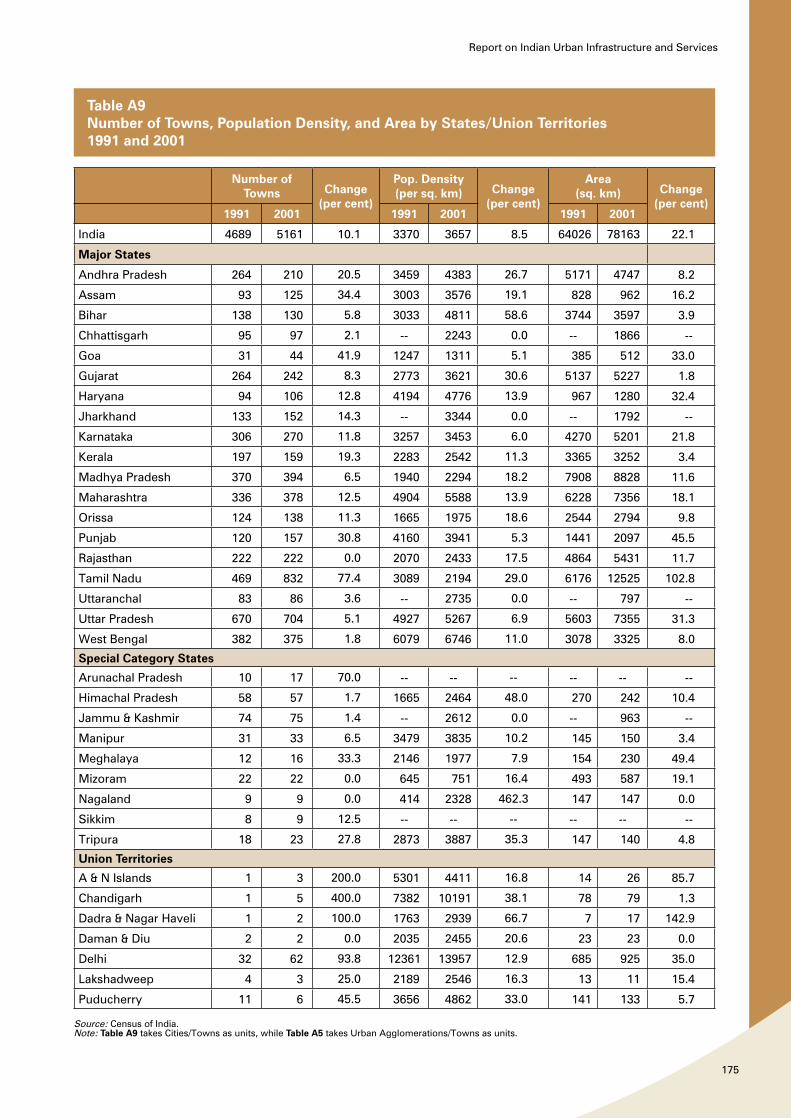
175
Report on Indian Urban Infrastructure and Services
Number of Towns Change
(per cent)
Pop. Density (per sq. km) Change
(per cent)
Area(sq. km) Change
(per cent)1991 2001 1991 2001 1991 2001
India 4689 5161 10.1 3370 3657 8.5 64026 78163 22.1
Major States
Andhra Pradesh 264 210 20.5 3459 4383 26.7 5171 4747 8.2
Assam 93 125 34.4 3003 3576 19.1 828 962 16.2
Bihar 138 130 5.8 3033 4811 58.6 3744 3597 3.9
Chhattisgarh 95 97 2.1 -- 2243 0.0 -- 1866 --
Goa 31 44 41.9 1247 1311 5.1 385 512 33.0
Gujarat 264 242 8.3 2773 3621 30.6 5137 5227 1.8
Haryana 94 106 12.8 4194 4776 13.9 967 1280 32.4
Jharkhand 133 152 14.3 -- 3344 0.0 -- 1792 --
Karnataka 306 270 11.8 3257 3453 6.0 4270 5201 21.8
Kerala 197 159 19.3 2283 2542 11.3 3365 3252 3.4
Madhya Pradesh 370 394 6.5 1940 2294 18.2 7908 8828 11.6
Maharashtra 336 378 12.5 4904 5588 13.9 6228 7356 18.1
Orissa 124 138 11.3 1665 1975 18.6 2544 2794 9.8
Punjab 120 157 30.8 4160 3941 5.3 1441 2097 45.5
Rajasthan 222 222 0.0 2070 2433 17.5 4864 5431 11.7
Tamil Nadu 469 832 77.4 3089 2194 29.0 6176 12525 102.8
Uttaranchal 83 86 3.6 -- 2735 0.0 -- 797 --
Uttar Pradesh 670 704 5.1 4927 5267 6.9 5603 7355 31.3
West Bengal 382 375 1.8 6079 6746 11.0 3078 3325 8.0Special Category States
Arunachal Pradesh 10 17 70.0 -- -- -- -- -- --
Himachal Pradesh 58 57 1.7 1665 2464 48.0 270 242 10.4
Jammu & Kashmir 74 75 1.4 -- 2612 0.0 -- 963 --
Manipur 31 33 6.5 3479 3835 10.2 145 150 3.4
Meghalaya 12 16 33.3 2146 1977 7.9 154 230 49.4
Mizoram 22 22 0.0 645 751 16.4 493 587 19.1
Nagaland 9 9 0.0 414 2328 462.3 147 147 0.0
Sikkim 8 9 12.5 -- -- -- -- -- --
Tripura 18 23 27.8 2873 3887 35.3 147 140 4.8Union Territories
A & N Islands 1 3 200.0 5301 4411 16.8 14 26 85.7
Chandigarh 1 5 400.0 7382 10191 38.1 78 79 1.3
Dadra & Nagar Haveli 1 2 100.0 1763 2939 66.7 7 17 142.9
Daman & Diu 2 2 0.0 2035 2455 20.6 23 23 0.0
Delhi 32 62 93.8 12361 13957 12.9 685 925 35.0
Lakshadweep 4 3 25.0 2189 2546 16.3 13 11 15.4
Puducherry 11 6 45.5 3656 4862 33.0 141 133 5.7
Source: Census of India.Note: Table A9 takes Cities/Towns as units, while Table A5 takes Urban Agglomerations/Towns as units.
Table A9Number of Towns, Population Density, and Area by States/Union Territories 1991 and 2001
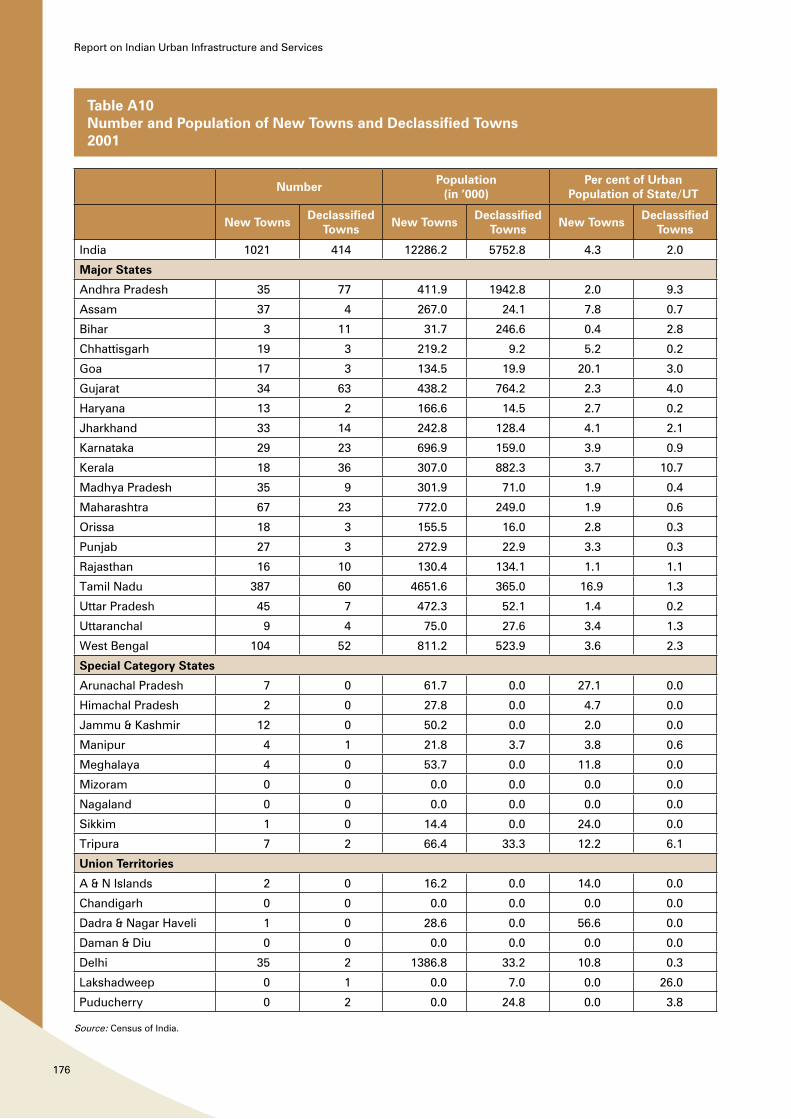
Report on Indian Urban Infrastructure and Services
176
NumberPopulation
(in ’000)Per cent of Urban
Population of State/UT
New TownsDeclassified
TownsNew Towns
Declassified Towns
New TownsDeclassified
Towns
India 1021 414 12286.2 5752.8 4.3 2.0
Major States
Andhra Pradesh 35 77 411.9 1942.8 2.0 9.3
Assam 37 4 267.0 24.1 7.8 0.7
Bihar 3 11 31.7 246.6 0.4 2.8
Chhattisgarh 19 3 219.2 9.2 5.2 0.2
Goa 17 3 134.5 19.9 20.1 3.0
Gujarat 34 63 438.2 764.2 2.3 4.0
Haryana 13 2 166.6 14.5 2.7 0.2
Jharkhand 33 14 242.8 128.4 4.1 2.1
Karnataka 29 23 696.9 159.0 3.9 0.9
Kerala 18 36 307.0 882.3 3.7 10.7
Madhya Pradesh 35 9 301.9 71.0 1.9 0.4
Maharashtra 67 23 772.0 249.0 1.9 0.6
Orissa 18 3 155.5 16.0 2.8 0.3
Punjab 27 3 272.9 22.9 3.3 0.3
Rajasthan 16 10 130.4 134.1 1.1 1.1
Tamil Nadu 387 60 4651.6 365.0 16.9 1.3
Uttar Pradesh 45 7 472.3 52.1 1.4 0.2
Uttaranchal 9 4 75.0 27.6 3.4 1.3
West Bengal 104 52 811.2 523.9 3.6 2.3
Special Category States
Arunachal Pradesh 7 0 61.7 0.0 27.1 0.0
Himachal Pradesh 2 0 27.8 0.0 4.7 0.0
Jammu & Kashmir 12 0 50.2 0.0 2.0 0.0
Manipur 4 1 21.8 3.7 3.8 0.6
Meghalaya 4 0 53.7 0.0 11.8 0.0
Mizoram 0 0 0.0 0.0 0.0 0.0
Nagaland 0 0 0.0 0.0 0.0 0.0
Sikkim 1 0 14.4 0.0 24.0 0.0
Tripura 7 2 66.4 33.3 12.2 6.1
Union Territories
A & N Islands 2 0 16.2 0.0 14.0 0.0
Chandigarh 0 0 0.0 0.0 0.0 0.0
Dadra & Nagar Haveli 1 0 28.6 0.0 56.6 0.0
Daman & Diu 0 0 0.0 0.0 0.0 0.0
Delhi 35 2 1386.8 33.2 10.8 0.3
Lakshadweep 0 1 0.0 7.0 0.0 26.0
Puducherry 0 2 0.0 24.8 0.0 3.8
Source: Census of India.
Table A10Number and Population of New Towns and Declassified Towns2001
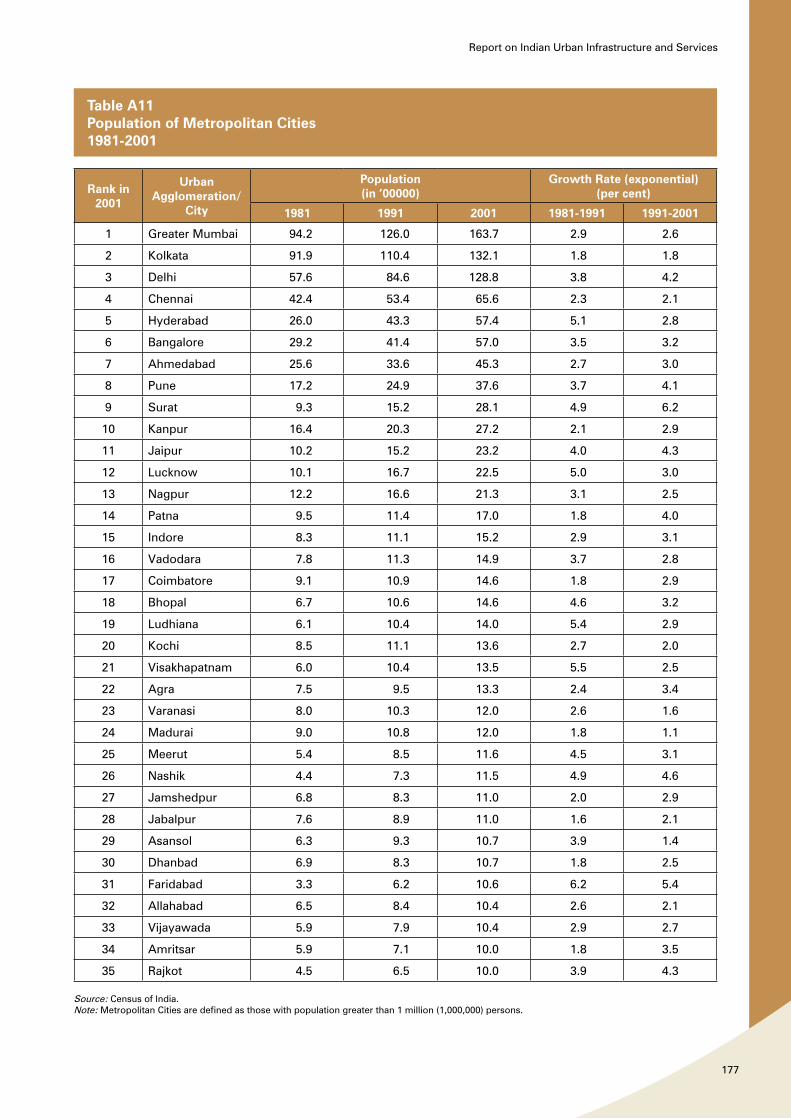
177
Report on Indian Urban Infrastructure and Services
Rank in 2001
Urban Agglomeration/
City
Population(in ’00000)
Growth Rate (exponential)(per cent)
1981 1991 2001 1981-1991 1991-2001
1 Greater Mumbai 94.2 126.0 163.7 2.9 2.6
2 Kolkata 91.9 110.4 132.1 1.8 1.8
3 Delhi 57.6 84.6 128.8 3.8 4.2
4 Chennai 42.4 53.4 65.6 2.3 2.1
5 Hyderabad 26.0 43.3 57.4 5.1 2.8
6 Bangalore 29.2 41.4 57.0 3.5 3.2
7 Ahmedabad 25.6 33.6 45.3 2.7 3.0
8 Pune 17.2 24.9 37.6 3.7 4.1
9 Surat 9.3 15.2 28.1 4.9 6.2
10 Kanpur 16.4 20.3 27.2 2.1 2.9
11 Jaipur 10.2 15.2 23.2 4.0 4.3
12 Lucknow 10.1 16.7 22.5 5.0 3.0
13 Nagpur 12.2 16.6 21.3 3.1 2.5
14 Patna 9.5 11.4 17.0 1.8 4.0
15 Indore 8.3 11.1 15.2 2.9 3.1
16 Vadodara 7.8 11.3 14.9 3.7 2.8
17 Coimbatore 9.1 10.9 14.6 1.8 2.9
18 Bhopal 6.7 10.6 14.6 4.6 3.2
19 Ludhiana 6.1 10.4 14.0 5.4 2.9
20 Kochi 8.5 11.1 13.6 2.7 2.0
21 Visakhapatnam 6.0 10.4 13.5 5.5 2.5
22 Agra 7.5 9.5 13.3 2.4 3.4
23 Varanasi 8.0 10.3 12.0 2.6 1.6
24 Madurai 9.0 10.8 12.0 1.8 1.1
25 Meerut 5.4 8.5 11.6 4.5 3.1
26 Nashik 4.4 7.3 11.5 4.9 4.6
27 Jamshedpur 6.8 8.3 11.0 2.0 2.9
28 Jabalpur 7.6 8.9 11.0 1.6 2.1
29 Asansol 6.3 9.3 10.7 3.9 1.4
30 Dhanbad 6.9 8.3 10.7 1.8 2.5
31 Faridabad 3.3 6.2 10.6 6.2 5.4
32 Allahabad 6.5 8.4 10.4 2.6 2.1
33 Vijayawada 5.9 7.9 10.4 2.9 2.7
34 Amritsar 5.9 7.1 10.0 1.8 3.5
35 Rajkot 4.5 6.5 10.0 3.9 4.3
Source: Census of India.Note: Metropolitan Cities are defined as those with population greater than 1 million (1,000,000) persons.
Table A11Population of Metropolitan Cities1981-2001
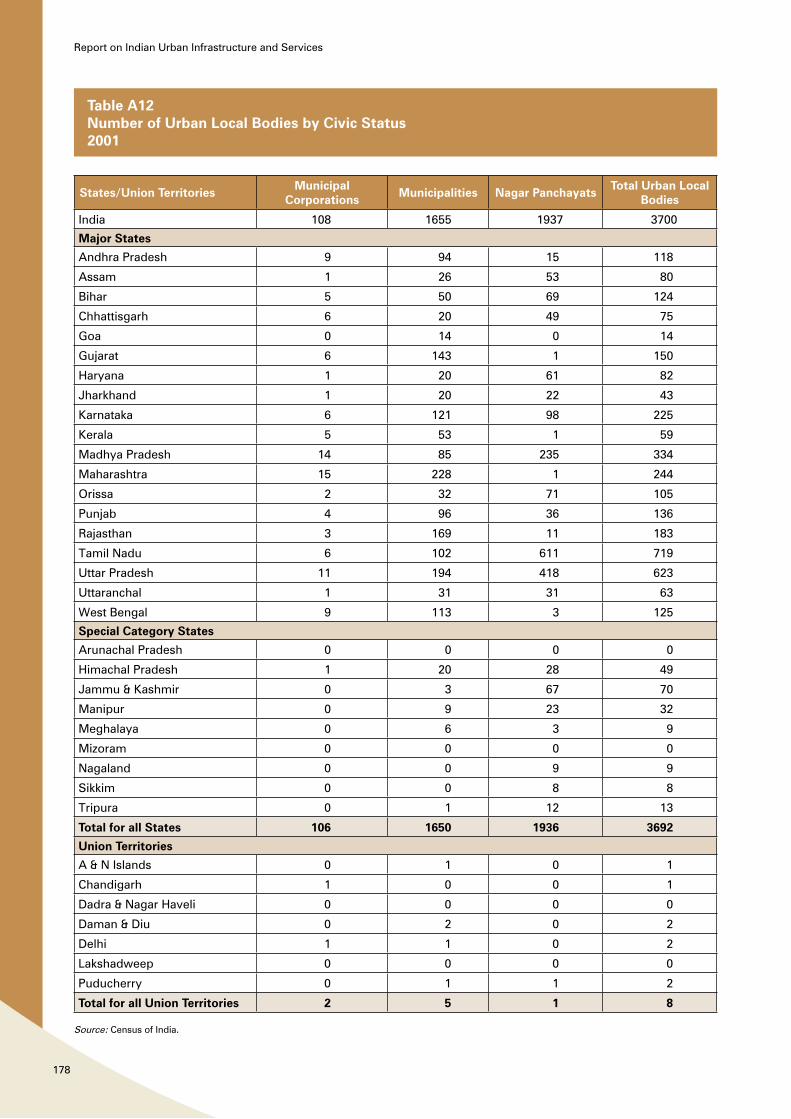
Report on Indian Urban Infrastructure and Services
178
States/Union TerritoriesMunicipal
CorporationsMunicipalities Nagar Panchayats
Total Urban Local Bodies
India 108 1655 1937 3700Major States
Andhra Pradesh 9 94 15 118
Assam 1 26 53 80
Bihar 5 50 69 124
Chhattisgarh 6 20 49 75
Goa 0 14 0 14
Gujarat 6 143 1 150
Haryana 1 20 61 82
Jharkhand 1 20 22 43
Karnataka 6 121 98 225
Kerala 5 53 1 59
Madhya Pradesh 14 85 235 334
Maharashtra 15 228 1 244
Orissa 2 32 71 105
Punjab 4 96 36 136
Rajasthan 3 169 11 183
Tamil Nadu 6 102 611 719
Uttar Pradesh 11 194 418 623
Uttaranchal 1 31 31 63
West Bengal 9 113 3 125Special Category States
Arunachal Pradesh 0 0 0 0
Himachal Pradesh 1 20 28 49
Jammu & Kashmir 0 3 67 70
Manipur 0 9 23 32
Meghalaya 0 6 3 9
Mizoram 0 0 0 0
Nagaland 0 0 9 9
Sikkim 0 0 8 8
Tripura 0 1 12 13
Total for all States 106 1650 1936 3692
Union Territories
A & N Islands 0 1 0 1
Chandigarh 1 0 0 1
Dadra & Nagar Haveli 0 0 0 0
Daman & Diu 0 2 0 2
Delhi 1 1 0 2
Lakshadweep 0 0 0 0
Puducherry 0 1 1 2
Total for all Union Territories 2 5 1 8
Source: Census of India.
Table A12Number of Urban Local Bodies by Civic Status2001
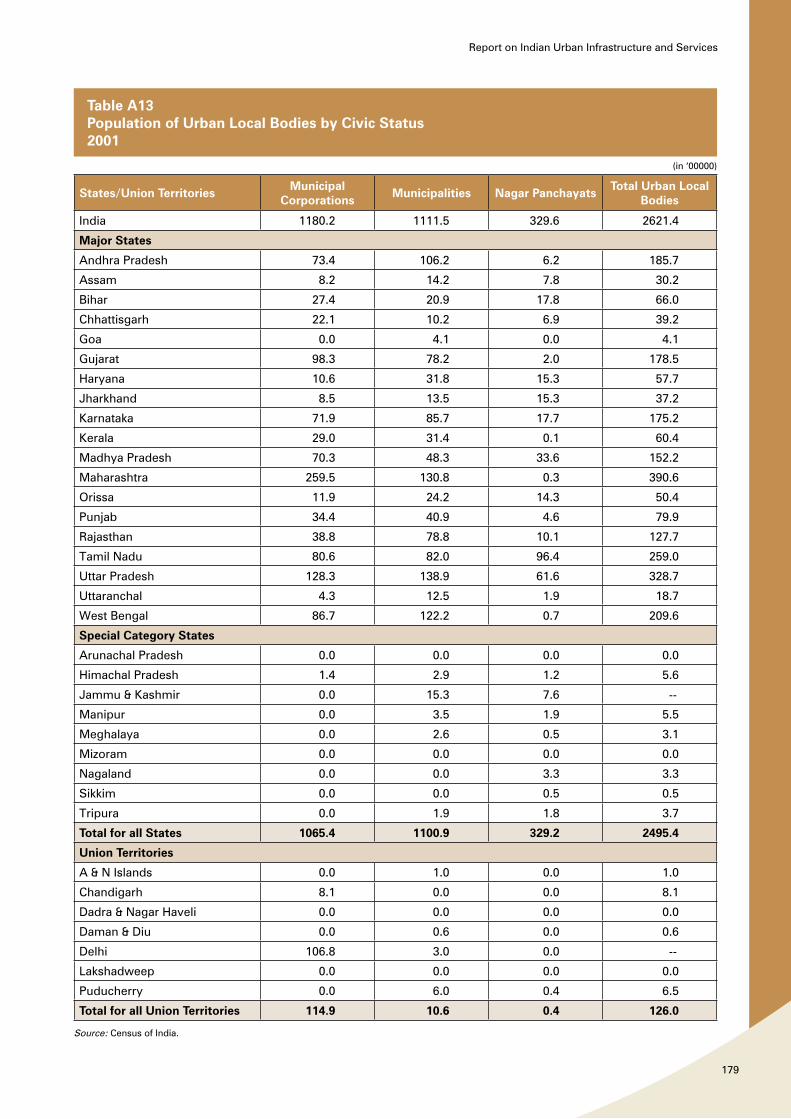
179
Report on Indian Urban Infrastructure and Services
States/Union TerritoriesMunicipal
CorporationsMunicipalities Nagar Panchayats
Total Urban Local Bodies
India 1180.2 1111.5 329.6 2621.4
Major States
Andhra Pradesh 73.4 106.2 6.2 185.7
Assam 8.2 14.2 7.8 30.2
Bihar 27.4 20.9 17.8 66.0
Chhattisgarh 22.1 10.2 6.9 39.2
Goa 0.0 4.1 0.0 4.1
Gujarat 98.3 78.2 2.0 178.5
Haryana 10.6 31.8 15.3 57.7
Jharkhand 8.5 13.5 15.3 37.2
Karnataka 71.9 85.7 17.7 175.2
Kerala 29.0 31.4 0.1 60.4
Madhya Pradesh 70.3 48.3 33.6 152.2
Maharashtra 259.5 130.8 0.3 390.6
Orissa 11.9 24.2 14.3 50.4
Punjab 34.4 40.9 4.6 79.9
Rajasthan 38.8 78.8 10.1 127.7
Tamil Nadu 80.6 82.0 96.4 259.0
Uttar Pradesh 128.3 138.9 61.6 328.7
Uttaranchal 4.3 12.5 1.9 18.7
West Bengal 86.7 122.2 0.7 209.6
Special Category States
Arunachal Pradesh 0.0 0.0 0.0 0.0
Himachal Pradesh 1.4 2.9 1.2 5.6
Jammu & Kashmir 0.0 15.3 7.6 --
Manipur 0.0 3.5 1.9 5.5
Meghalaya 0.0 2.6 0.5 3.1
Mizoram 0.0 0.0 0.0 0.0
Nagaland 0.0 0.0 3.3 3.3
Sikkim 0.0 0.0 0.5 0.5
Tripura 0.0 1.9 1.8 3.7
Total for all States 1065.4 1100.9 329.2 2495.4
Union Territories
A & N Islands 0.0 1.0 0.0 1.0
Chandigarh 8.1 0.0 0.0 8.1
Dadra & Nagar Haveli 0.0 0.0 0.0 0.0
Daman & Diu 0.0 0.6 0.0 0.6
Delhi 106.8 3.0 0.0 --
Lakshadweep 0.0 0.0 0.0 0.0
Puducherry 0.0 6.0 0.4 6.5
Total for all Union Territories 114.9 10.6 0.4 126.0
Source: Census of India.
(in ‘00000)
Table A13Population of Urban Local Bodies by Civic Status2001
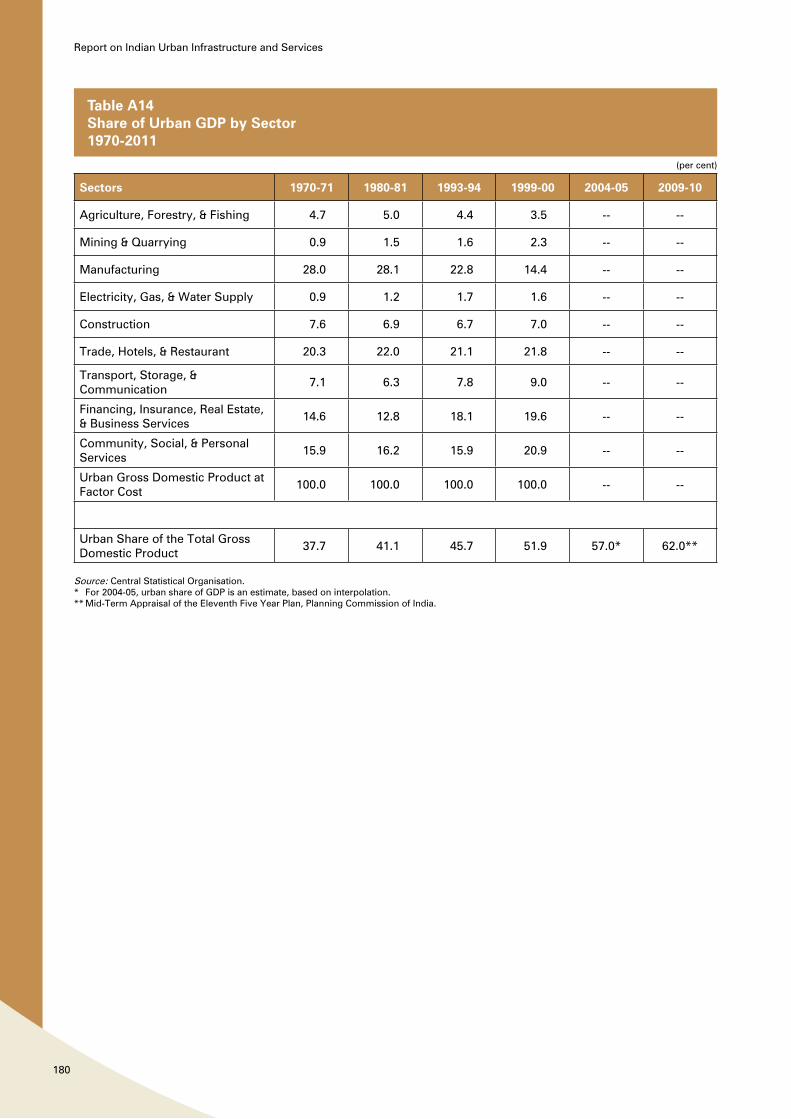
Report on Indian Urban Infrastructure and Services
180
Source: Central Statistical Organisation. * For 2004-05, urban share of GDP is an estimate, based on interpolation.** Mid-Term Appraisal of the Eleventh Five Year Plan, Planning Commission of India.
Sectors 1970-71 1980-81 1993-94 1999-00 2004-05 2009-10
Agriculture, Forestry, & Fishing 4.7 5.0 4.4 3.5 -- --
Mining & Quarrying 0.9 1.5 1.6 2.3 -- --
Manufacturing 28.0 28.1 22.8 14.4 -- --
Electricity, Gas, & Water Supply 0.9 1.2 1.7 1.6 -- --
Construction 7.6 6.9 6.7 7.0 -- --
Trade, Hotels, & Restaurant 20.3 22.0 21.1 21.8 -- --
Transport, Storage, & Communication 7.1 6.3 7.8 9.0 -- --
Financing, Insurance, Real Estate, & Business Services 14.6 12.8 18.1 19.6 -- --
Community, Social, & Personal Services 15.9 16.2 15.9 20.9 -- --
Urban Gross Domestic Product at Factor Cost 100.0 100.0 100.0 100.0 -- --
Urban Share of the Total Gross Domestic Product 37.7 41.1 45.7 51.9 57.0* 62.0**
(per cent)
Table A14Share of Urban GDP by Sector1970-2011
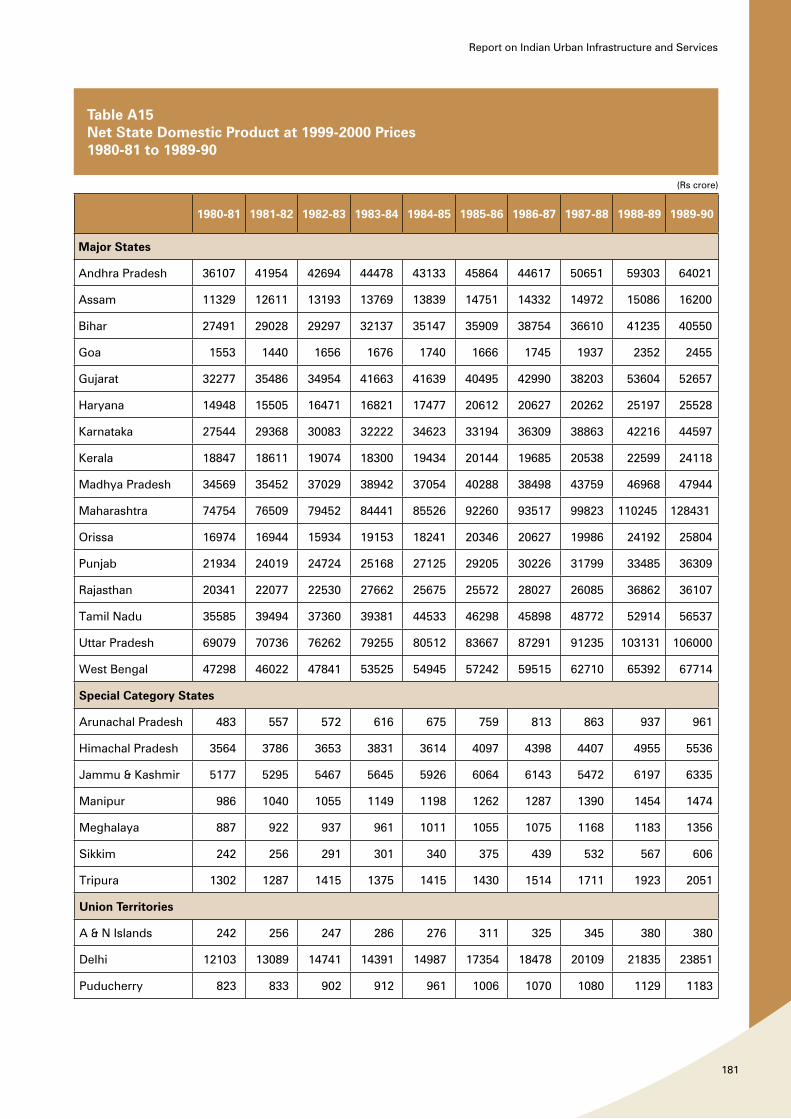
181
Report on Indian Urban Infrastructure and Services
1980-81 1981-82 1982-83 1983-84 1984-85 1985-86 1986-87 1987-88 1988-89 1989-90
Major States
Andhra Pradesh 36107 41954 42694 44478 43133 45864 44617 50651 59303 64021
Assam 11329 12611 13193 13769 13839 14751 14332 14972 15086 16200
Bihar 27491 29028 29297 32137 35147 35909 38754 36610 41235 40550
Goa 1553 1440 1656 1676 1740 1666 1745 1937 2352 2455
Gujarat 32277 35486 34954 41663 41639 40495 42990 38203 53604 52657
Haryana 14948 15505 16471 16821 17477 20612 20627 20262 25197 25528
Karnataka 27544 29368 30083 32222 34623 33194 36309 38863 42216 44597
Kerala 18847 18611 19074 18300 19434 20144 19685 20538 22599 24118
Madhya Pradesh 34569 35452 37029 38942 37054 40288 38498 43759 46968 47944
Maharashtra 74754 76509 79452 84441 85526 92260 93517 99823 110245 128431
Orissa 16974 16944 15934 19153 18241 20346 20627 19986 24192 25804
Punjab 21934 24019 24724 25168 27125 29205 30226 31799 33485 36309
Rajasthan 20341 22077 22530 27662 25675 25572 28027 26085 36862 36107
Tamil Nadu 35585 39494 37360 39381 44533 46298 45898 48772 52914 56537
Uttar Pradesh 69079 70736 76262 79255 80512 83667 87291 91235 103131 106000
West Bengal 47298 46022 47841 53525 54945 57242 59515 62710 65392 67714
Special Category States
Arunachal Pradesh 483 557 572 616 675 759 813 863 937 961
Himachal Pradesh 3564 3786 3653 3831 3614 4097 4398 4407 4955 5536
Jammu & Kashmir 5177 5295 5467 5645 5926 6064 6143 5472 6197 6335
Manipur 986 1040 1055 1149 1198 1262 1287 1390 1454 1474
Meghalaya 887 922 937 961 1011 1055 1075 1168 1183 1356
Sikkim 242 256 291 301 340 375 439 532 567 606
Tripura 1302 1287 1415 1375 1415 1430 1514 1711 1923 2051
Union Territories
A & N Islands 242 256 247 286 276 311 325 345 380 380
Delhi 12103 13089 14741 14391 14987 17354 18478 20109 21835 23851
Puducherry 823 833 902 912 961 1006 1070 1080 1129 1183
Table A15Net State Domestic Product at 1999-2000 Prices1980-81 to 1989-90
(Rs crore)
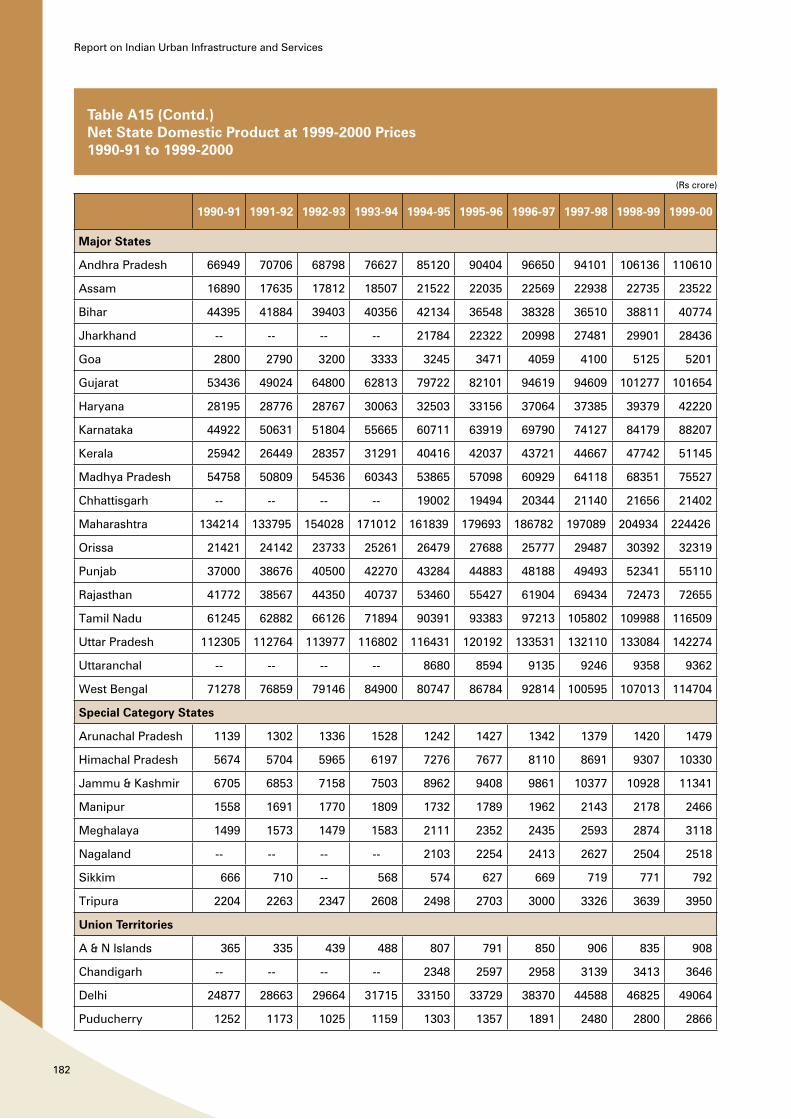
Report on Indian Urban Infrastructure and Services
182
1990-91 1991-92 1992-93 1993-94 1994-95 1995-96 1996-97 1997-98 1998-99 1999-00
Major States
Andhra Pradesh 66949 70706 68798 76627 85120 90404 96650 94101 106136 110610
Assam 16890 17635 17812 18507 21522 22035 22569 22938 22735 23522
Bihar 44395 41884 39403 40356 42134 36548 38328 36510 38811 40774
Jharkhand -- -- -- -- 21784 22322 20998 27481 29901 28436
Goa 2800 2790 3200 3333 3245 3471 4059 4100 5125 5201
Gujarat 53436 49024 64800 62813 79722 82101 94619 94609 101277 101654
Haryana 28195 28776 28767 30063 32503 33156 37064 37385 39379 42220
Karnataka 44922 50631 51804 55665 60711 63919 69790 74127 84179 88207
Kerala 25942 26449 28357 31291 40416 42037 43721 44667 47742 51145
Madhya Pradesh 54758 50809 54536 60343 53865 57098 60929 64118 68351 75527
Chhattisgarh -- -- -- -- 19002 19494 20344 21140 21656 21402
Maharashtra 134214 133795 154028 171012 161839 179693 186782 197089 204934 224426
Orissa 21421 24142 23733 25261 26479 27688 25777 29487 30392 32319
Punjab 37000 38676 40500 42270 43284 44883 48188 49493 52341 55110
Rajasthan 41772 38567 44350 40737 53460 55427 61904 69434 72473 72655
Tamil Nadu 61245 62882 66126 71894 90391 93383 97213 105802 109988 116509
Uttar Pradesh 112305 112764 113977 116802 116431 120192 133531 132110 133084 142274
Uttaranchal -- -- -- -- 8680 8594 9135 9246 9358 9362
West Bengal 71278 76859 79146 84900 80747 86784 92814 100595 107013 114704
Special Category States
Arunachal Pradesh 1139 1302 1336 1528 1242 1427 1342 1379 1420 1479
Himachal Pradesh 5674 5704 5965 6197 7276 7677 8110 8691 9307 10330
Jammu & Kashmir 6705 6853 7158 7503 8962 9408 9861 10377 10928 11341
Manipur 1558 1691 1770 1809 1732 1789 1962 2143 2178 2466
Meghalaya 1499 1573 1479 1583 2111 2352 2435 2593 2874 3118
Nagaland -- -- -- -- 2103 2254 2413 2627 2504 2518
Sikkim 666 710 -- 568 574 627 669 719 771 792
Tripura 2204 2263 2347 2608 2498 2703 3000 3326 3639 3950
Union Territories
A & N Islands 365 335 439 488 807 791 850 906 835 908
Chandigarh -- -- -- -- 2348 2597 2958 3139 3413 3646
Delhi 24877 28663 29664 31715 33150 33729 38370 44588 46825 49064
Puducherry 1252 1173 1025 1159 1303 1357 1891 2480 2800 2866
Table A15 (Contd.)Net State Domestic Product at 1999-2000 Prices1990-91 to 1999-2000
(Rs crore)
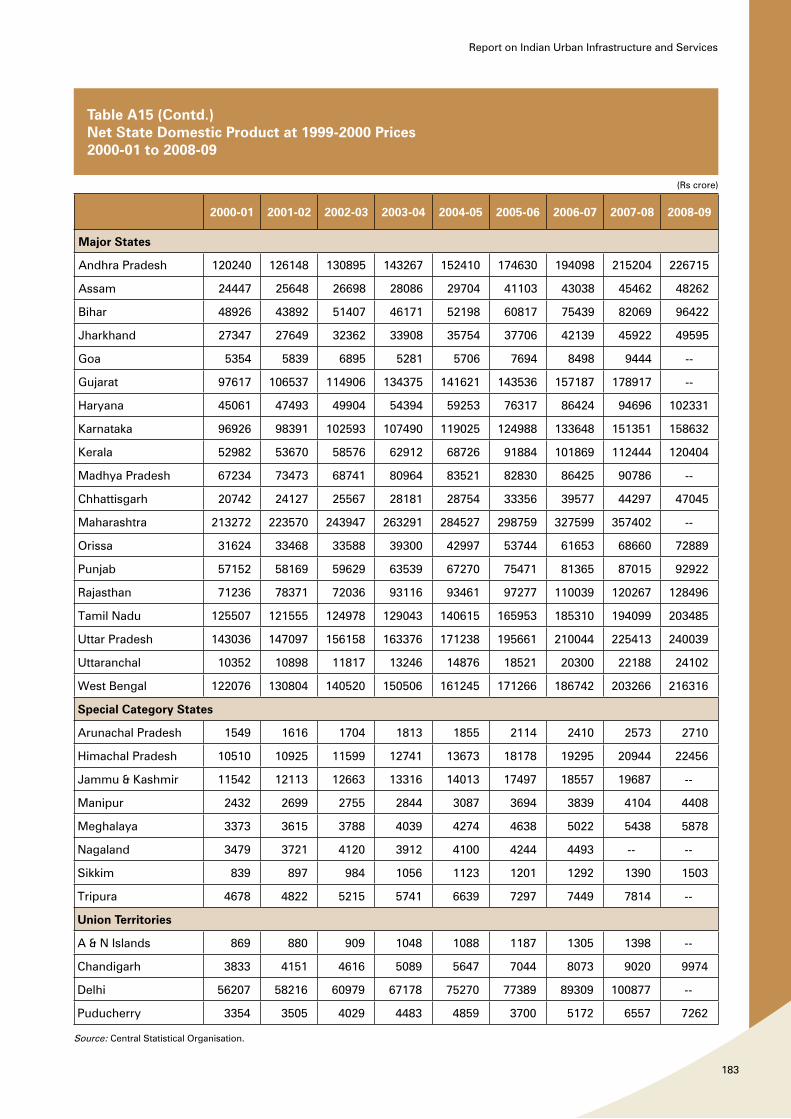
183
Report on Indian Urban Infrastructure and Services
Source: Central Statistical Organisation.
2000-01 2001-02 2002-03 2003-04 2004-05 2005-06 2006-07 2007-08 2008-09
Major States
Andhra Pradesh 120240 126148 130895 143267 152410 174630 194098 215204 226715
Assam 24447 25648 26698 28086 29704 41103 43038 45462 48262
Bihar 48926 43892 51407 46171 52198 60817 75439 82069 96422
Jharkhand 27347 27649 32362 33908 35754 37706 42139 45922 49595
Goa 5354 5839 6895 5281 5706 7694 8498 9444 --
Gujarat 97617 106537 114906 134375 141621 143536 157187 178917 --
Haryana 45061 47493 49904 54394 59253 76317 86424 94696 102331
Karnataka 96926 98391 102593 107490 119025 124988 133648 151351 158632
Kerala 52982 53670 58576 62912 68726 91884 101869 112444 120404
Madhya Pradesh 67234 73473 68741 80964 83521 82830 86425 90786 --
Chhattisgarh 20742 24127 25567 28181 28754 33356 39577 44297 47045
Maharashtra 213272 223570 243947 263291 284527 298759 327599 357402 --
Orissa 31624 33468 33588 39300 42997 53744 61653 68660 72889
Punjab 57152 58169 59629 63539 67270 75471 81365 87015 92922
Rajasthan 71236 78371 72036 93116 93461 97277 110039 120267 128496
Tamil Nadu 125507 121555 124978 129043 140615 165953 185310 194099 203485
Uttar Pradesh 143036 147097 156158 163376 171238 195661 210044 225413 240039
Uttaranchal 10352 10898 11817 13246 14876 18521 20300 22188 24102
West Bengal 122076 130804 140520 150506 161245 171266 186742 203266 216316
Special Category States
Arunachal Pradesh 1549 1616 1704 1813 1855 2114 2410 2573 2710
Himachal Pradesh 10510 10925 11599 12741 13673 18178 19295 20944 22456
Jammu & Kashmir 11542 12113 12663 13316 14013 17497 18557 19687 --
Manipur 2432 2699 2755 2844 3087 3694 3839 4104 4408
Meghalaya 3373 3615 3788 4039 4274 4638 5022 5438 5878
Nagaland 3479 3721 4120 3912 4100 4244 4493 -- --
Sikkim 839 897 984 1056 1123 1201 1292 1390 1503
Tripura 4678 4822 5215 5741 6639 7297 7449 7814 --
Union Territories
A & N Islands 869 880 909 1048 1088 1187 1305 1398 --
Chandigarh 3833 4151 4616 5089 5647 7044 8073 9020 9974
Delhi 56207 58216 60979 67178 75270 77389 89309 100877 --
Puducherry 3354 3505 4029 4483 4859 3700 5172 6557 7262
Table A15 (Contd.)Net State Domestic Product at 1999-2000 Prices2000-01 to 2008-09
(Rs crore)
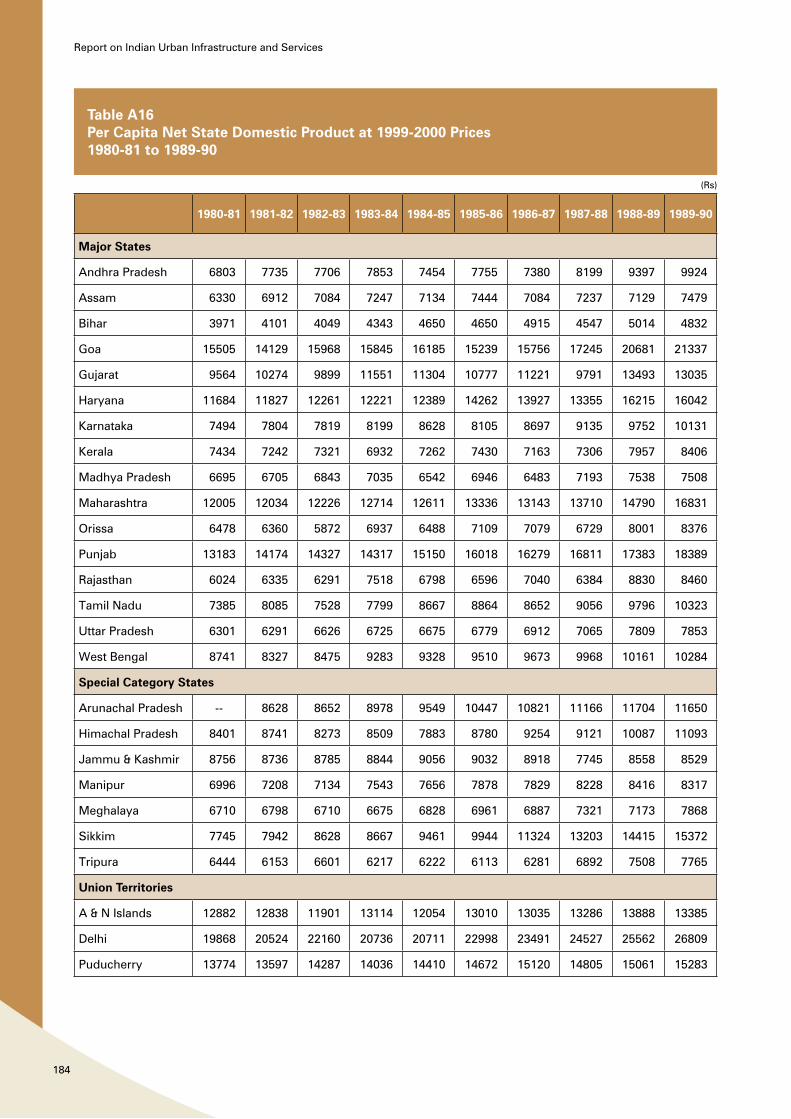
Report on Indian Urban Infrastructure and Services
184
1980-81 1981-82 1982-83 1983-84 1984-85 1985-86 1986-87 1987-88 1988-89 1989-90
Major States
Andhra Pradesh 6803 7735 7706 7853 7454 7755 7380 8199 9397 9924
Assam 6330 6912 7084 7247 7134 7444 7084 7237 7129 7479
Bihar 3971 4101 4049 4343 4650 4650 4915 4547 5014 4832
Goa 15505 14129 15968 15845 16185 15239 15756 17245 20681 21337
Gujarat 9564 10274 9899 11551 11304 10777 11221 9791 13493 13035
Haryana 11684 11827 12261 12221 12389 14262 13927 13355 16215 16042
Karnataka 7494 7804 7819 8199 8628 8105 8697 9135 9752 10131
Kerala 7434 7242 7321 6932 7262 7430 7163 7306 7957 8406
Madhya Pradesh 6695 6705 6843 7035 6542 6946 6483 7193 7538 7508
Maharashtra 12005 12034 12226 12714 12611 13336 13143 13710 14790 16831
Orissa 6478 6360 5872 6937 6488 7109 7079 6729 8001 8376
Punjab 13183 14174 14327 14317 15150 16018 16279 16811 17383 18389
Rajasthan 6024 6335 6291 7518 6798 6596 7040 6384 8830 8460
Tamil Nadu 7385 8085 7528 7799 8667 8864 8652 9056 9796 10323
Uttar Pradesh 6301 6291 6626 6725 6675 6779 6912 7065 7809 7853
West Bengal 8741 8327 8475 9283 9328 9510 9673 9968 10161 10284
Special Category States
Arunachal Pradesh -- 8628 8652 8978 9549 10447 10821 11166 11704 11650
Himachal Pradesh 8401 8741 8273 8509 7883 8780 9254 9121 10087 11093
Jammu & Kashmir 8756 8736 8785 8844 9056 9032 8918 7745 8558 8529
Manipur 6996 7208 7134 7543 7656 7878 7829 8228 8416 8317
Meghalaya 6710 6798 6710 6675 6828 6961 6887 7321 7173 7868
Sikkim 7745 7942 8628 8667 9461 9944 11324 13203 14415 15372
Tripura 6444 6153 6601 6217 6222 6113 6281 6892 7508 7765
Union Territories
A & N Islands 12882 12838 11901 13114 12054 13010 13035 13286 13888 13385
Delhi 19868 20524 22160 20736 20711 22998 23491 24527 25562 26809
Puducherry 13774 13597 14287 14036 14410 14672 15120 14805 15061 15283
Table A16Per Capita Net State Domestic Product at 1999-2000 Prices1980-81 to 1989-90
(Rs)
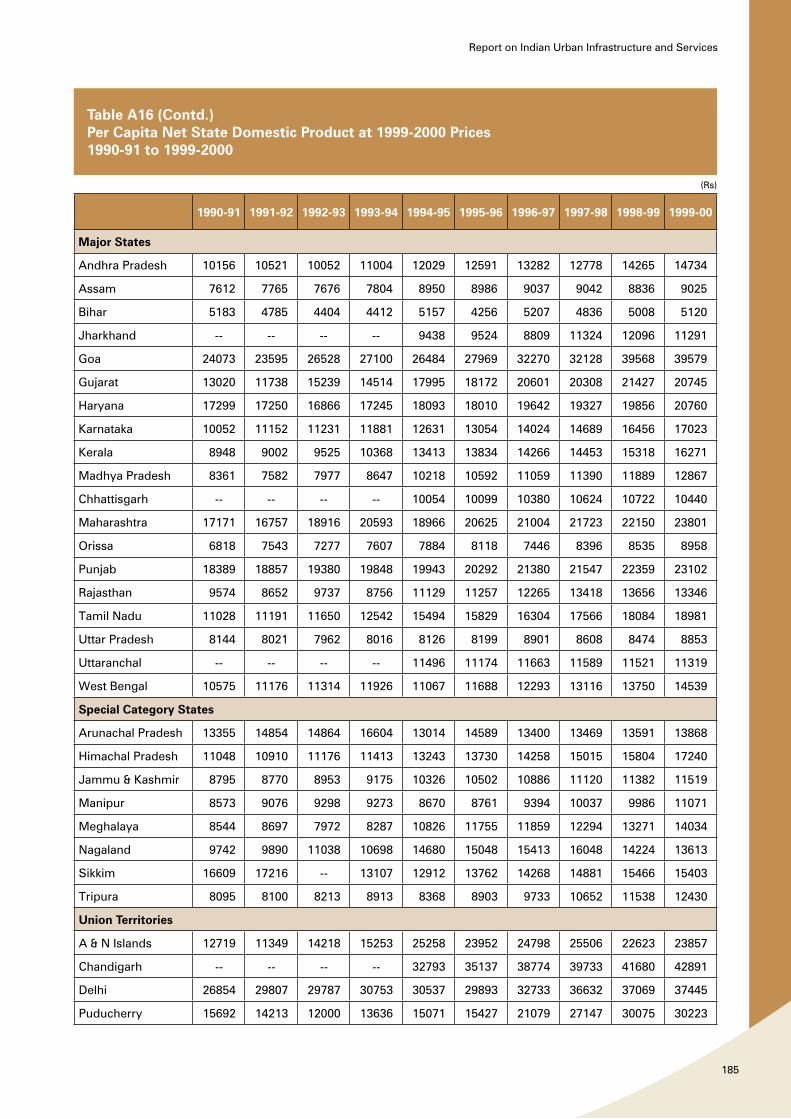
185
Report on Indian Urban Infrastructure and Services
1990-91 1991-92 1992-93 1993-94 1994-95 1995-96 1996-97 1997-98 1998-99 1999-00
Major States
Andhra Pradesh 10156 10521 10052 11004 12029 12591 13282 12778 14265 14734
Assam 7612 7765 7676 7804 8950 8986 9037 9042 8836 9025
Bihar 5183 4785 4404 4412 5157 4256 5207 4836 5008 5120
Jharkhand -- -- -- -- 9438 9524 8809 11324 12096 11291
Goa 24073 23595 26528 27100 26484 27969 32270 32128 39568 39579
Gujarat 13020 11738 15239 14514 17995 18172 20601 20308 21427 20745
Haryana 17299 17250 16866 17245 18093 18010 19642 19327 19856 20760
Karnataka 10052 11152 11231 11881 12631 13054 14024 14689 16456 17023
Kerala 8948 9002 9525 10368 13413 13834 14266 14453 15318 16271
Madhya Pradesh 8361 7582 7977 8647 10218 10592 11059 11390 11889 12867
Chhattisgarh -- -- -- -- 10054 10099 10380 10624 10722 10440
Maharashtra 17171 16757 18916 20593 18966 20625 21004 21723 22150 23801
Orissa 6818 7543 7277 7607 7884 8118 7446 8396 8535 8958
Punjab 18389 18857 19380 19848 19943 20292 21380 21547 22359 23102
Rajasthan 9574 8652 9737 8756 11129 11257 12265 13418 13656 13346
Tamil Nadu 11028 11191 11650 12542 15494 15829 16304 17566 18084 18981
Uttar Pradesh 8144 8021 7962 8016 8126 8199 8901 8608 8474 8853
Uttaranchal -- -- -- -- 11496 11174 11663 11589 11521 11319
West Bengal 10575 11176 11314 11926 11067 11688 12293 13116 13750 14539
Special Category States
Arunachal Pradesh 13355 14854 14864 16604 13014 14589 13400 13469 13591 13868
Himachal Pradesh 11048 10910 11176 11413 13243 13730 14258 15015 15804 17240
Jammu & Kashmir 8795 8770 8953 9175 10326 10502 10886 11120 11382 11519
Manipur 8573 9076 9298 9273 8670 8761 9394 10037 9986 11071
Meghalaya 8544 8697 7972 8287 10826 11755 11859 12294 13271 14034
Nagaland 9742 9890 11038 10698 14680 15048 15413 16048 14224 13613
Sikkim 16609 17216 -- 13107 12912 13762 14268 14881 15466 15403
Tripura 8095 8100 8213 8913 8368 8903 9733 10652 11538 12430
Union Territories
A & N Islands 12719 11349 14218 15253 25258 23952 24798 25506 22623 23857
Chandigarh -- -- -- -- 32793 35137 38774 39733 41680 42891
Delhi 26854 29807 29787 30753 30537 29893 32733 36632 37069 37445
Puducherry 15692 14213 12000 13636 15071 15427 21079 27147 30075 30223
Table A16 (Contd.)Per Capita Net State Domestic Product at 1999-2000 Prices1990-91 to 1999-2000
(Rs)
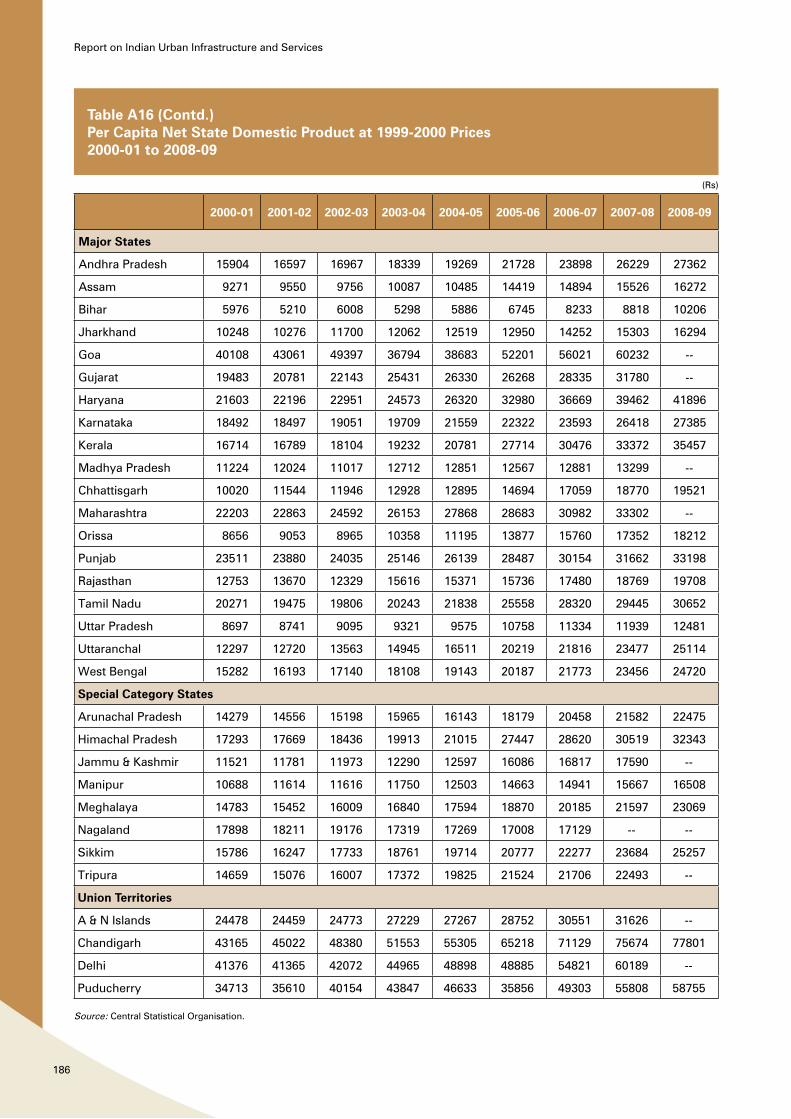
Report on Indian Urban Infrastructure and Services
186
2000-01 2001-02 2002-03 2003-04 2004-05 2005-06 2006-07 2007-08 2008-09
Major States
Andhra Pradesh 15904 16597 16967 18339 19269 21728 23898 26229 27362
Assam 9271 9550 9756 10087 10485 14419 14894 15526 16272
Bihar 5976 5210 6008 5298 5886 6745 8233 8818 10206
Jharkhand 10248 10276 11700 12062 12519 12950 14252 15303 16294
Goa 40108 43061 49397 36794 38683 52201 56021 60232 --
Gujarat 19483 20781 22143 25431 26330 26268 28335 31780 --
Haryana 21603 22196 22951 24573 26320 32980 36669 39462 41896
Karnataka 18492 18497 19051 19709 21559 22322 23593 26418 27385
Kerala 16714 16789 18104 19232 20781 27714 30476 33372 35457
Madhya Pradesh 11224 12024 11017 12712 12851 12567 12881 13299 --
Chhattisgarh 10020 11544 11946 12928 12895 14694 17059 18770 19521
Maharashtra 22203 22863 24592 26153 27868 28683 30982 33302 --
Orissa 8656 9053 8965 10358 11195 13877 15760 17352 18212
Punjab 23511 23880 24035 25146 26139 28487 30154 31662 33198
Rajasthan 12753 13670 12329 15616 15371 15736 17480 18769 19708
Tamil Nadu 20271 19475 19806 20243 21838 25558 28320 29445 30652
Uttar Pradesh 8697 8741 9095 9321 9575 10758 11334 11939 12481
Uttaranchal 12297 12720 13563 14945 16511 20219 21816 23477 25114
West Bengal 15282 16193 17140 18108 19143 20187 21773 23456 24720
Special Category States
Arunachal Pradesh 14279 14556 15198 15965 16143 18179 20458 21582 22475
Himachal Pradesh 17293 17669 18436 19913 21015 27447 28620 30519 32343
Jammu & Kashmir 11521 11781 11973 12290 12597 16086 16817 17590 --
Manipur 10688 11614 11616 11750 12503 14663 14941 15667 16508
Meghalaya 14783 15452 16009 16840 17594 18870 20185 21597 23069
Nagaland 17898 18211 19176 17319 17269 17008 17129 -- --
Sikkim 15786 16247 17733 18761 19714 20777 22277 23684 25257
Tripura 14659 15076 16007 17372 19825 21524 21706 22493 --
Union Territories
A & N Islands 24478 24459 24773 27229 27267 28752 30551 31626 --
Chandigarh 43165 45022 48380 51553 55305 65218 71129 75674 77801
Delhi 41376 41365 42072 44965 48898 48885 54821 60189 --
Puducherry 34713 35610 40154 43847 46633 35856 49303 55808 58755
Source: Central Statistical Organisation.
Table A16 (Contd.)Per Capita Net State Domestic Product at 1999-2000 Prices2000-01 to 2008-09
(Rs)
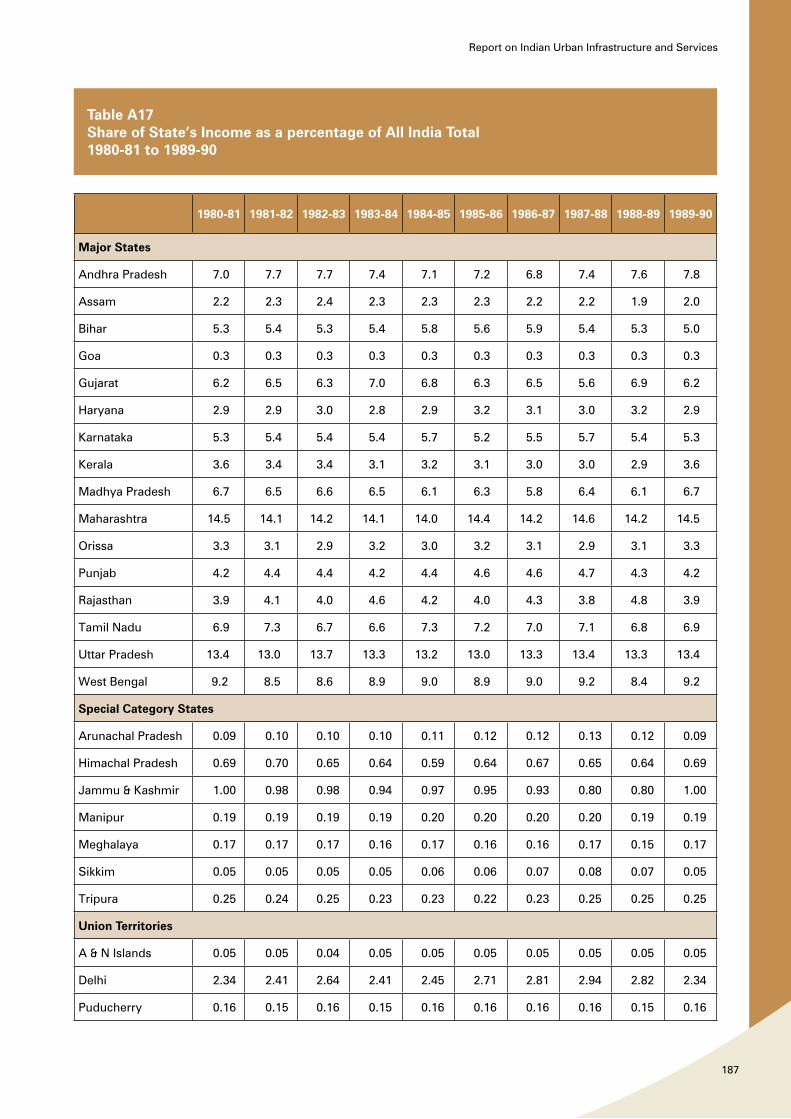
187
Report on Indian Urban Infrastructure and Services
1980-81 1981-82 1982-83 1983-84 1984-85 1985-86 1986-87 1987-88 1988-89 1989-90
Major States
Andhra Pradesh 7.0 7.7 7.7 7.4 7.1 7.2 6.8 7.4 7.6 7.8
Assam 2.2 2.3 2.4 2.3 2.3 2.3 2.2 2.2 1.9 2.0
Bihar 5.3 5.4 5.3 5.4 5.8 5.6 5.9 5.4 5.3 5.0
Goa 0.3 0.3 0.3 0.3 0.3 0.3 0.3 0.3 0.3 0.3
Gujarat 6.2 6.5 6.3 7.0 6.8 6.3 6.5 5.6 6.9 6.2
Haryana 2.9 2.9 3.0 2.8 2.9 3.2 3.1 3.0 3.2 2.9
Karnataka 5.3 5.4 5.4 5.4 5.7 5.2 5.5 5.7 5.4 5.3
Kerala 3.6 3.4 3.4 3.1 3.2 3.1 3.0 3.0 2.9 3.6
Madhya Pradesh 6.7 6.5 6.6 6.5 6.1 6.3 5.8 6.4 6.1 6.7
Maharashtra 14.5 14.1 14.2 14.1 14.0 14.4 14.2 14.6 14.2 14.5
Orissa 3.3 3.1 2.9 3.2 3.0 3.2 3.1 2.9 3.1 3.3
Punjab 4.2 4.4 4.4 4.2 4.4 4.6 4.6 4.7 4.3 4.2
Rajasthan 3.9 4.1 4.0 4.6 4.2 4.0 4.3 3.8 4.8 3.9
Tamil Nadu 6.9 7.3 6.7 6.6 7.3 7.2 7.0 7.1 6.8 6.9
Uttar Pradesh 13.4 13.0 13.7 13.3 13.2 13.0 13.3 13.4 13.3 13.4
West Bengal 9.2 8.5 8.6 8.9 9.0 8.9 9.0 9.2 8.4 9.2
Special Category States
Arunachal Pradesh 0.09 0.10 0.10 0.10 0.11 0.12 0.12 0.13 0.12 0.09
Himachal Pradesh 0.69 0.70 0.65 0.64 0.59 0.64 0.67 0.65 0.64 0.69
Jammu & Kashmir 1.00 0.98 0.98 0.94 0.97 0.95 0.93 0.80 0.80 1.00
Manipur 0.19 0.19 0.19 0.19 0.20 0.20 0.20 0.20 0.19 0.19
Meghalaya 0.17 0.17 0.17 0.16 0.17 0.16 0.16 0.17 0.15 0.17
Sikkim 0.05 0.05 0.05 0.05 0.06 0.06 0.07 0.08 0.07 0.05
Tripura 0.25 0.24 0.25 0.23 0.23 0.22 0.23 0.25 0.25 0.25
Union Territories
A & N Islands 0.05 0.05 0.04 0.05 0.05 0.05 0.05 0.05 0.05 0.05
Delhi 2.34 2.41 2.64 2.41 2.45 2.71 2.81 2.94 2.82 2.34
Puducherry 0.16 0.15 0.16 0.15 0.16 0.16 0.16 0.16 0.15 0.16
Table A17Share of State’s Income as a percentage of All India Total1980-81 to 1989-90
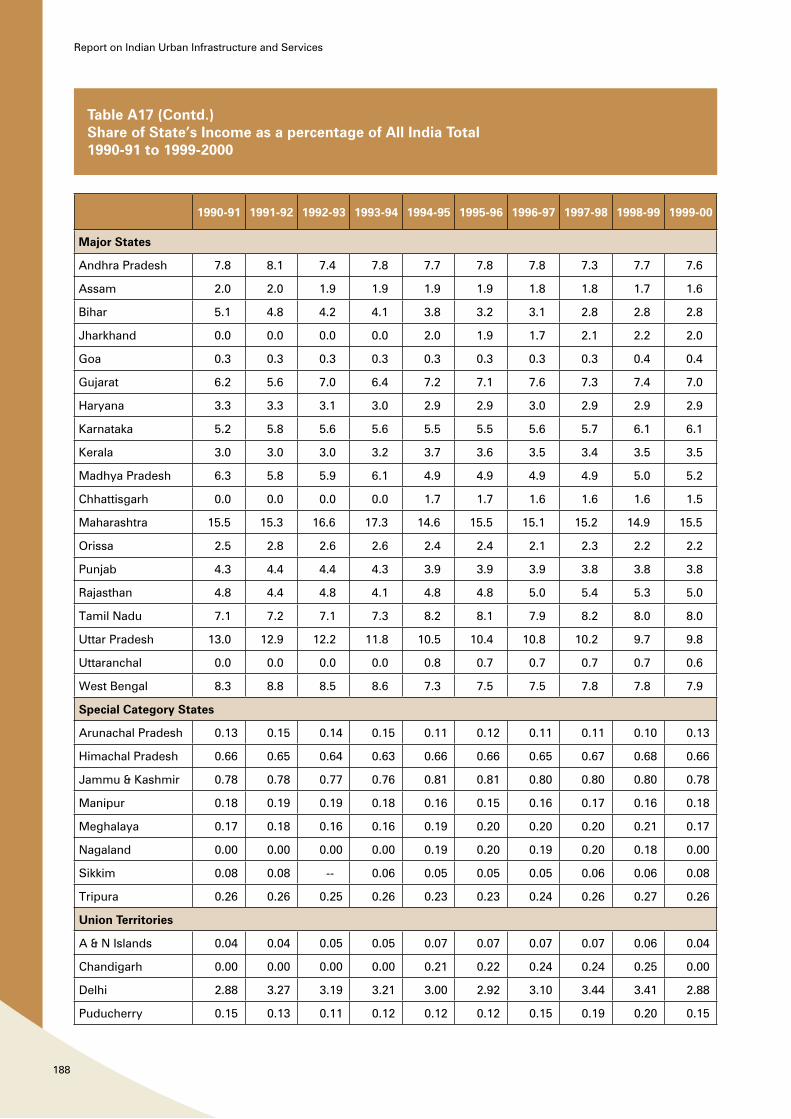
Report on Indian Urban Infrastructure and Services
188
1990-91 1991-92 1992-93 1993-94 1994-95 1995-96 1996-97 1997-98 1998-99 1999-00
Major States
Andhra Pradesh 7.8 8.1 7.4 7.8 7.7 7.8 7.8 7.3 7.7 7.6
Assam 2.0 2.0 1.9 1.9 1.9 1.9 1.8 1.8 1.7 1.6
Bihar 5.1 4.8 4.2 4.1 3.8 3.2 3.1 2.8 2.8 2.8
Jharkhand 0.0 0.0 0.0 0.0 2.0 1.9 1.7 2.1 2.2 2.0
Goa 0.3 0.3 0.3 0.3 0.3 0.3 0.3 0.3 0.4 0.4
Gujarat 6.2 5.6 7.0 6.4 7.2 7.1 7.6 7.3 7.4 7.0
Haryana 3.3 3.3 3.1 3.0 2.9 2.9 3.0 2.9 2.9 2.9
Karnataka 5.2 5.8 5.6 5.6 5.5 5.5 5.6 5.7 6.1 6.1
Kerala 3.0 3.0 3.0 3.2 3.7 3.6 3.5 3.4 3.5 3.5
Madhya Pradesh 6.3 5.8 5.9 6.1 4.9 4.9 4.9 4.9 5.0 5.2
Chhattisgarh 0.0 0.0 0.0 0.0 1.7 1.7 1.6 1.6 1.6 1.5
Maharashtra 15.5 15.3 16.6 17.3 14.6 15.5 15.1 15.2 14.9 15.5
Orissa 2.5 2.8 2.6 2.6 2.4 2.4 2.1 2.3 2.2 2.2
Punjab 4.3 4.4 4.4 4.3 3.9 3.9 3.9 3.8 3.8 3.8
Rajasthan 4.8 4.4 4.8 4.1 4.8 4.8 5.0 5.4 5.3 5.0
Tamil Nadu 7.1 7.2 7.1 7.3 8.2 8.1 7.9 8.2 8.0 8.0
Uttar Pradesh 13.0 12.9 12.2 11.8 10.5 10.4 10.8 10.2 9.7 9.8
Uttaranchal 0.0 0.0 0.0 0.0 0.8 0.7 0.7 0.7 0.7 0.6
West Bengal 8.3 8.8 8.5 8.6 7.3 7.5 7.5 7.8 7.8 7.9
Special Category States
Arunachal Pradesh 0.13 0.15 0.14 0.15 0.11 0.12 0.11 0.11 0.10 0.13
Himachal Pradesh 0.66 0.65 0.64 0.63 0.66 0.66 0.65 0.67 0.68 0.66
Jammu & Kashmir 0.78 0.78 0.77 0.76 0.81 0.81 0.80 0.80 0.80 0.78
Manipur 0.18 0.19 0.19 0.18 0.16 0.15 0.16 0.17 0.16 0.18
Meghalaya 0.17 0.18 0.16 0.16 0.19 0.20 0.20 0.20 0.21 0.17
Nagaland 0.00 0.00 0.00 0.00 0.19 0.20 0.19 0.20 0.18 0.00
Sikkim 0.08 0.08 -- 0.06 0.05 0.05 0.05 0.06 0.06 0.08
Tripura 0.26 0.26 0.25 0.26 0.23 0.23 0.24 0.26 0.27 0.26
Union Territories
A & N Islands 0.04 0.04 0.05 0.05 0.07 0.07 0.07 0.07 0.06 0.04
Chandigarh 0.00 0.00 0.00 0.00 0.21 0.22 0.24 0.24 0.25 0.00
Delhi 2.88 3.27 3.19 3.21 3.00 2.92 3.10 3.44 3.41 2.88
Puducherry 0.15 0.13 0.11 0.12 0.12 0.12 0.15 0.19 0.20 0.15
Table A17 (Contd.)Share of State’s Income as a percentage of All India Total1990-91 to 1999-2000

189
Report on Indian Urban Infrastructure and Services
2000-01 2001-02 2002-03 2003-04 2004-05 2005-06 2006-07 2007-08 2008-09
Major States
Andhra Pradesh 8.1 8.2 8.1 8.1 8.1 8.3 8.4 8.5 12.0
Assam 1.6 1.7 1.6 1.6 1.6 2.0 1.9 1.8 2.6
Bihar 3.3 2.8 3.2 2.6 2.8 2.9 3.3 3.2 5.1
Jharkhand 1.8 1.8 2.0 1.9 1.9 1.8 1.8 1.8 2.6
Goa 0.4 0.4 0.4 0.3 0.3 0.4 0.4 0.4 --
Gujarat 6.6 6.9 7.1 7.6 7.5 6.8 6.8 7.1 --
Haryana 3.0 3.1 3.1 3.1 3.1 3.6 3.7 3.7 5.4
Karnataka 6.5 6.4 6.3 6.1 6.3 5.9 5.8 6.0 8.4
Kerala 3.6 3.5 3.6 3.6 3.6 4.4 4.4 4.4 6.4
Madhya Pradesh 4.5 4.8 4.2 4.6 4.4 3.9 3.7 3.6 --
Chhattisgarh 1.4 1.6 1.6 1.6 1.5 1.6 1.7 1.8 2.5
Maharashtra 14.4 14.5 15.0 14.9 15.1 14.2 14.1 14.1 --
Orissa 2.1 2.2 2.1 2.2 2.3 2.6 2.7 2.7 3.9
Punjab 3.9 3.8 3.7 3.6 3.6 3.6 3.5 3.4 4.9
Rajasthan 4.8 5.1 4.4 5.3 4.9 4.6 4.7 4.8 6.8
Tamil Nadu 8.5 7.9 7.7 7.3 7.4 7.9 8.0 7.7 10.8
Uttar Pradesh 9.6 9.5 9.6 9.3 9.1 9.3 9.1 8.9 12.7
Uttaranchal 0.7 0.7 0.7 0.8 0.8 0.9 0.9 0.9 1.3
West Bengal 8.2 8.5 8.6 8.5 8.5 8.1 8.1 8.0 11.5
Special Category States
Arunachal Pradesh 0.10 0.10 0.10 0.10 0.10 0.10 0.10 0.10 0.14
Himachal Pradesh 0.71 0.71 0.71 0.72 0.72 0.86 0.83 0.83 1.19
Jammu & Kashmir 0.78 0.78 0.78 0.76 0.74 0.83 0.80 0.78 --
Manipur 0.16 0.17 0.17 0.16 0.16 0.18 0.17 0.16 0.23
Meghalaya 0.23 0.23 0.23 0.23 0.23 0.22 0.22 0.21 0.31
Nagaland 0.23 0.24 0.25 0.22 0.22 0.20 0.19 -- --
Sikkim 0.06 0.06 0.06 0.06 0.06 0.06 0.06 0.05 0.08
Tripura 0.32 0.31 0.32 0.33 0.35 0.35 0.32 0.31 --
Union Territories
A & N Islands 0.06 0.06 0.06 0.06 0.06 0.06 0.06 0.06 --
Chandigarh 0.26 0.27 0.28 0.29 0.30 0.34 0.35 0.36 0.53
Delhi 3.79 3.77 3.75 3.81 3.99 3.68 3.85 3.99 --
Puducherry 0.23 0.23 0.25 0.25 0.26 0.18 0.22 0.26 0.39
Source: Central Statistical Organisation.
Table A17 (Contd.)Share of State’s Income as a percentage of All India Total2000-01 to 2008-09
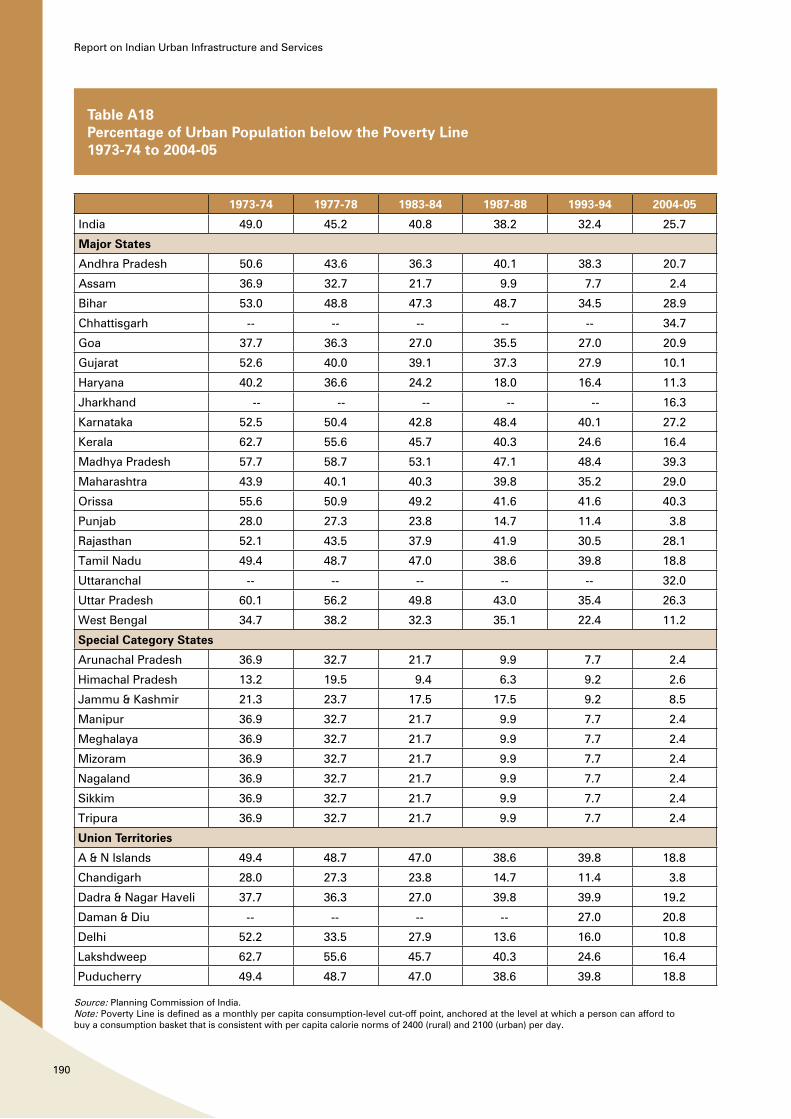
Report on Indian Urban Infrastructure and Services
190
1973-74 1977-78 1983-84 1987-88 1993-94 2004-05
India 49.0 45.2 40.8 38.2 32.4 25.7
Major States
Andhra Pradesh 50.6 43.6 36.3 40.1 38.3 20.7
Assam 36.9 32.7 21.7 9.9 7.7 2.4
Bihar 53.0 48.8 47.3 48.7 34.5 28.9
Chhattisgarh -- -- -- -- -- 34.7
Goa 37.7 36.3 27.0 35.5 27.0 20.9
Gujarat 52.6 40.0 39.1 37.3 27.9 10.1
Haryana 40.2 36.6 24.2 18.0 16.4 11.3
Jharkhand -- -- -- -- -- 16.3
Karnataka 52.5 50.4 42.8 48.4 40.1 27.2
Kerala 62.7 55.6 45.7 40.3 24.6 16.4
Madhya Pradesh 57.7 58.7 53.1 47.1 48.4 39.3
Maharashtra 43.9 40.1 40.3 39.8 35.2 29.0
Orissa 55.6 50.9 49.2 41.6 41.6 40.3
Punjab 28.0 27.3 23.8 14.7 11.4 3.8
Rajasthan 52.1 43.5 37.9 41.9 30.5 28.1
Tamil Nadu 49.4 48.7 47.0 38.6 39.8 18.8
Uttaranchal -- -- -- -- -- 32.0
Uttar Pradesh 60.1 56.2 49.8 43.0 35.4 26.3
West Bengal 34.7 38.2 32.3 35.1 22.4 11.2
Special Category States
Arunachal Pradesh 36.9 32.7 21.7 9.9 7.7 2.4
Himachal Pradesh 13.2 19.5 9.4 6.3 9.2 2.6
Jammu & Kashmir 21.3 23.7 17.5 17.5 9.2 8.5
Manipur 36.9 32.7 21.7 9.9 7.7 2.4
Meghalaya 36.9 32.7 21.7 9.9 7.7 2.4
Mizoram 36.9 32.7 21.7 9.9 7.7 2.4
Nagaland 36.9 32.7 21.7 9.9 7.7 2.4
Sikkim 36.9 32.7 21.7 9.9 7.7 2.4
Tripura 36.9 32.7 21.7 9.9 7.7 2.4
Union Territories
A & N Islands 49.4 48.7 47.0 38.6 39.8 18.8
Chandigarh 28.0 27.3 23.8 14.7 11.4 3.8
Dadra & Nagar Haveli 37.7 36.3 27.0 39.8 39.9 19.2
Daman & Diu -- -- -- -- 27.0 20.8
Delhi 52.2 33.5 27.9 13.6 16.0 10.8
Lakshdweep 62.7 55.6 45.7 40.3 24.6 16.4
Puducherry 49.4 48.7 47.0 38.6 39.8 18.8
Source: Planning Commission of India.Note: Poverty Line is defined as a monthly per capita consumption-level cut-off point, anchored at the level at which a person can afford to buy a consumption basket that is consistent with per capita calorie norms of 2400 (rural) and 2100 (urban) per day.
Table A18Percentage of Urban Population below the Poverty Line 1973-74 to 2004-05
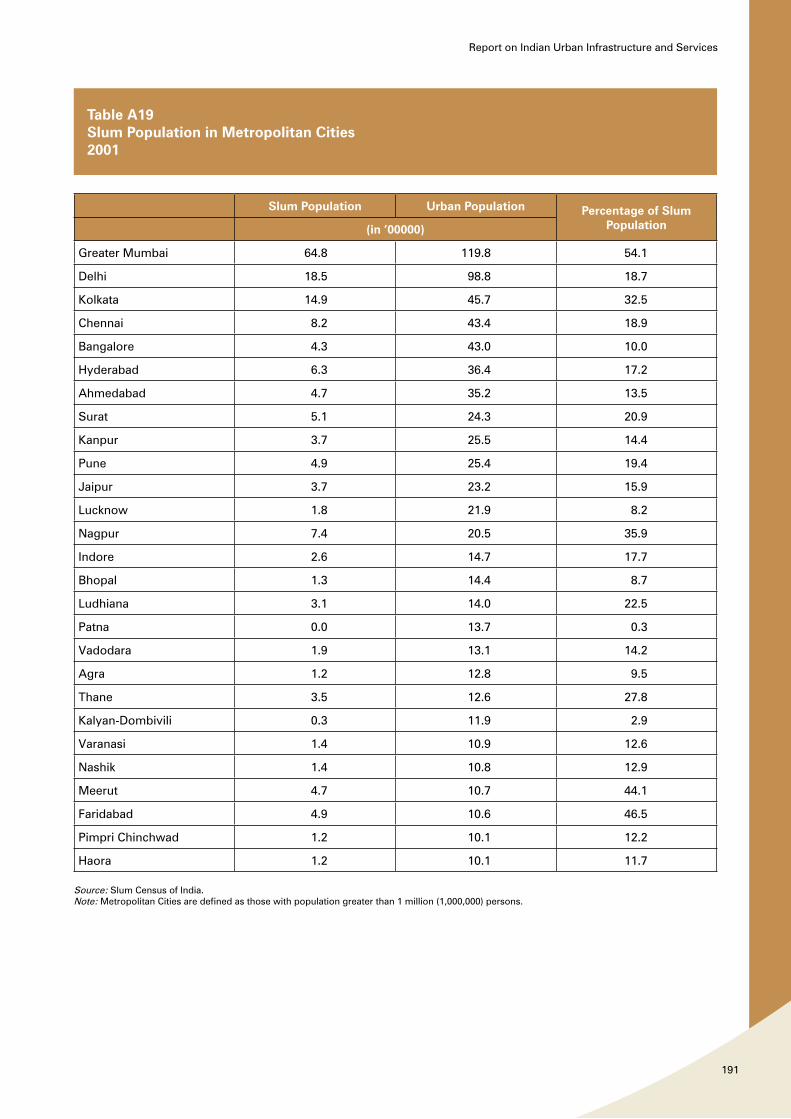
191
Report on Indian Urban Infrastructure and Services
Slum Population Urban Population Percentage of Slum Population(in ’00000)
Greater Mumbai 64.8 119.8 54.1
Delhi 18.5 98.8 18.7
Kolkata 14.9 45.7 32.5
Chennai 8.2 43.4 18.9
Bangalore 4.3 43.0 10.0
Hyderabad 6.3 36.4 17.2
Ahmedabad 4.7 35.2 13.5
Surat 5.1 24.3 20.9
Kanpur 3.7 25.5 14.4
Pune 4.9 25.4 19.4
Jaipur 3.7 23.2 15.9
Lucknow 1.8 21.9 8.2
Nagpur 7.4 20.5 35.9
Indore 2.6 14.7 17.7
Bhopal 1.3 14.4 8.7
Ludhiana 3.1 14.0 22.5
Patna 0.0 13.7 0.3
Vadodara 1.9 13.1 14.2
Agra 1.2 12.8 9.5
Thane 3.5 12.6 27.8
Kalyan-Dombivili 0.3 11.9 2.9
Varanasi 1.4 10.9 12.6
Nashik 1.4 10.8 12.9
Meerut 4.7 10.7 44.1
Faridabad 4.9 10.6 46.5
Pimpri Chinchwad 1.2 10.1 12.2
Haora 1.2 10.1 11.7
Source: Slum Census of India.Note: Metropolitan Cities are defined as those with population greater than 1 million (1,000,000) persons.
Table A19Slum Population in Metropolitan Cities2001
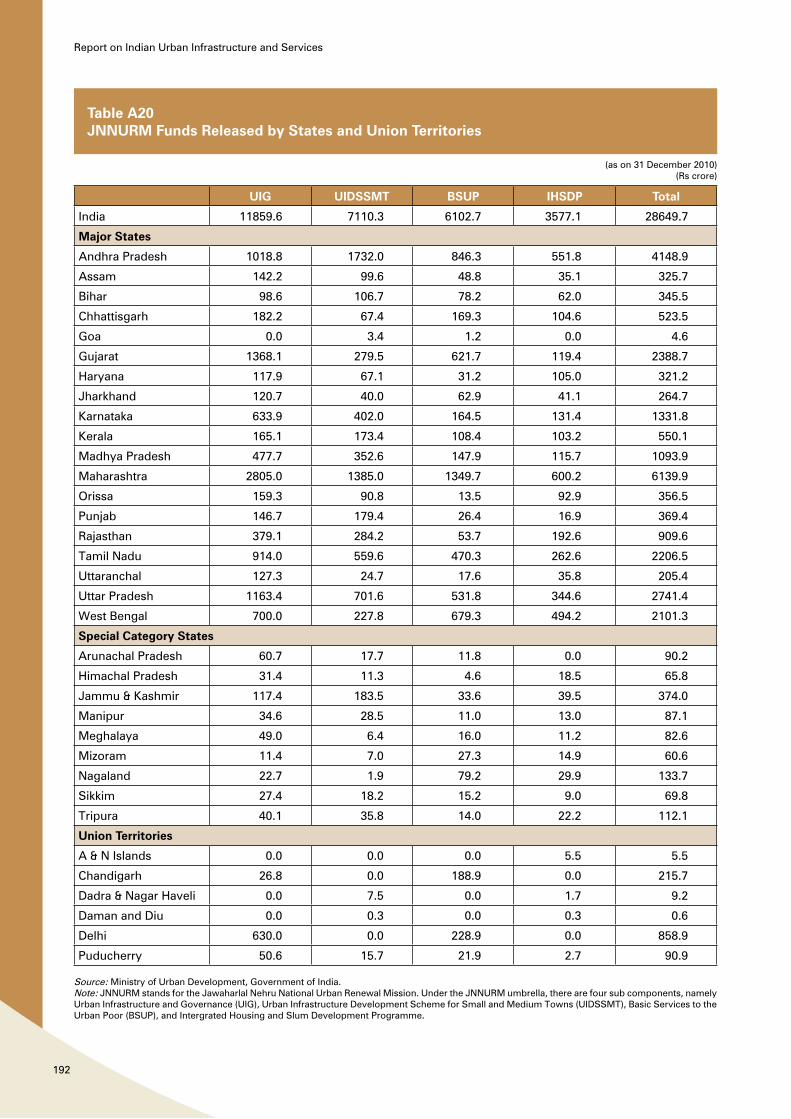
Report on Indian Urban Infrastructure and Services
192
Source: Ministry of Urban Development, Government of India.Note: JNNURM stands for the Jawaharlal Nehru National Urban Renewal Mission. Under the JNNURM umbrella, there are four sub components, namely Urban Infrastructure and Governance (UIG), Urban Infrastructure Development Scheme for Small and Medium Towns (UIDSSMT), Basic Services to the Urban Poor (BSUP), and Intergrated Housing and Slum Development Programme.
Source: Slum Census of India
Note: Metropolitan Cities are defined as those with population greater than 1 million (1000,000) persons.
UIG UIDSSMT BSUP IHSDP Total
India 11859.6 7110.3 6102.7 3577.1 28649.7
Major States
Andhra Pradesh 1018.8 1732.0 846.3 551.8 4148.9
Assam 142.2 99.6 48.8 35.1 325.7
Bihar 98.6 106.7 78.2 62.0 345.5
Chhattisgarh 182.2 67.4 169.3 104.6 523.5
Goa 0.0 3.4 1.2 0.0 4.6
Gujarat 1368.1 279.5 621.7 119.4 2388.7
Haryana 117.9 67.1 31.2 105.0 321.2
Jharkhand 120.7 40.0 62.9 41.1 264.7
Karnataka 633.9 402.0 164.5 131.4 1331.8
Kerala 165.1 173.4 108.4 103.2 550.1
Madhya Pradesh 477.7 352.6 147.9 115.7 1093.9
Maharashtra 2805.0 1385.0 1349.7 600.2 6139.9
Orissa 159.3 90.8 13.5 92.9 356.5
Punjab 146.7 179.4 26.4 16.9 369.4
Rajasthan 379.1 284.2 53.7 192.6 909.6
Tamil Nadu 914.0 559.6 470.3 262.6 2206.5
Uttaranchal 127.3 24.7 17.6 35.8 205.4
Uttar Pradesh 1163.4 701.6 531.8 344.6 2741.4
West Bengal 700.0 227.8 679.3 494.2 2101.3
Special Category States
Arunachal Pradesh 60.7 17.7 11.8 0.0 90.2
Himachal Pradesh 31.4 11.3 4.6 18.5 65.8
Jammu & Kashmir 117.4 183.5 33.6 39.5 374.0
Manipur 34.6 28.5 11.0 13.0 87.1
Meghalaya 49.0 6.4 16.0 11.2 82.6
Mizoram 11.4 7.0 27.3 14.9 60.6
Nagaland 22.7 1.9 79.2 29.9 133.7
Sikkim 27.4 18.2 15.2 9.0 69.8
Tripura 40.1 35.8 14.0 22.2 112.1
Union Territories
A & N Islands 0.0 0.0 0.0 5.5 5.5
Chandigarh 26.8 0.0 188.9 0.0 215.7
Dadra & Nagar Haveli 0.0 7.5 0.0 1.7 9.2
Daman and Diu 0.0 0.3 0.0 0.3 0.6
Delhi 630.0 0.0 228.9 0.0 858.9
Puducherry 50.6 15.7 21.9 2.7 90.9
(as on 31 December 2010)(Rs crore)
Table A20JNNURM Funds Released by States and Union Territories
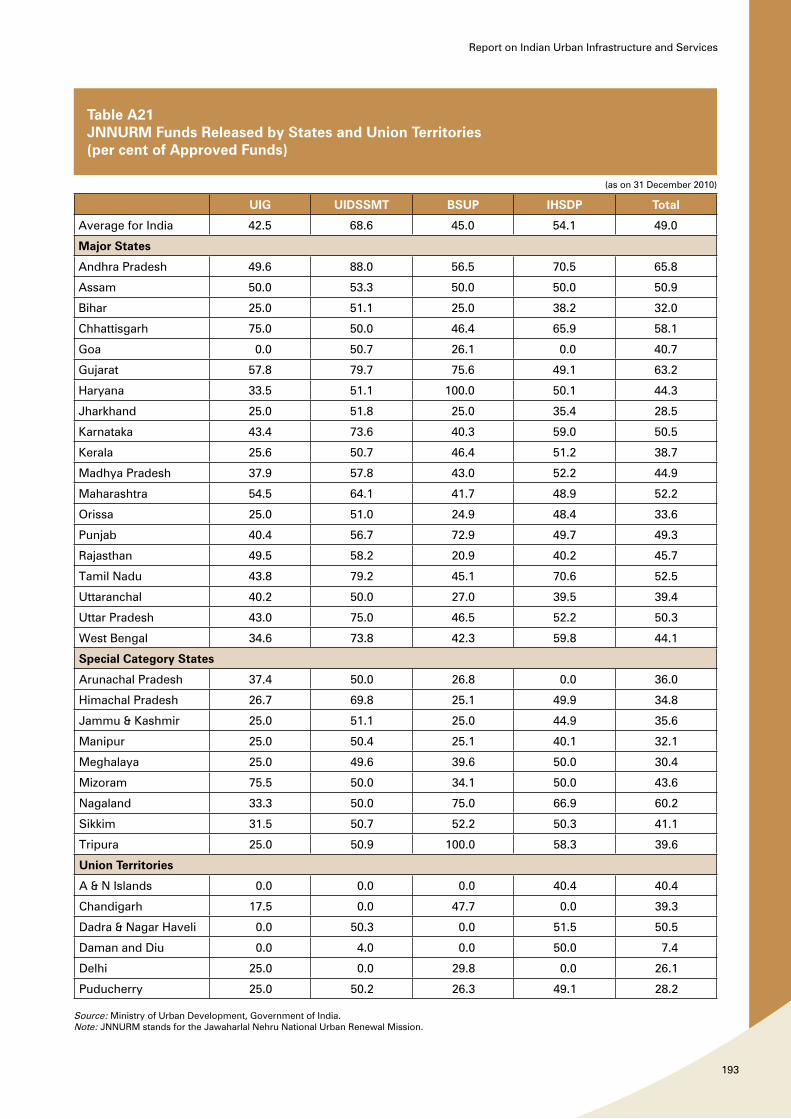
193
Report on Indian Urban Infrastructure and Services
UIG UIDSSMT BSUP IHSDP Total
Average for India 42.5 68.6 45.0 54.1 49.0
Major States
Andhra Pradesh 49.6 88.0 56.5 70.5 65.8
Assam 50.0 53.3 50.0 50.0 50.9
Bihar 25.0 51.1 25.0 38.2 32.0
Chhattisgarh 75.0 50.0 46.4 65.9 58.1
Goa 0.0 50.7 26.1 0.0 40.7
Gujarat 57.8 79.7 75.6 49.1 63.2
Haryana 33.5 51.1 100.0 50.1 44.3
Jharkhand 25.0 51.8 25.0 35.4 28.5
Karnataka 43.4 73.6 40.3 59.0 50.5
Kerala 25.6 50.7 46.4 51.2 38.7
Madhya Pradesh 37.9 57.8 43.0 52.2 44.9
Maharashtra 54.5 64.1 41.7 48.9 52.2
Orissa 25.0 51.0 24.9 48.4 33.6
Punjab 40.4 56.7 72.9 49.7 49.3
Rajasthan 49.5 58.2 20.9 40.2 45.7
Tamil Nadu 43.8 79.2 45.1 70.6 52.5
Uttaranchal 40.2 50.0 27.0 39.5 39.4
Uttar Pradesh 43.0 75.0 46.5 52.2 50.3
West Bengal 34.6 73.8 42.3 59.8 44.1
Special Category States
Arunachal Pradesh 37.4 50.0 26.8 0.0 36.0
Himachal Pradesh 26.7 69.8 25.1 49.9 34.8
Jammu & Kashmir 25.0 51.1 25.0 44.9 35.6
Manipur 25.0 50.4 25.1 40.1 32.1
Meghalaya 25.0 49.6 39.6 50.0 30.4
Mizoram 75.5 50.0 34.1 50.0 43.6
Nagaland 33.3 50.0 75.0 66.9 60.2
Sikkim 31.5 50.7 52.2 50.3 41.1
Tripura 25.0 50.9 100.0 58.3 39.6
Union Territories
A & N Islands 0.0 0.0 0.0 40.4 40.4
Chandigarh 17.5 0.0 47.7 0.0 39.3
Dadra & Nagar Haveli 0.0 50.3 0.0 51.5 50.5
Daman and Diu 0.0 4.0 0.0 50.0 7.4
Delhi 25.0 0.0 29.8 0.0 26.1
Puducherry 25.0 50.2 26.3 49.1 28.2
Source: Ministry of Urban Development, Government of India.Note: JNNURM stands for the Jawaharlal Nehru National Urban Renewal Mission.
(as on 31 December 2010)
Table A21JNNURM Funds Released by States and Union Territories(per cent of Approved Funds)
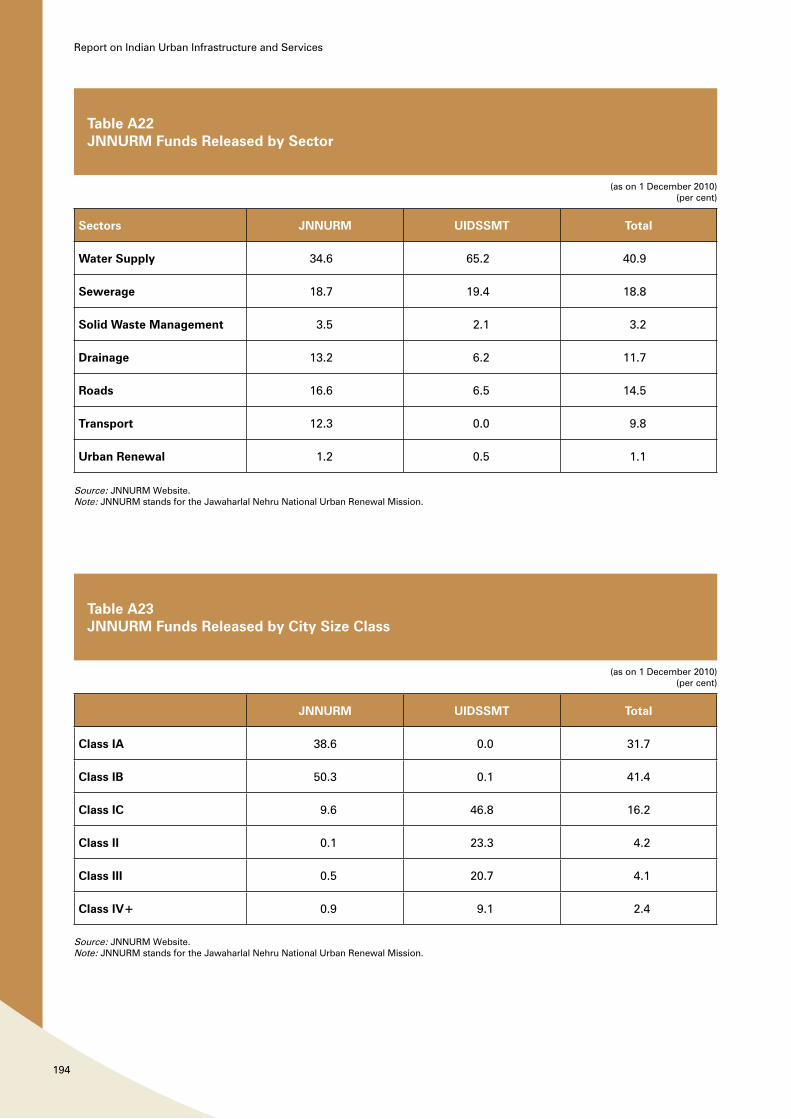
Report on Indian Urban Infrastructure and Services
194
Sectors JNNURM UIDSSMT Total
Water Supply 34.6 65.2 40.9
Sewerage 18.7 19.4 18.8
Solid Waste Management 3.5 2.1 3.2
Drainage 13.2 6.2 11.7
Roads 16.6 6.5 14.5
Transport 12.3 0.0 9.8
Urban Renewal 1.2 0.5 1.1
Source: JNNURM Website.Note: JNNURM stands for the Jawaharlal Nehru National Urban Renewal Mission.
(as on 1 December 2010)(per cent)
Table A22JNNURM Funds Released by Sector
JNNURM UIDSSMT Total
Class IA 38.6 0.0 31.7
Class IB 50.3 0.1 41.4
Class IC 9.6 46.8 16.2
Class II 0.1 23.3 4.2
Class III 0.5 20.7 4.1
Class IV+ 0.9 9.1 2.4
Source: JNNURM Website.Note: JNNURM stands for the Jawaharlal Nehru National Urban Renewal Mission.
(as on 1 December 2010)(per cent)
Table A23JNNURM Funds Released by City Size Class
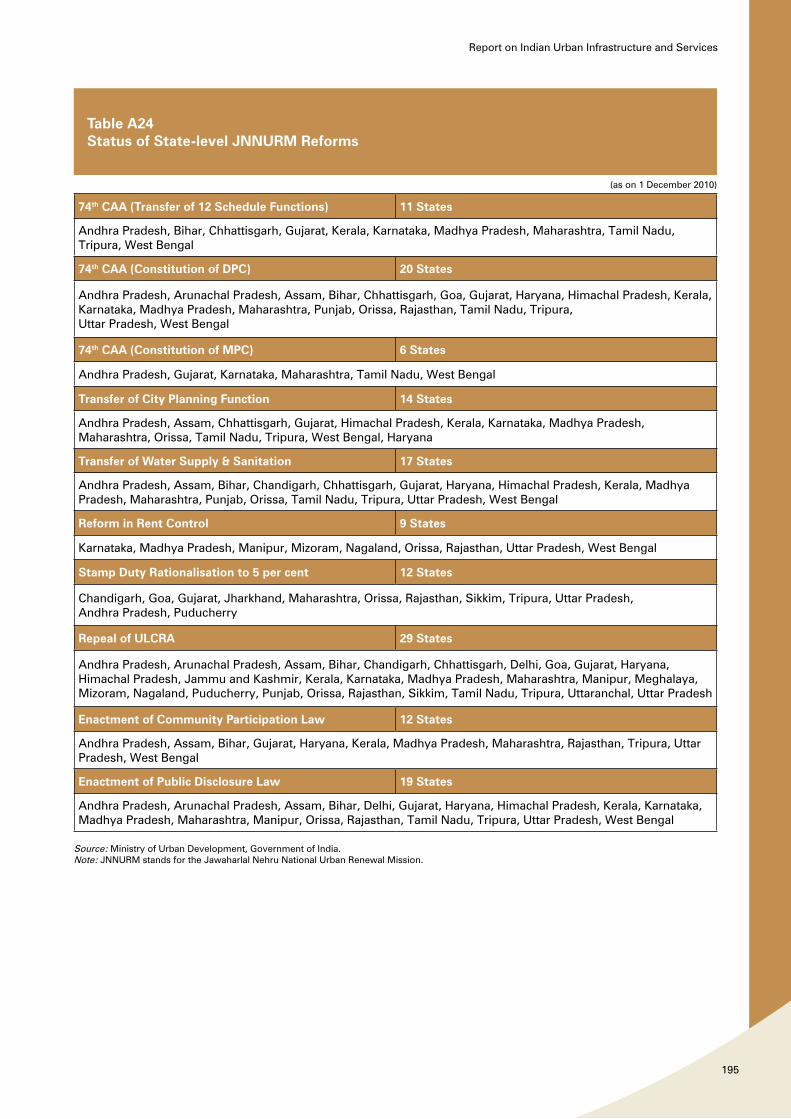
195
Report on Indian Urban Infrastructure and Services
74th CAA (Transfer of 12 Schedule Functions) 11 States
Andhra Pradesh, Bihar, Chhattisgarh, Gujarat, Kerala, Karnataka, Madhya Pradesh, Maharashtra, Tamil Nadu, Tripura, West Bengal
74th CAA (Constitution of DPC) 20 States
Andhra Pradesh, Arunachal Pradesh, Assam, Bihar, Chhattisgarh, Goa, Gujarat, Haryana, Himachal Pradesh, Kerala, Karnataka, Madhya Pradesh, Maharashtra, Punjab, Orissa, Rajasthan, Tamil Nadu, Tripura, Uttar Pradesh, West Bengal
74th CAA (Constitution of MPC) 6 States
Andhra Pradesh, Gujarat, Karnataka, Maharashtra, Tamil Nadu, West Bengal
Transfer of City Planning Function 14 States
Andhra Pradesh, Assam, Chhattisgarh, Gujarat, Himachal Pradesh, Kerala, Karnataka, Madhya Pradesh, Maharashtra, Orissa, Tamil Nadu, Tripura, West Bengal, Haryana
Transfer of Water Supply & Sanitation 17 States
Andhra Pradesh, Assam, Bihar, Chandigarh, Chhattisgarh, Gujarat, Haryana, Himachal Pradesh, Kerala, Madhya Pradesh, Maharashtra, Punjab, Orissa, Tamil Nadu, Tripura, Uttar Pradesh, West Bengal
Reform in Rent Control 9 States
Karnataka, Madhya Pradesh, Manipur, Mizoram, Nagaland, Orissa, Rajasthan, Uttar Pradesh, West Bengal
Stamp Duty Rationalisation to 5 per cent 12 States
Chandigarh, Goa, Gujarat, Jharkhand, Maharashtra, Orissa, Rajasthan, Sikkim, Tripura, Uttar Pradesh, Andhra Pradesh, Puducherry
Repeal of ULCRA 29 States
Andhra Pradesh, Arunachal Pradesh, Assam, Bihar, Chandigarh, Chhattisgarh, Delhi, Goa, Gujarat, Haryana, Himachal Pradesh, Jammu and Kashmir, Kerala, Karnataka, Madhya Pradesh, Maharashtra, Manipur, Meghalaya, Mizoram, Nagaland, Puducherry, Punjab, Orissa, Rajasthan, Sikkim, Tamil Nadu, Tripura, Uttaranchal, Uttar Pradesh
Enactment of Community Participation Law 12 States
Andhra Pradesh, Assam, Bihar, Gujarat, Haryana, Kerala, Madhya Pradesh, Maharashtra, Rajasthan, Tripura, Uttar Pradesh, West Bengal
Enactment of Public Disclosure Law 19 States
Andhra Pradesh, Arunachal Pradesh, Assam, Bihar, Delhi, Gujarat, Haryana, Himachal Pradesh, Kerala, Karnataka, Madhya Pradesh, Maharashtra, Manipur, Orissa, Rajasthan, Tamil Nadu, Tripura, Uttar Pradesh, West Bengal
(as on 1 December 2010)
Source: Ministry of Urban Development, Government of India.Note: JNNURM stands for the Jawaharlal Nehru National Urban Renewal Mission.
Table A24Status of State-level JNNURM Reforms
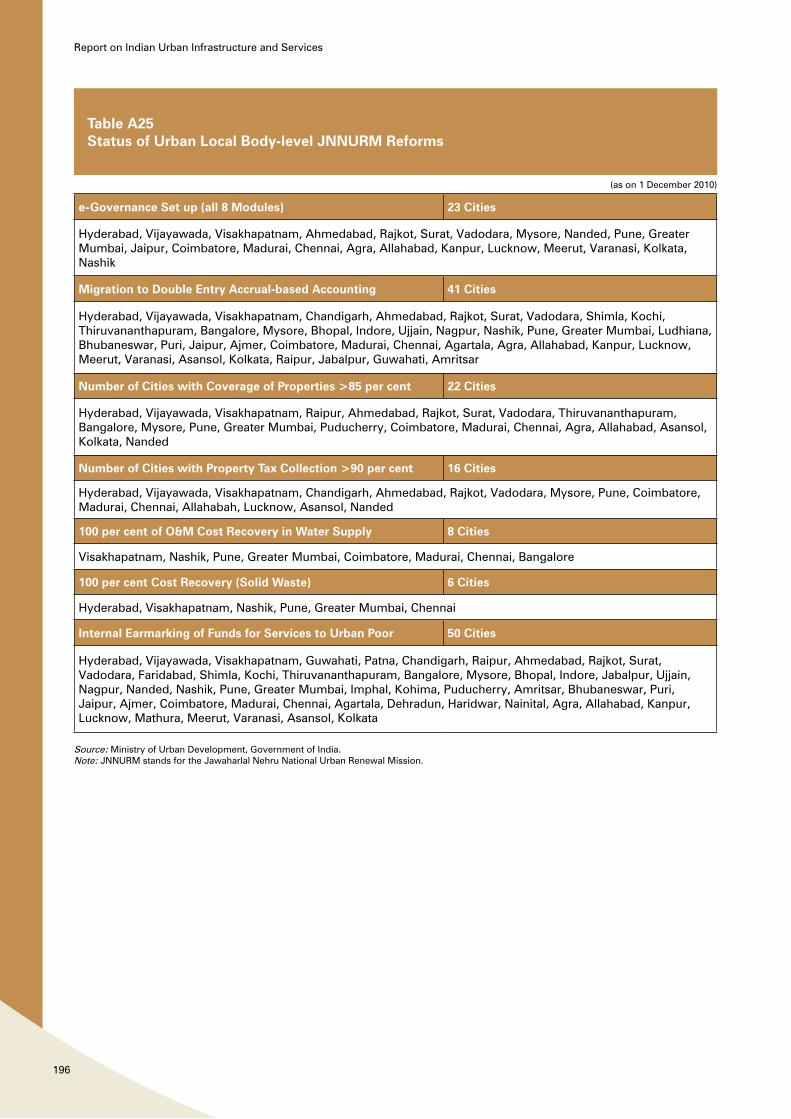
Report on Indian Urban Infrastructure and Services
196
e-Governance Set up (all 8 Modules) 23 Cities
Hyderabad, Vijayawada, Visakhapatnam, Ahmedabad, Rajkot, Surat, Vadodara, Mysore, Nanded, Pune, Greater Mumbai, Jaipur, Coimbatore, Madurai, Chennai, Agra, Allahabad, Kanpur, Lucknow, Meerut, Varanasi, Kolkata, Nashik
Migration to Double Entry Accrual-based Accounting 41 Cities
Hyderabad, Vijayawada, Visakhapatnam, Chandigarh, Ahmedabad, Rajkot, Surat, Vadodara, Shimla, Kochi, Thiruvananthapuram, Bangalore, Mysore, Bhopal, Indore, Ujjain, Nagpur, Nashik, Pune, Greater Mumbai, Ludhiana, Bhubaneswar, Puri, Jaipur, Ajmer, Coimbatore, Madurai, Chennai, Agartala, Agra, Allahabad, Kanpur, Lucknow, Meerut, Varanasi, Asansol, Kolkata, Raipur, Jabalpur, Guwahati, Amritsar
Number of Cities with Coverage of Properties >85 per cent 22 Cities
Hyderabad, Vijayawada, Visakhapatnam, Raipur, Ahmedabad, Rajkot, Surat, Vadodara, Thiruvananthapuram, Bangalore, Mysore, Pune, Greater Mumbai, Puducherry, Coimbatore, Madurai, Chennai, Agra, Allahabad, Asansol, Kolkata, Nanded
Number of Cities with Property Tax Collection >90 per cent 16 Cities
Hyderabad, Vijayawada, Visakhapatnam, Chandigarh, Ahmedabad, Rajkot, Vadodara, Mysore, Pune, Coimbatore, Madurai, Chennai, Allahabah, Lucknow, Asansol, Nanded
100 per cent of O&M Cost Recovery in Water Supply 8 Cities
Visakhapatnam, Nashik, Pune, Greater Mumbai, Coimbatore, Madurai, Chennai, Bangalore
100 per cent Cost Recovery (Solid Waste) 6 Cities
Hyderabad, Visakhapatnam, Nashik, Pune, Greater Mumbai, Chennai
Internal Earmarking of Funds for Services to Urban Poor 50 Cities
Hyderabad, Vijayawada, Visakhapatnam, Guwahati, Patna, Chandigarh, Raipur, Ahmedabad, Rajkot, Surat, Vadodara, Faridabad, Shimla, Kochi, Thiruvananthapuram, Bangalore, Mysore, Bhopal, Indore, Jabalpur, Ujjain, Nagpur, Nanded, Nashik, Pune, Greater Mumbai, Imphal, Kohima, Puducherry, Amritsar, Bhubaneswar, Puri, Jaipur, Ajmer, Coimbatore, Madurai, Chennai, Agartala, Dehradun, Haridwar, Nainital, Agra, Allahabad, Kanpur, Lucknow, Mathura, Meerut, Varanasi, Asansol, Kolkata
(as on 1 December 2010)
Source: Ministry of Urban Development, Government of India.Note: JNNURM stands for the Jawaharlal Nehru National Urban Renewal Mission.
Table A25Status of Urban Local Body-level JNNURM Reforms
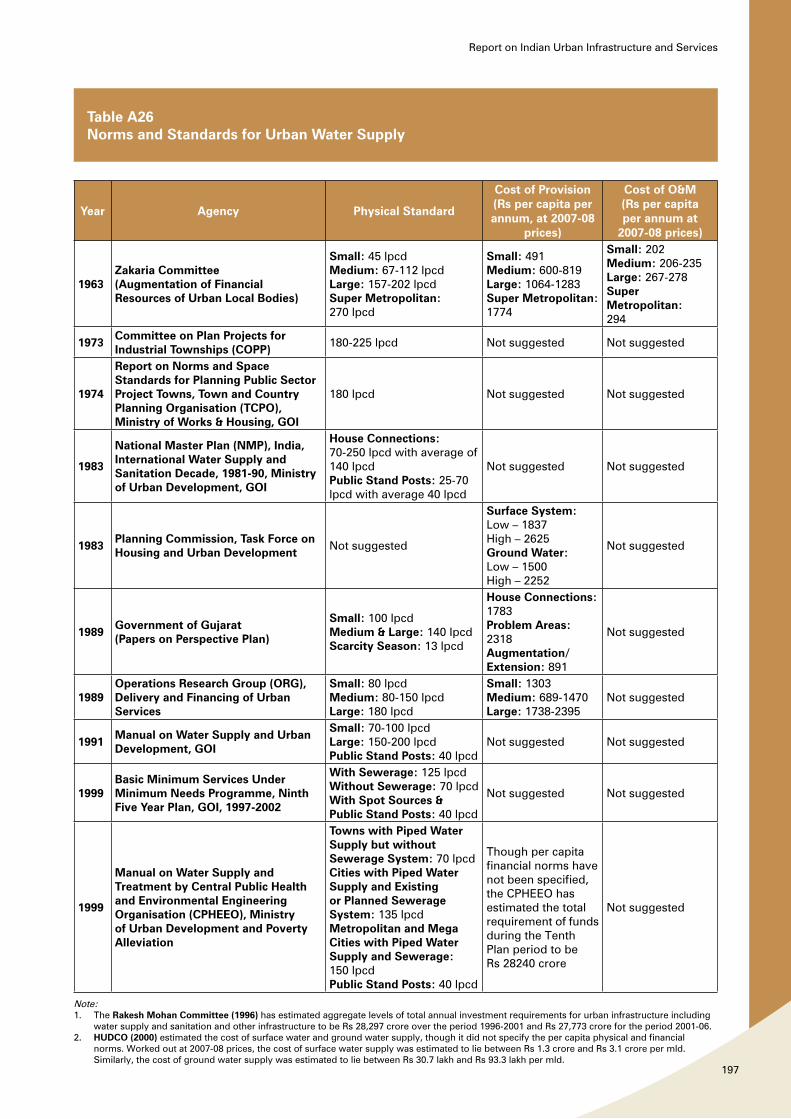
197
Report on Indian Urban Infrastructure and Services
Year Agency Physical Standard
Cost of Provision (Rs per capita per annum, at 2007-08
prices)
Cost of O&M (Rs per capita per annum at
2007-08 prices)
1963Zakaria Committee(Augmentation of Financial Resources of Urban Local Bodies)
Small: 45 lpcdMedium: 67-112 lpcdLarge: 157-202 lpcdSuper Metropolitan: 270 lpcd
Small: 491Medium: 600-819Large: 1064-1283Super Metropolitan: 1774
Small: 202Medium: 206-235Large: 267-278Super Metropolitan:294
1973Committee on Plan Projects for Industrial Townships (COPP)
180-225 lpcd Not suggested Not suggested
1974
Report on Norms and Space Standards for Planning Public Sector Project Towns, Town and Country Planning Organisation (TCPO), Ministry of Works & Housing, GOI
180 lpcd Not suggested Not suggested
1983
National Master Plan (NMP), India, International Water Supply and Sanitation Decade, 1981-90, Ministry of Urban Development, GOI
House Connections: 70-250 lpcd with average of 140 lpcdPublic Stand Posts: 25-70 lpcd with average 40 lpcd
Not suggested Not suggested
1983Planning Commission, Task Force on Housing and Urban Development
Not suggested
Surface System:Low – 1837High – 2625Ground Water:Low – 1500High – 2252
Not suggested
1989Government of Gujarat(Papers on Perspective Plan)
Small: 100 lpcdMedium & Large: 140 IpcdScarcity Season: 13 lpcd
House Connections: 1783Problem Areas: 2318Augmentation/Extension: 891
Not suggested
1989Operations Research Group (ORG), Delivery and Financing of Urban Services
Small: 80 lpcdMedium: 80-150 lpcdLarge: 180 lpcd
Small: 1303Medium: 689-1470Large: 1738-2395
Not suggested
1991Manual on Water Supply and Urban Development, GOI
Small: 70-100 lpcdLarge: 150-200 lpcdPublic Stand Posts: 40 lpcd
Not suggested Not suggested
1999Basic Minimum Services Under Minimum Needs Programme, Ninth Five Year Plan, GOI, 1997-2002
With Sewerage: 125 lpcdWithout Sewerage: 70 lpcdWith Spot Sources & Public Stand Posts: 40 lpcd
Not suggested Not suggested
1999
Manual on Water Supply and Treatment by Central Public Health and Environmental Engineering Organisation (CPHEEO), Ministry of Urban Development and Poverty Alleviation
Towns with Piped Water Supply but without Sewerage System: 70 lpcdCities with Piped Water Supply and Existing or Planned Sewerage System: 135 lpcdMetropolitan and Mega Cities with Piped Water Supply and Sewerage: 150 lpcdPublic Stand Posts: 40 lpcd
Though per capita financial norms have not been specified, the CPHEEO has estimated the total requirement of funds during the Tenth Plan period to be Rs 28240 crore
Not suggested
Note: 1. The Rakesh Mohan Committee (1996) has estimated aggregate levels of total annual investment requirements for urban infrastructure including water supply and sanitation and other infrastructure to be Rs 28,297 crore over the period 1996-2001 and Rs 27,773 crore for the period 2001-06.2. HUDCO (2000) estimated the cost of surface water and ground water supply, though it did not specify the per capita physical and financial norms. Worked out at 2007-08 prices, the cost of surface water supply was estimated to lie between Rs 1.3 crore and Rs 3.1 crore per mld. Similarly, the cost of ground water supply was estimated to lie between Rs 30.7 lakh and Rs 93.3 lakh per mld.
Table A26Norms and Standards for Urban Water Supply
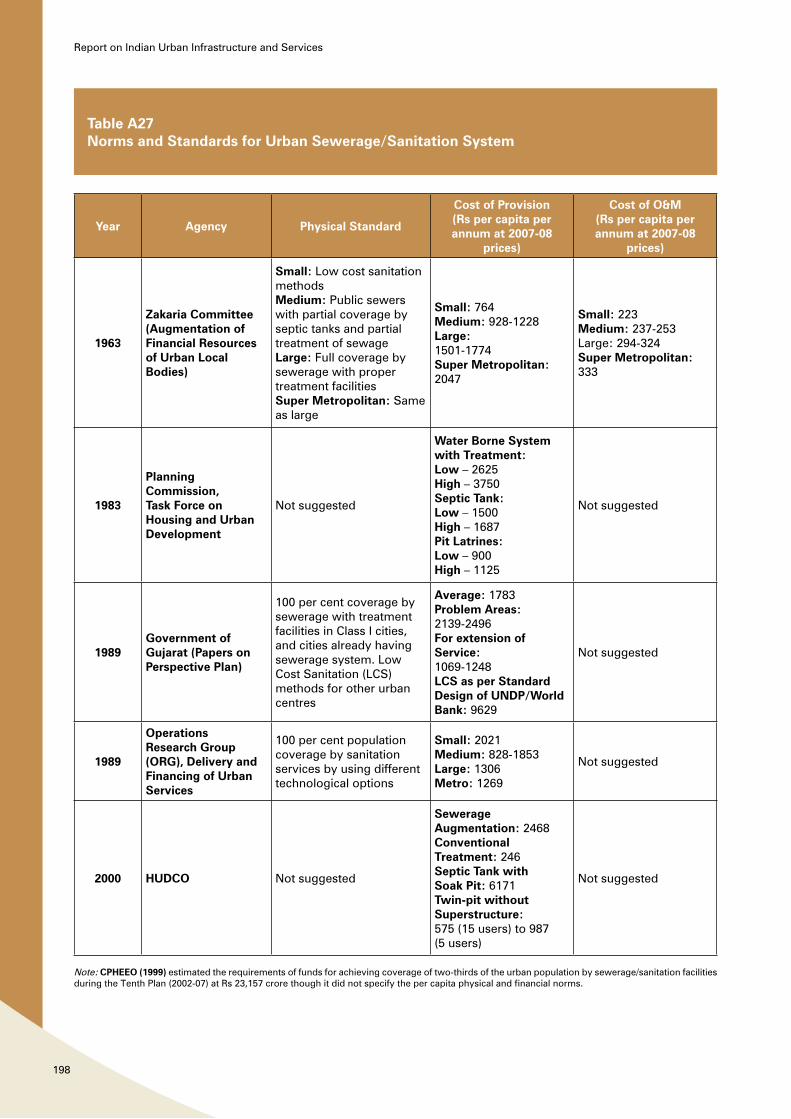
Report on Indian Urban Infrastructure and Services
198
Year Agency Physical Standard
Cost of Provision (Rs per capita per annum at 2007-08
prices)
Cost of O&M (Rs per capita per annum at 2007-08
prices)
1963
Zakaria Committee (Augmentation of Financial Resources of Urban Local Bodies)
Small: Low cost sanitation methodsMedium: Public sewers with partial coverage by septic tanks and partial treatment of sewageLarge: Full coverage by sewerage with proper treatment facilitiesSuper Metropolitan: Same as large
Small: 764Medium: 928-1228Large: 1501-1774Super Metropolitan: 2047
Small: 223Medium: 237-253Large: 294-324Super Metropolitan: 333
1983
Planning Commission, Task Force on Housing and Urban Development
Not suggested
Water Borne System with Treatment:Low – 2625High – 3750Septic Tank:Low – 1500High – 1687Pit Latrines:Low – 900High – 1125
Not suggested
1989Government of Gujarat (Papers on Perspective Plan)
100 per cent coverage by sewerage with treatment facilities in Class I cities, and cities already having sewerage system. Low Cost Sanitation (LCS) methods for other urban centres
Average: 1783Problem Areas: 2139-2496For extension of Service:1069-1248LCS as per Standard Design of UNDP/World Bank: 9629
Not suggested
1989
Operations Research Group (ORG), Delivery and Financing of Urban Services
100 per cent population coverage by sanitation services by using different technological options
Small: 2021Medium: 828-1853Large: 1306Metro: 1269
Not suggested
2000 HUDCO Not suggested
Sewerage Augmentation: 2468Conventional Treatment: 246Septic Tank with Soak Pit: 6171Twin-pit without Superstructure:575 (15 users) to 987(5 users)
Not suggested
Note: CPHEEO (1999) estimated the requirements of funds for achieving coverage of two-thirds of the urban population by sewerage/sanitation facilities during the Tenth Plan (2002-07) at Rs 23,157 crore though it did not specify the per capita physical and financial norms.
Table A27Norms and Standards for Urban Sewerage/Sanitation System
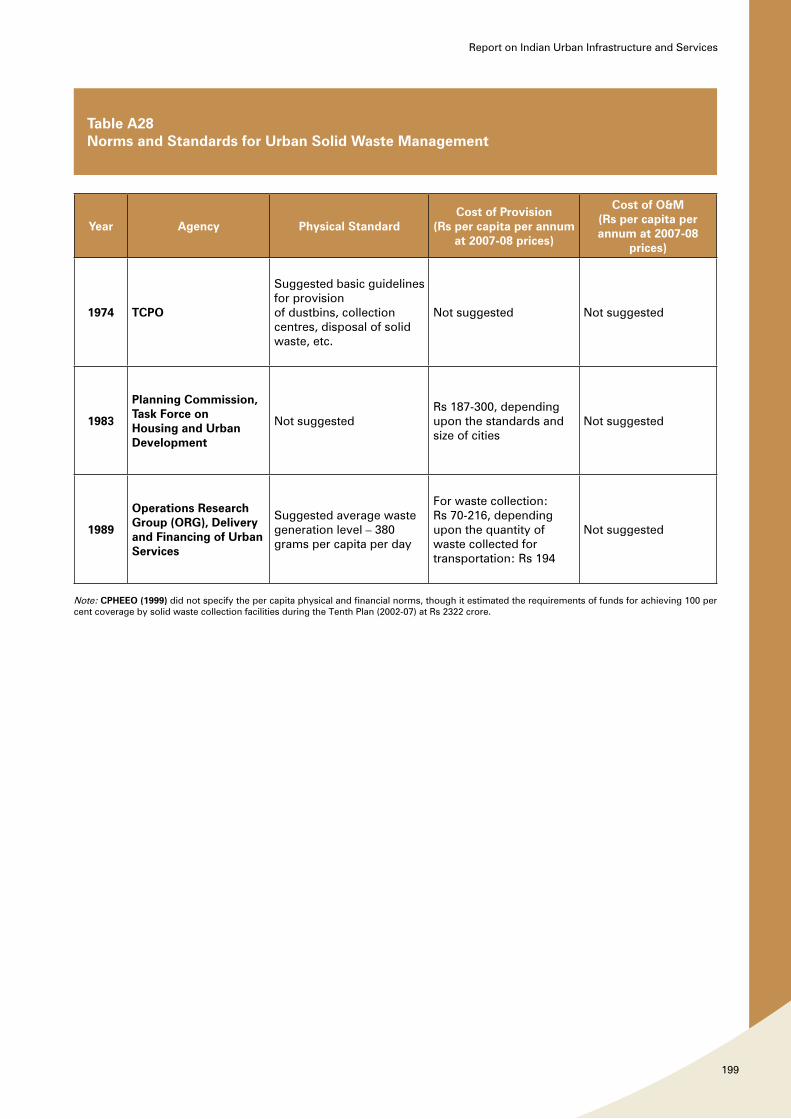
199
Report on Indian Urban Infrastructure and Services
Year Agency Physical StandardCost of Provision
(Rs per capita per annum at 2007-08 prices)
Cost of O&M (Rs per capita per annum at 2007-08
prices)
1974 TCPO
Suggested basic guidelines for provisionof dustbins, collection centres, disposal of solid waste, etc.
Not suggested Not suggested
1983
Planning Commission, Task Force on Housing and Urban Development
Not suggestedRs 187-300, depending upon the standards and size of cities
Not suggested
1989
Operations Research Group (ORG), Delivery and Financing of Urban Services
Suggested average waste generation level – 380 grams per capita per day
For waste collection: Rs 70-216, depending upon the quantity of waste collected for transportation: Rs 194
Not suggested
Note: CPHEEO (1999) did not specify the per capita physical and financial norms, though it estimated the requirements of funds for achieving 100 per cent coverage by solid waste collection facilities during the Tenth Plan (2002-07) at Rs 2322 crore.
Table A28Norms and Standards for Urban Solid Waste Management
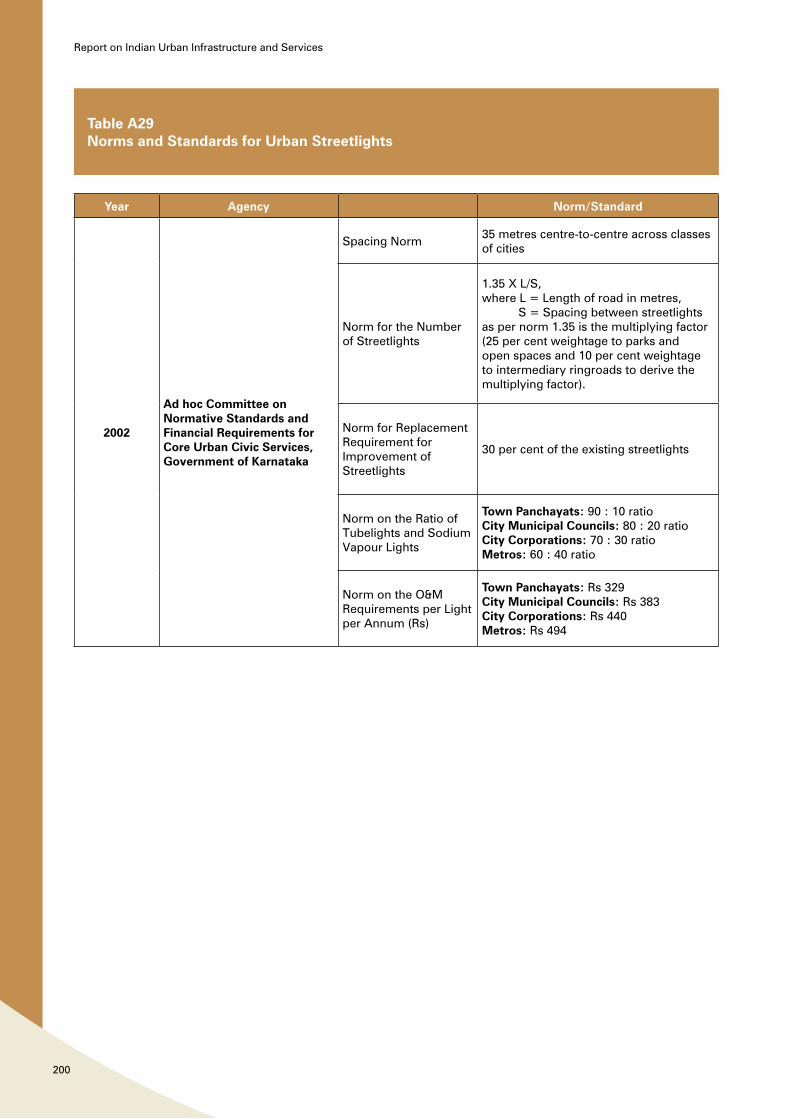
Report on Indian Urban Infrastructure and Services
200
Year Agency Norm/Standard
2002
Ad hoc Committee on Normative Standards and Financial Requirements for Core Urban Civic Services, Government of Karnataka
Spacing Norm 35 metres centre-to-centre across classes of cities
Norm for the Number of Streetlights
1.35 X L/S, where L = Length of road in metres, S = Spacing between streetlights as per norm 1.35 is the multiplying factor (25 per cent weightage to parks and open spaces and 10 per cent weightage to intermediary ringroads to derive the multiplying factor).
Norm for Replacement Requirement for Improvement of Streetlights
30 per cent of the existing streetlights
Norm on the Ratio of Tubelights and Sodium Vapour Lights
Town Panchayats: 90 : 10 ratioCity Municipal Councils: 80 : 20 ratioCity Corporations: 70 : 30 ratioMetros: 60 : 40 ratio
Norm on the O&M Requirements per Light per Annum (Rs)
Town Panchayats: Rs 329City Municipal Councils: Rs 383 City Corporations: Rs 440 Metros: Rs 494
Table A29Norms and Standards for Urban Streetlights
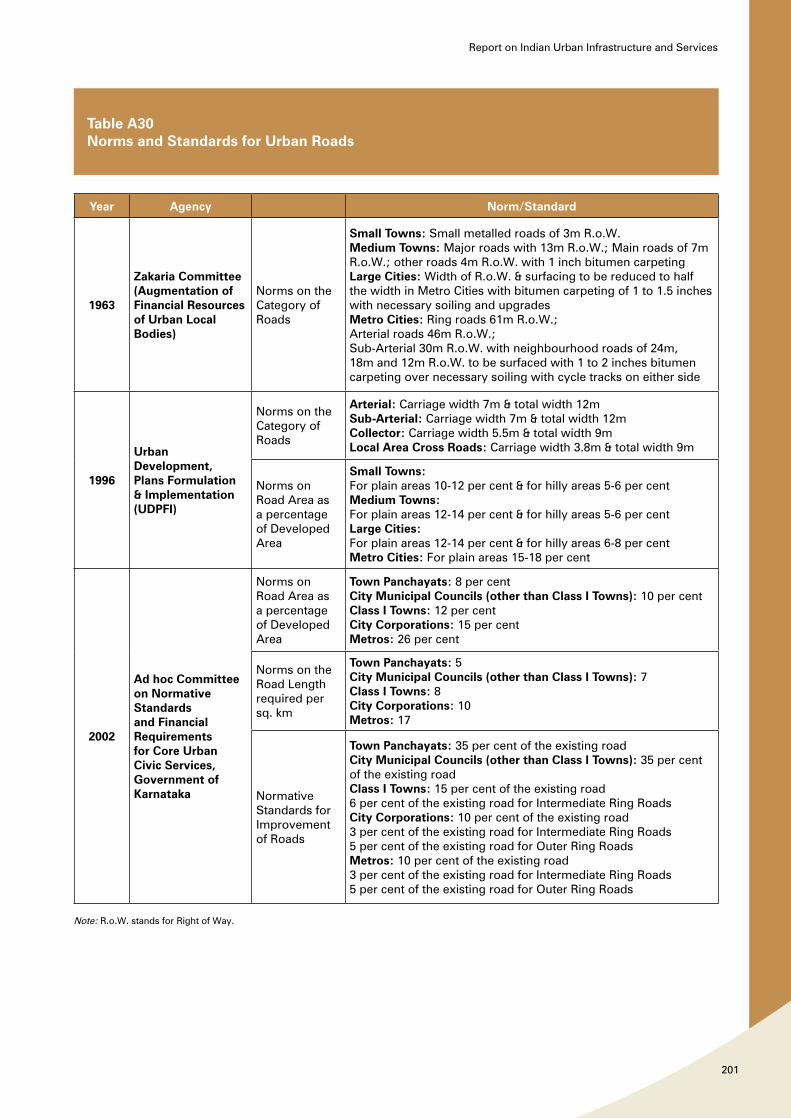
201
Report on Indian Urban Infrastructure and Services
Year Agency Norm/Standard
1963
Zakaria Committee(Augmentation of Financial Resources of Urban Local Bodies)
Norms on the Category of Roads
Small Towns: Small metalled roads of 3m R.o.W.Medium Towns: Major roads with 13m R.o.W.; Main roads of 7m R.o.W.; other roads 4m R.o.W. with 1 inch bitumen carpetingLarge Cities: Width of R.o.W. & surfacing to be reduced to half the width in Metro Cities with bitumen carpeting of 1 to 1.5 inches with necessary soiling and upgradesMetro Cities: Ring roads 61m R.o.W.; Arterial roads 46m R.o.W.;Sub-Arterial 30m R.o.W. with neighbourhood roads of 24m, 18m and 12m R.o.W. to be surfaced with 1 to 2 inches bitumen carpeting over necessary soiling with cycle tracks on either side
1996
Urban Development, Plans Formulation & Implementation (UDPFI)
Norms on the Category of Roads
Arterial: Carriage width 7m & total width 12mSub-Arterial: Carriage width 7m & total width 12mCollector: Carriage width 5.5m & total width 9mLocal Area Cross Roads: Carriage width 3.8m & total width 9m
Norms on Road Area as a percentage of Developed Area
Small Towns: For plain areas 10-12 per cent & for hilly areas 5-6 per centMedium Towns: For plain areas 12-14 per cent & for hilly areas 5-6 per centLarge Cities: For plain areas 12-14 per cent & for hilly areas 6-8 per centMetro Cities: For plain areas 15-18 per cent
2002
Ad hoc Committee on Normative Standards and Financial Requirements for Core Urban Civic Services, Government of Karnataka
Norms on Road Area as a percentage of Developed Area
Town Panchayats: 8 per centCity Municipal Councils (other than Class I Towns): 10 per centClass I Towns: 12 per centCity Corporations: 15 per centMetros: 26 per cent
Norms on the Road Length required per sq. km
Town Panchayats: 5City Municipal Councils (other than Class I Towns): 7Class I Towns: 8City Corporations: 10Metros: 17
Normative Standards for Improvementof Roads
Town Panchayats: 35 per cent of the existing roadCity Municipal Councils (other than Class I Towns): 35 per cent of the existing roadClass I Towns: 15 per cent of the existing road6 per cent of the existing road for Intermediate Ring RoadsCity Corporations: 10 per cent of the existing road3 per cent of the existing road for Intermediate Ring Roads5 per cent of the existing road for Outer Ring RoadsMetros: 10 per cent of the existing road3 per cent of the existing road for Intermediate Ring Roads5 per cent of the existing road for Outer Ring Roads
Table A30Norms and Standards for Urban Roads
Note: R.o.W. stands for Right of Way.
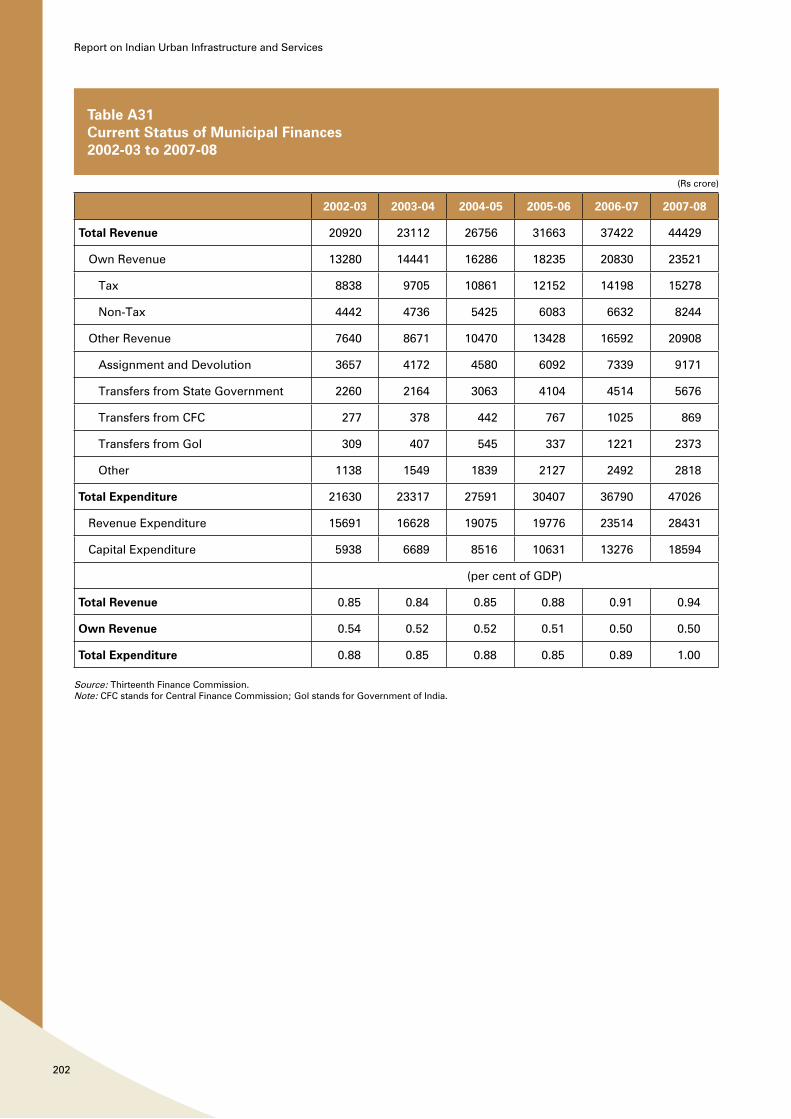
Report on Indian Urban Infrastructure and Services
202
2002-03 2003-04 2004-05 2005-06 2006-07 2007-08
Total Revenue 20920 23112 26756 31663 37422 44429
Own Revenue 13280 14441 16286 18235 20830 23521
Tax 8838 9705 10861 12152 14198 15278
Non-Tax 4442 4736 5425 6083 6632 8244
Other Revenue 7640 8671 10470 13428 16592 20908
Assignment and Devolution 3657 4172 4580 6092 7339 9171
Transfers from State Government 2260 2164 3063 4104 4514 5676
Transfers from CFC 277 378 442 767 1025 869
Transfers from GoI 309 407 545 337 1221 2373
Other 1138 1549 1839 2127 2492 2818
Total Expenditure 21630 23317 27591 30407 36790 47026
Revenue Expenditure 15691 16628 19075 19776 23514 28431
Capital Expenditure 5938 6689 8516 10631 13276 18594
(per cent of GDP)
Total Revenue 0.85 0.84 0.85 0.88 0.91 0.94
Own Revenue 0.54 0.52 0.52 0.51 0.50 0.50
Total Expenditure 0.88 0.85 0.88 0.85 0.89 1.00
(Rs crore)
Source: Thirteenth Finance Commission.Note: CFC stands for Central Finance Commission; GoI stands for Government of India.
Table A31Current Status of Municipal Finances2002-03 to 2007-08
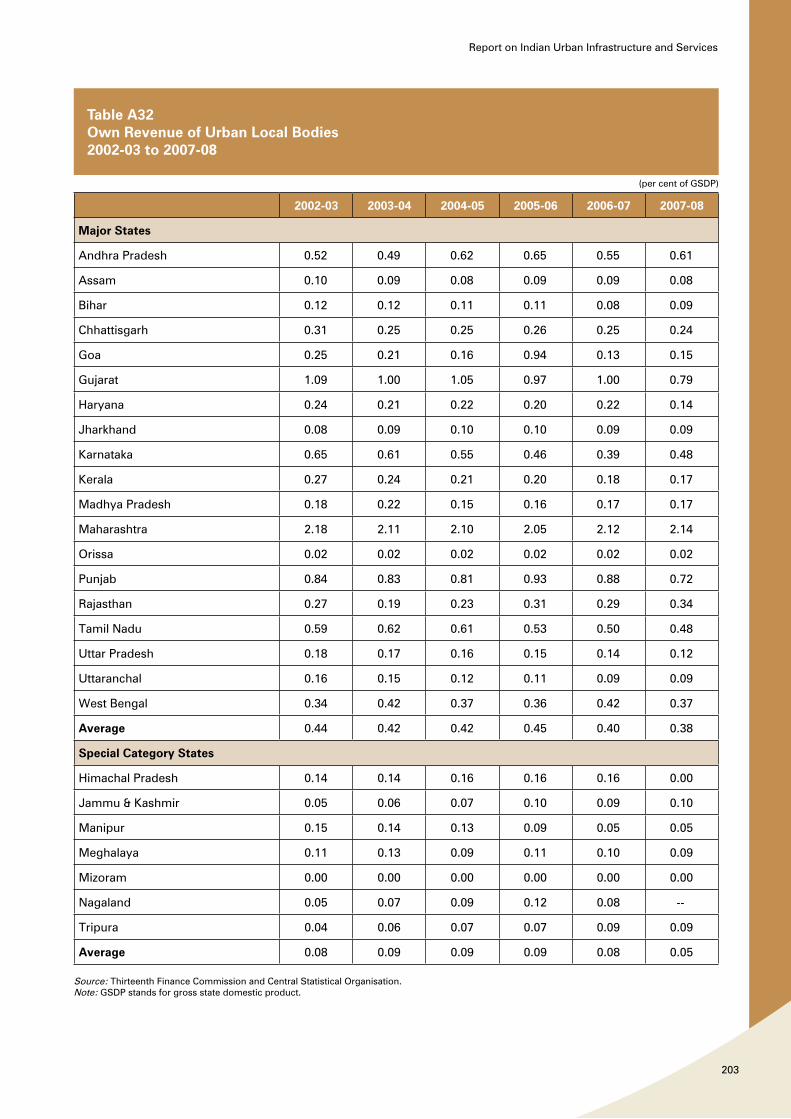
203
Report on Indian Urban Infrastructure and Services
2002-03 2003-04 2004-05 2005-06 2006-07 2007-08
Major States
Andhra Pradesh 0.52 0.49 0.62 0.65 0.55 0.61
Assam 0.10 0.09 0.08 0.09 0.09 0.08
Bihar 0.12 0.12 0.11 0.11 0.08 0.09
Chhattisgarh 0.31 0.25 0.25 0.26 0.25 0.24
Goa 0.25 0.21 0.16 0.94 0.13 0.15
Gujarat 1.09 1.00 1.05 0.97 1.00 0.79
Haryana 0.24 0.21 0.22 0.20 0.22 0.14
Jharkhand 0.08 0.09 0.10 0.10 0.09 0.09
Karnataka 0.65 0.61 0.55 0.46 0.39 0.48
Kerala 0.27 0.24 0.21 0.20 0.18 0.17
Madhya Pradesh 0.18 0.22 0.15 0.16 0.17 0.17
Maharashtra 2.18 2.11 2.10 2.05 2.12 2.14
Orissa 0.02 0.02 0.02 0.02 0.02 0.02
Punjab 0.84 0.83 0.81 0.93 0.88 0.72
Rajasthan 0.27 0.19 0.23 0.31 0.29 0.34
Tamil Nadu 0.59 0.62 0.61 0.53 0.50 0.48
Uttar Pradesh 0.18 0.17 0.16 0.15 0.14 0.12
Uttaranchal 0.16 0.15 0.12 0.11 0.09 0.09
West Bengal 0.34 0.42 0.37 0.36 0.42 0.37
Average 0.44 0.42 0.42 0.45 0.40 0.38
Special Category States
Himachal Pradesh 0.14 0.14 0.16 0.16 0.16 0.00
Jammu & Kashmir 0.05 0.06 0.07 0.10 0.09 0.10
Manipur 0.15 0.14 0.13 0.09 0.05 0.05
Meghalaya 0.11 0.13 0.09 0.11 0.10 0.09
Mizoram 0.00 0.00 0.00 0.00 0.00 0.00
Nagaland 0.05 0.07 0.09 0.12 0.08 --
Tripura 0.04 0.06 0.07 0.07 0.09 0.09
Average 0.08 0.09 0.09 0.09 0.08 0.05
(per cent of GSDP)
Source: Thirteenth Finance Commission and Central Statistical Organisation.Note: GSDP stands for gross state domestic product.
Table A32Own Revenue of Urban Local Bodies 2002-03 to 2007-08
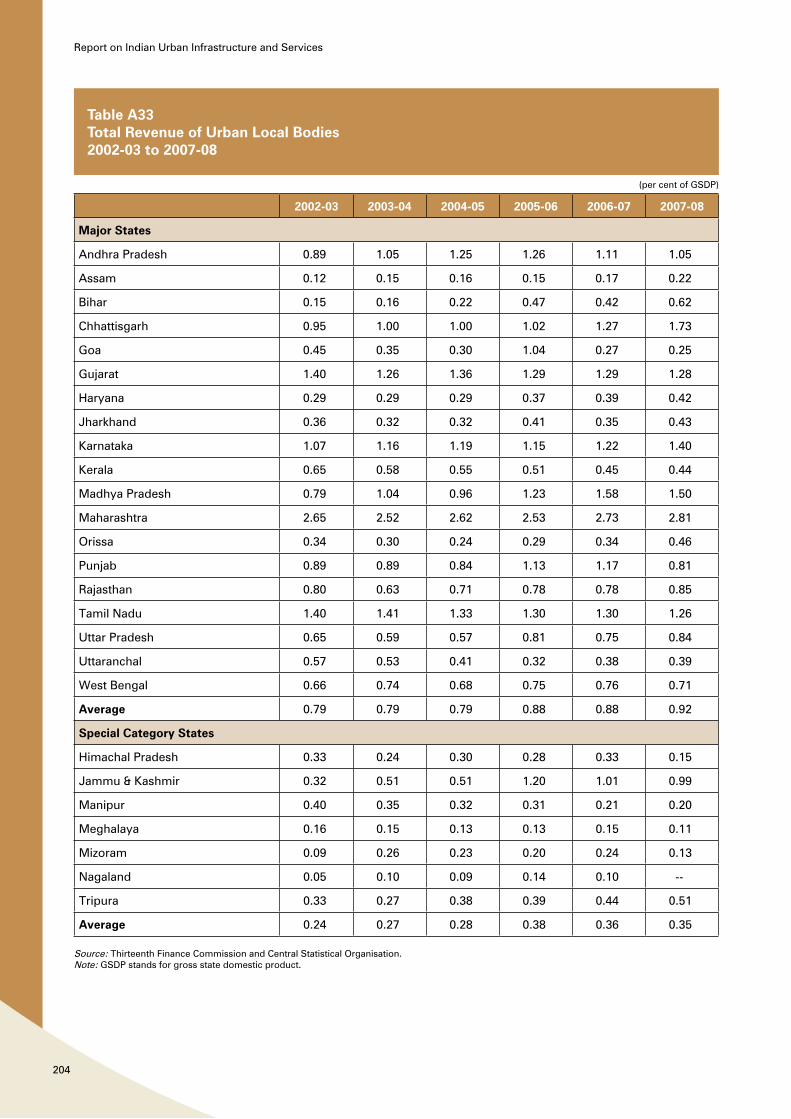
Report on Indian Urban Infrastructure and Services
204
2002-03 2003-04 2004-05 2005-06 2006-07 2007-08
Major States
Andhra Pradesh 0.89 1.05 1.25 1.26 1.11 1.05
Assam 0.12 0.15 0.16 0.15 0.17 0.22
Bihar 0.15 0.16 0.22 0.47 0.42 0.62
Chhattisgarh 0.95 1.00 1.00 1.02 1.27 1.73
Goa 0.45 0.35 0.30 1.04 0.27 0.25
Gujarat 1.40 1.26 1.36 1.29 1.29 1.28
Haryana 0.29 0.29 0.29 0.37 0.39 0.42
Jharkhand 0.36 0.32 0.32 0.41 0.35 0.43
Karnataka 1.07 1.16 1.19 1.15 1.22 1.40
Kerala 0.65 0.58 0.55 0.51 0.45 0.44
Madhya Pradesh 0.79 1.04 0.96 1.23 1.58 1.50
Maharashtra 2.65 2.52 2.62 2.53 2.73 2.81
Orissa 0.34 0.30 0.24 0.29 0.34 0.46
Punjab 0.89 0.89 0.84 1.13 1.17 0.81
Rajasthan 0.80 0.63 0.71 0.78 0.78 0.85
Tamil Nadu 1.40 1.41 1.33 1.30 1.30 1.26
Uttar Pradesh 0.65 0.59 0.57 0.81 0.75 0.84
Uttaranchal 0.57 0.53 0.41 0.32 0.38 0.39
West Bengal 0.66 0.74 0.68 0.75 0.76 0.71
Average 0.79 0.79 0.79 0.88 0.88 0.92
Special Category States
Himachal Pradesh 0.33 0.24 0.30 0.28 0.33 0.15
Jammu & Kashmir 0.32 0.51 0.51 1.20 1.01 0.99
Manipur 0.40 0.35 0.32 0.31 0.21 0.20
Meghalaya 0.16 0.15 0.13 0.13 0.15 0.11
Mizoram 0.09 0.26 0.23 0.20 0.24 0.13
Nagaland 0.05 0.10 0.09 0.14 0.10 --
Tripura 0.33 0.27 0.38 0.39 0.44 0.51
Average 0.24 0.27 0.28 0.38 0.36 0.35
(per cent of GSDP)
Source: Thirteenth Finance Commission and Central Statistical Organisation.Note: GSDP stands for gross state domestic product.
Table A33Total Revenue of Urban Local Bodies 2002-03 to 2007-08
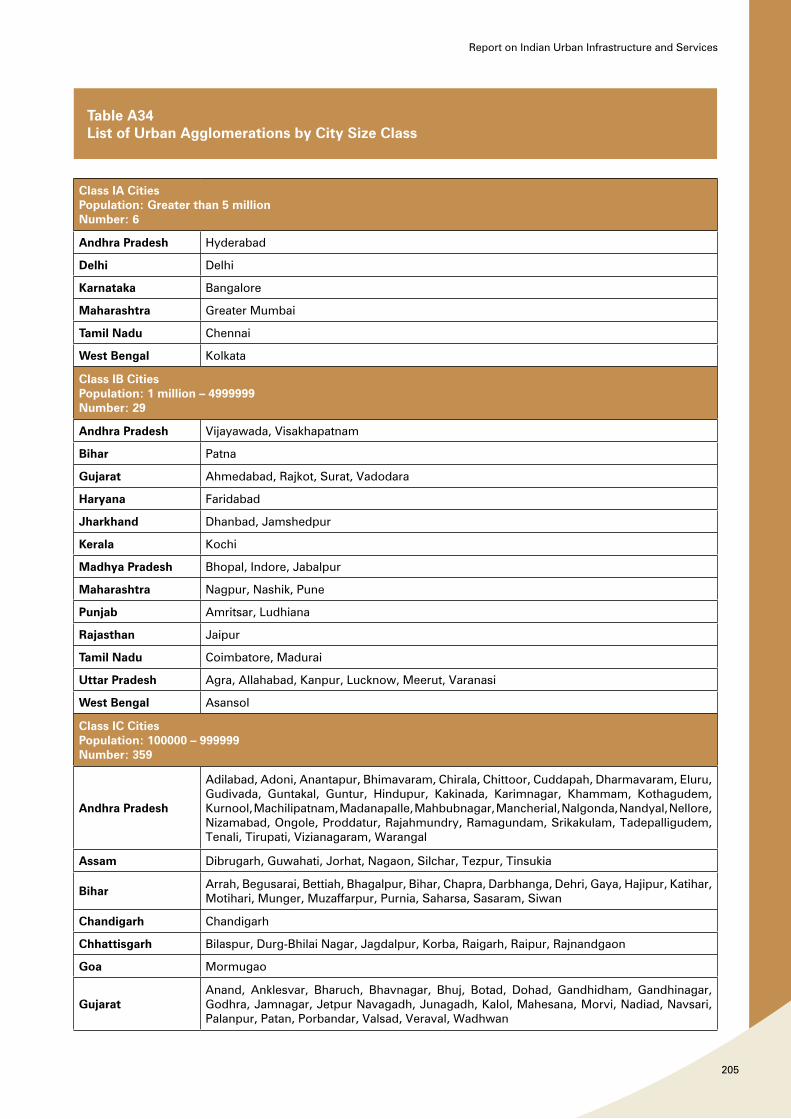
205
Report on Indian Urban Infrastructure and Services
Class IA CitiesPopulation: Greater than 5 million Number: 6
Andhra Pradesh Hyderabad
Delhi Delhi
Karnataka Bangalore
Maharashtra Greater Mumbai
Tamil Nadu Chennai
West Bengal Kolkata
Class IB CitiesPopulation: 1 million – 4999999Number: 29
Andhra Pradesh Vijayawada, Visakhapatnam
Bihar Patna
Gujarat Ahmedabad, Rajkot, Surat, Vadodara
Haryana Faridabad
Jharkhand Dhanbad, Jamshedpur
Kerala Kochi
Madhya Pradesh Bhopal, Indore, Jabalpur
Maharashtra Nagpur, Nashik, Pune
Punjab Amritsar, Ludhiana
Rajasthan Jaipur
Tamil Nadu Coimbatore, Madurai
Uttar Pradesh Agra, Allahabad, Kanpur, Lucknow, Meerut, Varanasi
West Bengal Asansol
Class IC CitiesPopulation: 100000 – 999999Number: 359
Andhra Pradesh
Adilabad, Adoni, Anantapur, Bhimavaram, Chirala, Chittoor, Cuddapah, Dharmavaram, Eluru, Gudivada, Guntakal, Guntur, Hindupur, Kakinada, Karimnagar, Khammam, Kothagudem, Kurnool, Machilipatnam, Madanapalle, Mahbubnagar, Mancherial, Nalgonda, Nandyal, Nellore, Nizamabad, Ongole, Proddatur, Rajahmundry, Ramagundam, Srikakulam, Tadepalligudem, Tenali, Tirupati, Vizianagaram, Warangal
Assam Dibrugarh, Guwahati, Jorhat, Nagaon, Silchar, Tezpur, Tinsukia
Bihar Arrah, Begusarai, Bettiah, Bhagalpur, Bihar, Chapra, Darbhanga, Dehri, Gaya, Hajipur, Katihar, Motihari, Munger, Muzaffarpur, Purnia, Saharsa, Sasaram, Siwan
Chandigarh Chandigarh
Chhattisgarh Bilaspur, Durg-Bhilai Nagar, Jagdalpur, Korba, Raigarh, Raipur, Rajnandgaon
Goa Mormugao
Gujarat Anand, Anklesvar, Bharuch, Bhavnagar, Bhuj, Botad, Dohad, Gandhidham, Gandhinagar, Godhra, Jamnagar, Jetpur Navagadh, Junagadh, Kalol, Mahesana, Morvi, Nadiad, Navsari, Palanpur, Patan, Porbandar, Valsad, Veraval, Wadhwan
Table A34List of Urban Agglomerations by City Size Class
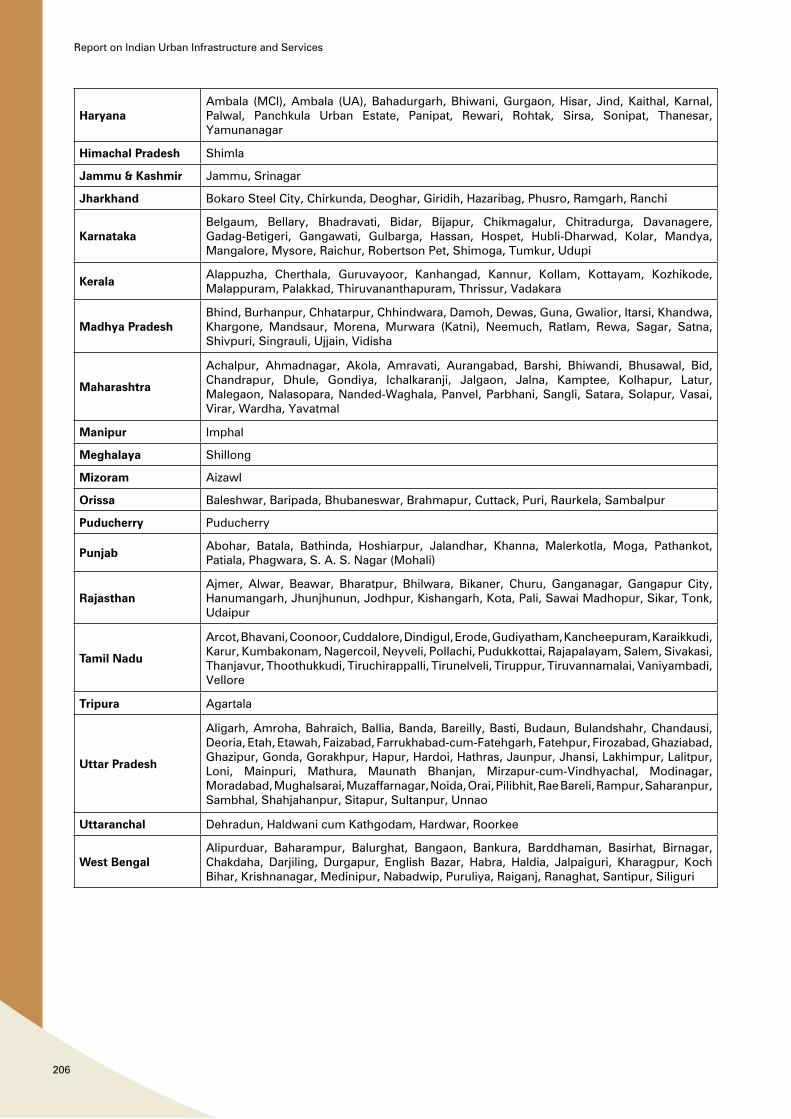
Report on Indian Urban Infrastructure and Services
206
Haryana Ambala (MCl), Ambala (UA), Bahadurgarh, Bhiwani, Gurgaon, Hisar, Jind, Kaithal, Karnal, Palwal, Panchkula Urban Estate, Panipat, Rewari, Rohtak, Sirsa, Sonipat, Thanesar, Yamunanagar
Himachal Pradesh Shimla
Jammu & Kashmir Jammu, Srinagar
Jharkhand Bokaro Steel City, Chirkunda, Deoghar, Giridih, Hazaribag, Phusro, Ramgarh, Ranchi
Karnataka Belgaum, Bellary, Bhadravati, Bidar, Bijapur, Chikmagalur, Chitradurga, Davanagere, Gadag-Betigeri, Gangawati, Gulbarga, Hassan, Hospet, Hubli-Dharwad, Kolar, Mandya, Mangalore, Mysore, Raichur, Robertson Pet, Shimoga, Tumkur, Udupi
Kerala Alappuzha, Cherthala, Guruvayoor, Kanhangad, Kannur, Kollam, Kottayam, Kozhikode, Malappuram, Palakkad, Thiruvananthapuram, Thrissur, Vadakara
Madhya Pradesh Bhind, Burhanpur, Chhatarpur, Chhindwara, Damoh, Dewas, Guna, Gwalior, Itarsi, Khandwa, Khargone, Mandsaur, Morena, Murwara (Katni), Neemuch, Ratlam, Rewa, Sagar, Satna, Shivpuri, Singrauli, Ujjain, Vidisha
Maharashtra
Achalpur, Ahmadnagar, Akola, Amravati, Aurangabad, Barshi, Bhiwandi, Bhusawal, Bid, Chandrapur, Dhule, Gondiya, Ichalkaranji, Jalgaon, Jalna, Kamptee, Kolhapur, Latur, Malegaon, Nalasopara, Nanded-Waghala, Panvel, Parbhani, Sangli, Satara, Solapur, Vasai, Virar, Wardha, Yavatmal
Manipur Imphal
Meghalaya Shillong
Mizoram Aizawl
Orissa Baleshwar, Baripada, Bhubaneswar, Brahmapur, Cuttack, Puri, Raurkela, Sambalpur
Puducherry Puducherry
Punjab Abohar, Batala, Bathinda, Hoshiarpur, Jalandhar, Khanna, Malerkotla, Moga, Pathankot, Patiala, Phagwara, S. A. S. Nagar (Mohali)
Rajasthan Ajmer, Alwar, Beawar, Bharatpur, Bhilwara, Bikaner, Churu, Ganganagar, Gangapur City, Hanumangarh, Jhunjhunun, Jodhpur, Kishangarh, Kota, Pali, Sawai Madhopur, Sikar, Tonk, Udaipur
Tamil Nadu
Arcot, Bhavani, Coonoor, Cuddalore, Dindigul, Erode, Gudiyatham, Kancheepuram, Karaikkudi, Karur, Kumbakonam, Nagercoil, Neyveli, Pollachi, Pudukkottai, Rajapalayam, Salem, Sivakasi, Thanjavur, Thoothukkudi, Tiruchirappalli, Tirunelveli, Tiruppur, Tiruvannamalai, Vaniyambadi, Vellore
Tripura Agartala
Uttar Pradesh
Aligarh, Amroha, Bahraich, Ballia, Banda, Bareilly, Basti, Budaun, Bulandshahr, Chandausi, Deoria, Etah, Etawah, Faizabad, Farrukhabad-cum-Fatehgarh, Fatehpur, Firozabad, Ghaziabad, Ghazipur, Gonda, Gorakhpur, Hapur, Hardoi, Hathras, Jaunpur, Jhansi, Lakhimpur, Lalitpur, Loni, Mainpuri, Mathura, Maunath Bhanjan, Mirzapur-cum-Vindhyachal, Modinagar, Moradabad, Mughalsarai, Muzaffarnagar, Noida, Orai, Pilibhit, Rae Bareli, Rampur, Saharanpur, Sambhal, Shahjahanpur, Sitapur, Sultanpur, Unnao
Uttaranchal Dehradun, Haldwani cum Kathgodam, Hardwar, Roorkee
West Bengal Alipurduar, Baharampur, Balurghat, Bangaon, Bankura, Barddhaman, Basirhat, Birnagar, Chakdaha, Darjiling, Durgapur, English Bazar, Habra, Haldia, Jalpaiguri, Kharagpur, Koch Bihar, Krishnanagar, Medinipur, Nabadwip, Puruliya, Raiganj, Ranaghat, Santipur, Siliguri
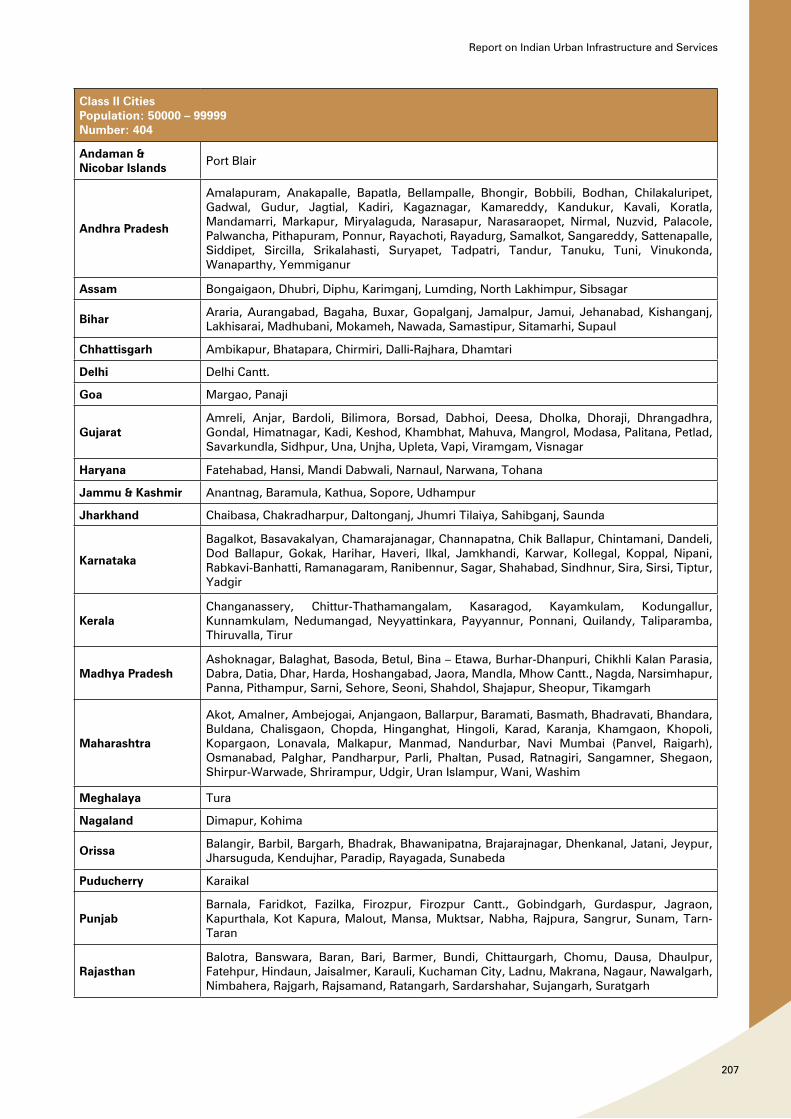
207
Report on Indian Urban Infrastructure and Services
Class II CitiesPopulation: 50000 – 99999Number: 404
Andaman & Nicobar Islands Port Blair
Andhra Pradesh
Amalapuram, Anakapalle, Bapatla, Bellampalle, Bhongir, Bobbili, Bodhan, Chilakaluripet, Gadwal, Gudur, Jagtial, Kadiri, Kagaznagar, Kamareddy, Kandukur, Kavali, Koratla, Mandamarri, Markapur, Miryalaguda, Narasapur, Narasaraopet, Nirmal, Nuzvid, Palacole, Palwancha, Pithapuram, Ponnur, Rayachoti, Rayadurg, Samalkot, Sangareddy, Sattenapalle, Siddipet, Sircilla, Srikalahasti, Suryapet, Tadpatri, Tandur, Tanuku, Tuni, Vinukonda, Wanaparthy, Yemmiganur
Assam Bongaigaon, Dhubri, Diphu, Karimganj, Lumding, North Lakhimpur, Sibsagar
Bihar Araria, Aurangabad, Bagaha, Buxar, Gopalganj, Jamalpur, Jamui, Jehanabad, Kishanganj, Lakhisarai, Madhubani, Mokameh, Nawada, Samastipur, Sitamarhi, Supaul
Chhattisgarh Ambikapur, Bhatapara, Chirmiri, Dalli-Rajhara, Dhamtari
Delhi Delhi Cantt.
Goa Margao, Panaji
GujaratAmreli, Anjar, Bardoli, Bilimora, Borsad, Dabhoi, Deesa, Dholka, Dhoraji, Dhrangadhra, Gondal, Himatnagar, Kadi, Keshod, Khambhat, Mahuva, Mangrol, Modasa, Palitana, Petlad, Savarkundla, Sidhpur, Una, Unjha, Upleta, Vapi, Viramgam, Visnagar
Haryana Fatehabad, Hansi, Mandi Dabwali, Narnaul, Narwana, Tohana
Jammu & Kashmir Anantnag, Baramula, Kathua, Sopore, Udhampur
Jharkhand Chaibasa, Chakradharpur, Daltonganj, Jhumri Tilaiya, Sahibganj, Saunda
Karnataka
Bagalkot, Basavakalyan, Chamarajanagar, Channapatna, Chik Ballapur, Chintamani, Dandeli, Dod Ballapur, Gokak, Harihar, Haveri, Ilkal, Jamkhandi, Karwar, Kollegal, Koppal, Nipani, Rabkavi-Banhatti, Ramanagaram, Ranibennur, Sagar, Shahabad, Sindhnur, Sira, Sirsi, Tiptur, Yadgir
KeralaChanganassery, Chittur-Thathamangalam, Kasaragod, Kayamkulam, Kodungallur, Kunnamkulam, Nedumangad, Neyyattinkara, Payyannur, Ponnani, Quilandy, Taliparamba, Thiruvalla, Tirur
Madhya PradeshAshoknagar, Balaghat, Basoda, Betul, Bina – Etawa, Burhar-Dhanpuri, Chikhli Kalan Parasia, Dabra, Datia, Dhar, Harda, Hoshangabad, Jaora, Mandla, Mhow Cantt., Nagda, Narsimhapur, Panna, Pithampur, Sarni, Sehore, Seoni, Shahdol, Shajapur, Sheopur, Tikamgarh
Maharashtra
Akot, Amalner, Ambejogai, Anjangaon, Ballarpur, Baramati, Basmath, Bhadravati, Bhandara, Buldana, Chalisgaon, Chopda, Hinganghat, Hingoli, Karad, Karanja, Khamgaon, Khopoli, Kopargaon, Lonavala, Malkapur, Manmad, Nandurbar, Navi Mumbai (Panvel, Raigarh), Osmanabad, Palghar, Pandharpur, Parli, Phaltan, Pusad, Ratnagiri, Sangamner, Shegaon, Shirpur-Warwade, Shrirampur, Udgir, Uran Islampur, Wani, Washim
Meghalaya Tura
Nagaland Dimapur, Kohima
OrissaBalangir, Barbil, Bargarh, Bhadrak, Bhawanipatna, Brajarajnagar, Dhenkanal, Jatani, Jeypur, Jharsuguda, Kendujhar, Paradip, Rayagada, Sunabeda
Puducherry Karaikal
PunjabBarnala, Faridkot, Fazilka, Firozpur, Firozpur Cantt., Gobindgarh, Gurdaspur, Jagraon, Kapurthala, Kot Kapura, Malout, Mansa, Muktsar, Nabha, Rajpura, Sangrur, Sunam, Tarn-Taran
RajasthanBalotra, Banswara, Baran, Bari, Barmer, Bundi, Chittaurgarh, Chomu, Dausa, Dhaulpur, Fatehpur, Hindaun, Jaisalmer, Karauli, Kuchaman City, Ladnu, Makrana, Nagaur, Nawalgarh, Nimbahera, Rajgarh, Rajsamand, Ratangarh, Sardarshahar, Sujangarh, Suratgarh
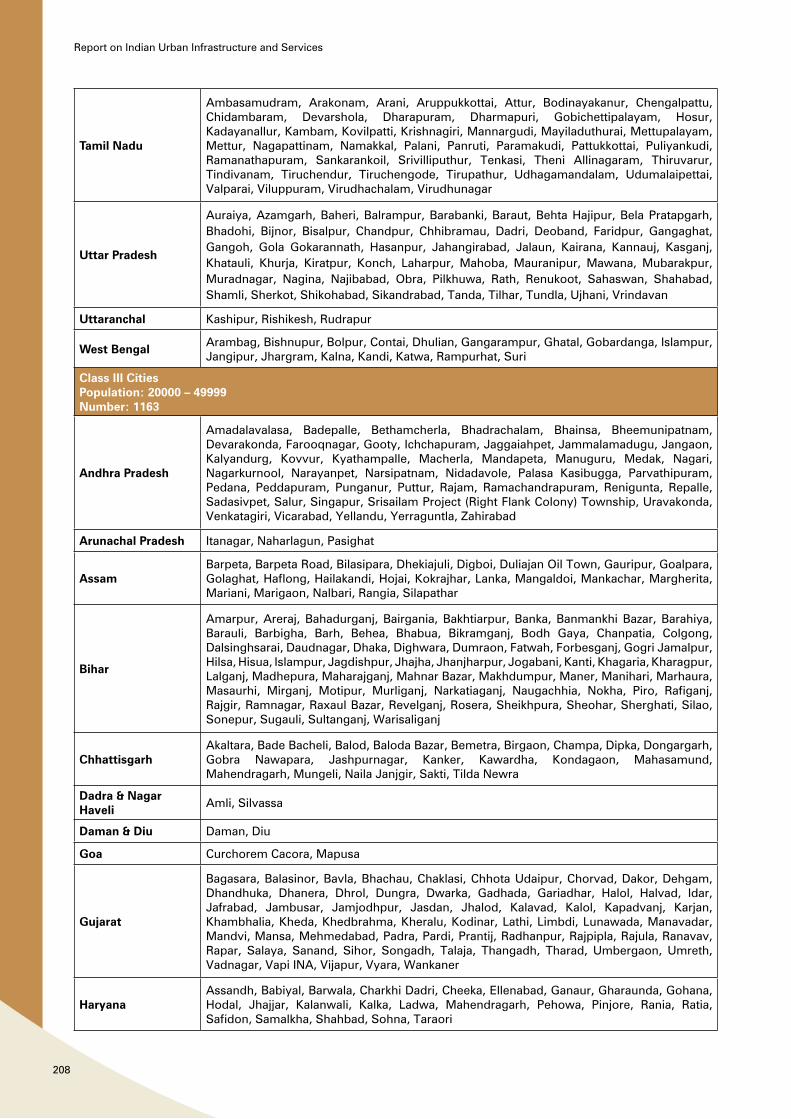
Report on Indian Urban Infrastructure and Services
208
Tamil Nadu
Ambasamudram, Arakonam, Arani, Aruppukkottai, Attur, Bodinayakanur, Chengalpattu, Chidambaram, Devarshola, Dharapuram, Dharmapuri, Gobichettipalayam, Hosur, Kadayanallur, Kambam, Kovilpatti, Krishnagiri, Mannargudi, Mayiladuthurai, Mettupalayam, Mettur, Nagapattinam, Namakkal, Palani, Panruti, Paramakudi, Pattukkottai, Puliyankudi, Ramanathapuram, Sankarankoil, Srivilliputhur, Tenkasi, Theni Allinagaram, Thiruvarur, Tindivanam, Tiruchendur, Tiruchengode, Tirupathur, Udhagamandalam, Udumalaipettai, Valparai, Viluppuram, Virudhachalam, Virudhunagar
Uttar Pradesh
Auraiya, Azamgarh, Baheri, Balrampur, Barabanki, Baraut, Behta Hajipur, Bela Pratapgarh, Bhadohi, Bijnor, Bisalpur, Chandpur, Chhibramau, Dadri, Deoband, Faridpur, Gangaghat, Gangoh, Gola Gokarannath, Hasanpur, Jahangirabad, Jalaun, Kairana, Kannauj, Kasganj, Khatauli, Khurja, Kiratpur, Konch, Laharpur, Mahoba, Mauranipur, Mawana, Mubarakpur, Muradnagar, Nagina, Najibabad, Obra, Pilkhuwa, Rath, Renukoot, Sahaswan, Shahabad, Shamli, Sherkot, Shikohabad, Sikandrabad, Tanda, Tilhar, Tundla, Ujhani, Vrindavan
Uttaranchal Kashipur, Rishikesh, Rudrapur
West BengalArambag, Bishnupur, Bolpur, Contai, Dhulian, Gangarampur, Ghatal, Gobardanga, Islampur, Jangipur, Jhargram, Kalna, Kandi, Katwa, Rampurhat, Suri
Class III Cities Population: 20000 – 49999Number: 1163
Andhra Pradesh
Amadalavalasa, Badepalle, Bethamcherla, Bhadrachalam, Bhainsa, Bheemunipatnam, Devarakonda, Farooqnagar, Gooty, Ichchapuram, Jaggaiahpet, Jammalamadugu, Jangaon, Kalyandurg, Kovvur, Kyathampalle, Macherla, Mandapeta, Manuguru, Medak, Nagari, Nagarkurnool, Narayanpet, Narsipatnam, Nidadavole, Palasa Kasibugga, Parvathipuram, Pedana, Peddapuram, Punganur, Puttur, Rajam, Ramachandrapuram, Renigunta, Repalle, Sadasivpet, Salur, Singapur, Srisailam Project (Right Flank Colony) Township, Uravakonda, Venkatagiri, Vicarabad, Yellandu, Yerraguntla, Zahirabad
Arunachal Pradesh Itanagar, Naharlagun, Pasighat
AssamBarpeta, Barpeta Road, Bilasipara, Dhekiajuli, Digboi, Duliajan Oil Town, Gauripur, Goalpara, Golaghat, Haflong, Hailakandi, Hojai, Kokrajhar, Lanka, Mangaldoi, Mankachar, Margherita, Mariani, Marigaon, Nalbari, Rangia, Silapathar
Bihar
Amarpur, Areraj, Bahadurganj, Bairgania, Bakhtiarpur, Banka, Banmankhi Bazar, Barahiya, Barauli, Barbigha, Barh, Behea, Bhabua, Bikramganj, Bodh Gaya, Chanpatia, Colgong, Dalsinghsarai, Daudnagar, Dhaka, Dighwara, Dumraon, Fatwah, Forbesganj, Gogri Jamalpur, Hilsa, Hisua, Islampur, Jagdishpur, Jhajha, Jhanjharpur, Jogabani, Kanti, Khagaria, Kharagpur, Lalganj, Madhepura, Maharajganj, Mahnar Bazar, Makhdumpur, Maner, Manihari, Marhaura, Masaurhi, Mirganj, Motipur, Murliganj, Narkatiaganj, Naugachhia, Nokha, Piro, Rafiganj, Rajgir, Ramnagar, Raxaul Bazar, Revelganj, Rosera, Sheikhpura, Sheohar, Sherghati, Silao, Sonepur, Sugauli, Sultanganj, Warisaliganj
ChhattisgarhAkaltara, Bade Bacheli, Balod, Baloda Bazar, Bemetra, Birgaon, Champa, Dipka, Dongargarh, Gobra Nawapara, Jashpurnagar, Kanker, Kawardha, Kondagaon, Mahasamund, Mahendragarh, Mungeli, Naila Janjgir, Sakti, Tilda Newra
Dadra & Nagar Haveli
Amli, Silvassa
Daman & Diu Daman, Diu
Goa Curchorem Cacora, Mapusa
Gujarat
Bagasara, Balasinor, Bavla, Bhachau, Chaklasi, Chhota Udaipur, Chorvad, Dakor, Dehgam, Dhandhuka, Dhanera, Dhrol, Dungra, Dwarka, Gadhada, Gariadhar, Halol, Halvad, Idar, Jafrabad, Jambusar, Jamjodhpur, Jasdan, Jhalod, Kalavad, Kalol, Kapadvanj, Karjan, Khambhalia, Kheda, Khedbrahma, Kheralu, Kodinar, Lathi, Limbdi, Lunawada, Manavadar, Mandvi, Mansa, Mehmedabad, Padra, Pardi, Prantij, Radhanpur, Rajpipla, Rajula, Ranavav, Rapar, Salaya, Sanand, Sihor, Songadh, Talaja, Thangadh, Tharad, Umbergaon, Umreth, Vadnagar, Vapi INA, Vijapur, Vyara, Wankaner
HaryanaAssandh, Babiyal, Barwala, Charkhi Dadri, Cheeka, Ellenabad, Ganaur, Gharaunda, Gohana, Hodal, Jhajjar, Kalanwali, Kalka, Ladwa, Mahendragarh, Pehowa, Pinjore, Rania, Ratia, Safidon, Samalkha, Shahbad, Sohna, Taraori
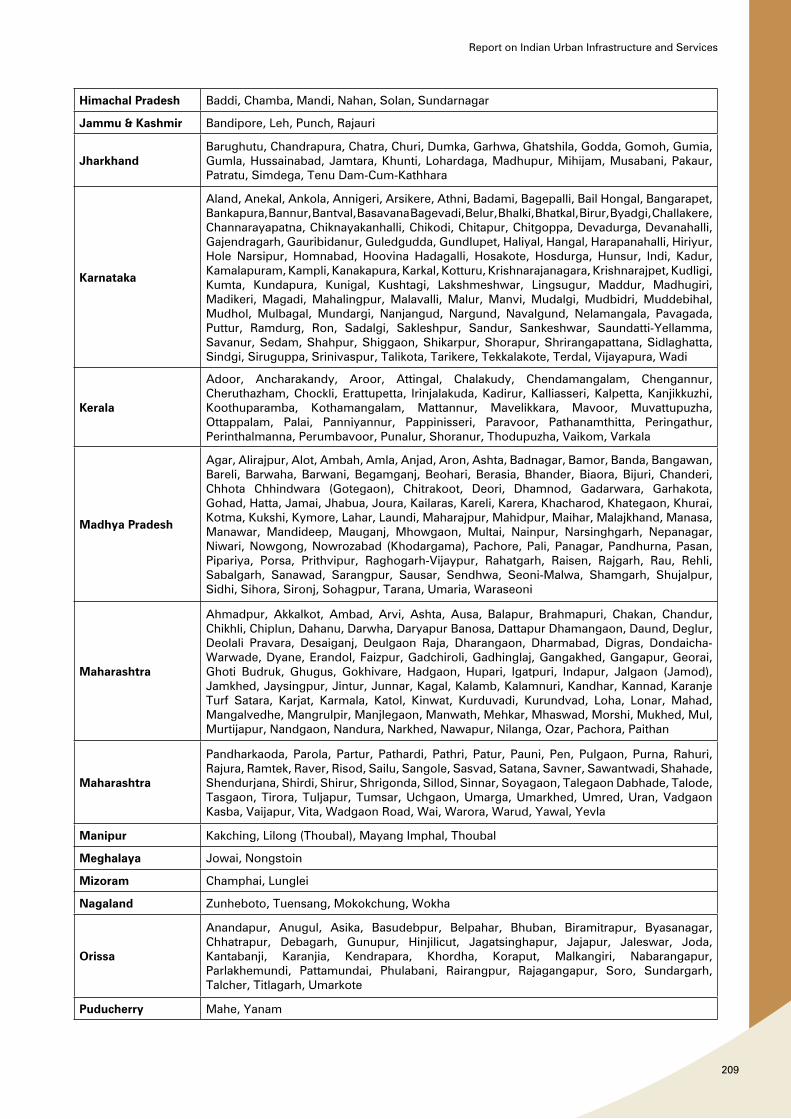
209
Report on Indian Urban Infrastructure and Services
Himachal Pradesh Baddi, Chamba, Mandi, Nahan, Solan, Sundarnagar
Jammu & Kashmir Bandipore, Leh, Punch, Rajauri
JharkhandBarughutu, Chandrapura, Chatra, Churi, Dumka, Garhwa, Ghatshila, Godda, Gomoh, Gumia, Gumla, Hussainabad, Jamtara, Khunti, Lohardaga, Madhupur, Mihijam, Musabani, Pakaur, Patratu, Simdega, Tenu Dam-Cum-Kathhara
Karnataka
Aland, Anekal, Ankola, Annigeri, Arsikere, Athni, Badami, Bagepalli, Bail Hongal, Bangarapet, Bankapura, Bannur, Bantval, Basavana Bagevadi, Belur, Bhalki, Bhatkal, Birur, Byadgi, Challakere, Channarayapatna, Chiknayakanhalli, Chikodi, Chitapur, Chitgoppa, Devadurga, Devanahalli, Gajendragarh, Gauribidanur, Guledgudda, Gundlupet, Haliyal, Hangal, Harapanahalli, Hiriyur, Hole Narsipur, Homnabad, Hoovina Hadagalli, Hosakote, Hosdurga, Hunsur, Indi, Kadur, Kamalapuram, Kampli, Kanakapura, Karkal, Kotturu, Krishnarajanagara, Krishnarajpet, Kudligi, Kumta, Kundapura, Kunigal, Kushtagi, Lakshmeshwar, Lingsugur, Maddur, Madhugiri, Madikeri, Magadi, Mahalingpur, Malavalli, Malur, Manvi, Mudalgi, Mudbidri, Muddebihal, Mudhol, Mulbagal, Mundargi, Nanjangud, Nargund, Navalgund, Nelamangala, Pavagada, Puttur, Ramdurg, Ron, Sadalgi, Sakleshpur, Sandur, Sankeshwar, Saundatti-Yellamma, Savanur, Sedam, Shahpur, Shiggaon, Shikarpur, Shorapur, Shrirangapattana, Sidlaghatta, Sindgi, Siruguppa, Srinivaspur, Talikota, Tarikere, Tekkalakote, Terdal, Vijayapura, Wadi
Kerala
Adoor, Ancharakandy, Aroor, Attingal, Chalakudy, Chendamangalam, Chengannur, Cheruthazham, Chockli, Erattupetta, Irinjalakuda, Kadirur, Kalliasseri, Kalpetta, Kanjikkuzhi, Koothuparamba, Kothamangalam, Mattannur, Mavelikkara, Mavoor, Muvattupuzha, Ottappalam, Palai, Panniyannur, Pappinisseri, Paravoor, Pathanamthitta, Peringathur, Perinthalmanna, Perumbavoor, Punalur, Shoranur, Thodupuzha, Vaikom, Varkala
Madhya Pradesh
Agar, Alirajpur, Alot, Ambah, Amla, Anjad, Aron, Ashta, Badnagar, Bamor, Banda, Bangawan, Bareli, Barwaha, Barwani, Begamganj, Beohari, Berasia, Bhander, Biaora, Bijuri, Chanderi, Chhota Chhindwara (Gotegaon), Chitrakoot, Deori, Dhamnod, Gadarwara, Garhakota, Gohad, Hatta, Jamai, Jhabua, Joura, Kailaras, Kareli, Karera, Khacharod, Khategaon, Khurai, Kotma, Kukshi, Kymore, Lahar, Laundi, Maharajpur, Mahidpur, Maihar, Malajkhand, Manasa, Manawar, Mandideep, Mauganj, Mhowgaon, Multai, Nainpur, Narsinghgarh, Nepanagar, Niwari, Nowgong, Nowrozabad (Khodargama), Pachore, Pali, Panagar, Pandhurna, Pasan, Pipariya, Porsa, Prithvipur, Raghogarh-Vijaypur, Rahatgarh, Raisen, Rajgarh, Rau, Rehli, Sabalgarh, Sanawad, Sarangpur, Sausar, Sendhwa, Seoni-Malwa, Shamgarh, Shujalpur, Sidhi, Sihora, Sironj, Sohagpur, Tarana, Umaria, Waraseoni
Maharashtra
Ahmadpur, Akkalkot, Ambad, Arvi, Ashta, Ausa, Balapur, Brahmapuri, Chakan, Chandur, Chikhli, Chiplun, Dahanu, Darwha, Daryapur Banosa, Dattapur Dhamangaon, Daund, Deglur, Deolali Pravara, Desaiganj, Deulgaon Raja, Dharangaon, Dharmabad, Digras, Dondaicha-Warwade, Dyane, Erandol, Faizpur, Gadchiroli, Gadhinglaj, Gangakhed, Gangapur, Georai, Ghoti Budruk, Ghugus, Gokhivare, Hadgaon, Hupari, Igatpuri, Indapur, Jalgaon (Jamod), Jamkhed, Jaysingpur, Jintur, Junnar, Kagal, Kalamb, Kalamnuri, Kandhar, Kannad, Karanje Turf Satara, Karjat, Karmala, Katol, Kinwat, Kurduvadi, Kurundvad, Loha, Lonar, Mahad, Mangalvedhe, Mangrulpir, Manjlegaon, Manwath, Mehkar, Mhaswad, Morshi, Mukhed, Mul, Murtijapur, Nandgaon, Nandura, Narkhed, Nawapur, Nilanga, Ozar, Pachora, Paithan
Maharashtra
Pandharkaoda, Parola, Partur, Pathardi, Pathri, Patur, Pauni, Pen, Pulgaon, Purna, Rahuri, Rajura, Ramtek, Raver, Risod, Sailu, Sangole, Sasvad, Satana, Savner, Sawantwadi, Shahade, Shendurjana, Shirdi, Shirur, Shrigonda, Sillod, Sinnar, Soyagaon, Talegaon Dabhade, Talode, Tasgaon, Tirora, Tuljapur, Tumsar, Uchgaon, Umarga, Umarkhed, Umred, Uran, Vadgaon Kasba, Vaijapur, Vita, Wadgaon Road, Wai, Warora, Warud, Yawal, Yevla
Manipur Kakching, Lilong (Thoubal), Mayang Imphal, Thoubal
Meghalaya Jowai, Nongstoin
Mizoram Champhai, Lunglei
Nagaland Zunheboto, Tuensang, Mokokchung, Wokha
Orissa
Anandapur, Anugul, Asika, Basudebpur, Belpahar, Bhuban, Biramitrapur, Byasanagar, Chhatrapur, Debagarh, Gunupur, Hinjilicut, Jagatsinghapur, Jajapur, Jaleswar, Joda, Kantabanji, Karanjia, Kendrapara, Khordha, Koraput, Malkangiri, Nabarangapur, Parlakhemundi, Pattamundai, Phulabani, Rairangpur, Rajagangapur, Soro, Sundargarh, Talcher, Titlagarh, Umarkote
Puducherry Mahe, Yanam
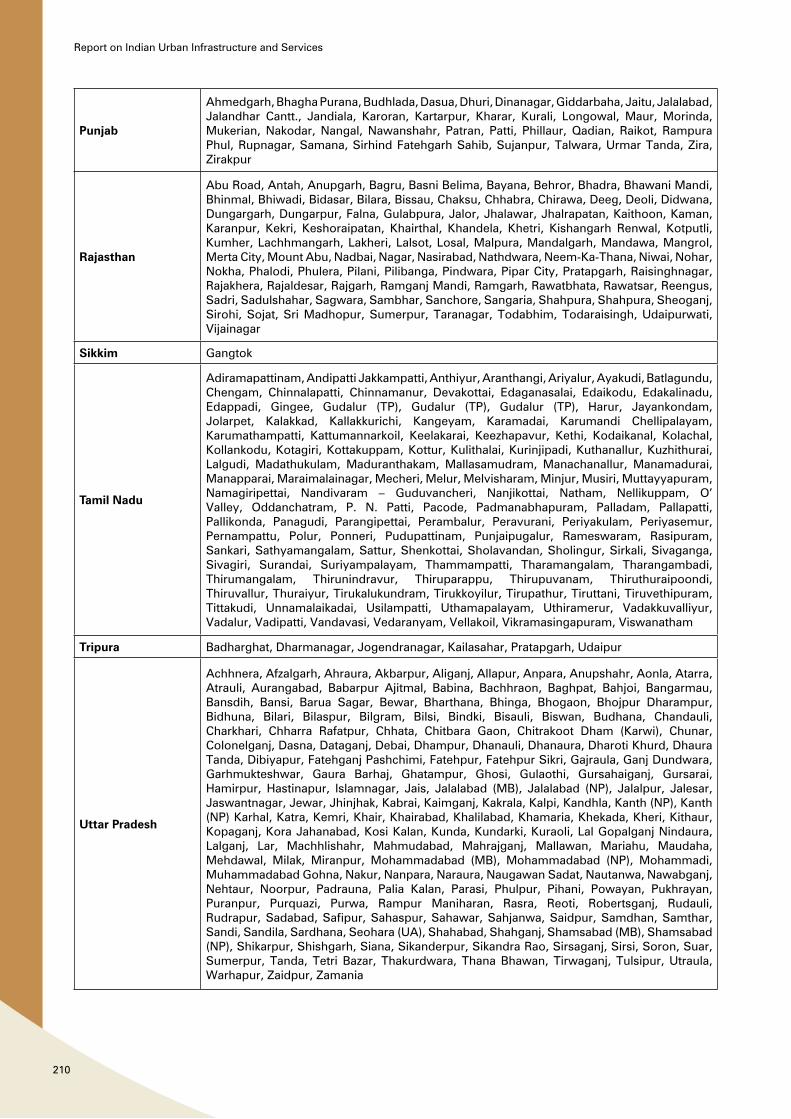
Report on Indian Urban Infrastructure and Services
210
Punjab
Ahmedgarh, Bhagha Purana, Budhlada, Dasua, Dhuri, Dinanagar, Giddarbaha, Jaitu, Jalalabad, Jalandhar Cantt., Jandiala, Karoran, Kartarpur, Kharar, Kurali, Longowal, Maur, Morinda, Mukerian, Nakodar, Nangal, Nawanshahr, Patran, Patti, Phillaur, Qadian, Raikot, Rampura Phul, Rupnagar, Samana, Sirhind Fatehgarh Sahib, Sujanpur, Talwara, Urmar Tanda, Zira, Zirakpur
Rajasthan
Abu Road, Antah, Anupgarh, Bagru, Basni Belima, Bayana, Behror, Bhadra, Bhawani Mandi, Bhinmal, Bhiwadi, Bidasar, Bilara, Bissau, Chaksu, Chhabra, Chirawa, Deeg, Deoli, Didwana, Dungargarh, Dungarpur, Falna, Gulabpura, Jalor, Jhalawar, Jhalrapatan, Kaithoon, Kaman, Karanpur, Kekri, Keshoraipatan, Khairthal, Khandela, Khetri, Kishangarh Renwal, Kotputli, Kumher, Lachhmangarh, Lakheri, Lalsot, Losal, Malpura, Mandalgarh, Mandawa, Mangrol, Merta City, Mount Abu, Nadbai, Nagar, Nasirabad, Nathdwara, Neem-Ka-Thana, Niwai, Nohar, Nokha, Phalodi, Phulera, Pilani, Pilibanga, Pindwara, Pipar City, Pratapgarh, Raisinghnagar, Rajakhera, Rajaldesar, Rajgarh, Ramganj Mandi, Ramgarh, Rawatbhata, Rawatsar, Reengus, Sadri, Sadulshahar, Sagwara, Sambhar, Sanchore, Sangaria, Shahpura, Shahpura, Sheoganj, Sirohi, Sojat, Sri Madhopur, Sumerpur, Taranagar, Todabhim, Todaraisingh, Udaipurwati, Vijainagar
Sikkim Gangtok
Tamil Nadu
Adiramapattinam, Andipatti Jakkampatti, Anthiyur, Aranthangi, Ariyalur, Ayakudi, Batlagundu, Chengam, Chinnalapatti, Chinnamanur, Devakottai, Edaganasalai, Edaikodu, Edakalinadu, Edappadi, Gingee, Gudalur (TP), Gudalur (TP), Gudalur (TP), Harur, Jayankondam, Jolarpet, Kalakkad, Kallakkurichi, Kangeyam, Karamadai, Karumandi Chellipalayam, Karumathampatti, Kattumannarkoil, Keelakarai, Keezhapavur, Kethi, Kodaikanal, Kolachal, Kollankodu, Kotagiri, Kottakuppam, Kottur, Kulithalai, Kurinjipadi, Kuthanallur, Kuzhithurai, Lalgudi, Madathukulam, Maduranthakam, Mallasamudram, Manachanallur, Manamadurai, Manapparai, Maraimalainagar, Mecheri, Melur, Melvisharam, Minjur, Musiri, Muttayyapuram, Namagiripettai, Nandivaram – Guduvancheri, Nanjikottai, Natham, Nellikuppam, O’ Valley, Oddanchatram, P. N. Patti, Pacode, Padmanabhapuram, Palladam, Pallapatti, Pallikonda, Panagudi, Parangipettai, Perambalur, Peravurani, Periyakulam, Periyasemur, Pernampattu, Polur, Ponneri, Pudupattinam, Punjaipugalur, Rameswaram, Rasipuram, Sankari, Sathyamangalam, Sattur, Shenkottai, Sholavandan, Sholingur, Sirkali, Sivaganga, Sivagiri, Surandai, Suriyampalayam, Thammampatti, Tharamangalam, Tharangambadi, Thirumangalam, Thirunindravur, Thiruparappu, Thirupuvanam, Thiruthuraipoondi, Thiruvallur, Thuraiyur, Tirukalukundram, Tirukkoyilur, Tirupathur, Tiruttani, Tiruvethipuram, Tittakudi, Unnamalaikadai, Usilampatti, Uthamapalayam, Uthiramerur, Vadakkuvalliyur, Vadalur, Vadipatti, Vandavasi, Vedaranyam, Vellakoil, Vikramasingapuram, Viswanatham
Tripura Badharghat, Dharmanagar, Jogendranagar, Kailasahar, Pratapgarh, Udaipur
Uttar Pradesh
Achhnera, Afzalgarh, Ahraura, Akbarpur, Aliganj, Allapur, Anpara, Anupshahr, Aonla, Atarra, Atrauli, Aurangabad, Babarpur Ajitmal, Babina, Bachhraon, Baghpat, Bahjoi, Bangarmau, Bansdih, Bansi, Barua Sagar, Bewar, Bharthana, Bhinga, Bhogaon, Bhojpur Dharampur, Bidhuna, Bilari, Bilaspur, Bilgram, Bilsi, Bindki, Bisauli, Biswan, Budhana, Chandauli, Charkhari, Chharra Rafatpur, Chhata, Chitbara Gaon, Chitrakoot Dham (Karwi), Chunar, Colonelganj, Dasna, Dataganj, Debai, Dhampur, Dhanauli, Dhanaura, Dharoti Khurd, Dhaura Tanda, Dibiyapur, Fatehganj Pashchimi, Fatehpur, Fatehpur Sikri, Gajraula, Ganj Dundwara, Garhmukteshwar, Gaura Barhaj, Ghatampur, Ghosi, Gulaothi, Gursahaiganj, Gursarai, Hamirpur, Hastinapur, Islamnagar, Jais, Jalalabad (MB), Jalalabad (NP), Jalalpur, Jalesar, Jaswantnagar, Jewar, Jhinjhak, Kabrai, Kaimganj, Kakrala, Kalpi, Kandhla, Kanth (NP), Kanth (NP) Karhal, Katra, Kemri, Khair, Khairabad, Khalilabad, Khamaria, Khekada, Kheri, Kithaur, Kopaganj, Kora Jahanabad, Kosi Kalan, Kunda, Kundarki, Kuraoli, Lal Gopalganj Nindaura, Lalganj, Lar, Machhlishahr, Mahmudabad, Mahrajganj, Mallawan, Mariahu, Maudaha, Mehdawal, Milak, Miranpur, Mohammadabad (MB), Mohammadabad (NP), Mohammadi, Muhammadabad Gohna, Nakur, Nanpara, Naraura, Naugawan Sadat, Nautanwa, Nawabganj, Nehtaur, Noorpur, Padrauna, Palia Kalan, Parasi, Phulpur, Pihani, Powayan, Pukhrayan, Puranpur, Purquazi, Purwa, Rampur Maniharan, Rasra, Reoti, Robertsganj, Rudauli, Rudrapur, Sadabad, Safipur, Sahaspur, Sahawar, Sahjanwa, Saidpur, Samdhan, Samthar, Sandi, Sandila, Sardhana, Seohara (UA), Shahabad, Shahganj, Shamsabad (MB), Shamsabad (NP), Shikarpur, Shishgarh, Siana, Sikanderpur, Sikandra Rao, Sirsaganj, Sirsi, Soron, Suar, Sumerpur, Tanda, Tetri Bazar, Thakurdwara, Thana Bhawan, Tirwaganj, Tulsipur, Utraula, Warhapur, Zaidpur, Zamania
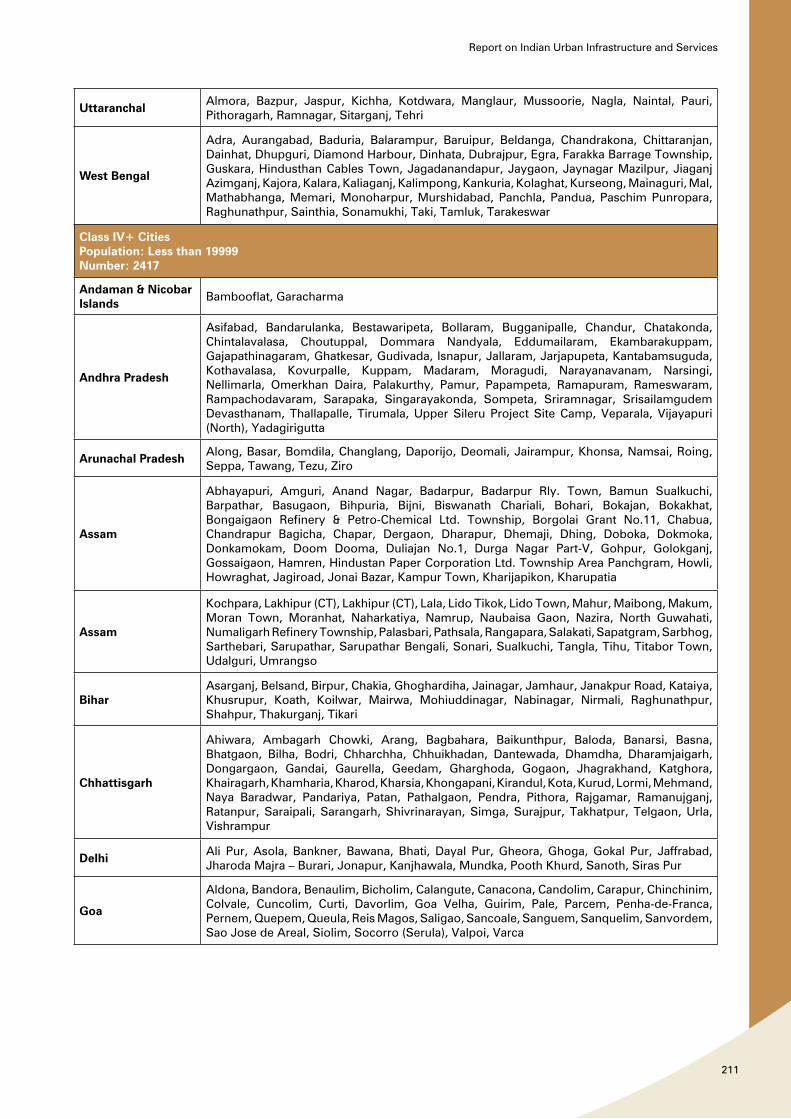
211
Report on Indian Urban Infrastructure and Services
UttaranchalAlmora, Bazpur, Jaspur, Kichha, Kotdwara, Manglaur, Mussoorie, Nagla, Naintal, Pauri, Pithoragarh, Ramnagar, Sitarganj, Tehri
West Bengal
Adra, Aurangabad, Baduria, Balarampur, Baruipur, Beldanga, Chandrakona, Chittaranjan, Dainhat, Dhupguri, Diamond Harbour, Dinhata, Dubrajpur, Egra, Farakka Barrage Township, Guskara, Hindusthan Cables Town, Jagadanandapur, Jaygaon, Jaynagar Mazilpur, Jiaganj Azimganj, Kajora, Kalara, Kaliaganj, Kalimpong, Kankuria, Kolaghat, Kurseong, Mainaguri, Mal, Mathabhanga, Memari, Monoharpur, Murshidabad, Panchla, Pandua, Paschim Punropara, Raghunathpur, Sainthia, Sonamukhi, Taki, Tamluk, Tarakeswar
Class IV+ CitiesPopulation: Less than 19999Number: 2417
Andaman & Nicobar Islands
Bambooflat, Garacharma
Andhra Pradesh
Asifabad, Bandarulanka, Bestawaripeta, Bollaram, Bugganipalle, Chandur, Chatakonda, Chintalavalasa, Choutuppal, Dommara Nandyala, Eddumailaram, Ekambarakuppam, Gajapathinagaram, Ghatkesar, Gudivada, Isnapur, Jallaram, Jarjapupeta, Kantabamsuguda, Kothavalasa, Kovurpalle, Kuppam, Madaram, Moragudi, Narayanavanam, Narsingi, Nellimarla, Omerkhan Daira, Palakurthy, Pamur, Papampeta, Ramapuram, Rameswaram, Rampachodavaram, Sarapaka, Singarayakonda, Sompeta, Sriramnagar, Srisailamgudem Devasthanam, Thallapalle, Tirumala, Upper Sileru Project Site Camp, Veparala, Vijayapuri (North), Yadagirigutta
Arunachal PradeshAlong, Basar, Bomdila, Changlang, Daporijo, Deomali, Jairampur, Khonsa, Namsai, Roing, Seppa, Tawang, Tezu, Ziro
Assam
Abhayapuri, Amguri, Anand Nagar, Badarpur, Badarpur Rly. Town, Bamun Sualkuchi, Barpathar, Basugaon, Bihpuria, Bijni, Biswanath Chariali, Bohari, Bokajan, Bokakhat, Bongaigaon Refinery & Petro-Chemical Ltd. Township, Borgolai Grant No.11, Chabua, Chandrapur Bagicha, Chapar, Dergaon, Dharapur, Dhemaji, Dhing, Doboka, Dokmoka, Donkamokam, Doom Dooma, Duliajan No.1, Durga Nagar Part-V, Gohpur, Golokganj, Gossaigaon, Hamren, Hindustan Paper Corporation Ltd. Township Area Panchgram, Howli, Howraghat, Jagiroad, Jonai Bazar, Kampur Town, Kharijapikon, Kharupatia
Assam
Kochpara, Lakhipur (CT), Lakhipur (CT), Lala, Lido Tikok, Lido Town, Mahur, Maibong, Makum, Moran Town, Moranhat, Naharkatiya, Namrup, Naubaisa Gaon, Nazira, North Guwahati, Numaligarh Refinery Township, Palasbari, Pathsala, Rangapara, Salakati, Sapatgram, Sarbhog, Sarthebari, Sarupathar, Sarupathar Bengali, Sonari, Sualkuchi, Tangla, Tihu, Titabor Town, Udalguri, Umrangso
BiharAsarganj, Belsand, Birpur, Chakia, Ghoghardiha, Jainagar, Jamhaur, Janakpur Road, Kataiya, Khusrupur, Koath, Koilwar, Mairwa, Mohiuddinagar, Nabinagar, Nirmali, Raghunathpur, Shahpur, Thakurganj, Tikari
Chhattisgarh
Ahiwara, Ambagarh Chowki, Arang, Bagbahara, Baikunthpur, Baloda, Banarsi, Basna, Bhatgaon, Bilha, Bodri, Chharchha, Chhuikhadan, Dantewada, Dhamdha, Dharamjaigarh, Dongargaon, Gandai, Gaurella, Geedam, Gharghoda, Gogaon, Jhagrakhand, Katghora, Khairagarh, Khamharia, Kharod, Kharsia, Khongapani, Kirandul, Kota, Kurud, Lormi, Mehmand, Naya Baradwar, Pandariya, Patan, Pathalgaon, Pendra, Pithora, Rajgamar, Ramanujganj, Ratanpur, Saraipali, Sarangarh, Shivrinarayan, Simga, Surajpur, Takhatpur, Telgaon, Urla, Vishrampur
DelhiAli Pur, Asola, Bankner, Bawana, Bhati, Dayal Pur, Gheora, Ghoga, Gokal Pur, Jaffrabad, Jharoda Majra – Burari, Jonapur, Kanjhawala, Mundka, Pooth Khurd, Sanoth, Siras Pur
Goa
Aldona, Bandora, Benaulim, Bicholim, Calangute, Canacona, Candolim, Carapur, Chinchinim, Colvale, Cuncolim, Curti, Davorlim, Goa Velha, Guirim, Pale, Parcem, Penha-de-Franca, Pernem, Quepem, Queula, Reis Magos, Saligao, Sancoale, Sanguem, Sanquelim, Sanvordem, Sao Jose de Areal, Siolim, Socorro (Serula), Valpoi, Varca
Report on Indian Urban Infrastructure and Services
212
Gujarat
Adalaj, Adityana, Alang, Ambaji, Ambaliyasan, Andada, Anklav, Antaliya, Arambhada, Atul, Bantwa, Bhanvad, Bharuch INA, Bhayavadar, Bodeli, Boriavi, Chala, Chalala, Chalthan, Chanasma, Chanod, Chhatral INA, Chikhli, Chiloda (Naroda), Damnagar, Devgadbaria, Devsar, Dharampur, Dhola, Digvijaygram, Gandevi, Ghogha, Hajira INA, Harij, Kadodara, Kalol INA, Kalol INA, Kandla, Kanodar, Katpar, Kevadiya, Kharaghoda, Kosamba, Kutiyana, Limla, Mahudha, Mahuvar, Malpur, Meghraj, Mithapur, Mundra, Nandej, Ode, Okha Port, Paddhari, Palej, Parnera, Santrampur, Sarigam INA, Sayan, Sikka, Surajkaradi, Talod, Ukai, Umbergaon INA, Vadia, Vaghodia INA, Valsad INA, Vanthali, Vartej, Vasna Borsad INA, Visavadar
Haryana
Asankhurd, Ateli, Bawal, Bawani Khera, Beri, Bilaspur, Buria, Chhachhrauli, Dharuhera, Dundahera, Farakhpur, Farrukhnagar, Ferozepur Jhirka, Haileymandi, Hassanpur, Hathin, Indri, Jakhalmandi, Julana, Kalanaur, Kalayat, Kanina, Kansepur, Kardhan, Kharkhoda, Ladrawan, Loharu, Maham, Mustafabad, Nagal Chaudhry, Naraingarh, Narnaund, Nilokheri, Nuh, Pataudi, Punahana, Pundri, Radaur, Raipur Rani, Rewari (Rural), Sadaura, Siwani, Taoru, Tilpat, Tosham, Uchana, Uklanamandi, Uncha Siwana
Himachal Pradesh
Arki, Bakloh, Banjar, Bhota, Bhuntar, Bilaspur, Chaupal, Chuari Khas, Dagshai, Dalhousie (CB), Dalhousie (MCl), Daulatpur, Dera Gopipur, Dharmsala, Gagret, Ghumarwin, Hamirpur, Jawalamukhi, Jogindarnagar, Jubbal, Kangra, Kasauli, Kotkhai, Kullu, Manali, Mant Khas, Mehatpur Basdehra, Nadaun, Nagrota Bagwan, Naina Devi, Nalagarh, Narkanda, Nurpur, Palampur, Paonta Sahib, Parwanoo, Rajgarh, Rampur, Rawalsar, Rohru, Sabathu, Santokhgarh, Sarkaghat, Seoni, Talai, Theog, Tira Sujanpur, Una, Yoi
Jammu & Kashmir
Achabal, Akhnoor, Arnia, Awantipora, Badgam, Banihal, Bashohli, Batote, Beerwah, Bhaderwah, Billawar, Bishna, Chenani, Chrari Sharief, Doda, Ganderbal, Gho-Manhasan, Gorah Salathian, Gulmarg, Hajan, Handwara, Hiranagar, Jourian, Kargil, Katra, Khan Sahib, Khour, Khrew, Kishtwar, Kud, Kukernag, Kulgam, Kunzer, Kupwara, Lakhenpur, Magam, Nowshehra, Pahalgam, Parole, Pattan, Pulwama, Qazigund, Ramban, Ramgarh, Ramnagar, Ranbirsinghpora, Reasi, Samba, Shupiyan, Sumbal, Sunderbani, Talwara, Thanamandi, Tral, Uri, Vijay Pore
Jharkhand
Amlabad, Ara, Balkundra, Barajamda, Barhi, Barwadih, Basukinath, Bhojudih, Bundu, Chakulia, Chandil, Chiria, Danguwapasi, Dari, Deorikalan, Dhanwar, Dugda, Gidi, Gobindpur, Gua, Hesla, Isri, Jadugora, Jena, Jhinkpani, Kalikapur, Kandra, Kedla, Kharkhari, Kharsawan, Khelari, Kiriburu, Kodarma, Kuju, Lapanga, Latehar, Marma, Meghahatuburu Forest Village, Meru, Mugma, Muri, Nirsa, Noamundi, Orla, Palawa, Panchet, Rajmahal, Religara alias Pachhiari, Sahnidih, Seraikela, Sewai, Sijhua, Sinduria, Sini, Tati, Topa, Topchanchi
Karnataka
Adityapatna, Adyar, Afzalpur, Alnavar, Alur, Ambikanagara, Arkalgud, Aurad, Bajpe, Beltangadi, Bhimarayanagudi, Bilgi, Bommasandra, Channagiri, Chincholi, Dargajogihalli, Donimalai Township, Gokak Falls, Gonikoppal, Gubbi, Gudibanda, Gurmatkal, Hatti, Hatti Gold Mines, Hebbagodi, Heggadadevankote, Hirekerur, Holalkere, Honavar, Honnali, Hosanagara, Hukeri, Hungund, Jagalur, Jevargi, Jog Falls, Kadigenahalli, Kalghatgi, Kerur, Khanapur, Kodiyal, Konnur, Koppa, Koratagere, Krishnarajasagara, Kudchi, Kudremukh, Kundgol, Kurgunta, Kushalnagar, Londa, Mallar, Molakalmuru, Mudgal, Mudigere, Mulgund, Mulki, Mulur, Mundgod, Munirabad Project Area, Nagamangala, Narasimharajapura, Naregal, Pandavapura, Piriyapatna, Pudu, Raybag, Saligram, Shaktinagar, Shirhatti, Siddapur, Siralkoppa, Somvarpet, Sorab, Sringeri, Sulya, Thumbe, Tirthahalli, Tirumakudal – Narsipur, Turuvekere, Virajpet, Yelandur, Yelbarga, Yellapur, Yenagudde
Kerala
Akathiyoor, Arookutty, Avinissery, Bangramanjeshwar, Chala, Chelora, Chevvoor, Hosabettu, Idukki Township, Iriveri, Kanhirode, Kannadiparamba, Kannapuram, Kolazhy, Koratty, Kottayam-Malabar, Manjeshwar, Marathakkara, Mavilayi, Munderi, Narath, Nenmenikkara, Paduvilayi, Palissery, Panoor, Pathiriyad, Pattiom, Peralasseri, Pinarayi, Pottore, Puranattukara, Puthukkad, Udma, Vallachira, Varam
Lakshadweep Amini, Kavaratti, Minicoy
Madhya Pradesh
Ajaygarh, Akoda, Akodia, Alampur, Amanganj, Amarkantak, Amarpatan, Amarwara, Ambada, Antari, Anuppur, Babai, Bada – Malhera, Badagaon (NP), Badagoan (NP), Badarwas, Badawada, Badi, Badnawar, Badod, Badoda, Badra, Bagh, Bagli, Baihar, Baikunthpur, Baldeogarh, Bamhani, Bamora, Bansatar Kheda, Barela, Barghat, Barhi, Barigarh, Betma, Betul Bazar, Bhainsdehi, Bhanpura, Bharveli, Bhaurasa, Bhavra, Bhedaghat, Bhikangaon, Bhitarwar, Bijawar, Bilaua, Birsinghpur, Boda, Budni, Buxwaha, Chachaura – Binaganj, Chakghat,
213
Report on Indian Urban Infrastructure and Services
Madhya Pradesh
Chandia, Chandla, Chaurai Khas, Chichli, Churhat, Daboh, Damua, Deohara, Deori, Depalpur, Devendranagar, Dhana, Dharampuri, Dighawani, Diken, Dindori, Dola, Dumar Kachhar, Gairatganj, Garhi – Malhara, Garoth, Ghansaur, Ghuwara, Gogapur, Gormi, Govindgarh, Gurh, Hanumana, Harpalpur, Harrai, Harsud, Hatod, Hatpipalya, Hindoria, Hirapur, Ichhawar, Indergarh, Isagarh, Jaisinghnagar, Jaithari, Jaitwara, Jatara, Jawad, Jawar, Jeron Khalsa, Jhundpura, Jiran, Jirapur, Jobat, Kakarhati, Kali Chhapar, Kanad, Kannod, Kantaphod, Kari, Karnawad, Karrapur, Kasrawad, Katangi (NP), Katangi (NP), Kelhauri(Chachai), Khajuraho, Khand (Bansagar), Khaniyadhana, Khargapur, Khetia, Khilchipur, Khirkiya, Khujner, Kolaras, Kotar, Kothi, Kumbhraj, Kurwai, Lakhnadon, Lateri, Lidhorakhas, Lodhikheda, Loharda, Machalpur, Maheshwar, Majholi, Maksi, Malhargarh, Mandav, Mandleshwar, Mangalya-Sadak, Mangawan, Manpur, Mau, Meghnagar, Mehgaon, Mihona, Mohgaon, Mundi, Mungaoli, Nagod, Nagri, Nai-Garhi, Nalkheda, Namli, Narayangarh, Narwar, Nasrullaganj, Naudhia, Obedullaganj, Omkareshwar, Orchha, Ordnance Factory Itarsi, Pachmarhi Cantt., Pal Chaurai, Palera, Panara, Pandhana, Pansemal, Patan, Patharia, Pawai, Petlawad, Phuphkalan, Pichhore (NP), Pichhore (NP), Piploda, Piplya Mandi, Polaykalan, Rajgarh, Rajnagar, Rajpur, Rampur Baghelan, Rampur Naikin, Rampura, Ranapur, Ratangarh, Rehti, Runji – Gautampura, Sailana, Sanchi, Sardarpur, Satai, Satwas, Sawer, Semaria, Seondha, Sethiya, Shahgarh, Shahpur (CT), Shahpur (NP), Shahpur (NP), Shahpura (NP), Shahpura (NP), Singoli, Sinhasa, Sirgora, Sirmaur, Sitamau, Sonkatch, Soyatkalan, Sultanpur, Susner, Suthaliya, Tal, Talen, Taricharkalan, Tekanpur, Tendukheda, Teonthar, Thandla, Timarni, Tirodi, Udaipura, Ukwa, Unchahara, Unhel, Vijaypur, Vijayraghavgarh
Maharashtra
Ajra, Alandi, Alibag, Ambivali Tarf Wankhal, Babhulgaon, Bhingar, Bhokardan, Bhor, Bhum, Biloli, Birwadi, Boisar, Budhgaon, Chandur, Chandurbazar, Chicholi, Chikhaldara, Chinchani, Dapoli Camp, Davlameti, Deoli, Dewhadi, Dharur, Dhatau, Dudhani, Durgapur, Ganeshpur, Ghatanji, Ghulewadi, Godoli, Goregaon, Guhagar, Jalgaon, Jawhar, Jejuri, Kalambe Turf Thane, Kalameshwar, Kalundre, Kandri, Kandri, Kankavli, Karivali, Kasara Budruk, Katai, Katkar, Kegaon, Khadkale, Khapa, Khed (CT), Khed (M Cl), Kherdi, Khuldabad, Kodoli, Kon, Kondumal, Kopharad, Korochi, Kudal, Kundalwadi, Kusgaon Budruk, Lanja, Lasalgaon, Mahabaleshwar, Mahadula, Maindargi, Malkapur (CT), Malkapur (M Cl), Malwan, Manadur, Manchar, Manor, Mansar, Matheran, Mhasla, Mohpa, Mohpada Alias Wasambe, Mowad, Mudkhed, Murbad, Murgud
Maharashtra
Murud, Murum, Nachane, Nagapur, Nagardeole, Nagothana, Nakoda, Naldurg, Neral, Nildoh, Nimbhore Budruk, Pachgaon, Padagha, Pali, Panchgani, Pandharpur, Panhala, Paranda, Pasthal, Patan, Peth Umri, Poladpur, Purushottamnagar, Rahimatpur, Rahta Pimplas, Rajapur, Rajgurunagar (Khed), Rajur, Roha Ashtami, Sasti, Savda, Sawari Jawharnagar, Shahapur, Shelar, Shirwal, Shivaji Nagar, Shivatkar (Nira), Shrivardhan, Sillewada, Sindi, Sindi Turf Hindnagar, Sindkhed Raja, Singnapur, Sonegaon (Nipani), Sonpeth, Surgana, Taloje Panchnad, Tarapur, Tathavade, Telhara, Totaladoh, Trimbak, Umbar Pada Nandade, Umri Pragane Balapur, Utekhol, Vada, Vadgaon, Vanvadi (Sadashivgad), Vasantnagar, Vashind, Vengurla, Waghapur, Wajegaon, Walani, Waliv, Wanadongri, Yerkheda
Manipur
Andro, Bishnupur, Heirok, Jiribam, Kakching Khunou, Kumbi, Kwakta, Lamjaotongba, Lamlai, Lamsang, Lilong (Imphal West), Moirang, Moreh, Nambol, Ningthoukhong, Oinam, Samurou, Sekmai Bazar, Sikhong Sekmai, Sugnu, Thongkhong Laxmi Bazar, Wangjing, Wangoi, Yairipok
Meghalaya Baghmara, Cherrapunjee, Mairang, Nongpoh, Resubelpara, Williamnagar
MizoramBairabi, Biate, Darlawn, Hnahthial, Khawhai, Khawzawl, Kolasib, Lengpui, Mamit, N. Kawnpui, N. Vanlaiphai, Saiha, Sairang, Saitual, Serchhip, Thenzawl, Tlabung, Vairengte, Zawlnuam
Nagaland Chumukedima, Mon Town, Phek
Orissa
Athagad, Athmallik, Balagoda(Bolani), Balimela, Balugaon, Banapur, Bangura, Banki, Barapali, Baudhgarh, Belagachhia, Bellaguntha, Bhanjanagar, Binika, Bishama Katak, Buguda, Champua, Chandapur, Chandili, Charibatia, Chikiti, Dadhapatna, Daitari, Damanjodi, Dera Colliery Township, Dhamanagar, Digapahandi, Dungamal, Fertilizer Corporation of India Township, G. Udayagiri, Ganjam, Ghantapada, Gopalpur, Gudari, Hatibandha, Jhumpura, Junagarh, Kamakshyanagar, Kantilo, Kashinagara, Kavisurjyanagar, Kesinga, Khaliapali, Khalikote, Khandapada, Khariar, Khariar Road, Khatiguda, Kochinda, Kodala, Konark, Kotpad, Lathikata, Makundapur, Mukhiguda, Nalco, Nayagarh, Nilagiri, Nimapada, Nuapatna, O. C. L. Industrial Township, Padmapur, Panposh, Patnagarh, Pipili, Polasara, Pratapsasan, Purusottampur, Rambha, Redhakhol, Rengali Dam Project Township, Sonapur, Surada, Talcher Thermal Power Station Township, Tarbha, Tensa, Udala
Report on Indian Urban Infrastructure and Services
214
Punjab
Adampur, Ajnala, Akalgarh, Alawalpur, Amloh, Amritsar Cantt., Anandpur Sahib, Badhni Kalan, Balachaur, Banga, Banur, Bareta, Bariwala, Bassi Pathana, Begowal, Bhabat, Bhadaur, Bhankharpur, Bharoli Kalan, Bhawanigarh, Bhikhi, Bhikhiwind, Bhisiana, Bhogpur, Bhucho Mandi, Bhulath, Budha Theh, Cheema, Chohal, Daulatpur, Dera Baba Nanak, Dera Bassi, Dhanaula, Dharamkot, Dhariwal, Dhilwan, Dirba, Doraha, Fatehgarh Churian, Gardhiwala, Garhshankar, Ghagga, Ghanaur, Goniana, Goraya, Guru Har Sahai, Hajipur, Handiaya, Hariana, Hussainpur, Jandiala, Jugial, Kalanaur, Khamanon, Khanauri, Khemkaran, Kot Fatta, Lehragaga, Lohian Khas, Machhiwara, Mahilpur, Majitha, Makhu, Maloud, Moonak, Mullanpur Dakha, Mullanpur Garib Dass, Nehon, Nurmahal, Payal, Rahon, Raja Sansi, Raman, Ramdas, Rayya, Rurki Kasba, Sahnewal, Samrala, Sanaur, Sangat, Sansarpur, Sardulgarh, Shahkot, Sham Chaurasi, Shekhpura, Sri Hargobindpur, Sultanpur, Talwandi Bhai, Tapa
Rajasthan
1SGM, 3 STR, Aklera, Amet, Asind, Baggar, Bakani, Bali, Banasthali, Bandikui, Bari Sadri, Beejoliya Kalan, Begun, Bhalariya, Bhinder, Bhusawar, Budhpura, Chechat, Chhapar, Chhipabarod, Chhoti Sadri, Dariba, Deogarh, Deshnoke, Dhariawad, Fatehnagar, Gajsinghpur, Galiakot, Gangapur, Goredi Chancha, Govindgarh, Jahazpur, Jaitaran, Jobner, Kanor, Kapasan, Kaprain, Kesrisinghpur, Kherli, Kherliganj, Kherwara Chhaoni, Kishangarh, Kolvi @ Mandi Rajendrapur, Kuchera, Kumbhkot, Kushalgarh, Mahwa, Mandawar, Manoharthana, Marwar Junction, Modak, Mukandgarh, Mundwá, Nainwa, Nawa, Newa Talai, Padampur, Parbatsar, Partapur, Pirawa, Pokaran, Pushkar, Rani, Ratannagar, Rikhabdeo, Salumbar, Sangod, Sarwar, Satalkheri, Sojat Road, Suket, Surajgarh, Takhatgarh, Tijara, Todra, Udpura, Uniara, Vijainagar, Viratnagar, Weir
Sikkim Gyalshing, Jorethang, Mangan, Namchi, Nayabazar, Rangpo, Singtam, Upper Tadong
Tamil Nadu
A. Vellalapatti, Abiramam, Achampudur, Acharapakkam, Acharipallam, Achipatti, Adikaratti, Aduthurai alias Maruthuvakudi, Agaram, Agastheeswaram, Alagappapuram, Alanganallur, Alangayam, Alangudi, Alangulam (CT), Alangulam (TP), Alanthurai, Alapakkam, Alur, Alwarkurichi, Alwarthirunagiri, Ammainaickanur, Ammapettai, Ammapettai, Ammavarikuppam, Ammoor, Anaimalai, Anaiyur, Ananthapuram, Anjugramam, Annavasal, Annur, Appakudal, Arachalur, Arakandanallur, Aralvaimozhi, Arani, Arasiramani, Aravakurichi, Arimalam, Ariyappampalayam, Ariyur, Arumanai, Arumbavur, Athani, Athanur, Athimarapatti, Athipattu, Athur, Athur, Avadattur, Avalpoondurai, Aygudi, Ayothiapattinam, Ayyalur, Ayyampalayam, Ayyampettai (CT), Ayyampettai (TP), Azhagiapandiapuram, B. Meenakshipuram, B. Mallapuram, Balakrishnampatti, Balakrishnapuram, Balapallam, Balasamudram, Bargur, Belur, Bhavanisagar, Bhuvanagiri, Bikketti, Boothapandi, Boothipuram, Chennasamudram, Chennimalai, Cheranmadevi, Chetpet, Chettiarpatti, Chettipalayam, Chettithangal, Chinnakkampalayam, Chinnasalem, Chithode, Cholapuram, Courtalam, Denkanikottai, Desur, Devadanapatti, Devanangurichi, Dhalavoipuram, Dhali, Dhaliyur, Dusi, Elathur, Elayirampannai, Elumalai, Eral, Eraniel, Eriodu, Erumaipatti, Eruvadi, Ethapur, Ettayapuram, Ezhudesam, Ganapathipuram, Gangavalli, Ganguvarpatti, Gopalasamudram, Gummidipoondi, Hanumanthampatti, Highways, Huligal, Ilampillai, Ilanji, Ilayangudi, Iluppaiyurani, Iluppur, Jalakandapuram, Jambai, Kadambur, Kadathur, Kadayal, Kadayampatti, Kalambur, Kalappanaickenpatti, Kalavai, Kaliyakkavilai, Kallakudi, Kallukuttam, Kalugumalai, Kamayagoundanpatti, Kambainallur, Kamuthi, Kanakkampalayam, Kanam, Kangayampalayam, Kaniyur, Kanjikoil, Kannamangalam, Kannivadi, Kannivadi, Kanniyakumari, Kappiyarai, Karambakkudi, Kariamangalam, Kariapatti, Karugampattur, Karungal, Karunguzhi, Karuppur, Kasipalayam (G), Kathujuganapalli, Kattuputhur, Kaveripakkam, Kaveripattinam, Kayatharu, Keeramangalam, Keeranur, Keeranur, Keeripatti, Kelamangalam, Kembainaickenpalayam, Kilampadi, Kilkulam, Kilkunda, Killai, Killiyur, Kilpennathur, Kilvelur, Kinathukadavu, Kodavasal, Kodumudi, Kolappalur, Kolathupalayam, Kolathur, Kollankoil, Komaralingam, Kombai, Konganapuram, Kooraikundu, Koradacheri, Kothinallur, Kottaram, Krishnarayapuram, Kuchanur, Kuhalur, Kulasekarapuram, Kumarapuram, Kunnathur, Kurumbalur, Kuthalam, Labbaikudikadu, Lakkampatti, Lalpet, Madukkur, Mallankinaru, Mallur, Mamallapuram, Mamsapuram, Manalmedu, Manalurpet, Manavalakurichi, Mandaikadu, Mandapam, Mangalampet, Manimutharu, Marakkanam, Maramangalathupatti, Marandahalli, Markayankottai, Marudur, Marungur, Mathigiri, Melacheval, Melachokkanathapuram, Melagaram, Melamaiyur, Melathiruppanthuruthi, Melattur, Melpattampakkam, Mettupalayam, Modakurichi, Mohanur, Moolakaraipatti, Mopperipalayam, Mudukulathur, Mukasipidariyur, Mukkudal, Mulagumudu, Mulanur, Muruganpalayam, Muthupet, Muthur, Myladi, Naduvattam, Nagavakulam, Nagojanahalli, Nallampatti, Nallur, Nambiyur, Nangavalli, Nangavaram, Nanguneri, Nannilam, Naranapuram, Narasingapuram (CT), Narasingapuram (TP), Nasiyanur, Nathampannai, Natrampalli, Nattarasankottai, Nazerath, Needamangalam, Neelagiri, Neikkarapatti, Neiyyur, Nemili, Neripperichal, Nerkuppai, Nerunjipettai, Nilakkottai, Odaipatti, Odaiyakulam, Odugathur, Olagadam, Omalur, Orathanadu (Mukthambalpuram),
215
Report on Indian Urban Infrastructure and Services
Tamil Nadu
Othakadai, Othakalmandapam, Ottapparai, P. J. Cholapuram, P. Mettupalayam, Padaiveedu, Padirikuppam, Palaganangudy, Palakkodu, Palamedu, Palani Chettipatti, Palayam, Pallapalayam, Pallapatti (CT), Pallapatti (TP), Pallipattu, Panaimarathupatti, Panapakkam, Panboli, Pandamangalam, Pannaikadu, Pannaipuram, Papanasam, Papparapatti, Pappireddipatti, Paramathi, Pasur, Pathamadai, Pattinam, Pattiveeranpatti, Pazhugal, Pennadam, Pennagaram, Pennathur, Peraiyur, Peralam, Peranamallur, Periya Negamam, Periyakodiveri, Periyapatti, Perumagalur, Perumandi, Perumuchi, Perundurai, Perungulam, Pethampalayam, Pethanaickenpalayam, Pillanallur, Ponmani, Ponnamaravathi, Ponnampatti, Poolambadi, Poolampatti, Pooluvapatti, Punjaipuliampatti, Puthalam, Puvalur, R. Pudupatti, R. S. Mangalam, Rayagiri, Reethapuram, Rosalpatti, Rudravathi, S. Kannanur, S. Kodikulam, Salangapalayam, Samalapuram, Samathur, Sambavar Vadagarai, Sankaramanallur, Sankarapuram, Sarcarsamakulam, Sathankulam, Sathiyavijayanagaram, Sayalgudi, Sayapuram, Seerapalli, Seithur, Semmipalayam, Senthamangalam, Sentharapatti, Senur, Sethiathoppu, Sevugampatti, Sholur, Singampuneri, Singaperumalkoil, Sirugamani, Sirumugai, Sithayankottai, Sithurajapuram, Sivagiri, Sivanthipuram, Srimushnam, Sriperumbudur, Sriramapuram, Srivaikuntam, Suchindram, Sundarapandiam, Pothanur, Pothatturpettai, Pudukadai, Pudukkottai, Pudupalayam, Pudupalayam Agraharam, Pudupatti, Pudur (S), Puliyur, Pullampadi, Punjai Thottakurichi, Sundarapandiapuram, Swamimalai, T. Kallupatti, Tayilupatti, Thadikombu, Thakkolam, Thalainayar, Thalakudi, Thamaraikulam, Thathaiyangarpet, Thedavur, Thengampudur, Thenkarai, Thenkarai, Thenthamaraikulam, Thenthiruperai, Thesur, Thevaram, Thevur, Thiagadurgam, Thingalnagar, Thirukarungudi, Thirukkattupall, Thirumalayampalayam, Thirunageswaram, Thiruporur, Thiruppanandal, Thirupuvanam, Thiruvaiyaru, Thiruvalam, Thiruvattaru, Thiruvenkatam, Thiruvennainallur, Thiruvidaimarudur, Thiruvithankodu, Thisayanvilai, Thittacheri, Thondamuthur, Thondi, Thorapadi, Thottiyam, Thuthipattu, Timiri, TNPL Pugalur, Udangudi, Udayarpalayam, Ulundurpettai, Unjalur, Uppidamangalam, Uppiliapuram, Urapakkam, Uthangarai, Uthukkottai, Uthukuli, V. Pudur, V. Pudupatti, Vadakarai Keezhpadugai, Vadakkanandal, Vadamadurai, Vadugapatti, Vadugapatti, Vaitheeswarankoil, Valangaiman, Valavanur, Vallam, Valvaithankoshtam, Vanavasi, Vaniputhur, Varadarajanpettai, Vasudevanallur, Vathirairuppu, Vazhapadi, Vedasandur, Veeraganur, Veerakkalpudur, Veerapandi, Veeravanallur, Velankanni, Vellimalai, Vellottamparappu, Velur, Vengampudur, Vengathur, Venkarai, Vennanthur, Veppathur, Verkilambi, Vettaikaranpudur, Vettavalam, Vijayapuri, Vikravandi, Vilapakkam, Vilathikulam, Vilavur, Villukuri, Virupakshipuram, Walajabad
TripuraAmarpur, Ambassa, Belonia, Gakulnagar, Gandhigram, Indranagar(part), Kamalpur, Kanchanpur, Khowai, Kumarghat, Kunjaban(part), Narsingarh, Ranirbazar, Sabroom, Sonamura, Teliamura
Uttar Pradesh
Achhalda, Adari, Agarwal Mandi, Ailum, Air Force Area, Ajhuwa, Akbarpur, Allahganj, Amanpur, Ambehta, Amethi(NP) Amethi (NP), Amila, Aminagar Sarai, Aminagar urf Bhurbaral, Amraudha, Anandnagar, Antu, Ashrafpur Kichhauchha, Atasu, Atraulia, Aurangabad Bangar, Auras, Awagarh, Azizpur, Azmatgarh, Baberu, Babrala, Babugarh, Bachhrawan, Bad, Bah, Bahadurganj, Bahsuma, Bahuwa, Bajna, Bakewar, Bakiabad, Baldeo, Banat, Bansgaon, Bara Gaon, Baragaon, Barhalganj, Barhani Bazar, Barkhera, Barsana, Barwar, Behat, Belthara Road, Beniganj, Beswan, Bhadarsa, Bhagwant Nagar, Bharatganj, Bhargain, Bharuhana, Bharwari, Bhatni Bazar, Bhatpar Rani, Bhawan Bahadur Nagar, Bhokarhedi, Bhulepur, Bighapur, Bijpur, Bikapur, Bilariaganj, Bilaspur, Bilhaur, Bilram, Bilsanda, Bisanda Buzurg, Bisharatganj, Bithoor, Bugrasi, Chail, Chak Imam Ali, Chakia, Charthaval, Chaumuhan, Chhaprauli, Chhatari, Chhutmalpur, Chilkana Sultanpur, Chirgaon, Chopan, Choubepur Kalan, Churk Ghurma, Dalmau, Dankaur, Dariyabad, Daurala, Deoranian, Dewa, Dhanauha, Dhaurahara, Dildarnagar Fatehpur Bazar, Doghat, Dohrighat, Dostpur, Dudhi, Dulhipur, Ekdil, Erich, Etmadpur, Faizganj, Farah, Faridnagar, Faridpur, Fariha, Fatehabad, Fatehganj Purvi, Fatehpur Chaurasi, Gangapur, Ganj Muradabad, Garautha, Garhi Pukhta, Gauri Bazar, Gausganj, Gawan, Ghiraur, Ghorawal, Ghosia Bazar, Ghughuli, Gohand, Gokul, Gola Bazar, Gopamau, Gopi Ganj, Gosainganj (NP), Gosainganj (NP), Govardhan, Gularia Bhindara, Gulariya, Gunnaur, Gyanpur, Hafizpur, Haidergarh, Haldaur, Handia, Harduaganj, Hargaon, Hariharpur, Harraiya, Hasayan, Hata, Hyderabad, Ibrahimpur, Iglas, Ikauna, Iltifatganj Bazar, Indian Telephone Industry Mankapur (Spl.Village), Itaunja, Jafarabad, Jagner, Jahanabad, Jahangirpur, Jaithara, Jalalabad, Jalali, Jamshila, Jangipur, Jansath, Jarwal, Jasrana, Jatari, Jhalu, Jhinjhana, Jhusi Kohna, Jhusi, Jiyanpur, Joya, Jyoti Khuria, Kachhauna Patseni, Kachhla, Kachhwa, Kadaura, Kadipur, Kailashpur, Kakgaina, Kakod, Kakori, Kalinagar, Kamalganj, Kampil, Kandwa, Kaptanganj,
Report on Indian Urban Infrastructure and Services
216
Uttar Pradesh
Karari, Karnawal, Kataria, Katghar Lalganj, Kathera, Katra, Katra Medniganj, Kauria-ganj, Kerakat, Khadda, Khaga, Khailar, Khairabad, Khanpur, Kharela, Khargupur, Khariya, Kharkhoda, Khatauli Rural, Kheragarh, Kheta Sarai, Khudaganj, Khutar, Kiraoli, Kishni, Kishunpur, Koeripur, Koraon, Korwa, Kota, Kotra, Kotwa, Kulpahar, Kunwargaon, Kurara, Kursath (NP), Kursath (NP), Kurthi Jafarpur, Kushinagar, Kusmara, Lakhna, Lawar, Ledwa Mahua, Lohta, Madhoganj, Madhogarh, Maghar, Mahaban, Maharajganj, Maholi, Mahona, Mahrajganj, Mahroni, Mailani, Majhara Pipar Ehatmali, Majhauliraj, Malihabad, Mandawar, Manikpur, Manikpur Sarhat, Maniyar, Manjhanpur, Mankapur, Marehra, Maswasi, Mataundh, Mau Aima, Maurawan, Mehnagar, Mendu, Mirganj, Misrikh Cum Neemsar, Mogra Badshahpur, Mohan, Mohanpur, Mohiuddinpur, Moth, Mundera Bazar, Mundia, Mursan, Musafirkhana, Nadigaon, Nagram, Nai Bazar, Nainana Jat, Nanauta, Nandgaon, Naraini, Narauli, Nawabganj (MB), Nawabganj (NP), Nichlaul, Nidhauli Kalan, Niwari, Nizamabad, Nyoria Husainpur, Nyotini, Oel Dhakwa, Oran, Ordinance Factory Muradnagar, Pachperwa, Pahasu, Paintepur, Pali (NP), Pali (NP), Parichha, Parikshitgarh, Parsadepur, Patala, Patiyali, Patti, Phalauda, Phaphund, Phulpur, Pilkhana, Pinahat, Pipalsana Chaudhari, Pipiganj, Pipraich, Pratapgarh City, Purdilnagar, Qasimpur Power House Colony, Rabupura, Radhakund, Raja ka Rampur, Rajapur, Ramkola, Ramnagar, Rampur Bhawanipur, Rampur Karkhana, Rampura, Ranipur, Rashidpur Garhi, Rasulabad, Raya, Richha, Risia Bazar, Rithora, Rly. Settlement Roza, Rudayan, Rura, Sadat, Sahanpur, Sahatwar, Sahpau, Saidpur, Sainthal, Saiyad Raja, Sakhanu, Sakit, Salarpur Khadar, Salempur, Salon, Sarai Aquil, Sarai Mir, Sarila, Sarsawan, Sasni, Satrikh, Saunkh, Saurikh, Sewalkhas, Sewarhi, Shahi, Shahpur, Shankargarh, Shergarh, Shivli, Shivrajpur, Shohratgarh, Siddhaur, Sidhauli, Sidhpura, Sikanderpur, Sikindra, Singahi Bhiraura, Sirathu, Sirauli, Sirsa, Sisauli, Siswa Bazar, Som, Suriyawan, Talbehat, Talgram, Tambaur Cum Ahmadabad, Tatarpur Lallu, Thiriya Nizamat Khan, Tikait Nagar, Tikri, Tindwari, Titron, Tondi Fatehpur, Ugu, Ujhari, Umri, Umri Kalan, Un, Unchahar, Usawan, Usehat, Vijaigarh, Wazirganj
Uttaranchal
Badrinathpuri, Bageshwar, Banbasa, Bandia, Barkot, Bhimtal, Bhowali, Chakrata, Chamba, Chamoli Gopeshwar, Champawat, Devaprayag (Distt. 04 & 06), Dhaluwala, Dhandera, Dharchula, Dharchula Dehat, Didihat, Dineshpur, Dogadda, Doiwala, Dwarahat, Gadarpur, Gangotri, Gochar, Herbertpur, Jhabrera, Joshimath, Kachnal Gosain, Kaladhungi, Karnaprayag, Kashirampur, Kedarnath, Kela Khera, Khatima, Kirtinagar, Laksar, Lalkuan, Landhaura, Lansdowne, Lohaghat, Mahua Dabra Haripura, Mahua Kheraganj, Mohanpur Mohammadpur, Muni Ki Reti, Nandprayag, Narendranagar, Pratitnagar, Ranikhet, Rudraprayag, Shaktigarh, Srinagar, Sultanpur, Tanakpur, Uttarkashi, Vikasnagar
West Bengal
Ahmadpur, Aiho, Amtala, Anup Nagar, Arra, Bablari Dewanganj, Badhagachhi, Bagnan, Bahirgram, Bahula, Bairatisal, Balichak, Banarhat Tea Garden, Banshra, Bara Bamonia, Barabazar, Barijhati, Barjora, Baska, Begampur, Beldubi, Belebathan, Beliatore, Bhandardaha, Bhangar Raghunathpur, Bholar Dabri, Bikihakola, Bilandapur, Bilpahari, Birlapur, Bishnupur, Bowali, Cart Road, Chachanda, Chak Bankola, Chak Enayetnagar, Chak Kashipur, Chapari, Chapui, Charka, Chelad, Chhora, Chikrand, Dafahat, Dakshin Baguan, Dakshin Jhapardaha, Dalkhola, Dalurband, Darappur, Debipur, Deuli, Dhakuria, Dhandadihi, Dhanyakuria, Dhatrigram, Dhusaripara, Dignala, Domjur, Durllabhganj, Falakata, Fatellapur, Gabberia, Gairkata, Garalgachha, Ghorsala, Goaljan, Goasafat, Gopinathpur, Gora Bazar, Guma, Haldibari, Harharia Chak, Haripur, Harishpur, Hatsimla, Hijuli, Jagtaj, Jala Kendua, Jemari, Jhalda, Jot Kamal, Kachu Pukur, Kakdihi, Kanksa, Kanyanagar, Karimpur, Kenda, Kendra Khottamdi, Kendua, Kesabpur, Khagrabari, Khalor, Khandra, Khantora, Kharar, Kharsarai, Khodarampur, Konardihi, Krishnapur, Kshidirpur, Kshirpai, Kunustara, Madanpur, Madhusudanpur, Mahira, Makardaha, Mandarbani, Mansinhapur, Mekliganj, Mirik, Mrigala, Nabagram, Nabgram, Nachhratpur Katabari, Natibpur, Naupala, Nebadhai Duttapukur, Nokpul, Ondal, Pairagachha, Palashban, Pangachhiya, Paniara, Par Beliya, Parashkol, Parasia, Patuli, Prayagpur, Purbba Tajpur, Raghunathpur (PS-Magra), Ramjibanpur, Ramnagar, Ratibati, Sahajadpur, Sahapur, Sankarpur, Santaldih Thermal Power Project-Town, Sarpi, Serpur, Siduli, Singur, Sirsha, Sonatikiri, Srikantabati, Srirampur, Sukdal, Tufanganj, Ukhra, Uttar Bagdogra, Uttar Kalas, Uttar Kamakhyaguri, Uttar Latabari, Uttar Mahammadpur
Source: Census of India
APPENDIX B:Assumptions and Methodology for Estimation of Investment Requirements

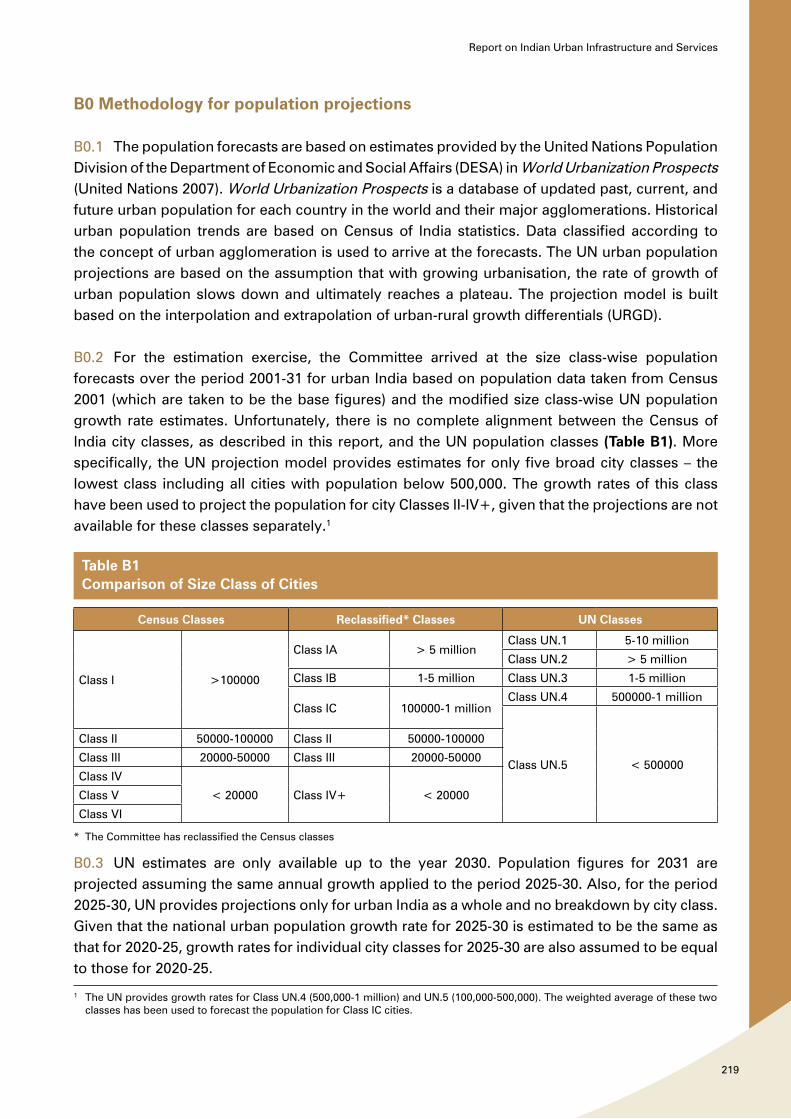
219
Report on Indian Urban Infrastructure and Services
B0 Methodology for population projections
B0.1 The population forecasts are based on estimates provided by the United Nations Population Division of the Department of Economic and Social Affairs (DESA) in World Urbanization Prospects (United Nations 2007). World Urbanization Prospects is a database of updated past, current, and future urban population for each country in the world and their major agglomerations. Historical urban population trends are based on Census of India statistics. Data classified according to the concept of urban agglomeration is used to arrive at the forecasts. The UN urban population projections are based on the assumption that with growing urbanisation, the rate of growth of urban population slows down and ultimately reaches a plateau. The projection model is built based on the interpolation and extrapolation of urban-rural growth differentials (URGD).
B0.2 For the estimation exercise, the Committee arrived at the size class-wise population forecasts over the period 2001-31 for urban India based on population data taken from Census 2001 (which are taken to be the base figures) and the modified size class-wise UN population growth rate estimates. Unfortunately, there is no complete alignment between the Census of India city classes, as described in this report, and the UN population classes (Table B1). More specifically, the UN projection model provides estimates for only five broad city classes – the lowest class including all cities with population below 500,000. The growth rates of this class have been used to project the population for city Classes II-IV+, given that the projections are not available for these classes separately.1
Table B1 Comparison of Size Class of Cities
Census Classes Reclassified* Classes UN Classes
Class I >100000
Class IA > 5 millionClass UN.1 5-10 millionClass UN.2 > 5 million
Class IB 1-5 million Class UN.3 1-5 million
Class IC 100000-1 million Class UN.4 500000-1 million
Class UN.5 < 500000
Class II 50000-100000 Class II 50000-100000Class III 20000-50000 Class III 20000-50000Class IV
< 20000 Class IV+ < 20000Class VClass VI
B0.3 UN estimates are only available up to the year 2030. Population figures for 2031 are projected assuming the same annual growth applied to the period 2025-30. Also, for the period 2025-30, UN provides projections only for urban India as a whole and no breakdown by city class. Given that the national urban population growth rate for 2025-30 is estimated to be the same as that for 2020-25, growth rates for individual city classes for 2025-30 are also assumed to be equal to those for 2020-25.
1 The UN provides growth rates for Class UN.4 (500,000-1 million) and UN.5 (100,000-500,000). The weighted average of these two classes has been used to forecast the population for Class IC cities.
* The Committee has reclassified the Census classes
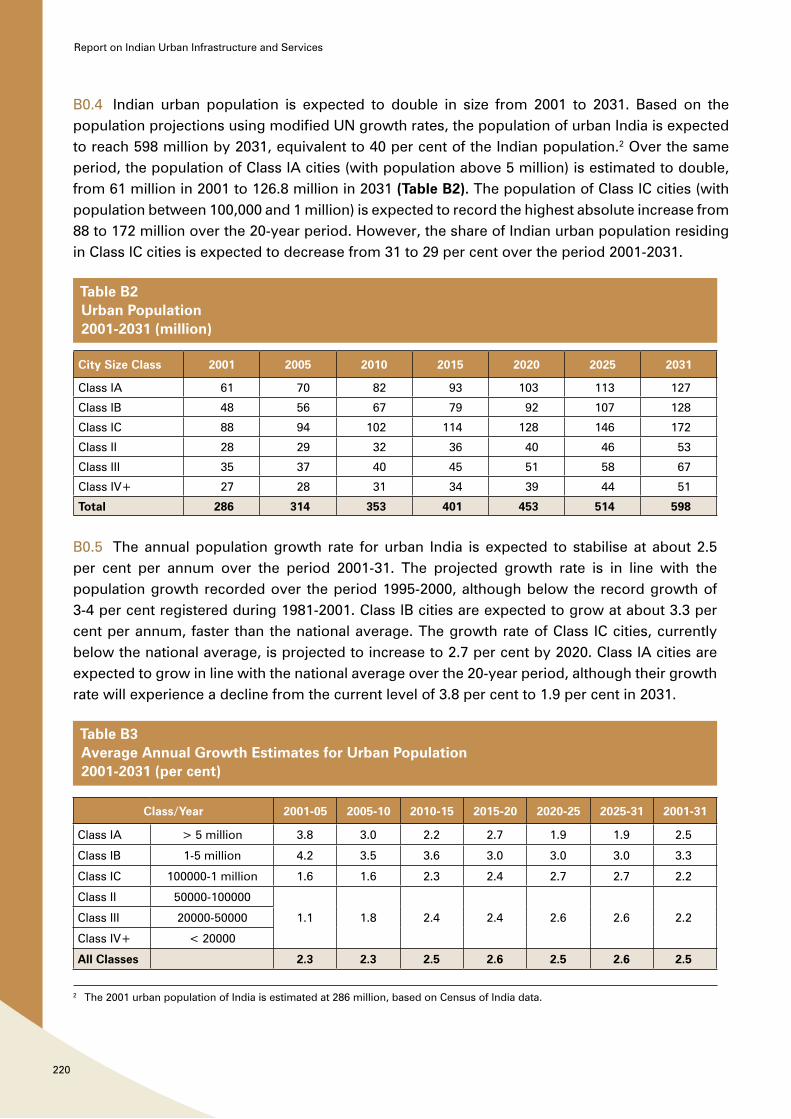
Report on Indian Urban Infrastructure and Services
220
Class/Year 2001-05 2005-10 2010-15 2015-20 2020-25 2025-31 2001-31
Class IA > 5 million 3.8 3.0 2.2 2.7 1.9 1.9 2.5
Class IB 1-5 million 4.2 3.5 3.6 3.0 3.0 3.0 3.3
Class IC 100000-1 million 1.6 1.6 2.3 2.4 2.7 2.7 2.2
Class II 50000-100000
1.1 1.8 2.4 2.4 2.6 2.6 2.2Class III 20000-50000
Class IV+ < 20000
All Classes 2.3 2.3 2.5 2.6 2.5 2.6 2.5
B0.4 Indian urban population is expected to double in size from 2001 to 2031. Based on the population projections using modified UN growth rates, the population of urban India is expected to reach 598 million by 2031, equivalent to 40 per cent of the Indian population.2 Over the same period, the population of Class IA cities (with population above 5 million) is estimated to double, from 61 million in 2001 to 126.8 million in 2031 (Table B2). The population of Class IC cities (with population between 100,000 and 1 million) is expected to record the highest absolute increase from 88 to 172 million over the 20-year period. However, the share of Indian urban population residing in Class IC cities is expected to decrease from 31 to 29 per cent over the period 2001-2031.
Table B2 Urban Population 2001-2031 (million)
2 The 2001 urban population of India is estimated at 286 million, based on Census of India data.
B0.5 The annual population growth rate for urban India is expected to stabilise at about 2.5 per cent per annum over the period 2001-31. The projected growth rate is in line with the population growth recorded over the period 1995-2000, although below the record growth of 3-4 per cent registered during 1981-2001. Class IB cities are expected to grow at about 3.3 per cent per annum, faster than the national average. The growth rate of Class IC cities, currently below the national average, is projected to increase to 2.7 per cent by 2020. Class IA cities are expected to grow in line with the national average over the 20-year period, although their growth rate will experience a decline from the current level of 3.8 per cent to 1.9 per cent in 2031.
Table B3 Average Annual Growth Estimates for Urban Population 2001-2031 (per cent)
City Size Class 2001 2005 2010 2015 2020 2025 2031
Class IA 61 70 82 93 103 113 127
Class IB 48 56 67 79 92 107 128
Class IC 88 94 102 114 128 146 172
Class II 28 29 32 36 40 46 53
Class III 35 37 40 45 51 58 67
Class IV+ 27 28 31 34 39 44 51
Total 286 314 353 401 453 514 598
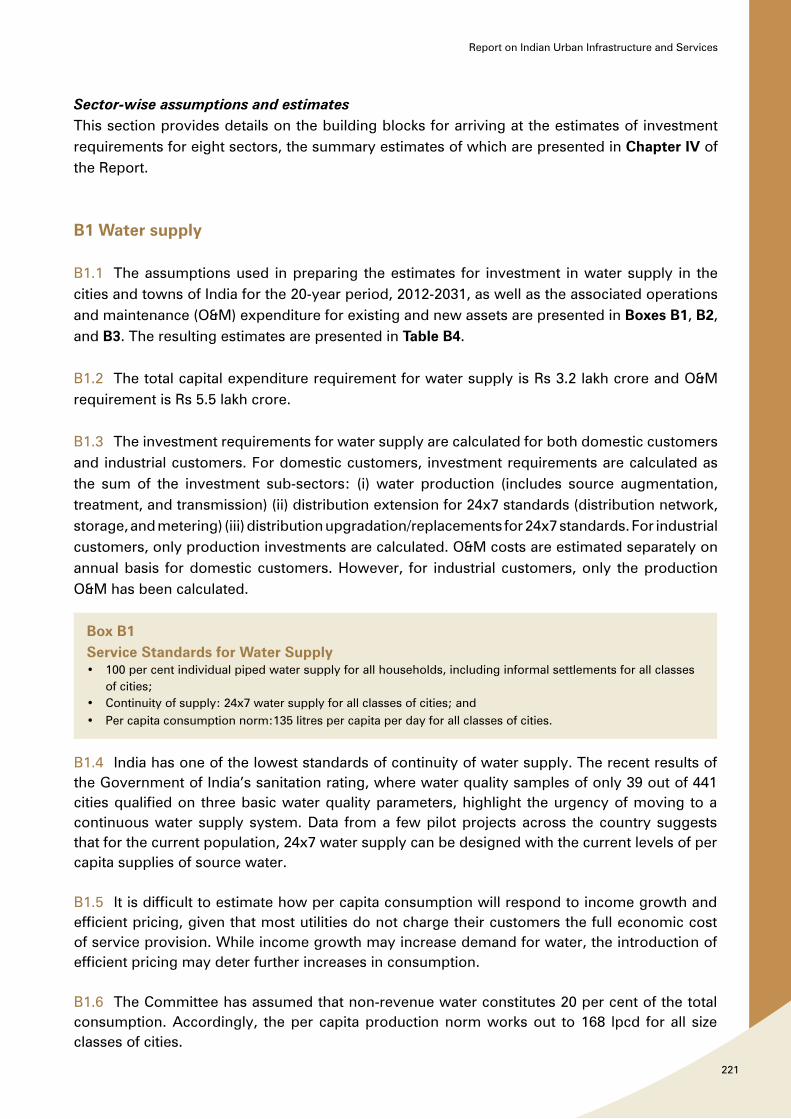
221
Report on Indian Urban Infrastructure and Services
Sector-wise assumptions and estimatesThis section provides details on the building blocks for arriving at the estimates of investment requirements for eight sectors, the summary estimates of which are presented in Chapter IV of the Report.
B1 Water supply
B1.1 The assumptions used in preparing the estimates for investment in water supply in the cities and towns of India for the 20-year period, 2012-2031, as well as the associated operations and maintenance (O&M) expenditure for existing and new assets are presented in Boxes B1, B2, and B3. The resulting estimates are presented in Table B4.
B1.2 The total capital expenditure requirement for water supply is Rs 3.2 lakh crore and O&M requirement is Rs 5.5 lakh crore.
B1.3 The investment requirements for water supply are calculated for both domestic customers and industrial customers. For domestic customers, investment requirements are calculated as the sum of the investment sub-sectors: (i) water production (includes source augmentation, treatment, and transmission) (ii) distribution extension for 24x7 standards (distribution network, storage, and metering) (iii) distribution upgradation/replacements for 24x7 standards. For industrial customers, only production investments are calculated. O&M costs are estimated separately on annual basis for domestic customers. However, for industrial customers, only the production O&M has been calculated.
Box B1 Service Standards for Water Supply
100 per cent individual piped water supply for all households, including informal settlements for all classes • of cities; Continuity of supply: 24x7 water supply for all classes of cities; and• Per capita consumption norm:135 litres per capita per day for all classes of cities.•
B1.4 India has one of the lowest standards of continuity of water supply. The recent results of the Government of India’s sanitation rating, where water quality samples of only 39 out of 441 cities qualified on three basic water quality parameters, highlight the urgency of moving to a continuous water supply system. Data from a few pilot projects across the country suggests that for the current population, 24x7 water supply can be designed with the current levels of per capita supplies of source water.
B1.5 It is difficult to estimate how per capita consumption will respond to income growth and efficient pricing, given that most utilities do not charge their customers the full economic cost of service provision. While income growth may increase demand for water, the introduction of efficient pricing may deter further increases in consumption.
B1.6 The Committee has assumed that non-revenue water constitutes 20 per cent of the total consumption. Accordingly, the per capita production norm works out to 168 lpcd for all size classes of cities.
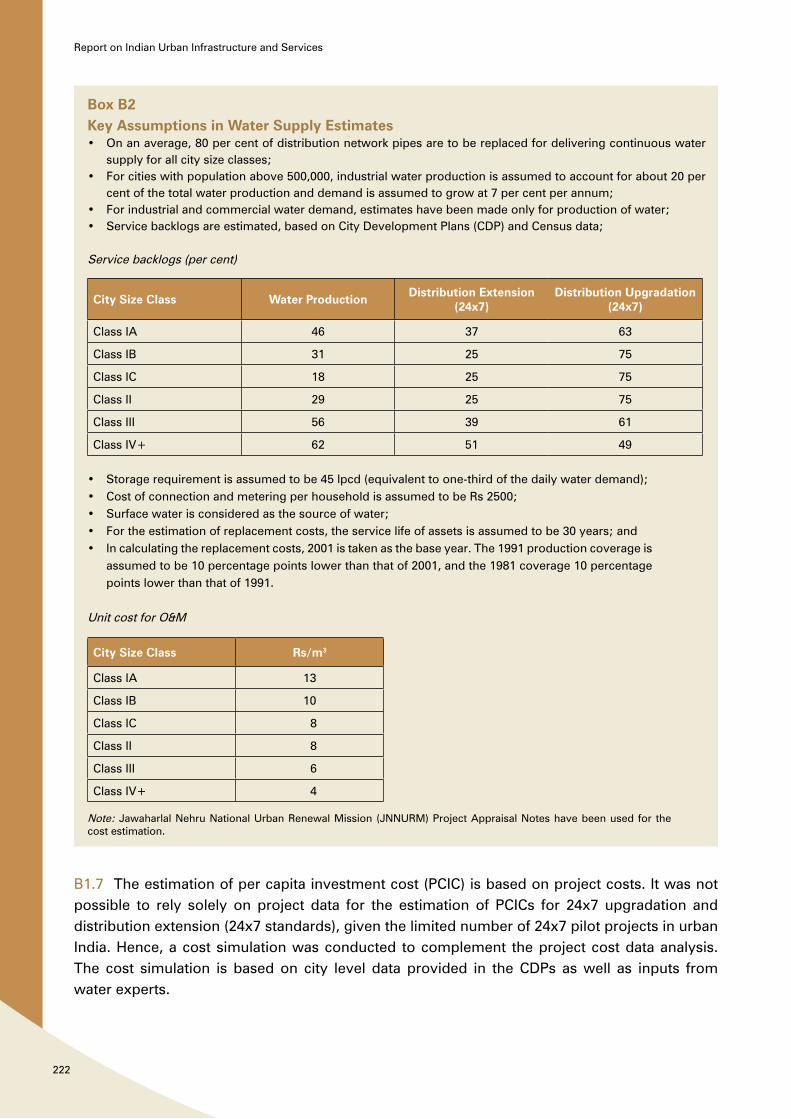
Report on Indian Urban Infrastructure and Services
222
Note: Jawaharlal Nehru National Urban Renewal Mission (JNNURM) Project Appraisal Notes have been used for the cost estimation.
City Size Class Water ProductionDistribution Extension
(24x7)Distribution Upgradation
(24x7)
Class IA 46 37 63
Class IB 31 25 75
Class IC 18 25 75
Class II 29 25 75
Class III 56 39 61
Class IV+ 62 51 49
Storage requirement is assumed to be 45 lpcd (equivalent to one-third of the daily water demand);• Cost of connection and metering per household is assumed to be Rs 2500;• Surface water is considered as the source of water;• For the estimation of replacement costs, the service life of assets is assumed to be 30 years; and• In calculating the replacement costs, 2001 is taken as the base year. The 1991 production coverage is • assumed to be 10 percentage points lower than that of 2001, and the 1981 coverage 10 percentage points lower than that of 1991.
Unit cost for O&M
Box B2 Key Assumptions in Water Supply Estimates
On an average, 80 per cent of distribution network pipes are to be replaced for delivering continuous water • supply for all city size classes;For cities with population above 500,000, industrial water production is assumed to account for about 20 per • cent of the total water production and demand is assumed to grow at 7 per cent per annum;For industrial and commercial water demand, estimates have been made only for production of water;• Service backlogs are estimated, based on City Development Plans (CDP) and Census data;•
Service backlogs (per cent)
City Size Class Rs/m3
Class IA 13
Class IB 10
Class IC 8
Class II 8
Class III 6
Class IV+ 4
B1.7 The estimation of per capita investment cost (PCIC) is based on project costs. It was not possible to rely solely on project data for the estimation of PCICs for 24x7 upgradation and distribution extension (24x7 standards), given the limited number of 24x7 pilot projects in urban India. Hence, a cost simulation was conducted to complement the project cost data analysis. The cost simulation is based on city level data provided in the CDPs as well as inputs from water experts.
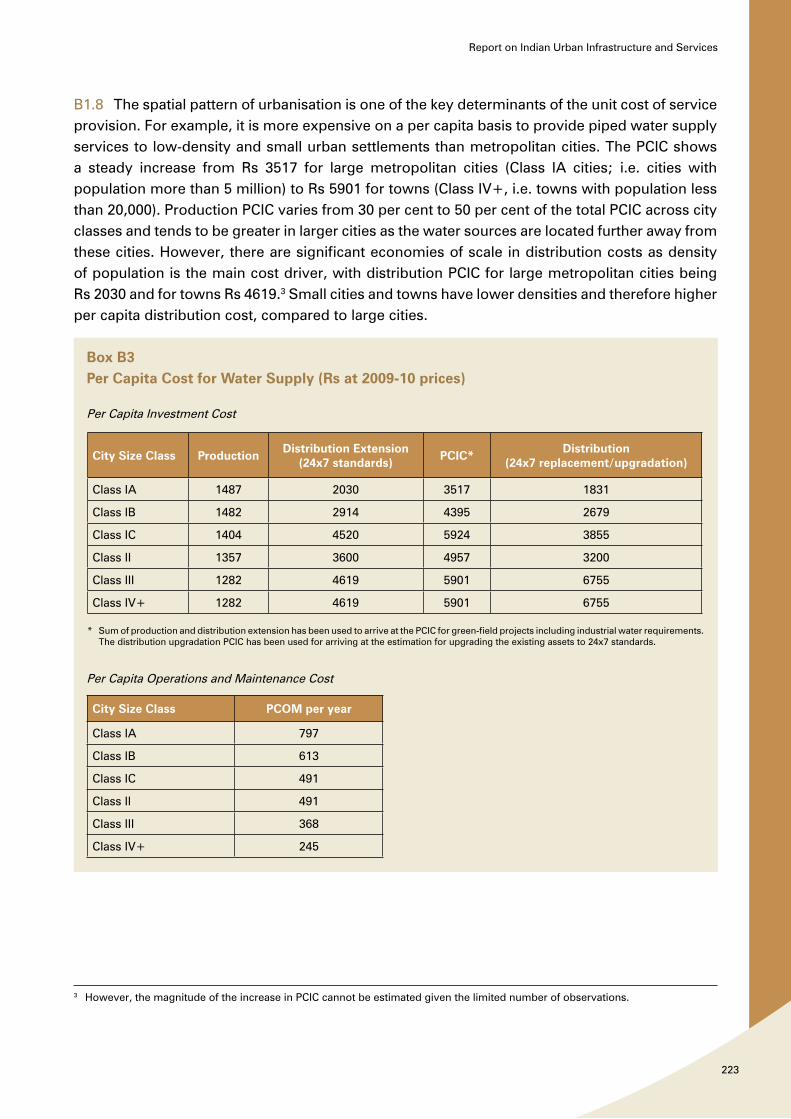
223
Report on Indian Urban Infrastructure and Services
3 However, the magnitude of the increase in PCIC cannot be estimated given the limited number of observations.
City Size Class ProductionDistribution Extension
(24x7 standards)PCIC*
Distribution (24x7 replacement/upgradation)
Class IA 1487 2030 3517 1831
Class IB 1482 2914 4395 2679
Class IC 1404 4520 5924 3855
Class II 1357 3600 4957 3200
Class III 1282 4619 5901 6755
Class IV+ 1282 4619 5901 6755
B1.8 The spatial pattern of urbanisation is one of the key determinants of the unit cost of service provision. For example, it is more expensive on a per capita basis to provide piped water supply services to low-density and small urban settlements than metropolitan cities. The PCIC shows a steady increase from Rs 3517 for large metropolitan cities (Class IA cities; i.e. cities with population more than 5 million) to Rs 5901 for towns (Class IV+, i.e. towns with population less than 20,000). Production PCIC varies from 30 per cent to 50 per cent of the total PCIC across city classes and tends to be greater in larger cities as the water sources are located further away from these cities. However, there are significant economies of scale in distribution costs as density of population is the main cost driver, with distribution PCIC for large metropolitan cities being Rs 2030 and for towns Rs 4619.3 Small cities and towns have lower densities and therefore higher per capita distribution cost, compared to large cities.
* Sum of production and distribution extension has been used to arrive at the PCIC for green-field projects including industrial water requirements. The distribution upgradation PCIC has been used for arriving at the estimation for upgrading the existing assets to 24x7 standards.
Box B3Per Capita Cost for Water Supply (Rs at 2009-10 prices)
Per Capita Investment Cost
Per Capita Operations and Maintenance Cost
City Size Class PCOM per year
Class IA 797
Class IB 613
Class IC 491
Class II 491
Class III 368
Class IV+ 245
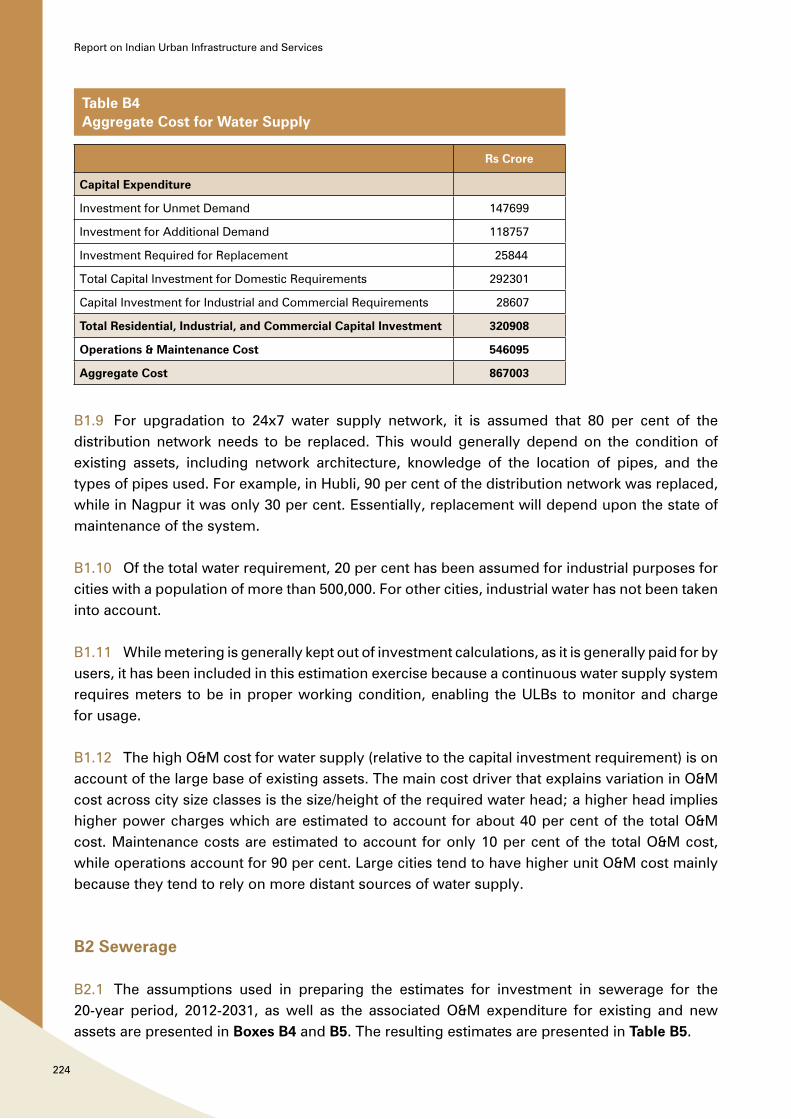
Report on Indian Urban Infrastructure and Services
224
Rs Crore
Capital Expenditure
Investment for Unmet Demand 147699
Investment for Additional Demand 118757
Investment Required for Replacement 25844
Total Capital Investment for Domestic Requirements 292301
Capital Investment for Industrial and Commercial Requirements 28607
Total Residential, Industrial, and Commercial Capital Investment 320908
Operations & Maintenance Cost 546095
Aggregate Cost 867003
B1.9 For upgradation to 24x7 water supply network, it is assumed that 80 per cent of the distribution network needs to be replaced. This would generally depend on the condition of existing assets, including network architecture, knowledge of the location of pipes, and the types of pipes used. For example, in Hubli, 90 per cent of the distribution network was replaced, while in Nagpur it was only 30 per cent. Essentially, replacement will depend upon the state of maintenance of the system.
B1.10 Of the total water requirement, 20 per cent has been assumed for industrial purposes for cities with a population of more than 500,000. For other cities, industrial water has not been taken into account.
B1.11 While metering is generally kept out of investment calculations, as it is generally paid for by users, it has been included in this estimation exercise because a continuous water supply system requires meters to be in proper working condition, enabling the ULBs to monitor and charge for usage.
B1.12 The high O&M cost for water supply (relative to the capital investment requirement) is on account of the large base of existing assets. The main cost driver that explains variation in O&M cost across city size classes is the size/height of the required water head; a higher head implies higher power charges which are estimated to account for about 40 per cent of the total O&M cost. Maintenance costs are estimated to account for only 10 per cent of the total O&M cost, while operations account for 90 per cent. Large cities tend to have higher unit O&M cost mainly because they tend to rely on more distant sources of water supply.
B2 Sewerage
B2.1 The assumptions used in preparing the estimates for investment in sewerage for the 20-year period, 2012-2031, as well as the associated O&M expenditure for existing and new assets are presented in Boxes B4 and B5. The resulting estimates are presented in Table B5.
Table B4 Aggregate Cost for Water Supply
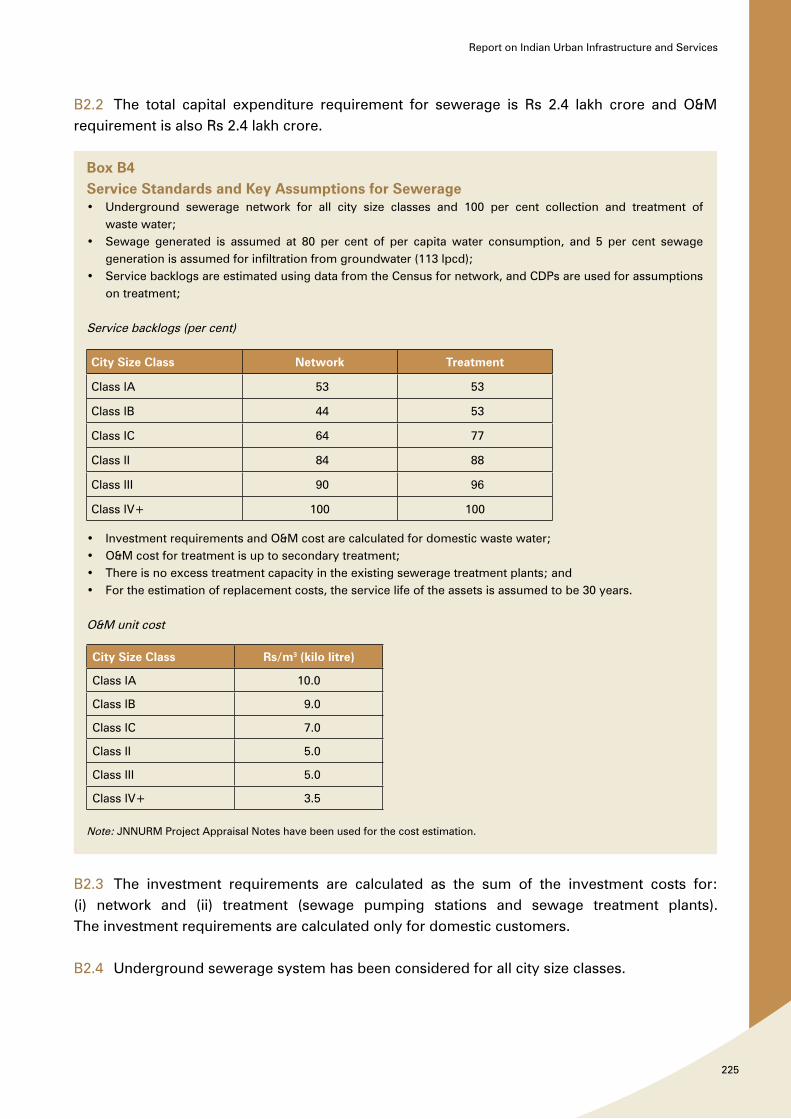
225
Report on Indian Urban Infrastructure and Services
City Size Class Network Treatment
Class IA 53 53
Class IB 44 53
Class IC 64 77
Class II 84 88
Class III 90 96
Class IV+ 100 100
City Size Class Rs/m3 (kilo litre)
Class IA 10.0
Class IB 9.0
Class IC 7.0
Class II 5.0
Class III 5.0
Class IV+ 3.5
Note: JNNURM Project Appraisal Notes have been used for the cost estimation.
Box B4 Service Standards and Key Assumptions for Sewerage
Underground sewerage network for all city size classes and 100 per cent collection and treatment of • waste water; Sewage generated is assumed at 80 per cent of per capita water consumption, and 5 per cent sewage • generation is assumed for infiltration from groundwater (113 lpcd);Service backlogs are estimated using data from the Census for network, and CDPs are used for assumptions • on treatment;
Service backlogs (per cent)
Investment requirements and O&M cost are calculated for domestic waste water;• O&M cost for treatment is up to secondary treatment;• There is no excess treatment capacity in the existing sewerage treatment plants; and• For the estimation of replacement costs, the service life of the assets is assumed to be 30 years.•
O&M unit cost
B2.2 The total capital expenditure requirement for sewerage is Rs 2.4 lakh crore and O&M requirement is also Rs 2.4 lakh crore.
B2.3 The investment requirements are calculated as the sum of the investment costs for: (i) network and (ii) treatment (sewage pumping stations and sewage treatment plants). The investment requirements are calculated only for domestic customers.
B2.4 Underground sewerage system has been considered for all city size classes.
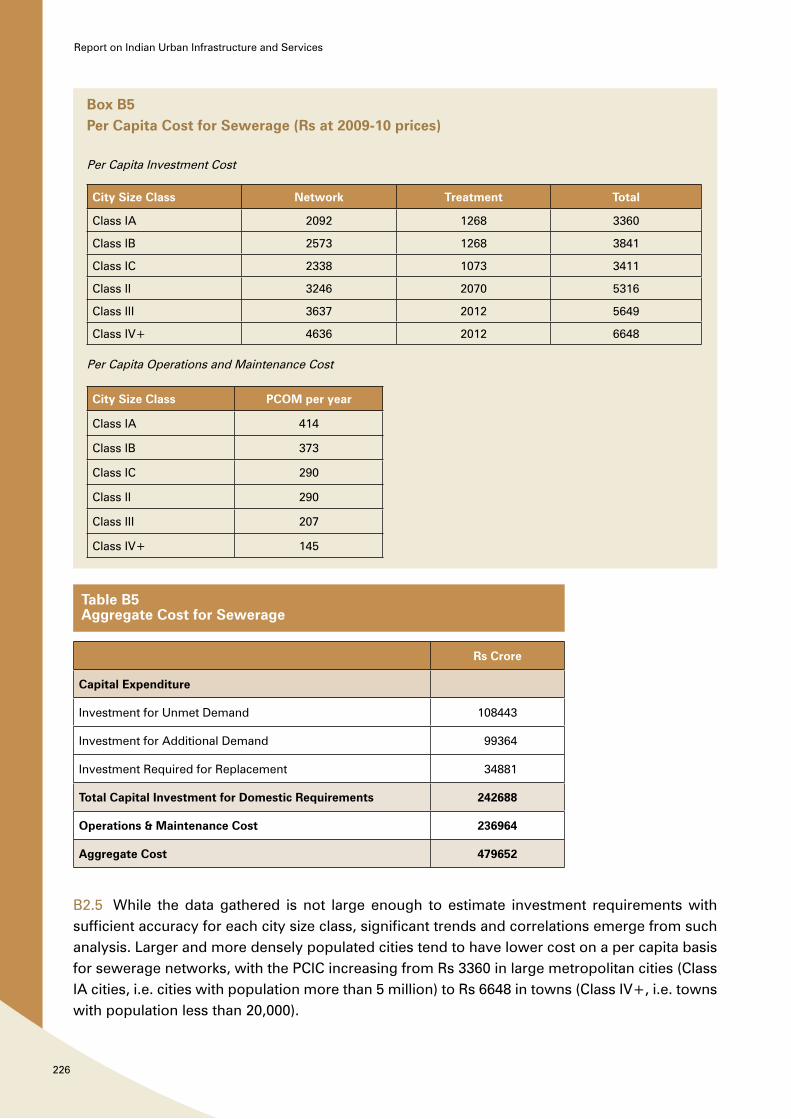
Report on Indian Urban Infrastructure and Services
226
Rs Crore
Capital Expenditure
Investment for Unmet Demand 108443
Investment for Additional Demand 99364
Investment Required for Replacement 34881
Total Capital Investment for Domestic Requirements 242688
Operations & Maintenance Cost 236964
Aggregate Cost 479652
City Size Class Network Treatment Total
Class IA 2092 1268 3360
Class IB 2573 1268 3841
Class IC 2338 1073 3411
Class II 3246 2070 5316
Class III 3637 2012 5649
Class IV+ 4636 2012 6648
Box B5Per Capita Cost for Sewerage (Rs at 2009-10 prices)
Per Capita Investment Cost
Per Capita Operations and Maintenance Cost
Table B5 Aggregate Cost for Sewerage
City Size Class PCOM per year
Class IA 414
Class IB 373
Class IC 290
Class II 290
Class III 207
Class IV+ 145
B2.5 While the data gathered is not large enough to estimate investment requirements with sufficient accuracy for each city size class, significant trends and correlations emerge from such analysis. Larger and more densely populated cities tend to have lower cost on a per capita basis for sewerage networks, with the PCIC increasing from Rs 3360 in large metropolitan cities (Class IA cities, i.e. cities with population more than 5 million) to Rs 6648 in towns (Class IV+, i.e. towns with population less than 20,000).
227
Report on Indian Urban Infrastructure and Services
B2.6 The average O&M cost for network is estimated at Rs 3.3 per cu. m; O&M cost for treatment is estimated at Rs 5.4 per cu. m on an average. The total O&M cost for sewerage covering the existing and new assets is lower than that of water supply because of the existing low service coverage and lower unit cost of O&M. Industrial waste water collection and treatment have not been considered for the purpose of estimating investment requirements.
B3 Solid waste management
B3.1 The assumptions used in preparing the estimates for investment in solid waste management for the 20-year period, 2012-2031, as well as the associated O&M expenditure for existing and new assets are presented in Boxes B6 and B7. The resulting estimates are presented in Table B6.
B3.2 The total capital expenditure requirement for solid waste management is Rs 48,582 crore and O&M requirement is Rs 2.7 lakh crore.
B3.3 The investment requirements are calculated as the sum of: (i) Collection and Transport: trucks, containers, push carts, mechanical sweeping, and transfer stations, (ii) Processing: treatment plants, and (iii) Disposal: development of landfill sites.
B3.4 The assumptions underlying the estimation exercise for solid waste management are based on the Municipal Solid Waste (Management and Handling) Rules 2000.
B3.5. Over 60 per cent of the waste generated in India is biodegradable and hence, suitable for composting. This is unlike the situation in western countries which have a higher proportion of non-biodegradable waste. Given this scenario, the share of waste processed is assumed to be 80 per cent of the total waste generated and the share of waste disposal 20 per cent in the project’s design year. Of the waste disposed, 50 per cent is direct landfill and 50 per cent is processed.
B3.6 The higher PCIC in large cities is due to the higher per capita waste generated compared with other city classes. There are no significant economies of scale in processing. A uniform unit cost for O&M has been assumed for all city classes based on the assumption that large cities would adopt highly mechanised systems while smaller cities would adopt comparatively more labour intensive processes.
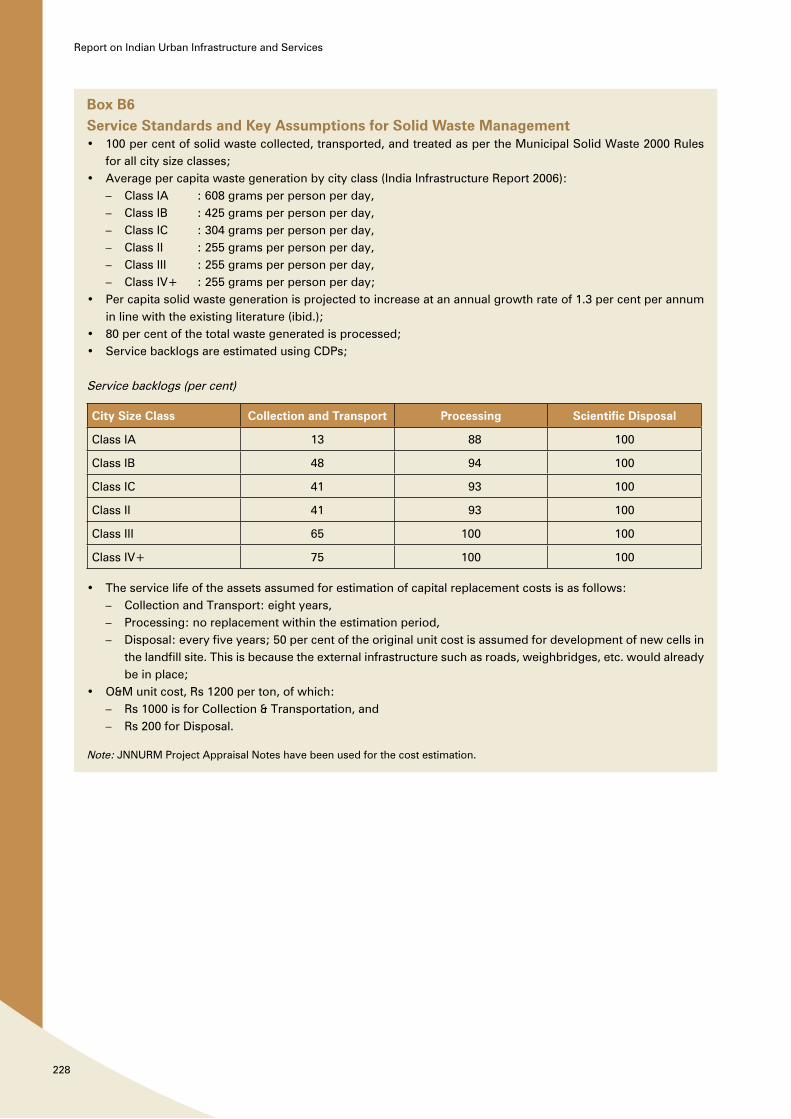
Report on Indian Urban Infrastructure and Services
228
Box B6 Service Standards and Key Assumptions for Solid Waste Management
100 per cent of solid waste collected, transported, and treated as per the Municipal Solid Waste 2000 Rules • for all city size classes;Average per capita waste generation by city class (India Infrastructure Report 2006):•
Class IA : 608 grams per person per day, –Class IB : 425 grams per person per day, –Class IC : 304 grams per person per day, –Class II : 255 grams per person per day, –Class III : 255 grams per person per day, –Class IV+ : 255 grams per person per day; –
Per capita solid waste generation is projected to increase at an annual growth rate of 1.3 per cent per annum • in line with the existing literature (ibid.);80 per cent of the total waste generated is processed;• Service backlogs are estimated using CDPs;•
Service backlogs (per cent)
The service life of the assets assumed for estimation of capital replacement costs is as follows:• Collection and Transport: eight years, –Processing: no replacement within the estimation period, –Disposal: every five years; 50 per cent of the original unit cost is assumed for development of new cells in –the landfill site. This is because the external infrastructure such as roads, weighbridges, etc. would already be in place;
O&M unit cost, Rs 1200 per ton, of which:• Rs 1000 is for Collection & Transportation, and –Rs 200 for Disposal. –
Note: JNNURM Project Appraisal Notes have been used for the cost estimation.
City Size Class Collection and Transport Processing Scientific Disposal
Class IA 13 88 100
Class IB 48 94 100
Class IC 41 93 100
Class II 41 93 100
Class III 65 100 100
Class IV+ 75 100 100
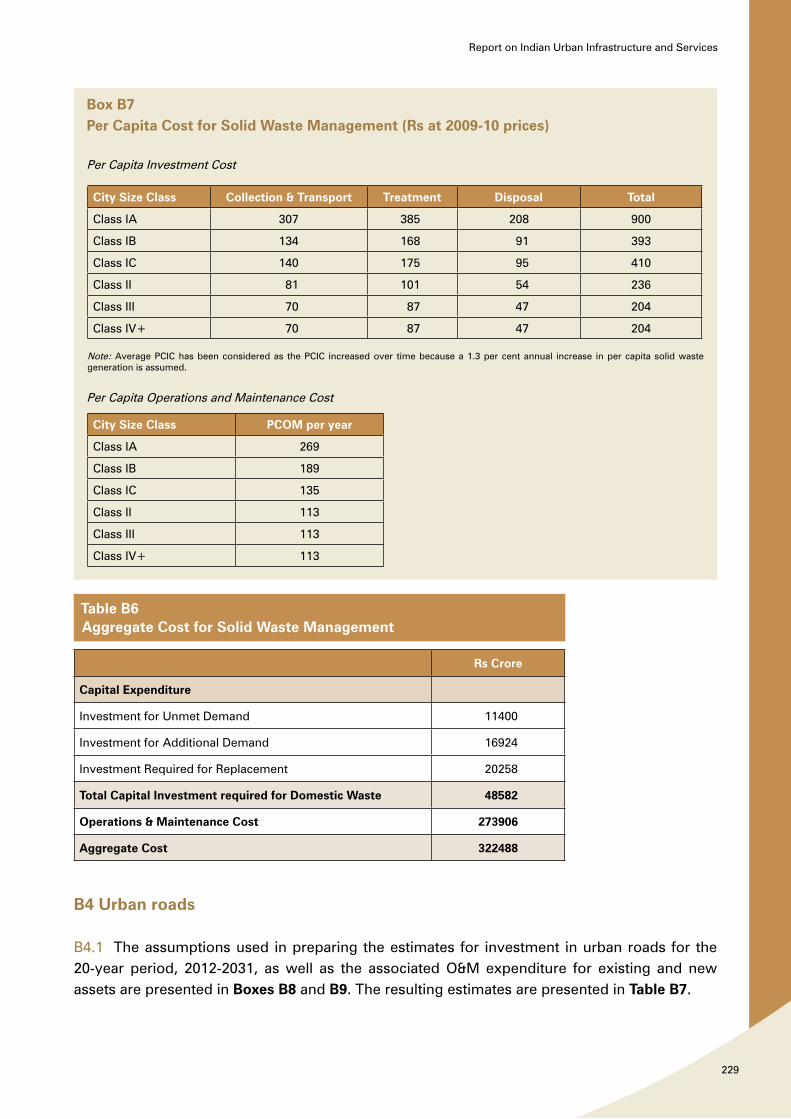
229
Report on Indian Urban Infrastructure and Services
Note: Average PCIC has been considered as the PCIC increased over time because a 1.3 per cent annual increase in per capita solid waste generation is assumed.
Box B7 Per Capita Cost for Solid Waste Management (Rs at 2009-10 prices)
Per Capita Investment Cost
Per Capita Operations and Maintenance Cost
Table B6 Aggregate Cost for Solid Waste Management
B4 Urban roads
B4.1 The assumptions used in preparing the estimates for investment in urban roads for the 20-year period, 2012-2031, as well as the associated O&M expenditure for existing and new assets are presented in Boxes B8 and B9. The resulting estimates are presented in Table B7.
Rs Crore
Capital Expenditure
Investment for Unmet Demand 11400
Investment for Additional Demand 16924
Investment Required for Replacement 20258
Total Capital Investment required for Domestic Waste 48582
Operations & Maintenance Cost 273906
Aggregate Cost 322488
City Size Class Collection & Transport Treatment Disposal Total
Class IA 307 385 208 900
Class IB 134 168 91 393
Class IC 140 175 95 410
Class II 81 101 54 236
Class III 70 87 47 204
Class IV+ 70 87 47 204
City Size Class PCOM per year
Class IA 269
Class IB 189
Class IC 135
Class II 113
Class III 113
Class IV+ 113
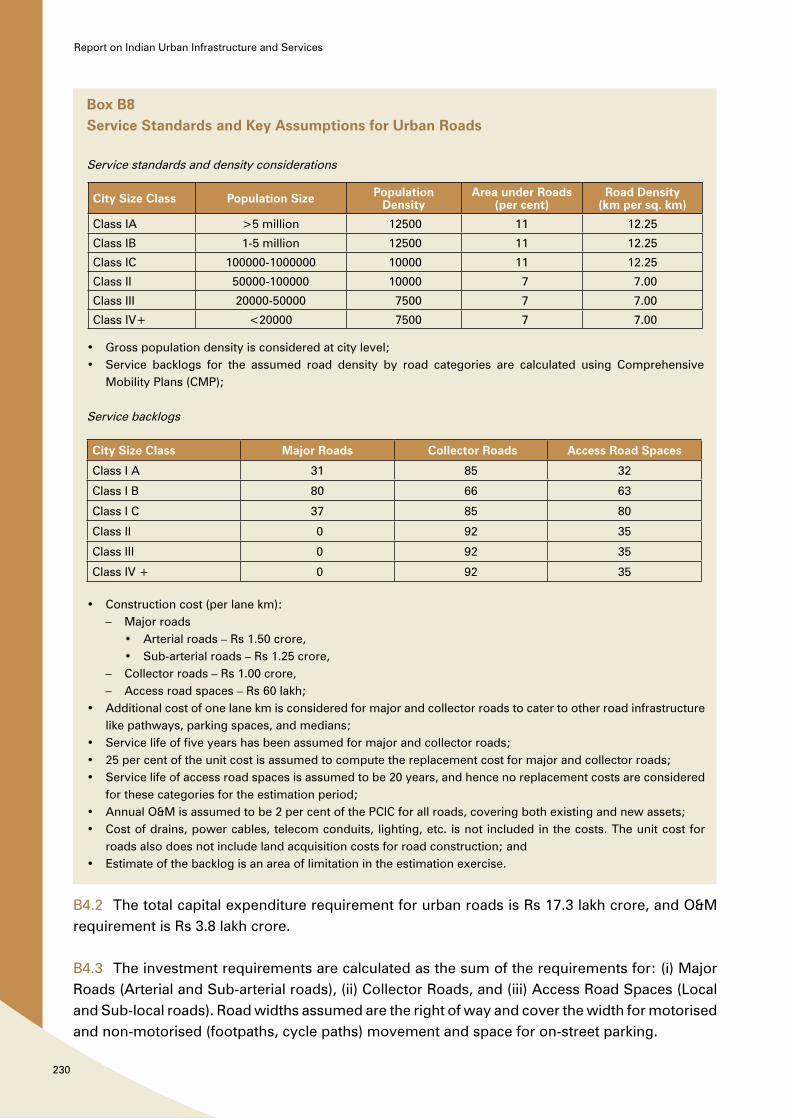
Report on Indian Urban Infrastructure and Services
230
Box B8 Service Standards and Key Assumptions for Urban Roads
Service standards and density considerations
Gross population density is considered at city level; • Service backlogs for the assumed road density by road categories are calculated using Comprehensive • Mobility Plans (CMP);
Service backlogs
Construction cost (per lane km):• Major roads –
Arterial roads • – Rs 1.50 crore, Sub-arterial roads • – Rs 1.25 crore,
Collector roads – – Rs 1.00 crore,Access road spaces – – Rs 60 lakh;
Additional cost of one lane km is considered for major and collector roads to cater to other road infrastructure • like pathways, parking spaces, and medians;Service life of five years has been assumed for major and collector roads;• 25 per cent of the unit cost is assumed to compute the replacement cost for major and collector roads; • Service life of access road spaces is assumed to be 20 years, and hence no replacement costs are considered • for these categories for the estimation period;Annual O&M is assumed to be 2 per cent of the PCIC for all roads, covering both existing and new assets;• Cost of drains, power cables, telecom conduits, lighting, etc. is not included in the costs. The unit cost for • roads also does not include land acquisition costs for road construction; andEstimate of the backlog is an area of limitation in the estimation exercise.•
B4.2 The total capital expenditure requirement for urban roads is Rs 17.3 lakh crore, and O&M requirement is Rs 3.8 lakh crore.
B4.3 The investment requirements are calculated as the sum of the requirements for: (i) Major Roads (Arterial and Sub-arterial roads), (ii) Collector Roads, and (iii) Access Road Spaces (Local and Sub-local roads). Road widths assumed are the right of way and cover the width for motorised and non-motorised (footpaths, cycle paths) movement and space for on-street parking.
City Size Class Population Size Population Density
Area under Roads (per cent)
Road Density (km per sq. km)
Class IA >5 million 12500 11 12.25Class IB 1-5 million 12500 11 12.25Class IC 100000-1000000 10000 11 12.25Class II 50000-100000 10000 7 7.00Class III 20000-50000 7500 7 7.00Class IV+ <20000 7500 7 7.00
City Size Class Major Roads Collector Roads Access Road Spaces
Class I A 31 85 32
Class I B 80 66 63
Class I C 37 85 80
Class II 0 92 35
Class III 0 92 35
Class IV + 0 92 35
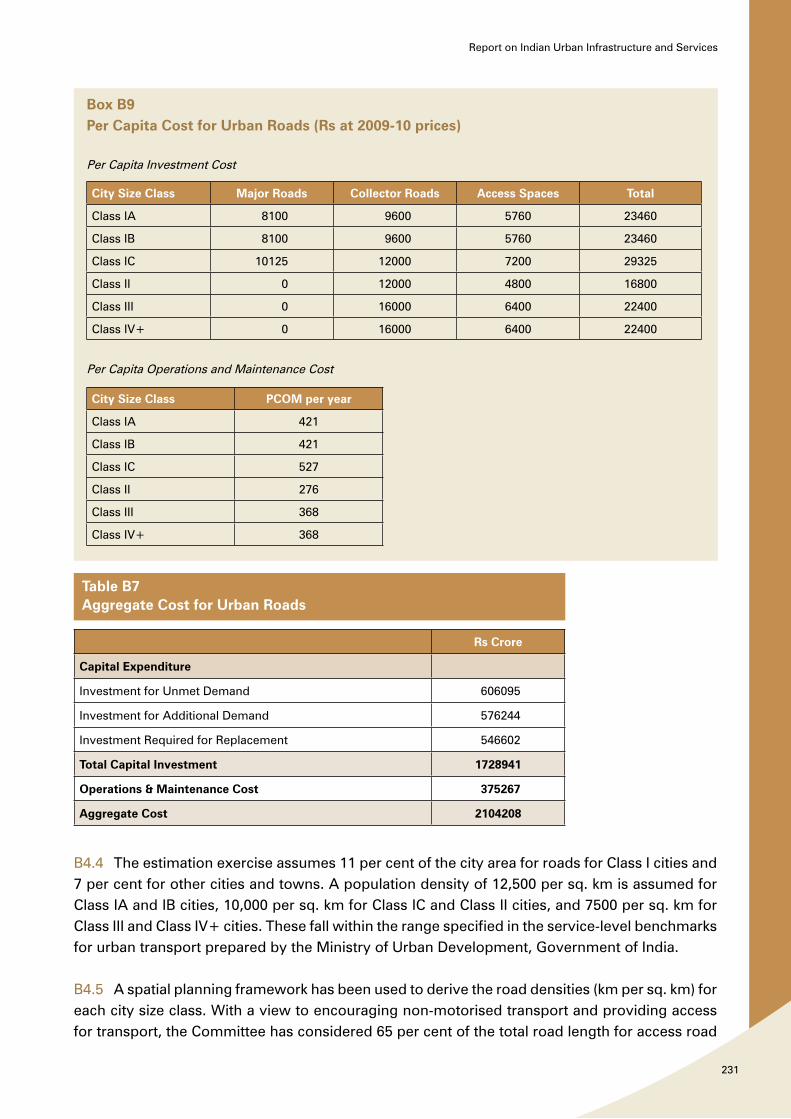
231
Report on Indian Urban Infrastructure and Services
Box B9 Per Capita Cost for Urban Roads (Rs at 2009-10 prices)
Per Capita Investment Cost
Per Capita Operations and Maintenance Cost
Table B7 Aggregate Cost for Urban Roads
Rs Crore
Capital Expenditure
Investment for Unmet Demand 606095
Investment for Additional Demand 576244
Investment Required for Replacement 546602
Total Capital Investment 1728941
Operations & Maintenance Cost 375267
Aggregate Cost 2104208
B4.4 The estimation exercise assumes 11 per cent of the city area for roads for Class I cities and 7 per cent for other cities and towns. A population density of 12,500 per sq. km is assumed for Class IA and IB cities, 10,000 per sq. km for Class IC and Class II cities, and 7500 per sq. km for Class III and Class IV+ cities. These fall within the range specified in the service-level benchmarks for urban transport prepared by the Ministry of Urban Development, Government of India.
B4.5 A spatial planning framework has been used to derive the road densities (km per sq. km) for each city size class. With a view to encouraging non-motorised transport and providing access for transport, the Committee has considered 65 per cent of the total road length for access road
City Size Class Major Roads Collector Roads Access Spaces Total
Class IA 8100 9600 5760 23460
Class IB 8100 9600 5760 23460
Class IC 10125 12000 7200 29325
Class II 0 12000 4800 16800
Class III 0 16000 6400 22400
Class IV+ 0 16000 6400 22400
City Size Class PCOM per year
Class IA 421
Class IB 421
Class IC 527
Class II 276
Class III 368
Class IV+ 368
Report on Indian Urban Infrastructure and Services
232
spaces and 25 per cent for collector roads. Only 10 per cent of the total road length is assumed for major roads so as to discourage private transport.
B4.6 The Committee feels that cities should aim to have a low share of road space for motorised transport and a high quality public transport system, so that people are encouraged to use public transport instead of personalised transport, in line with the National Urban Transport Policy 2006. Population density and road density are the key drivers for the computation of PCIC, with the PCIC being inversely related to both of them. The average PCIC for urban roads across all city size classes is Rs 22,974. Economies of scale, on account of the key drivers, are evident in all city size classes.
B4.7 Urban roads account for 56 per cent of the total requirement for urban infrastructure. It is worth highlighting that the definition of roads for the exercise includes access road spaces which are generally not part of such estimation exercises. Service life of five years for the major and collector roads has been assumed for calculation of reinvestment costs which amount to Rs 5.4 lakh crore (31 per cent of urban road investment requirements). Investment requirement for access road spaces amounts to Rs 3 lakh crore over the 20-year period.
B4.8 The estimates for urban roads are meant to be indicative and subject to the specific works to be undertaken on each stretch of road identified for improvement. The scope of works could be designed in a fashion to significantly improve efficiency in relation to construction and maintenance, and to support improvement in other municipal infrastructure such as drainage, water, sewerage, energy distribution, and telecommunications.
B5 Storm water drains
B5.1 The assumptions used in preparing the estimates for investment in storm water drains for the 20-year period, 2012-2031, as well as the associated O&M expenditure for existing and new assets are presented in Boxes B10 and B11. The resulting estimates are presented in Table B8.
B5.2 The total capital expenditure requirement for storm water drains is Rs 1.9 lakh crore and O&M requirement is Rs 34,612 crore.
B5.3 The investment requirements are calculated as the sum of (i) Network and (ii) Outfall. Components for network and outfall include widening of drains and structures to prevent waste dumping, laying of pipeline with pipe support bridges/culverts, catch pits, manholes, outfall structures with gates, and covers for the drain.
B5.4 The PCIC trend for storm water drains follows that of urban roads as the same road densities and backlog have been considered for estimating storm water drain requirements. Like with the estimates for urban roads, the estimates for storm water drains are subject to the specific works to be undertaken, based on factors like city topography, rainfall patterns, and integration with road works.
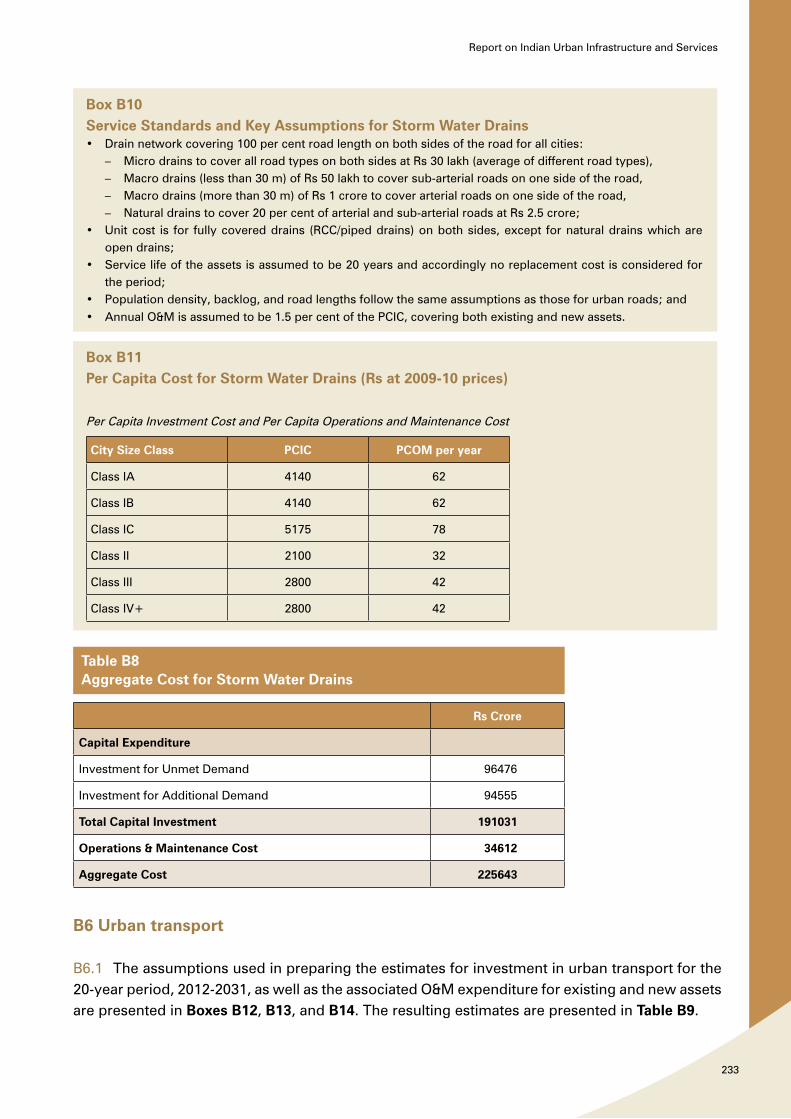
233
Report on Indian Urban Infrastructure and Services
Box B10 Service Standards and Key Assumptions for Storm Water Drains
Drain network covering 100 per cent road length on both sides of the road for all cities:• Micro drains to cover all road types on both sides at Rs 30 lakh (average of different road types), –Macro drains (less than 30 m) of Rs 50 lakh to cover sub-arterial roads on one side of the road, –Macro drains (more than 30 m) of Rs 1 crore to cover arterial roads on one side of the road, –Natural drains to cover 20 per cent of arterial and sub-arterial roads at Rs 2.5 crore; –
Unit cost is for fully covered drains (RCC/piped drains) on both sides, except for natural drains which are • open drains; Service life of the assets is assumed to be 20 years and accordingly no replacement cost is considered for • the period; Population density, backlog, and road lengths follow the same assumptions as those for urban roads; and• Annual O&M is assumed to be 1.5 per cent of the PCIC, covering both existing and new assets.•
Box B11Per Capita Cost for Storm Water Drains (Rs at 2009-10 prices)
Per Capita Investment Cost and Per Capita Operations and Maintenance Cost
Table B8 Aggregate Cost for Storm Water Drains
Rs Crore
Capital Expenditure
Investment for Unmet Demand 96476
Investment for Additional Demand 94555
Total Capital Investment 191031
Operations & Maintenance Cost 34612
Aggregate Cost 225643
B6 Urban transport
B6.1 The assumptions used in preparing the estimates for investment in urban transport for the 20-year period, 2012-2031, as well as the associated O&M expenditure for existing and new assets are presented in Boxes B12, B13, and B14. The resulting estimates are presented in Table B9.
City Size Class PCIC PCOM per year
Class IA 4140 62
Class IB 4140 62
Class IC 5175 78
Class II 2100 32
Class III 2800 42
Class IV+ 2800 42
Report on Indian Urban Infrastructure and Services
234
B6.2 The total capital expenditure requirement for urban transport is Rs 4.5 lakh crore, of which rail-based mass rapid transit system (MRTS) costs about Rs 3.6 lakh crore, road-based MRTS costs about Rs 90,000 crore, and O&M requirement is Rs 3 lakh crore.
B6.3 The investment requirements for urban transport are estimated as the sum of (i) Rail-based MRTS (cost components include rail network, rolling stock, stations, control systems, traction, signalling) and (ii) Road-based MRTS (cost components include road network, bus stops, signages, signalling).
B6.4 Urban transport in India has hitherto been a much neglected area. Indian cities are facing a transport crisis that has been exacerbated by inadequate infrastructure, limited and inefficient public transport, poorly maintained and unpaved, congested roads, and very high pollution levels. On average, the public transport share in the country is currently at 22 per cent, significantly lower than international standards in large cities.
B6.5 Cities should consider use of public transport and non-motorised modes of travel as these modes consume less road space, require less fuel and emit fewer pollutants. The National Urban Transport Policy in India has recognised the concerns with regard to urban transport and its suggestions have been taken into consideration in arriving at the estimates for urban transport.
B6.6 The estimates are predicated on an assumption that cities will consider an integrated transport solution of prioritising the various types of MRTS options based on ridership at the design stage so that they can be made complementary and part of an integrated solution.
B6.7 All available technologies are considered for MRTS, i.e. metro, bus rapid transit system (BRTS), light rail, monorail, suburban rail. Each of these technologies has its unique characteristics such as the urban form, terrain, level of demand, direction and extent of sprawl, projections for future growth, and population density, which will determine the type of technology to be used.
B6.8 An elevated metro rail costs Rs 200 crore per km, while suburban rail costs Rs 60 crore per km. For the purpose of estimation, a cost of Rs 150 crore per km has been assumed as the average cost for suburban rail, monorail, light rails, and elevated metro rail. O&M cost for rail-based MRTS has been taken at an average of 8 per cent of the annual capital investment. While in the initial phases of operation the system would require lower O&M, the O&M cost is likely to increase with time.
B6.9 Rail-based and road-based MRTS have been assigned for only Class IA and IB cities, i.e. cities with population of more than 1 million. A higher network length of 0.5 km per sq.km (for both rail-based and road-based MRTS) has been assumed for Class IA cities, given the importance of the regional transport network in these cities. The Committee has also assigned 20 per cent of the total network length for rail-based MRTS for Class IB cities, i.e. cities with population between 1 million and 5 million. However, factors such as ridership, trip lengths, and spatial structures of these cities should determine whether cities actually opt for rail-based MRTS. In Class IC cities, i.e. cities with population between 100,000 and 1 million, the Committee has not assigned MRTS
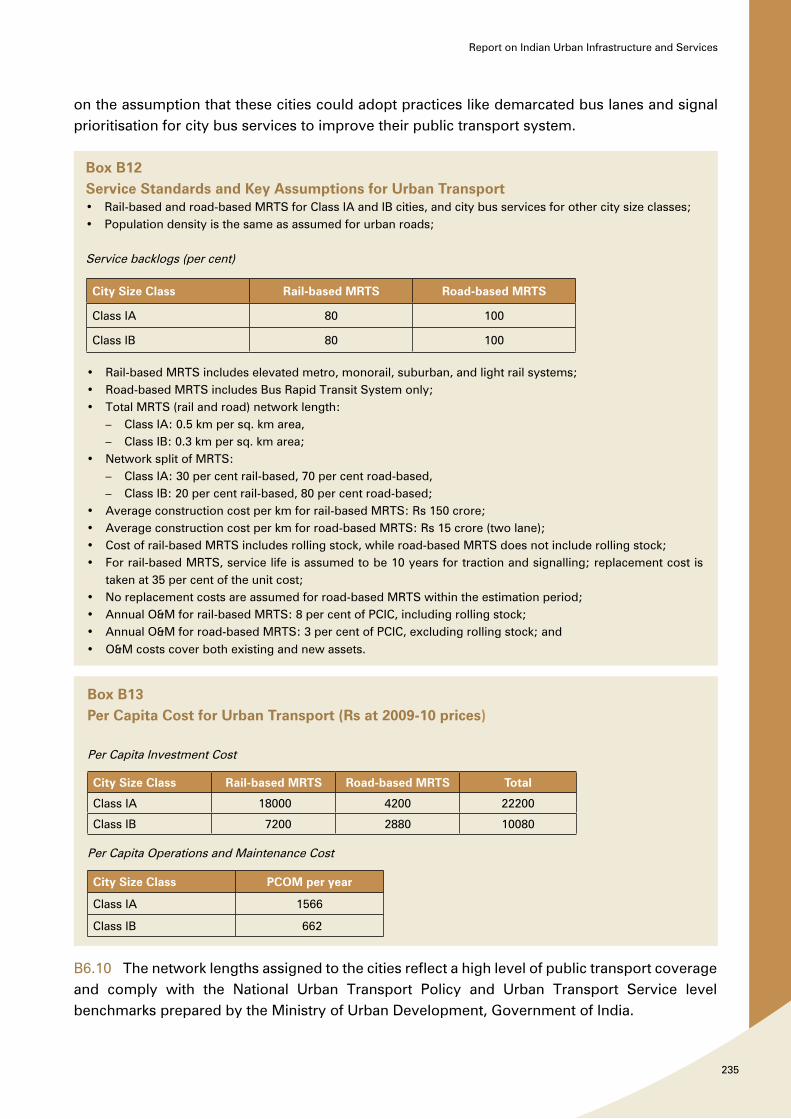
235
Report on Indian Urban Infrastructure and Services
Box B12 Service Standards and Key Assumptions for Urban Transport
Rail-based and road-based MRTS for Class IA and IB cities, and city bus services for other city size classes;• Population density is the same as assumed for urban roads;•
Service backlogs (per cent)
City Size Class Rail-based MRTS Road-based MRTS
Class IA 80 100
Class IB 80 100
Rail-based MRTS includes elevated metro, monorail, suburban, and light rail systems;• Road-based MRTS includes Bus Rapid Transit System only;• Total MRTS (rail and road) network length:•
Class IA: 0.5 km per sq. km area, –Class IB: 0.3 km per sq. km area; –
Network split of MRTS:• Class IA: 30 per cent rail-based, 70 per cent road-based, –Class IB: 20 per cent rail-based, 80 per cent road-based; –
Average construction cost per km for rail-based MRTS: Rs 150 crore;• Average construction cost per km for road-based MRTS: Rs 15 crore (two lane);• Cost of rail-based MRTS includes rolling stock, while road-based MRTS does not include rolling stock;• For rail-based MRTS, service life is assumed to be 10 years for traction and signalling; replacement cost is • taken at 35 per cent of the unit cost;No replacement costs are assumed for road-based MRTS within the estimation period;• Annual O&M for rail-based MRTS: 8 per cent of PCIC, including rolling stock;• Annual O&M for road-based MRTS: 3 per cent of PCIC, excluding rolling stock; and• O&M costs cover both existing and new assets.•
Box B13 Per Capita Cost for Urban Transport (Rs at 2009-10 prices)
Per Capita Investment Cost
City Size Class Rail-based MRTS Road-based MRTS Total
Class IA 18000 4200 22200
Class IB 7200 2880 10080
City Size Class PCOM per year
Class IA 1566
Class IB 662
Per Capita Operations and Maintenance Cost
B6.10 The network lengths assigned to the cities reflect a high level of public transport coverage and comply with the National Urban Transport Policy and Urban Transport Service level benchmarks prepared by the Ministry of Urban Development, Government of India.
on the assumption that these cities could adopt practices like demarcated bus lanes and signal prioritisation for city bus services to improve their public transport system.
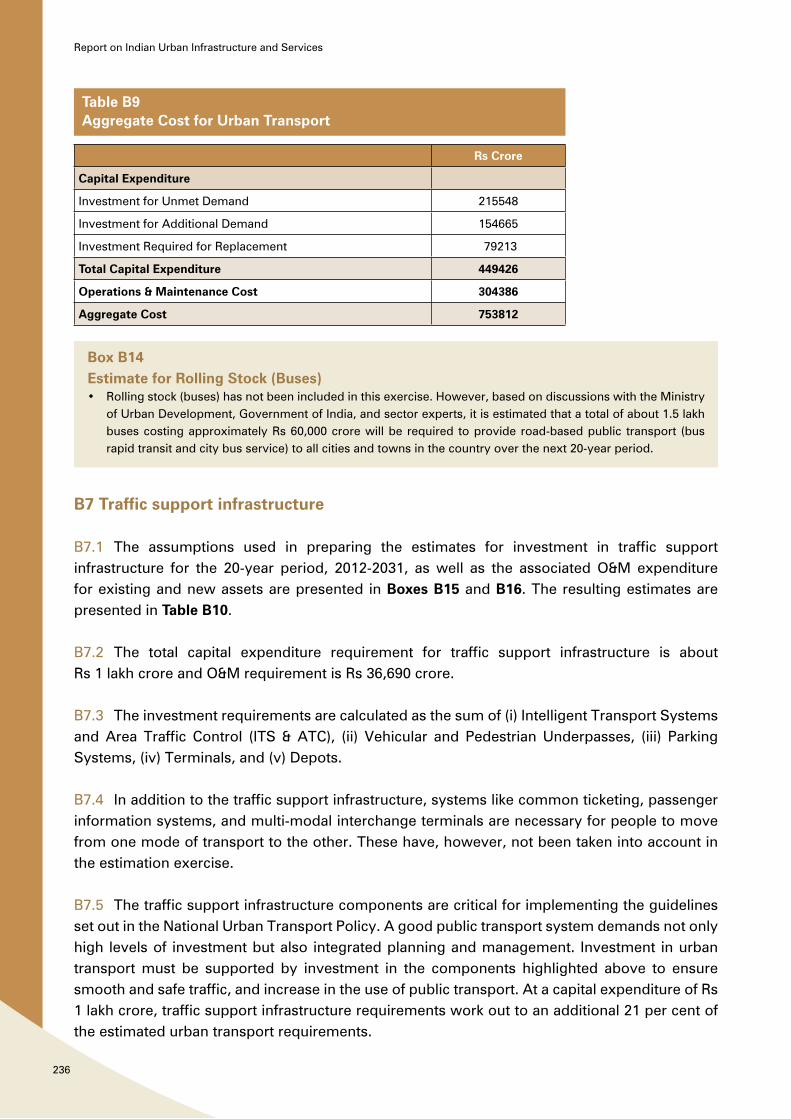
Report on Indian Urban Infrastructure and Services
236
Table B9 Aggregate Cost for Urban Transport
Rs Crore
Capital Expenditure
Investment for Unmet Demand 215548
Investment for Additional Demand 154665
Investment Required for Replacement 79213
Total Capital Expenditure 449426
Operations & Maintenance Cost 304386
Aggregate Cost 753812
Box B14 Estimate for Rolling Stock (Buses)
Rolling stock (buses) has not been included in this exercise. However, based on discussions with the Ministry • of Urban Development, Government of India, and sector experts, it is estimated that a total of about 1.5 lakh buses costing approximately Rs 60,000 crore will be required to provide road-based public transport (bus rapid transit and city bus service) to all cities and towns in the country over the next 20-year period.
B7 Traffic support infrastructure
B7.1 The assumptions used in preparing the estimates for investment in traffic support infrastructure for the 20-year period, 2012-2031, as well as the associated O&M expenditure for existing and new assets are presented in Boxes B15 and B16. The resulting estimates are presented in Table B10.
B7.2 The total capital expenditure requirement for traffic support infrastructure is about Rs 1 lakh crore and O&M requirement is Rs 36,690 crore.
B7.3 The investment requirements are calculated as the sum of (i) Intelligent Transport Systems and Area Traffic Control (ITS & ATC), (ii) Vehicular and Pedestrian Underpasses, (iii) Parking Systems, (iv) Terminals, and (v) Depots.
B7.4 In addition to the traffic support infrastructure, systems like common ticketing, passenger information systems, and multi-modal interchange terminals are necessary for people to move from one mode of transport to the other. These have, however, not been taken into account in the estimation exercise.
B7.5 The traffic support infrastructure components are critical for implementing the guidelines set out in the National Urban Transport Policy. A good public transport system demands not only high levels of investment but also integrated planning and management. Investment in urban transport must be supported by investment in the components highlighted above to ensure smooth and safe traffic, and increase in the use of public transport. At a capital expenditure of Rs 1 lakh crore, traffic support infrastructure requirements work out to an additional 21 per cent of the estimated urban transport requirements.
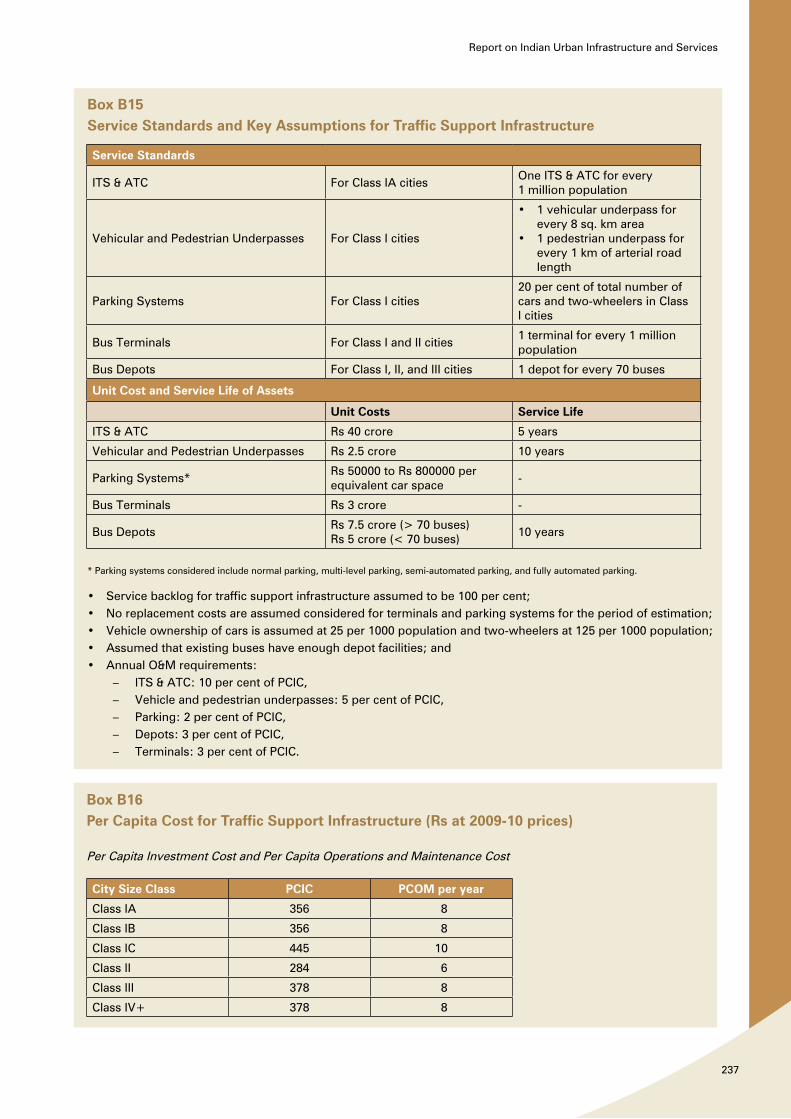
237
Report on Indian Urban Infrastructure and Services
Service Standards
ITS & ATC For Class IA cities One ITS & ATC for every 1 million population
Vehicular and Pedestrian Underpasses For Class I cities
• 1 vehicular underpass for every 8 sq. km area
• 1 pedestrian underpass for every 1 km of arterial road length
Parking Systems For Class I cities20 per cent of total number of cars and two-wheelers in Class I cities
Bus Terminals For Class I and II cities 1 terminal for every 1 million population
Bus Depots For Class I, II, and III cities 1 depot for every 70 buses
Unit Cost and Service Life of Assets
Unit Costs Service Life
ITS & ATC Rs 40 crore 5 years
Vehicular and Pedestrian Underpasses Rs 2.5 crore 10 years
Parking Systems* Rs 50000 to Rs 800000 per equivalent car space -
Bus Terminals Rs 3 crore -
Bus Depots Rs 7.5 crore (> 70 buses) Rs 5 crore (< 70 buses) 10 years
* Parking systems considered include normal parking, multi-level parking, semi-automated parking, and fully automated parking.
Box B15 Service Standards and Key Assumptions for Traffic Support Infrastructure
Service backlog for traffic support infrastructure assumed to be 100 per cent;• No replacement costs are assumed considered for terminals and parking systems for the period of estimation;• Vehicle ownership of cars is assumed at 25 per 1000 population and two-wheelers at 125 per 1000 population;• Assumed that existing buses have enough depot facilities; and• Annual O&M requirements:• – ITS & ATC: 10 per cent of PCIC, – Vehicle and pedestrian underpasses: 5 per cent of PCIC, – Parking: 2 per cent of PCIC, – Depots: 3 per cent of PCIC, – Terminals: 3 per cent of PCIC.
Box B16 Per Capita Cost for Traffic Support Infrastructure (Rs at 2009-10 prices)
Per Capita Investment Cost and Per Capita Operations and Maintenance Cost
City Size Class PCIC PCOM per year
Class IA 356 8
Class IB 356 8
Class IC 445 10
Class II 284 6
Class III 378 8
Class IV+ 378 8
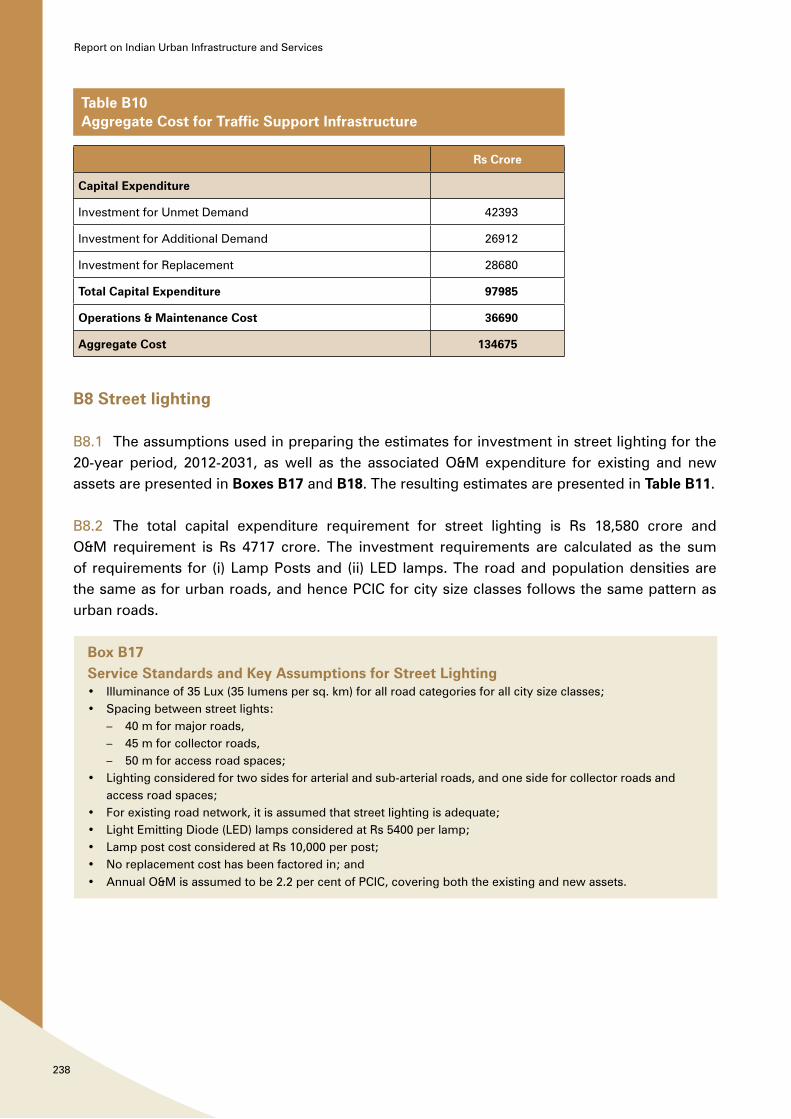
Report on Indian Urban Infrastructure and Services
238
Table B10 Aggregate Cost for Traffic Support Infrastructure
Rs Crore
Capital Expenditure
Investment for Unmet Demand 42393
Investment for Additional Demand 26912
Investment for Replacement 28680
Total Capital Expenditure 97985
Operations & Maintenance Cost 36690
Aggregate Cost 134675
B8 Street lighting
B8.1 The assumptions used in preparing the estimates for investment in street lighting for the 20-year period, 2012-2031, as well as the associated O&M expenditure for existing and new assets are presented in Boxes B17 and B18. The resulting estimates are presented in Table B11.
B8.2 The total capital expenditure requirement for street lighting is Rs 18,580 crore and O&M requirement is Rs 4717 crore. The investment requirements are calculated as the sum of requirements for (i) Lamp Posts and (ii) LED lamps. The road and population densities are the same as for urban roads, and hence PCIC for city size classes follows the same pattern as urban roads.
Box B17 Service Standards and Key Assumptions for Street Lighting
Illuminance of 35 Lux (35 lumens per sq. km) for all road categories for all city size classes; • Spacing between street lights:•
40 m for major roads, –45 m for collector roads, –50 m for access road spaces; –
Lighting considered for two sides for arterial and sub-arterial roads, and one side for collector roads and • access road spaces;For existing road network, it is assumed that street lighting is adequate;• Light Emitting Diode (LED) lamps considered at Rs 5400 per lamp;• Lamp post cost considered at Rs 10,000 per post;• No replacement cost has been factored in; and• Annual O&M is assumed to be 2.2 per cent of PCIC, covering both the existing and new assets.•
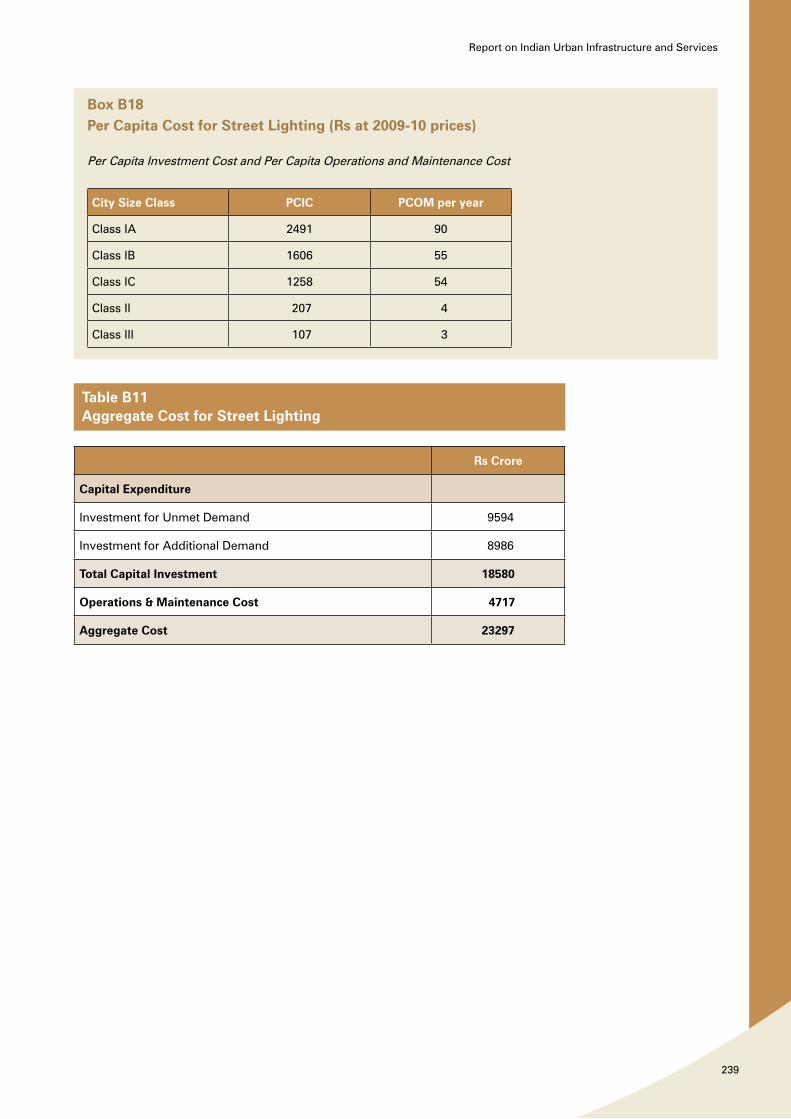
239
Report on Indian Urban Infrastructure and Services
City Size Class PCIC PCOM per year
Class IA 2491 90
Class IB 1606 55
Class IC 1258 54
Class II 207 4
Class III 107 3
Box B18Per Capita Cost for Street Lighting (Rs at 2009-10 prices)
Per Capita Investment Cost and Per Capita Operations and Maintenance Cost
Table B11 Aggregate Cost for Street Lighting
Rs Crore
Capital Expenditure
Investment for Unmet Demand 9594
Investment for Additional Demand 8986
Total Capital Investment 18580
Operations & Maintenance Cost 4717
Aggregate Cost 23297


Annexure ITerms of Reference

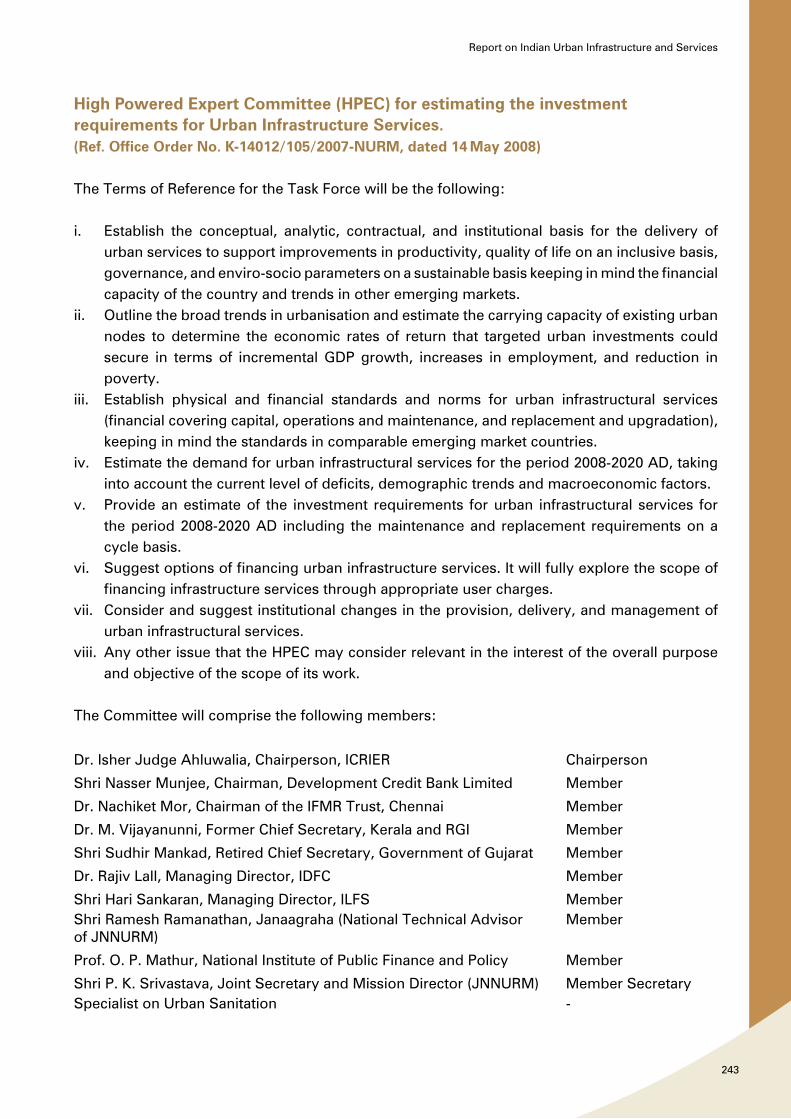
243
Report on Indian Urban Infrastructure and Services
High Powered Expert Committee (HPEC) for estimating the investment requirements for Urban Infrastructure Services.(Ref. Office Order No. K-14012/105/2007-NURM, dated 14 May 2008)
The Terms of Reference for the Task Force will be the following:
Establish the conceptual, analytic, contractual, and institutional basis for the delivery of i. urban services to support improvements in productivity, quality of life on an inclusive basis, governance, and enviro-socio parameters on a sustainable basis keeping in mind the financial capacity of the country and trends in other emerging markets.Outline the broad trends in urbanisation and estimate the carrying capacity of existing urban ii. nodes to determine the economic rates of return that targeted urban investments could secure in terms of incremental GDP growth, increases in employment, and reduction in poverty.Establish physical and financial standards and norms for urban infrastructural services iii. (financial covering capital, operations and maintenance, and replacement and upgradation), keeping in mind the standards in comparable emerging market countries.Estimate the demand for urban infrastructural services for the period 2008-2020 AD, taking iv. into account the current level of deficits, demographic trends and macroeconomic factors.Provide an estimate of the investment requirements for urban infrastructural services for v. the period 2008-2020 AD including the maintenance and replacement requirements on a cycle basis.Suggest options of financing urban infrastructure services. It will fully explore the scope of vi. financing infrastructure services through appropriate user charges.Consider and suggest institutional changes in the provision, delivery, and management of vii. urban infrastructural services.Any other issue that the HPEC may consider relevant in the interest of the overall purpose viii. and objective of the scope of its work.
The Committee will comprise the following members:
Dr. Isher Judge Ahluwalia, Chairperson, ICRIER ChairpersonShri Nasser Munjee, Chairman, Development Credit Bank Limited MemberDr. Nachiket Mor, Chairman of the IFMR Trust, Chennai MemberDr. M. Vijayanunni, Former Chief Secretary, Kerala and RGI MemberShri Sudhir Mankad, Retired Chief Secretary, Government of Gujarat MemberDr. Rajiv Lall, Managing Director, IDFC MemberShri Hari Sankaran, Managing Director, ILFS MemberShri Ramesh Ramanathan, Janaagraha (National Technical Advisor Member of JNNURM) Prof. O. P. Mathur, National Institute of Public Finance and Policy MemberShri P. K. Srivastava, Joint Secretary and Mission Director (JNNURM) Member SecretarySpecialist on Urban Sanitation -


Annexure IIMeetings andConsultations

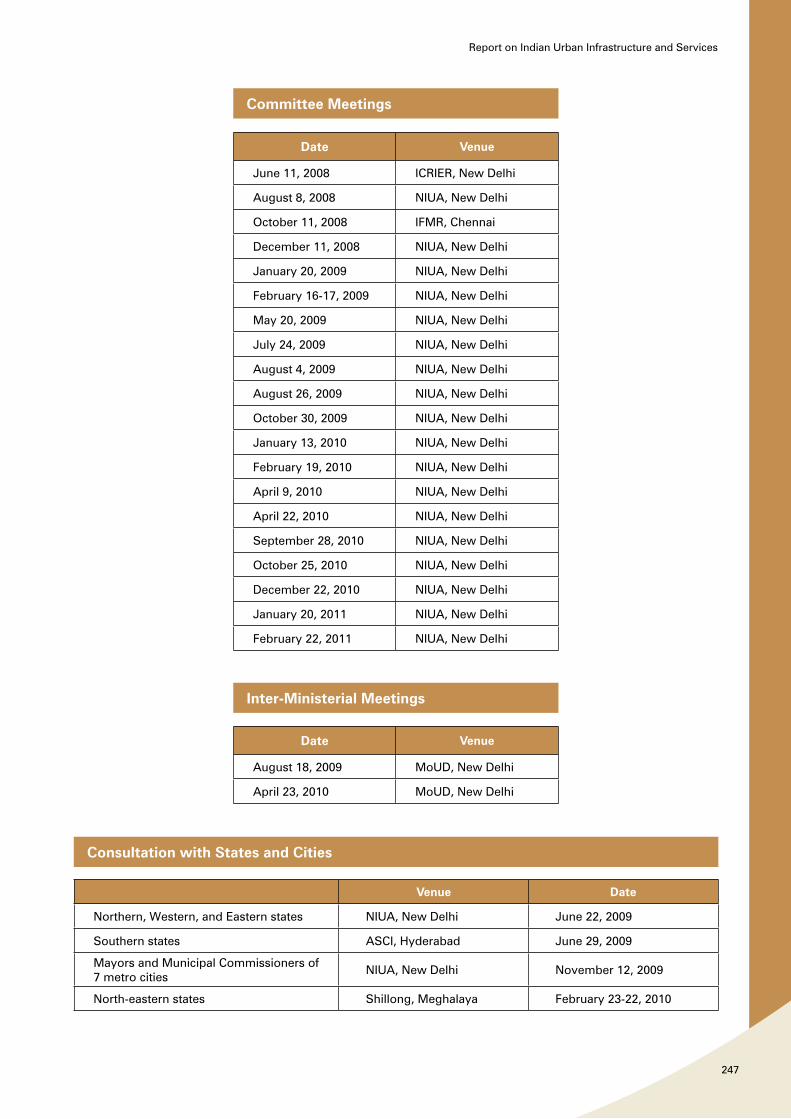
247
Report on Indian Urban Infrastructure and Services
Committee Meetings
Date Venue
June 11, 2008 ICRIER, New Delhi
August 8, 2008 NIUA, New Delhi
October 11, 2008 IFMR, Chennai
December 11, 2008 NIUA, New Delhi
January 20, 2009 NIUA, New Delhi
February 16-17, 2009 NIUA, New Delhi
May 20, 2009 NIUA, New Delhi
July 24, 2009 NIUA, New Delhi
August 4, 2009 NIUA, New Delhi
August 26, 2009 NIUA, New Delhi
October 30, 2009 NIUA, New Delhi
January 13, 2010 NIUA, New Delhi
February 19, 2010 NIUA, New Delhi
April 9, 2010 NIUA, New Delhi
April 22, 2010 NIUA, New Delhi
September 28, 2010 NIUA, New Delhi
October 25, 2010 NIUA, New Delhi
December 22, 2010 NIUA, New Delhi
January 20, 2011 NIUA, New Delhi
February 22, 2011 NIUA, New Delhi
Inter-Ministerial Meetings
Date Venue
August 18, 2009 MoUD, New Delhi
April 23, 2010 MoUD, New Delhi
Consultation with States and Cities
Venue Date
Northern, Western, and Eastern states NIUA, New Delhi June 22, 2009
Southern states ASCI, Hyderabad June 29, 2009
Mayors and Municipal Commissioners of 7 metro cities NIUA, New Delhi November 12, 2009
North-eastern states Shillong, Meghalaya February 23-22, 2010
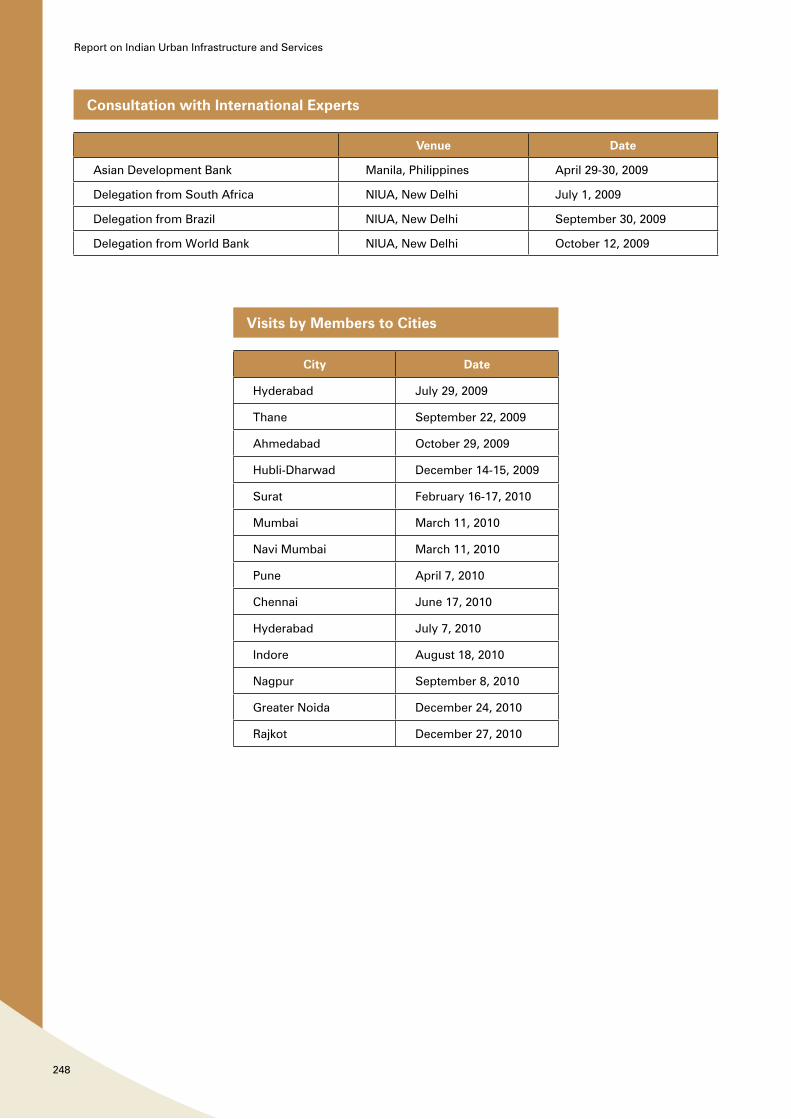
Report on Indian Urban Infrastructure and Services
248
Consultation with International Experts
Venue Date
Asian Development Bank Manila, Philippines April 29-30, 2009
Delegation from South Africa NIUA, New Delhi July 1, 2009
Delegation from Brazil NIUA, New Delhi September 30, 2009
Delegation from World Bank NIUA, New Delhi October 12, 2009
Visits by Members to Cities
City Date
Hyderabad July 29, 2009
Thane September 22, 2009
Ahmedabad October 29, 2009
Hubli-Dharwad December 14-15, 2009
Surat February 16-17, 2010
Mumbai March 11, 2010
Navi Mumbai March 11, 2010
Pune April 7, 2010
Chennai June 17, 2010
Hyderabad July 7, 2010
Indore August 18, 2010
Nagpur September 8, 2010
Greater Noida December 24, 2010
Rajkot December 27, 2010


:: Water Supply
:: Sewerage
:: Solid Waste Management
:: Storm Water Drains
:: Urban Roads
:: Urban Transport
:: Street Lighting
:: Traffic Support Infrastructure
Report on IndianUrban Infrastructure
and Services


