Trends inWhile Aniludesloward NegrOeS
LIB R AR Y ENTERNlON RESEARCH C
NATIONAL - . 0\.niver&itv of
ChlC2g
F\LE copy
Report No. 119
Mildred A. SChwartz
NATIONAL OPINION RESEARCH CENTER. THE UNIVERSITY OF CHICAGO
The research reported hereinwas supported by National Science Foundation
Grant GS 498 to the National Opinion Research Center
Copyright 1967 by the National Opinion Research CenterLibrary of Congress Catalog Card Number 67-17809
All rights reserved. Published by theNational Opinion Research Center, The University of Chicago
Designed by Bonnie McKeonCover photo by John C. Goodwin
Printed in the United States of America
ACKNOWLEDGMNTS
Data for this report were provided by the Roper
Center for Public Opinion Research at Williamstown,
Massachusetts , and the National Opinion Research CenterChicago. I wish to thank Dr. Philip Hastings at the
former organization and Patrick Bova at the latter for
directing me to sources and quickly providing me with
materials. Computer programing was done by Robert Cody,
and general research assistance was provided by Lawrence
Lesoff. Mr. Lesoff I s work was especially appreciated in
making up all of the tables. I wish to thank Bonnie
McKeon for editing the manuscript , and Nella Siefert and
Toshi Takahashi for its preparation.
I am indebted to several of my former colleagues
for many helpful suggestions. These include Peter
Rossi , Paul Sheatsley, Seymour Sudman , Robert W. Hodge
Joe L. Spaeth , and Norman Bradburn. Doctors Sudman and
Spaeth were particularly generous with assistance and
suggestions regarding the presentation of data.
iii

TABLE OF CONTENTS
ACKNOWLEDGMNTS
LIST OF TABLES.
LIST OF CHARTS.
Chapter
APPENDIX
. . . . . . . . . . . . . . .. . . . .. . . . . . . . . . . . .. . . . . . . . . . . . . . . . . . . . . . .
TRENDS IN WHITE ATTITUDES TOWARD NEGROES.
. . . . . . . . . . .
IntroductionSelection of IssuesPresentation of DataThe Salience of CivilAn Overview of Trends
Rights Issues
II. ATTITUDES TOWARD THE EDUCATION OF NEGROES
. . . . . . . . . . .
Negro IntelligenceThe Desirability of Integrated EducationWith All Deliberate SpeedThe Supreme Court and the Impact of EventsWould You Want Your Own ChildrenSumary
III. HOUSING OPPORTUNITIES
. . . . . . . . . . . . . . . . . . . . .
Recognition of NeedAcceptability of Negro NeighborsResponses to Negro NeighborsSumary
IV. VIEWS OF DISCRIMINATION IN OTHER AREAS
. . . . . . . . . . . . .
Job OpportunitiesPublic TransportationOther Public ServicesSumary
AN EVALUATION OF THE CIVIL RIGHTS MOVEMENT AND PROSPECTS FORTHE FUTURE ......
.............. ...
The Civil Rights MovementFuture ProspectsSumary
VI. THE CONTINUITY OF SOCIAL CLEAVAGES IN ATTITUDES TOWARD NEGROES.
The Present SituationThe Cumulative Nature ofThe Effects of EducationLimits on Change
Change
. . . . . . . . . . . . . . . . . . . . . . . . . . .
Page
iiivii
113
131

LIST OF TABLES
Table
1.1
1.2Negroes 1 Evaluation of Rights Most Important To Be Worked for Now
Negroes I Evaluation of Rights Wanted by Almost All Negroes.
Negro and White Children Should Go To the Same Schools
Per Cent in Favor of Imediate School Integration
. . . . .
Attitudes toward the Speed of Integration, by Region and Education1956-1958
. . . . . . . . .
11.111.211.3
11.4 Attitudes toward Issues of School Integration, by Region and Edu-cation
...........................
II. Differences between Per Cents Favoring Eventual Integration andApproving of Supreme court Decision
. . . . . . . . . .
A Chronology of Civil Rights Events and Trends in Per Cent Approvingof Supreme Court Decision on School Desegregation.
. . . . . .
II.
11. 7 White Parents with No Objection to Their Own Children AttendingSchool with Negro Children , Depending on the Number of Negroesin the School
. . . . . . . . . . .
Opinions of Whether Anything Should Be Done To Improve NegroHousing
. . . . . . . . . . . . . . . . . . . . . . . .
Opinions of Whether Whites Have a Right To Keep Negroes Out ofTheir Neighborhood. . .
. . . . . . . . . . . . .
III.
III.
III. 3 Have You Yourself Ever Had a Negro Family Living on the Same BlockAs You?
. . . . . . . . . . . . . . . . .
?er Cent Who Think Negroes Do Not Have Same Opportunities As WhitePeople. . . .
. . . . . . . . . . . . . . . . . . . . . .
IV.
Per Cent Agreeing That Negroes Should Have Right to IntegratedPublic Services , 1944-1965, by Education and Region
. . . . . .
Per Cent Who Would Eat in Restaurant Serving Both Negro and WhitePeople. .
. . . . . . . . . . . . . . . . . . . .
IV. 4 Per Cent Who Would Have No Objection to Family Member BringingNegro Home to Dinner.
. . . . . . . . . . . . . . . . . . . . .
IV.
IV.
l Per Cent of White Respondents Very Interested in the Question ofNegro-White Relations
. . . . . . . . . . . . . . . . . . . . .
Changes in Attitudes toward Racial Integration in Recent Years. .Goals of the Negro Civil Rights Movement. . .
. . . . . . . . . .
Opinions of How Much Negro Rights Groups Are Asking For
. . . . .
5 Feelings about Rights Movement in Different Types of Comunities.6 Persons or Groups behind Recent Negro Civil Rights Actions.
7 Opinions of Eight Kational Organizations.
. . . . .
Sympathy with Actions of Negro Civil Rights Movement
9 Do . Demonstrations Help or Hurt Negroes ' Cause? . .
. . . . . . . .
vii
Page
Table
V1.l
V1.2
viii
LIST OF TABLES--Continued
Per Cent Disapproving of Recent Civil Rights Activities inDifferent Types of Communities. . .
. . . . . . . . . .
Per Cent Who Feel Administration Is Pushing Integration Too Fast.
Expectations of Race Riots in Sumer of 1965 . .
Expectations of Racial Trouble in Own Community
. . . . . . . .
Assessment of Negro-White Relations as Continuing Problem for theUnited States
. . .
. . . 0 0 0 . . . .
. . .
. . . . 0
. . . .
Per Cent Southerners Believing That Integration in SchoolsRestaurants, and Public Accommodations Will Eventually Come tothe South
. .
. . . 0 . . .
. . . . .
. . . 0 . 0 . . . . .
. .
Approximate Year in Whch 90 Per Cent of the White Population CanBe Expected To Hold Opinions Favorable to Negroes and NegroRights. . .
. . . . . . . . . . . . . . . . . . . . .
0 . . . .School Attainment of the White Population, Twenty-Five Years of
Age and Older , for the United States and Regions, 1950- 1960
Appendix Tables
Per Cent Thinking Negroes Are as Intelligent as Whites. 0 . . 0 .Per Cent Thinking White and Negro Students Should Go to the Same
Schools
. . . . . . . . .
. 0 . . 0
. . . . . . . . .
Per Cent Approving of the Supreme Court Ruling That RacialSegregation in the Public Schools Is Illegal. 0 . . 0
. .
Per Cent Not Objecting To Sending Their Children to a SchoolWhere the Majority of Students Are Negro 0 . . . . . . 132
Per Cent Saying It Would Make No Difference if a Negro with theSame Education and Income Moved into Their Block
Per Cent Who Would Not Move if Colored People Came To LiveNext Door . . 0 .
. . . . . . . .
. 0 . 0
. .
Per Cent Who Would Not Move if Colored People Came To Live inin Great Numbers in Their Neighborhood 0 . . . . .
. .
. . 0
. .
Per Cent Thinking Negroes Should Have as Good a Chance as WhitesTo Get. Any Kind of Job. . . 0 . . . . .
. . . . . . . .
Per Cent Feeling There Should Not Be Separate Sections for Negroesin Street Cars and Buses.
. . . . . . . . . . . . . . . . . . .
Per Cent Expecting the Day When Negroes and Whites in the SouthWill Be Sharing the Same Public Accomodations. . .
. . . . . .
Page
100
102
104
105
105
109
117
125
131
131
132
132
133
133
133
134
134
Chart
III. 1
III. 2
III. 3
III.
II1. 5
III.
LIST OF CHARTS
11.1 Least Squares Linear Trend Line in Per Cent Believing Negroes AreAs Intelligent As Whites , 1942-1963
. . . . . . . . . . . . . . .
Least Squares Linear Trend Lines in Per Cent Believing Negroes AreAs Intelligent As Whites, 1944-1963
. . . . . . . . . . . . . . .
II.
11.3 Least Squares Linear Trend Line in Per Cent Agreeing Negroes ShouldGo to the Same Schools As Whites , 1942-1965
. . . .
Least Squares Linear Trend Lines in Per Cent Agreeing Negroes ShouldGo to the Same Schools As Whites, 1956-1965
. . . . . . . . . . .
11.4
11. 5 Least Squares Linear Trend Line in Per Cent Approving of SupremeCourt Decision on School Desegregation , 1954-1961
. . . . . . .
Per Cent Approving of Supreme Court Decision Ruling School Segre-gation Illegal
. . . . . . . . . . . . . . . . . . . . . . . . .
II.
II. 7 Least Squares Trend Line in Per Cent with No Objection to SendingOwn Children to a School with a Majority of Negroes , 1954-1963
Least Squares Trend Lines in Per Cent with No Objection to SendingOwn Children to a School with a Majority of Negroes , 1954-1963
II.
Least Squares Trend Line in Per Cent Who Would Not Mind if Negrowith Same Income and Education Moved on Same Block, 1942-1965
. .
Least Squares Trend Lines in Per Cent Who Would Not Mind if Negrowith Same Education and Income Moved on Same Block , 1956-1965
. .
Least Squares Linear Trend Line in Per Cent Saying They Would NotMove if Colored People Moved Next Door , 1958-1965
. . . . . . . .
Per Cent Saying They Would Not Move if Colored People Came To LiveNext Door, 1958-1963
. . . . . . . . . . . . . . . . . . .
Least Squares Linear Trend Line in Per Cent Saying They Would NotMove if Colored People Came To Live in Great Numbers in Neighbor-hood, 1958-1965
. . . . . . . . . . . . . . . . .
IV.
Per Cent Saying They Would Not Move if Colored People Came To Livein Great Numbers in Neighborhood, 1958-1963
. . . . . . . . . . .
Least Squares Trend Line in Per Cent Saying That Negroes Should HaveAs Good a Chance as White People To Get Any Kind of Job , 1944-1963
Least Squares Trend Lines in Per Cent Sayin That Negroes Should HaveAs Good a Chance as White People To Get Any Kind of Job , 1944-1963
Least Squares Linear Trend Line in Per Cent Saying There Should NotBe Separate Sections for Negroes in Street Cars and Buses,1942-1963 . .
. . . . . . . . . . . . . . . . . . . . . . . . . .
IV.
IV.
IV. Least Squares Linear Trend Lines in Per Cent Saying There Should NotBe Separate Sections for Negroes in Street Cars and Buses1956-1963 . .
. . . . . . . . . . . . . . . . '. . . . . . . . . .
Least Squares Linear Trend Line in Per Cent Feeling That the Situ-ation in the South between the Races Wilt Get Better in ComingYear, 1957-1964 .
. . . . . . . . . . . . . . . . . . . . . . . .
Page
107

Chart
Least Squares Linear Trend Line in Per Cent Expecting That Day WillCome in the South When Whites and Negroes Will Be , . . Sharingthe Same Public Accommodations , 1957-1963
. . . . . . . . . . . .
Per Cent Who Feel That Day Will Come in the South When Whites andNegroes Will Be . . '. Sharing the Same Public Accomodations,1955-1963
LIST OF CHARTS--Continued
. . . . . . . . . . . . . . . . . . . . . . . . . . .
Page
108
110

CHAPTER I
TREDS IN WHITE ATTITUDES TOWARD NEGROES
Introduction
The past twenty years have witnessed great changes in the extension and
guarantee of rights and opportunities to Negro Americans, While much remains to
be done to ensure that Negroes obtain both equal rights and the opportunities forenjoying them, there is little question that progress has been made since World
War II. Especially noteworthy is the recent responsiveness of governmental agen-
cies to removing barriers to full civic participation.
What has been the public reaction to the changes that have occurred dur-
ing this time? While we begin with no assumptions about the relation between
public opinion and public policy, we do feel that a review of public attitudes
over time will give a better understanding of the context in which major "Social
changes have occurred, both by revealing sources of support for and opposition
to these changes and by suggesting the possible limits of further change.
The primary concern of this report is , then, to describe the climate of
opinion in which social changes with regard to Negro rights have taken place.
Along with this , the differential impact of specific civil rights issues and the
differential response of various population groups will be traced.
Selection of Issues
Data for this report come from surveys conducted between 1942 and 1965,
with some reference to earlier material. The main part of the analysis is based
on ten surveys conducted by the National Opinion Research Center and supplement-
ed by one Roper and five Gallup surveys. Data used to fill in trends and to ex-
trapolate trend data were obtained from some ten additional surveys conducted by
the same organizations. In those cases where direct use of the surveys was made
data were supplied by the Roper Center for Public Opinion Research or by NORC.
Reports on supplementary questions came mainly from Gallup releases, especially
those compiled in the Spring, 1962 , issue of the Public Opinion Quarterly
Since the main concern was with tracing changes in opinions , we looked
for questions which had been repeated in different surveys over a period of time.
For a recent review of the legalsee Vern Countryman (Ed.
),
DiscriminationChicago Press, 1966),
means for overcoming discriminationand the Law (Chicago: University of
-1-
-2-
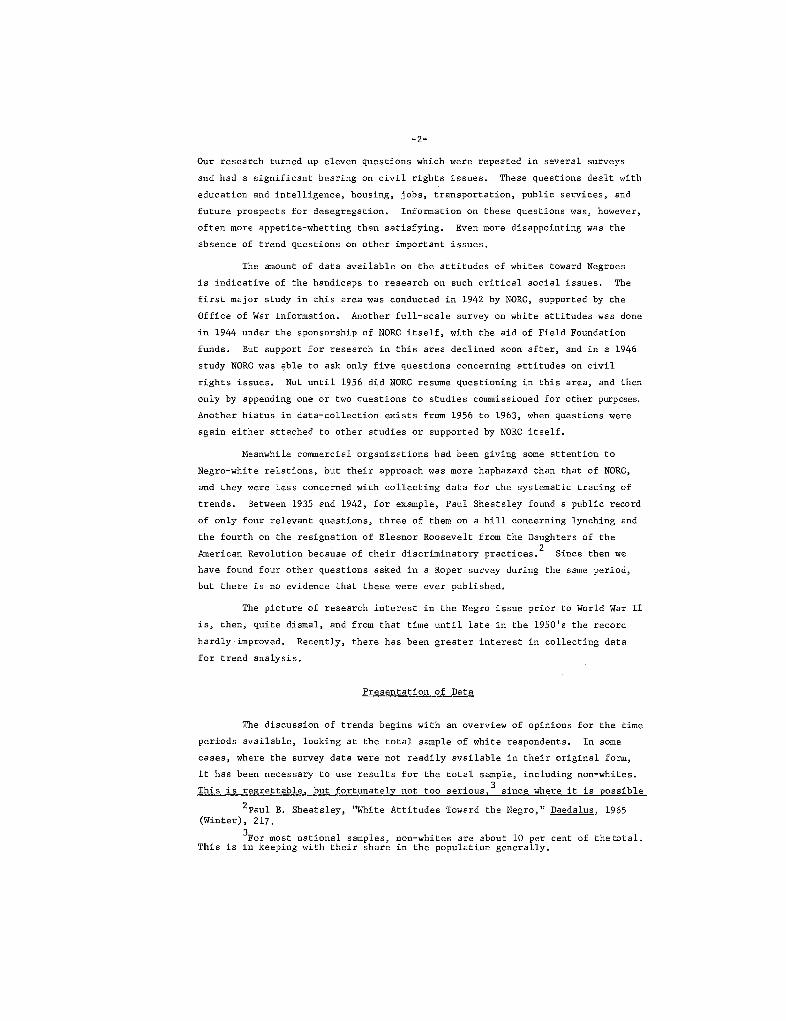
Our research turned up eleven questions which were repeated in several surveys
and had a significant bearing on civil rights issues, These questions dealt with
education and intelligence , housing, jobs, transportation , public services, and
future prospects for desegregation. Information on these questions was , however
often more appetite-whetting than satisfying. Even more disappointing was the
absence of trend questions on other important issues,
The amount of data available on the attitudes of whites toward Negroes
is indicative of the handicaps to research on such critical social issues, The
first major study in this area was conducted in 1942 by NORC , supported by the
Office of War Information. Another full- scale survey on white attitudes was done
in 1944 under the sponsorship of NORC itself , with the aid of Field Foundation
funds. But support for research in this area declined soon after, and in a 1946
study NORC was able to ask only five questions concerning attitudes on civil
rights issues. Not until 1956 did NORC resume questioning in this area , and then
only by appending one or two questions to studies commissioned for other purposes,
Another hiatus in data- collection exists from 1956 to 1963, when questions were
again either attached to other studies or supported by NORC itself.
Meanwhile commercial organizations had been giving some attention to
Negro-white relations , but their approach was more haphazard than that of NORCand they were less concerned with collecting data for the systematic tracing of
trends, Between 1935 and 1942 , for example , Paul Sheatsley found a public record
of only four relevant questipns , three of them on a bill concerning lynching and
the fourth on the resignation of Eleanor Roosevelt from the Daughters of the
American Revolution because of their discriminatory practices, Since then we
have found four other questions asked in a Roper survey during the same period
but there is no evidence that these were ever published,
The picture of research interest in the Negro issue prior to World War II
then, quite dismal , and from that time until late in the 1950' s the record
hardly.improved. Recently, there has been greater interest in collecting data
for trend analysis,
Presentation of Data
The discussion of trends begins with an overview of opinions for the time
periods available , looking at the total sample of white respondents. In some
cases , where the survey data were not readily available in their original formit has been necessary to use results for the total sample , including non-whites.This is regrettable, but fortunately not too serious,
3 since where it is possible
paul B. Sheatsley, "White(Winter), 217,
For most national samplesThis is in keeping with their share
Attitudes Toward the Negro Daedalus , 1965
non-whites are about 10 per cent of the total.in the population generally.

-3-
to compare the total sample with the white sample, differences in the distribu-
tion of opinions do not vary more than two percentage points.
In an analysis of this sort , where a number of different surveys are used
for comparative purposes , it is important to make an early decision on the choice
of variables for critical attention, if only to prevent inundation by the data.
Using data collected at different times , by different organizations, and under
differing conditions , normal sampling variability has been compounded to an un-
known extent. This argues that the analysis should be kept on a fairly simple
basis. With such crude data , it hardly seems advisable , for example, to try to
deal with a large number of variables simultaneously, In order to make best use
of the different survey questions , it is preferable to select a number of dis-
tinctive variables which allow for the emergence of gross differences of opinion.
Using this as a criterion of selection , supplemented by a review of pub-
lished and unpublished material on white attitudes toward Negroes, and especially
by the advice of Paul Sheatsley, we decided to examine opinion trends in relation
to two population characteristics-- region of residence and level of education.
In order to permit comparisons across surveys , regional and educational
distinctions have been treated quite crudely. This is especially the case with
region. Respondents are divided into only two categories--those who live in
the South , and all others , who for the sake of convenience are termed northerners,
Southern residents are those living in anyone of sixteen states designated bythe census as South Atlantic , West South Central , and East South Central, and
including the District of Columbia. Variations among these states and the Dis-
trict of Columbia in the treatment of Negroes are considerable. The remainder
of the continental United States , classified as northern, is also highly vari-
able, Despite these internal differences , however, we find that the North-South
distinction is a meaningful one, accounting for most differences in opinions.
Educational backgrounds are diyided into three categories, The lowest
level includes no schooling to the completion of grade school. The second levelcomprises a high school education, covering nine to twelve years of schooling.
The college category includes thirteen or more years of schooling. Although it
is not as significant differentia as is region of residence , educational level
also serves to account for differences in white viewpoints about Negroes,
Responses that indicate trends are presented both in tables and in graphs
as least squares regression lines, regressing on time the per cent favorable to
Negro aspirations on each issue, This was done for the total sample for eleven
questions and for regional and educational subgroups for six questions.
These states are: Alabama , Arkansas , Delaware , Florida , GeorgiaKentucky, Louisiana , Maryland, Mississippi , North Carolina , Oklahoma , SouthCarolina , Tennessee , Texas , Virginia , West Virginia,

-4-
There are several advantages to a regression approach. It is a highly
efficient means for presenting data on several points in time and, wherever
available, for several population groups in the space of one chart. In addition,
it enables us to iron out minor fluctuations in the trend line. For example
when the per cent favorable to Negroes rises , declines , and then rises again
and continues to do so , it might appear that the decline has some critical re-
lation to current events. But the imprecise nature of the data indicates that
the overall trend is more reliable than moderate yariations away from it , es-
pecially if the decline is relatively minor, and the direction of the trend is
to increasing favorabi lity. In the case of our own data , there are almost no
significant departures from linearity, although this is partly the result of
having a small number of measures for each question. Finally, and most impor-
tant , the slope of the lines gives a very dramatic picture of the course of opin-
ion change and of the sharp contrasts between educational levels in the North
and the South.
The presentation of the assembled questions proceeds topically. Thus
Chapter II deals with education; III with housing; IV with jobs , transportation
and public services; and V with future prospects. At the same time , a more gen-
eral theme runs through the topical presentation.
tion.The question items used in this report suggested a three-fold distinc-
The normative dimension subsumes all questions in which a respondent is
asked for his evaluation of what a given state of affairs should be. The second
more personal dimension, concerns the actual behavior of respondents or that of
their family. These questions deal essentially with the degree of social dis-
tance or contact between whites and Negroes. The third category includes allother opinions and beliefs about Negroes. While this classification was derivedmainly from an examination of the questionnaire items themselyes , it was also
suggested by the literature on attitudes and opinions in general , as well as
those specifically relating to Negro-white relations,
In particular, it appeared that specific questions available to us might
provide an empirical basis for Myrdal' s thesis on value- conflict experienced by
white Americans whose treatment of Negroes contradicts their professed values,
Two small studies by Westie and Campbell have recently examined Myrdal' s theory
in relation to the consistency of values and opinion, Other current research
has moved from concern with the expression of values about integration to an
examination of actual behayior. The contrast between what people believe about
Gunnar Myrdal An American Dilemma:Democracy (New York: Harper , 1944).
Frank R. Westie
, "
The American Dilemma: An Empirical Test Amer. Soc-iol. Rev " 1965 (August), 527-38; Ernest Q. Campbell
, "
Moral Discomfort andRacial Segregation--An Examination of the Myrdal Hypothesis, Social Forces,1961 (March), 228-34.
The Ne ro Problem and American
-5-
the desirability of an integrated society and how they behave when in contact
with Negroes is the focus of investigation. 7 On
the basis of Myrdal' s descrip-
tion of the "dilema " one would anticipate that beliefs are more favorable to
integration than is behavior.
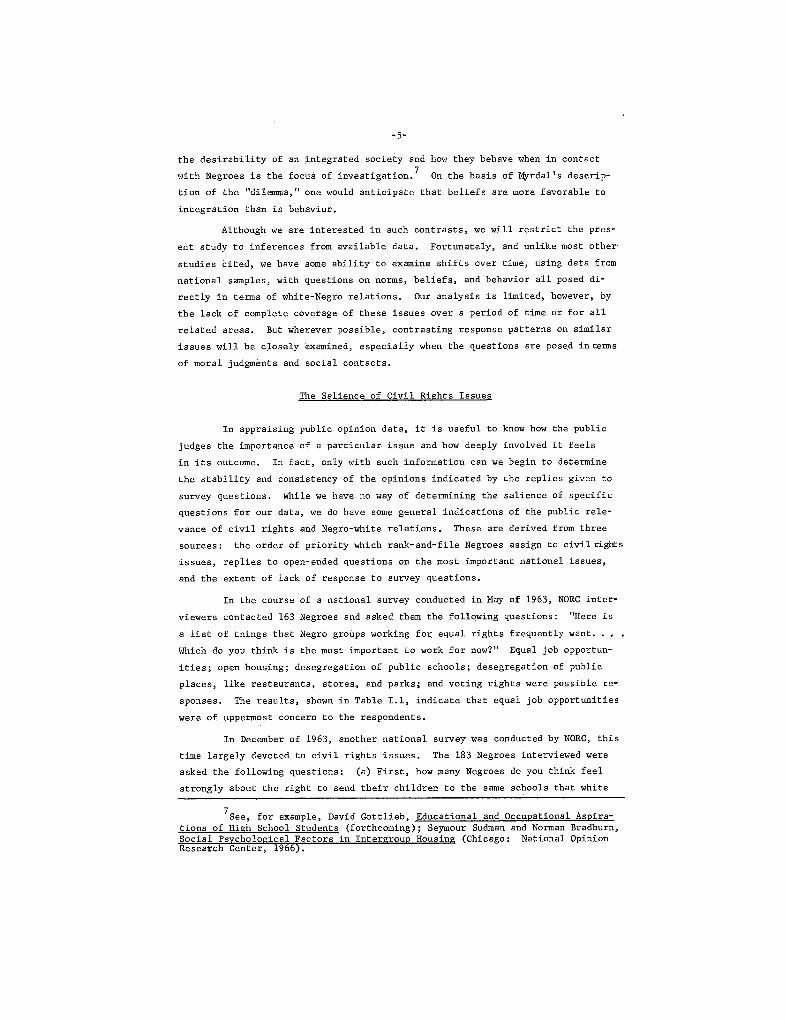
Although we are interested in such contrasts , we will restrict the pres-
ent study to inferences from available data. Fortunately, and unlike most other
studies cited, we have some ability to examine shifts over time, using data from
national samples , with questions on norms, beliefs , and behavior all posed di-
rectly in terms of white-Negro relations. Our analysis is limited, however , by
the lack of complete coverage of these issues over a period of time or for all
related areas. But wherever possible , contrasting response patterns on similar
issues will be closely examined , especially wheri the questions are posed in terms
of moral judgments and social contacts.
The Salience of Civil Rights Issues
In appraising public opinion data , it is useful to know how the public
judges the importance of a particular issue and how deeply involved it feels
in its outcome. In fact , only with such information can we begin to determine
the stability and consistency of the opinions indicated by the replies given to
survey questions. While we have no way of determining the salience of specific
questions for our data , we do have some general indications of the public rele-
vance of civil rights and Negro-white relations. These are derived from three
sources: the order of priority which rank- and-file Negroes assign to civil rightsissues , replies to open- ended questions on the most important national issuesand the extent of lack of response to survey questions.
In the course of a national survey conducted in May of 1963 , NORC inter-
viewers contacted 163 Negroes and asked them the following questions: Here is
a list of things that Negro groups working for equal rights frequently want.
Which do you think is the most important to work for now?" Equal job opportun-
ities; open housing; desegregation of public schools; desegregation of public
places , like restaurants , stores , and parks; and voting rights were possible re-sponses, The results , shown in Table 1. , indicate that equal job opportunities
were of uppermost concern to the respondents.
In December of 1963, another national survey was conducted by NORC , this
time largely devoted to ciyil rights issues, The 183 Negroes interviewed were
asked the following questions: (a) First , how many Negroes do you think feelstrongly about the right to send their children to the same schools that white
7 See, for example , David Gottlieb Educational and Occupational Aspira-
tions of High School Students (forthcoming); Seymour Sudman and Norman BradburnSocial Ps cholo ical Factors in Inter rou Housin (Chicago: National OpinionResearch Center, 1966
-6-
chi ldren go to? (b) How many do you think feel strongly about the right to
hoods?
(c) How many feel strongly about the right to live in white neighbor-
(e) How many feel strongly about the right to hold the same jobs as
vote?
white people? (g) How many feel strongly about the right to use the same parks
restaurants and hotels as white people? Two additional items were included, one
about the right of intermarriage and the other about the desirability of Negroes
living in a separate area of the United States. Respondents could select one of
five categories of number of Negroes feeling strongly about these issues.
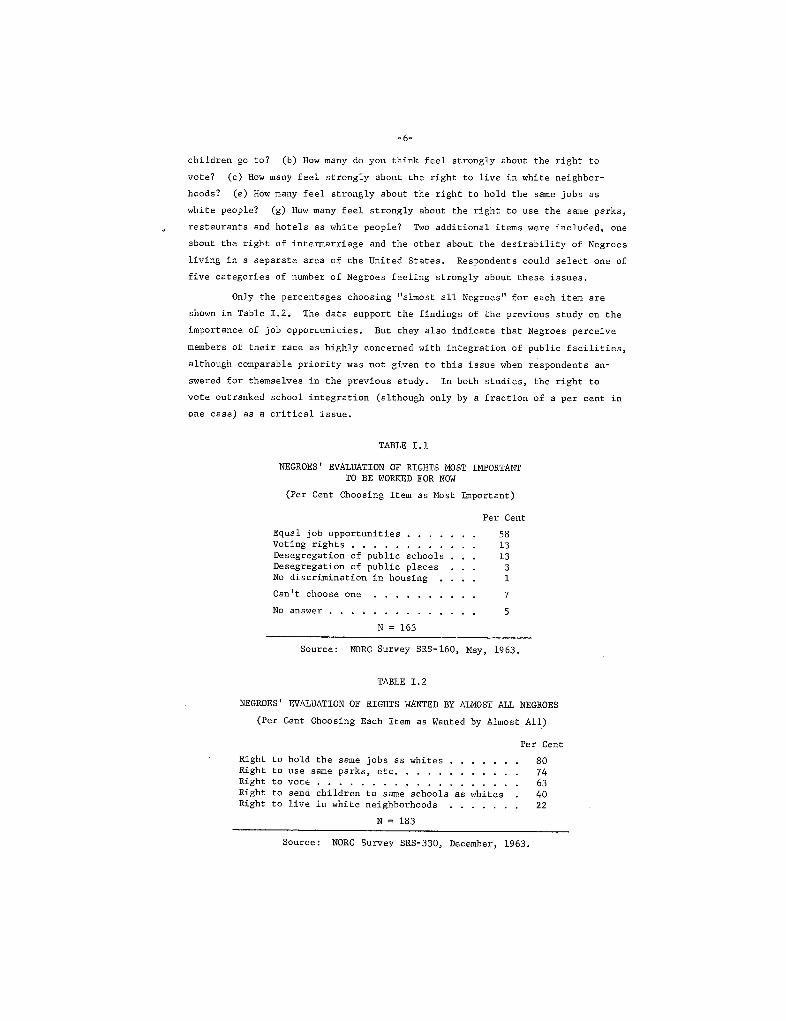
Only the percentages choosing " almost all Negroes " for each item are
shown in Table 1. The data support the findings of the preYious study on the
importance of job opportunities. But they also indicate that Negroes perceive
members of their race as highly concerned with integration of public facilities
although comparable priority was not given to this issue when respondents an-
swered for themselves in the previous study. In both studies, the right to
vote outranked school integration (although only by a fraction of a per cent in
ODe case) as a critical issue.
TABLE I. 1
NEGROES I EVALUATION OF RIGHTS MOST IMPORTANTTO BE WORKD FOR NOW
(Per Cent Choosing Item as Most Important)
Per Cent
Equal job opportunitiesVoting rights.
. . . . . . . . . .
Desegregation of public schoolsDesegregation of public placesNo discrimination in housing
No answer, , .
. , . . . . . . . . .
Can t choose one
. . . . . . . . . .
N = 163
Source: NaRC Survey SRS-160 , May, 1963.
TABLE I. 2
NEGROES' EVALUATION OF RIGHTS WANTED BY ALOST ALL NEGROES
(Per Cent Choosing Each Item as Wanted by Almost All)
Per CentRight hold the same jobs whitesRight use same parks etc.Right voteRight send children same schools whitesRight live in white neighborhoods
N = 183
Source: NORC Survey SRS-330, December , 1963.
-7-
It is interesting to compare this ordering of issues with their cover-
age in other survey research. Trend questions asked by both academic and com-
mercial agencies have been weighted heavily on the side of educational issues.
Much less attention has been paid to job problems , despite their critical im-
portance to Negroes, No comparable questions on the importance of voting r
have been asked over a period of years , since this issue has only recently be-
come a public concern,
One indication of the salience of civil rights issues to the public--
and this means primarily the white public-- comes from answers to an open- ended
question on the most important problems facing the country today. Some version
of this question has been asked by the American Institute of Public Opinion
(Gallup organization) ever since its inception in 1935. Up until 1956 , spon-
taneous mention of racial problems was made only infrequently by no more than
4 per cent of the survey population. Crises associated with school integration
during 1956 and 1957 placed racial problems in. the first or second rank of allproblems mentioned in the two surveys available for those years, From 1958 to1963, however , this issue dropped to from 4 to 10 per cent of all problems cited.Civil rights activities, and a cooling- off of some international issues , brought
associated problems to the fore of public concern again in October , 1963, and
since then they have fluctuated between first and second place in national sur-
veys , depending on the international political situation. Despite the urgencyof the problems to those concerned, the population generally has not been acute-
ly troubled by racial problems until relatively recently. In this respect , the
the comercial polling agencies have been following the public lead in pursuing
issues of apparent salience. This does not , of course, gainsay the loss of im-
port ant historical data on attitudes toward Negroes during an era when theseissues did not yet have their current popular appeal.
When questions on civil rights have been asked, whites have displayed
considerable awareness of and concern with these issues. The proportion of re-
spondents who were unable or unwilling to give a response to each question posed
rarely exceeded 10 per cent for all the questions used in this study. In most
cases "no answers" and "don t knows" combined were only about 3 or 4 per cent.
While this tells us little about how knowledgeable the respondents actually
were about the issues involved, it does give at least a rough indication that
respondents were quite willing to take a position on these matters, This iseven more evident when our results are compared with those from surveys on other
substantive issues , where the rate of "don ' tknows " is frequently much higher,
See the discussion and data cited by V. 0, Key, Jr. Public Opinion andAmerican Democracy (New York: Knopf , 1961), pp. 78-82 and Sheatsley ( loc. cit

-8-
The significance of civil rights issues is unquestioned as far as Negroes
are concerned, and is of growing importance for white Americans. However , the
likelihood of research on these important concerns has been largely dependent
for academic agencies , on the availability of funds , and for commercial ones
on perceived public interest. The selection of issues for this report , then
has been dependent primarily on their availability. This is hardly a satisfac-tory way to engage in research, even when it is necessarily based on a secondary
analysis of data. Nevertheless , we can end this critique of available data onan encouraging note: Despite the limitations of such a secondary analysis , the
material which follows should be adequate proof that a great deal can be karnd
both from the data analyzed and from the procedures used here, Any complaints
are largely regrets that survey organizations did not take greater advantage of
the opportunities to measure public responses to history in the making. In the
meantime, we can proceed with the knowledge that these matters are of consider-
able concern to both Negro and white Americans.
An Overview of Trends
Before turning to a detailed examination of opinions on education, hous-
ing, and other areas of civil rights activity, it may be useful to have some
overview of how opinions have shifted through time. A brief sumary of the re-suits of eleyen trend questions, as viewed by white respondents, is presented
here. The questions are arranged by topic, beginning with an assessment of
Negro intelligence. Accompanying the discussion is a regression line for each
of the questions , indicating the direction and slope of opinion changes, De-
tails on sources of data , actual results , regression coefficients , and standard
errors are not given here but can be found in charts in the chapters following.
A basic requisite of Negro children s full enjoyment of the opportun-
ities provided by the public educational system is that they have an educable
potential at least the equal of whites. Experts still do not agree on whetherit is possible to test such potential without the distortions introduced by the
conditions of poyerty in which so many Negroes live, But the whi te layman
admission of the intellectual equality of Negroes seems to indicate a relatively
favorable perception of Negroes , regardless of the accuracy of this perception.
On seven different occasions , NORC interyiewers have asked respondents
, "
In gen-
eral , do you think Negroes are as intelligent as white people--that is , can theylearn just as well if they are given the same education?,,
9 In 1942, 42 per cent
of a national sample of white Americans replied that they believed Negroes to
have the same intelligence as whites, From that time on , the prOfXrton answering
In one survey, the question ended, " , , , given the same education andtra;jning. This change does not appear to have had an effect on the. results.

-9-
yes " has risen , slowly in the 1940' s and sharply thereafter. By 1956, 78 per
cent of the population believed in the intellectual equality of Negroes and
whites , and since then similar proportions have given this answer, The directionand slope of this general trend is indicated in the accompanying chart as a re-
gression line. Full details on the sources of data , actual observations , and
regression statistics are given in Chart 11.
Least Squares Linear Trend Linein Per Cent Believing Negroesand Whites Are of Equal Intel-
ligence, 1942-1963Per Cent
100
42 Li 52 '57 ' 62 'Year
Given this recent belief in the equal intellectual capabilities of
Negroes and whites , it is relevant to ask whether there has also been a rise inwillingness to accept school integration. Nine measures of the question
, "
you think white students and Negro students should go to the same schools or to
separate schools?" were used, and again the trend was to growing favorability
toward Negro right s and equality, as the regression line in the chart graphicallyillustrates. (For full detail see Chart 11. ) In 1942 , 30 per cent felt that
Least Squares Linear Trend Linein Per Cent Agreeing NegroesShould Go to the Same Schools
as Whites , 1942-1965
Per Cent
100
42 Li 52 i57 '62 'Year

-10-
schools should be integrated; the percentage rose to just under 50 in 1956 , and
to oyer 60 per cent in the 1960 r S. Beginning at a lower level of favorability
than was the case with views of Negro intelligence, a comparatively smaller pro-
portion of white respondents were favorable toward school integration by the
1960'
While the desirability of school integration appears to be increasingly
recognized, the likelihood of respondents r sending their own children to such
schools is not so clear- cut. In 1954, Gallup asked all white respondents
Would you object to having your children attend a school where the majority of
pupils are Negroes?" In 1958 and 1963 the question was asked in terms of vary-
ing proportions of col red children and was addressed only to those with chil-
dren in grade or high school. We will consider as comparable to the 1954 ques-tion the one that asked
, "
Would you, yourself , have any objection to sending
your children to a school where more than half of the children are colored?"
The results clearly support the Myrdalian expectation that feelings of social
distance with regard to Negroes are stronger than normative views of what the
school situation should be. While the 1954 question was asked of all white re-
spondents , and the two later ones only of those with children in school, some
degree of comparability was obtained by tabulating the earlier question only for
those with children between the ages of four and twenty-one. While this differ-
ence still limits full comparability, nonetheless , the rough outlines of a trend
emerge, As a maximum, about two-fifths of white parents would send their chil-
dren to schools where Negroes would be in the majority; at a minimum , one-
quarter would do so. Not only are a minority of white parents willing to permit
their children to be outnumbered by Negro students , but as our chart shows , the
acceptability of such a situation actually declined from 1954 to 1963. (See
Chart 11. 7 for detai is, ) In other words , it is in the realm of behavior that we
find an important instance of the limits of white tolerance,
Least Squares Linear Trend Line inPer Cent with No Objection To Send-ing Own Children to. a School with aMajority of Negroes , 1954-1963
Per Cent100
42 '41 '52 '57 ' 62 'Year

-11-
The school question came into prominence as a result of the Supreme Court
decision in 1954 that upset previous rulings and practices on the legality of
separate but equal" schooling and ordered the integration of all public schools.
On nine occasions since then , Gallup has asked for respondents ' evaluation of
this decision, using the question
, "
The U. S. Supreme Court has ruled that racialsegregation in the public schools is illegal, This means that all children , no
matter what their race , must be allowed to go to the same schools, Do you approve
or disapprove of this decision?" Between 1954 and 1961 the per cent approving
ranged from 54 to 63.10 While this
represents a significant trend , in terms of
our regression analysis , the movement was not as sharp as that for other issues,
This is made clear by a simple visual comparison of the regression lines in this
and the preceding charts, or by a comparison of the metric b , indicating the
slopes of the lines. 11 For opinions on the Supreme Court decision , b is . 97,
This contrasts with b' s ofl 69 on intelligence and 1. 59 on school integration,
Least Squares Linear Trend Line inPer Cent Approving of Supreme
Court Decision on SchoolDesegregation, 1954-1961
Per Cent
100
42 ' t; 52 '57 ' 62 '
Year
It is somewhat surprising that there has not been more change in opinions
on the issues in question, Unlike otl:er questi"ons which cover a time span usedin this report , this is one of the few instances where there is so little notice-
able trend, Perhaps more unexpected , however, is the apparent lack of influence
on opinions stemming from the Supreme Court decision itself. For those who
Data presented in the text refer to the total national sample , includ-ing Negro respondents , since it was not possible to separate Negroes from the re-mainder in the published results, However , experience with other data indicatesthat this does not affect the results by more than one or two percentage points,
For details in the regression analysis of the question on the SupremeCourt decision, see Chart 11.

-12-
follow the Sumnerian position on the stability of mores in the face of changing
stateways , the absence of a growing acceptance of the Supreme Court decisionmight be anticipated. But the current view, supported by research experience
has revealed many instances when events , including new laws, do in fact change
opinions, This is particularly likely to be true when the event is a faitcompli nd when it is accomplished through the efforts of normally prestigious
elements in the population. 12 For reasons which we will explore in the next
chapter , however, this particular legislative effort has not produced any size-able bandwagon effect.
Turning from schools to jobs , we are hampered by a lack of trend data.
Extant dat a concern normative views elicited by such questions as
, "
Do you think
Negroes should have as good a chance as white people to get any kind of job , or
do you think white people should have the first chance at any kind of job?"
Willingness to give Negroes equal job opportunities has changed dramatically
since the 1940' , when under half replied that Negroes should have equal oppor-
tunities , to 1963, when over 80 per cent were of this opinion. The trend lineis presented in the accompanying chart , and full details are given in Chart IV.
Least Squares Linear Trend Linein Per Cent Saying That NegroesShould Have as Good Chance asWhite People To Get Any Kind
of Job , 1944-1963
Per Cent
100
42 ' ti 52 '57 ' 62 '
Year
For data and relevant discussion , see, for example, Milton J. Rosenbeg,Carl I. Hovland, William J. McGuire , Robert P. Abelson , and Jack Brehm, AttitudeOrganization and Chan~e: An Analysis of Consistency amon~ Attitude Components(New Haven: Yale University Press , 1960), p. 213; Bernard Berelson and Garry A,Steiner Human Behavior: An Inventory of Scientific Findings (New York: Har-court , Brace & World, 1964), p. 574; Morroe Berger Equality by Statute (NewYork: Columbia University Press , 1952); William M. Evan and Mildred A, SchwartzLaw and the Emergence of Formal Organizations Sociology and Social Research
1964, (April), 270-80,
-13-
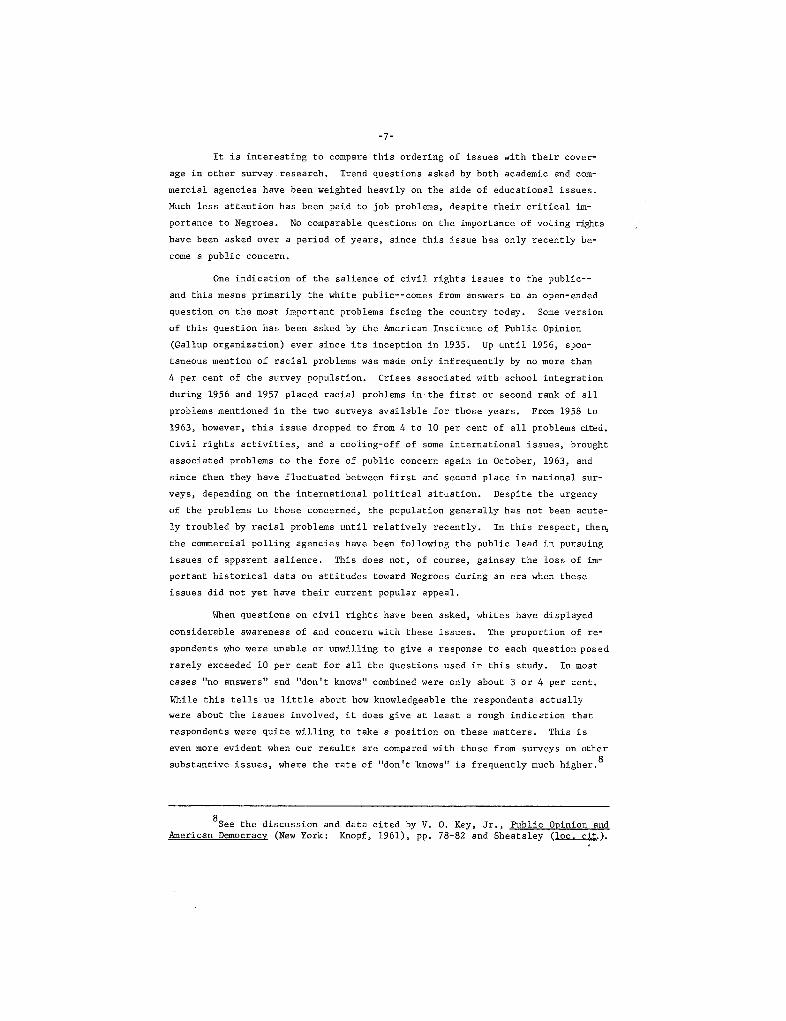
Housing-- an issue able to evoke almost as much emotional furor as school
integration-- ranks relatively low on the list of Negro priorities, as we recallfrom tables 1. 1 and 1, 2. But both Gallup and NORC, reflecting the impact of thsissue on the white community, have devoted research attention to it , particular-
ly since 1960. The NORC trend question, asked in 1942 , 1956, and four times be-
tween 1963 and 1965 was
, "
If a Negro with just as much income and education as
you had moved into your block, would it make any difference to you?" Those who
answered that it would make no difference, or that the difference would be a de-
sirable one, were considered to give a reply favorable to Negro aspirations,
Over the years this issue has produced growing favorability, beginning with a
low of 35 per cent in 1942 and currently at a level of 67 per cent. The regres-sion of these per cents on time is given in the chart included with the text.
Additional information on its components can be found in Chart 111.
Least Squares Linear Trend Linein Per Cent Who Would Not Mindif Negro with Same Income andEducation Moved on Same Block
1942-1965
Per Cent
100
42 ' li 52 '57 '62 '
Year
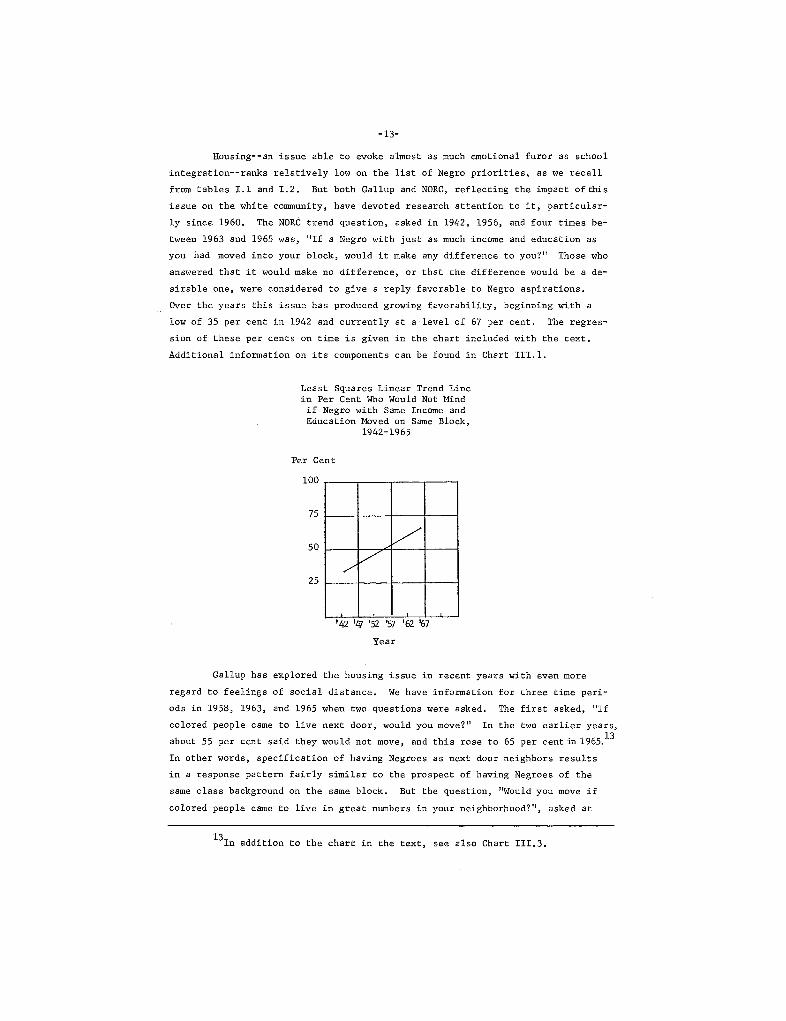
Gallup has explored the housing issue in recent years with even more
regard to feelings of social distance, We have information for three time peri-
ods in 1958 , 1963, and 1965 when two questions were asked. The first asked
, "
colored people came to live next door , would you move?" In the two earlier years,about 55 per cent said they would not move, and this rose to 65 per cent in 1965.
In other words , specification of having Negroes as next door neighbors results
in a response pattern fairly simi lar to the prospect of haying Negroes of thesame class background on the same block. But the question
, "
Would you move if
colored people came to live in great numbers in your neighborhood?" , asked at
In addition to the chart in the text, see also Chart 111.
-14-
the same time as the preceding one , produced quite a different reaction, From
20 to 31 per cent of the respondents said that they would be willing to remain
under these circumstances, While this represents a noticeable trend , as the
accompanying chart and the more detailed information in Chart 111. 5 indicate
the general level of acceptability of Negroes is fairly low, Although having
an unspecified number of Negroes living on the same block (presumably isolated
families), or having Negroes move next door , has become acceptable to a majority,
the prospect of living among large numbers of Negroes , again an unspecified quan-
tity, remains undesirable,
Least Squares Linear Trend Linein Per Cent Saying They WouldNot Move if Colored PeopleMoved Next Door , 1958-1965
Per Cent
100
42 'lj 52 '57 ' 62 '
Year
Least Squares Linear Trend Linein Per Cent Saying They WouldNot Move if Colored People
Came To Live in Great Numbers inNeighborhood, 1958-1965
Per Cent
100
42 lj 52 '57 ' 62 '
Year
-15-
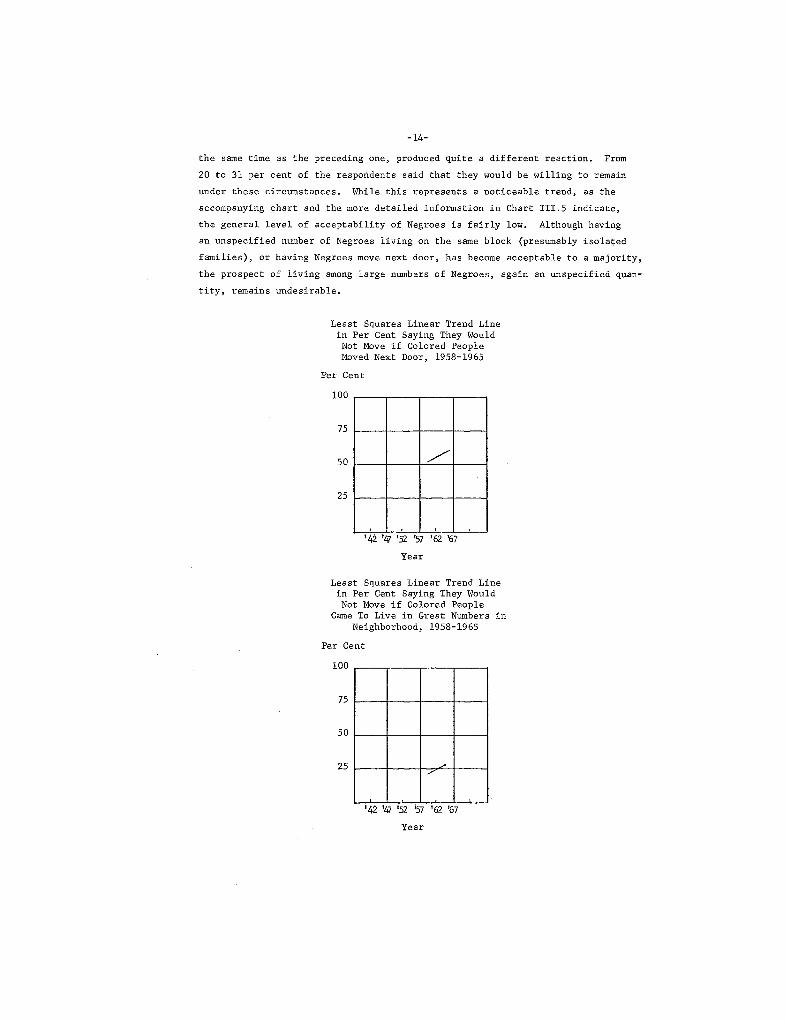
Unlike housing and school segregation and job discrimination, separation
of Negroes and whites in public transportation both has no t been practiced out-
side of the South and has been more rapidly eliminated in the South in confor-
mity with Supreme Court rulings, Yet as long as it existed, such separation
was a source of tension between whites and Negroes. In Montgomery, Alabama , itprovided the focus for the bus boycott that was to introduce a new era of civil
rights activity. National attention was evoked by the Freedom Rides that tested
conformity to integration in public facilities. Either because separation in
public transportation was confined to the South , quickly eliminated , or drama-
tized by protest activities, the proportions of the public who disagreed with
the question
, "
Generally speaking, do you think there should be separate sectionsfor Negroes in street cars and buses?" rose sharply over time. This is made
clear by the accompanying chart and the data in Chart IV, in 1942 , 44 per
cent were opposed to separate sections; in 1956 it was 60 per cent; and in 1963
about 78 per cent. We can anticipate that segregated transportation will soon
disappear altogether as an issue of controversy.
Least Squares Linear Trend Linein Per Cent Saying There ShouldNot Be Separate Sections forNegroes in Street Cars and
Buses, 1942-1963
Per Cent
100
42 ' lj 52 '57 '62 '
Year
Public opinion on general prospects for desegregation in the South was
surveyed by Gallup in 1957 and 195814 and by NORC in 1963, Both organizationsasked the same question: "Do you think the day will ever come in the South when
whites and Negroes will be going to the same schools, eating in the same restau-
rants , and generally sharing the same public accommodations?" In order to make
ThiS same question was also asked in 1956 and 1961 , but published re-sults are only those for selected population subgroups.
-16-
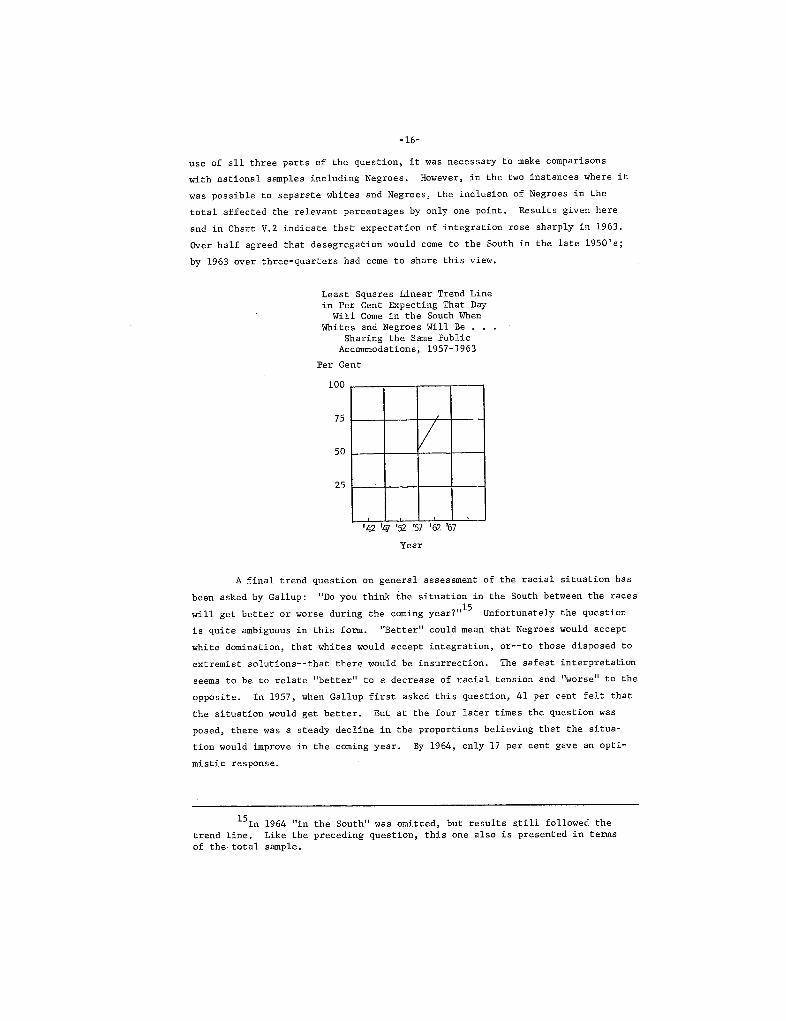
use of all three parts of the question , it was necessary to make comparisons
with national samples including Negroes. However, in the two instances where it
was possible to separate whites and Negroes , the inclusion of Negroes in the
total affected the relevant percentages by only one point. Results given here
and in Chart V. 2 indicate that expectation of integration rose sharply in 1963.
Over half agreed that desegregation would come to the South in the late 1950'
by 1963 over three-quarters had come to share this view.
Least Squares Linear Trend Linein Per Cent Expecting That DayWill Come in the South When
Whites and Negroes Will Be .
. .
Sharing the Same PublicAccomodations , 1957-1963
Per Cent
100
'42 l. 52 '57 ' 62 '
Year
A final trend question on general assessment of the racial situation has
been asked by Gallup: "Do you think the situation in the South between the races
will get better or worse during the coming year?,,15
Unfortunately the question
is quite ambiguous in this form. Better" could mean that Negroes would acceptwhite domination, that whites would accept integration , or--to those disposed to
extremist solutions--that there would be insurrection. The safest interpretation
seems to be to relate "better" to a decrease of racial tension and "worse" to the
opposite. In 1957, when Gallup first asked this question, 41 per cent felt that
the situation would get better. But at the four later times the question was
posed, there was a steady decline in the proportions believing that the situa-
tion would improve in the coming year.
mistic response.
By 1964, only 17 per cent gave an opti-
In 1964 "trend line, Like theof the total. sample.
the South" was omitted , but results s,ti11 followed thepreceding question, this one also is presented in terms

-17-
Least Squares Linear Trend Linein Per Cent Feeling That theSituation between the Races
Will Get Better in the ComingYear , 1957-1964
Per Cent
100
42 'lj 52 '57 ' 62 '
Year
These eleven questions represent the available data for tracing an over-
view of white public opinion on racial issues, From the 1940' s to the presentthere has been considerable change in outlook , and for the most part this has
been in the direction of growing favorability to Negro aspirations.
While questions have been presented in terms of the contrast betweennonns beliefs and soci a 1 contact the number of questions available do not per-mit much in the way comparative conclusions. Yet we can see that over time
trends on normative questions have risen more sharply than have those on socialcontact. Trends on beliefs appear to lie in between.
The degree to which favorability of white opinions to Negro rights has
increased is more strongly affected by the content than by the character. of thequestion. For example, all opinions on school integration , whether referring
to norms, beliefs , or social contact , have remained most resistant to change.
In addition, while there is some trend of increased willingness to accept inte-
grated situations, there is still strong reluctance to accept situations where
Negroes are as numerous as whites,
It is difficult to make a clear- cut interpretation of the trends in pub-
lic opinion on the racial situation, But available data appear to indicate that
the majority of respondents feel that racial tension will increase before Negro-
white relations improve. On the whole , this short- range pessimism has not hin-
dered the increasing favorability toward the exercise of civil rights by Negroes,
In the following chapters the overview of public opinion trends presented here
will be elaborated and supplemented with additional data, and a more detailed
exposition of public opinion on selected issues concerning Negroes will be given.
CHAPTER II
ATTITUDES TOWARD THE EDUCATION OF NEGROES
Negro Intelligence
The first available measure of the attitudes of whites toward Negro
intelligence comes from the results of a Roper survey of September , 1939 , that,
as far as I know, have not been published elsewhere. Over fiye thousand re-
spondents were asked
, "
Do you think Negroes now generally have higher intelli-
gence than white people, lower, or about the same?" Seventy-one per cent ofthe respondents replied " lower " and 22 per cent
, "
about the same. Those who
answered " lower" were then asked to give their evaluation of the reasons. The
largest category--44 per cent--believed that Negroes were born with less intel-
ligence. Thirty-two per cent attributed the difference to lack of educationalopportunities, and another 22 per cent felt that both lack of opportunity and
inferior inborn intelligence accounted for this difference. When NORC began
studying beliefs about Negro intelligence in 1942 , 42 per cent of the respon-
dents said that Negroes were as intelligent as whites. This apparent increase
in the favorable perception of Negro intelligence may represent some real gain
from the 1939 data , perhaps attributable to the new contacts and experiences en-
countered in the armed forces and increasing urban migration. However , it may
also be due to the change in wording of the question. From 1942 to 1963 the
NORC wording was followed consistently, and in that time there was a sharp rise
in the proportion of white respondents believing that Negroes and whites do not
differ in innate intellectual capacity. The results of these seven surveys are
presented in Chart 11. , where the straight line represents the regression on
time of the per cent belieYing that Negroes are as intelligent as whites, and the
points represent the actual observations. The latter appear to show a sharp rise
in favorable views in 1956 and some levelling off from then until 1963,
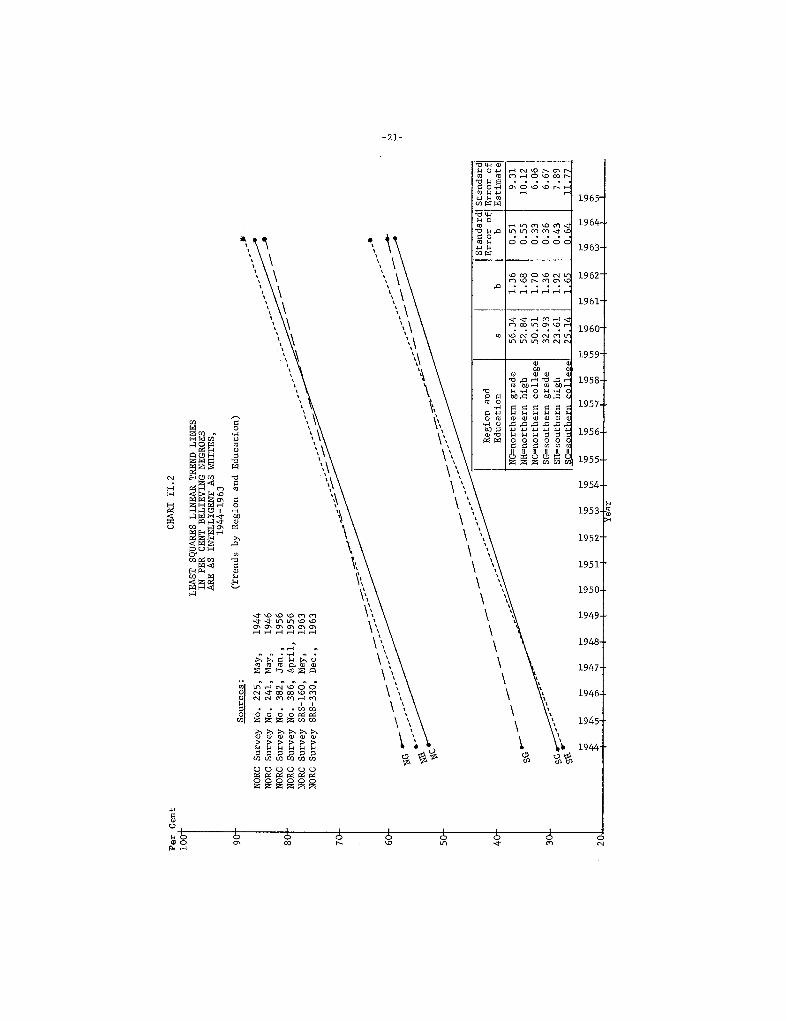
The extent and continuity of opinion differences between critical popu-
lation groups is especially noteworthy. The data presented in Chart II. 2 as re-gression lines show the direction of trends between 19442 and 1963 for those
living inside or outside the South for three educational levels: grade school
education or less , high school , and at least some college education. (Actualdata on which this chart is based can be found in Appendix Table 1. Dramatic
Tabulations were done by the Roper Center for Public Opinion Research.
0nly marginal data .are available for the 1942 study.
-19-

ent
CHART II.
LEAST SQUARES LINEAR TRED
LIN
EIN PER CENT BELIEVING NEGROES
ARE AS INTELLIGENT AS WHITES
19(J
2-19
63(Total White Respondents)
NORC Survey
NORC Survey
NORC Survey
NORC Survey
NORC Suryey
NO
R S
urve
yNORC SurveySo
urce
sNo. 113,
No, 225,
No. 241
No. 382
No. 386
SRS-
160
SRS-
330
Stan
dard
Stan
dard
Error of
Error of
Est
imat
e
45.
1. 6
9
June, 1942
May
, 194
4M
ay, 1
946
Jan., 1956
Apr
il, 1956
May
, 196
3D
ec"
1963
Yea
r
Per Cent
100
CHART II.
LEAST SQUARES LINEAR TRED
LIN
ES
IN PER CEN BELIEVING
NE
GR
OE
SA
R A
S INTELLIGENT AS WHITES
1944
-196
3(Trends by Region and Education)
- -
- -
- -
- -
--
- -
--
- -
- -
--
-..;
.'"
-- -.
-- .-
..--
--
-- -
-::-
=--
-- -
...:; -- -- --
?:. -
---
--
---:
--:-
-- -
- --
--
---
--
-- -
-- -
- --
--
---
--
-- -
SG -
-- -
Sour
ces
No. 225
No. 241
No. 382
No. 386,
SRS-
160
SRS-
330
May
, 194
4M
ay, 1
946
Jan.
, 195
6A
pril, 1956
May
, 196
3D
ec.,
1963
NORC Survey
NORC Survey
NORC Survey
NORC Survey
NORC Survey
NORC Survey
.p.
.Tr
Stan
dard
! Sta
ndar
dRegion and
Error of Error of
Edu
catio
nE
stim
ate
NG=northern grade
56,
1.36
31 I
NH=northern high
52.
1.68
10.1
2 ,
NC=northern college
50.5
1,1.
7006
ISG
=so
uthe
rn g
rade
32.9
3 I
1.36
67 I
SH=
sout
hern
hig
h23
.6l!
1. 9
21 6
0 6
11.
-22-
differences emerge from the trend lines. The contrast between North and South
is the most pronounced, regardless of the amount of schooling of respondents,
As might be expected , non- southern respondents have a more favorable view of
Negro intelligence than do southerners. The amount of difference between the
two regions remains great over time and shows no sign of decreasing.
An examination of the actual results and the trend lines reyeal several
pertinent findings. For one thing, the levelling-off in favorable views shown
in Chart 11. 1 is more pronounced in the data on subgroups, There is some indi-
cation that the favorable views of college-educated southerners and grade school-
educated northerners on this issue have reached the tolerance limit and may even
be declining. Differences between educational levels generally tend to be minor
although they are slightly greater in the South than in the North. In addition
while the pattern is not completely consistent , there is a somewhat greater ten-
dency for those with a high school education or less to think that Negro and
white intelligence are equal than is the case for the college- educated. This
is true in both the North and the South.
It is normally not desirable to forego the interpretation of such data
until later in the discussion. But in this instance , the full significance of
the findings emerges only after the responses to other questions are examined.
Therefore, the data on education and school desegregation will be presented be-fore analyzing these trends.
The Desirability of Integrated Education
A 1944 NORC interview asked
, "
Generally, do you think Negroes in the
United States are as well educated as white people? ,,3 More than three- quarters
of the respondents replied that Negroes were not as well educated as whites.
In both the North and the South, the greater the respondent s own education , the
less likely he was to feel that Negroes were as well educated as whites. Whites
with less than a high school education were more likely to have been exposed to
Negroes with similar education to their own and to infer the educational equality
of Negroes and whites. This was less likely to be true in the case of the high
school- educated and least likely in the case of the college-educated. For allgroups , however, the majority clearly saw Negroes as educationally inferior.
Of those respondents who answered that Negroes were less well educated
than whites , the largest proportion-- about two-fifths-- attributed this to lack
of ambition and lack of capacity to learn, Only about one-fifth felt that lack
of opportunity generally, and insufficient or inadequate schools contributed to
the educational disparity. With most of the blame for educational deficiencies
NORC Survey No. 225, May, 1944.

-23-
placed on the Negro himself , it is hardly surprising that 85 per cent of the re-
spondents thought that Negroes had the same educational opportunities as whites.
Only college- educated southerners appeared to have noticeable doubts about this:66 per cent felt that there was eq al educational opportunity in their community.
Respondents ' opinions of actual educational opportunities in their com-
munity were highly distorted and were probably influenced by their values since89 per cent thought that" . . . Negroes in this town should have the same chance
as white people to get a good education, While some regional and educational
differences in commitment to equal education are apparent , the large proportion
believing in the legitimacy of equal educational opportunities is striking, For
example, of the group least likely to belieye that Negroes were as well educated
as whites-- southerners with a grade school education or less--fully 76 per cent
were sympathetic to the principle of equal education, The progression in order
of favorability increased with education, first in the South and then in the
North , with 95 per cent of college- educated northerners expressing support for
equality.
What did these questions actually measure? Hardly a commitment to inte-
grated education. The results , although lacking depth , illustrate the ration-
alizations and easily-expressed values current in 1944. The large majority of
respondents expressing approval of equal educational opportunities for Negroes
should not be misleading. For one thing, many whites felt , with considerable
justification, that it was far from easy to obtain an adequate education for
their own children. Their admission that Negroes should be permitted to engage
in the same struggle may not have been a great concession, Further , adherenceto the principle of equal education frequently rested on a belief that education
could be both separate and equal. This interpretation is supported by an exam-
ination of responses to a related question, asked by NORC interviewers in 1942.
Respondents were asked
, "
Do you think white students and Negro students should
go to the same schools or to separate schools?" Thirty per cent felt that white
and Negro children should attend the same schools. During 1956, the same ques-
tion was asked three times , and just under half the respondents were in favor
of integrated schools , a far cry from the 89 per cent who favored equal educa-
tional opportunities for Negroes in the 1944 survey, Our interpretation of the
NORC survey results is reinforced by a small study done in Indianapolis by Frank
Westie. 4 Ninety- eight per cent of his respondents felt that "Children shouldhave equal educational opportunities. However . only 79 per cent agreed with
the statement
, "
I would not mind having Negro children attend the same school
my chi ldren go to. One might well anticipate , in conformity with Myrdal'
hypothesis , that such a suggestion would meet with less favor than would questions
Frank R. Westie, "The American Dilemma:Sociol. Rev ., 1965, (August), 531.
An Empirical Test Amer.

C24-
on the general moral issue of equal education. Thus, while appearing favorable
to Negro educational aspirations , many whites have responded in terms of sepa-
rate but equal education for Negroes, despite the presently-defined illegality
of such separation.
Since the 1950 I s , the major educational issue in the context of race re-
lations has been that of school integration. Unfortunately, however , until 1963
measures of public opinion on this matter were largely limited to the 1942 and
1956 surveys already mentioned, One indication of the climate of opinion oper-
ating at the time of the 1954 Supreme Court decision on school desegregation is
given by a 1950 Roper survey. Almost three thousand respondents were asked
Which of these statements would you come closest to agreeing with? (a) Chil-
dren of all races and color should be allowed to go to the same schools to-
gether everywhere in the country. (b) Children of all races and color should
be allowed to go to the same public schools together everywhere except in the
South, where white and Negro children should go to separate schools, (c) White
children and Negro children should be required to go to separate schools every-
where in the country. By 1950, integrated education was beginning to pick up
adherents: 41 per cent were in favor of "the same schools together everywhereand another 17 per cent in favor of the same schools "except in the South.
These results are mirrored by the NORC survey findings of 1956. It is not clear
exactly when a majority of white people came to accept these views , but over 60
per cent of the respondents to a 1963 survey agreed with the principle of inte-
grated schools. The overall trend, then, has been in the direction of increas-
ing acceptance of equal educational opportunities for Negroes,
Regional and educational differences in opinion among population sub-
groups are especially noteworthy. Regression lines showing such shifts, based
on data from seven surveys conducted between 1956 and 1965, are given in Chart
11, 4, and actual data are given in Appendix Table 2. The most sizeable differ-
ences are between North and South , though educational differences are also con-
siderable. This is hardly surprising in the light of the long history of school
segregation in the South, At the same time, the apparent responsiveness of white
northerners to integrated schools is open to some skepticism in view of the ex-
tent of de facto school segregation in northern cities. If nothing else, the
survey results indicate growing public approval of the claim for shared educa-
tional facilities.
The increase over tim in favorability to integrated education has pro-
ceeded in such a fashion that regional and educational groups remain different
ated in a stable fashion. Least favorable are southerners with a grade school
The data reported hereOpinion Research , and it is notcluded in the sample.
were tabulated by the Roper Center for Publicclear whether or not Negro respondents were in-

Per
: Cen
t
50 t-
CH
AT
II.
3
LE
AST
SQ
UA
RS LINE TRED LINE IN PER
CEN AGREING NEGROES SHOULD GO TO
SA SC
HOOLS AS WHITES, 1942-1965
(Total White Respondents)
Stan
dard
St a
nda
rdError of
Error of
Est
imat
e
28.
1.59
1.81
t- t-
..
1. 1
. ..
1.
., .,
., .,
'j '
Y' '
f
.. ..
.. ..
t- t-
J- t-
J-
J-
1. 1.
1. \D
\D 1
.
.p .p
\J Ln
Ln
Ln L
r'f
'F 1" 'I '
". Y' 'I I
Yea
r
Sour
ces
NORC Survey No.
113, June,
1942
NORC Survey No. 386, April, 1956
NORC Survey No, 390, June
1956
NORC Survey No, 393, Sept., 1956
NORC Survey SRS-160, May,
1963
NORC Survey SRS-350, Nov.,
1963
NORC Survey SRS-330, Dec.,
1963
NO
RC
Sur
vey
SRS-
630
, May,
1964
NORC Survey SRS-857, June
1965
t- J
- J-
I-
t- t-
t-
\D \D
1. \
D \D
\0
1.
Ui \
J 0"
0'
0" 0
' 0'
'f
9 'I
\" 'f
""

CHART II.
LEAST SQUARES LINER TREND LINES IN PER CENT
AGREING NEGROES SHOULD GO TO TH SAM
SCHOOLS AS WHITES, 1956-1965
(Trends by Region and Education)
Region and
Edu
catio
n
1.27
1.44
1.25
1.52
NG
=no
rthe
rn g
rade
: 32.73
INH=northern high i .44
.40
NC=northern college! 47.56
iSG=southern grade i -
15. 2
0 SH=southern high 1-14.
SC=southern collegel-
ll.
NORC Survey
NO
RC
S!l
rvey
NORC Survey
NORC Survey
NORC Survey
NORC Survey
NORC Survey
No. 386,
No. 390
SRS-
160
SRS-
350
SRS-
330
SRS-
630
SRS-
857,
Apr
il, 1956
June, 1956
May
, 196
3N
ov.,
1963
Dec. ,
1963
May
, 196
4Ju
ne19
65
Sta
ndar
d1 S
tand
ard
Err
or o
f I E
rror
of
I Est
imat
e
27
51 I
30
79 ,
15 1.
38 I
44 I 4.
13 i
30 I 2.
80 I
65 6
,
Per Cent
C -
- -
- -
--
--
--
--
- -
--
--
-..-
-- -
- --
--
----
--
-- -
- --
G -
- -
- -
--
--
-
s\' .-
.-
t- t-
I- t-
I-
---
I. \D
\0 \0
1. \D
SG
""
Ln
1I V
1 0'
Q'
Q' 0'
Q'
J- N
"" V
I Iear I

-27-
education or less , followed by southerners with a high school education, and by
college- educated southerners, The same order of increasing favorability with in-
creasing educational level is true for the North, as well. But the six subgroups
under consideration remain far apart in outlook, By 1965 , 53 per cent of south-
ern whites with a college education approved of desegregation , a proportion sim-
ilar to the northern grade school- educated in 1956. In other words , the most
tolerant southerners have , as a group, only recently attained the level of toler-
ance manifested by the least tolerant northerners a decade ago.
Within these two broad regions , there are some differences in the rela-
tive differences of opinion between educational groups. For example , while dif-
ferences are greatest in both regions between the college and grade school- edu-cated, on the average they are greater in the South , where there may even be
some movement to increasing differentiation. In the North , on the other hand
those with college and high school educations have tended to hold more similar
viewpoints than in the South.
As a result of the greater spread between educational levels in the
South , it is not surprising that , despite very large regional differences , we
find somewhat less differentiation between the college- educated across regional
lines than is true of those with less schooling. Opinion differences between
northern and southern college- educated range between 30 and 48 percentage points;the range is 41 to 50 for those with a hi school education and 39 to 47 for those
with no more than a grade school education, There is some variation in theamount of difference between educational levels for each survey, but there is no
discernible trend toward either greater or lesser regional difference.
The data summarized in Table 11. 1 show that , within either region, the
group that was most favorable to desegregation in 1956 normally showed the great-
est increase in favorability by 1965. This is true in all cases except college-educated northerners , who , with a favorability rate greater than 75 per cent in
1956, had an imminent ceiling on rate increase before achieving complete consensus.
TABLE II. 1
NEGRO AND WHITE CHILDREN SHOULD GO TOTHE SAM SCHOOLS
(Per Cent Difference between 1956 and 1965)
Education RegionSouth North
College, .High school.
Grade school or less
+27
+21
+17
+ 9
+15
+14

28-
While it is clear that the majority of southerners are still far from accepting
the desirability of integrated schools , at least the momentum of change is great-
er in the South than in the North.
With All Deliberate Speed
The Supreme Court decision on school desegregation did not issue any
directives for the implementation of new procedures. The Court did not , as
proposed by the department (of Justice), direct the lower courts to make local
school authorities present desegregation plans within a specified time. It said
only that the lower courts require a ' prompt and reasonable start toward fullcompliance. ' The process of desegregation, the opinion concluded, must proceed
with all deliberate speed ' a phrase first used in the Supreme Court in 1911
by Justice Holmes , and often invoked in recent years by Holmes s great admirer
Justice Frankfurter. No matter how hallowed by tradition, the language of the
Court was to be a source of heartbreak and frustration to civil rights groups
and to serve as a defense for the delaying tactics of recalcitrant states. But
there was and is no question that social and administrative patterns passed down
for generations are difficult to change , with or without "deliberate speed,
Public recognition of the difficulties of effecting change, or at least of the
reluctance to accept rapid change, is reflected in the answers to several ques-
tions asked by Roper and Gallup in 1956 , 1957, 1958 , and 1961.
The 1956 Roper question was as follows: Now there have been a number of
different viewpoints about the Supreme Court decision against separate schools
for Negro students. Which of these comes closest to expressing your own person-
al opinion? (1) Negroes should go to the same schools that white children do
and separate schools should be done away with immediately in all parts of the
country. (b) Every attempt should be made to do away with separate schools forNegro students, but a reasonable time should be given to work out the problem.
(c) The time may come when Negro and white children should go to the same schools
but it will take years in some places and it shouldn t be pushed. (d) The Su-
preme Court decision was a mistake and white and Negro students should never be
forced to go to the same schoo is, ,,
The largest proportion, 31 per cent , felt that the Court decision had
been a mistake. Twenty-three per cent were of the opinion that school integra-
tion, while desirable, would take many years and should not be pushed. Another
22 per cent wanted separate schools done away with , but agreed that " reasonable
time" should be allowed for this. Altogether , then, 45 per cent opted for a
Anthony Lewis and the New York Times Portrait of a Decade. TheSecond American Revolution (New York: Random House, 1964), p. 30.
Roper Survey No. 64, September , 1956.
-29-
gradual approach to school integration.iate integration. 8
Only 12 per cent were in favor of immed-
In that same year, Gallup asked respondents a similar question , but al-
lowed them only two alternatives: " (i) The government should try to bring about
the integration of white and Negro children in public schools gradually--that is
over a long period of years. (2) The government should do everything it can to
see that white and Negro children in all parts of the country go to the same
public schools within the coming year. Although this survey did not provide a
separate answer category for the possibility of a complete rejection of school
integration, approximately 18 per cent volunteered that they never wanted inte-
gration to come about. Fifty-three per cent wanted gradual integration, and
18 per cent wanted it in the coming year.
In 1957, Gallup used a slightly different wording in a question on this
subject: "Generally speaking, do you think segregation (sic-- changed to integra-tion) should be brought about gradually, or do you think every means should be
used to bring it about in the near future?" Gradual integration was favored by
47 per cent; 20 per cent were totally opposed to integration; and 27 per cent
thought it should be brought about in the near future,
In the following year, Gallup focussed directly on the situation in the
South, explaining the extent of school segregation in a preamble. In many com-
munities in the Deep South states , the number of colored school children is great-
er than the number of white school children, Now the next question has to do
with how much time the Federal courts should giye schools in these areas to in-
tegrate, that is, to require white and colored children to attend the same rather
than separate schools. Would you say that these communities in the South should
be required to integrate immediately, should they be given a few years to do
this, should they be given a longer time such as ten to twenty years, or should
they not be required to integrate at all?" Immediate integration was selected
by 27 per cent; 24 per cent hoped that the South would be given a few years to
integrate; 9 per cent suggested from ten to twenty years; and 32 per cent were
opposed altogether to integration.
ence
Finally, in 1961, Gallup resumed asking about integration without refer-
to any particular region. The question , posed in still different terms
Do you think integration--that is , bringing Negro and white childrenwas
The remainder had no opinion.9 AIPO release
, May 9 , 1956, The "gradual" and "never" categories areestimates. The sample presumably includes some Negroes.
10 AIPO
11 AIPO
study 589-K, September , 1957.
study 604-K , September , 1958.
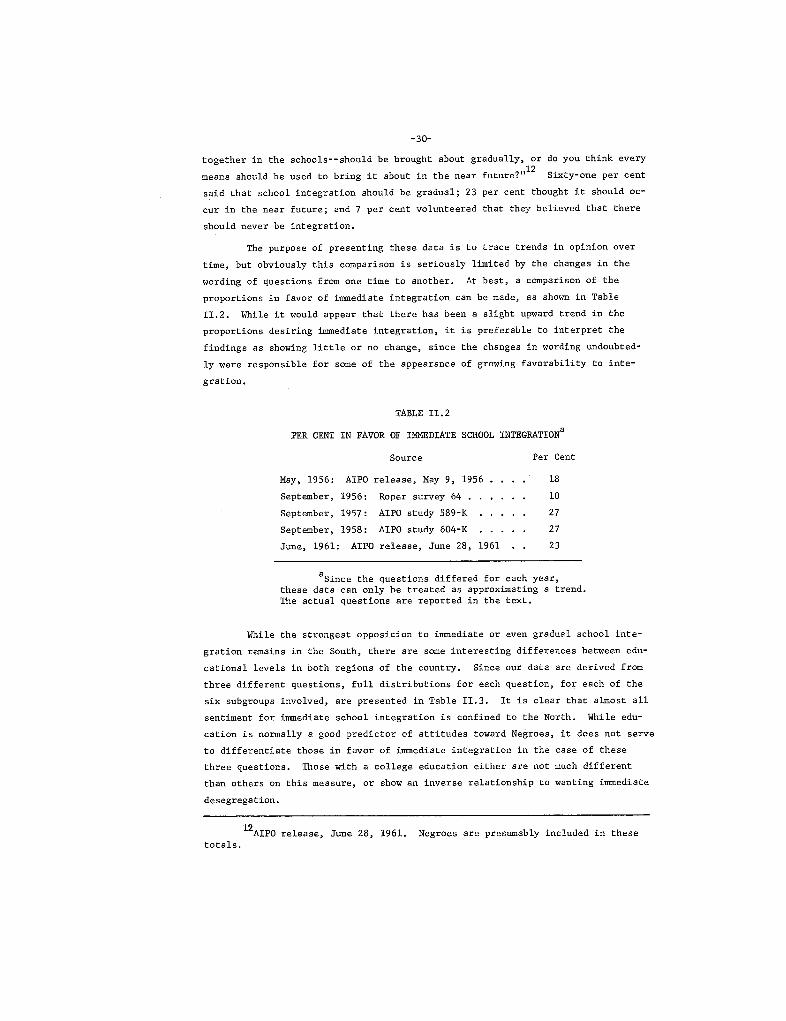
-30-
together in the schools-- should be brought about gradually, or do you think every
means should be used to bring it about in the near future?,,12 Sixty-
one per cent
said that school integration should be gradual; 23 per cent thought it should oc-
cur in the near future; and 7 per cent volunteered that they believed that there
should never be integration.
The purpose of presenting these data is to trace trends in opinion over
time, but obviously this comparison is seriously limited by the changes in the
wording of questions from one time to another. At best , a comparison of theproportions in favor of immediate integration can be made, as shown in Table
11, 2. While it would appear that there has been a slight upward trend in the
proportions desiring immediate integration, it is preferable to interpret the
findings as showing little or no change , since the changes in wording undoubted-
ly were responsible for some of the appearance of growing favorability to inte-
gration.
TABLE II. 2
PER CENT IN FAVOR OF IMMDIATE SCHOOL INTEGRATION
Source Per Cent
May, 1956: AIPO release , May 1956
September 1956: Roper survey 64 ,September 1957: AIPO study 589-K
September 1958: AIPO study 604- K
June 1961: AIPO release June 28 1961
Since the questions differed for each yearthese data can only be treated as approximating a trend.The actual questions are reported in the text.
While the strongest opposition to immediate or even gradual school inte-
gration remains in the South , there are some interesting differences between edu-
cational levels in both regions of the country. Since our data are derived from
three different questions , full distributions for each question, for each of the
six subgroups involved , are presented in Table 11. It is clear that almost all
sentiment for immediate school integration is confined to the North. Whi le edu-
cation is normally a good predictor of attitudes toward Negroes , it does not serve
to differentiate those in favor of immediate integration in the case of these
three questions. Those with a college education either are not much different
than others on this measure , or show an inverse relationship to wanting immediate
desegregation.
AIPO release , June 28 , 1961.totals,
Negroes are presumably included in these
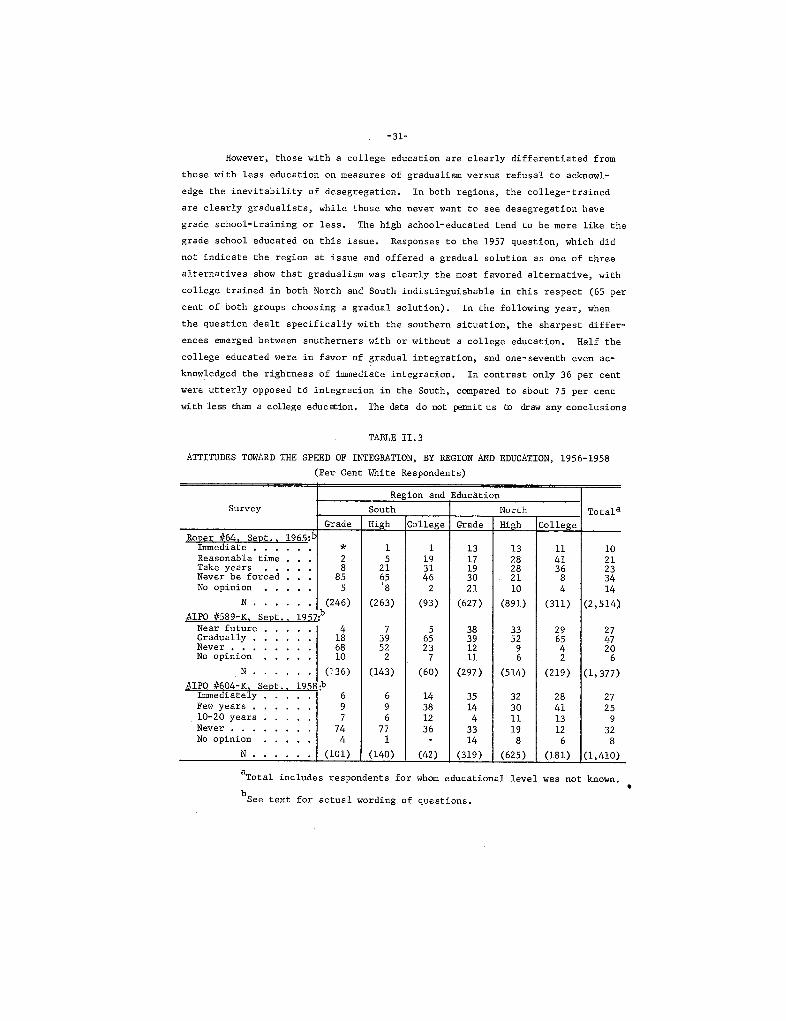
-31-
Howeyer, those with a college education are clearly differentiated from
those with less education on measures of gradualism versus refusal to acknowl-
edge the ineYitability of desegregation. In both regions, the college- trainedare clearly gradualists , while those who never want to see desegregation have
grade school-training or less. The high school- educated tend to be more like the
grade school educated on this issue. Responses to the 1957 question, which did
not indicate the region at issue and offered a gradual solution as one of three
alternatives show that gradualism was clearly the most favored alternative , with
college. trained in both North and South indistinguishable in this respect (65 percent of both groups choosing a gradual solution), In the following year, when
the question dealt specifically with the southern situation, the sharpest differ-
ences emerged between southerners with or without a college education. Half the
college educated were in favor of gradual integration, and one- seventh even ac-
knowledged the rightness of immediate integration. In contrast only 36 per cent
were utterly opposed to integration in the South , compared to about 75 per cent
with less than a college education. The data do not peit us to draw any conclusions
TABLE II. 3
ATTITUDES TOWARD THE SPEED OF INTEGRATION, BY REGION AND EDUCATION, 1956-1958
(Per Cent White Respondents)
Region and EducationSurvey South North Total a
Grade High College Grade High Collegeer 4F64 1965:
ImediateReasonable timeTake yearsNever be forcedNo opinion
N , (246) (263) (93) (627) (891) (311) 514)AIPO 4F589-K 1957:
Near futureGradually.Never. .No opinion
N . (136) (143) (60) (297) (514) (219) 377)AIPO 4F604- Sept. 1958:
ImmediatelyFew years10-20 yearsNeverNo opinion
N , (101) (140) (42) (319) (625) (181) 410)
Total includes respondents for whom educational
See text for actual word ng of questions,
level was not known.

-32-
about opinion trends for these different groups , but they do document the con-
tinuing significance, at least until 1958 , of differences between regions and
educational groups in their receptiveness to integration. In general , it is
fair to conclude that immediate integration is still wanted by only a small mi-
nority of the population, even among the usually more liberal college- educated
groups.
The Supreme Court and the Impact of Events
The law has been an important instrument in the struggle for full civil
rights: In the decade between the Supreme Court decision of 1954 and the Civil
Rights Act of 1964, increasing numbers of barriers to Negro participation in
American society have been breached, if not yet overcome. These results have
been achieved with painful slowness, sometimes accompanied by violence. The re-
mark attributed to President Eisenhower
, "
You cannot change people s hearts mere-
ly by laws, " has continued to have considerable significance to many people.
Apart from some kind of unusually probing research to get at how people "reallyfeel " we are left with the alternative of watching responses and listening to
opinions. We know that the laws exist , that some institutional arrangements have
already been changed, and that many people s behavior has been altered in ways
that might not have been predicted. Our problem is to determine how people
opinions have been affected by these events, if at all.
An analysis of the interaction between events and opinions is aided by
the repetition of a single question by the Gallup organization nine times between
1954 and 1961. The question asked
, "
The U. S. Supreme Court has ruled that racialsegregation in the public schools is illegal. This means that all children, no
matter what their race, must be allowed to go to the same schools. Do you ap-
prove or disapprove of this decision?"
In general, this report specifically avoids looking for particular causal
factors involved in opinion fluctuations. An examination of responses to ques-tions which have been repeated reveals that normally there is a cumulative effect
attributable to the passage of time and a combination of events , that leads to
growing favorabi1ity to Negro aspirations. This general observation, then, pro-
vided one rationale for the presentation of data in the form of regression lines:
Since the overall tendency is for opinions to move in a linear direction, such a
presentation is most effective in illustrating the data. In the case of questions
on the Supreme Court decision, however, linearity is not so clear-cut. Between
1954 and 1961 there certainly has been a trend to increasing favorabi1ity, a
illustrated by Chart 11.5. But equally noteworthy is the shallowness of the slopb equal to 0. 97, indicating a relatively small amount of change, and the disper-sion of the actual results around the trend line. This latter finding, in par-
ticular, suggests that it would be worth considering the impact of specific eventson fluctuations in opinion over short time periods.

-33-
,,Zr-r.0'-p. H'"(I r-ZH IH U..r. '" ,.A 0' r- '-
H E- H"; " P Z Q 0 0 Z U H 0
gj
t: E- '"
,, gj ,,
p.,, r-Pr. (I (I '-r. 0HI' Q
H::P po U0'0 (I(I ,,p.ZE- p.0(1..
'" 0Q) 0p. r-
-. L1 \0 f' .. .. r- 0\ ..I. Lf If I. I. If I. l/0'0'0\0'0\0\0'0\0\1".. ..r-.... r-r- r-
n"'..-. ....C"OOC'r-"" ..NMN
...- ..
(J . +J .
..
.a bO 0. 0 r- (J (J QJ.
Q) ..;: I';:.. (I Q....oJ ; OJ
"'
II Q) OJ.. to U) (J tI .. co en (J (I co tt co Ct CU (\
I QJ QJ QJ QJ I QJ QJ QJN r- .... r- 0\.. .. ..
Q. Q) Q) CO 00 Q) (1 Q)
~~~
HL1HHH000000000
p. p. p. p. p. p. p. p. p.
HHHHHHHHH-0 -0 -0 -0 -0 -0 -0..-0
O4-'" 0 '-"d '" S0...
'" '-
(I r. r.
"d 4-
0 .a
(I r.
1961
1960
1959
1958
1957
1956
1955
1954
+-.----.---+-.-.---. ..----
f----.---..
-+-------.-j----+--
0' co
,.
\0 Lt
-.
-34-
Three distinctions were made in order to interpret the response to this
question: the influence of the Supreme Court in general, the impact of the de-
cision itself, and the impact of other events were differentiated.
The Supreme Court is a powerful segment of the political machinery of
the United States government , participating in the process of political decision-
making, though removed in important ways from the contamination of partisanship,
and able to confer legitimacy on major social changes.13 The
inviolate authority
of the Court was reflected, during Franklin D. Roosevelt s second term as Presi-
dent , in the reluctance of public opinion to sanction an alteration of the Courtdespite general support for the New Deal policies that were being thwarted by the
Court. 14 Direct evidence of the prestige of the justices themselves comes from
NORC' s 1947 and 1963 studies of occupational prestige, in which Supreme Court
justice was rated as the occupation with most prestige from a list of ninety oc-
cupations. 15 The combination of these indicators lends credence to the theorythat a Supreme Court decision, from the very fact that it emanates from the Court
will elicit a considerable sentiment of approval. As a highly prestigious source
of opinion, decisions of the Supreme Court should, independent of their content
result in a high measure of public acceptance,
While it is thus highly probable that actions of the Supreme Court will
favorably influence public opinion, one cannot discount the possibility of re-
actionary effect. Two sources suggest this possibility: An early report on the
effects of question wording concludes that a question stating that " a law must
be changed in order to carry out a specified policy immediately creates a certain
amount of opposition on the part of many people who would otherwise be in favor
of the adoption of such a pOlicy.17 While the examples cited in support of this
statement may not be relevant to our question , they do introduce a cautionary
note to our otherwise optimistic assessment of the nature of the Supreme Court
influence on public opinion. Further doubt is cast by an even more telling
Robert A. Dahla National Policy-MakerBlack The People and the
Decision-Making in a Democracy, The Supreme Court asJournal of Public Law , 1958 Q, 279-95; Charles L.Court (New York: Macmillan , 1960),
Frank V. Cantwell
, "
Public Opinion and the Legislative Process, AmerPolito Sci. Rev" 1946, , 924-35.
Robert W, Hodge, Paul M. SiegelPrestige in the United States , 1925-1963,286-302.
and Peter H. Rossi
, "
OccupationalAmer, J. Sociol ., 1964, (November),
This is inferred from experimental evidence of the influence of " com-municator credibility. " See, for example, Carl I. Hovland, Irving L. JanisHarold L. Kelley, Communication and Persuasion (New Haven: Yale UniversityPress , 1953), pp. 19-48.
17 Hadley Cantri 1 Gauging Public Opinion (Princeton:
sity Press
, '
1947), p. 43.Princeton Univer-

-35-
source-- a Gallup poll that asked
, "
In general , what kind of a rating would you
give the Supreme Court-- excellent , good , fair, or poor?" Ten per cent answered
excellent 11 33 per cent
, "
good " 26 per cent , IIfair , II 15 per cent , IIpoor " and
16 per cent had no opinion,18 In
other words , approximately equal proportions
were favorable to or critical of the Court, While actual data were not reported
the release in question notes that the South is most critical , with about twice
as many saying that the Court is fair or poor than saying that it is good or ex-
cellent. There is , then, some reason to believe that attitudes toward Supreme
Court decisions will not be characterized by unqualified approval , and that
there are likely to be significant differences among population groups in the
way the Court is seen.
The 1954 decision, by virtue of the ensuing publicity and the expected
far- reaching effects on major population groups , could be anticipated to havehad a direct effect on public opinion, If the influence of the Supreme Court
is found to be mainly in the direction of encouraging approval of its actions
then it follows that this particular decision should also have been received
with favor, The model of change implied here is a simple, sequence-of- eventsmodel, in which alterations of opinion follow directly from a particular event.
It is necessary, in order to trace such a causal sequence, to have a prior mea-
sure of public opinion on the issue in question. Thus we would need data on
public reactions to desegregation, or opinions on the desirability of desegre-
gat ion immediately before the Court decision was handed down. Although such an
initial bench mark is missing from our data , an attempt will be made to trace
the probable relationship among events.
Ideally, a study describing the impact of events on opinions should try
to duplicate the conditions of an experimental situation. This means not only
having a measure of opinion prior to the event in question, but also controlling
for the influence of extraneous factors.20 Since
, in this case, there is no way
of preventing possible contamination, and no method of evaluating the releyance
or direction of influence of extraneous variables , we can only infer that the
decision itself should elicit approval.
But what guidelines can be used to select other influential factors?
For example, will public knowledge that some southern communities have subverted
the decision lead to a hardening of opinion , wi fu a majority in favor of imple-menting the decision, by a show of force if necessary? Or will obstinacy on the
part of the South lead to general discouragement and a feeling of futility? Will
AIPO release , August 30 , 1963.
For a fuller discussion , see Mildred A. Schwartz
, "
Survey Research andthe Study of Change" (Chicago: National Opinion Research Center, 1965), p. 22.
0p, cit ., pp. 13-15, 22.
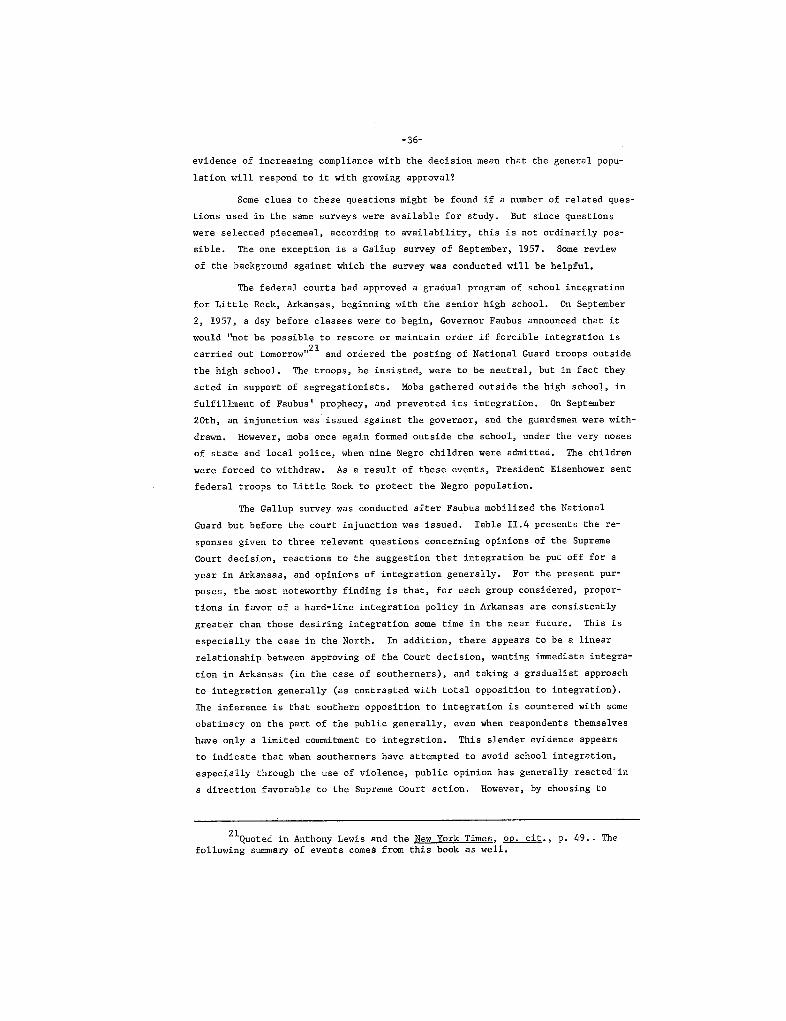
-36-
evidence of increasing compliance with the decision mean that the general popu-
lation will respond to it with growing approval?
Some clues to these questions might be found if a number of related ques-
tions used in the same surveys were available for study. But since questions
were selected piecemeal , according to availability, this is not ordinarily pos-
sible. The one exception is a Gallup survey of September, 1957. Some reyiew
of the background against which the survey was conducted will be helpful.
The federal courts had approved a gradual program of school integration
for Little Rock, Arkansas, beginning with the senior high school. On September
, 1957, a day before classes wer to begin, Governor Faubus announced that it
would "not be possible to restore or maintain order if forcible integration iscarried out tomorrow
2l and ordered the posting of National Guard troops outside
the high school. The troops , he insisted, were to be neutral , but in fact they
acted in support of segregationists, Mobs gathered outside the high school , in
fulfillment of Faubus ' prophecy, and prevented its integration. On September
20th , an injunction was issued against the governor , and the guardsmen were with-
drawn. However, mobs once again formed outside the school, under the very noses
of state and local police, when nine Negro children were admitted. The children
were forced to withdraw. As a result of these events , President Eisenhower sent
federal troops to Little Rock to protect the Negro population.
The Gallup survey was conducted after Faubus mobilized the National
Guard but before the court injunction was issued. Table 11. 4 presents the re-sponses given to three relevant questions concerning opinions of the Supreme
Court decision, reactions to the suggestion that integration be put off for a
year in Arkansas, and opinions of integration generally. For the present pur-
poses , the most noteworthy finding is that , for each group considered , propor-
tions in favor of a hard-line integration policy in Arkansas are consistently
greater than those desiring integration some time in the near future. This isespecially the case in the North. In addition, there appears to be a linear
relationship between approving of the Court decision , wanting immediate integra-
tion in Arkansas (in the case of southerners), and taking a gradualist approach
to integration generally (as contrasted with total opposition to integration).
The inference is that southern opposition to integration is countered with some
obstinacy on the part of the public generally, even when respondents themselves
have only a limited commitment to integration. This slender evidence appears
to indicate that when southerners haye attempted to avoid school integration
especially through the use of violence , public opinion has generally reacted in
a direction favorable to the Supreme Court action. However, by choosing to
Quoted in Anthony Lewis and the New York Times OP. cit ., p. 49. - The
following sumary of events comes from this book as well.
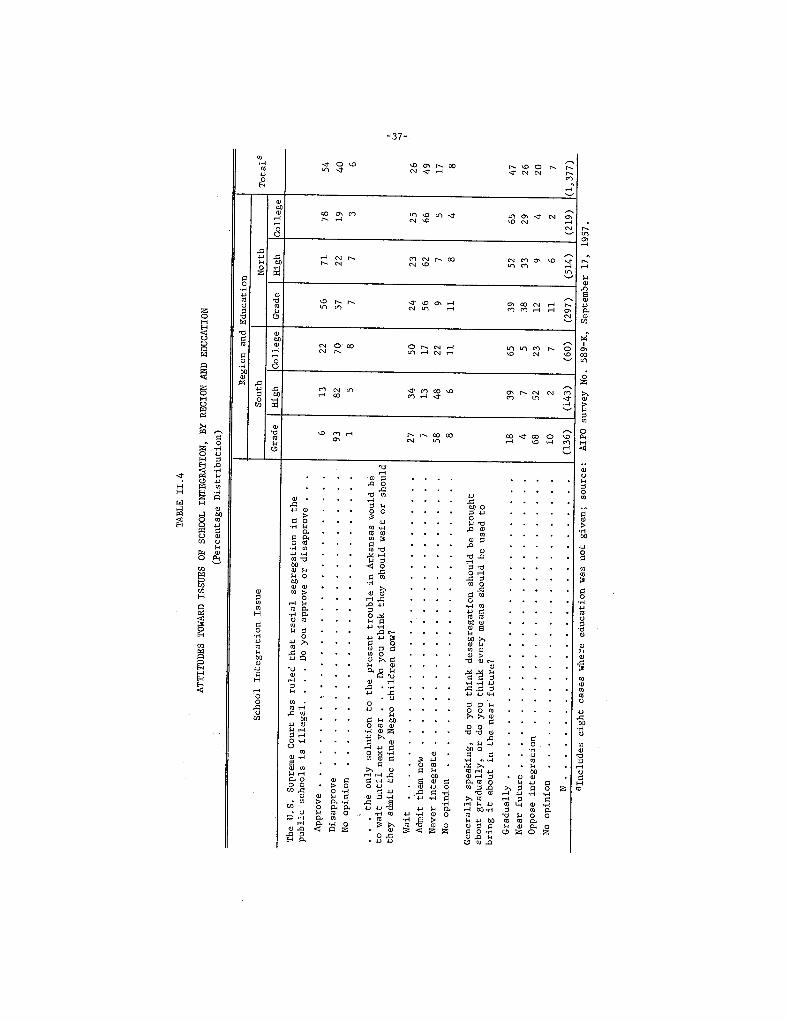
TA
BL
E I
I.
ATTITUDES TOWARD ISSUES OF SCHOOL INTEGRATION, BY REGION AND EDUCATION
(Percentage Distribution)
School Integration Issue
The U, S. Supreme Court has ruled that racial segregation in the
public schools is illegal. . . . Do you approve or disapprove
App
rove
.D
isap
prov
eN
o op
inio
n
the only solution
to wait until next year
they admit the nine Negro
Wai
t
. . .
. .
Admit them now
Never integrate
No opinion
to the present trouble in Arkansas would be
. . Do you think they should wai t or should
children now?
Generally speaking, do you think desegregation should be brought
about gradua lly, or do you think every means sh
ould
be
used
tobring it about in the near future?
Gra
dual
ly.
Near future
Oppose integration
No opinion
alncludes eight cases where education was not given; source:
(136
)
Region and Education
Gra
de
Sout
h
Hig
hC
olle
ge
(60)
(297
)
Gra
de
(514
)
Nor
thH
igh
Col
lege
(143
)(2
19)
AIPO survey No. 589-K, September 17, 1957.
Total a
377
)

-38-
introduce only those events related to school questions, we may well be over-
looking significant variables bearing on such opinions.
A closer look at the findings reported in Table 11, 4 leads to some nagging
suspicions about the accuracy of our predictions. Compare the question on the
Supreme Court with the one on integration generally. If we combine the categories
of "gradually" and "near future" for the latter question, we find a larger propor-
tion who felt that integration should eventually take place than who approved of
the Supreme Court decision. The amount of difference is shown in Table 11.
TABLE 11. 5
DIFFERENCES BETWEEN PER .CENTS FAVORING
EVENTAL INTEGRATION AND APPROVING OFSUPRE COURT DECISION
(Differences in Direction ofFavoring Integration)a
Education South North
Grade school or less +16 +21
High school +23 +14
College +48 +16
Derived from Table 11,
The table also shows clearly that southerners with a college education are more
accepting of the inevitability of school desegregation than are other whites
living in their region. This implies that the Court decision has increased the
feeling that integration will come about , no matter what delaying tactics are
used. But it lays open to question our previous assumption that the decision
would itself elicit public approval. There may exist a fairly widespread feeling
that the Court made a decision that is unfortunate but is part of the law of the
land, and that it is absurd to think that the law can be resisted successfully
over any period of time.
This rather lengthy discussion of the probable effects of the Supreme
Court decision on public opinion , and the probable impact of related events , pro-
vides a framework for viewing opinion trends. Some expectations about how trends
should move, the sources of these expectations , and the very real difficulties in-volved in tracing possible influences on the direction of trends , have been made
explicit, The trend da.ta are presented in Table II. 6, along with brief capsulesof important events , selected because of their direct relation to education (with
the exception of the 1957 Civil Rights Act) and because they received broad coyer-
age by the mass media. As has already been suggested, the Court decision did not
result in a high level of nationwide approval. But relatively tangential evidence
indicates that it did have some impact on public opinion. In the 1950 Roper
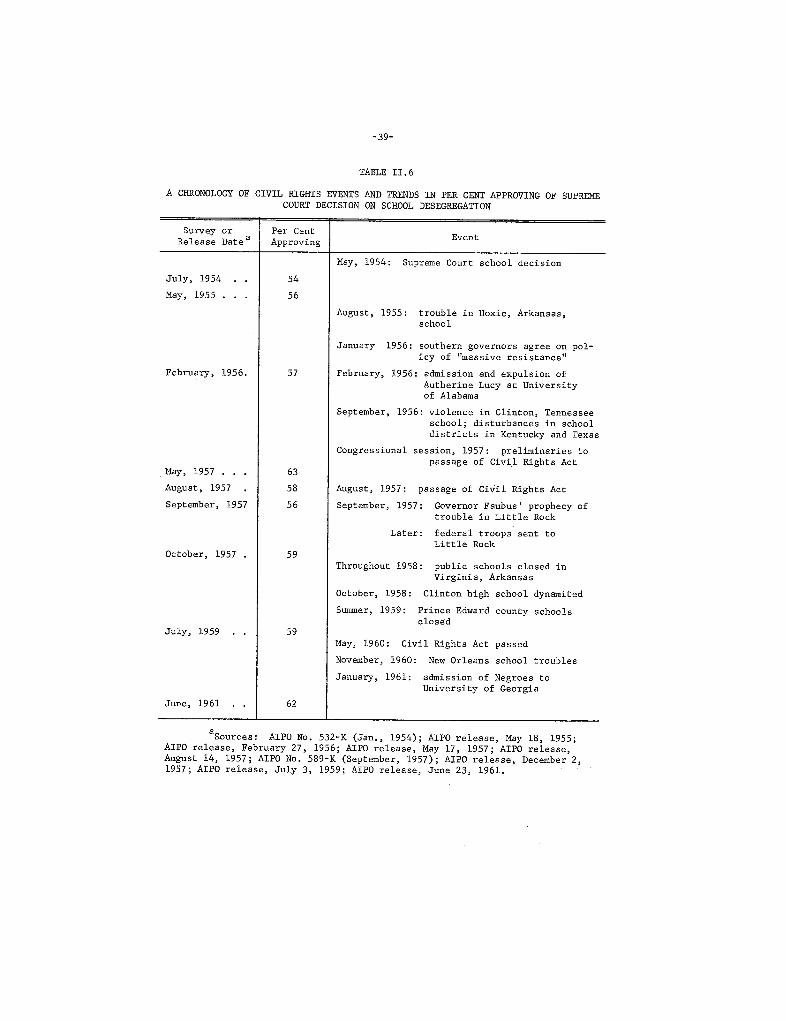
-39-
TABLE II. 6
A CHRONOLOGY OF CIVIL RIGHTS EVENTS AND TREDS IN PER CENT APPROVING OF SUPREMECOURT DECISION ON SCHOOL DESEGREGATION
SurveyorRelease Date
Per CentApproving Event
May, 1954: Supreme Court school decision
July, 1954
May, 1955 . .
August , 1955: trouble in Hoxie , Arkansasschoo 1
February, 1956.
1956: southern governors agree on pol-icy of "massive resistance II
February, 1956: admission and expulsion ofAutherine Lucy at Universityof Alabama
January
September, 1956: violence in Clinton , Tennesseeschool; disturbances in schooldistricts in Kentucky and Texas
Congressional session, 1957: preliminaries topassage of Civil Rights Act
May, 1957 , .
August , 1957
September , 1957
August , 1957: passage of Civil Rights Act
September, 1957: Governor Faubus ' prophecy oftrouble in Little Rock
Later: federal troops seut toLittle Rock
October , 1957 .Throughout 1958:
October , 1958:
Sumer , 1959:
public schools closed inVirginia , Arkansas
Clinton high school dynamited
Prince Edward county schoolsclosed
July, 1959May, 1960: Ciyil Rights Act passed
November, 1960: New Orleans school troublesJanuary, 1961: admission of Negroes to
University of Georgia
June , 1961
Sources: AIPO No. 532-K (Jan. , 1954); AIPO release , May 18 , 1955;AIPO release, February 27, 1956; AIPO release , May 17, 1957; AIPO releaseAugust 14, 1957; AIPO No. 589-K (September , 1957); AIPO release , December 21957; AIPO release , July 3, 1959; AI PO release, June 23, 1961.

-40-
survey previously referred to , 41 per cent of respondents indicated that they
favored integrated schools everywhere in the country. In the next year for
which we have comparable information, 1956, about 49 per cent of the white popu-
lation said that white and Negro children should go to the same schools. These
results give some indication of the initial impact of the 1954 Court de-
The prevailing opinion climate seems to have been less favorable to
surveycision:school integration than it was to the Court decision. This is true at a later
period as well -- in 1956 , Gallup found 57 per cent approving the decision, com-
pared to the NORC finding of 49 per cent favoring integration that year.
The data on this Supreme Court decision as a factor influencing the favor-
ability of opinions, however , do not account for the fluctuations over time seen
in Table II, Overall , there has been a slight , but fairly regular , increase
in public approval of school desegregation. Some increase may be due simply to
growing compliance to a Court decision with revolutionary effects on American
society. Although the prestige of the Court alone may not have been sufficient
to carry with it large- scale public support , the impact of the decision on so-
ciety, over time, has helped to convince some of the doubtful and to produce a
cumulative effect.
Results from one survey to the next , while never dropping below the level
of approval recorded in 1954, do drop from the high of 63 per cent in May of 1957.
In two surveys conducted later that year, approval dropped a total of 7 percentage
points. There is no ready explanation for the rise between February, 1956 and
May, 1957 or for the decline noted in August and September of 1957. The events
we chronicled in 1956--massive resistance and the expulsion of Autherine Lucy
from the University of Alabama-- either occurred or received publicity early in
the year, They probably served to keep opinion measured in February at a con-
servative level, In September of 1956, there was some violence at Clinton High
School in Tennessee, under the instigation of John Kasper , but the community
resistance to agitation was soon demonstrated through the vigorous action of its
leaders. 22 Ten months later Kasper and his supporters were tried and convictedby a Knoxville , Tennessee court. This evidence of southern willingness to stand
up to a segregationist agitation may have led to an increase in receptivity to
school integration. For the rest of 1956, coverage of racial unrest by the mass
media was not so extensive, since newsworthy events were occurring on the inter-
national scene , notably the Suez crisis and the Hungarian uprising. When Gallup
interviewers asked a national sample to indicate the most important problem cur-
rently facing the nation, only 18 per cent mentioned civil rights, compared to
46 per cent who cited the threat of war , the Suez situation , and foreign policy,
Lewis op cit , pp. 37-42.
AIPO release, September 28 1956.

-41-
These crises may have served to deflect attention from racial problems and to
consolidate approval for domestic policies in the face of external threats.
August , however, civil rights issues were again back in the news, as the new
Civil Rights Act became law, The September survey, conducted after Faubus had
called in the National Guard in a move inflamatory of civil unrest , showed a
96 per cent public awareness of the troubles in Little Rock. This focus of at-tention on unrest , occurring even before the national publicity given to the
second attempt at integration in Little Rock and the subsequent entry of federal
troops , may have had a depressing effect on favorable opinions, In October , whenfederal troops were mobilized, approval of the Court decision rose by 3 per cent
perhaps reflecting increased public confidence that violence would not go un-
checked.
Obviously these attempts to trace a connection between events and opin-
ions are , at best , tenuous. The fluctuations are quite small and could easily
be due to sampling variability or to the context in which the questions were
asked. But if they do have a significance , some rationale for connecting them
with the social milieu has at least been suggested. Moreover , the long- rangetrend to approval of the Court decision , while not pronounced, lends some credi-
bility to the interrelations traced here. Clearly, none of this can be taken as
an effective demonstration of the connections between events and opinions in the
sense of the quasi- experiments or sequence-of-events models of change introducedat the outset of this discussion.
Much more impressive, from the point of view of clear- cut findings , is
evidence of regional and educational differences in opinions, Such data are
available for two points in time: June, 1954 and September, 1957. (See Chart
11. 6 and Appendix Table 3. ) As we would expect , both studies show a great differ-ence in the views of northerners and southerners, The difference between the most
approving southerners (those with a college education) and the least approving
northerners (those with a grade school education or less) was 23 percentage
points in 1954 and 34 points in 1957, During this time, the trend in the South
was to a decline in approval, especially among the cOLlege educated, and to a
slight increase in the North , most noticeable for those with a high school educa-
tion. Little Rock , then, may have been especially important in convincing south-
erners that the Supreme Court ruling permitting federal government intervention
in the education of their children was very ill-advised. If anything, it had
just the contrary effect on high school-educated northerners,
Would You Want Your Own Children.
. .
Myrdal' s critical observations of American society led him to conclude
that Americans experience a basic ambivalence between society as it should be--
incorporating the values of the founding fathers-- and society as it is--functioning

K6J Cent
201
liH'"
NG
.-
Gallup Poll 532-K, June, 1954
Gallup Poll 589-K, Sept., 1957
CHART II.
PER CENT APPROVING OF SU
PRE
CO
UR
T
DECISION RULING SCHOOL SEGREGATION
ILL
EG
AL
(Distribution by Region and Education)
SH 8
... -
-..
NG
=no
rthe
rn g
rade
NH=northern high
NC=northern college
SG
=so
uthe
rn g
rade
SH=southern high
SC=southern college
I- J
- I-
t-
\, \.
\, \.
Ln
V1
Ln
Ln
()
l' Y'
'i i
Yea
r

-43-
with actualities of day-to-day existence, In a test of some of Myrdal' s assump-
tions , Frank Westie asked respondents a series of questions , one set dealing withgeneral values and the other with specific issues. 24 The general and specificstatements dealing with education are especially pertinent. Ninety- eight per
cent of the sample agreed with the general statement
, "
Children should have equal
educational opportunities. Seyenty-nine per cent said
, "
I would not mind having
Negro children attend the same school my children go to. While there was a high
level of agreement with both statements , the difference of 19 per cent is statis-
tically significant. Both Myrdal' s generalizations and Westie ' s limited researchthen, suggest that it would be worthwhile to consider the difference in responses
to questions dealing with normative ideals and those dealing with personal be-
havior.
Between 1954 and 1963, Gallup asked several questions about attitudes
toward the attendance of the respondents ' own children at schools with Negro
children. The questions are not completely comparable , but they do permit some
comparisons. In 1954 the question
, "
Would you object to having your children
attend a school where the majority of pupils are Negroes?" was asked of all
white respondents , regardless of whether or not they had school- aged children.In 1958 and 1963, however, the questions were addressed only to those with chil-
dren at school. In order to achieve some measure of comparability, the 1954
question was tabulated only for those with children under twenty- one years of
age and living in the same household with respondents. Fifty-five per cent of
these said that they would object; 41 per cent said that they would not; and the
remainder gave qualified answers or had no opinion,
In 1958 and 1963 Gallup asked the following series of questions of re-
spondents with children in grade or high school: "Would you , yourself , have any
objection to sending your children to a school where a few of the children are
co lored?" If the answer was " " respondents were then asked this in terms of
. . . where half of the children are colored?" If the answer wa.s still "
they were asked
, "
. . . where more than half of the children are colored? ,,
We have tabulated the results by using the numbers with children in school as
the percentage base for all parts of this question. As Table 11, 7 indicatesthe proportions with no objection to their children attending integrated schools
shrinks noticeably as the number of Negroes in the school increases. In 1963
for example, 76 per cent had no objection if there were only a few Negroes , but
only 25 per cent would not object if more than half of the children were Negro.
Frank R. Westie
, "
The American Dilemma:Sociol. Rev ., 1965 (August), 531,
There is some evidence that interviewers did notin excluding respondents who , according to specificationsthese questions.
An Empirical Test Amer
exert scrupulous carewere not to be asked

-44-
TABLE II. 7
WHITE PARENTS WITH NO OBJECTION TO THEIR OWN CHILDREN ATTENDING SCHOOL WITHNEGRO CHILDREN, DEPENDING ON THE NUMBERS OF NEGROES IN THE SCHOOL
(Per Cent by Region and Education)
Region and Education
Proportion Negro South North Total
Grade High College Grade High Co 11ege
1958
Few are colored
Ha if are co lored .
More than half arecolored
(38) (73) (13) (114) (311) (69) (618)
1963
Few are colored
Half are colored.More than half are
colored
(109) (172) (70) (237) (639) (192) 419)
percentages were calculated individually for each question asking re-sponses to specified proportions of Negro children. The base used for calculat-
ing the percentage for each question is the number with children presently inelementary or high school.
Source AIPO No. 604-K, September , 1958; AI PO No. 673-K, May, 1963.
This relationship holds true in both 1958 and 1963 and in both the North and the
South. Normally, a lack of objection to having one s own children attend inte-
grated schools is associated with higher levels of education. But differences
between regions are more striking than those between educational leyels. While
the college- educated are more amenable to integration in both regions , the great-
est contrast between the college educated and the remainder of the population
exists in the South, As a result , cross- regional differences tend to be rela-tively less great among those with some college training. The sharpest differ-
ences between groups occurs in the South , in response to questions on children
school attendance with a few .Negro children. In other words , resistance to even
token school integration , if it involves the respondents ' own children , remains
adamant unless there has been some exposure to coilege education. In 1958 , for
example, 61 per cent of college-educated southerners had no objection to integrated
745-
schooling if there were only a few Negroes, compared to 19 per cent of those
with a grade school education having no objections.
In Charts 11. 7 and 11. , we have shown differences between the 1954 and
1963 data in terms of regression lines.27 The
data were derived from questions
asking about a majority, or more than half , Negro fellow students. There ap-
pears to be a slight trend to a dropping- off in lack of objections to having
one s own children in the company of a majority of Negroes , and this is true
for almost all subgroups. These results are open to some question , since the
1954 question is not identical to those asked in later years , and, more impor-
tant , the population to which the question was addressed is not the same. De-
spite our attempt to overcome this latter difficulty by using as our percentage
base in 1954 only those known to have children between the ages of five and
twenty-one living at home , some distinction may still exist. Despite the lackof full comparability of 1954 figures with those of 1958 and 1963, results for
these last two years also show a slight but consistent downward trend. There, however, no trend in the amount of difference found between regions and edu-
cational levels,
The trend to declining personal acceptance of school integration is
clear- cut for all groups except the college educated in both regions. In the
case of the college educated , opinions are not particularly linear for the three
measures available to us. Aside from the possibility of a greater sensitiYity
to changes in question wording among the bet er educated, the data suggest no
reason for this difference.
Regardless of the degree of credence lent to the foregoing results , they
do provide some interesting contrasts. Most notably, they indicate that the
normative push toward school integration is still stronger than personal willing-
ness to participate in school integration. The trends to increasing favo.rabil-ity to school integration as a desirable goal and to decreasing willingness to
send one s own children to integrated schools is especially intriguing. The onlyexplanation I would suggest is that exposure to the very real problems of inte-
grated education have made more parents unwilling to risk the problems involved
for their own children, This sentiment is by no means confined to the white
population, and especially not to the white liberals excoriated by militant civil
rights workers. For example, in a recent controversy about the expansion of public
high school facilities , middle-class Negroes resident in the integrated Hyde Park
While only thirteen college- educatedin 1958 , the same difference is found in 1963found.
southerners had children in schoolwhen a more adequate sample was
27 Actual data on which Chart 11, 8 is based can be found in Appendix
Table 4,

80. , Per Cent
7ot
;6cj
SO-
3oi
: Sta
ndar
d! S
tand
ard
: Err
or o
f: E
rror
of
Est
imat
el
-1.52 1.35
: 1.423
53.
20j-
Sour
ces
Gallup Poll 532-K, June, 1954
Gallup Poll 604-K, Sept., 1958
Gallup Poll 673-K, May, 1963
1,d
CHART II.
LEAST SQUARS TREND LINE IN PER
CE
NT
WIT
HNO OBJECTION TO SENDING OWN CHILDREN TO A
SCHOOL WITH A MAJORITY OF NEGROES
1954
-196
3
(Total Respondents)
J):
t- i-
..
i- I-
1- J-
I- t-
1.
\. \.
\0 \0
\0
1.
Ln
V1
Ln
Ln 0
"0'
L
n \0 a J-
(\ W
---.
---
---.
. I

Per Cent
CHART II.
LEAST SQUARES TREND LINES IN PER CENT WITH
NO OBJECTION TO SENDING OWN CHILDRE TO A
SCHOOL WITH A MAJORITY OF NEGROES, 1954-1963
(Trends by Region and Education)
I Sta
ndar
d! S
tand
ard
Region and
Edu
catio
n; E
rror
ofi
Err
or o
fj E
stim
ate
I NG
=no
rthe
rn g
rade
74,
-2.
NH=northern high
74.
-2.
NC=northern college
84.
-1.4
71.
92
12.
. SG
=so
uthe
rn g
rade
30.
-1. 39
i SH
=so
uthe
rn h
igh
24. 4
6 I
-0.
1.17
! SC
=so
uthe
rn c
olle
ge27
.-0
.1.
14
Sour
ces
Gallup Poll 532-K, June, 1954 (respondents with
children ages 4-21 years)
Gallup Foil 604-K, S
ept.,
195
8 (respondents with
Gallup Poll 673-K, May, 1963
children in school)
NH
,
NC
- No-
".. .. .. ..
".. "
.. "
.. "
.. -
.. "
.. "
.. "..
Slr-
""
.: -.: -.: -. -.
: - - -
- -
- -
- -
- -
I Ir-
I- I-
j-
1- t-
t- t-
\0 \0
\0
\0 \0
\0 \0
\0 \0
In 1l
1. Ln
O\ 0
\0'
+: lJ
Cj ""
() \0
0 t-
N
Yea
r

-48-
comunity of Chicago frequently aligned themselves with their social- class con-
freres across racial lines.
Suma ry
As befits the importance of the issue of integrated education, this
chapter has covered a wide variety of topics , ranging from perceptions of the
educability of Negroes to willingness to send one s own children to predominant-
ly Negro schools. It is hardly necessary to repeat the findings for these ques-
tions. But a number of clearly established response patterns are worth noting
again.
In light of the history of the United States, it is hardly surprising
that we find major differences in the outlooks of those living in the South as
compared to the remainder of the country. But the consistency and range of opin-
ion differences are surprising. For example, out of seventeen repeated questions,
almost half show a difference of at least 40 per cent between North and South , a
far greater difference between population groups than normally measured by opin-
ion surveys, From the available questions , it is also clear which issues are
associated with the greatest difference of opinion. Beliefs about Negro intel-
ligence and personal preferences about school integration reveal relatively fewer
regional differences. In the case of intelligence, this is due to sharply in-
creasing beliefs, in both regions, that Negroes are as intelligent as whites.
Preferences on sending one s own children to schools where Negroes are in a ma-
jority is not a welcome prospect anywhere , and residents of both North and South
reveal a declining acceptance of this possibility. The sharpest regional divi-
sions relate to the desirability of sending white and Negro children to the same
schools and to the Supreme Court decision on school desegregation.
A step-like progression in the proportions favorable to Negro civil
rights emerges from an examination of educational groups within and between re-
gions. While there are some exceptions, it is usual for favorability to increase
with education, first in the South and then in the North. In other words, south-
erners with grade schooling or less generally have the smallest proportion accept-
ing progress on civil rights. At the opposite extreme are the college-educatednortherners. In all the trend questions we have examined, while college- educatedsoutherners usually appear to be the most tolerant in their region, they still
fall behind the least tolerant northerners , those with only grade schooling or
less.
An exception to the step like pattern described above occurred in ques-
tions on intelligence. There the inclination was for those with high. school edu-
cation or less to believe most often that Negroes have the same intellectual ca-
pacity as whites. This may well be a consequence of experience. Since there are

-49-
fewer college educated in the population than those with less schooling, and
since there is some tendency to equate intelligence with education, the college-
educated respondent is less likely to be exposed to Negroes at his educational
level. Those with less schooling are more likely to find Negroes with similar
training and consequently to assume that Negroes are their intellectual equals.
None of this , of course , says anything about the validity of either yiew.
Despite the existence of educational variations in outlook by region
each region displays considerable solidarity across educational lines. The one
major exception emerges in the responses to questions on school integration.
Whether or not white and Negro children should go to the same school sharply di-vides all population groups , first regionally, and then according to respondents
own educational levels. This seems to indicate public recognition of the crucial
nature of a problem not yet resolved-- advisability of in egra ed versus separate
schools.
CHAPTER III
HOUSING OPPORTUNITIES
Recognition of Need
The likelihood that Negroes will have access to good schools and to a
diversified job market is inseparably related to the area in which they live.
As in the case of schools and other public facilities , the concept of "separatebut equal" housing is , for the most part , a myth. The ability of Negroes to en-
joy adequate housing is largely conditional on their having equal access to the
available property.
For a long time it was possible for most white people to ignore Negro
housing conditions since the numbers of Negroes living outside the southern
states was small. The first sizeable migration northward , and westward, began
during World War I , when, as the southern economy underwent changes displacing
Negro farm labor, new .occupational opportunities opened outside the South. Highvisibility did not occur until World War II and its aftermath when, by 1960 , 40
per cent of all Negroes were living outside the South, Along with this change
in regional distribution has come an even more drastic change toward urbaniza-
tion, In 1910, 73 per cent of all Negroes were living in rural areas; in 1960
73 per cent were in urban area This complete transformation in urban- ruralresidence patterns has been accompanied by a heavy population concentration in
the central cities of a relatively few large metropolitan areas.
Concern with the limited opportunity for Negroes to find other than over-
crowded and run down dwellings might , then, be expected to rise with this new
distribution of the Negro population. The importance of segregated housing, both
as a correlate of other kinds of segregation and as a concomitant of less than
adequate housing, is only recently becoming of critical priority for the civil
rights movement, Only recently did Martin Luther King, for example, divert his
energies from ore pressing concerns to directly tackle housing problems in the
urban North , beginning with Chicago, Rank- and-file Negroes , when asked to assessthe relative importance of various civil rights , assigned the lowest priority to
housing, Perhaps it is not surprising, then, that national samples of the white
philip M. Hauser
, "
Demographic Factors in the Integration of NegroesDaedalus , 1965 (Fall), 847-77.
See above , Chapter 1 , Tables 1, 1 and 1,
'-51-

-52-
population have almost never been asked questions on the need for changes in
Negro housing opportunities. But , in keeping with other responses to questions
on Negro aspirations , we could well anticipate that whites would , at least in
expressed opinion , turn a sympathetic eye to the plight of the Negro householder.
The little evidence we do have comes first from an NORC survey conducted
in May, 1944. The sample, composed entirely of whites , was asked: "Do you thinkanything should be done about making it possible for Negroes to have better hous-
ing than most of them have now?" Sixty-nine per cent answered "yes " 22 per cent
" and the remainder had no opinion. Positive concern was related to respon-
dents ' education and regions of residence , with college education and northern
residence both associated with a higher incidence of concern. Yet even in the
case of groups characteristically least interested in Negro claims for equality--
southerners with less than college training--a majority felt that steps should
be taken to improve Negro housing. The data are shown in Table 111. 1, Those
who replied that something should be done were then asked for their suggestions.
Most of the coments which followed were based on a sympathetic assessment of the
Negro s plight. Forty-one per cent of the suggestions mentioned improvementthrough government housing projects , and 36 per cent thought that housing stan-
dards could be improved through laws. Relatively few of those who felt that
something should be done about Negro housing put the onus for the existing hous-
ing problems on Negroes themselves. Only about 5 per cent of the suggestions
mentioned that the solution lay in some form of continued segregation of Negro
housing.
TABLE II1. 1
OPINIONS OF WHETHER ANTHING SHOULD BE DONE TOIMPROVE NEGRO HOUSING
(Percentage Distribution--White Respondents)
Improvement ofRegion and Education
Negro Housing South North
Grade High Co llege Grade High College
Something should be done
Nothing should be done
No opinion/qualified
(247) (230) (144) (671) (830) (391)
NORC Survey No. 225 , May, 1944.
Further recognition of the needs for improved housing may well exist , but
these have not been tapped by public opinion polls. One additional, but sketchy
piece of evidence comes from a survey conducted in 1963. The sample was restricted
-53-
to residents of Minnesota , a state where the ratio of Negroes to whites in 1960
was 1 to 151. Given the limited exposure of most whites to the problems of
Negroes, it is still of some interest to see how Minnesotans responded to the
issue of housing discrimination. Asked
, "
Do you think Negroes in Minnesota gen-
erally are treated fairly or unfairly when it comes to buying homes or renting
apartments?" 47 per cent answered
, "
unfairly, " and 33 per cent
, "
fairly. " Inthe Twin Cities area , where most of the Negroes live , 59 per cent believed treat-
ment was unfair. While this question is somewhat tangential , it does indicate
white awareness of the limited housing opportunities for Negroes. In sum, how-
ever, the amount of data available is far from adequate, despite the pressingnature of housing problems.
Acceptability of Negro Neighbors
An awareness that Negroes do not enjoy adequate housing facilities and
do not have equal access to the housing market is probably fairly widespread.
But when Negro housing rights are presented in terms of accepting Negro neigh-
bors , a new issue is raised. To begin with, evidence of contrasting values
toward these issues is revealed in a study by Frank Westie. At one point inhis interview, Westie postulated
, "
Under our democratic system people should be
allowed to live where they please if they can afford it. Sixty per cent agreed
with this statement , and 34 per cent disagreed. But at a later point , when the
same respondents were presented with the statement
, "
I would be willing to haye
a Negro family live next door to me, " only 38 per cent agreed, and 54 per cent
disagreed. This turnabout in views is indicative of the threat that many
whites feel in the face of more intimate contacts with Negroes as compared to
their general willingness to accede to the legitimacy of Negro wants. Housing,
along with the education of children, remains a peculiarly emotional issue, In
the case of housing, home ownership in particular is evaluated as a fundamental
right of Americans and anything that would threaten its value, b it financial
or symbolic , elicits a violent reaction. Numerous cases of panic reactions to
the movement of Negroes into previously all-white areas , despite the lack ofevidence that such Negro homeowners or tenants will depreciate property values
lend substance to our characterization of potential contacts with Negro neigh-
bors as a highly emotional issue. The issues at stake are succinctly presented
by one informant in a recent study of integrated neighborhoods:
Minnesota Poll , September, 1963.
Frank R. Westie
, "
The American Dilema:Rev ., 1965 (August), 532.
Luigi Laurenti Property Values and Race (Berkeley:California Press, 1960),
An Empirical Test 1I Amer. Soc
University of
-54-
No matter how liberal you think people are, no matter what pledge
cards they sign or organizations they join, a funny thing comes
over them when they hear that the first Negro family is going tomove into their neighborhood. Some of them get scared. In thiscase Ii. e., of the comunities in question), not of the color ofthe skins-- ve had every shade of skin in our pool for yearsand years. Plenty of all- races parties and friends here. Ittheir investment , their equity, They see themselves robbed of avaluable piece of property.
Questions from national samples on the acceptability of Negro neighbors
have been worded in terms of contact next door , on the same block, or in the
same neighborhood. Most of the questions asked by NORC have focussed on the
block context. Once in 1942 , once in 1956 , twice in 1963 , once in 1964 , and
once in 1965 NORC asked the question: If a Negro with the same income and
education as you have , moved into your block, would it make any difference to
yoU?11 As seen in Chart 111. , there has been a steady growth in the proportion
of whites who answered that it would make no difference or who had some definite
positive response to this eventuality. By 1956 a small majority was of this
view , and the proportion had increased to two-thirds by 1965. In other wordsNegroes of the same social- class background are increasingly acceptable to amajority of the population, despite expectations of the prevalence of sentiments
of exclusiveness.
Trends found for the total white population apply, though less evenly,
to the six subgroups upon which we have been focussing. They are shown as re-
gression lines in Chart 111. , and the percentage distribution is given in
Appendix Table 5. While the 1942 data are not available for subgroups , data
from 1956 through 1965 indicate that the sharpest rise in favorability occurred
among the college educated. In both regions , the college educated have become
increasingly differentiated from their less well- educated regional counterparts.
This does not , of course, gainsay the considerable significance of regional dif-
ferences even among the college trained.
Most studies show the most racially prejudiced group to be those with a
grade school education or less. In this case, however, it is southerners with
a high school education who are most reluctant to accept Negroes as neighbors.
A marked upsurge in opinions favorable to neighborhood integration occurred
among this group in 1963, according to our survey, but since then the move has
been away from this position. It may be that the high school- educated southern-
er has made the greatest relative investment in a move to an all-white neighbor-
hood, and consequently reacts most negatively to the possibility of change,
the South , although segregated areas have long existed , it has not been unusual
for Negro and white housing to be intermixed and differentiated only by the type
Seymour Sudman and Norman Bradburn Social Psychological Factors inIntergroup Housing (Chicago: National Opinion Research Center, 1966), p, 86.
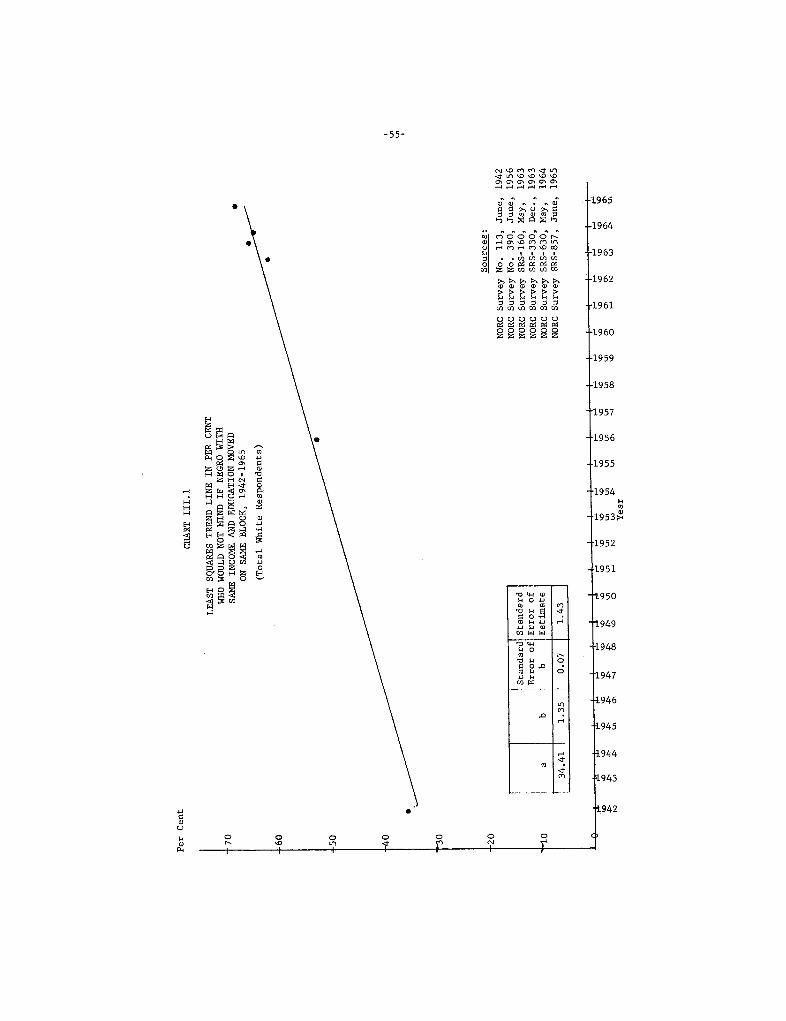
Per Cent
CHART III. 1
LEAST SQUARES TREND LINE IN PER CENT
WHO WOULD NOT MIND IF NEGRO WITH
SAM
INCOME AND EDUCATION MOVED
ON SAM BLOCK, 1942-1965
(Total White Respondents)
Sour
ces
NORC Survey No.
113, June
1942
NORC Survey No.
390, June,
1956
St a
nda
rdNORC Survey SRS-160, May,
1963
Error of
NORC Survey SRS-330, Dec"
1963
NO
RC
Sur
vey
SRS-
630, May,
1964
NORC Survey SRS-857, June
1965
34.
1.35
1.43
,l
,! ,l
.J ,l
,! ,!
,! ,!
,! ,!
,! ,!
,! ,!
,! ,!
,! ,!
\0 \0
\0 \0
\0 \0
\0 \0
\0 \0
\0 \0
\0 \0
\0 \0
\0 \0
\0 \0
.p .p
.p .p
Vi \
J \J
lr L
n V
1 \J
VI lJ
l. Q
' Q
' 0\
0'
0\
U' 0\
..
OJ \0
0 J
- N
Lo
.p \J
Q' .. (X
\0 0
J-
N
.p
Yea
r

80 Per Cent
NORC Survey
NORC Survey
NORC Survey
NORC Survey
NORC Survey
Sour
ces
No, 390
SRS-
160
SRS-
330
SRS-
630
SRS-
857,
CHART II1.
LEAST SQUARES TREND LINES IN PER CENT WHO WOULD NOT MIND IF
NE
GR
O W
ITH
SA
M .
ED
UC
AT
IQN
AN
D IN
CO
ME
MO
VE
D O
N S
AM
BLO
CK
,19
56-1
965
(Trends by Region and Education)
June
, 1956
May
, 196
3D
ec"
1963
May
, 196
4Ju
ne, 1965
Stan
dard
Stan
dard
Reg
ion
Error of
Error of
Est
imat
e
I NG
=no
rthe
rn g
rade
37
,1.
42NH=northern high
34.
1.58
I NC
=no
rthe
rn c
olle
ge
28.
1.23
SG=southern grade
23.
1.13
1.51
SH=
sout
hern
hig
h18
.1.
12i S
C=
sout
hern
cO
llege
11.1
6
e, .- :.
-- -
,;-
SC
"" -
- -
-"'- -
- --
- -
- --
- -
- --
--
---
-- -
- --
- -
- -
l l
\0 \0
\0 \0
\0 \0
\0 \0
\0
l. lJ
U1
VI
0\
0\ 0'
"" ()
\0
..
(' W
Yea
r
-57-
of house and accoutrements, But with the recent growth of suburbs around south-
ern cities, patterns formerly more characteristic of the North have been repeat-
, with all-white suburbs the rule. It might be anticipated, then , that when
those with a high school education moye into such suburbs , the high costs in-
volved would be sufficient to produce great anxiety about maintaining the segre-
gated character of the neighborhood, Although this possibility cannot be demon-
strated from the data , it seems a reasonable conjecture, Nevertheless , it is
striking that , by 1965, only high school- educated southerners varied from the
majority to whom Negro neighbors would "make no difference. In the North , be-
tween 1963 and 1964, there was a tendency for those with college training to be
most tolerant of Negro neighbors. But by 1965 this view had spread to other
educational levels , and only minor differences existed among northerners accord-
ing to the extent of their schooling.
In 1948 and again in 1949,7 questions Dn neighborhood composition were
asked in two Roper surveys, In both cases respondents were presented with a
list of eight racial , religious and national groups, among which Negroes were
included. The general question first asked was
, "
Would you prefer not to have
any of these kinds of people move into your neighborhood to live , or would it
make no difference to you?" All those who expressed some prejudice were then
asked
, "
Which kinds of people would you prefer not to move into your neighbor-
hood? Any other?" While this study has no interest in any groups other than
Negro , we should make clear that Negroes were mentioned about twice as frequent-
ly as any other group. Results for the second question asked in consecutive
years are similar, Using as the percentage base only those who had expressed a
prejudice against all eight groups listed in the first question, we find that
92 per cent in 1948 and 91 per cent in 1949 preferred not to have Negroes move
into their neighborhood. If the total sample is used as a base , then anti-Negro
feelings were expressed by 62 per cent in 1948 and by 42 per cent in 1949, The
first set of percentages clearly shows that respondents who indicated that they
did not wish to live among diverse groups were objecting mainly to Negroes. The
crease in anti-Negro feelings for the total sample , from 1948 to 1949, is , un-
fortunately, not as easy to account for. A similar drop was found for two re-lated questions asked in the same surveys--one on job contact and the other on
inviting Negroes home for dinner. Since no plausible reason for these changes
is suggested by the events of the time , it seems likely that they were effected
by the context in which questions were asked and by possible changes in the
sampling frame, For these reasons , we hesitate to compare the Roper findings
with those from NORC surveys. Otherwise, responses to the possibility of Negroes
vey No.Opinion
Roper Fortune Survey No, 69, September , 1948, and Roper Commercial Sur-
, October, 1949. Tabulations were made by the Roper Center for PublicResearch.

-58-
in the same neighborhood might have been expected to be similar to responses on
Negroes in the same block.
Finally, there are some scattered data on the acceptability of Negroes
as next-door neighbors. The first available item is a question by NORC , asked
in May, 1944: "Would it make any difference to you if a Negro family moved in
next door to you?" Of the total sample of whites , 69 per cent said it would
make a difference and 22 per cent said it would not. In both North and South
educational differences between respondents were minor; the critical differences
were regional ones. As would be expected, northerners were more open to the
possibility of Negro neighbors than were southerners , but still no more than
one-quarter felt that it would make no difference.
Although the questions are not completely comparable, published results
from two Louis Harris surveys , which were part of a series on contact with Ne-
groes, indicate that in 1963, 51 per cent of respondents said they would object
to having Negroes as next-door neighbors , and in 1965, 37 per cent would object.
These yaried data show that there has been a trend to growing acceptance
to Negro neighbors , but they cannot readily be compared to each other, Not only
are the questions worded differently, but the proportions favorable to Negroes
are not always given. Questions dealing with Negroes living on the same block
and in the same neighborhood probably suggest similar situations to most respon-
dents. But questions about having Negroes as next-door neighbors refer to a
form of contact that immediately suggests the possibilities of greater social
intimacy as a result of proximity, and there is likely to be more resistance to
this.
Responses to Negro Neighbors
The preceding questions dealt with white attitudes to Negro housing. The
data reveal increasing acknowledgment of Negro problems and a growing willingness
to at least tolerate Negro neighbors. What should now be considered are issues
more closely related to the actual behavior of whites in this area. While ex-pressed sentiments of comiseration or of tolerance may indicate increasing
sympathy to Negroes , actual behavior may be quite different. Our data do not
provide direct measures of behayioral reactions to the integration of previously
all-white areas. But responses to a series of questions discussed below do give
us at least a rough measure of probable behavior under such circumstances.
There has always been considerable sentiment in favor of formal or in-
formal ways of restricting the freedom of Negroes to live where they please.
In 1939 , Roper asked the following question: Do you think Ithat) (a) there
The Harris Survey, published in the Washington Post , October 18, 1965.
-59-
should be laws compelling Negroes to live in certain districts; or (b) there
should be no laws , but there should be an unwritten understanding, backed up by
social pressure, to keep Negroes out of the neighborhood where white people live;or (c) Negroes should be allowed to live wherever they want to live , and there
should be no laws or social pressures to keep them from it?" Only 13 per cent
thought that Negroes should have the right to live wherever they wanted. Forty-one per cent wanted legal restrictions on housing, and 42 per cent wanted un-
written understandings. 9
In a 1963 survey, NORC aBked white respondents their reactions to a
series of statements about Negro-white relations. One- quarter of the respon-
dents strongly disagreed with the statement
, "
White people have a right to keep
Negroes out of their neighborhoods if they want to, and Negroes should respect
that right. " While lines were less sharply drawn in 1963 than in 1939 , a ma-jority still agreed, either strongly or slightly, that whites had a right to
restrict the movement of Negroes in the housing market.
We have no data on population differences for the 1939 question, but
in 1963 there were sharp distinctions .between regions and educational levels.Regional opinion differences are not uncomon and have been found whenever datawere differentiated by region. What is unusual is the extent of difference
among educational levels in the North. For example , Table 111. 2 shows the con-
trast between northerners with college training and those with only grade school
education or less. Sixty per cent of the former group disagree that whites have
a right to keep Negroes out of their neighborhoods, while 68 per cent of the
latter group agree with this statement, In this instance , also, the least prej-
udiced group in the South--educated southerners-- expressed opinions at leastcomparable to some segments of the North , namely, grade school- educated north-
erners.Despite the growth of favorability to the aspirations of Negroes , then
there remain strong attitudes of defensiveness against a perceived threat to the
integrity of white housing, This defensiveness is strongest among the least edu-
cated, who presumably also have the smallest monetary inyestment in housing.
Perhaps housing represents a much greater share of their total income than it
does for the prosperous college- educated group. Moreover, the possibility of a
Negro influx may well seem much more likely in their neighborhood than in higher-
priced areas.
Data from the 1939 question show that , Americans were even then not es-pecially eager for legal protection against integration of their neighborhoods.
Roper Fortune Surveysample of 5, 146 respondents.Opinion Research.
No. , September, 1939. Results are based on aData were tabulated by the Roper Center for Public
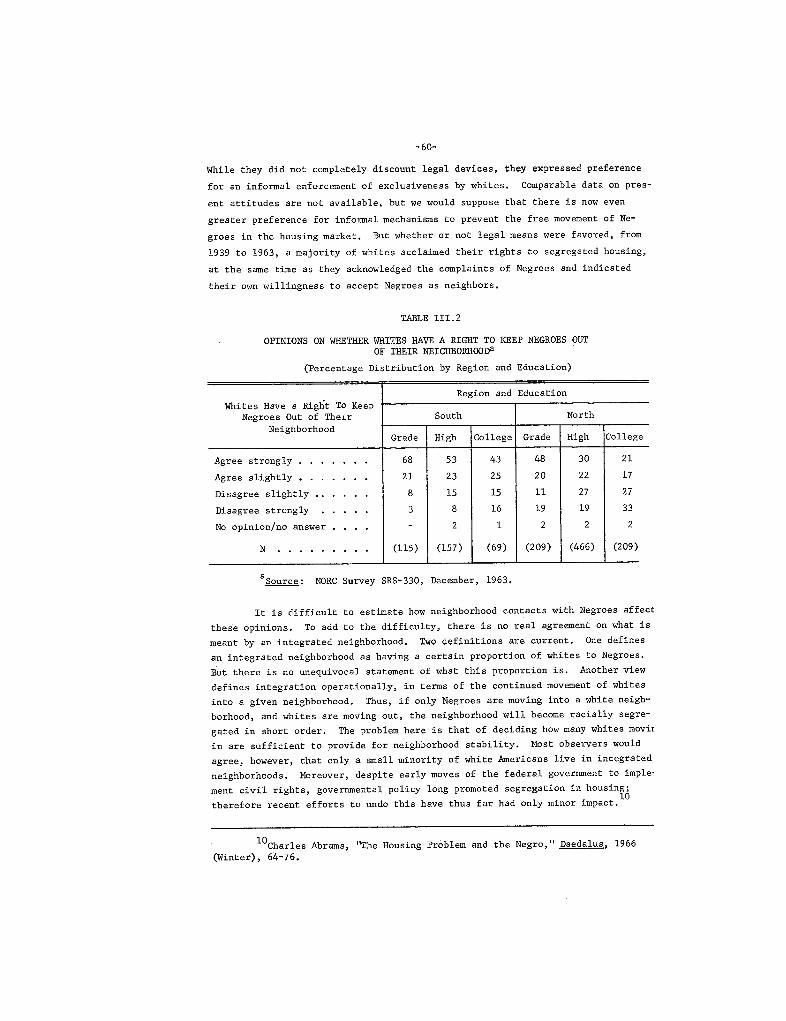
-60-
While they did not completely discount legal devices , they expressed preference
for an informal enforcement of exclusiveness by whites. Comparable data on pres-
ent attitudes are not available, but we would suppose that there is now even
greater preference for informal mechanisms to prevent the free movement of Ne-
groes in the housing market. But whether or not legal means were favored, from
1939 to 1963 , a majority of whites acclaimed their rights to segregated housing,
at the same time as they acknowledged the complaints of Negroes and indicated
their own willingness to accept Negroes as neighbors.
TABLE II1. 2
OPINIONS ON WHTHER WHITES HAVE A RIGHT TO KEEP NEGROES OUTOF THEIR NEIGHBORHOO
(Percentage Distribution by Region and Education)
Region and Education
Whites Have a Right To KeepNegroes Out of Thelr South North
NeighborhoodGrade High College Grade High College
Agree stronglyAgree slightly.Disagree slightly..Disagree stronglyNo opinion/no answer
(115) (157) (69) (209) (466) (209)
Source NORC Survey SRS-330 , December , 1963.
It is difficult to estimate how neighborhood contacts with Negroes affect
these opinions. To add to the difficulty, there is no real agreement on what is
meant by an integrated neighborhood. Two definitions are current. One definesan integrated neighborhood as having a certain proportion of whites to Negroes.
But there is no unequivocal statement of what this proportion is, Another view
defines integration operationally, in terms of the continued movement of whites
into a given neighborhood, Thus , if only Negroes are moving into a white neigh-
borhood, and whites are moving out , the neighborhood will become racially segre-
gated in short order. The problem here is that of deciding how many whites moviI
in are sufficient to provide for neighborhood stability. Most observers would
agree, however, that only a small minority of white Americans live in integrated
neighborhoods. Moreover, despite early moves of the federal government to imple'
ment civil rights , governmental policy long promoted segregation in housing;
therefore recent efforts to undo this have thus far had only minor impact,
Charles Abrams, "The Housing Problem and the Negro Daedalus , 1966(Winter), 64-76.

-61-
The transformation of all-white neighborhoods into all-Negro ones can
take place rapidly, when white residents panic or are frightened by the activ-
ities of unscrupulous realtors. ll Although none of the surveys we are dealingwith provides evidence of such behavior , there are two interesting items of re-
lated information. Results are shown in Table 111. 3, and indicate that , while
only a minority of white Americans were living on the same block as Negroes in
1965 , a considerably larger proportion had done so in the past.
also indicative of the growing housing segregation in the South.
The data are
Formerly, when
status differences between whites and Negroes were unequivocal , there was little
danger of status loss for whites from proximity to Negroes. In addition, it had
been customary in the South for servants to live in alleys and byways close to
whi te mansions. But recently-burgeoning suburbs in the South , as well as in the
North , have provided exclusive havens for white residents. We can then inter-
pret the greater past experience of living close to Negroes as reflecting differ-
ent kinds of housing patterns. While our data neither confirm nor deny thisinterpretation, it is also likely that some of the previous contacts provided
the impetus for movement away from a neighborhood.
TABLE II1. 3
HAVE YOU YOURSELF EVER HAD A NEGRO FAMLY LIVING ONTHE SAM BLOCK AS YOU? a
(Percentage Distribution by Region and Education)
Region and EducationNegro Family Lived
South Northon Same Block
Grade High College Grade High CollegeYes live there now
Yes, used to
, never.
N . (101) (157) (86) (205) (480) (258)
Source NORC Survey SRS-857, June , 1965.
Our second item of information on actual behavior is even more limited
in scope. It comes from a study of St. Louis , primarily designed to discover
For evidence from a number of comunities see , Eleanor Leacock, MartinDeutsch and Joshua Fishman Integration in Suburban Housing (New York: Anti-Defamation League, 1965); Eleanor Caplan and Eleanor Wolf
, "
Factors AffectingRacial Change in Two Middle Income Housing Areas Phylon, 1960 (Fall),225-33; Eleanor Wolf
, "
The Invasion- Succession Sequence as a Self-FulfillingProphecy, Journal of Social Issues , 1947, 7-20.

-62-
concerns about air pollution. Since these concerns were plotted in relation
to a number of other community problems, the relative importance of racial prob-
lems with respect to housing can be assessed. The question posed was
, "
Have you
ever moved from one neighborhood to another because of any of these problems?"
. ,.
(a) Recreation areas and programs? (b) Unemployment? (c) Air pollution?
(d) Race problems? (e) Garbage and refuse collection and disposal? (f) Juvenile
delinquency?" Responses given by whites ranged from less than 1 per cent for
garbage disposal to 9 per cent for race problems, The frequency with which re-
maining problems were mentioned was 6 per cent for unemployment , 4 per cent for
air pollution, 3 per cent for juvenile delinquency, and 2 per cent for recreatin.
Slight differences among educational levels of those who mentioned race
problems as a causative factor were noted. Nine per cent of those with grade
schooling or less , 10 per cent of those with high schooling, and only 5 per cent
of those with a college education felt that race problems had been the cause of
their moving. While it cannot be argued that St, Louis is a typical example , an-
swers to these questions give a rough indication of how residents of a large ur-
ban community respond to Negro neighbors. We have, of course , no idea of the
nature of the problem. For some, it may have been simply the one or two Negrofamilies moving in. Others may have objected not so much to the migration of
Negroes but rather to changes in the racial composition of the schools to which
they sent their children. Still others may have associated their new Negroneighbors with an increase in crime, especially crimes of violence. But whatever
the nature of the race problem, by 1963 for at least one city, relatively few re-
spondents said that race per se had led them to move, Yet race emerged in this
study as the most prominent cause of white migration away from a particular lo-
cale,
Probable responses to Negro neighbors have been tackled most directly by
two Gallup questions, both asked in September of 1958 , in May of 1963, and in
May of 1965. The first of these was
, "
If colored people came to live next door
would you move?" Between 1958 and 1963, there was almost no difference in the
proportions who said they would not move under these circumstances, By the time
of the 1965 survey, however, there had been a 10 per cent increase in those will-
ing to accept Negro next-door neighbors, the proportion rising from 55 to 65 per
cent. The results can be plotted along a trend line, as in Chart 111. 3, but
they do not fit a straight line too well , as shown by plotting the actual find-
ings, But available measures are few and the time spanned is short. Probably
most noteworthy is the similarity in trends between this question and the NORC
Public Administration and Metropolitan Affairs Program, Southern Illi-
nois University, "Public Awareness and Concern with Air Pollution in the St,Louis Metropolitan Area Research and Information Monograph: Report No. RI-3March , 1964. Data come from NORC Survey No, 472,
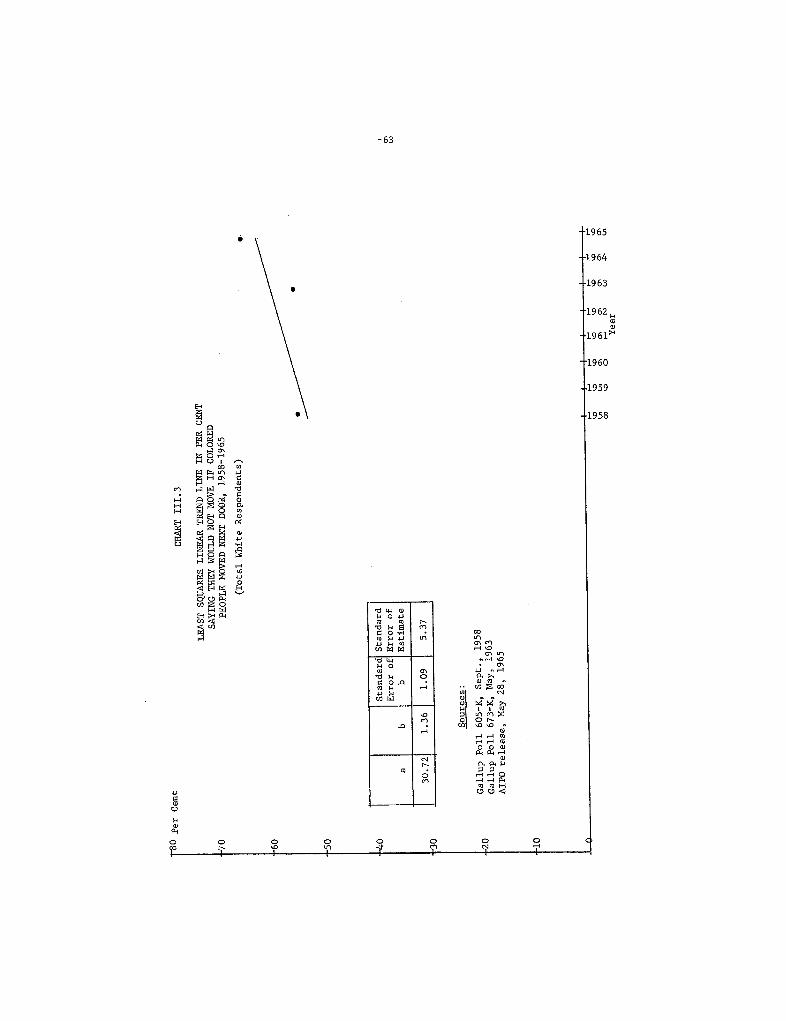
o Per Cent
CH
AT
III
,
LEAST SQUARES L
INE
R T
RE
D L
INE
IN
PER CENT
SAYING THEY WOULD NOT MOVE IF COLORED
PEOPLE MOVED NE DOOR, 1958-1965
(Total White Respondents)
Stan
dard
Stan
dard
Error of
Error of
Est
imat
e
30. '
71.
361.
09'3
0
Gallup Poll 605-K, Sept" 1958
Gallup Poll 673-K, May, 1963
AIPO release, May 28, 1965
.. \0
'"
.. N
Yea
r

-64-
question shown in Chart 111. , on whether it would make a difference if Negroes
came to live on the same block, Both question forms apparently derive from a
single attitude dimension-- a general willingness to accept one or more Negro
neighbors who , extrapolating from the NORC question , would . be likely to be simi-lar to the respondent in socio- economic status,
For the 1958 and 1963 questions , data on region and education are shown
Chart III.4. While this chart is based on the actual percentage distribution
of responses , Appendix Table 6 has been constructed to facilitate reading the
results. The distribution of responses reported in Chart 111. 4 differs from the
more customary pattern of response revealed in Chart 111. There , North andSouth remained divided, while differences between educational groups were most
distinct in the South. In the North , the grade and high school educated were
quite similar, Of course , these results are based on regression equations rath-er than on raw data , and this undoubtedly introduces some distortion. But check'
ing the standard errprs and the actual data show that , in fact , there is little
distorting effect except in the case of high school- educated southerners , where--
in the 1963 and 1964 surveys-- respondents were less favorable to integrated hous-
ing than was predicted, In response to the question of possible reactions toNegro next-door neighbors , however, the pattern is quite erratic, For example
between the two time periods , college- educated northerners increased their ac-
ceptance of Negroes but the high school- educated northerners decreased in ac-
ceptance. Responses of high school- educated &outherners remained unchanged , butthe college trained increased quite sharply in favorability to Negro neighbors.
In yiew of the unevenness of opinion changes , the lack of comparability to Chart
111, 2 and divergence from the customary step-like pattern of trends across region-
al and educational lines , data in Chart 111. 4 seem especially questionable.
We have only one possible explanation for some of the unevenness , pri-
marily the low level of approval among college- educated southerners in 1958.
The context in which the question was asked may have influenced results sincethe immediately preceding question was
, "
Do you approve or disapprove of marri-
ages between white and colored people?" Racial intermarriage is a highly emo
tionally charged issue, and one to which even those otherwise favorably disposed
to Negro aspirations respond with disfavor. Attitudes toward intermarriage were
found to be the second lowest ranking item on an eight-item scale, ranking from
most to least favorable. 13 In the 1958 Gallup study in question, attitudes toward
intermarriage were even more extreme. Almost every respondent interviewed in theSouth disapproved of Negro and white intermarriage. Feelings in the North were
Donald J. Treiman, I1Statu Discrepancy and Prejudice 11 Amer, J gociol.1966 , 11 (May), 651-64. The analysis was based on NORC Survey SRS-330, December1963.
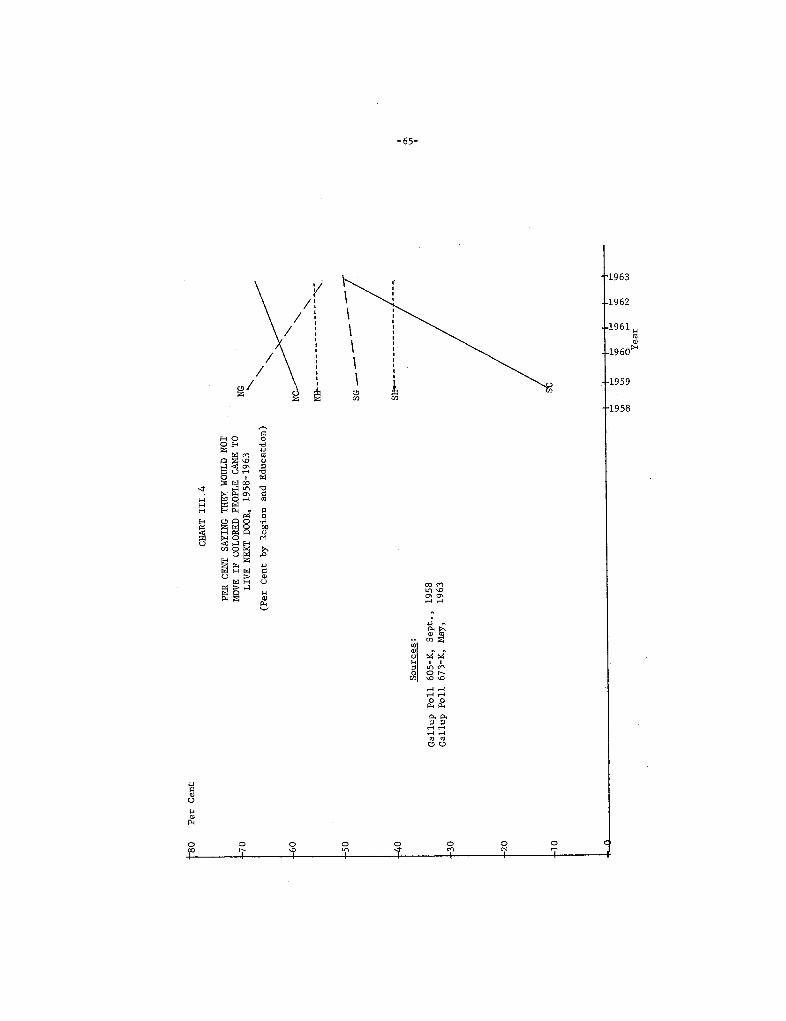
Per Cent
CHART III.
PE
R C
EN
SA
YIN
G THEY WOULD NOT
MO
VE
IF
CO
LO
RE
D P
EO
PLE
CA
M T
OL
IVE
NE DOOR, 1958-1963
(Per Cent by Region and Education)
Gallup Poll 605-K, Sept., 1958
Gallup Poll 673-K, M
ay, 1
963
NH
--
----
- --
-- -
---
-
SG .-
,. '" a-
Yea
r

-66-
not much different , with 95 per cent of those with less than college education
disapproving and 77 per cent of the college trained opposed to intermarriage.
In the light of such widespread disapproval it is not surprising, then, that
feelings about intermarriage might have spilled over to feelings about Negroes
as next-door neighbors. The 1963 question was not asked in a completely neutral
context , but the questions preceding it were more neutral , related ones aboutsending children to schools in which there were varying proportions of Negro stu-
dents. This contextual explanation is not offered as conclusive, since it is not
clear why it should have affected some groups more than others , and why it should
even appear to have contrary effects on some groups , the more favorable
attitudes of the high school- educated northerners in 1958 than in 1963),
The second direct question on probable behavioral responses , asked on
the same three Gallup surveys , was, "Would you move if colored people came to
live in great numbers in your neighborhood?" While here too, as shown in Chart
111. 5, there is a moderate trend to increasing acceptability of even large num-
bers of Negro neighbors , less than one-third of the white respondents held this
view by 1965. There are, again, only two points in time when data are availablefor regional and educational subgroups. (See Chart 111. 6 and Appendix Table 7.In neither region is there a distinct trend to increased favorability to Negro
neighbors, College-educated northerners emerge as the most favorable. Attitudesin the South are probably fairly stable , despite a noticeable increase in accep-
tance of Negroes among the college educated. But , as in the question on a Negro
next-door neighbor , the college- educated response was at an unusually low level
in 1958 , and by 1963 was probably measured at a level closer to the norm.
Sumary
The problem of establishing adequate housing for Negroes is a pressing
national concern, Solut on of this problem is confounded by the widespread prac-
tice of residential segregation that restricts open access to the housing market,
For example , in a survey of 221 cities , it was found that in 56 per cent of the
cases , Negroes were permitted to live in only one or a few residential areas.Despite the importance of the problem, there is little available information on
the extent of public concern about Negro housing opportunities. Normative ques-tions , directed to what the state of affairs should be , are totally unavailable.Thus our discussion has been confined mainly to situations of contact with Negro
neighbors , either actual or potential.
This study was done by a research team at Cornell University in theearly 1950' s. The sample of cities was apparently biased in favor of the largenorthern cities. See Robin M. Williams , Jr., Strangers Next Door (EnglewoodCliffs: Prentice-Hall , 1964), p. 130.

o Per Cent
.70
I Sta
ndar
d
l Sta
ndar
d!! E
rror
of E
rror
of
, Est
imat
e
-3.
1.40
93 !
Gallup Poll 605-K, Sept., 1958
Gallup Poll 673-K, May, 1963
AIPO release, May 28, 1965
CHART III.
LEAST SQUARES LINEAR TREND LINE IN
PER CENT SAYING THEY WOULD NOT MOVE
IF COLORED PEOPLE C
A TO LIVE IN
GR
ET
NU
ER
S IN
NE
IGH
BO
RH
OO
D19
58-1
965
(Total White Respondents)
.. '" a-
.. N
Yea
r
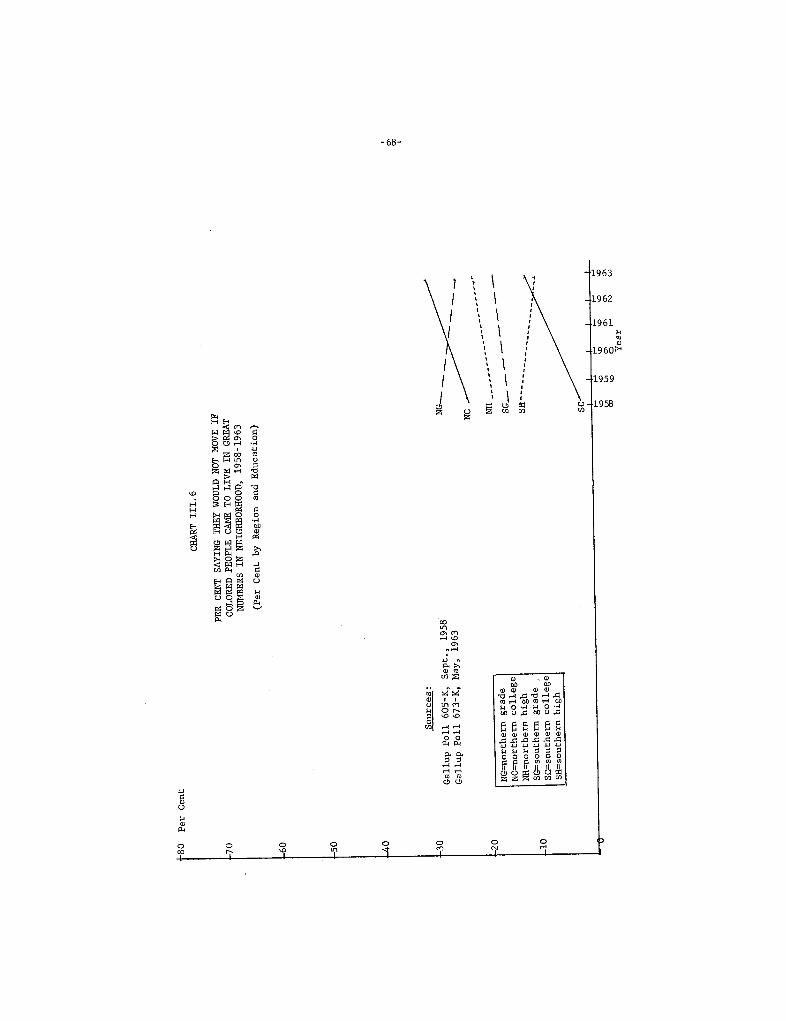
Per Cent
Sour
ces
Gallup Poll 605-K, Sept" 1958
Gallup Poll 673-K, May, 1963
NG=northern grade
northern college
NH=northern high
SG=southern grade
southern college
sout
hern
hig
h
CHART III,
PER CENT SAYING THEY WOULD NOT MOVE IF
COLORED PEOPLE C
A T
O L
IVE
IN
GR
ET
NU
ER
S IN
NEIGHBORHOOD, 1958-1963
(Per Cent by Region and Education)
NC
-N
H -
SG_
,. '" a-
Yea
r

-69-
The public opinion data we examined revealed that there is a growing
willingness to accept Negro neighbors with similar socio- economic characteris-
tics. The potential acceptability of Negroes even extends to next-door neigh-
But resistance to the possibility of living among large numbers of Negroesbors.remains widespread.
As was the case of educational issues, the major differences of opinion
on housing integration were found to have a regional origin, differentiating
southerners from the rest of the nation. No evidence of a trend to declining
differences between North and South was uncovered.
In the preceding chapter on education , a step-like pattern in the dis-
tribution of responses most favorable to Negro rights was reyealed, Withinregions , beginning in the South, increased education was normally associatedwith greater proportions accepting Negro claims to equality. A similar pattern
was displayed in the questions on housing, but with considerably greater vari-ability. Most notably, high school-educated southerners proved most resistant
to accepting Negro neighbors, Other divergences from the usual pattern were de-scribed, but these were less easy to account for.

CHAPTER IV
VIEWS OF DISCRIMINATION IN OTHER ARES
Job Opportunities
is sues?What should be the priority criterion in a discussion of civil rights
In our examination of education and housing, up to this point we have
been guided primarily by what are known to be important issues both to whites
and Negroes, and by the public opinion data available. But in considering trends
in opinions. about jobs for Negroes, a disappointing lack of material was encoun-tered. This is especially unfortunate because of the importance of equal jobopportunities to Negroes. As was shown in Tables 1. 1 and 1, , Negroes inter-
viewed in two NORC studies assigned top priority to job opportunities. The
acuteness of the Negro job problem is emphasized by unemployment. While the un-
employment rate among whites in non-farm industries was 4. 6 per cent in 1960 , itwas 8. 3 per cent for non-whites. 1 The meagreness of data on which the followingdiscussion is based can hardly be attributed to lack of salience. It is probably
due more to the perspective of the white comunity. Unlike other issues that wehave discussed in some detail , many whites are not directly affected by equal em-
ployment opportunities. If only from the viewpoint of our objective--to trace
trends in white opinions we must conclude that this lack of white interest has
been unfortunate.
Perception of discrimination --Perception of the inequities which Ne-
groes suffer in the job world is not especially widespread. In 1944, when
whites were asked Do you think Negroes have the same chance as white people
make good living in this country?" 50 per cent answered in the affirmative and
41 per cent in the negative. Later in the the focus wa shiftedsame survey,directly to jobs , and the question asked was
, "
Do you feel that Negroes in the
United States have just as good a chance as white people to get 1i kind of job?"Twenty-one per cent thought that they did, and 71 per cent thought that they did
not. In other words, a considerably larger majority thought that Negroes hadequal chances for earnings than thought that they had equal job opportunities,
Daniel Patrick Moynihan
, "
Employment , Income, and the Ordeal of theNegro Family, Daedalus , 1965 (Fall), 749. While reference is to non-whitesthere is evidence that the unemployed among this group are mainly Negroes, anything, Negro unemployment rates are probably higher than those reported.
The remainder gave qualified answers or had no opinion.from NORC Survey No. 225 , May, 1944.
Data are
-71-
-72-
A second question on job opportunities was asked in 1963, but this time in terms
of the respondent s community rather than the country as a whole. Forty- threeper cent of respondents replied that Negroes had as good a chance as whites to
get any kind of job , but 48 per cent thought that they did not. Additional in-formation comes from a 1964 survey of white Californians , in which the question
asked was
, "
Do you feel that Negroes are denied job opportunities in California?"
In this instance , 33 per cent felt that Negroes were denied opportunities, and
53 per cent said that they were not.4 On
the basis of the last three questions
some trend away from perception of job inequalities can be detected. At presentthe majority of the white comunity is of the view that job opportunities for
Negroes are equal to those for whites. Comparatively more whites were perceptive
of the inequalities faced by Negroes in education and housing. It is difficult
to say how accurately the public generally evaluates the restrictions on full
participation by Negroes in the labor market , especially since considerable prog-
ress in removing barriers to participation has been made through legislative and
educational efforts, Perhaps the ethic of the desirability of hard work , and
the belief that rewards will automatically follow , prevent many whites from un-
derstanding the limited job opportunities of Negroes.
Regional and educational breakdowns are available only for the two ques-
tions asked in 1944 (see Table IV, l), While they do not permit any further an-
alysis of trends , these data do allow us to compare differences in response to
the two questions. In both regions , increased education goes along with in-
creased awareness of Negro disadvantages. Only the college educated recognize
that Negroes have fewer opportunities to earn a good living, and this is especi-
ally prominent in the North. As might be expected from the overall results
much larger proportions of all groups perceive that Negroes have limited job
opportunities. Perception of such limitations appears to be strongly affected
by the educational level of respondents, so that differences are greater within
regions than among educational groups across regions. To some extent , this is
also true for the question on earning a living. The overlap in regional differ-
ences in perception of job opportunities anticipates findings reported in the
following section, where those most likely to be threatened by job competition
from Negroes are least willing to feel that Negroes should have equal job oppor-
tunities. It is this same population--the undereducated--who are also leastwilling to re ognize that Negroes do , in fact , suffer from job discrimination.
AIPO release , July 20pie, white awareness of limitedby these data.
The California Poll , May 21 , 1964.
1963. Since Negroes were included in this sam-opportunities was probably less than indicated

-73-
TABLE IV. 1
PER CENT WHO THINK NEGROES DO NOT HAVE SA OPPORTUNITIESAS .WHITE PEOPLE
Region and Education
Negro Opportunities South North
Grade High College Grade High College
Not. as good chance toearn a living
Not as good chance toget any kind of job
N . (247) (230) (144) (671) (830) (391)
Source C Survey No. 225 , May, 1944.
Differences among educational levels in the assessment of Negro oppor-
tunities point out an additional factor about the significance of perceptual
experience. The grade school educated are more likely to have direct experience
, if not personal contact with , Negroes holding jobs similar to their own.
In contrast , the college educated, who are normally employed in business and
the professions , rarely see Negroes in job situations comparable to their own.
It is not surprising, then, that they frequently evaluate the Negro s overall
economic position as inferior to that of whites , although they generally hold
more favorable opinions. The more prejudiced grade school- educated group, in
contrast, comes in contact with many Negroes who attain jobs and earnings simi-lar to their own, and their perception of Negroes as no more limited in oppor-
tunities than they are themselves is thus reinforced.
Evaluation of equal opportunitY --In 1944 , 1946, and 1963, white re-
spondents were asked to evaluate the desirability of equal job access for Ne-
groes. The question was
, "
Do you think Negroes should have as good a chance as
white people to get any kind of job , or do you think white people should have
the first chance at any kind of job?" Results are presented in the regression
line in Chart IV. l; actual distributions of responses appear on the chart as
points plotted around the regression line. In either case , a major shift in
opinions is evident in the less than twenty years spanned. During that time,
acceptance of the legitimacy of Negro claims to equal job opportunities rose
from over 40 per cent of the white population to over 80 per cent. Thus , de-
spite a persistent tendency to view the job situation more optimistically than
is probably warranted, whites are increasingly convinced that universalistic
standards should apply to job competition.
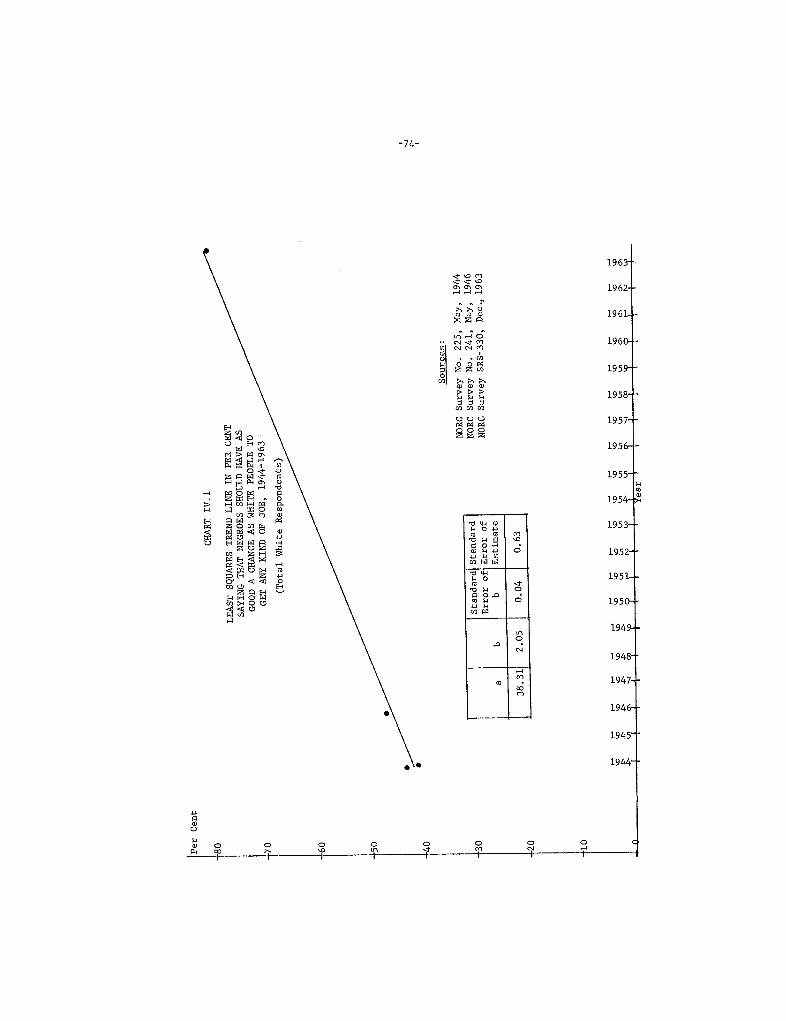
Iper Cent
,40
CH
AR
T I
V. 1
LEAST SQUARES TREND LINE IN PER
CE
NSAYING THT NEGROES SHOULD HAVE
GOOD A CHACE AS WHITE PEOPLE TO
GET ANY KIND OF JOB, 1944-1963
(Total White Respondents)
Stan
dard
Stan
dard
Error of
Error of
Est
imat
e
38.
NORC Survey No, 225, May, 1944
NORC Survey No. 241, May, 1946
NORC Survey SRS-330, Dec., 1963
j- j-
I- I-
I- ..
..
t- I
- I-
t- t-
t- I-
t- I
- I-
I: I
-
\. \.
\. \.
1. \.
\.
\0 \0
\.
\C \0
\, \.
\C \.
\.
\0 \.
+: .
. .. .
p
Ln
Ln
Ln
Ln
Ln
U1
Ln
Ln
Ln
Ln
0' 0
' 0'
J
o 4" !
'\
'f r
'f r
I' I
rear
1 T I 'f
'I 'f
r I' I
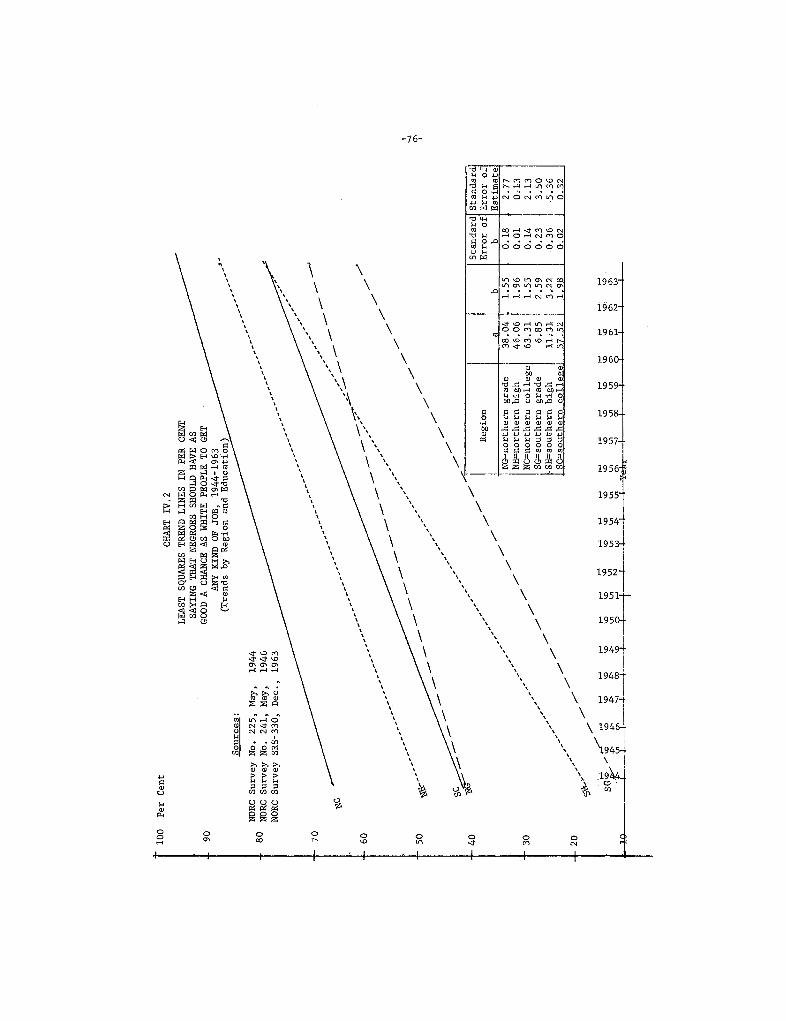
100
Per Cent
CH
AR
T I
V. 2
LEAST SQUARS TRED LINES IN PER
CE
NSAYING THT NEGROES SHOULD HAVE AS
GOOD A CHANCE AS WHITE PEOPLE TO GET
ANY KIND OF JOB, 1944-1963
(Trends by Region and Education)
--
':. -
---
--
,--
--
-- -- --
- --
,--
-- -
- -- -- ..
-- ,
-- -- --
-- -
- --
"-- ,,
-- --
-- ,
rr /
./ -"
./ ./
eg10
n
./ --
./ ./
NG
=no
rthe
rn g
rade
./
NH
=no
rthe
rn h
igh
" ././
NC=northern college
./
SG=
sout
hern
gra
de
" ./
./
SH=southern high
./
SC=southern college
./ ./
..
t- ..
..
t- ..
SG..
"\. \0
\.
\0 \.
\.
.p Ln
'" ..
'" 0
-+--
- -I.-
--I-
---I
--
-+--
.-
Sour
ces
NORC Survey No. 225, May,
1944
80 NORC Survey No. 241, May, 1946
NORC Survey SRS-330, Dec., 1963
04 l
46.
63.
11..
1.55
1. 9
61.
55
3..
1.98
.. ..
..
\0
\0
V1
Ln
Ln
'f .I
'1 Yt: 'l
l
.. ..
.. ..
.. ..
\0 \0
\.
\0 \0
\.:
1I \J
Ln
0' 0
' 0'
1"
'f'i '1
Stan
dard
Error of
Stan
dard
Error of
stim
ate

-75-
Data on trends among regional and educational groups for the three sur-
veys reported are shown in Chart IV. 2 as regression lines, and actual data are
presented in Appendix Table 8. Several interesting observations can be made on
the basis of both the table and the chart. For one thing, majorities of all
groups , including 62 per cent of the usually most prejudiced group--grade school-educated southerners--had come to accept the desirability of equal opportunity
by 1963. In the time covered by the surveys, there was also a movement to de-clining interregional differences among educational groups. This movement was
accompanied by a phenomenon not previously witnessed on trend questions--
cross- over from one region to another. For the first time in trend data , a
group in one region resembled its counterpart in another region more than it
did its regional confreres.
while beginning at a level
(39 per cent .versus 42 per
Specifically, grade school- educated northerners
slightly lower than college- educated southernerscent in favor of equal opportunity), moved to a per-
centage of favorability more like that of grade school- educated southernersthan like any other regional or educational group. While grade school- educatednortherners still favored Negroes 1 having equal access to jobs in 71 per cent
of the cases in 1963, the acceptance of universalistic criteria in the job mar-
ket had become so widespread by that time that even this high level of favora-
bility to equal rights was not sufficient to eclipse educational differences
across regions. Altogether , then, those with less than a high school educationin both North and South have become more sharply differentiated from those with
more schooling. In the earlier surveys , differences were greatest between the
college educated and the remainder, especially in the South. In 1963, however
the high school and college educated were much closer together in viewpoint,
Chart IV. 2 illustrates two themes. One is an unusually strong trend to
favoring equal job opportunities for Negroes when these are presented in norma-
tive terms. Regardless of personal feelings about Negroes , it has become in-creasingly difficult for most Americans to justify special job treatment for
whites simply on the basis of their color, The second theme is the evidence of
continuing resistance to an open job market , now confined to the minority of
those most likely to experience competition from Negroes , given the present level
of Negro training, The threat of increased competition for the segment of the
population faced with a constricting labor market was apparently a factor con-
tributing to their continual resistance to equal job opportunities,
On-the-;ob contacts --Opinions about job contacts with Negroes have not
been broadly explored, and national information is available only up to 1949.
Although sketchy, this informa ion permits some evaluation of how this issue
was viewed by the American public. In a study done during the early years of
World War II for the Office of War Information, NORC interviewers asked
, "
Sup-
pose you were working in an office or factory and a Negro were hired to work

-77-
alongside of you, would it make any difference to you?,, Of the total white sam-
pie of 3, 587 respondents , 55 per cent said that it would make no difference , 39per cent that it would make a difference, and the remaining opinions were not
ascertained, The original data for this study are no longer available , and ex-
isting tabulations do not follow the same procedures we have been using. Thesetabulations do indicate , however, that there were major differences in outlook
between the North and the South. In the North , less than 30 per cent felt that
the possibility of working with a Negro would make a difference; in the South
about 70 per cent thought that it would.
A different form of questioning was used in 1944, when the respondent
was asked to think of a situation in which a Negro would be doing the same kind
of work as he did: "If a Negro with the same training had the same kind of job
as you at the place where you worked, would it be all right with you , or wouldn
you like it?" Fifty- one. per cent answered that it would be all right , 43 percent said that they would not like it , and the remainder gave qualified answers
or had no opinion, 6 In this case responses were clearly affected by the region
of residence of respondents. Although education had some bearing on the distri-
bution of responses, respondents were differentiated by region for the most part.
Qnly one- quarter of those in the South, but just under two-thirds of those inthe North , expressed willingness to accept a Negro co-worker. In the North , this
tolerance increased with education , although the grade school educated were the
most tolerant in the South.
Two Roper questions are available , one asked in 1948 and the other in
1949 , on the kinds of people respondents would prefer not to work with. Of all
those who expressed a collective prejudice, in both years more than three-quarterssingled out Negroes as the kind of people they would find most objectionable to
work with. 7 In the years for which we have information, it appears that a small
majority were willing to accept Negro co-workers , although as the Roper surveysindicate, this acceptance was probably a grudging one and certainly did notrepresent a strong personal preference. Moreover, the roots of antipathy to
Negro fellow-workers lie in the experiences of white southerners. Northernerswho generally express more tolerant opinions, would have been considerably less
likely to have had contact with Negroes.
More current information is limited to a 1964 California poll , in which
respondents were asked
, "
If a colored person came to work next to you , would you
object?" Ninety-one per cent of the white adults interviewed said that they
NORC Survey No, 113, June, 1942.
NORC Survey No. 225 , May, 1944,
Roper Furtune Survey No. 69, September , 1948; and Roper Comercial Sur-vey No. 36, October, 1949.

-78-
would have no objection,8 It is not possible to project these findings onto theremainder of the country, but they do at least suggest that there has been a
tendency to increased acceptance of Negro co-workers.
Public Transportation
The right of free use of public transportation occasioned several dra-
matic incidents in the course of the struggle for full civil rights. In 1896 the
Ferguson decision of the Supreme Court first enunciated the "separate but
equa. doctrine. The right of recourse to the Fourteenth Amendment as a guar-
anty of free use of public transportation facilities was firmly denied. This
decision was to provide the legal basis for many subsequent claims to segregation.
The equal use of public transportation facilities provided an important
focus of civil rights activities. On December 1 , 1955, Mrs. Rosa Parks , a Negro
woman returning home from work in Montgomery, Alabama , refused to give up her
bus seat to a white man. As a result of her arrest , Montgomery, Alabama Negroesput into effect a bus boycott , and the Reverend Martin Luther King first came
to national prominence.
The Montgomery bus boycott lasted for a year and ended only when a court
ruling declaring such segregation unconstitutional was handed down. Integrationof public transportation facilities was effected surprisingly peacefully, and
relatively few incidents of violence resulted.
Segregated public transportation is unique among the issues thus far con-
sidered, in that it was confined to the South. While northern Negroes experience
discrimination in jobs , housing, and education, they have , for the most part
been able to use transportation facilities freely. As a result , northern whites
have limited exposure to this problem and thus we cannot predict how a national
sample of whites will react to questions on segregated transportation.
Opposition to segregation . --For whites generally, there has been a long-
term growth in the proportions opposed to the establishment of sections for Ne-
groes in public transportation facilities. Chart IV. 3 shows the trend line re-
sulting from regressing the per cent opposed to segregation along a time dimen-
sion, in answer to the question
, "
Generally speaking, do you think there should
be separate sections for Negroes in streetcars and buses?" In the time spanned
by the surveys, opinion shifted from less than half to over three-quarters in
favor of integrated transportation.
Invoking the prestige of the President before asking respondents ' opin-
ions, may lea.d to an unusually high rate of approval. 9 But there does not appear
The9For
(Princeton:
California Poll , Release No. 433, May 22 , 1964.
some early examples, see Hadley Cantril Gauging Public OpinionPrinceton University Press , 1944), pp 38-40.
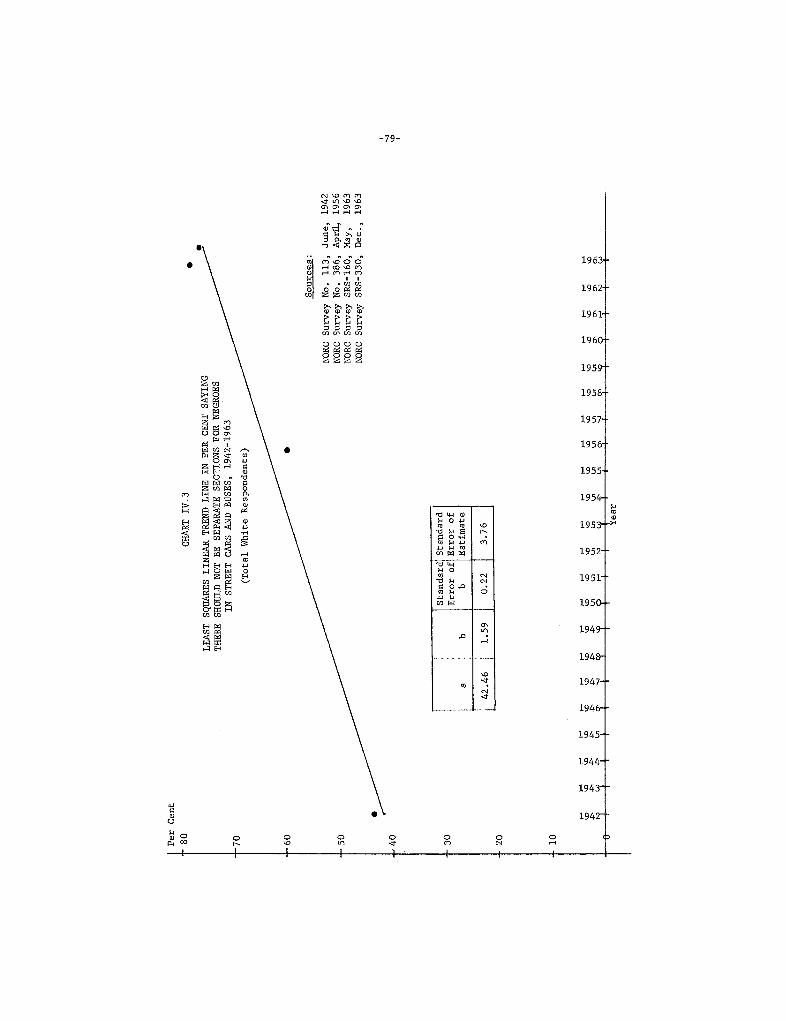
Per Cent
CH
AR
T I
V. 3
LEAST SQUARES LINEAR TREND LINE IN PER CENT SAYING
THERE SHOULD NOT BE SEPARATE SECTIONS FOR NEGROES
IN STREET CARS AND BUSES, 1942-1963
(Total White Respondents)
NORC Survey
NORC Survey
NORC Survey
NORC Survey
No. 113,
No. 386,
SRS-
160,
SRS-
330,
June, 1942
Apri, 1956
May
, 196
3Dec., 1963
Stan
dard
Stan
dard
Error of
Error of
Est
imat
e
42.
1.59
Yea
r

-80-
to have been such an effect in three questions asked by the Gallup organization
with respect to interstate travel. The question was, "One of Truman s proposals
concerns interstate travel. Do you think Negroes should or should not be re-
quired to occupy a separate part of a train or bus when travelling from one state
to another?" This question was asked in January and July of 1948 and in April of
1949. On all three occasions the national results were similar, varying no morethan one percentage point from 50 per cent . 10 A comparison of these results withthe regression line for the preceding NORC question shows that they lie exactly
on the line, suggesting that the change in question wording probably did not
alter respondents ' general views of segregated public transportation.
The NORC questions on whether or not there should be separate sections
for Negroes are presented in the form of regression lines for the six education-
al and regional subgroups shown in Chart IV. Actual data are given in the
Appendix Table 9. Results show that approval for desegregated transportation in-
creases with education, first in the South and then in the North. Southerners,
who were much more prejudiced than northerners , shifted their opinions sharply
over time, so that while the pattern of differences for the six groups remains
it is no longer quite so sharply defined. Educational differences remain promi-
nent especially in the South, although the major difference is between regions
rather than between educational levels.
Regardless of education, by 1956 a majority of whites living in the North
felt that there should not be separate sections for Negroes in streetcars and
buses. By 1963, almost all northerners sampled with at least a high school edu-
cation were of this view. In the South , however, despite increased favorability
to Negro rights in public transportation, only a bare majority of the high school
educated agreed in 1963 that there should not be segregation of transportation
and only about one-third of the grade school educated accepted this view. Thus
despite a considerable shift in opinions, continuing reluctance to accept equal
use of public transportation is evident in the South. In the North , acceptance
of desegregation in this area has reached almost perfect consensus,
Support for the law --Not until 1956 did the Supreme Court reverse the
1896 Plessy v. Ferguson ruling. Segregation of public transportation was ruled
unconstitutional. In 1957 and 1961 Gallup poll interviewers asked
, "
The U. S.
Supreme Court has ruled that racial segregation on trains , buses, and in public
waiting rooms must end. Do you approve or disapprove of this rUling?"ll Approv-
al shifted from 60 per cent in 1957 to 66 per cent in 1961 , virtually little
change. In the time spanned by the surveys , two-thirds of the southerners re-
mained adamant in their disapproval. These findings imply that , in both the
10 AIPO
11 AIPO
releases , January 16 , 1948; July 25, 1948; January 29, 1949.
release, June 21 , 1961.
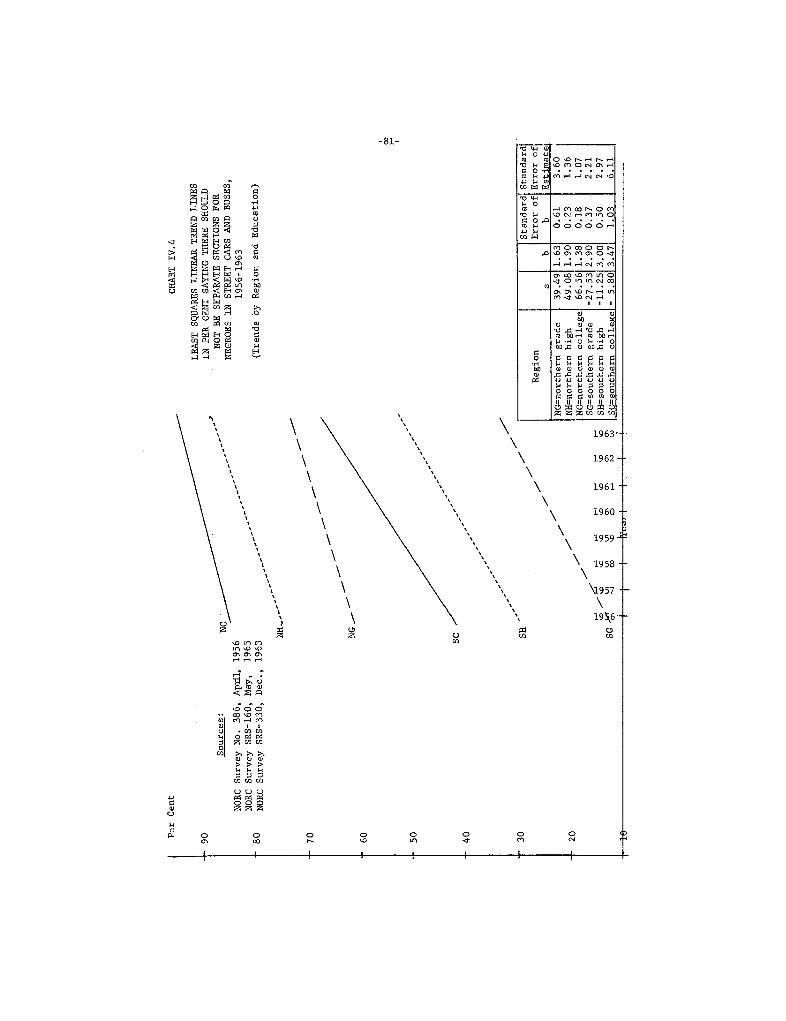
Per Cent
NORC Survey No. 386, AprL
1956
NORC Survey SRS-160, May,
1963
NORC Survey SRS-330, Dec., 1963
CH
AR
T I
V. 4
- -
--
- -
NH
_
LEAST SQUARES LINEAR TREND LINES
IN PER CENT SAYING THERE SHOULD
NOT BE SEPARATE SECTIONS FOR
NEGROES IN STREET CARS AND BUSES
1956
-196
3
(Trends by Region and Education)
.. --
.. ..
.. ..
.. ..
.. ..
NG .. .. ..
SH
"
SG
Stan
dard
; Sta
ndar
dR
egio
nError of
Error of
Est
imat
eN
G=
nort
hern
gra
de39
,1.
63
60
NH=northern high
49.
1. 9
01.
36NC=northern college
66.
1.38
1. 0
7SG
=so
uthe
rn g
rade
-27.
SH=southern high
-11. 25
SC=southern collepe
- 5,
1.03

-82-
North and the South , demands for integrated transportation have met with wider
approval than have the efforts of the Supreme Court to ensure those demands,
It may be that the use of legal means to effect change itself created
some feelings of resistance on the part of people who might otherwise have sup-
ported the change.12 It is
also possible that the context in which the 1961
question was asked influenced results. Despite the Court s ruling, southern
compliance was slow to follow, and national attention was focussed on the prob-
lem by the actions of white and Negro civil rights workers who, in 1961, boarded
buses in Washington , D, C., and began a "Freedom Ride" through part of the South,
At several places in Alabama the riders encountered violence, This , in turn
led to new federal intervention. Respondents to the 1961 Gallup survey were
asked if they knew about the actions of the Freedom Riders. Of the 63 per cent
who did know of them, two-thirds disapproved. 13 Moreover
, 57 per cent of the
national sample and 70 per cent of the South alone felt that'" sit-ins ' at lunch
counters
, '
Freedom Buses ' and other demonstrations by Negroes (would) hurt the
Negro s chance of being integrated in the South.14
This suggests that some of
the reservations about the Supreme Court decision on desegregating public trans-
portation may have stemmed from disapproval of the direct- action tactics of civil
rights groups intended to ensure e forcement of the decision.
In summary, then, demands for integrated public transportation have won
wide approval in the North and increasing, though still reluctant , approval in
the South. Smaller numbers of respondents are, however, willing to accept theintercession of the Supreme Court to ensure that such integration is enforced
and probably a majority are even opposed to citizens ' enjoying their constitution-
al right to demand that the Court and other legal and administrative machinery
take steps to ensure compliance with the Court s rulings.
Other Public Services
Full enjoyment of citizenship for the Negro means equal freedom of move-
ment and enjoyment of the same public services as are available to white citizens.
Facilities such as restaurants , parks, hotels , and theaters are included in this
category. Limited trend data are available on the extent to which whites feelthat Negroes should be able to enjoy the same public services as do whites. How-
ever, a general tendency toward growing approval for shared public facilities
Evidence that the suggestion of a legal change creates some oppositionis provided by Cantril, based on several questions from 1939 surveys. As far aswe can tell , however, these kinds of effects have not been systematically explored.Cantril op. cit ., pp. 43-44.
13 AIPO
14 AIPO
release, June 21, 1961.
release , June 28 , 1961.
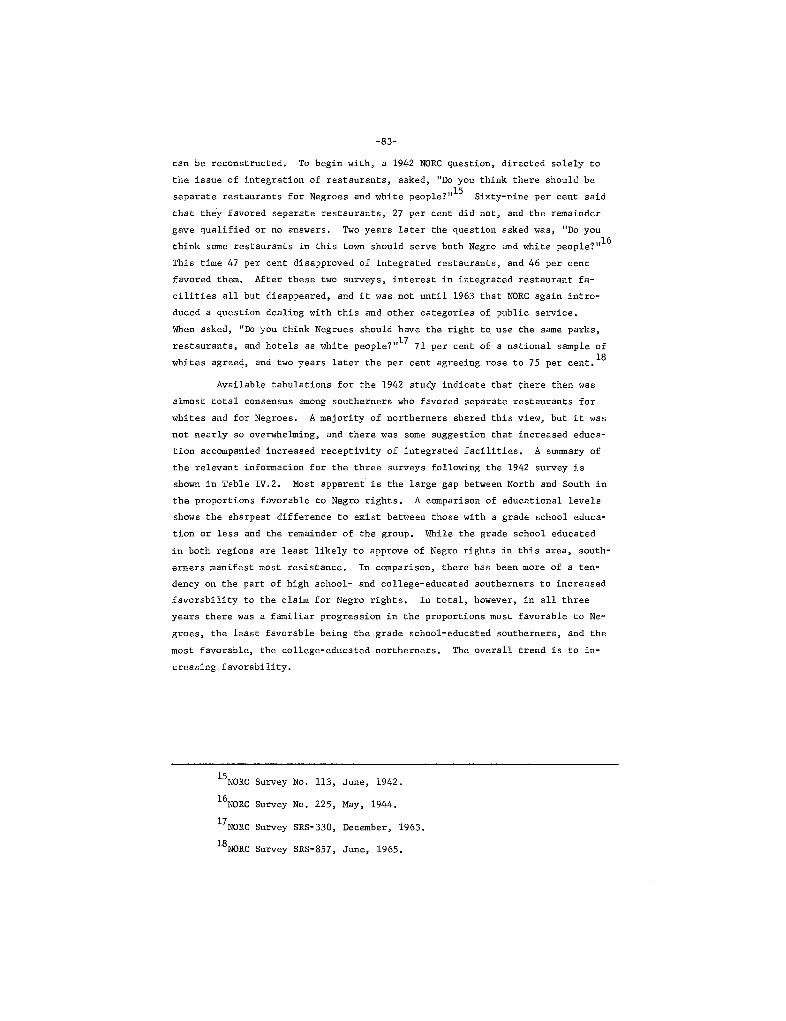
-83-
can be reconstructed. To begin with , a 1942 NORC question , directed solely to
the issue of integration of restaurants , asked
, "
Do you think there should be
separate restaurants for Negroes and white people? ,,15 Sixty-nine per cent said
that they favored separate restaurants , 27 per cent did not , and the remainder
gave qualified or no answers. Two years later the question asked was
, "
Do you
think some restaurants in this town should serve both Negro and white people?,,
This time 47 per cent disapproved of integrated restaurants , and 46 per cent
favored them. After these two surveys, interest in integrated restaurant fa-cilities all but disappeared , and it was not until 1963 that NORC again intro-
duced a question dealing with this and other categories of public service.
When asked
, "
Do you think Negroes should have the right to use the same parks
restaurants, and hotels as white people?,,17 71 per cent of a national sample of
whites agreed, and two years later the per cent agreeing rose to 75 per cent.
Available tabulations for the 1942 study indicate that there then was
almost total consensus among southerners who favored separate restaurants for
whites and for Negroes, A majority of northerners shared this view, but it was
not nearly so overwhelming, and there was some suggestion that increased educa-
tion accompanied increased receptivity of integrated facilities. A summary of
the relevant information for the three surveys following the 1942 survey is
shown in Table IV. Most apparent is the large gap between North and South in
the proportions favorable to Negro rights. A comparison of educational levels
shows the sharpest difference to exist between those with a grade school educa-
tion or less and the remainder of the group. While the grade school educated
in both regions are least likely to approve of Negro rights in this area , south-
erners manifest most resistance. In comparison, there has been more of a ten-
dency on the part of high schoo1- and college- educated southerners to increased
favorability to the claim for Negro rights. In total, however, in all three
years there was a familiar progression in the proportions most favorable to Ne-
groes, the least favorable being the grade school-educated southerners , and the
most favorable, the college- educated northerners.creasing favorability.
The overall trend is to in-
NORC Survey No, 113, June 1942.
NORC Survey No, 225 , May, 1944.
17 NORC Survey SRS-330 December 1963.
NORC Survey SRS-857, June 1965.

-84-
TABLE IV. 2
PER CENT AGREEING THAT NEGROES SHOULD HAVE RIGHT TO INTEGRATEDPUBLIC SERVICES , 1944.1965 , BY EDUCATION AND REGION
Region and Education
Survey South North
Grade High College Grade High College
NORC No. 225 June 1944:Some restaurants in town
should serve Negroes andwhites 5 (247) 7 (230) 20 (144) 53 (671) 57 (830) 68 (391)
NORC SRS-330 December 1963:Negroes should have right
to use same parks res-taurants, . etc. 26 (115) 46 (157) 59 (69) 67 (209) 83 (466) 94 (209)
NORC SRS-857 June 1965:Negroes should have right
to use same parks, res-taurants etc. 29 (101) 50 (157) 64 (86) 71 (205) 88 (480) 93 (258)
Legal protection --The law has frequently been invoked as an instrument
for attaining and protecting Negro rights. In the two instances when responses
of the white public to the use of legal measures have been examined , only moder-
ate acceptance of such instrumentality was evidenced. In recent years , Gallup
has asked about legal protection of the rights of Negroes to service in public
places. Again, support was not overwhelming, but was at least as great as that
for laws or decisions already passed. Respondents were asked
, "
How would you
feel about a law which would give all persons--Negro as well as white--the right
to be served in public places such as hotels, restaurants , theaters , and similar
establishments. Would you like to see Congress pass such a law, or not?" The
question was asked in June and in August of 1963, and in January of 1964. Dur-
ing this short time span, support for such a law increased from 49 per cent to
61 per cent. As might be expected, support was much greater in the North than
in the South. By 1964, 71 per cent of northerners and 20 per cent of southernersapproved of a new law. Between June of 1963 and January of 1964 , approval in-
creased in both regions , but more sharply in the North than in the South.
Eating with Negroes . --We have some data on opinion trends on the rights
of Negroes to non-discriminatory service and the desirability of legal guaranties
of such service. Some indication of actual or anticipated behavior of whites
when faced with integrated services is now needed. Unfortunately our information
is confined to one question from a 1944 survey in which respondents were asked
19 All information frOm AIPO release, February 2 , 1964.
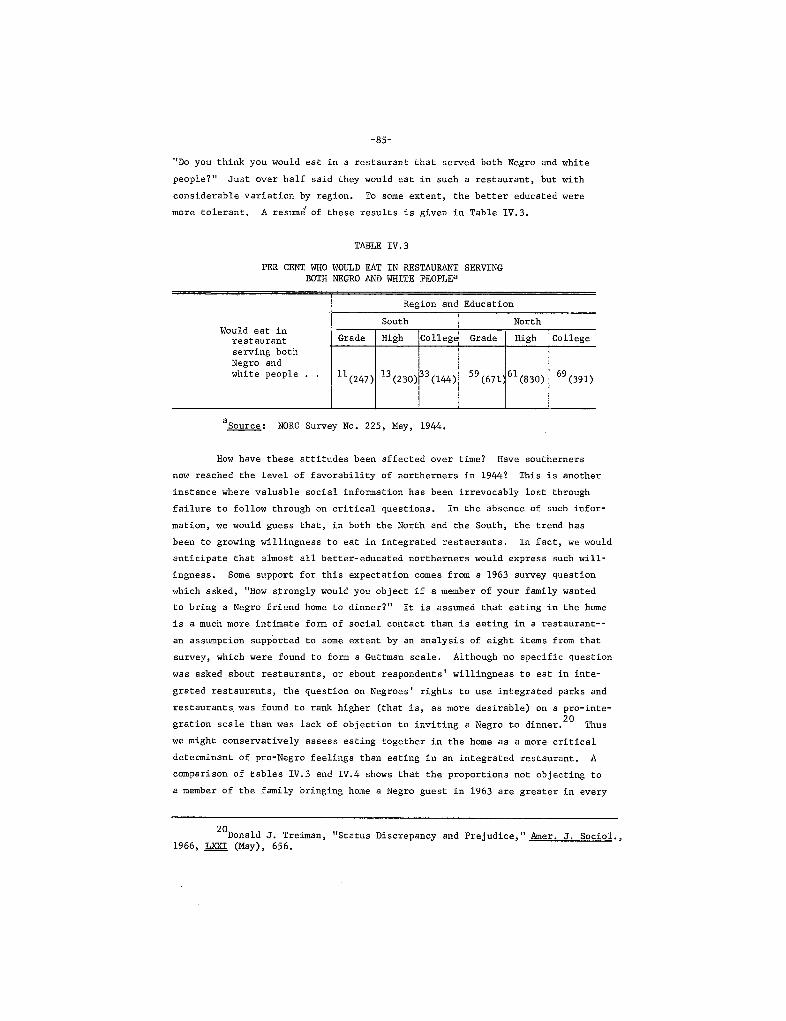
-85-
Do you think you would eat in a restaurant that served both Negro and white
people?" Just over half said they would eat in such a restaurant , but with
considerable variation by region. To some extent , the better educated were
more tolerant. A resume of these results is given in Table IV,
TABLE IV. 3
PER CENT WHO WOULD EAT IN RESTAURAT SERVINGBOTH NEGRO AND WHITE PEOPLEa
Region and Education
Would eat inrestaurantserving bothNegro andwhite people. .
Grade
South
High Grade
North
High College
11 (247) 13 (230)r3c144 59 (671 61 (830) I 69 (391)
Source NORC Survey No. 225, May, 1944.
How have these attitudes been affected over time? Have southerners
now reached the level of favorability of northerners in 1944? This is another
instance where valuable social information has been irrevocably lost through
failure to follow through on critical questions. In the absence of such infor-
mation, we would guess that , in both the North and the South , the trend has
been to growing willingness to eat in integrated restaurants. In fact , we would
anticipate that almost all better- educated northerners would express such will-ingness. Some support for this expectation comes from a 1963 survey question
which asked
, "
How si:rongly would you object if a member of your family wanted
to briug a Negro friend home to dinner?" It is assumed that eating in the home
is a. much more intimate form of social contact than is eating in a restaurant--
an assumption supported to some extent by an analysis of eight items from that
survey, which were found to form a Guttman scale. Although no specific question
was asked about restaurants, or about respondeni:s ' willingness to eat in inte-grated restaurants , the question on Negroes I rights to use integrated parks and
restaurants. was found to rank higher (that is , as more desirable) on a pro-inte-
gration scale than was lack of objection to inviting a Negro to dinner,20
Thus
we might conservatively assess eating together in the home as a more critical
determinant of pro-Negro feelings than eating in an integrated restaurant,
comparison of tables IV. 3 and IV, 4 shows that the proportions not objecting toa member of the family bringing home a Negro guest in 1963 are greater in every
Donald J, Treiman
, "
Status Discrepancy and Prejudice Amer. J. Sociol.1966 (May), 656.
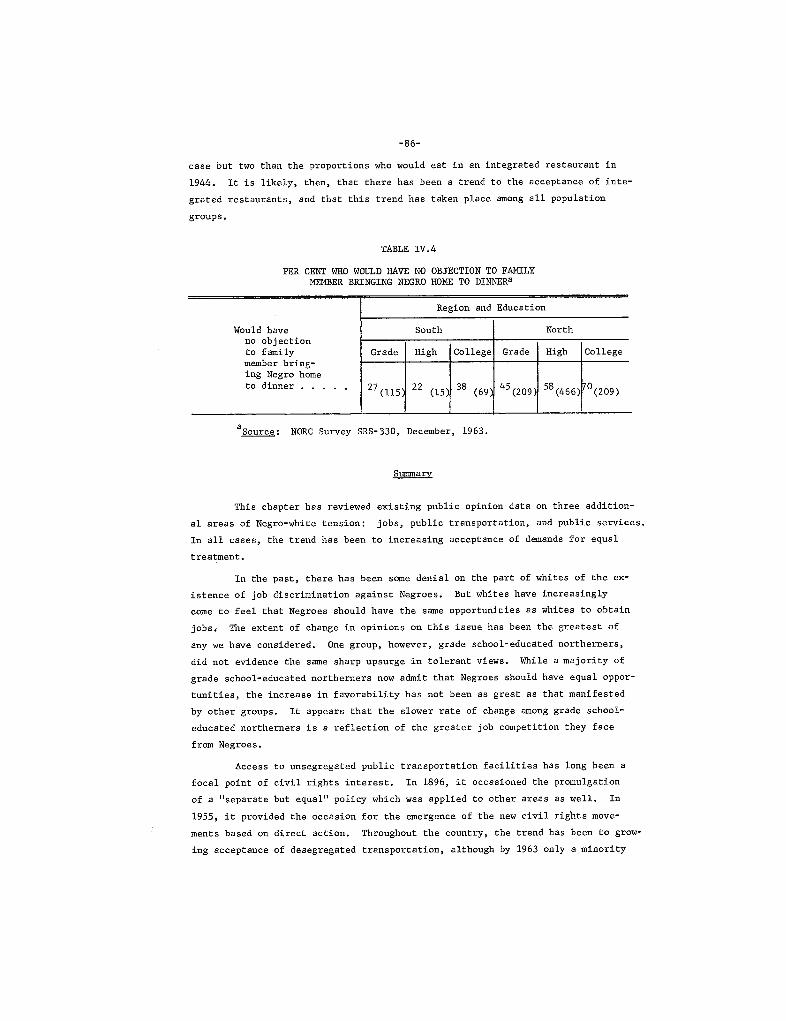
-86-
case but two than the proportions who would eat in an integrated restaurant in
1944. It is likely, then, that there has been a trend to the acceptance of inte-
grated restaurants , and that this trend has taken place among all population
groups.
TABLE IV. 4
PER CENT WHO WOULD HAVE NO OBJECTION TO FAMLYMEER BRINGING NEGRO HOME TO DINNR
Region and Education
Would have South Northno objectionto family Grade High College Grade High Collegemember bring-ing Negro hometo dinner. 27 (115
(15) (69 45 (209) 58 (466)nO (209)
NORC Survey SRS-330 , December , 1963.
Sumarv
This chapter has reviewed existing public opinion data on three addition-
al areas of Negro-white tension: jobs , public transportation, and public services.
In all cases , the trend has been to increasing acceptance of demands for equal
treatment.
In the past , there has been some denial on the part of whites of the ex-
istence of job discrimination against Negroes. But whites have increasinglycome to feel that Negroes should have the same opportuni ties as whites to obtain
jobs. The extent of change in opinions on this issue has been the greatest of
any we have considered. One group, however, grade school- educated northerners,
did not evidence the same sharp upsurge in tolerant views. While a majority of
grade school- educated northerners now admit that Negroes should have equal oppor-
tunities , the increase in favorability has not been as great as that manifestedby other groups. It appears that the slower rate of change among grade school-
educated northerners is a reflection of the greater job competition they face
from Negroes.
Access to unsegregated public transportation facilities has long been a
focal point of civil rights interest, In 1896, it occasioned the promulgation
of a "separate but equal" policy which was applied to other areas as well.1955 , it provided the occasion for the emergence of the new civil rights move-
ments based on direct action. Throughout the country, the trend has been to grow-
ing acceptance of desegregated transportation, although by 1963 only a minority
-87-
of grade school- educated southerners indicated acceptance. Questions on trans-
portation also provided evidence of the reluctance of many people to use the law
to ensure desegregation. Some of this appeared to arise from the objections of
whites in both the North and the South to the activities of civil rights workers
in bringing their grievances directly to the attention of the legal authorities
and the public at large.
Information on other public services is even more sketchy, but it points
in the same direction of growing willingness to equal enjoyment of the same fa-
cilities, such as restaurants , parks , hotels , and theaters by Negroes and whites,

CHAPTER V
AN EVALUATION OF THE CIVIL RIGHTS MOVEMNT AND PROSPECTS FOR THE FUTURE
One hundred years late , the promise of emancipation is finally becoming
realized. New legislative acts, new interpretations of old
of civil rights organizations , new militancy on the part of
receptivity on the part of many whites all are contributing
laws, new impacts
Negroes, and new
to the still slow
and painful move toward the guarantee of full civic rights for Negroes. In this
report , we have provided evidence from survey data of growing responsiveness tothe civil rights cause.
Our review of available data has centered on changes regarding specific
issues , such as education and housing. This chapter is concerned with assessing
more general perspectives on civil rights. Among the questions to be dealt with
are the following: Are whites disturbed by the new Negro militancy? Do they
feel civil rights groups are moving too fast? How is the government fulfilling
its obligations to both majorities and minorities? Will the future bring further
changes? Will these come about peacefully or not?
In the following section, opinions about the civil rights movement will
be reported. Because of the recency of its latest activities, there is little
trend data available. While this report has been concerned primarily with trac-ing opinion trends , the relevance of the time-bound data presented in this chap-
ter should soon become clear.
of white tolerance,In a very real sense , they indicate the boundaries
The Civil Rights Movement
Degree of concern --In our brief survey of questions asked by the Gallup
organization on the most important problems facing the United States , we found
that civil right s problems came to the fore of public attention in the 1950' s
especially during nationally publicized crises, Since 1963, civil rights and
important international issues have been alternating for first place in public
concern. In a 1963 NORC survey, a national sample was asked to indicate the
extent of interest in three issues--the next year s presidential election , United
States relations with Cuba , and Negro-white relations in the United States, Allthree were issues of considerable interest to respondents , but the greatest pro-
portion (64 per cent) indicated that they were "very interested" in lqegro-white
See above , Chapter I,
-89-
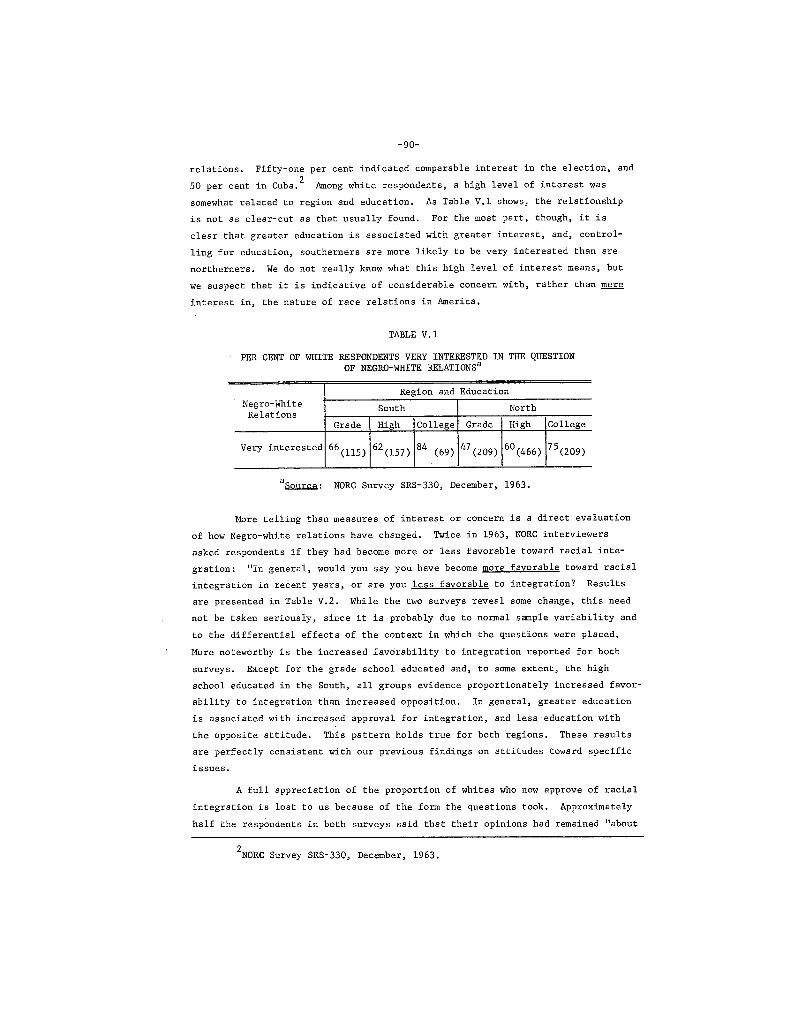
-90-
relations. Fifty-one per cent indicated comparable interest in the election , and50 per cent in Cuba. Among white respondents, a high level of interest was
somewhat related to region and education,
is not as clear- cut as that usually found.
As Table V, l shows, the relationship
For the most part , though , it is
clear that greater education is associated with greater interest , and, control-
ling for education, southerners are more likely to be very interested than are
northerners. We do not really know what this high level of interest means , but
we suspect that it is indicative of considerable concern with , rather than
interest in, the nature of race relations in America.
TABLE V, 1
PER CEN OF WHITE RESPONDENTS VERY INTERESTED IN TH QUESTIONOF NEGRO-WHITE REATIONS
Region and EducationNegro-White South North
Re 1at ionsGrade High College Grade High College
Very interested 66 (115) 62 (157) 84 (69) 47 (209) 60 (466) (209)
NORC Survey SRS-330 , December , 1963.
More telling than measures of interest or concern is a direct evaluation
of how Negro-white relations have changed. Twice in 1963, NORC interviewers
asked respondents if they had become more or less favorable toward racial inte-
gration: "In general , would you say you have become more favorable toward racial
integration in recent years , or are you less favorable to integration? Results
are presented in Table V. 2. While the two surveys reveal some change , this need
not be taken seriously, since it is probably due to normal sample variability and
to the differential effects of the context in which the questions were placed,
More noteworthy is the increased favorability to integration reported for both
surveys. Except for the grade school educated and, to some extent , the highschool educated in the South, all groups evidence proportionately increased favor-
ability to integration than increased opposition. In general , greater education
is associated with increased approval for integration, and less education with
the opposite attitude. This pattern holds true for both regions. These results
are perfectly consistent with our previous findings on attitudes toward specific
issues.
A full appreciation of the proportion of whites who now approve of racial
integration is lost to us because of the form the questions took. Approximately
half the respondents in both surveys said that their opinions had remained "about
NORC Survey SRS-330, December , 1963,

-91-
the sal!e, " We do not know whether these people began and remained favorable orunfavorable to integration. Our only observation is that the higher the educa-
tional level , the more likely this is to be associated with a change in opinion
either pro or con.
TABLE V,
CHANGES IN ATTITUDES TOWARD RACIA INTEGRATION IN RECENT YEARS
(Per Cent White Respondents)
Attitude towardRacial Integrationin Recent Years
Region and EducationSouth NorthGrade I High I College I Grade I High I College
Source: NORC SRS-160, May, 1963
Become more favorable.Become less favorable
About the same
Don know or no answer
N . (101) (149) (105) (212) (511) (271)
Source: NORC SRS-330, December , 1963
Become more tavorableBecome less favorable
Abuut the same
Don know or no answer
N . (115) (159) (69) (209) (466) (209)
Perhaps the most surprising finding is the narrow range of difference
between educational levels in the North and in the South in the per cent who be-
came more favorable. This is apparent when these results are compared with pre-
vious ones on the proportions favorable to integration in housing, schools , trans-
portation and jobs, Instead of differences of 70 per cent or more between the
most and least prejudiced groups (grade school-educated southerners and college-educated northerners), here the maximum difference is 29 per cent. While this
is certainly a sizeable difference, it is nowhere as great as those to which we
have become accustomed, Why should this be so? The data can only suggest some
possible explanations , and these are well worth exploring,
In representing shifts in opinions over time as a linear trend line , we
have drawn attention to both the gradual and the cumulative nature of the opin-
ion changes. At anyone point in time , then, we cannot expect to find propor-
tions that admit changing their opinions as large as the total proportions cur-
rently in favor of integration in any given area. That is , at any point in time
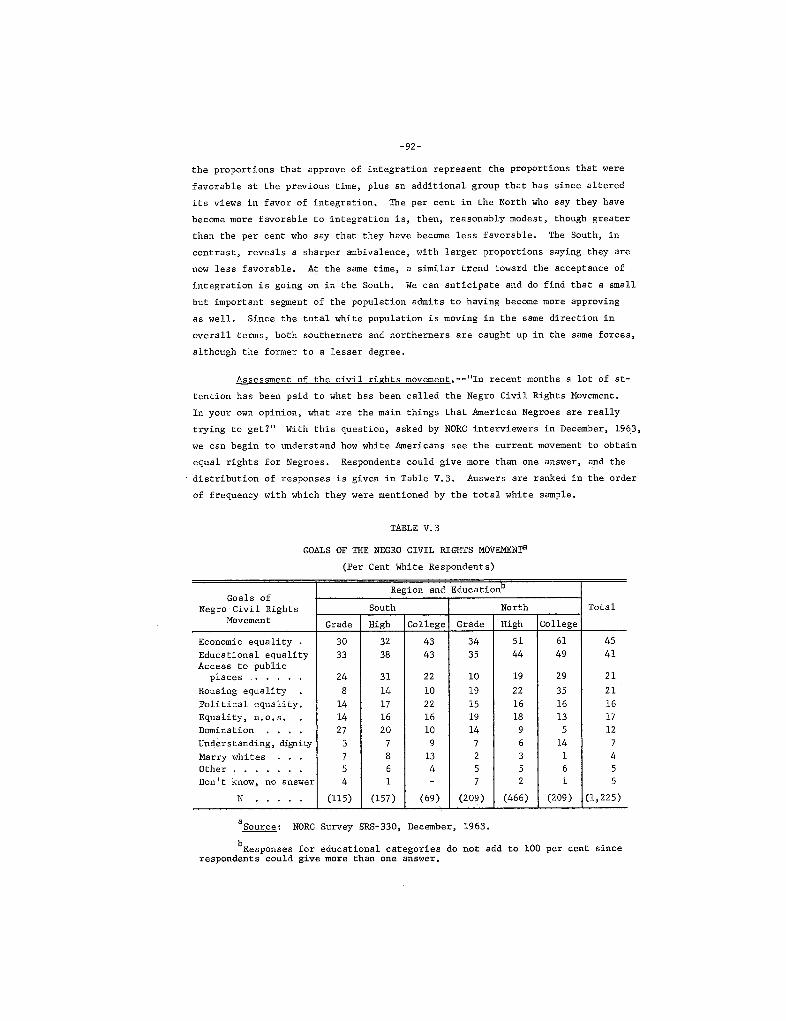
-92-
the proportions that approve of integration represent the proportions that were
favorable at the previous time , plus an additional group that has since altered
its views in favor of integration. The per cent in the North who say they have
become more favorable to integration is , then, reasonably modest , though greater
than the per cent who say that they have become less favorable. The South , in
contrast , reveals a sharper ambivalence, with larger proportions saying they arenow less favorable. At the same time , a similar trend toward the acceptance of
integration is going on in the South. We can anticipate and do find that a small
but important segment of the population admits to having become more approving
as well. Since the tota.l white population is moving in the same direction inoverall terms , both southerners and northerners are caught up in the same forces
although the former to a lesser degree.
Assessment of the civil rights movement
. --
In recent months a lot of at-
tention has been paid to what has been called the Negro Civil Rights Movement.
In your own opinion, what are the main things that American Negroes are really
trying to get?" With this question , asked by NORC interviewers in December , 1963,
we can begin to understand how white Americans see the current movement to obtain
equal rights for Negroes. Respondents could give more than one answer, and the
distribution of responses is given in Table V. Answers are ranked in the order
of frequency with which they were mentioned by the total white sample.
TABLE V.
GOALS OF THE NEGRO CIVIL RIGHTS MOVEMNra
(Per Cent White Respondents)
Region and EducationGoals of
Negro-Civil Rights South North TotalMovement Grade High Co llege Grade High College
Economic equality
Educational equalityAccess to public
placesHousing equality
Political equality,
Equality, o. s.DominationUnderstanding, digity
Marry whites
OtherDon know no answer
(ll5) (157) (69) (209) (466) (209) 225)
Source NORC Survey SRS-330, December, 1963.
Responses for educational categories do not add to 100 per cent sincerespondents could give more than one answer.

-93-
The two most frequently mentioned goals were economic and educational
equality. The right to hold jobs for which they are qualified, the right to
obtain higher pay and better living standards , and the right to attend the same
schools as white children and to obtain equally good educations--these are the
issues that over 40 per cent of the respondents recognized as critical concerns
for Negro Americans. On the whole, these issues were mentioned more often in
the North than in the South , and the likelihood that they would be mentioned in-
creased with greater education. Differences between those with the same level
of education were only moderately affected by region in the case of those who
suggested that the civil rights movement was concerned with educational equality.
There is almost no difference in the frequency with which economic equality was
cited by the grade school educated in both the North and the South. However
the high school and college educated displayed considerable difference, with
those in the North suggesting that this was an important goal about 20 per cent
more often than did their educational counterparts in the South.
Access to public places and the desire for equality in housing represent
a second degree of frequency of issues mentioned, this time by about 20 per cent.
Desire to freely use parks , restaurants , churches , hotels , theaters , buses
trains , and lunch counters is more often attributed to Negroes by those in theSouth. This contrast between North and South exists for those with less thancollege training. In the North , however, the characteristic increase in mention
of access to public places corresponding to greater education is found. Improvedhousing conditions, and the right to live anywhere without racial discrimination
are goals. noted more often by northerners. Here the contrast is especially great
between the college educated and all other groups in both regions.
About 15 per cent of the respondents mentioned political equality or
equal rights without further specification. In both of these cases regional dif-ferences were minor, as were educational ones. In view of the efforts of ciyil
rights groups to ensure that Negroes in the South are permitted to register to
vote and to exercise their voting privileges, it is probably surprising that
this goal has made so little impact on whites, either in the North or South.
Instead, whites recognize the more directly instrumental rights as the primary
aspirations of the civil rights movement.
Both the desire for domination and the desire for understanding were
cited by about 10 per cent. Southerners with less than a college education most
frequently expressed the beliefs that Negroes want to become superior , to gain
control over the society, to take over, to obtain more than their share, or to
receive preferential treatment. Considering that these groups have elsewhere
been most reluctant to express opinions favorable to Negro integration , it is
not surprising that they were the most outspokenly anti-Negro in assessing the
rights movement. At the same time , only small minorities in either region
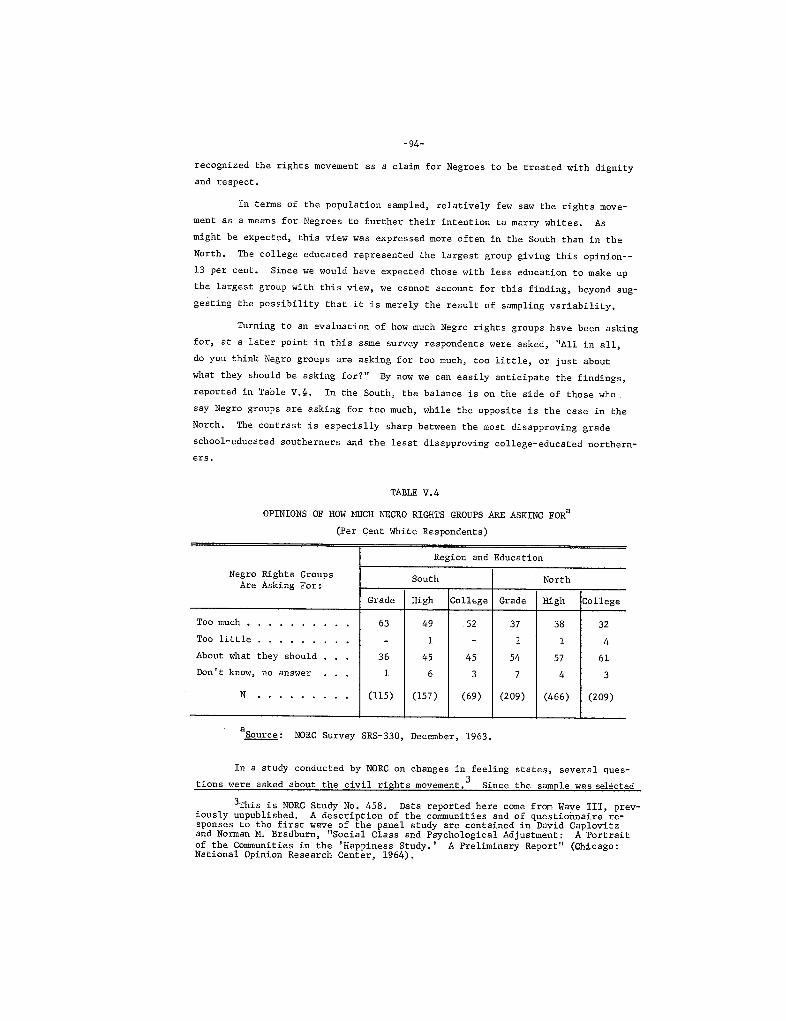
-94-
recognized the rights movement as a claim for Negroes to be treated with dignity
and respect.
In terms of the population sampled, relatively few saw the rights move-
ment as a means for Negroes to further their intention to marry whites.
might be expected, this view was expressed more often in the South than in the
North. The college educated represented the largest group giving this opinion--
13 per cent. Since we would have expected those with less education to make up
the largest group with this view, we cannot account for this finding, beyond sug-
gesting the possibility that it is merely the result of sampling variability.
Turning to an evaluation of how much Negro rights groups have been asking
for, at a later point in this same survey respondents were asked
, "
All in alldo you think Negro groups a e asking for too much, too little, or just about
what they should be asking for?" By now we can easily anticipate the findings
reported in Table V. . In the South, the balance is on the side of those who
say Negro groups are asking for too much, while the opposite is the case in the
North. The contrast is especially sharp between the most disapproving grade
school- educated southerners and the least disapproving college- educated northern-ers.
TABLE V.
OPINIONS OF HOW MUCH NEGRO RIGHTS GROUPS ARE ASKING FOR
(Per Cent White Respondents)
Region and Education
Negro Rights Groups South NorthAre Asking For:Grade High Coll"ge Grade High College
Too much.
Too little
About what they should
Don know answer
(115) (157) (69) (209) (466) (209)
Source NORC Survey SRS-330 , December , 1963.
In a study conducted by NORC on changes in feeling states , several ques-
tions were asked about the civil rights movement. Since the sample was selected3This is NORC Study No. 458. Data reported here come from Waye III , prev-iously unpublished. A description of the comunities and of questionnaire re-
sponses to the first wave of the panel study are contained in David Caplovitzand Norman M. Bradburn
, "
Social Class and Psychological Adjustment: A Portraitof the Communities in the 'Happiness Study. ' A Preliminary Report" (Chicago:National Opinion Research Center , 1964).
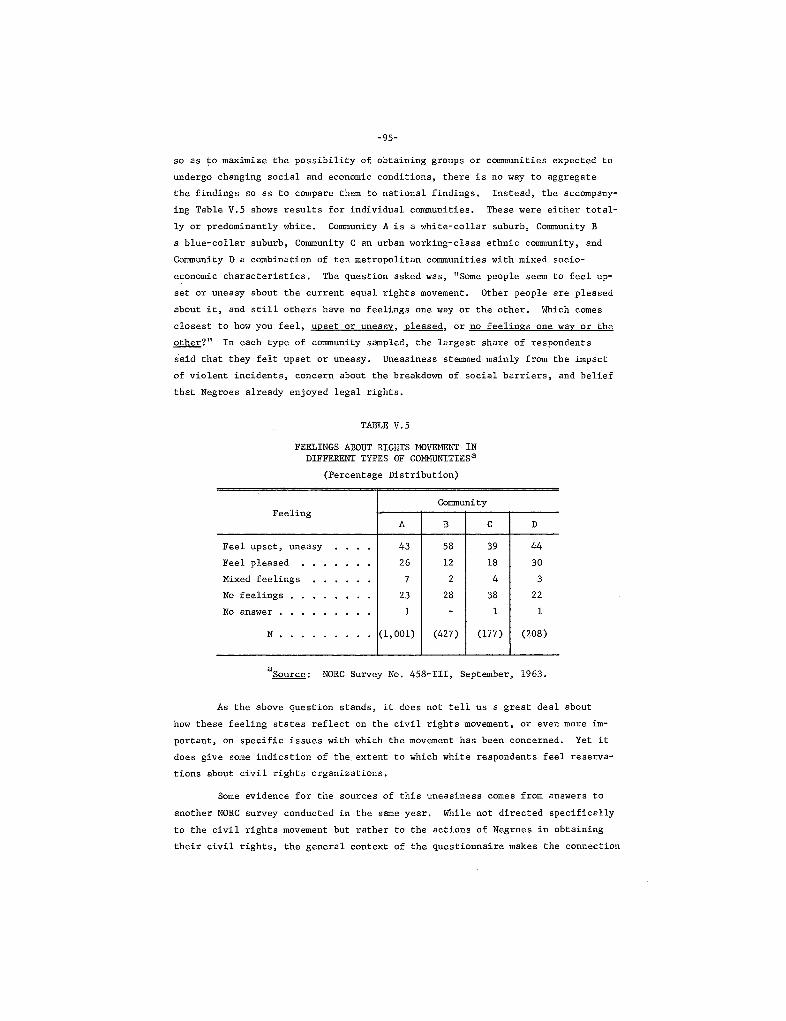
-95-
so as o maximize the possibility of obtaining groups or comunities expected toundergo changing social and economic conditions , there is no way to aggregate
the findings so as to compare them to national findings. Instead, the accompany-
ing Table V. 5 shows results for indiyidual comunities. These were either total-
ly or predominantly white. Community A is a white- collar suburb , Community B
a blue-collar suburb , Community C an urban working- class ethnic comunity, andCommunity D a combination of ten metropolitan communities with mixed socio-
economic characteristics, The question asked was, "Some people seem to feel up-set or uneasy about the current equal rights movement. Other people are pleasedabout it , and still others have no feelings one way or the other. Which comes
closest to how you feel upset or uneasy pleased , or no feelings one way or the
other?" In each type of comunity sampled, the largest share of respondentssaid that they felt upset or uneasy. Uneasiness stemmed mainly from the impact
of violent incidents , concern about the breakdown of social barriers , and belief
that Negroes already enjoyed legal rights.
TABLE V.
FEELINGS ABOUT RIGHTS MOVENT' DIFFERE TYPES OF COMMNITIES a
(Percentage Distribution)
ComunityFeeling
Feel upset unea sy
Feel pleasedMixed feelings
feelingsanswer
001) (427) (177) (208)
Source NORC Survey No, 458-111 , September , 1963.
As the above question stands, it does not tell us a great deal about
how these feeling states reflect on the civil rights movement , or even more im-
portant , on specific issues with which the movement has been concerned. Yet it
does give some indication of the extent to which white respondents feel reserva-
tions about civil rights organizations.
Some evidence for the sources of this uneasiness comes from answers to
another NORC survey conducted in the same year. While not directed specifically
to the civil rights movement but rather to the actions of Negroes in obtaining
their civil rights , the general context of the questionnaire makes the connection
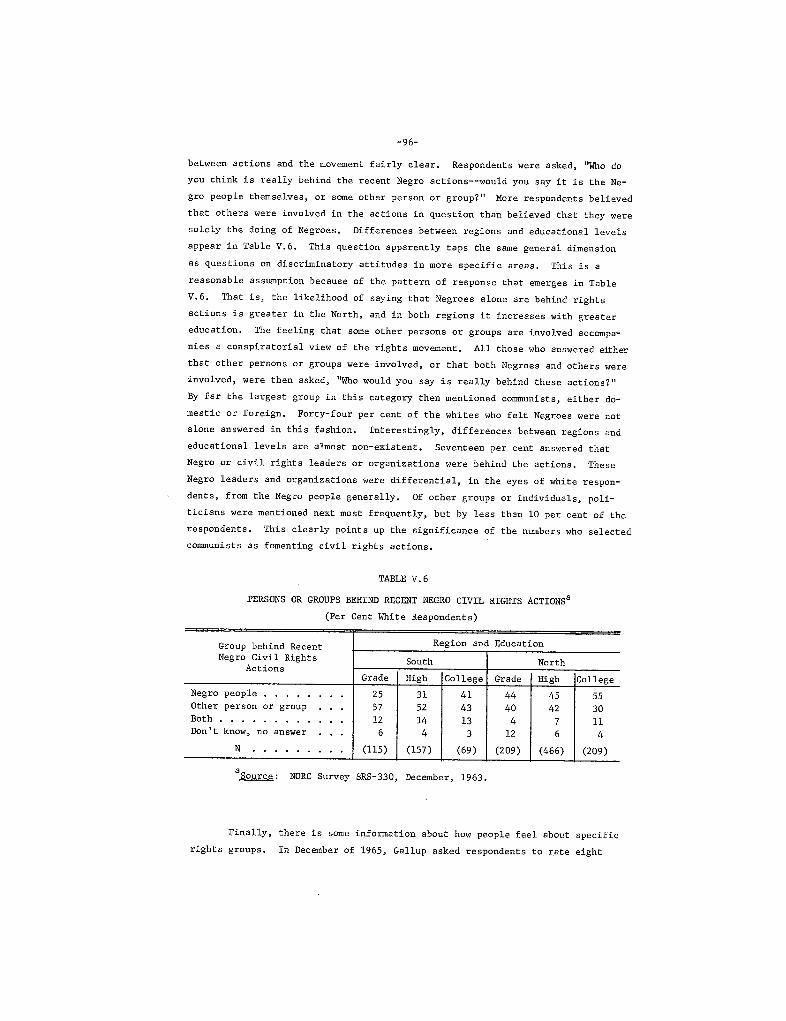
-96-
between actions and the movement fairly clear. Respondents were asked
, "
Who doyou think is really behind the recent Negro actions--would you say it is the Ne-
gro people themselves , or some other person or group?" More respondents believed
that others were involved in the actions in question than believed that they were
solely the doing of Negroes. Differences between regions and educational levelsappear in Table V.6, This question apparently taps the same general dimensionas questions on discriminatory attitudes in more specific areas. This is a
reasonable assumption because of the pattern of response that emerges in Table
That is , the likelihood of saying that Negroes alone are behind rightsactions is greater in the North , and in both regions it increases with greater
education. e f eling that some other persons or groups are involved accompa-
nies a conspiratorial view of the rights movement. All those who answered eitherthat other persons or groups were involved, or that both Negroes and others were
'Involved , were then asked
, "
Who would you say is really behind these actions?"
By far the largest group in this category then mentioned communists , either do-
mestic or foreign. Forty-four per cent of the whites who felt Negroes were not
alone answered in this fashion. Interestingly, differences between regions and
educational levels are almost non-existent. Seventeen per cent answered that
Negro or civil rights leaders or organizations were behind the actions, TheseNegro leaders and organizations were differential , in the eyes of white respon-
dents , from the Negro people generally. Of other groups or individuals , poli-
ticians were mentioned next most frequently, but by less than 10 per cent of the
respondents. This clearly points up the significance of the numbers who selected
comunists as fomenting civil rights actions.
TABLE V. 6
PERSONS OR GROUPS BEHIND RECENT NEGRO CIVIL RIGHTS ACTIONS
(Per Cent White Respondents)
Group behind Recent Region and Education
Negro Civil Rights South NorthActionsGrade High College Grade High College
Negro peopleOther person or group
BothDon t know answer
(115) (157) (69) (209) (466) (209)
Source NORC Survey SRS- 330, December, 1963.
Finally, there is some information about how people feel about specific
right s groups. In December of 1965, Gallup asked respondents to ate eight
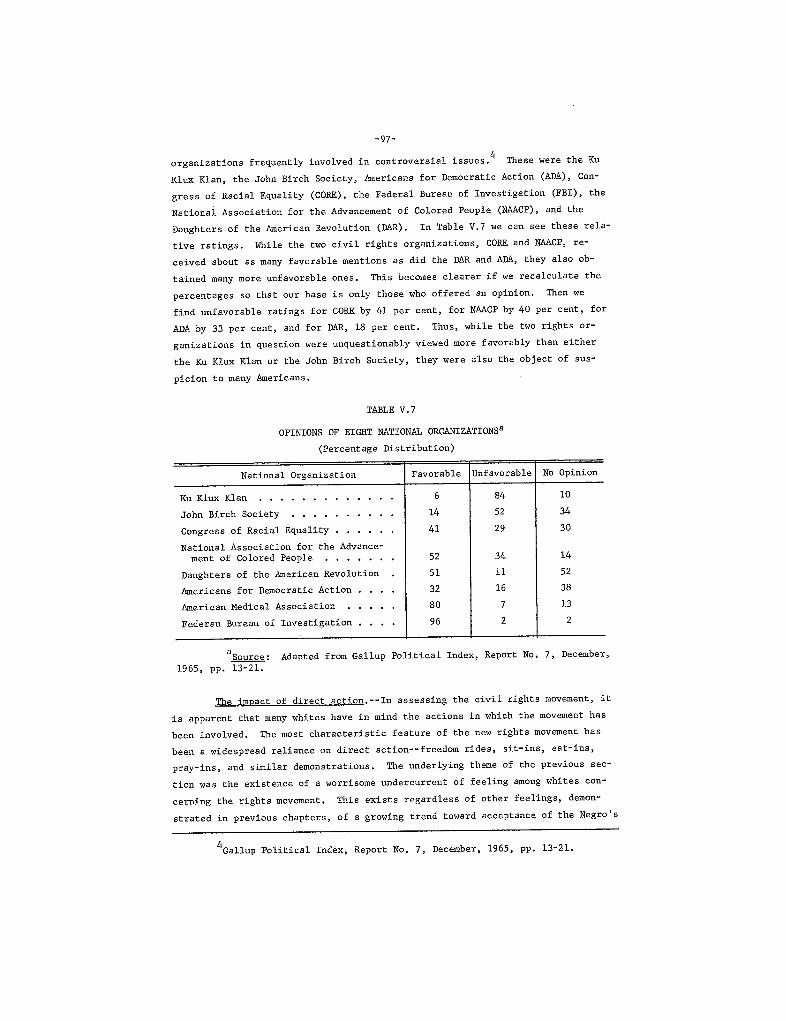
-97-
organizations frequently involved in controversial issues, These were the Ku
Klux Klan, the John Birch Society, Americans for Democratic Action (ADA), Con-
gress of Racial Equality (CORE), the Federal Bureau of Investigation (FBI), the
National Association for the Advancement of Colored People (NAACP), and the
Daughters of the American Revolution (DAR). In Table V. 7 we can see these rela-
tive ratings. While the two ciyil rights organizations , CORE and NAACP, re-
ceived about as many favorable mentions as did the DAR and ADA, they also ob-
tained many more unfavorable ones. This becomes clearer if we recalculate the
percentages so that our base is only those who offered an opinion. Then we
find unfavorable ratings for CORE by 41 per cent , for NAACP by 40 per cent, for
ADA by 33 per cent, and for DAR, 18 per cent. Thus , while the two rights or-
ganizations in question were unquestionably viewed more favorably than either
the Ku Klux Klan or the John Birch Society, they were also the object of sus-
picion to many Americans.
TABLE V,
OPINIONS OF EIGHT NATIONAL ORGANIZATIONS
(Percentage Distribution)
National Organization Favorable Unfavorable No Opinion
Ku Klux Klan
John Birch Society
Congress of Racial EqualityNational Association for the Advance-
ment Colored People
Daughters the American Revolution
Americans for Democratic Action
American Medical Association
Federau Bureau of Investigation
Source1965 , pp. 13-21.
Adapted from Gallup Political Index, Report No. 7, December,
The jmpact of direct action , --In assessing the civil rights movement , itis apparent that many whites have in mind the actions in which the movement has
been involved. The most characteristic feature of the new rights movement has
been a widespread reliance on direct action--freedom rides, sit-ins , eat-ins
pray-ins , and similar demonstrations. The underlying theme of the previous sec-
tion was the existence of a worrisome undercurrent of feeling among whites con-
cerning the rights movement. This exists regardless of other feelings, demon-strated in previous chapters , of a growing trend toward acceptance of the Negro
Ga1lup Political Index, Report No. 7, December, 1965, pp. 13-21.
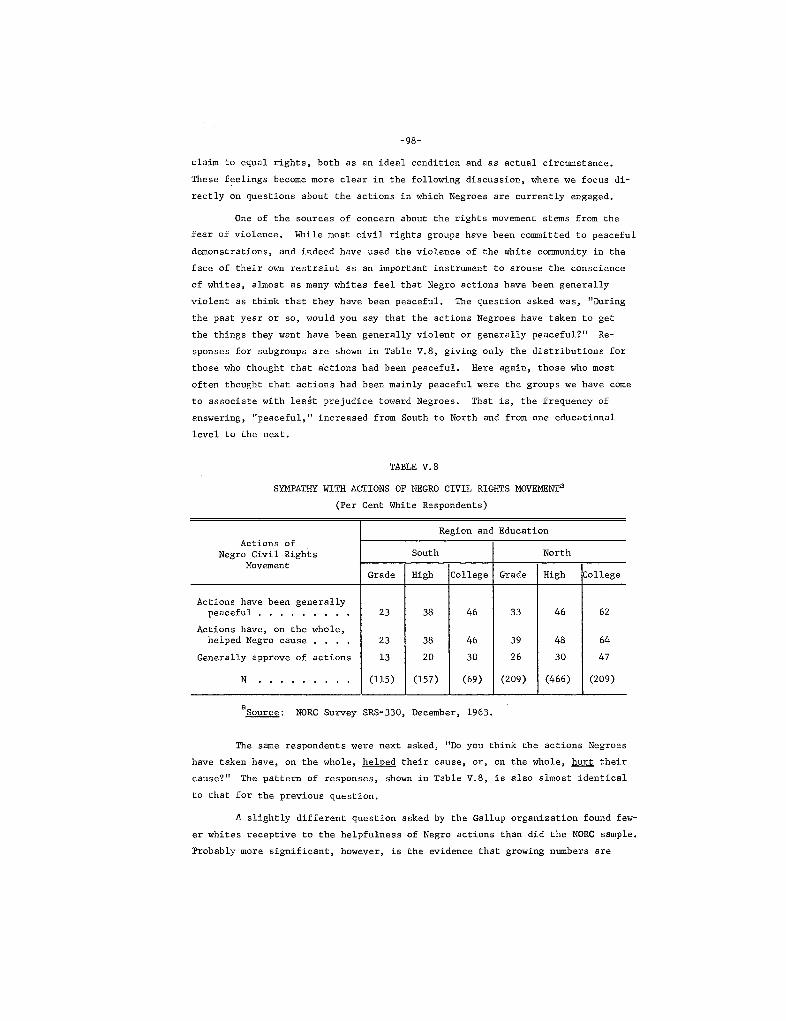
-98-
claim to equal rights , both as an ideal condition and as actual circumstance.These feelings become more clear in the following discussion, where we focus di-
rectly on questions about the actions in which Negroes are currently engaged.
One of the sources of concern about the rights movement stems from the
fear of violence. While most civil rights groups have been committed to peaceful
demonstrations , and indeed have used the violence of the white community in theface of their own restraint as an important instrument to arouse the conscience
of whites , almost as many whites feel that Negro actions have been generally
violent as think that they have been peaceful, The question asked was
, "
During
the past year or so , would you say that the actions Negroes have taken to get
the things they want have been generally violent or generally peaceful?" Re-
sponses for subgroups are shown in Table V, , giving only the distributions for
those who thought that actions had been peaceful. Here again, those who most
often thought that actions had been mainly peaceful were the groups we have come
to associate with least prejudice toward Negroes. That is , the frequency of
answering, "peaceful " increased from South to North and from one educational
level to the next.
TABLE V.
SYMATH WITH ACTIONS OF NEGRO CIVIL RIGHTS MOVEMENT
(Per Cent White Respondents)
Region and EducationActions of
Negro Civil Rights South NorthMoyement
Grade High College Grade High College
Actions have been generallypeaceful
Actions have on the whole,helped Negro cause
Generally approve of actions
(115) (157) (69) (209) (466) (209)
Source NORC Survey SRS-330 , December , 1963.
The same respondents were next asked
, "
Do you think the actions Negroes
have taken have, on the whole helped their cause , or, on the whole hurt theircause?1I The pattern of responses, shown in Table V. , is also almost identical
to that for the previous question,
A slightly different question asked by the Gallup organization found few-
er whites receptive to the helpfulness of Negro actions than did the NORC sample.
Probably more significant , however, is the evidence that growing numbers are

-99-
becoming convinced that demonstrations hurt the cause of racial equality.
1963 and 1964, Gallup asked
, "
Do you think mass demonstrations by Negroes are
more likely to help or more likely to hurt the Negro s cause for racial equality?"
As Table V. 9 shows , the per cent who feel that Negroes will be helped declined
from 21 to 10 in the year spanned.
TABLE V.
DO DEMONSTRATIONS HELP OR HURT NEGROES' CAUSE?
Effect Demonstrations 1963 1964on Negroes Cause
HelpHurt
differenceopinion
a SourceAIPO release, June 7, 1964.
What has been the personal impact of all of this? A further question
from the 1963 NORC survey aids our assessment. Respondents were asked
, "
How do
you yourself feel about these actions--do you genera1ly approve of them or gener-al1y disapprove of them?" Patterns of those approving are again reported in Table8. The pattern is expectedly familiar. More noteworthy are the relatively
small proportions who say they approve , in no case representing a majority of
any of the six groups, In presenting responses favorable to the actions of civi rights groups from three questions in the same table , it becomes clearer where
the tension lies. While there are considerable numbers who consider civil rights
activities to have been generally peaceful and helpful to the Negro cause, it is
only among college- educated northerners that a majority holds these views, More-
over, in all cases, from 10 to almost 20 per cent fewer are themselyes in person-
al agreement with how civil rights groups have behaved. In other words, there
appears to be a grudging recognition among many whites that demonstrations, peace-
ful or otherwise, are an important part of the struggle for equal rights. Yet
while they are increasingly in favor of these .rights for Negroes , they are person-ally much less likely to appreciate the steps which civil rights leaders feel are
important to take, steps which are more likely to upset the equilibrium of white
society and point up the history of chronic injustice.
Another indication of the extent of disapproval comes from a Harris sur-
vey, conducted in 1965. Respondents were presented with a list of different
kinds of people includin American Communist Party members , people who don t be-
lieve in God, civil rights demonstrators, working career women with young chil-
dren, homosexuals , women who gossip all the time, and young people who read books
most of the time, and were asked, "America has many different types of people in
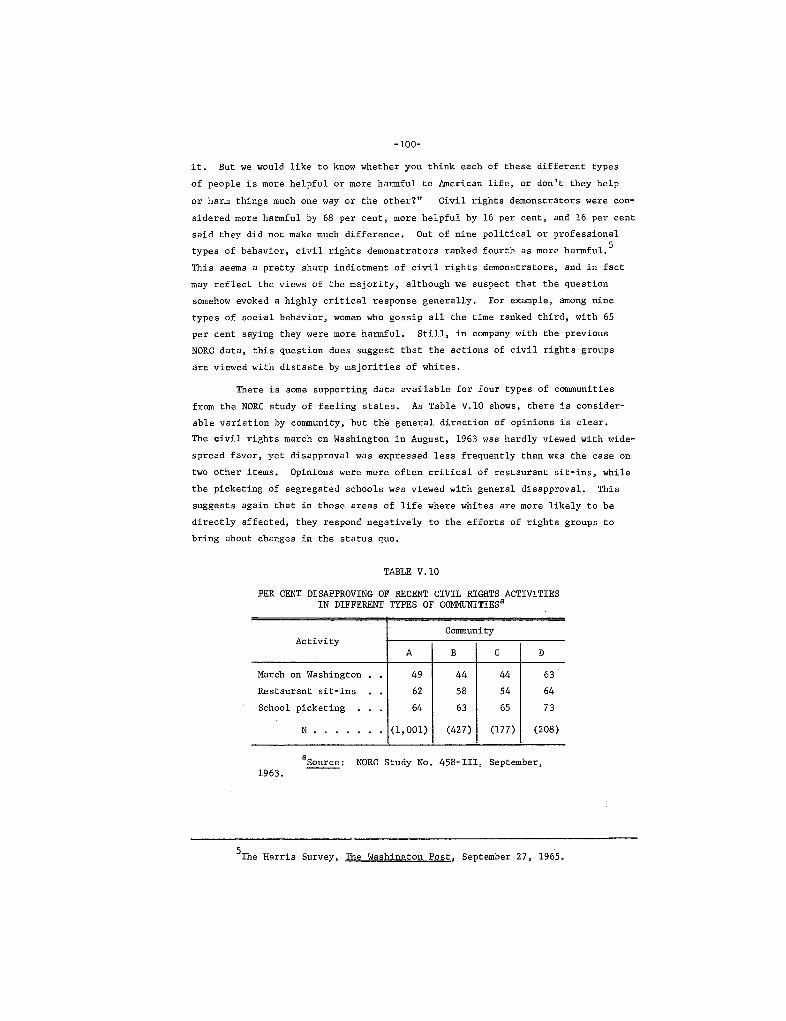
-100-
it, But we would like to know whether you think each of these different types
of people is more helpful or more harmful to American life , or don t they help
or harm things much one way or the othe
'?"
Civil rights demonstrators were con-
sidered more harmful by 68 per cent , more helpful by 16 per cent , and 16 per cent
said they did not make much difference. Out of nine political or professional
types of behavior, civil rights demonstrators ranked fourth as more harmful.
This seems a pretty sharp indictment of civil rights demonstrators , and in fact
may reflect the views of the majority, although we suspect that the question
somehow evoked a highly critical response generally. For example , among nine
types of soci l behavior, women who gossip all the time ranked third, with 65
per cent saying they were more harmful, Still, in company with the previousNORC data , this question does suggest that the actions of civil rights groups
are viewed with distaste by majorities of whites.
There is some supporting data available for four types of comunitiesfrom the NORC study of feeling states. AsTable V. 10 shows, there is consider-able variation by comunity, but the general direction of opinions is clear.The civil rights march on Washington in August , 1963 was hardly viewed with wide-
spread favor, yet disapproval was expressed less frequently than was the case on
two other items. Opinions were more often critical of restaurant sit-ins , while
the picketing of segregated schools was viewed with general disapproval. This
suggests again that in those areas of life where whites are more likely to be
directly affected, they respond negatively to the efforts of rights groups to
bring about changes in the status quo.
TABLE V, 10
PER CENT DISAPPROVING OF RECENT CIVIL RIGHTS ACTIVITIESIN DIFFERENT TYPES OF COMMNITIES
CommunityActivity
March on Washington
Restaurant sit-ins
School picketing
N . 001) (427) (177) (208)
Source: NORC Study No, 458-111 , September1963.
The Harris Survey, The Washington Post , September 27, 1965.

To briefly sumarize , then, evidence from different surveys and questions
asked in recent years enables us to see that the activities of civil rights groups
which employ direct- action techniques to ensure that Negroes can enjoy their
civil rights , arouse concern and disapproval among whites. Whites may agreethat Negroes should have these rights , but they hide from the fact that actions
distasteful to them must be employed to guarantee that equal rights become real-
ity. We have also suggested that the pattern of approval for rights actions
follows that established on questions of specific rights. In other words , amount
of education and region of residence are also associated with approval of direct
action, The most unequivocal demonstration of white disapproval of demonstra-
tions comes from a 1964 Gallup question: "People have different views about the
Negro demonstrations. With which view do you agree? Some people say the Negroes
should stop their demonstrations now that they have made their point , and even
though some of their demands have not been met. Others say they have to contin-
ue demonstrating in order to achieve better jobs, better housing, and better
schooling. With which view do you agree?" .Nationally, 73 per cent said Negroesshould stop, 19 per cent felt they had to continue, while 8 per cent had no opin-
on.
Further insight on the impact of direct action on the white comunitycomes from a California poll conducted in November , 1965. Here the focus was
not on protests organized by civil rights groups but on the more spontaneous
outbursts arising from the frustrations of ghetto life. In August of 1965, the
Watts area of Los Angeles was torn by days and nights of riots , and several months
later, a sample of respondents throughout the state was interviewed concerning
their feelings. Asked what they thought were the most important causes behind
the riots, 36 per cent of the white respondents replied that it was lack of re-spec.t for law and order and 28 per cent answered that it was caused by outside
agitators. Widespread unemployment received 22 per cent of the mentions and bad
living conditions , 15 per cent, Publicized grievances , such as lack of communi-
cation between Negroes and whites , police mistreatment , and unfair practices by
white merchants and landlords apparently made little impression on the white
public, and altogether received less than 10 per cent of the mentions.7 In an-swer to the question
, "
One thing that riots did was to bring attention to the
bad conditions that exist in Negro slums. Seventy-two per cent of respondents
agreed. But , more crucial to our interest , 70 per cent agreed that "People are
AIPO release , November 13, 1964.
Findings are based on a sample of 1 260 adults , 1 167 of whom werewhite. Only the responses of whites are reported here. Respondents could men-tion more than one cause for the riots. The California Poll , Release No. 502November 24, 1965.

-102 -
less sympathetic now toward the civil rights movement than they were before the
riots. li
The pace of change --We can well anticipate from the foregoing that Wh
will object to the speed with which changes are being introduced. For example,
in the four types of communities previously referred to, the largest share of
respondents in each community answered " too fast " to the question "How fast doyou think the equal rights movement is moving?"
Comunity B to 70 per cent in Community D.
This ranged from 48 per cent in
The only other relevant questions available on the speed with which the
civil rights battle is being pushed concern the activities of government. Since
participation of government agencies and the executive branch in the introduction
and enforcement of equal rights is more prominent now than at any time since the
Civil War and its aftermath, these questions certainly have considerable timeli-
ness. Beginning in ).963, Gallup asked
, "
do you think the Kennedy adminis-
tration is pushing racial integration too fast , or not fast enough?" Since then
the question has been asked three times in 1965 , in terms of the Johnson adminis-
tration. A majority of respondents in each case expressed dissatisfaction with
the pace of change , as contrasted with those who felt that things were about
right or who had no opinion. But those who felt that the administration was push-
ing integration too fast outnumbered those who felt that it was not fast enough
by at least two to one. The per cents who believed the pace to be too fast are
shown in Table V. , contrasting northern and southern views.
TABLE V. 11
PER CEN WHO FEEL ADMINISTRATION IS PUSHING INTEGRATION TOO FAST
RegionSource Tota 1
South North
AIPO 673-K:May, 1963
AIPO release ril 11:March 1965
AIPO release 12:May, 1965
AI PO release ustAugust 1965
The California Poll , Release No. 503, November 25, 1965.
See above, Chapter II, on the speed of school desegregation.

-103-
The growing proportion who felt that things were moving too fast , especi-
ally between March and May, 1965, is striking. While detailed information is not
yet available , it seems clear that the bulk of the change in opinions took place
in the North. During this period, civil rights demonstrations were moving north
on a large scale for the first time, and as we know , whites , regardless of region
do not like them. Since then, however, there is some indication that opposition
is subsiding slightly in both regions,
From a somewhat different perspective , there are other indications that
a more moderate pace is desired by the majority of whites, in both the North and
the South. In a survey done about the time of the 1964 presidential electionGallup asked respondents
, "
Some people say the Civil Rights Law guaranteeing
equal rights for Negroes should be strictly enforced right from the beginning,
Others say a gradual persuasive approach should be used at first. Which approach
would you rather see used?" National results show 23 per cent in fayor of strict
enforcement , 62 wanting a gradual approach , and' the remainder giving qualified orno answers. Not only do a majority of southerners favor a gradual approach
but this view is also shared by over 60 per cent of northerners.
Future Prospects
Tieing together our discussion of the rights demanded by Negroes , the
willingness of whites to participate in an integrated society, and the reluctant
acceptance of civil rights groups and their activities are questions of how
whites perceive the future. Will there be more violence, as Negroes press even
more strongly for their rights? Is there any hope of solution to the conflictbetween Negroes and whites? These and related questions will be considered as
a conclusion to this chapter.
the benefit of trend data.
Fortunately, much of this discussion will have
Race problems --Expectations of violence underlie the opinions of many
whites regarding the outcome of the current struggle for Negro rights, For ex-
ample, in 1963 Gallup asked southerners
, "
Do you think it (integration) will
come about in a more or less peaceful manner , or do you think there will be a
great deal of racial strife?" Only 21 per cent answered "peacefully, " while 42per cent said there would be some strife, and 30 per cent a great deal of strife.
In 1965 , NORC asked about the prospects of race riots in the North: "As you
probably recall, there were race riots in several northern cities in this country
last sumer. The way it looks now, do you expect that this sumer there will
Gallup Political Index, Report No, 3, August , 1965, p. 13.
AIPO release , November 13, 1964.
AIPO release, July 19, 1963.

-104-
many race riots around the country, some, hardly any, or none at all?" In reply,
more than 80 per cent of the sample said that they expected at least some vio-
lence. The accompanying Table V, 12 gives the distribution of responses for re-
gional and educational groups. While those in the North are inclined to be more
optimi stic than are southerners , both groups expected at least some violence,
These expectations are apparently not related to other views on integration
since the normally least prejudiced group-- college- educated northerners-- are notmuch different than the most prejudiced--grade school- educated southerners--when
the categories of "many" and " some" riots are collapsed,
TABLE V. 12
EXPECTATIONS OF RACE RIOTS IN SUMR OF 1965
(Per Cent White Respondents)
Region and Education
ExpectedRace Riots in South NorthSumer of 1965
Grade High College Grade High College
Many
Some
Hardly any
None
Don know
N . (101) (157) (86) (205) (480) (258)
Source NORC Survey SRS-857, June , 1965.
A survey conducted in 1963 by the Gallup organization was again concerned
with future prospects, In that case , however, results were quite different from
those just reported. No mention was made of violence, but only of possible trou-
bles, and this may have swung the majority of respondents to an optimistic view.Moreover, the reference was not to the respondent' s own community; this , too
may have increased optimism. The specific question was
, "
Do you think there is
likely to be any serious racial trouble in this comunity in the next two orthree years?" Respondents in both the North and the South answered most frequent-
ly that trouble was not likely. As Table V. 13 shows , educational differences are
minor within the two regions. Least optimistic, however, are the grade school-
educated southerners. In total, northerners are more likely than their counter-parts in the South to believe that trouble will be avoided in their cpmunity inthe coming years.

-105-
TABLE V. 13
EXPECTATIONS OF RACIAL TROUBLE IN OWN COMMTYa
(Per Cent White Respondents)
Trouble Region and Education
ExpectedSouth Northin Own
CommunityGrade High College Grade High College
Trouble likely.Have it now
Not likelyNo opinion
(358) (351) (170) (870) 307) (535)
Source AIPO Survey No. 673-K, May, 1963.
Speaking only in terms of problems and transferring the reference to the
entire nation, NORC interviewers asked
, "
Do you think that Negro-white relationswill always be a problem for the United States , or that a solution will eventu-
ally be worked out?" Optimism was moderated , presumably because focussing on
the nation as a whole directed respondents to think of comunities in both the
orth and the South where violence had occurred, and where whites showed them-
selves as intransigent. As Table V. 14 shows, optimism was somewhat more promi-
nent in the North, and increased with more education. In the South, however
the distribution of responses was uniform across educational lines. In other
words , the amount of schooling was not a critical factor affecting views of
southerners on the outcome of Negro-white problems. For all groups , however
the amount of pessimism expressed in answer to this question is especially note-
worthy.
TABLE V, 14
ASSESSMENT OF NEGRO-WHITE RETIONS AS CONTINUINGPROBLEM FOR TH UNITED STATES(Per Cent White Respondents)
Future Region and EducationNegro-White South NorthRelations asProblematic Grade High College Grade High College
Always a. problemEventual solution.
Don t know, No answe
N . (115) (157) (69) (209) (466) (209)
-_.
Source NORC Survey SRS-330, December , 1963.

-106-
Short- run prospects Questions ignoring direct reference to riots , vio-
lence , or mere trouble , but asking respondents to look ahead for the next yearor two , indicate the widespread prevalence of pessimistic attitudes toward the
short-term course of race relations. In 1944, as the tide of the war had turned
to the advantage of the Allies , respondents were asked
, "
After the war , do you
expect Negroes and white people to get along with each other better , or not as
well as they did before the war?" Of the total sample of white respondents , 23per cent said things would become better, 39 per cent worse , 23 per cent the
same , and the remainder gave qualified responses or did not know how things
would turn out. 13 It is difficult to interpret this question, since what peoplemean by "better " or "worse" depends on their general outlook on race relations.
For example , a respondent prejudiced against Negroes might see the prospects of
increased racial equality as worsening of relations. Despite this very ambigu-
ity, we have chosen t interpret such questions as referring to the possibility
of increased or decreased racial tension. This applies particularly to a seriesof Gallup polls , asked between 1957 and 1964.
The question asked was, "Do you think the situation in the South between
the races will get better or worse during the coming year?" In 1964, the ques-
tion was altered so that "in the South" was omitted, and the time covered was
shortened to six months. Results are shown in Chart V. l in the form of a regres-
sion line, where the per cent believing that the situation will get better is re-
gressed on time. Not only do those optimistic make up a minority of the popula-
tions sampled, but their share has declined over time, This is especially note-
worthy in view of the change of emphasis in
the nation as a whole. At that time , only
get better, a compared to 57 per cent who
the 1964 question from the South to
17 per cent thought that things would
said that they would get worse.
Long- range prospects --When we turn to longer- range assessments , it becomes
clearer that the majority do not see problems of Negro-white relations as utterlyhopeless , despite the foregoing results. This interpretation is supported by con-
sideration of a question first used by Gallup and repeated by NORC asking, "
you think the day will ever come in the South when whites and Negroes will be
going to the same schools, eating in the same restaurants, and generally sharing
the same public accommodations?"
1963, are presented in Chart V.
National data, available for 1957, 1958 , and
The per cent believing in the inevitability
of integration as a regression on time shows a . sharp trend upward. While it
would obviously have been useful to obtain more than these three measures for a
national sample, Gallup releases from 1956 to 1963 provide confirmation of in-
creasing, although not necessarily willing, acceptance of integration. These
NORC Survey No. 225, May, 1944.

o Per Cent
CH
AR
T V
. 1
LEAST SQUARES LINEAR TREND LINE IN PER CENT FEELING T
HT
THE SITUATION IN THE SOUTH
BE
TW
EN
TH
E RACES WILL GET
BETTER IN THE COMING YEAR, 1957-1964
(Total Respondents)
Stan
dard
Stan
dard
Error of
Error of
Est
imat
e
73.
-2.
June 25, 1961)
June 25, 1961)
Sour
ces
AIP
O, Jan., 1957 (released
AIP
O, Aug., 1957 (released
AIP
O 6
05-K
, Sept" 1958
AIP
O r
elea
se, June 25, 1961
AIPO release, June 5, 1964
Omi tting "in the South.
.I ,l t- t- t
- t-
I-
1. \.
\0
\0
U1
U1
0\0'
..
00 -c oY
ear'
'" W
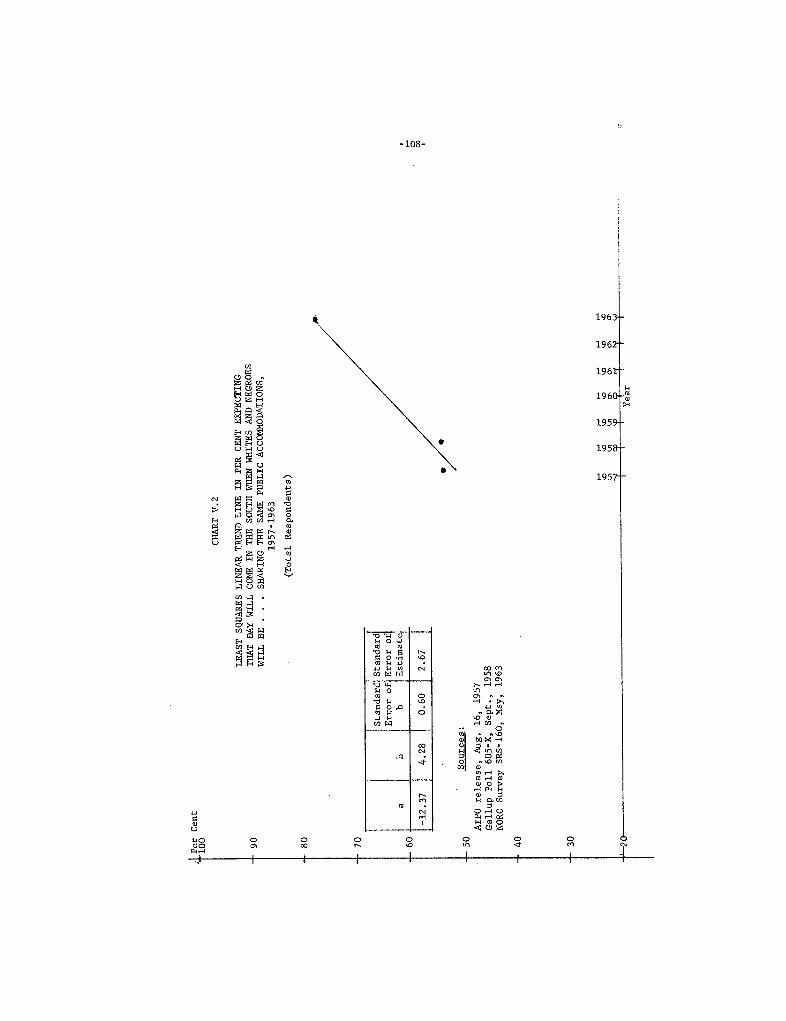
. 166
Cen
tC
HA
RT
V.
LEAST SQUARES LINEAR TREND LINE IN PER CENT EXPECTING
TH
AT
DA
Y W
ILL
CO
ME
IN T
HE
SO
UT
H W
HN
WHITES AND NEGROES
WILL BE . . . SHARING THE SAM PUBLIC ACCOMMODATIONS
1957
-196
3
(Total Respondents)
/8,
Stan
dard
Stan
dar
I Err
or o
f Err
or o
fla b
Est
imat
e60 ' ,
-12.
Sour
ces
AIPO release, Aug. 16, 1957
Gallup Poll 605-K, Sept., 1958
NORC Survey SRS-160, May, 1963
.. ..
.. ..
J- ..
\0 \0
\0 \0
\0 \0
l.
l. L
n 0'
C) (J
'I
'f f
l' l'
') ...
....
Yea
r
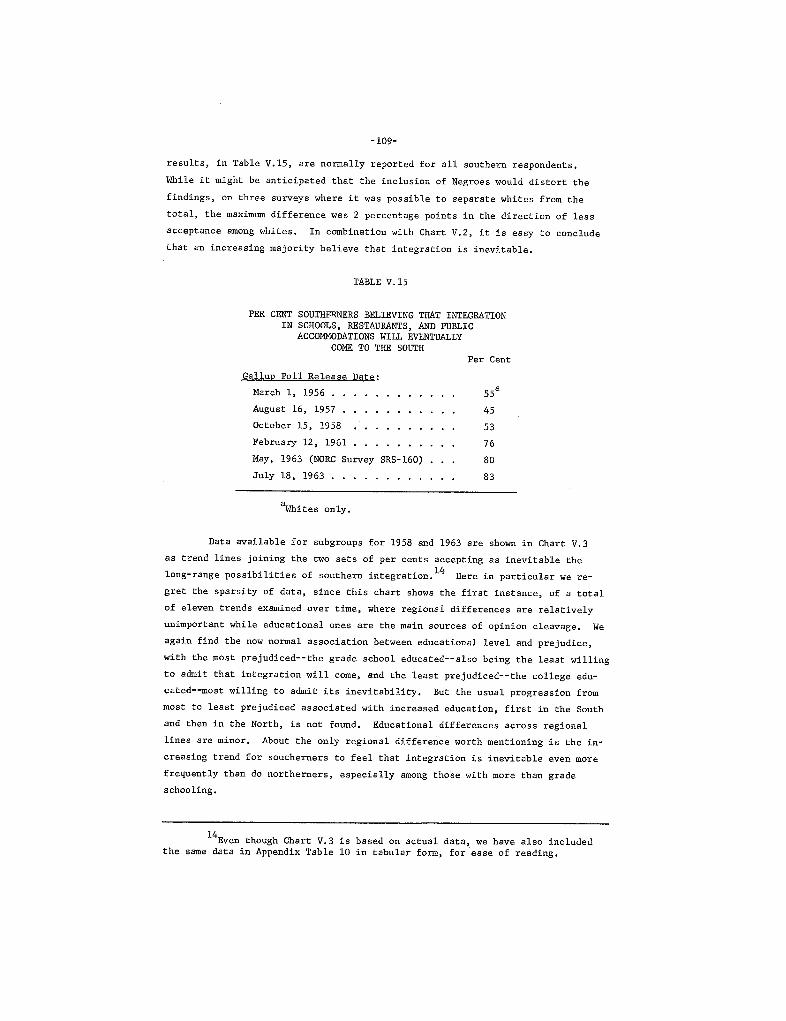
-109-
results , in Table V. , are normally reported for all southern respondents.
While it might be anticipated that the inclusion of Negroes would distort the
findings , on three surveys where it was possible to separate whites from thetotal , the maximum difference was 2 percentage points in the direction of lessacceptance among whites, In combination with Chart V. , it is easy to conclude
that an increasing majority believe that integration is inevitable.
TABLE V. 15
PER CEN SOUTH NERS BELIEVING THT INTEGRATIONIN SCHOOLS , RESTAURANTS , AND PUBLIC
ACCOMMODATIONS WILL EVENTUALLYCOME TO THE SOUTH
Per Cent
Gallup Poll Release Date
March 1 , 1956
, . . . . , . . . , . .
August 16 , 1957
October 15 , 1958
February 12 , 1961
May, 1963 (NORC Survey SRS-160)
July 18 , 1963
. . . . , , . . .
Whites only.
Data available for subgroups for 1958 and 1963 are shown in Chart V.
as trend lines joining the two sets of per cents accepting as inevitable the
long- range possibilities of southern integration. 14 Here in particular we re-gret the sparsity of data , since this chart shows the first instance , of a total
of eleven trends examined over time, where regional differences are relatively
unimportant while educational ones are the main sources of opinion cleavage.
again find the now normal association between educational level and prejudice,
with the most prejudiced--the grade school educated-- also being the least willing
to admit that integration will come, and the least prejudiced--the college edu-
cated--most willing to admit its inevitability. But the usual progression frommost to least prejudiced associated with increased education , first in the South
and then in the North, is not found. Educational differences across regional
lines are minor. About the only regional difference worth mentioning is the in-
creasing trend for southerners to feel that integration is inevitable even more
frequently than do northerners , especially among those with more than grade
schooling.
Even though Chart V, 3 is based on actual data, we have also includedthe same data in Appendix Table 10 in tabular form, for ease of reading.

t ,.,
'00
CH
AR
T V
,
PER CENT WHO FEEL THT DAY WILL COME IN
THE SOUTH WHEN WHITES AND NEGROES WILL
BE . . , SHARING THE
SAM
PU
BL
IC A
CC
OM
c
MO
DA
TIO
NS, 1955-1963
, ',: ,(
,-;f
, ,
-r )...
'2i:
,/ -f
NC=northern college
NH=northern high
NG
=no
rthe
rn g
rade
SC=southern college
SH=southern high
SG
=so
uthe
rn g
rade
Sour
ces
Gallup Poll 605-K, Sept., 1958
NORC Survey SRS-160, May, 1963
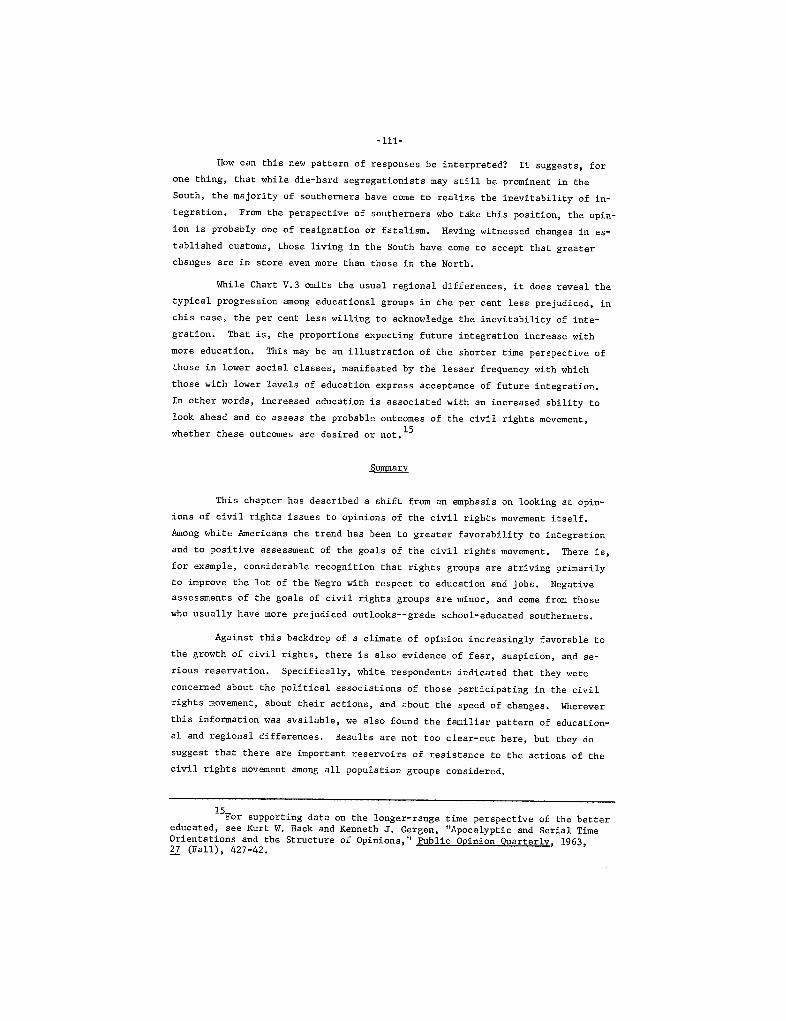
-111-
How can this new pattern of responses be interpreted? It suggests , for
one thing, that while die-hard segregationists may still be prominent in the
South , the majority of southerners have come to realize the inevitability of in-
tegration. From the perspective of southerners who take this position, the opin-
ion is probably one of resignation or fatalism. Having witnessed changes in es-
tablished customs , those living in the South have come to accept that greater
changes are in store even more than those in the North.
While Chart V. 3 omits the usual regional differences , it does reveal the
typical progression among educational groups in the per cent less prejudiced, in
this case, the per cent less willing to acknowledge the inevitability of inte-
gration. That is , the proportions expecting future integration increase withmore education. This may be an illustration of the shorter time perspective of
those in lower social classes, manifested by the lesser frequency with which
those with lower levels of education express acceptance of future integration.
In other words , increased education is associated with an increased ability to
look ahead and to assess the probable outcomes of the civil rights movement
whether these outcomes are desired or not.
Sumary
This chapter has described a shift from an emphasis on looking at opin-
ions of civil rights issues to opinions of the civil rights movement itself.
Among white Americans the trend has been to greater favorability to integration
and to positive assessment of the goals of the civil rights movement. There is,for example , cons derable recognition that rights groups are striving primarily
to improve the lot of the Negro with respect to education and jobs. Negative
assessments of the goals of civil rights groups are minor, and come from those
who usually have more prejudiced outlooks--grade school- educated southerners.
Against this backdrop of a climate of opinion increasingly favorable to
the growth of civil rights , there is also evidence of fear, suspicion, and se-
rious reservation. Specifically, white respondents indicated that they were
concerned about the political associations of those participating in the civil
rights movement , about their actions, and about the speed of changes. Wherever
this information was available, we also found the familiar pattern of education-
al and regional differences, Results are not too clear-cut here , but they do
suggest that there are important reservoirs of resistance to the actions of the
civil rights movement among all population groups considered.
For supporting data on the longer- range time perspective of the bettereducated, see Kurt W, Back and Kenneth J. Gergen, "Apocalyptic and Serial TimeOrientations and the Structure of Opinions Public Opinion Quarterly , 1963,
(Fall), 427-42.

-112-
The future looks fraught with tension to many whites when they consider
the course of Negro-white relations. Yet this is apparently true only for the
immediate future. In the long run, majorities have come to believe that integra-
tion is certain to occur. This is more likely to be true of opinions expressed
in the South. Belief that integration is unavoidable does, in fact , cut across
regional lines , with the better educated, who are presumably also those with alonger time perspective , most willing to concede the inevitable,

CHAER VI
THE CONTINUITY OF SOCIA CLEAVAGES IN ATTITUDES TOWARD NEGROES
The Present Situation
For the most part , we have been able to document a growth in favorable
attitudes to civil rights for Negroes. As yet , however, there are still major
boundaries to the widespread distribution of tolerant views. Tolerance limitsappear whenever there is the possibility of contact with large numbers of Ne-
groes. Another source of tension derives from the actions of civil rights
groups. Concerns steming from these sources are shared by many, and at times
by a majority of , white Americans. On other issues, the trend has been to grow-
ing favorability, but always accompanied by continuing and large- scale differ-ences between population groups. Primarily, these differences are found between
those living in the South compared to those living in the remainder of the coun-
try.els.
To a lesser extent , they are also found between different educational lev-
This final chapter will further explore possible explanations of the
findings and attempt to assess changes likely to occur in the future.
The Cumulative Nature of Change
When the direction, rate, and social context of opinion changes which
occur through time are examined, what inferences can be drawn about the causal
connection between opinions and events? Can we assume an association between a
course of events and subsequent public opinion? Or do particular events appear
to result in only minor fluctuations in opinion, so that recurring measures of
opinion remain more or less uniform in direction?
To a large extent , our manner of presentation of the opinion data has
presumed the second of the two alternatives. That is, part of our rationale for
The focus of this study has been on aggregate units-- samples of thetotal white population or regional and educational subgroups-- and the opinionshifts examined have been those of entire groups. Despite the very real impor-tance of focussing on the dynamics of opinion change at the individual level , wehave devoted our attention in this study solely to group changes. The questionswhich we ask about the possible causative factors that bring about opinion shiftsmust , then, necessarily be posed in terms of broad social considerations ratherthan in terms of social- psychological ones.
-113-
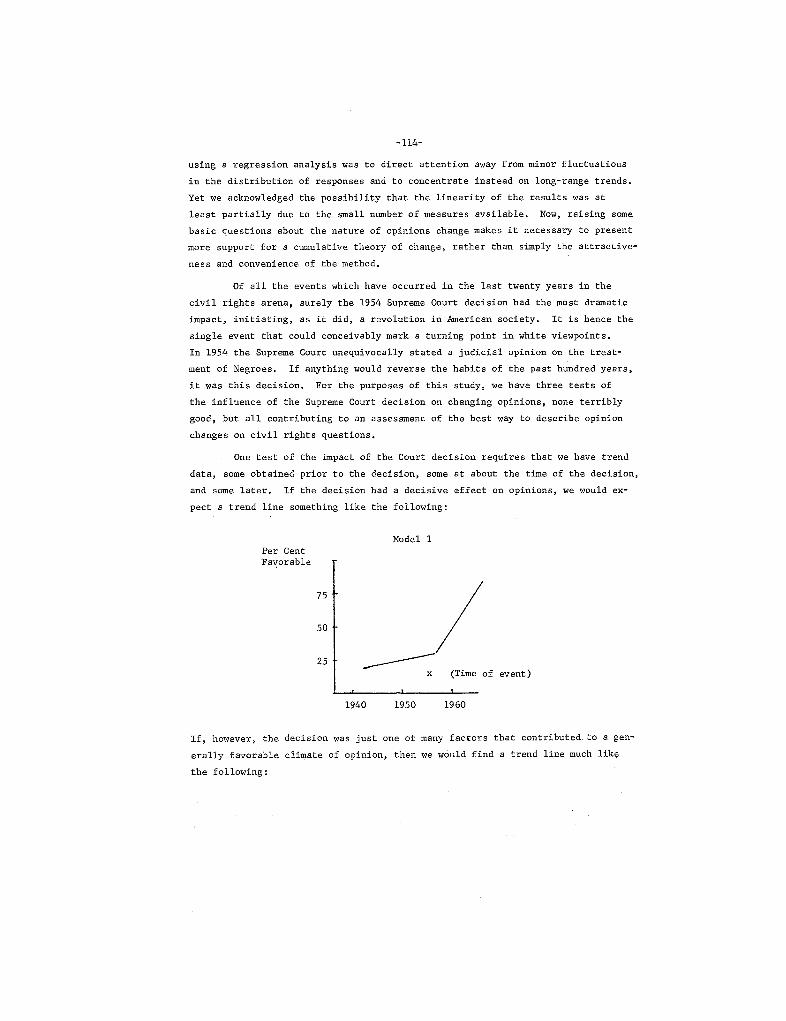
-114-
using a regression analysis was to direct attention away from minor fluctuations
in the distribution of responses and to concentrate instead on long- range trends.
Yet we acknowledged the possibility that the linearity of the results was at
least partially due to the small number of measures available, Now , raising some
basic questions about the nature of opinions change makes it necessary to present
more support for a cumulative theory of change , rather than simply the attractive-
ness and convenience of the method.
Of all the events which have occurred in the last twenty years in the
civil rights arena , surely the 1954 Supreme Court decision had the most dramatic
impact , initiating, as it did, a revolution in American society. It is hence the
single event that could conceivably mark a turning point in white viewpoints.
In 1954 the Supreme Court unequivocally stated a judicial opinion on the treat-
ment of Negroes. If anything would reverse the habits of the past hundred years
it was this decision. For the purposes of this study, we have three tests of
the influence of the Supreme Court decision on changing opinions , none terribly
good, but all contributing to an assessment of the best way to describe opinion
changes on civil rights questions.
One test of the impact of the Court decision requires that we have trend
data, some obtained prior to the decision, some at about the time of the decisionand some later. If the decision had a decisive effect on opinions, we would ex-
pect a trend line something like the fo llowing:
ModellPer CentFa'(orable
(Time of event)
1940 1950 1960
, hmlever, the decision was just one of many factors that contributed to a gen-
erally favorable climate of opinion, then we would find a trend line much lik
the following:
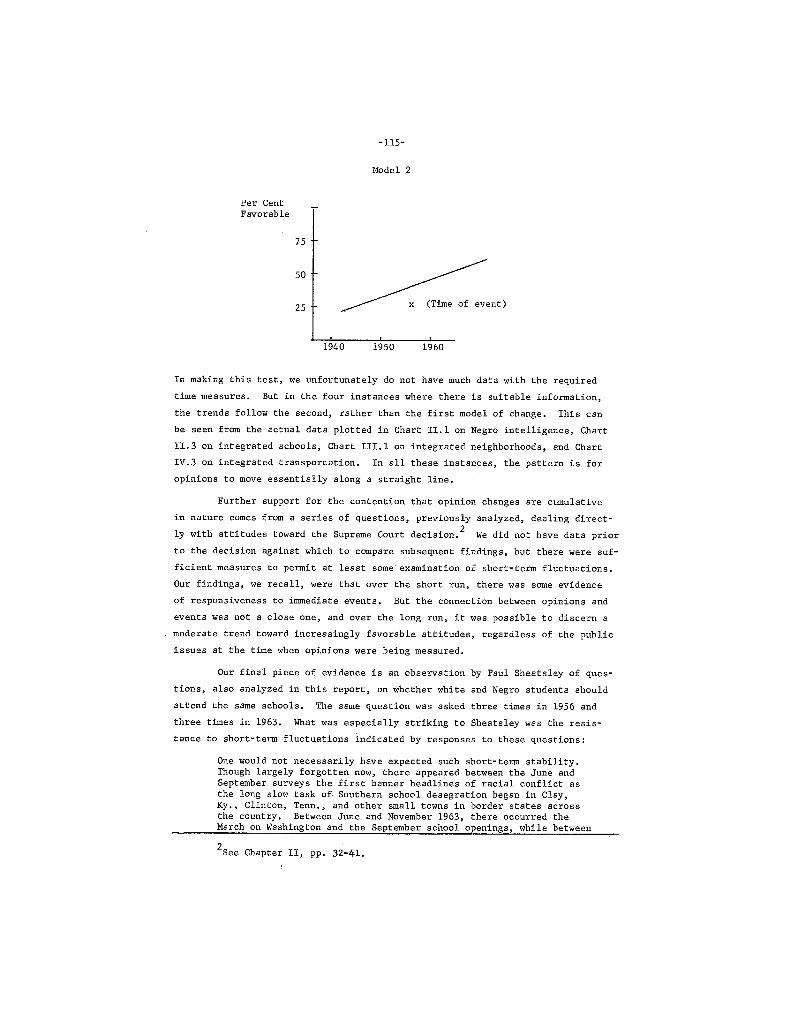
-115-
Model 2
Per CentFavorable
'"')
1940 1950 1960
In making this test , we unfortunately do not have much data with the required
time measures. But in the four instances where there is suitable information
the trends follow the second, rather than the first model of change. This can
be seen from the actual data plotted in Chart 11. 1 on Negro intelligence , Chart
11. 3 on integrated schools , Chart 111. 1 on integrated neighborhoods , and Chart
IV. 3 on integrated transportation. In all these instances , the pattern is for
opinions to move essentially along a straight line,
Further support for the contention that opinion changes are cumulative
in nature comes from a series of questions , previously analyzed, dealing direct-
ly with attitudes toward the Supreme Court decision.2 We
did not have data prior
to the decision against which to compare subsequent findings , but there were suf-
ficient measures to permit at least some . examination of short-term fluctuations.Our findings , we recall, were that over the short run, there was some evidenceof responsiveness to immediate events. But the connection between opinions and
events was not a close one, and over the long run , it was possible to discern a
moderate trend toward increasingly favorable attitudes , regardless of the public
issues at the time when opinions were being measured,
Our final piece of evidence is an observation by Paul Sheatsley of ques-
tions, also analyzed in this report , on whether white and Negro students should
attend the same schools. The same question was asked three times in 1956 and
three times in 1963. What was especially striking to Sheats ley was the resis-
tance to short-term fluctuations indicated by responses to these questions:
One would not necessarily have expected such short-term stability.Though largely forgotten now, there appeared between the June andSeptember surveys the first banner headlines of racial conflict asthe long slow task of Southern school desegration began in Clay,Ky., C inton, Tenn., and other small towns in border states acrossthe country. Between June . and November 1963, there occurred theMarch on Washington and the September school openings, while between
See Chapter II, pp. 32-41.

" 116-
the November and December surveys there intervened the shockingassassination of President Kennedy in a Southern metropolis, Buteven so dramatic an event , with all its implications for the civilrights movement , failed to disturb, in either North or South, theattitudes which had been expressed a month earlier.
Thus , even in the short run, at least on this one issue , the long-term movement
of opinions is barely deflected by even the most dramatic events.
Altogether , then, we feel that these different items of information sub-stantiate our claim that opinions on ciyil rights issues are best understood as
moving in a uniform direction, and becoming increasingly more favorable to Negro
aspirations, regardless of immediate events. This is not to say that events are
irrelevant , but rather that shifts in opinions on civil rights are better under-stood as responding to a host of events , such as the Supreme Court decision
school boycotts , sit-ins , and new contacts between whites and Negroes , that act
in such a way as to produce a climate of opinion generally favorable to Negro
rights.
If we accept this cumulative view of change , it is then possible to make
some predictions about the future course of opinion change. Assuming events con-
tinue to have the same impact in the future they have had in the pastcould assume that the rate and direction of opinion change would continuehas in the past. These assumptions may not be wholly valid; it is conceivable
that there may be a dramatic turn in events altering the manner in which white
Americans view race problems. Conceding this , it is still possible to engage in
what may only be a speculative exercise , but which has at the same time some like-
lihood of forecasting future opinion distributions. The procedure for making the
following predictions was a simple one , requiring ruler , pen, graph paper , and
the charts on which we had already plotted trend questions. The results, report-
ed in Table VI. , are hardly precise , but they can be treated as rough indicators
of future developments. In the case of each population group for each of elevenquestions , the problem posed was , given the current direction and rate of changehow long will it take until 90 per cent of the group adopt a view favorable to
Negro rights?
Table VI. l gives this information for all eleven questions on which twoor more measures were taken. On all questions where interviews were done at only
two points in time , the direction of change was normally not sufficiently consis-
tent to allow a prediction. Even where one was made, it cannot be regarded as
particularly reliable. Moreover, most of these same questions showed a decline
in the proportions favorable to equal rights , either for all or some subgroups.
It was obviously not possible in these cases to predict when 90 per cent would
paul B, Sheatsley, "White Attitudes Toward the Negro Daedalus , 1966(Winter), 220.
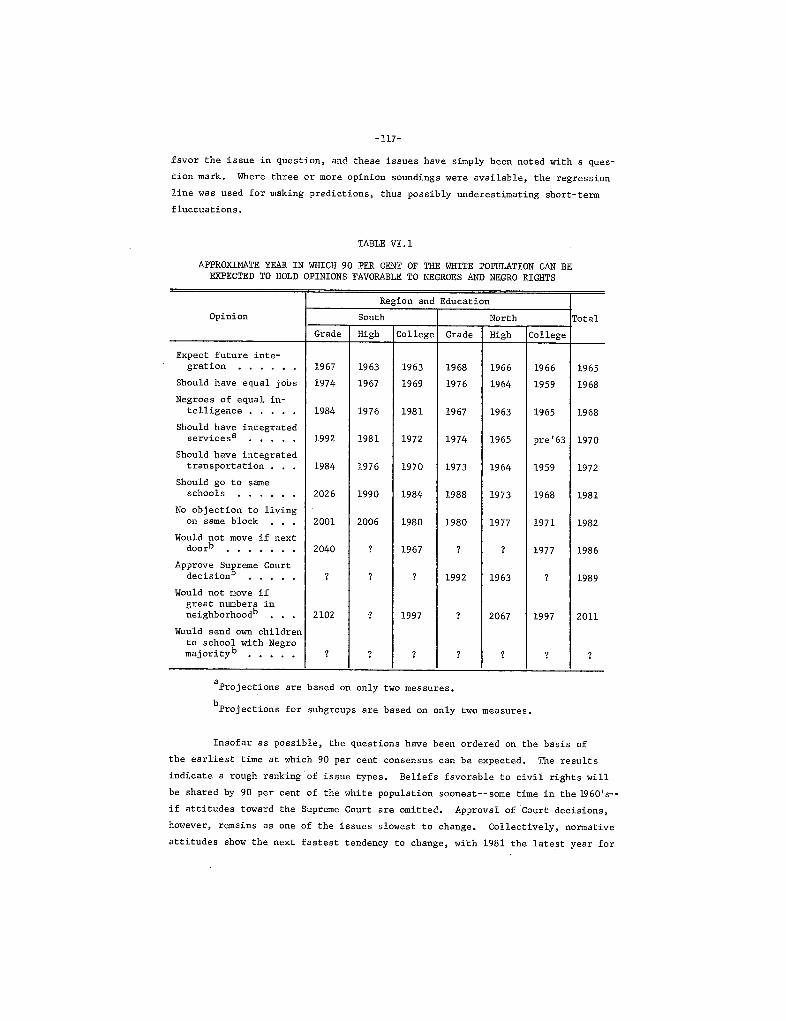
-117-
favor the issue in question , and these issues have simply been noted with a ques-
tion mark. Where three or more opinion soundings were available , the regression
line was used for making predictions , thus possibly underestimating short-term
fluctuations.
TABLE VI. 1
APPROXIMATE YEAR IN WHICH 90 PER CENT OF THE WHITE POPUATION CAN BEEXPECTED TO HOLD OPINIONS FAVORABLE TO NEGROES AND NEGRO RIGHTS
Region and Education
Opinion South North TotalGrade High Co 11ege Grade High College
Expect future inte-gration 1967 1963 1963 1968 1966 1966 1965
Should have equal jobs 1974 1967 1969 1976 1964 1959 1968
Negroes of equal in-telligence . 1984 1976 1981 1967 1963 1965 1968
Should have integratedservices 1992 1981 1972 1974 1965 pre ' 63 1970
Should have integratedtransportation. 1984 1976 1970 1973 1964 1959 1972
Should go to sameschools 2026 1990 1984 1988 1973 1968 1981
No objection to livingon same block 2001 2006 1980 1980 1977 1971 1982
Would not move if nextdoor 2040 1967 1977 1986
Approve Sugreme Court1992 1963 1989decision
. . . . .
Would not move ifgreat numbers inneighborhoodb .. 2102 1997 2067 1997 2011
Would send own childrento school with Negromaj ori ty b
projections are based on only two measures.
projections for subgroups are based on only two measures.
Insofar as possible , the questions have been ordered on the basis of
the earliest time at which 90 per cent consensus can be expected. The results
indicate a rough ranking of issue types. Beliefs favorable to civil rights will
be shared by 90 per cent of the white population soonest-- some time in the W60'
if attitudes toward the Supreme Court are omitted. Approval of Court decisions,however, remains as one of the issues slowest to change. Collectively, normative
attitudes show the next fastest tendency to change, with 1981 the latest year for

-118-
achieving consensus along this dimension. Slowest to change are opinions re
to social contacts. If the pace of change continues as it has in the past , it
will be well into the next century before whites will willingly accept partici-
pation in situations where they are a racial minority. In total , however , thiskind of ranking has an air of artificiality. For one thing, the numbers of ques-
tions in each category are exceedingly limited and hardly even representative of
the attitude dimensions. For another , of the questions available , it is clear
that the crucial factor in predicting the rate of change is the issue in question.
The two areas slowest to change are opinions pertaining to schools and those per-
taining to housing. But some difficulty in interpretation is introduced by ask-
ing about living among or sending children to school with large numbers of Ne-
groes. While this , in fact , is the situation faced by some whites, it is a high-
1y unlikely circumstance for most whites. Questions of this sort are useful in
indicating the limits of tolerance, but they are not so useful as predictors of
future behavior. StiLl , contacts in schools and neighborhoods remain as barriersagainst the full acceptance of Negroes. But as the predictions show, this does
not mean that whites are impervious to change. It only means that , comparatively
speaking, these areas remain as citadels of prejudice still to be overcome.
The Effects of Education
Many of the group differences discussed in this report have documented
the now familiar finding that the better educated, especially if they have school-
ing beyond high school , are more tolerant of racial and ethnic minorities and more
responsive to the protection of civil rights. Unfortunately, the literature is
much more meager when it comes to accounting for the reason that higher education
has such effects. Several reasons for the socially liberalizing consequences of
college training can be suggested. To begin with, attendance at college is fre-quently the first serious challenge to students ' standards and beliefs acquired
from, and supported by, family, comunity, religious , and other salient groups.
This challenge comes from exposure to new ideas in a new learning environment
and from exposure to a frequently heterogeneous social environment. For many
students , the results of these new experiences include the acquisition of differ-ent values and interests and a willingness to consider the previously unknown as
For example, see Samuel A. Stouffer Communi sm. Conformitv. and CivilLiberties (New York: Doubleday, 1955); James W, Prothro and Charles W. Grigg,Fundamental Principles of Democracy, Journal of Politics , 1960, (Spring),276-94; G. H. Smith
, "
Liberalism and Level of Information Journal of Education-
al Psychology , 1948 , 65-82; Charles Herbert Stember Education and Attitude
Change (New York: Institute of Human Relations Press, 1961); James G, Martinand Frank R. Westie
, "
The Tolerant Personality, American Sociological Review
1959, (August), 521-28.
A good sampling of the writing on this subject is contained in SanfordNevitt (Ed.
),
The American College (New York: John Wiley & Sons, 1962).

-119-
at least engaging if not attractive. This is a period when students become more
sophisticated and set off from those with less education in their understanding
of and support for abstract principles. The opening of new intellectual and
social horizons brings with it a feeling of greater mastery over the external
environment. For example, in a study of voting behavior , the Survey ResearchCenter found that increased education was associated with an increased sense of
political efficacy, " of conviction of an ability to personally affect the po-
litical process.6 The
greater ego strength associated with advanced education
decreases the likelihood of a need to project hostility onto outgroups or to
curtail the freedom of those who are somehow different. Of course, the process-es set in motion by attendance at college do not affect all those with some col-
lege education, but they do suggest the ways in which higher education has lib-
eralizing consequences. Finally, we should not overlook the very real possibil-
ity that the more tolerant views of the better educated stem partly from their
greater verbal facility and their awareness of the more socially acceptable re-
sponses.
The greater tolerance of the better educated has not , despite the evi-
dence cited, gone unchallenged. Charles Stember, in reviewing some of the same
data used in this report , along with additional data on both Negroes and other
minorities , presents more limited conclusions on the effects of education.sees the better educated as more likely to reject some stereotypes about minori-
ties , for example, those about such inherited characteristics as racial differ-
ences in blood. But he suspects that , if public opinion polls were geared to
reveal more subtle aspects of stereotyping, we would find that the better edu-
cated were not free from some generalized prejudices. For example, there is a
greater tendency for the better educated to see Jews as Comunists or racketeer&
Strongest support for legal measures against discrimination comes from the better
educated, parallel to our own findings on laws and general normative views, ButStember feels that intimate forms of social contact are as much rejected by the
college educated as by the less well educated , although causal forms of contact
are more acceptable to the former.
Our own conclusions are much less equivocal, though of course we have
avoided the complication of considering attitudes toward different minorities.
For example, it is clear from Stember ' s work that attitudes toward Jews are es-pecially salient to the better educated and the upper class. This is not true
of attitudes toward Negroes. 8 Still, Stember ' s reservations prompted a review
Angus Campbell , Philip E. Converse, Warren E. Miller, and Donald E.Stokes, The American Voter (New York: John. Wiley & Sons, 1960), p, 479,
Stember OP. cit ., p. 20.
Ibid ., p. 180. Interestingly enough, Stember does not feel that theparticular group that is the target of prejudice is especially important.

-120-
of the data presented here. The question at issue was whether there were any
instances when the college educated were more prejudiced than the remainder,
Out of sixty-nine questions where data were reported by education, there were
six instances where the college educated showed more prejudice than did their
less well-educated regional counterparts. Three of these questions referred to
the possibility of contact with large numbers of Negroes. In two Gallup surveys
in 1958, the college- educated northerners , normally the most tolerant , were morereluctant than others in their region to send their children to schools where
there would be a majority of Negro students or to feel that they would not move
if Negroes came to live either next door or in their neighborhood in large num-
bers. 9 Yet in the face of all the data examined in this report , these findingsare hardly sufficient to presume that the college educated are notably more re-
luctant , as. Stember has concluded for his data , to engage in intimate relationswith Negroes. Our own conclusions remain that , for the issues considered here,
there is a clear- cut association between education and attitudes toward integra-
tion.
Referring back to Table VI. , and considering only those issues where
more than two measures are available, some further coment can be made about theamount and nature of differences between educational levels. Within each region
the greatest amount of difference, in this case in the time it will take to achieve
90 per cent consensus , is between the college and grade school educated. The high
school and grade school educated are next in extent of difference in outlook, and
the college and high school educated are most alike,
The greatest gap between educational levels is found in the South. The
most divisive issues there are education and housing, with education setting off
the grade school educated from the remainder , and housing differentiating between
those with a college education and those with less schooling. It will take the
grade school educated approximately forty-two years to catch up with the college
educated in per cent agreeing to the desirability of integrated schools. These
two groups will be separated for about twenty- one years until 90 per cent do not
obj ect to having a Negro live on the same block. The grade school educated willtake fourteen years longer than the college educated before 90 per cent agree to
the appropriateness of integrated public transportation. The most divisive issue
between high school and grade school educated is integrated schools. If trends
continue in their present direction and at their present rate, it will take the
high school educated until 1990 before 90 per cent agree that schools should be
integrated and until 2026 before the grade school educated have a similar con-
sensus. The college and high school educated have one major bone of contention--
a willingness to live on the same block with a Negro family. Ninety per cent of
Data are reported in Table 11. 7, charts 111. 4 and 111.
-121-
the former can be predicted to accept this by 1980, but it will take approximate-
ly until the year 2006 for this level of acceptance to be achieved by the latter.
In the North , differences between educational levels are not of such
great magnitude. Still, it will take the grade school educated between fourteento twenty years longer to achieve the same level of tolerance as the college edu-
cated on integrated schools and transportation and on equal job opportunities.Jobs and schools also, though to a somewhat lesser extent , differentiate the
grade school from the high school educated. Of the six issues under review
none shows a predicted time separation of more than six years in which it will
take the high school and college educated to achieve consensus.
These findings are simply another way of stating what we have concluded
from previous chapters: that educational increments from grade school to high
school to college are associated with greater tolerance for Negroes and Negro
rights. Yet the procedure of predicting changes does draw attention to two im-
portant phenomena. The first relates to issues where subgroup differences are
greatest , the second to the extent of differences within regions.are jobs , housing, and schools,
These issues
We previously noted the salience of equal job opportunities in the North,
In Chapter IV we observed that the grade school educated were slower to acknowl-
edge that Negroes should have the same opportunities as whites to obtain employ-
ment. At that time we attributed this to the threat of increased job competitionfrom Negroes felt by poorly-educated whites. According to Table VI. , grade
school- educated northerners have been moving so slowly in their rate of opinionchange, that 90 per cent of their educational counterparts in the South may come
to accept the morality of equal job opportunities about two years earlier than
they,
In Chapter III the opposition of southerners with less than a college
education to the possibility of living on the same block with a Negro family of
similar education and income was discussed. This was the one major instance
when the high school educated took a stand similar to , in fact more extreme
than the grade school educated. The data at hand offered no explanation forthese viewpoints , but changing patterns of housing in the South , especially the
movement to all-white suburbs , suggested that southerners felt most vulnerable
to the impact of Negro neighbors on their privileged position.
In both the North and the South, though to a greater extent in the South
probably the most notable opinion differences revolve around the issue of inte-
grated schools. Data reported in Chart 11. 4 revealed the great gaps existing
between and within regions. These data suggest that a greater amount of opinion
change took place in the South than in the North between 1956 and 1963. But
predicted changes reported in Table VI. l show that , continuing at the present
pace, it will take the South several generations longer to catch up with the

-122-
North. Table VI. l also points up the extent of differentiation in the rate of
change for the grade school educated as compared to those with at least some high
school education. Why should the grade school educated be dragging their feet
We can suggest two seemingly contradictory reasons. On theto such an extent?
one hand, the better educated are more apt to , first , recognize the morality of
integrated education in terms of the opportunities this represents for Negro
children and to, second , appreciate the benefits .of exposure to a diversifiedsocial environment for whites as well as for Negroes. Insofar as higher educa-
tion tends to broaden perspectives and increase appreciation of exposure to
varied experiences , it might be assumed that those with college training will
feel that white children have much to learn from attending schools where there
are also Negro children, Yet , at the same time , the better educated , who are
also more likely to be among the higher income groups, haye an alternative avail-
able to them. While paying lip service to integrated schooling, they can , and
frequently do, withdraw their own children from the public schools whenever they
feel that the caliber of education is not at a desired level. We have no evidence
one way or the other that integration lowers the quality of education for white
children, but it often does add new problems, especially when the Negro children
come from lower- class homes. In response to these new problems , or in anticipa-tion of them, those with the financial resources often enroll their children in
private schools , thereby helping to make a self-fulfilling prophecy out of their
prediction that schools will decline in quality as soon as Negroes are enrolled.
The grade school educated do not have these alternatives , nor do they have the
imagination to see any positive advantage to their own children attending inte-
grated schools. It is this segment of the population, then, that presents great-
est resistance to school integration, either in law or in fact.
Our final question is why there is more difference between educational
levels in the South than in the North, particularly between the college and grade
school educated. To some extent , as we have pointed out , this difference is due
to the differential impact of issues , a phenomenon noticed in the North as well.
Yet it is also apparent that there is something about southern society that cre-
ates and perpetuates this difference between educational levels. Enough has been
said and written about the uniqueness of the South, even when recognizing that
there are many Souths , to make further discussion of this subject tiresome.
was hardly necessary, for example , to ask why southerners were so different in
their responses to questions on Negro rights. The whole history of the South
has been such as to make relations with Negroes the central core of southern
identi ty. Here, however, we are faced with another kind of question--not why
the South in general is different from the North, but rather why internal differ-
ences are greater in the South than in the North. Our data provide no answers,
but we can garner some suggestions from a number of other sources.

-123-
The college educated in the South, as elsewhere , are better informed
more exposed to the mass media, and generally more aware of and responsive to
the national climate of opinion. We can imagine that the less parochial atti-
tude of the college educated has special significance in the South because of
how it must heighten awareness of southern differences. If living in the South
still hinders a full acceptance of Negro rights , the mind-opening experiences ofcollege training have at least made some impact. But living in the shelter of
southern society, those with less education are less frequently exposed to na-
tional viewpoints and , when they are , are generally more resistant to changing
their accustomed ways.
The South still possesses aspects of an aristocratic society, based on
a landed gentry. In such a society, the social differences between classes are
manifestly greater, in fact or in perception, than in a more open society.closed nature of the society contributes to greater differences in outlook.
The
This has been reinforced by a tradition of lukewarm support for, or even outright
opposition to, public primary and secondary education. For many generations
there was hardly such a thing in the South , and what existed was
ferior in quality to that available elsewhere in the country.
sentiments were strong in the South , and it should be remembered
distinctly in-Anti - populistthat such things
as literacy tests and poll tax requirements were aimed at keeping poor whites
from voting almost as much as Negroes. 11 As a result of a variety of steps taken
to perpetuate an archaically aristocratic society, it should not be surprising
that there is evidence of great differences in outlook between the most and
least educated.
As the civil rights movement increased in militancy, there was a tendency
for white southerners to blame "outsiders, " white as well as Negro , for bringingabout changes in established social patterns. Yet northerners who settle in the
South are frequently constrained from expressing views or behaving in ways dif-
ferent from their new neighbors. 12 This sense of constraint need not be true,however, in answering survey questions. Responding to a survey is a reasonablyprivate act , and northerners living in the South need not fear reprisals for an-
swering in a liberal fashion. It is a real possibility that part of the greater
William H. Nicholls Southern Tradition and Regional Progress (ChapelHill: University of North Carolina Press , 1960); Alfred O. Hero Jr" The South-erner and World Affairs (Baton Rouge: Louisiana State University Press, 1965),pp. 247-73; Solon T, Kimball, "Education and the New South " in John C. McKinneyand Edgar T, Thompson The South in Continuity and Change (Durham: Duke Univer-sity Press , 1965), pp. 260-76; Allan M. Cartter
, "
The Kole of Higher Educationin the Changing South in McKinney and Thompson op. cit pp, 277-97.
V. 0, Key Jr" Southern Politics in State and Nation (New York:Alfred A, Knopf, Inc., 1949), p. 531.
Hero OP. cit ., p. 457.

-124-
difference between educational groups in the South may be due to the responses
of migrants, There is , unfortunately, no way of relating geographic mobility to
opinions for our data , with the exception of one NORC survey conducted in 1963.
Since results have been reviewed elsewhere , a quotation should be sufficient to
establish our point.
Present northerners who formerly lived in the South (and these maybe eith r southern migrants or northerners who spent some time inthe South) are only slightly less pro-integrationist than theirneighbors who have never been exposed to southern life. In con-trast , southerners who have previously resided in the North differgreatly from their co- regionalists who have known nothing but south-ern life. The net effect of migration from one of the regions tothe other seems to be a strengthening of the cause of integration.Ex- southerners who move to the North appear generally to conform tonorthern attitudes, while ex-northerners who mOVe to the South (andsoutherners who have been temporarily exposed to northern living)tend to reject the more extreme segregationist views of the life-long southerner .
All that this tells us , of course, is that having once lived in the North , re-
spondents are more likely to be in tune with the general opinion climate on in-
tegration. But the question at issue here relates to educational differences
within the South. Data compiled by the Survey Research Center suggest that these,
too, may be affected by migration. From a 1956 study on voting behavior , it was
discovered that those persons who move to the South are disproportionately better
educated. Thirty per cent of northern migrants to the South had attended collegeand 90 per cent had at least a high school education.
14 All this suggests the
possibility that at least part of the greater difference between educational lev-
els in the South is attributable to the influence of college-educated migrants
from the North;
The level of education of the American populace has risen phenomenally
over the years. The evidence of change can even be seen over a relatively short
time span. For example, in 1940, 57 per cent of the white population twenty-five
years of age and over had only a grade school education or less. At the time of
the 1960 census , this proportion had dropped to 38 per cent , with comensurate
increases in the proportions who had attended either high school or college.
These changes continue to take place throughout the nation, though more slowly
in the South than elsewhere. Yet , as Table VI. 2 indicates , the difference be-
tween the North and the South in the proportions with some college training in
both 1950 and 1960 is minor. This may mean that it is necessary for the South
to share in a general upgrading of education before the effects of a more liberal-
ized outlook become widespread. As Myrdal said twenty-five years ago
, "
Southern liberalism has aristocratic traditions. As a movement it is as yet
Sheatsley, OP. cit ., pp. 227-28.
campbell et al
.,
OP. cit ., p. 449.
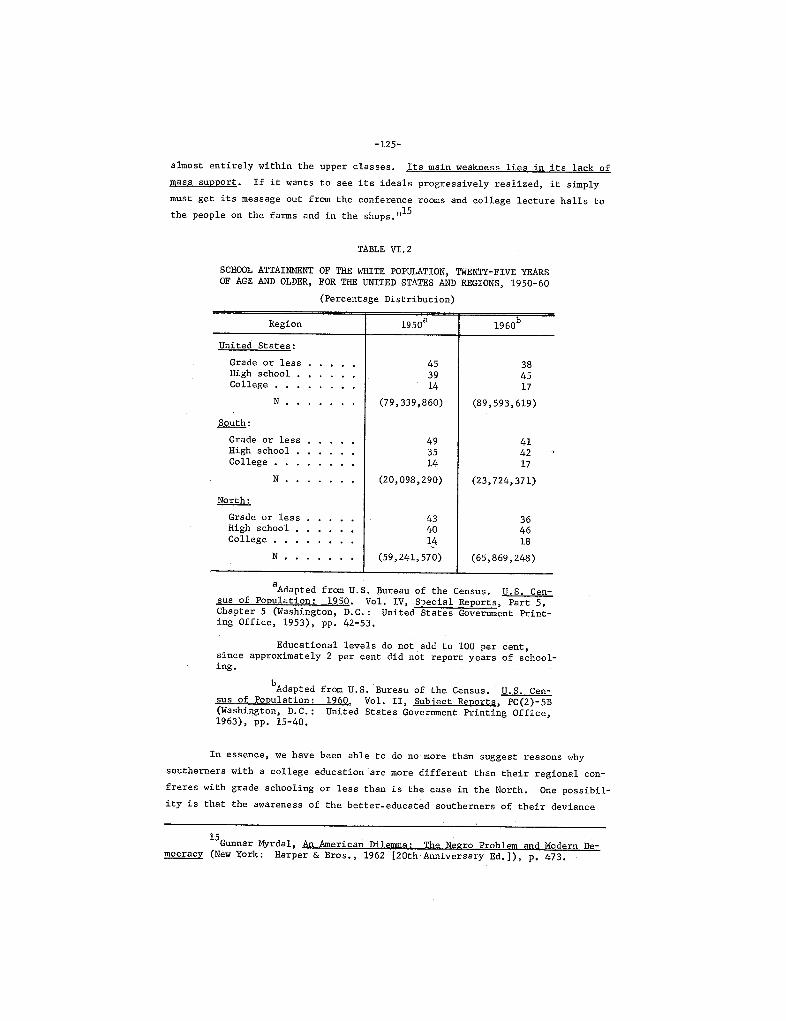
-125-
almost entirely within the upper classes. Its main weakness lies in its lack of
mass support . If it wants to see its ideals progressively realized, it simplymust get its message out from the conference rooms and college lecture halls to
the people on the farms and in the shops.
TABLE VI. 2
SCHOOL ATTAINMT OF THE WHTE POPUTION, TWNT-FIVE YERSOF AGE AND OLDER, FOR TH UNITED STATES AND REGIONS, 1950-60
(Percentage Distribution)
Region 1950 1960
Uni ted States:Grade or lessHigh schoolCollege.
N . (79 339, 860) (89 593, 619)
South
Grade or lessHigh schoolCollege
N . (20 098 290) (23, 724, 371)
North:
Grade or lessHigh schoolCollege.
N . (59 241 570) (65, 869 248)
Adapted from U. S, Bureau of the Census. U, S. Cen-sus of Population: 1950 . Vol. IV Special Reports , Part 5,Chapter 5 (Washington , D. C. : United States Government Print-ing Office, 1953), pp. 42-53.
Educational levels do not add to 100 per centsince approximately 2 per cent . did not report years of school-ing.
b Adapted
sus of Population:(Washington , D. C. :
1963), pp. 15-40.
from U. S, Bureau of the Census. S. Cen-1960 . Vol. II Sub;ect Reports , PC(2)-5BUnited States Government Printing Office,
In essence , we have been able to do no. more than suggest reasons whysoutherners with a college education . are more different than their regional con-
freres with grade schooling or less than is the case in the North. One possibil-
ity is that the awareness of the better- educated southerners of their deviance
Gunnar Mjrdal An American Dilemma: The Negro Problem and Modern De-mocracy (New York: Harper & Bros., 1962 (20th Anniversary Ed. )), p. 473.

-126-
from national viewpoints and norms produced more push to adopting pro-integration-
ist opinions. Some of the difference is probably also related to the carry-over
of an aristocratic tradition in the South , reinforcing differences in outlook be-
tween educational groups. Finally, some of the difference was probably due tothe direct impact of northern society, through the differential migration of
those with above-average years of schooling into the South.
Limits on Change
There has been no attempt in this study to disguise our own feelings
about the results of opinion change over the twenty year period studied. The
intrusion of personal feelings into a research enterprise frequently creates dif-
ficulties , but here it has been irrelevant. Our own views had no bearing on the
selection of data or on the findings themselves. However, they may have entered
into the assessment of past changes as these have implications for the future.
Interpretations were optimistic in terms of predicting how white Americans would
continue to react to the claims of Negroes for full rights and opportunities.
It would be misleading, however, to stop at this point without considering some
of the limits on future change. Opinion changes in the coming years may be re-
stricted by a number of social factors. In addition, our interpretations and
predictions may have been unduly optimistic because of our prior assumptions.
Prior assumptions could , of course, have no bearing on future developments, but
they must be considered since they could affect the validity of our interpreta-
tions. The following five factors could circumscribe the possible limits of
change: (1) the continuity of population differences; (2) the relationship be-tween opinions and behavior; (3) the role played by education; (4) possible fal-lacies in the conception of change presented here; and (5) the adequacy of our
data for developing generalizations about the nature of opinion change,
Continuity of differences One of the striking results derived from
this review of public opinion data is the large and continued difference of opin-
ion between North and South. If these differences have continued for so long, re-gardless of the evidence of some change , why should we expect that the South will
ever be identical to other parts of the country in its outlook on racial ques-
tions? Southerners have neither the ability nor the desire to insulate themselves
from the rest of the nation, and, consequently, they will undoubtedly change even
more. But how much more? It could well be that southerners will reach a ceilingon tolerance before they attain the level of tolerance presently found in the
North.
Opinions and behavior By focussing on opinions and opinion changes,
the view that emerges may well have only a passing relationship to actual behav-
ior. Regardless of whether or not sentiments of tolerance are strong, patterns
of discrimination may be so entrenched as to nullify efforts to bring about
-127-
behavioral changes. What needs to be emphasized , then, is that this study has
been concerned only with the nature of public opinion and of changes in the dis-
tribution of opinions over time. The manner in which these changes may affect
behavior, either of the individuals sampled or of participants in such criticalinstitutional areas as the legal, political, educational, and economic , is quite
another point , and one beyond the limits of this study. Some attempt was made
to consider behavioral changes by looking at questions dealing with possible
responses to social contacts with Negroes. However, coverage of significant
areas of contact was sketchy, and questions did not always deal with meaningful
situations in terms of actual events. We would consider behavior to be an in-
adequately covered subject in this report , at the same time as we see behavioral
changes as critical ones. This is not to discount the relevance of examining
opinions, but only to say that opinions in themselves have but partial validity
as predictors of behavior.
Role of education: Why should we regard education as a panacea for
the ills of prejudice? It is true that there is a strong correlation between
advanced schooling and tolerant opinions , but this is not to say that education
is necessarily the cause of tolerance, While we have suggested a variety of
reasons why college education leads to a more open mind about social diversity,
there is still no reason to categorically assume that increased levels of educa-
tion will always be accompanied by the same results. Increased education may
still not be sufficient , in itself , to offset the influences of other social
factors that perpetuate opinions unfavorable to Negro rights. If the educated
man is not a demogogue who rants against Negroes , he may still be a man who
politely but firmly sidesteps the obligations of integration.
One of the peculiarities of the current civil rights movement is that
greater intransigence on the part of whites has been associated with greater
gains for Negroes. For example, North Carolina was the first of the southern
states to willingly integrate its schools. In comparison, Virginia strongly
resisted implementing the Supreme Court decision and even went so far as to
close some of its public schools. But since 1961 , when Virginia began to comply
with court orders, there has been a higher proportion of integrated schools in
Virginia than in North Carolina. A similar contrast can be seen between Georgia
and Alabama, Georgia did not desegregate its schools until 1961 , but then it
did so peacefully. Alabama continued strong resistance until 1963. Yet by 1964,
the apparently more compliant Georgia had desegregated fewer school districts
than Alabama. 16
Robert L, Crain, School Dese ationStudy of the Failure of Social Control (ChicagoCenter, Report No. 110B, 1966), p. 9.
in New Orleans: A ComparativeIll, : National Opinion Research
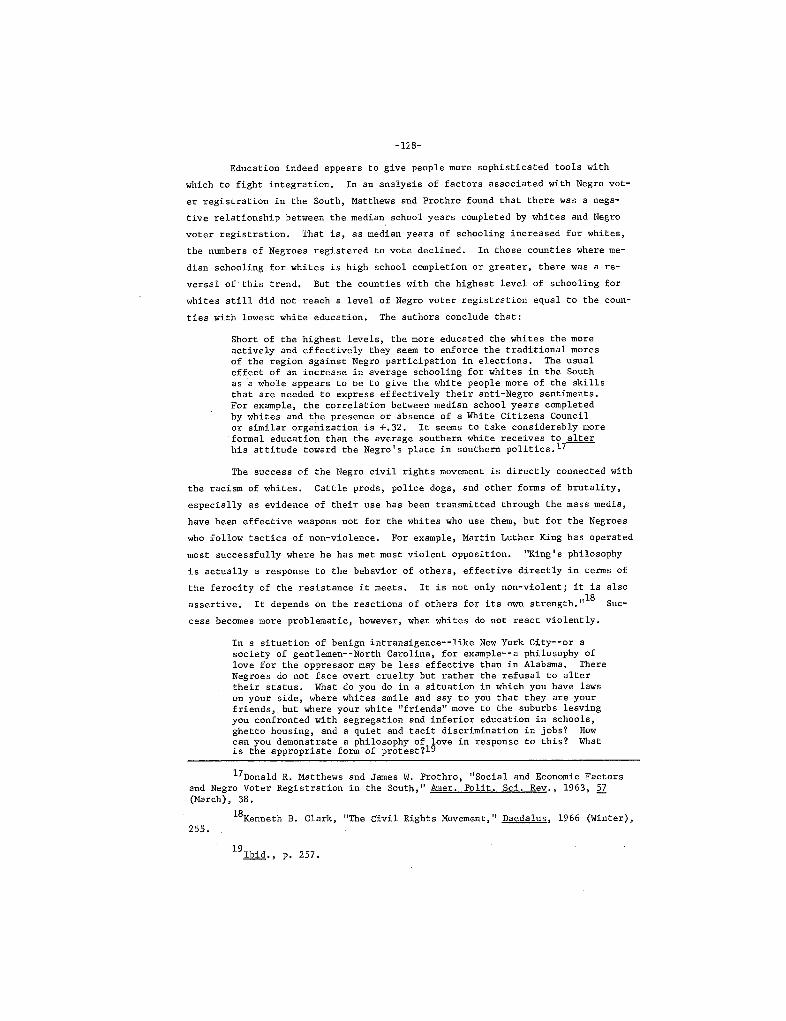
-1:;8-
Education indeed appears to give people more sophisticated tools with
which to fight integration. In an analysis of factors associated with Negro vot-
er registration in the South, Matthews and Prothro found that there was a nega-
tive relationship between the median school years completed by whites and Negro
voter registration. That is , as median years of schooling increased for whitesthe numbers of Negroes registered to vote declined. In those counties where me-
dian schooling for whites is high school completion or greater , there was a re-
versal of this trend. But the counties with the highest level of schooling for
whites still did not reach a level of Negro voter registration equal to the coun-
ties with lowest white education. The authors conclude that:
Short of the highest levels, the more educated the whites the moreactively and effectively they seem to enforce the traditional moresof the region against Negro participation in elections. The usualeffect of an increase in average schooling for whites in the Southas .a whole appears to be to give the white people more of the skillsthat are needed to express effectively their anti-Negro sentiments.For example, the correlation between median school years completedby whites and the presence or absence of a White Citizens Councilor similar organization is +.32. It seems to take considerably moreformal education than the average southern white receives to alterhis attitude toward the Negro s place in southern politics.
The success of the Negro civil rights movement is directly connected with
the racism of whites. Cattle pro , police dogs, and other forms of brutality,
especially as evidence of their use has been transmitted through the mass media
have been effective weapons not for the whites who use them, but for the Negroes
who follow tactics of non-violence. For example, Martin Luther King has operated
most successfully where he has met most violent opposition. King I s philosophy
is actually a response to the behavior of others , effective directly in terms of
the ferocity of the resistance it meets. It is not only non-violent; it is alsoassertive. It depends on the reactions of others for its own strength. ,,18 Suc-
cess becomes more problematic , however, when whites do not reacc violently.
In a situation of benign intransigence--like New York City-- or a
society of gentlemen--North Carolina , for example--a philosophy oflove for the oppressor may be less effective than in Alabama. ThereNegroes do not face overt cruelty but rather the refusal to altertheir status. What do you do in a situation in which you have lawson your side, where whites smile and say to you that they are yourfriends,. but where your white "friends" move to the suburbs leavingyou confronted with segregation and inferior education in schoolsghetto housing, and a quiet and tacit discrimination in jobs? Howcan you demonstrate a philosophy of love in response to this? Whatis the appropriate form of protest?19
Donald R, Matthewsand Negro Voter Registration(March), 38.
Kenneth B. Clark
, "
The Civil Rights Movement Daedalus , 1966 (Winter),
and James W. Prothro
, "
Social and Economic Factorsin the South, Amer. Polito Sci. Rev ., 1963, 21
255.
Ibid ., p. 257.
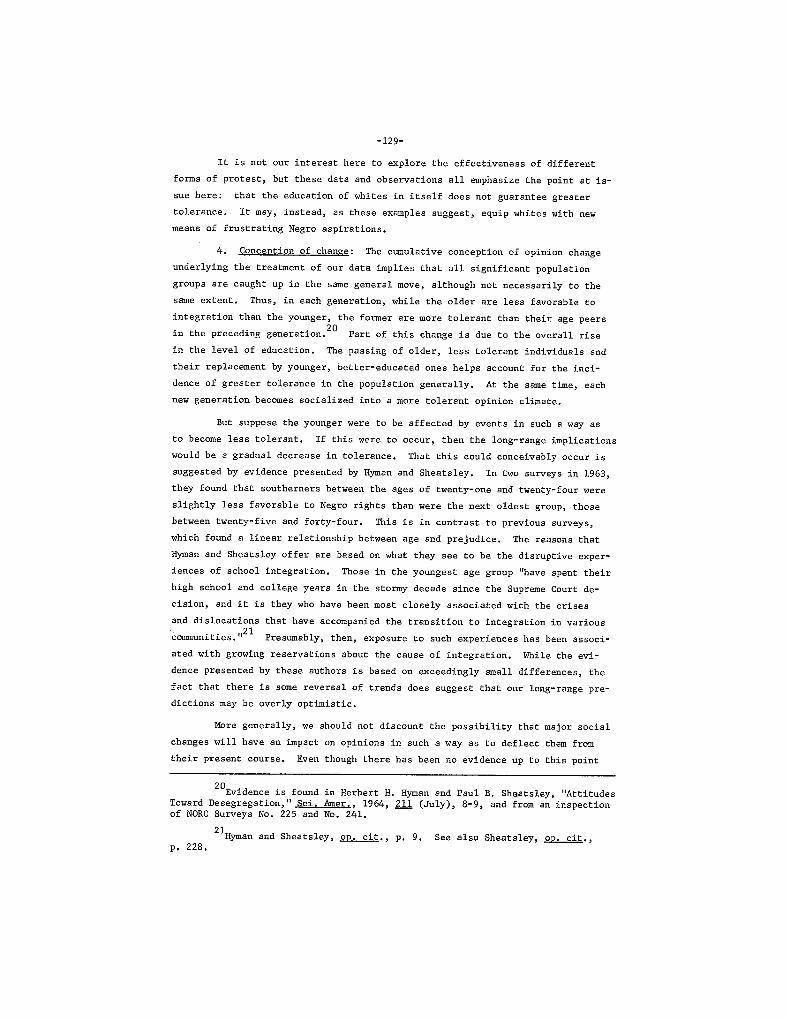
-129-
It is not our interest here to explore the effectiveness of different
forms of protest , but these data and observations all emphasize the point at is-
sue here: that the education of whites in itself does not guarantee greater
It may, instead, as these examples suggest , equip whites with newtolerance.means of frustrating Negro aspirations.
Conception of change The cumulative conception of opinion change
underlying the treatment of our data implies that all significant population
groups are caught up in the same general move , although not necessarily to the
same extent. Thus, in each generation, while the older are less favorable to
integration than the younger, the former are more tolerant than their age peers
in the preceding generation.20
Part of this change is due to the overall rise
in the level of education. The passing of older , less tolerant individuals and
their replacement by younger, better- educated ones helps account for the inci-
dence of greater tolerance in the population generally. At the same time, each
new generation. becomes socialized into a more tolerant opinion climate.
But suppose the younger were to be affected by events in such a way as
to become less tolerant. If this were to occur, then the long-range implications
would be a gradual decrease in tolerance. That this could conceivably occur is
suggested by evidence presented by Hyman and Sheats ley . In two surveys in 1963,
they found that southerners between the ages of twenty-one and twenty-four were
slightly less favorable to Negro rights than were the next oldest group, those
between twenty-five and forty-four. This is in contrast to previous surveys
which found a linear relationship between age and prejudice. The reasons that
Hyman and .Sheatsley offer are based on what they see to be the disruptive exper-
iences of school integration. Those in the youngest age group "have spent their
high school and college years in the stormy decade since the Supreme Court de-
cision, and it is they who have been most closely associated with the crises
and dislocations that have accompanied the transition to integration in various
comunities. ,,21 Presumably, then, exposure to such experiences has been associ-ated with growing reservations about the cause of integration. While the evi-dence presented by these authors is based on exceedingly small differences , the
fact that there is some reversal of trends does suggest that our long- range pre-dictions may be overly optimistic.
More generally, we should not discount the possibility that major social
changes will have an impact on opinions in such a way as to deflect them from
their present course. Even though there has been no evidence up to this point
Evidence is foundToward Desegregationof NORC Surveys No. 225 and
in Herbert H. Hyman and Paul B, Sheatsley, "AttitudesAmer , 1964, 211 (July), 8-9, and from an inspectionNo. 241.
Hyman and Sheatsley, OP. cit ., p. 9. See also Sheatsley, op, citp. 228.

-130-
that even events which are disliked by majorities of white people, such as the
activities of civil rights groups , alter the general movement toward growing sup-
port of integration , this does not preclude their future influence. Who can fore-
tell what consequences would flow from a major economic recession, a basic politi-
cal realignment that would permit the ascendancy of whites unsympathetic or in-
different to Negro rights , or a widespread movement of disillusionment among Ne-
groes who are dissatisfied with the speed and character of change and who favor
greater militancy, repudiation of white liberals , and self- segregation?
Data for the study of change The analysis presented here was based
on whatever data we could find. This does not mean that the data put any limits
on the changes we can anticipate, but they did limit the interpretations we could
make , either of past changes or of future trends. This is particularly trouble-
some when we try to do more than just describe isolated opinions. Thus, our ex-
ploration of the rela ion between different attitude dimensions and their differ-
ential rates of change was severely curtailed by our reliance on a limited number
of questions , assumed to be indicators of these dimensions. Insofar as it is de-
sirable to develop empirically-based generalizations about opinion change , and if
we want to use survey data for studying such change , it will be necessary to do
much more in the way of long- range planning than has been customary up to now.
Methods for teams of researchers to plan at least twenty years ahead, in order
to avoid reliance on secondary data and the consequent piecemeal approach employed
here, would be most welcome.
We hope to have satisfied any concerns about the influence of our person-
al feelings on the interpretations presented here. A number of ways in which
future changes might be limited, either through the emergence of unanticipated
events with special impact on critical population groups , or through the limita-
tions inherent in the procedures used for tracing changes, have been suggested.
Nevertheless , our general conclusions are not altered by the inclusion of theseconsiderations. The evidence, on balance, is still in favor of continued growthin support for the extension of civil rights to Negroes.

APPENDIX TABLj'S
TABLE 1
PER CEN THINKING NEGROES ARE AS INTELLIGENT AS WHITES
(By Region and Education)
South NorthSurvey
Grade High College Grade High College
May, 1944(NORC Survey 225)
. . . . .
(247) (230) (144) (671) (830) (391)May, 1946
(NORC Survey 241)
. . ..
(258) (227) (93) (676) (813) (287)January, 1956
(NaRC Survey 382)
. . ..
(104) (144) (57) (237) (417) (156)April , 1956
(NORC Survey 386)
. . ..
(109) (147) (64) (232) (422) (140)May, 1963
(NORC Survey SRS-160)
. ,.
(101) (149) (105) (212) (511) (271)December, 1963
(NORC Survey SRS-330)
, . .
(115) (157) (69) (209) (466) (209)
TABLE 2
PER CENT THINKING WHITE AND NEGRO STUDENTS SHOULD GO TO THE SAM SCHOOLS
(By Region and Education)
South NorthSurveyGrade High College Grade High College
April, 1956(NORC Survey 386)
. . . .
(109) (147) (64) (232) (422) (140)June, 1956
(NORC Survey 390)
, . .
(128) (141) (52) (253) (436) (144)May, 1963
(NORC Survey SRS-160)
, .
(101) (149) (105) (212) (511) (271)November , 1963
(NORC Survey SRS-350) . (106) (123) (55) (280) (429) (204)December, 1963
(NORC Survey SRS-330) (115) (157) (69) (209) (466) (209)May, 1964
(NORC Survey SRS-630) . .. (109) (166) (85) (199) (484) (257)June , 1965
(NORC Survey SRS-857) . (101) (157) (86) (205) (480) (258)
-131-
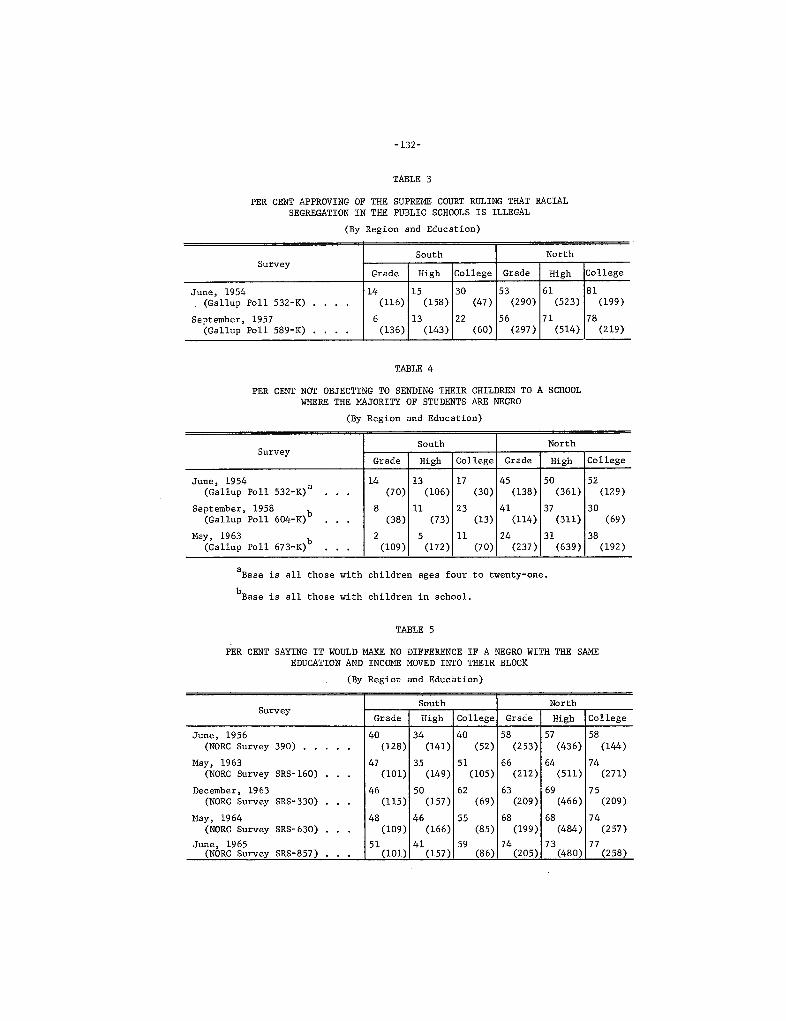
-132-
TABLE 3
PER CENT APPROVING OF THE SUPRE COURT RULING THAT RACIALSEGREGATION IN THE PUBLIC SCHOOLS IS ILLEGAL
(By Region and Education)
South NorthSuryey
Grade High College Grade High College
June , 1954(Gallup Poll 532-K) . (116) (158) (47) (290) (523) (199)
September , 1957(Gallup Poll 589-K). (136) (143) (60) (297) (514) (219)
TABLE 4
PER CENT NOT OBJECTING TO SENDING THEIR CHILDREN TO A SCHOOLWHRE THE MAJORITY OF STUDENTS ARE NEGRO
(By Region and Education)
South NorthSurvey
Grade High College Grade High College
June, 1954 (Gallup Poll 532-K)
...
(70) (106) (30) (138) (361) (129)
September, 1958 (Gallup Poll 604-K) (38) (73) (13) (114) (311) (69)
May, 196367 3-K) b(Gallup Poll
. .
(109) (172) (70) (237) (639) (192)
Base is all those with children ages four to twenty-one.
Base is all those with children in school.
TABLE 5
PER CENT SAYING IT WOULD MA NO DIFFERENCE IF A NEGRO WITH THE SAMEDUCATION AND INCOME MOVED INTO THIR BLOCK
(By Region and Education)
South NorthSurvey
Grade High College Grade CollegeHigh
June, 1956(NORC Survey 390) .
. .
(128) (141) (52) (253) (436) (144)
May, 1963(NORC Survey SRS-160) . (101) (149) (105) (212) (511) (271)
December , 1963(NORC Survey SRS- 330) , (115) (157) (69) (209) (466) (209)
May, 1964(NORC Survey SRS-630) . (109) (166) (85) (199) (484) (257)
June, 1965(NORC Survey SRS-857) . (101) (157) (86) (205) (480) (258)
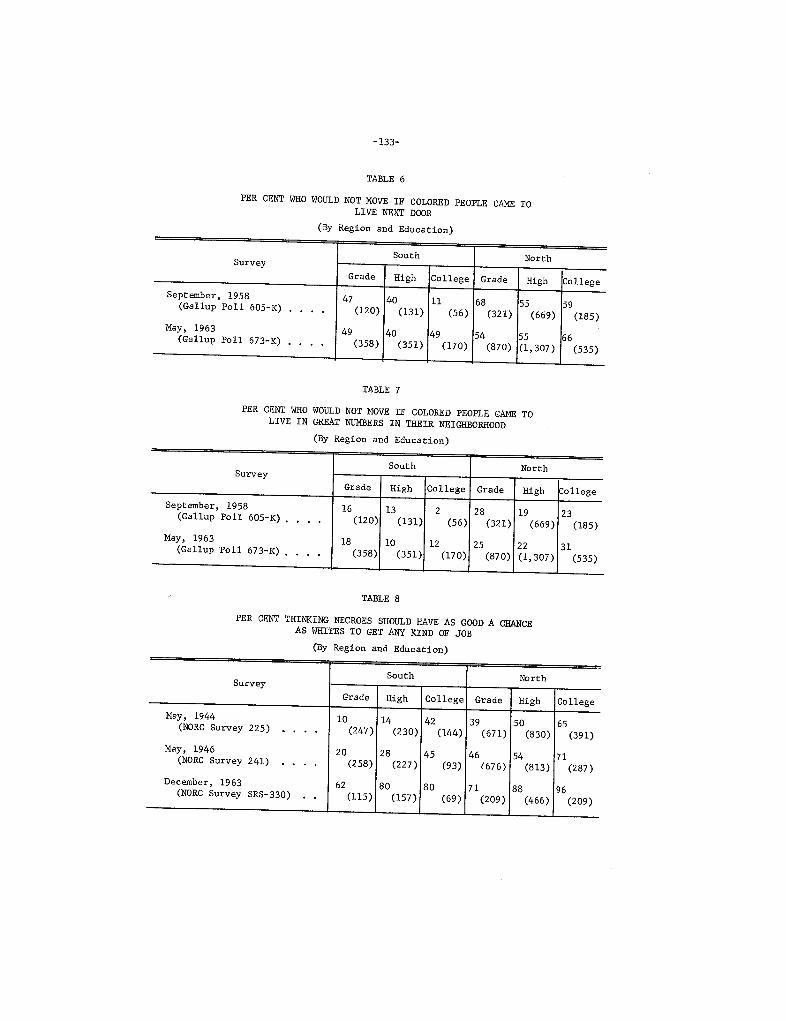
-133-
TABLE 6
PER CENT WHO WOULD NOT MOVE IF COLORED PEOPLE CA LIVE NEXT DOOR
(By Region and Education)
South NorthSurveyGrade High College Grade High College
September, 1958(Gallup Poll 605-K)
. . .
(120) (131) (56) (321) (669) (185)May, 1963
(Gallup Poll 673-K)
. ,
(358) (351) (170) (870) 307) (535)
TABLE 7
PER CENT WHO WOULD NOT MOVE IF COLORED PEOPLE CAM TOLIVE IN GRET NUERS IN THEIR NEIGHBORHOOD(By Region and Education)
South NorthSurveyGrade High College Grade High o11e
September , 1958(Gallup Poll 605-K).
. . .
(120) (131) (56) (321) (669) (185)May, 1963
(Gallup Poll 673-K). (358) (351) (170) (870) 307) (535)
TABLE 8
South NorthSurveyGrade High College Grade High College
May, 1944(NORC Survey 225)
. .
(247) (230) (144) (671) (830) (391)May, 1946
(NORC Survey 241)
. .
(258) (227) (93) (676) (813) (287)December , 1963
(NORC Survey SRS-330)
. .
(115) (157) (69) (209) (466) (209)
PER CENT THINKING NEGROES SHOULD HAVE AS GOOD A CHANCE
AS WHITES TO GET AN KIND OF JOB
(By Region and Education)
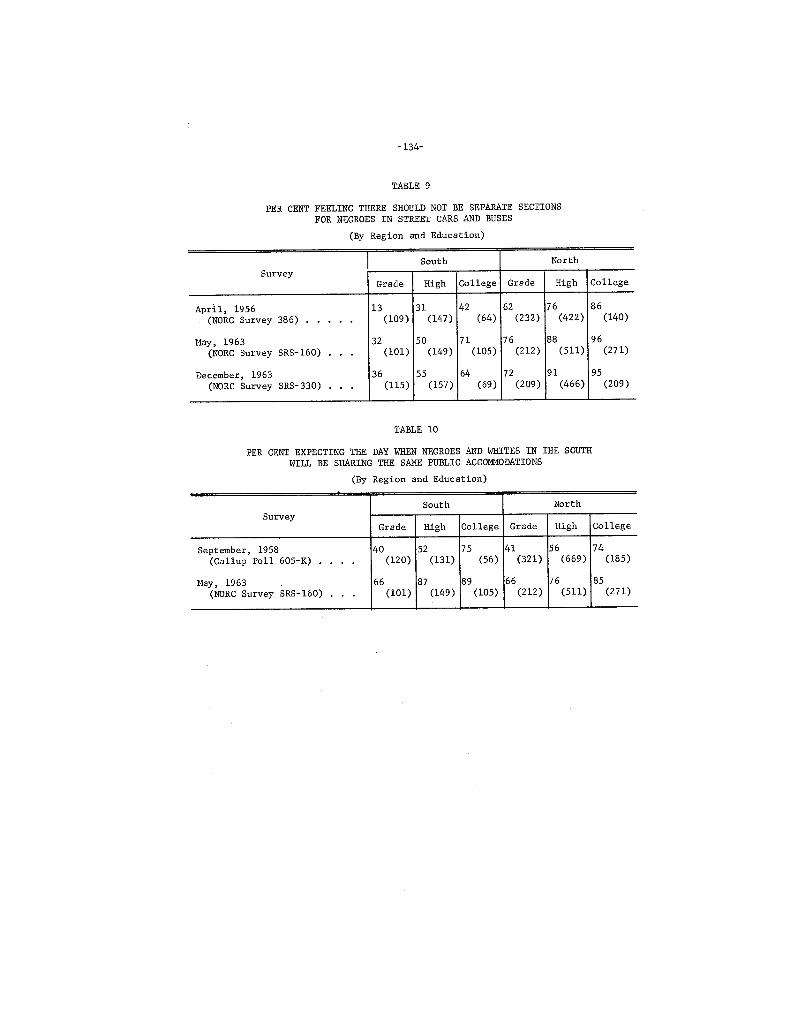
-134-
TABLE 9
PER CENT FEELING THERE SHOULD NOT BE SEPARATE SECTIONSFOR NEGROES IN STREET CARS AND BUSES
(By Region and Education)
South NorthSurvey
Grade High College Grade High College
Aprt 1 , 1956(NORC Survey 386)
. . . .
(109) (147) (64) (232) (422) (140)
May, 1963(NORC Survey SRS-160) .
, .
(101) (149) (105) (212) (511) (271)
December , 1963(NORC Survey SRS- 330) .
, .
(115) (157) (69) (209) (466) (209)
TABLE 10
PER CENT EXPECTING TH DAY WHEN NEGROES AND WHITES IN THE SOUTHWILL BE SHARING THE SAM PUBLIC ACCOMMODATIONS
(By Region and Education)
South NorthSurvey
Grade High College Grade High College
September , 1958(Gallup Poll 605-K) . .
. .
(120) (131) (56) (321) (669) (185)
May, 1963(NORC Survey SRS-160) , (101) (149) (105) (212) (511) (271)


