Download - Transport properties of sorbing contaminants in a fractured granite under oxidizing conditions
Korean J. Chem. Eng., 23(5), 741-746 (2006)
SHORT COMMUNICATION
741
†To whom correspondence should be addressed.
E-mail: [email protected]
Transport properties of sorbing contaminants in a fractured graniteunder oxidizing conditions
Chung-Kyun Park†, Won-Jin Cho and Pil-Soo Hahn
Research Team of High Level Radioactive Waste Disposal, Korea Atomic Energy Research Institute,Yousung P.O.box105, Daejeon 305-600, Korea
(Received 13 December 2005 • accepted 25 April 2006)
Abstract−Migration of some sorbing chemical species has been studied in a single rock fracture of 1 m scale in order
to understand the transport behavior of contaminants at underground environments. For the tracers, tritium and anions
were used as nonsorbing ones and some sorbing cations such as Sr, Co and Cs were used as well. The experimental
study was focused on the identification of the retardation and matrix diffusion of the tracer in the fracture. The hydraulic
conductivity in the fracture was determined from the pressure differentials between pairs of boreholes. The hydraulic
data were used with a variable aperture channel model to characterize the aperture distribution in the fracture. A transport
model has been developed to describe the migration of the solutes in the flow field by using a particle tracking method.
Results were plotted in the form of elution curves and migration plumes in the fracture. The experimental elution curves
have been explored with the transport model which takes into account sorption and diffusion into the rock matrix. This
comparison may contribute to further understanding on the heterogeneous flow field and the interactions between rock
and chemical species.
Key words: Transport, Sorption, Matrix Diffusion, Retardation, Particle Tracking Method, Distribution Coefficient
INRODUCTION
Isolating toxic wastes from the biosphere is becoming an impor-
tant social and technical issue. Many countries are running or plan-
ning repositories for the wastes including radioactive ones. Usually,
hazardous wastes are disposed in a trench type concrete block in
shallow land, while radioactive wastes are considered to be dis-
posed in deep hardrock mass. In order to assess whether the waste
is sufficiently segregated from the biosphere, the characteristics of
geologic media around the repository as well as interactions among
wastes, groundwater, and geomedia should be defined in detail. When
toxic materials are disposed of in underground hard rock, the con-
taminants will be dissolved in groundwater and moved out through
the rock fracture by the flowing water in the long run. Fractures in
rocks tend to dominate the water flow, when the rock matrix is of
low permeability. Individual fractures act as conduits through the
rock media.
There are two ways to describe the flow and migration of con-
taminants in fractured media: the equivalent porous medium model
[Tang et al., 1981] and the fracture network model [Moreno et al.,
1993]. The porous medium model characterizes hydrodynamic pa-
rameters by averaged values and has been applied to the flow in
soils. When the rock mass has extremely many interconnecting frac-
tures, the flow medium can be treated as an equivalent porous me-
dium. Otherwise, a fracture network model will be more appropri-
ate. The flow in the rock fracture is often assumed to be like that
between two parallel and smooth plates. However, results from the
laboratory and field measurements show that the parallel plate ideali-
zation does not describe adequately the fluid flow and contaminant
transport. The parallel plate model fails to recognize the spatial hetero-
geneity in the fracture aperture. Thus, model concepts of spatial
heterogeneity have been studied by assuming variable apertures in
the fracture along flow paths [Tsang et al., 1988].
As a serial work of Park et al. [1995, 2002]’s study, the progres-
sion is that of an experimental system from a simple artificial frac-
ture to a tortuous natural fracture as well as the migration model by
adding sorption and matrix diffusion terms. In this study, we are
going to develop a generic model for describing the migration of
tracers in various rock fractures: a variable aperture channel model
for the characterization of the fracture plane and also a particle track-
ing scheme for the solute transport. We will present our investiga-
tions of flow and migration in two-dimensions, representing to the
physical situation of the experimental setup.
TRANSPORT MODELING
1. Aperture Characterization and Flow Field in the Rock Frac-
ture
When the flow in the fracture is assumed as a steady state flow
in a confined aquifer, the transmissivity between sets of two bore-
holes, T, may be calculated [Bear, 1979]:
(1)
where Q is the volumetric flow rate, ∆h is the hydraulic head, rw is
the radius of injection/elution borehole, and 2d is the distance be-
tween injection and elution boreholes.
The data obtained in the hydraulic characterization of the frac-
ture may be used to generate an approximate distribution of the frac-
ture aperture, b, across the block by using the standard cubic law
equation [Park et al., 1997].
T = Q
2π∆h-------------
2d
rw
------ln
742 C.-K. Park et al.
September, 2006
(2)
where µ is the viscosity of the transport solution, g is the gravita-
tional acceleration, and ρ is the density of the transport solution.
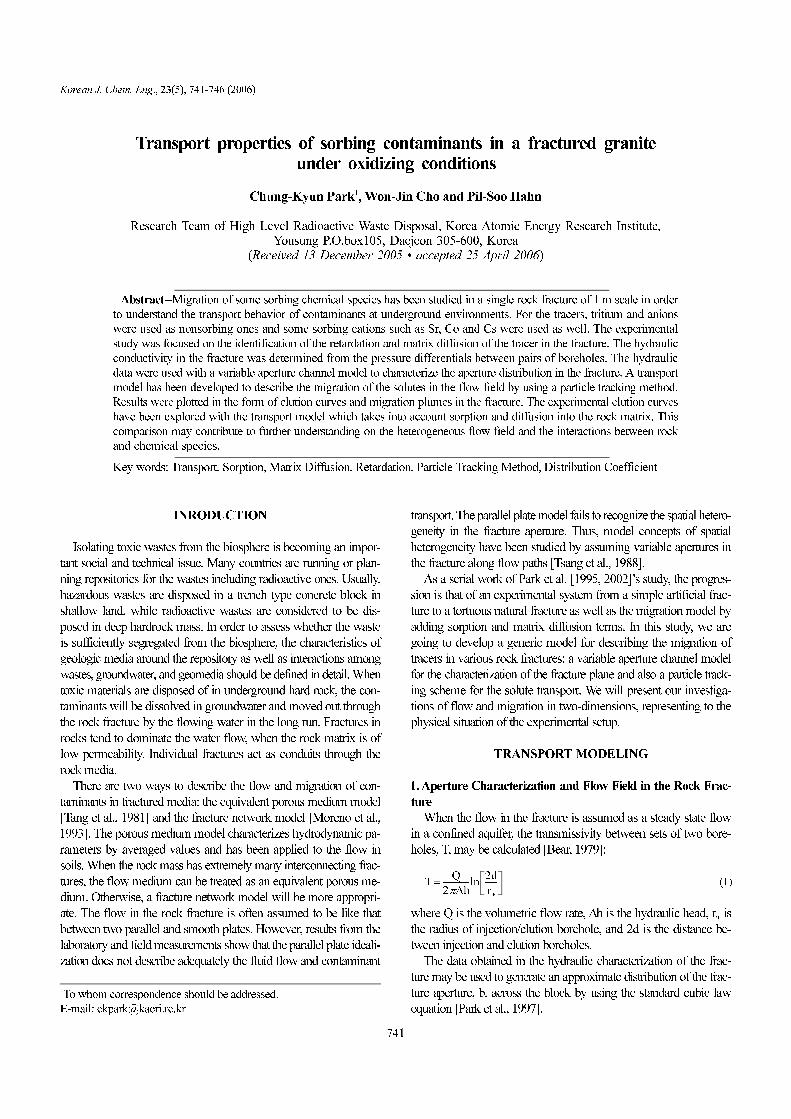
The fracture plane may be subdivided into imaginary subsquares
as shown in Fig. 1. The fluid flow through the fracture was then
calculated for a constant injection/elution rate as well as for con-
stant pressure conditions. For a constant laminar flow, the volumet-
ric flow rate, Qij, through the subsquares enclosed by the grid lines
may be written as:
Qij=Cij(Pi−Pj) (3)
where Pi is the pressure at node i, Node i implies an index of the
ith subsquare in the fracture surface. Cij is the flow conductance be-
tween nodes i and j .
The mass balance at each node may be written as:
(4)
where Ei is the injection rate or elution rate at node i. The subscript
j stands for the four facing nodes of surrounding subsquares to node
i. By rearranging the above equation for each node, we can obtain
a system of linear equations in the form
[B] [P]=[E] (5)
where [B] is a coefficient matrix describing the flow conductance.
The matrix [P] is an array describing the pressure distribution and
[E] is an array describing net flow rates.
Except for the nodes at the boundaries, the pressure at each node
can be solved with a numerical iteration method. The flow between
adjacent nodes can be calculated by using Eq. (3). After obtaining
flow vectors at all nodes, solute transport can be simulated in this
flow field.
2. Solute Transport Model
A two-dimensional random-walk particle tracking algorithm is
used to simulate the solute transport through the flow fields [Park
et al., 1995]. Particle displacements in each time step consisted of
an advective displacement based on local velocities calculated by
using the pressure field and random diffusive displacement. Parti-
cles, which are representing the mass of a solute contained in a de-
fined volume of fluid, move through a fracture with two types of
motion. One motion is with the mean flow along stream lines and
the other is random motion, governed by scaled probability [Des-
barats, 1990]. At the inlet, a certain amount of particles were intro-
duced and distributed at each node between flow channels with a
probability proportional to the flow rates. Particles are then advected
by discrete steps from node to node until they reach the outlet node
at which point the arrival time is recorded. This procedure is repeated
for all the particles to get a stable probability distribution. The resi-
dence time for nonsorbing tracers in a given subsquare is deter-
mined from the total flow through that subsquare and its volume.
The residence time of a particle along each path is obtained as the
sum of the residence times in all subsquares through which the par-
ticle has passed. Four transport processes are considered in model-
ing the solute transport: advection, longitudinal dispersion, diffusion
into the rock mass, and sorption.
MIGRATION EXPERIMENT
The fractured granite block which has a single natural fracture of
1 m scale was sampled in a domestic quarry, through which ground-
water had been flowing. This rock has an interconnected porosity
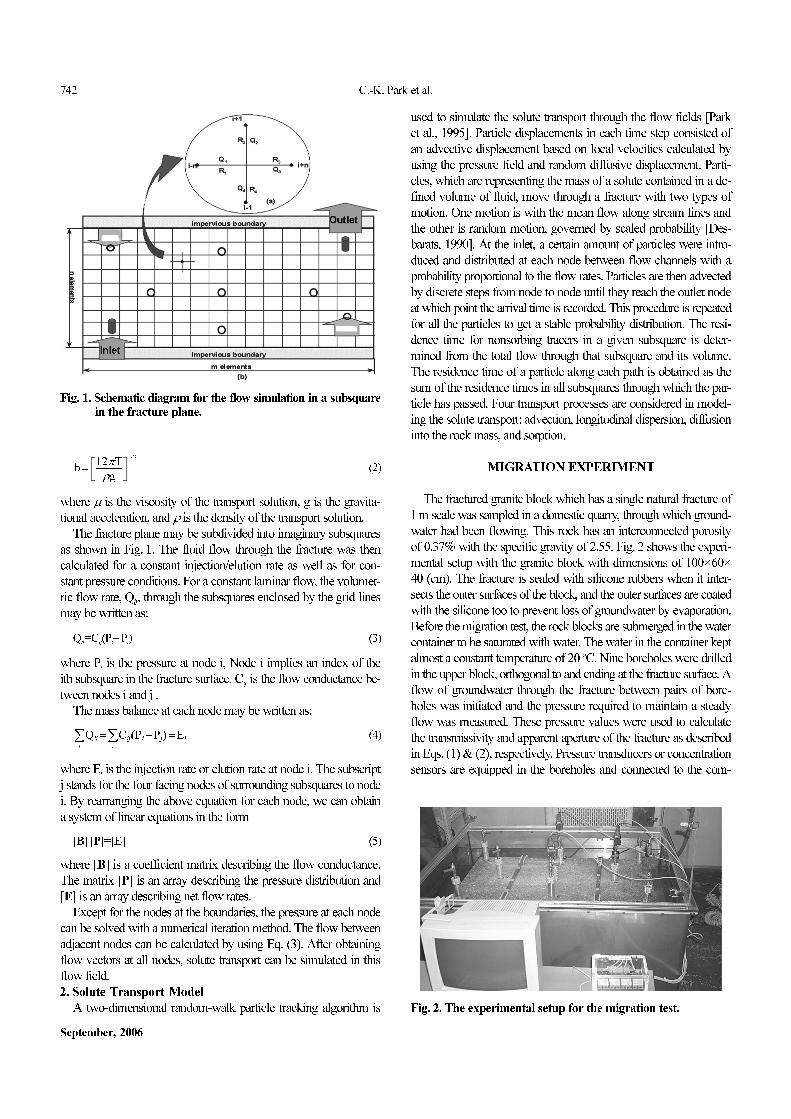
of 0.37% with the specific gravity of 2.55. Fig. 2 shows the experi-
mental setup with the granite block with dimensions of 100×60×
40 (cm). The fracture is sealed with silicone rubbers when it inter-
sects the outer surfaces of the block, and the outer surfaces are coated
with the silicone too to prevent loss of groundwater by evaporation.
Before the migration test, the rock blocks are submerged in the water
container to be saturated with water. The water in the container kept
almost a constant temperature of 20 oC. Nine boreholes were drilled
in the upper block, orthogonal to and ending at the fracture surface. A
flow of groundwater through the fracture between pairs of bore-
holes was initiated and the pressure required to maintain a steady
flow was measured. These pressure values were used to calculate
the transmissivity and apparent aperture of the fracture as described
in Eqs. (1) & (2), respectively. Pressure transducers or concentration
sensors are equipped in the boreholes and connected to the com-
b = 12πT
ρg-------------
1/3
Qij = Cij Pi − Pj( ) = Eij∑
j∑
Fig. 1. Schematic diagram for the flow simulation in a subsquarein the fracture plane.
Fig. 2. The experimental setup for the migration test.
Transport properties of sorbing contaminants in a fractured granite under oxidizing conditions 743
Korean J. Chem. Eng.(Vol. 23, No. 5)
puter system to collect data as an on-line system as shown in Fig. 2.
Two boreholes on the upper plate are selected as inlet and outlet
for transporting of fluid. Four kinds of chemical species are used
for the migration test: (1) tritiated water (THO), (2) anions; Cl− &
Br− (3) polymeric organic dye; NaLS (sodium lignosulfonate, Mw=
24,000) and Eosine (C20H6Br4Na2O5, Mw=691), and (4) sorbing ca-
tion; Cu+2, Co+2, Sr+2, & Cs+. 1.2 ml aliquots of solution containing
tracers were injected as a band input function into the inlet bore-
hole, fed with an HPLC pump through the fracture at a flow rate
of 0.2 ml/min and collected at the outlet borehole as shown in Figs.
1 & 2. The eluted solution was collected by using a fraction collec-
tor. Concentration of eosine and NaLS was analyzed with a UV/
VIS spectrophotometer at the wavelengths of 524 nm, 282 nm, re-
spectively. Concentrations of Cl− and Br− were analyzed with the ion
electrodes of Orion Research Inc.. Sr, Co, Cu, & Cs were analyzed
with an ICP-MS. THO was analyzed with a Liquid Scintillation
Counter.
SIMULATION AND EXPERIMENTAL RESULTS
1. Simulation of Facture and Flow
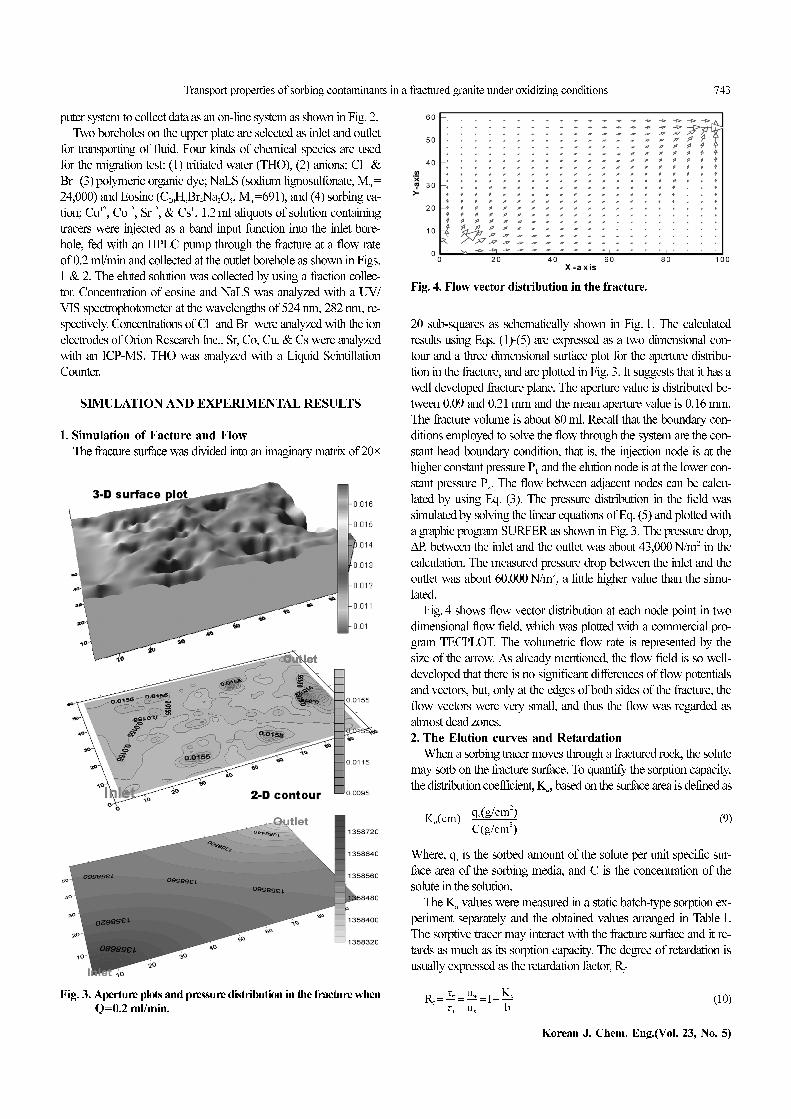
The fracture surface was divided into an imaginary matrix of 20×
20 sub-squares as schematically shown in Fig. 1. The calculated
results using Eqs. (1)-(5) are expressed as a two dimensional con-
tour and a three dimensional surface plot for the aperture distribu-
tion in the fracture, and are plotted in Fig. 3. It suggests that it has a
well developed fracture plane. The aperture value is distributed be-
tween 0.09 and 0.21 mm and the mean aperture value is 0.16 mm.
The fracture volume is about 80 ml. Recall that the boundary con-
ditions employed to solve the flow through the system are the con-
stant head boundary condition, that is, the injection node is at the
higher constant pressure P1 and the elution node is at the lower con-
stant pressure P2. The flow between adjacent nodes can be calcu-
lated by using Eq. (3). The pressure distribution in the field was
simulated by solving the linear equations of Eq. (5) and plotted with
a graphic program SURFER as shown in Fig. 3. The pressure drop,
∆P, between the inlet and the outlet was about 43,000 N/m2 in the
calculation. The measured pressure drop between the inlet and the
outlet was about 60,000 N/m2, a little higher value than the simu-
lated.
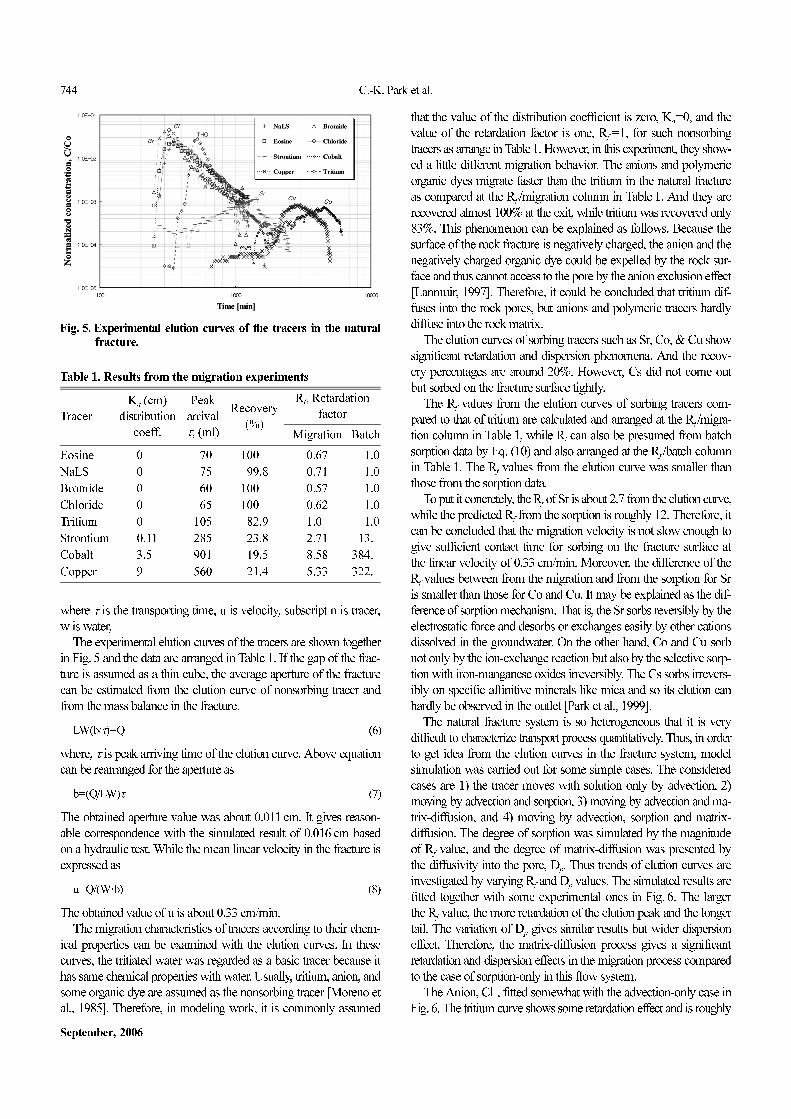
Fig. 4 shows flow vector distribution at each node point in two
dimensional flow field, which was plotted with a commercial pro-
gram TECPLOT. The volumetric flow rate is represented by the
size of the arrow. As already mentioned, the flow field is so well-
developed that there is no significant differences of flow potentials
and vectors, but, only at the edges of both sides of the fracture, the
flow vectors were very small, and thus the flow was regarded as
almost dead zones.
2. The Elution curves and Retardation
When a sorbing tracer moves through a fractured rock, the solute
may sorb on the fracture surface. To quantify the sorption capacity,
the distribution coefficient, Ka, based on the surface area is defined as
(9)
Where, qs is the sorbed amount of the solute per unit specific sur-
face area of the sorbing media, and C is the concentration of the
solute in the solution.
The Ka values were measured in a static batch-type sorption ex-
periment separately and the obtained values arranged in Table 1.
The sorptive tracer may interact with the fracture surface and it re-
tards as much as its sorption capacity. The degree of retardation is
usually expressed as the retardation factor, Rf
(10)
Ka cm( ) = qs g/cm
2
( )
C g/cm3
( )-----------------------
Rf = τn
τw
---- = uw
un
----- =1+ Ka
b------Fig. 3. Aperture plots and pressure distribution in the fracture when
Q=0.2 ml/min.
Fig. 4. Flow vector distribution in the fracture.
744 C.-K. Park et al.
September, 2006
where τ is the transporting time, u is velocity, subscript n is tracer,
w is water,
The experimental elution curves of the tracers are shown together
in Fig. 5 and the data are arranged in Table 1. If the gap of the frac-
ture is assumed as a thin cube, the average aperture of the fracture
can be estimated from the elution curve of nonsorbing tracer and
from the mass balance in the fracture.
LW(b/τ)=Q (6)
where, τ is peak arriving time of the elution curve. Above equation
can be rearranged for the aperture as
b=(Q/LW)τ (7)
The obtained aperture value was about 0.011 cm. It gives reason-
able correspondence with the simulated result of 0.016 cm based
on a hydraulic test. While the mean linear velocity in the fracture is
expressed as
u=Q/(W·b) (8)
The obtained value of u is about 0.33 cm/min.
The migration characteristics of tracers according to their chem-
ical properties can be examined with the elution curves. In these
curves, the tritiated water was regarded as a basic tracer because it
has same chemical properties with water. Usually, tritium, anion, and
some organic dye are assumed as the nonsorbing tracer [Moreno et
al., 1985]. Therefore, in modeling work, it is commonly assumed
that the value of the distribution coefficient is zero, Ka=0, and the
value of the retardation factor is one, Rf =1, for such nonsorbing
tracers as arrange in Table 1. However, in this experiment, they show-
ed a little different migration behavior. The anions and polymeric
organic dyes migrate faster than the tritium in the natural fracture
as compared at the Rf /migration column in Table 1. And they are
recovered almost 100% at the exit, while tritium was recovered only
83%. This phenomenon can be explained as follows. Because the
surface of the rock fracture is negatively charged, the anion and the
negatively charged organic dye could be expelled by the rock sur-
face and thus cannot access to the pore by the anion exclusion effect
[Lanmuir, 1997]. Therefore, it could be concluded that tritium dif-
fuses into the rock pores, but anions and polymeric tracers hardly
diffuse into the rock matrix.
The elution curves of sorbing tracers such as Sr, Co, & Cu show
significant retardation and dispersion phenomena. And the recov-
ery percentages are around 20%. However, Cs did not come out
but sorbed on the fracture surface tightly.
The Rf values from the elution curves of sorbing tracers com-
pared to that of tritium are calculated and arranged at the Rf/migra-
tion column in Table 1, while Rf can also be presumed from batch
sorption data by Eq. (10) and also arranged at the Rf /batch column
in Table 1. The Rf values from the elution curve was smaller than
those from the sorption data.
To put it concretely, the Rf of Sr is about 2.7 from the elution curve,
while the predicted Rf from the sorption is roughly 12. Therefore, it
can be concluded that the migration velocity is not slow enough to
give sufficient contact time for sorbing on the fracture surface at
the linear velocity of 0.33 cm/min. Moreover, the difference of the
Rf values between from the migration and from the sorption for Sr
is smaller than those for Co and Cu. It may be explained as the dif-
ference of sorption mechanism. That is, the Sr sorbs reversibly by the
electrostatic force and desorbs or exchanges easily by other cations
dissolved in the groundwater. On the other hand, Co and Cu sorb
not only by the ion-exchange reaction but also by the selective sorp-
tion with iron-manganese oxides irreversibly. The Cs sorbs irrevers-
ibly on specific affinitive minerals like mica and so its elution can
hardly be observed in the outlet [Park et al., 1999].
The natural fracture system is so heterogeneous that it is very
difficult to characterize transport process quantitatively. Thus, in order
to get idea from the elution curves in the fracture system, model
simulation was carried out for some simple cases. The considered
cases are 1) the tracer moves with solution only by advection, 2)
moving by advection and sorption, 3) moving by advection and ma-
trix-diffusion, and 4) moving by advection, sorption and matrix-
diffusion. The degree of sorption was simulated by the magnitude
of Rf value, and the degree of matrix-diffusion was presented by
the diffusivity into the pore, Dp. Thus trends of elution curves are
investigated by varying Rf and Dp values. The simulated results are
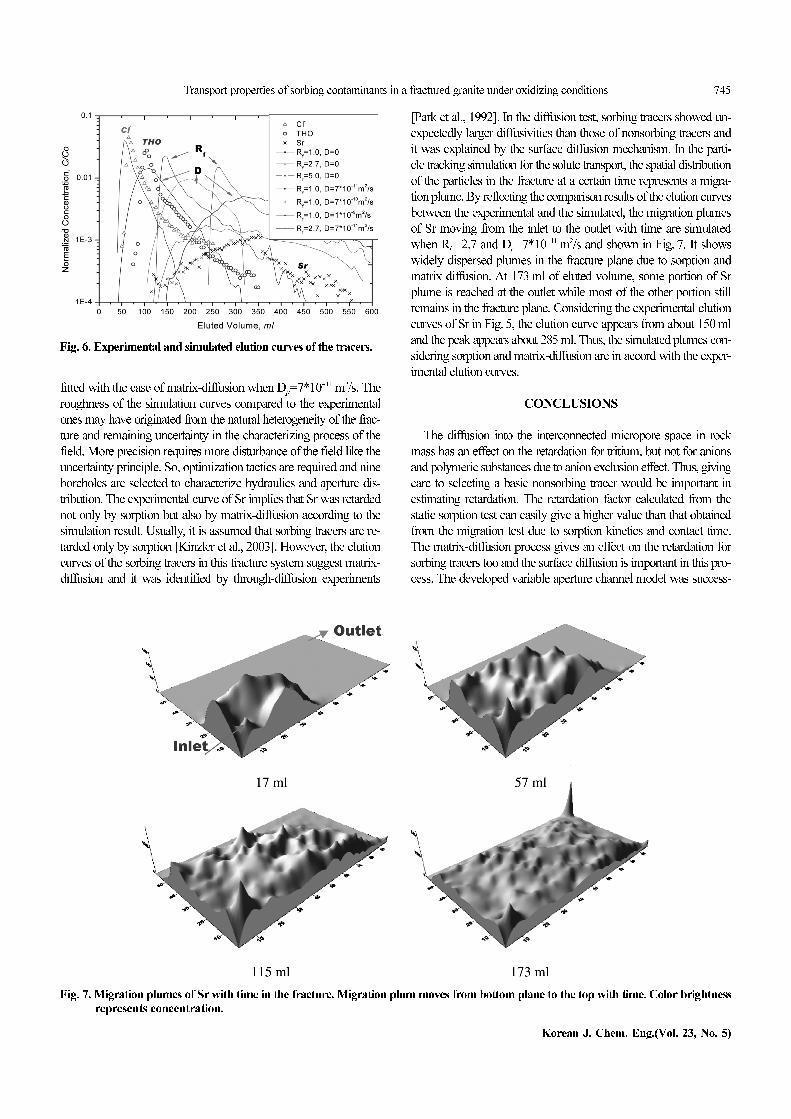
fitted together with some experimental ones in Fig. 6. The larger
the Rf value, the more retardation of the elution peak and the longer
tail. The variation of Dp gives similar results but wider dispersion
effect. Therefore, the matrix-diffusion process gives a significant
retardation and dispersion effects in the migration process compared
to the case of sorption-only in this flow system.
The Anion, Cl−, fitted somewhat with the advection-only case in
Fig. 6. The tritium curve shows some retardation effect and is roughly
Table 1. Results from the migration experiments
TracerK
a (cm)
distributioncoeff.
Peakarrivalτ, (ml)
Recovery(%)
Rf, Retardationfactor
Migration Batch
Eosine 0.00 070 100.0 0.67 001.0
NaLS 0.00 075 099.8 0.71 001.0Bromide 0.00 060 100.0 0.57 001.0Chloride 0.00 065 100.0 0.62 001.0
Tritium 0.00 105 082.9 1.00 001.0Strontium 0.11 285 023.8 2.71 013.0Cobalt 3.50 901 019.5 8.58 384.0
Copper 9.00 560 021.4 5.33 322.0
Fig. 5. Experimental elution curves of the tracers in the naturalfracture.
Transport properties of sorbing contaminants in a fractured granite under oxidizing conditions 745
Korean J. Chem. Eng.(Vol. 23, No. 5)
fitted with the case of matrix-diffusion when Dp=7*10−11 m2/s. The
roughness of the simulation curves compared to the experimental
ones may have originated from the natural heterogeneity of the frac-
ture and remaining uncertainty in the characterizing process of the
field. More precision requires more disturbance of the field like the
uncertainty principle. So, optimization tactics are required and nine
boreholes are selected to characterize hydraulics and aperture dis-
tribution. The experimental curve of Sr implies that Sr was retarded
not only by sorption but also by matrix-diffusion according to the
simulation result. Usually, it is assumed that sorbing tracers are re-
tarded only by sorption [Kinzler et al., 2003]. However, the elution
curves of the sorbing tracers in this fracture system suggest matrix-
diffusion and it was identified by through-diffusion experiments
[Park et al., 1992]. In the diffusion test, sorbing tracers showed un-
expectedly larger diffusivities than those of nonsorbing tracers and
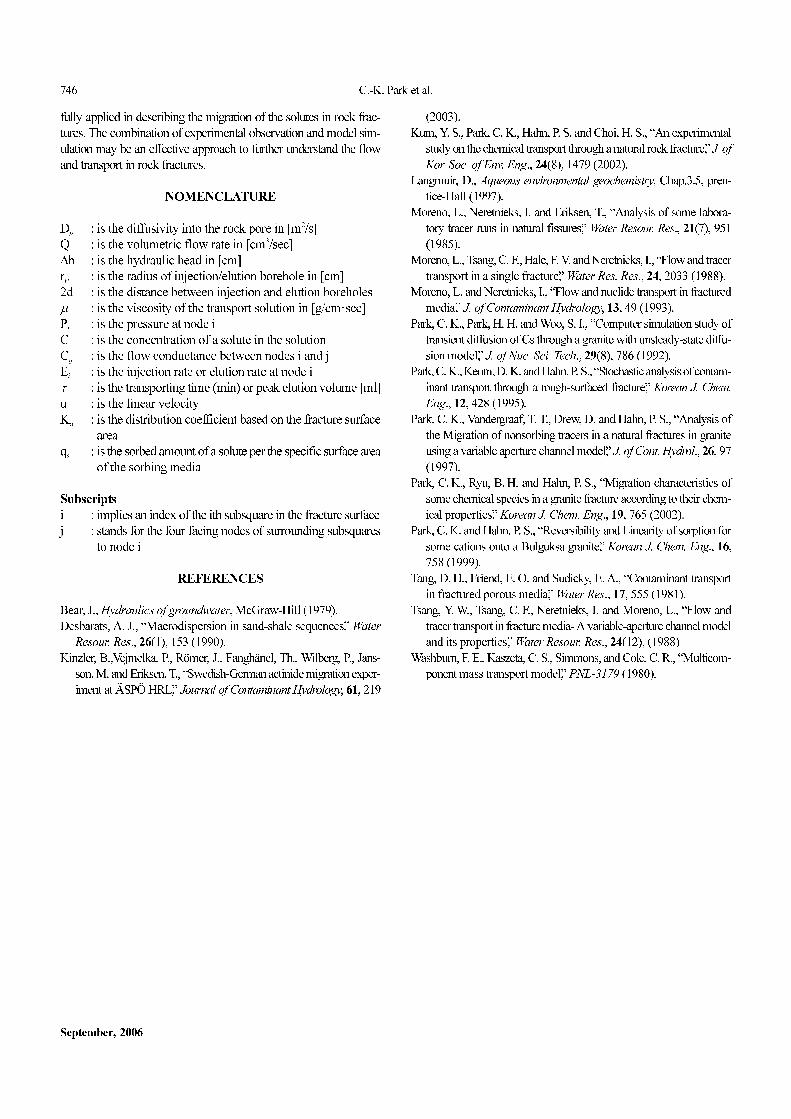
it was explained by the surface diffusion mechanism. In the parti-
cle tracking simulation for the solute transport, the spatial distribution
of the particles in the fracture at a certain time represents a migra-
tion plume. By reflecting the comparison results of the elution curves
between the experimental and the simulated, the migration plumes
of Sr moving from the inlet to the outlet with time are simulated
when Rf =2.7 and Dp=7*10−11 m2/s and shown in Fig. 7. It shows
widely dispersed plumes in the fracture plane due to sorption and
matrix diffusion. At 173 ml of eluted volume, some portion of Sr
plume is reached at the outlet while most of the other portion still
remains in the fracture plane. Considering the experimental elution
curves of Sr in Fig. 5, the elution curve appears from about 150 ml
and the peak appears about 285 ml. Thus, the simulated plumes con-
sidering sorption and matrix-diffusion are in accord with the exper-
imental elution curves.
CONCLUSIONS
The diffusion into the interconnected micropore space in rock
mass has an effect on the retardation for tritium, but not for anions
and polymeric substances due to anion exclusion effect. Thus, giving
care to selecting a basic nonsorbing tracer would be important in
estimating retardation. The retardation factor calculated from the
static sorption test can easily give a higher value than that obtained
from the migration test due to sorption kinetics and contact time.
The matrix-diffusion process gives an effect on the retardation for
sorbing tracers too and the surface diffusion is important in this pro-
cess. The developed variable aperture channel model was success-
Fig. 6. Experimental and simulated elution curves of the tracers.
Fig. 7. Migration plumes of Sr with time in the fracture. Migration plum moves from bottom plane to the top with time. Color brightnessrepresents concentration.
746 C.-K. Park et al.
September, 2006
fully applied in describing the migration of the solutes in rock frac-
tures. The combination of experimental observation and model sim-
ulation may be an effective approach to further understand the flow
and transport in rock fractures.
NOMENCLATURE
Dp : is the diffusivity into the rock pore in [m2/s]
Q : is the volumetric flow rate in [cm3/sec]
∆h : is the hydraulic head in [cm]
rw : is the radius of injection/elution borehole in [cm]
2d : is the distance between injection and elution boreholes
µ : is the viscosity of the transport solution in [g/cm·sec]
Pi : is the pressure at node i
C : is the concentration of a solute in the solution
Cij : is the flow conductance between nodes i and j
Ei : is the injection rate or elution rate at node i
τ : is the transporting time (min) or peak elution volume [ml]
u : is the linear velocity
Ka : is the distribution coefficient based on the fracture surface
area
qs : is the sorbed amount of a solute per the specific surface area
of the sorbing media
Subscripts
i : implies an index of the ith subsquare in the fracture surface
j : stands for the four facing nodes of surrounding subsquares
to node i
REFERENCES
Bear, J., Hydraulics of groundwater, McGraw-Hill (1979).Desbarats, A. J., “Macrodispersion in sand-shale sequences,” Water
Resour. Res., 26(1), 153 (1990).Kinzler, B.,Vejmelka, P., Römer, J., Fanghänel, Th., Wilberg, P., Jans-
son, M. and Eriksen, T., “Swedish-German actinide migration exper-iment at ÄSPÖ HRL,” Journal of Contaminant Hydrology, 61, 219
(2003).Kum, Y. S., Park, C. K., Hahn, P. S. and Choi, H. S., “An experimental
study on the chemical transport through a natural rock fracture,” J. of
Kor. Soc. of Env. Eng., 24(8), 1479 (2002).Langmuir, D., Aqueous environmental geochemistry, Chap.3.5, pren-
tice-Hall (1997).Moreno, L., Neretnieks, I. and Eriksen, T., “Analysis of some labora-
tory tracer runs in natural fissures,” Water Resour. Res., 21(7), 951(1985).
Moreno, L., Tsang, C. F., Hale, F. V. and Neretnieks, I., “Flow and tracertransport in a single fracture,” Water Res. Res., 24, 2033 (1988).
Moreno, L. and Neretnieks, I., “Flow and nuclide transport in fracturedmedia,” J. of Contaminant Hydrology, 13, 49 (1993).
Park, C. K., Park, H. H. and Woo, S. I., “Computer simulation study oftransient diffusion of Cs through a granite with unsteady-state diffu-sion model,” J. of Nuc. Sci. Tech., 29(8), 786 (1992).
Park, C. K., Keum, D. K. and Hahn, P. S., “Stochastic analysis of contam-inant transport through a rough-surfaced fracture,” Korean J. Chem.
Eng., 12, 428 (1995).Park, C. K., Vandergraaf, T. T., Drew, D. and Hahn, P. S., “Analysis of
the Migration of nonsorbing tracers in a natural fractures in graniteusing a variable aperture channel model,” J. of Cont. Hydrol., 26, 97(1997).
Park, C. K., Ryu, B. H. and Hahn, P. S., “Migration characteristics ofsome chemical species in a granite fracture according to their chem-ical properties,” Korean J. Chem. Eng., 19, 765 (2002).
Park, C. K. and Hahn, P. S., “Reversibility and Linearity of sorption forsome cations onto a Bulguksa granite,” Korean J. Chem. Eng., 16,758 (1999).
Tang, D. H., Friend, E. O. and Sudicky, E. A., “Contaminant transportin fractured porous media,” Water Res., 17, 555 (1981).
Tsang, Y. W., Tsang, C. F., Neretnieks, I. and Moreno, L., “Flow andtracer transport in fracture media- A variable-aperture channel modeland its properties,” Water Resour. Res., 24(12), (1988)
Washburn, F. E., Kaszeta, C. S., Simmons, and Cole, C. R., “Multicom-ponent mass transport model,” PNL-3179 (1980).


