Download - Thomas plueckebaum

1
Countrywide Broadband - Parameters
for Success (Landesweit Breitband - Parameter für Erfolg)
8th FTTH Conference 2012, FTTH Council Europe, ‚Deutscher Workshop‘,
Munich, 14. - 16. Febr. 2012
Some Results of the research project
„Implikationen eines flächendeckenden Glasfaserausbaus und sein Subventionsbedarf“
Dr. Thomas Plückebaum
14. February 2012

2
Content
• Approach
• Results
• Summary and conclusions

3
MDF areas ranked according to customer density
20 Cluster of 5% subscribers each
~ 2 Mio. potential
subscribers per cluster

4
Calculation of 4 NGA architectures with
detailed data of all regions in Germany
• Streets
• Buildings
• Business and residential
customers
1
DP – Distribution Point
MDF – Main Distribution Frame
MPoP - Metropolitan Point of Presence
MPoP DPMDF
Core
Network
Feeder Segment Drop Cable Segment
Customer
Concentration
network
Architectures
• PMP GPON
• P2P Ethernet
• P2P GPON
• FTTB P2P DSL

5
Important assumptions
• Maximum penetration
• 100% homes passed
• Mix of ducted/ aerial cables
• All cost considered (OPEX,
common, access, concentration,
core)
• Steady state approach
• No opportunity cost
• Inhouse cabling selectable
ARPU
Price per
month (in
€)
Busy hour
traffic
(in kbps)
customer
share
Telefone 17 20 10%
Telefone & Internet 30 380 45%
Telefone, Internet
und IPTV 40 425 35%
Busines customer 88 600 10%
Average
customer 38 382
6
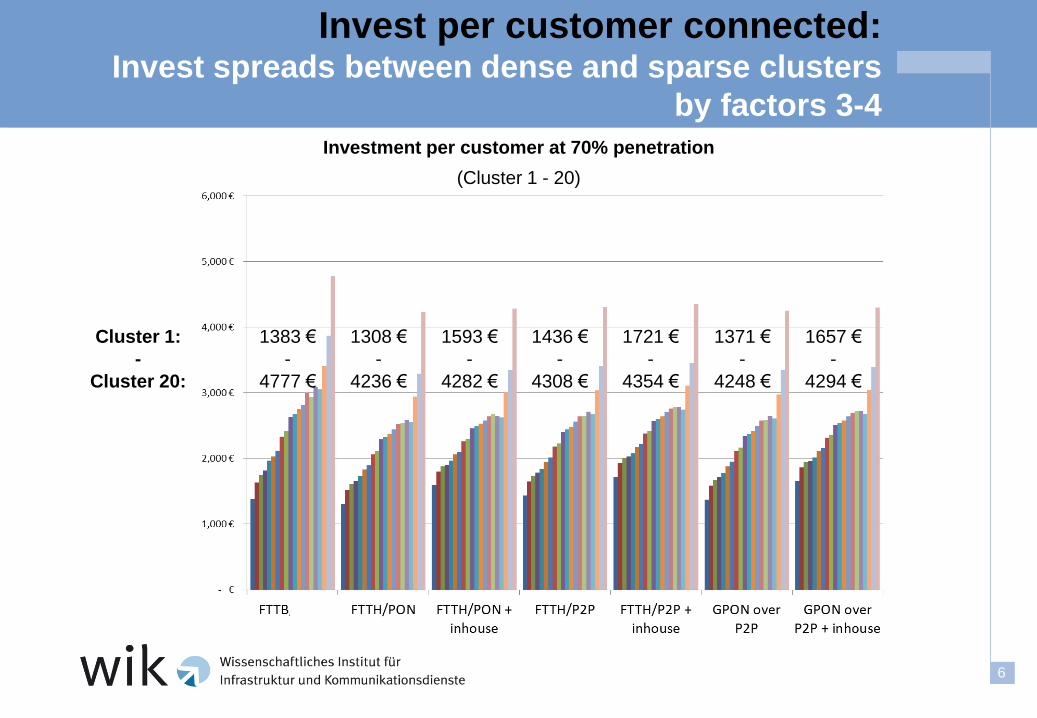
Invest per customer connected: Invest spreads between dense and sparse clusters
by factors 3-4
1383 €
-
4777 €
1308 €
-
4236 €
1593 €
-
4282 €
1436 €
-
4308 €
1721 €
-
4354 €
1371 €
-
4248 €
1657 €
-
4294 €
Cluster 1:
-
Cluster 20:
Investment per customer at 70% penetration
(Cluster 1 - 20)

7
Critical penetration rate depends on ARPU example: FTTH/P2P without inhouse cabling, clusters 1-10
Cluster 10
Cluster 1
Total cost per customer and month
depending on penetration
(FTTH P2P without inhouse cabling)
Eu
ro p
er
mo
nth
Penetration

8
Base case result
How to improve situation
• Profitable rollout for 25 - 45% of access lines in Germany
• Profitable coverage strongly depend on hight of ARPU and customer
penetration rate
• Ramp up cost make situation worse
• National invest between 70 and 80 Bn. €
• Passive fibre network has 80-90% share of total invest
• Reduce cost (e.g. by using existing facilities …)
• Improve penetration (wholesale open access, …)
• Increase ARPU
• One time subsidy
• Cross subsidies between clusters

9
Which ARPU-increase required? Either customers pay cost oriented prices per cluster of 30 € - 70 €,
or all customers pay additionally ~ 6 € per month
38€ + 5,89€ = ~44€
38€
FTTH/P2P ohne Inhouse, ARPU 38€, 70% Penetration
FTTH P2P
38€
44€
Cost and ARPU per customer and month
(at 70% penetration)
Cost per customer at 70% penetration
Base case ARPU
ARPU required for countrywide roll out

10
Which one time access price/ subsidy per
customer required?
Required one time access price /
subsidy between 100 – 2.400€
FTTH/P2P without Inhouse, ARPU 38€, 70% Penetration
FTTH P2P Invest and invest subsidy per cluster (per customer) In
ve
stm
en
t (p
er
cu
sto
me
r)
Invest subsidy per customer (at 70% penetration) per cluster
Total invest per customer (at 70% penetration) per cluster

11
Cummulative subsidies for profitable roll out
per cluster increment
A countrywide rollout of FTTH requires appr. 14 Bn. Euro subsidy
FTTH/P2P without Inhouse, ARPU 38€, 70% Penetration
FTTH P2P Invest and invest subsidy per cluster
(Bn. Euro) In
ve
stm
en
t (i
n B
n. E
uro
)
Invest subsidy per customer (at 70% penetration) in Bn. Euro
Invest per cluster (at 70% penetration) in Bn. Euro
Invest subsidy per cluster accumulated (at 70 % penetration) in Bn. Euro

12
If main goal of the operator is optimal
coverage (without losses) instead of profit,
profitable clusters can subsidize others
Clusters 1-7 are profitable
Clusters 8-20 have deficit
FTTH/P2P without Inhouse, ARPU 38€, 70% Penetration
Profit/ loss per subscriber and month E
uro
pe
r c
us
tom
er
an
d m
on
th

13
If main goal of the operator is optimal
coverage (without losses) instead of profit,
coverage can be nearly doubled
Cluster 14-20 bleiben
defizitär
Profits from clusters 1-7
subsidize clusters 8-13
successfully
FTTH/P2P without Inhouse, ARPU 38€, 70% Penetration
C14:
deficit cannot be
compensated completely
Profit/ loss per subscriber and month E
uro
pe
r c
us
tom
er
an
d m
on
th
14
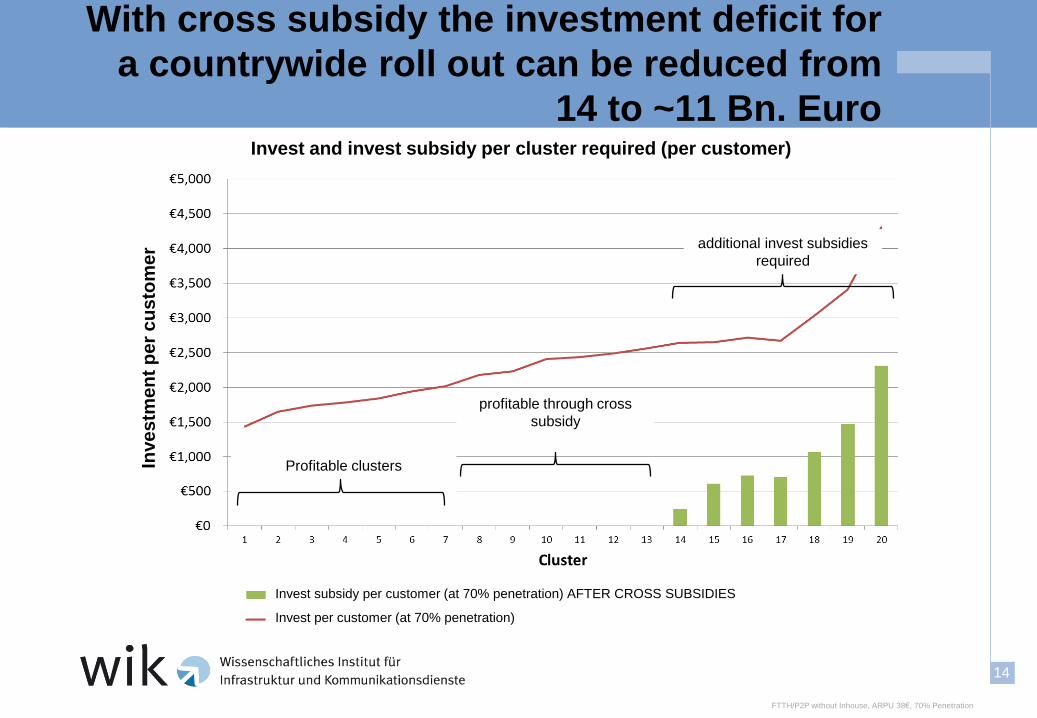
With cross subsidy the investment deficit for
a countrywide roll out can be reduced from
14 to ~11 Bn. Euro
Profitable clusters
profitable through cross
subsidy
additional invest subsidies
required
FTTH/P2P without Inhouse, ARPU 38€, 70% Penetration
Invest and invest subsidy per cluster required (per customer) In
ve
stm
en
t p
er
cu
sto
me
r
Invest subsidy per customer (at 70% penetration) AFTER CROSS SUBSIDIES
Invest per customer (at 70% penetration)

15
Results: country wide fibre roll out in
Germany under todays circumstances
cannot be profitable
• Invest volume 70-80 Bn. €
• FTTH in Germany only profitable for 25-45% of the access lines
• Coverage expansion with
• Higher ARPU: ~44€
• Invest subsidy: up to 2.500€ per access
• Cross subsidy: not sufficient for countrywide coverage
Results are comparable for many countries

16
Key factors for NGA success
• Penetration rate
• Wholesale product
• Migration of copper to fibre access
• ARPU
• User one time payment (Inhouse cabling, building access)
• Public subsidies/ prorated contribution system

17
Dr.-Ing. Thomas Plückebaum
WIK Wissenschaftliches Institut für Infrastruktur
und Kommunikationsdienste GmbH
Postfach 2000
53588 Bad Honnef
Deutschland
Tel.: +49 2224-9225-20
Fax: +49 2224-9225-63
eMail: [email protected]
www.wik.org
Study: www.wik.org - Diskussionsbeitrag Nr. 359 (German)
https://www.econstor.eu/dspace/handle/10419/52172
(ITS conference contribution (English)

18
Other important parameters
Invest positions Network element Invest per unit
Lifetime
(years)
Ethernet CPE 100€ 5
GPON CPE 115€ 5
FTTB Mini DSLAM in
basement of building 905€ 5
ODF port 23€ 35
OLT port 1000€ 7
Ethernet port
1Gbps / 10Gbps 120€ / 2000€ 7
Trench, duct and
cable incl. installation
per meter
120€ Cluster 1
…
40€ Cluster 20
35
Direct Investment Direct cost and other parameters
Parameter Assumption
Concentration network cost
per month
22,5 Mio € + 0,7€ per
customer
Core network cost per
month
6 Mio € + 1,08€ per
customer
Retail cost (customer care,
billing, sales & marketing,
customer acquisition) per
month
5€ per customer
WACC 10%

19
Comparing key invest positions for a total
roll out in GE at 70% penetration, Bn. Euro
FTTB PON PON
+ inhouse P2P
P2P
+ inhouse GPON
over P2P
GPON
over P2P
+ inhouse
Total invest
(Bn. €) 79.34 € 69.31 € 74.35 € 72.78 € 77.82 € 70.86 € 75.90 €
FTTR* 65% 51.84 €
76% 52.95 €
71% 52.95 €
73% 52.78 €
68% 52.78 €
74% 52.78 €
70% 52.78 €
Building access 14%
11.18 € 16%
11.18 € 15%
11.18 € 15%
11.18 € 14%
11.18 € 16%
11.18 € 15%
11.18 €
Inhouse cabling 7%
5.04 € 6%
5.04 € 7%
5.04 €
FTTB - Mini DSLAM 14% 10.96 €
CPE 3% 1.99 €
5% 3.81 €
5% 3.81 €
5%
3.31 € 4%
3.31 € 5%
3.81 € 5%
3.81 €
Active Technique
MPoP 4%
2.98 € 2%
1.12 € 2%
1.12 € 5%
3.99 € 5%
3.99 € 1%
0.68 € 1%
0.68 €
Rest** 0% 0.39 €
0% 0.26 €
0% 0.26 €
2% 1.52 €
2% 1.52 €
3% 2.41 €
3%
2.41 €
* Passive net from ODF to branch sleeve in the street in front of the building.
** Rest: MPoP-Invest in floor space, net sided ODF-ports, IPTV platform, central splitters with GPON over P2P
Passive
net:
80-90%
Active net:
10-20%

20
Financial demand for countrywide roll out,
all scenario overview
FTTB FTTH/PON FTTH/PON + inhouse FTTH/P2P
FTTH/P2P + inhouse
GPON over P2P
GPON over P2P + inhouse
No. of profitable Cluster 4 9 7 7 5 9 7
Required uniform ARPU at 70 % Penetration (€ pro Monat)
51.55 € 42.29 € 43.11 € 43.89 € 44.98 € 42.56 € 43.44 €
All customer monthly broadband subsidy, 38 € ARPU and 70 % penetration (€ per montht)
13.55 € 4.29 € 5.11 € 5.89 € 6.98 € 4.56 € 5.44 €
invest subsidy reqired (Bn. €) 27.07 €
(Bn.) 10.54 €
(Bn.) 12.49 €
(Bn.) 14.21 €
(Bn.) 16.89 €
(Bn.) 11.15 € (Bn.)
13.32 € (Bn.)
Calculation basis for profitability: ARPU 38 €

21
Sensitivities
1. Brownfield instead of greenfield
2. Higher costen
3. Lower penetration

22
Sensitivity considerations do not reval principal
change of results
1. 35€ instead of 38€ ARPU: 4 insteaf of 7 profitable clusters
2. Brownfield instead of greenfield: small cost decrease
3. Higher Cost*: 6 instead of 7 profitable clusters
4. Penetration only 60% max.: 5 instead of 7 profitable
clusters
Example: FTTH/P2P without Inhouse
*Changes:
• Invest for civil construction, ducts, cables and installation for building access: 40 €
instead of 30 € per meter
• CPE: 125 € instead of 100 €
• Aerial cabling: No aerial instead of 5% in the last five clusters

23
Profitable coverage at ARPU of 38€:
appr. 25-45% of customers
Red = critical penetration rate is greater than 70%
Cluster
Customers in percent (cum,) FTTB FTTH/PON
FTTH/PON + inhouse FTTH/P2P
FTTH/P2P + inhouse
GPON over P2P
GPON over P2P +
inhouse 1 5% 2 10% 3 15% 4 20% 5 25% 6 30% 7 35% 8 40% 9 45%
10 50% 11 55% 12 60% 13 65% 14 70% 15 75% 16 80% 17 85% 18 90% 19 95% 20 100%
Green= critical penetration rate is less or equal 70%

24
Profitable coverage at ARPU of 35€,
significant decrease
Cluster
Customers in percent (cum.) FTTB FTTH/PON
FTTH/PON + inhouse FTTH/P2P
FTTH/P2P + inhouse
GPON over P2P
GPON over P2P +
inhouse 1 5% 2 10% 3 15% 4 20% 5 25% 6 30% 7 35% 8 40% 9 45%
10 50% 11 55% 12 60% 13 65% 14 70% 15 75% 16 80% 17 85% 18 90% 19 95% 20 100%
Red = critical penetration rate is greater than 70%
Green= critical penetration rate is less or equal 70%

25
Sensitivities considered
70% Penetration, 38 € ARPU
60 % Penetration, 35 € ARPU, higher cost
60 % Penetration, 38 € ARPU
No. of profitable clusters 7 1 5
Uniform ARPU for profitable roll out (€ per month)
44 € 48 € 47 €
Broadband contribution for all NGA-customers (€ per month)
6 € 13 € 9 €
invest subsidy required (Bn. €)
14 Mrd. € 27 Mrd. € 25 Mrd. €
Basis
Szenario Variant 1 Variant 2
FTTH/P2P ohne Inhouse

26
If penetration rate falls from 70% to 60%,
profitable coverage and potential of cross
subsidy also decreases
FTTH/P2P without Inhouse, ARPU 38€, 60% Penetration
Clusters 9-20 remain in deficit
Profits from clusters 1-5
subsidize clusters 6-8
successfully
Profit/ loss per subscriber and month E
uro
pe
r c
us
tom
er
an
d m
on
th


