
i
THERMAL DENOX OPTIMIZATION:
A CASE STUDY IN FLUID CATALYTIC CRACKING
by: David E. Rozier III
A thesis submitted to the faculty of the University of Mississippi in partial fulfillment of
the requirements of the Sally McDonnell Barksdale Honors College
Oxford
May 2017
Approved by:
______________________________
Advisor: Dr. Adam Smith
______________________________
Reader: Dr. John O’Haver
______________________________
Reader: Dr. Wei-Yin Chen

ii
© 2017
David E. Rozier III
ALL RIGHTS RESERVED

iii
This thesis is dedicated to my late grandfather, David E. Rozier, Sr., who
was fond of saying, “A job worth doing is a job worth doing well.”

iv
Acknowledgments
First and foremost, my completion of this thesis would not have been possible
without the love and support of my family and friends, especially my parents, Dave and
Jackie Rozier. I would like to thank Dr. Adam Smith, Dr. John O’Haver, Dr. Wei-Yin
Chen, and Mr. David Carroll for their feedback and encouragement. I would also like to
thank ExxonMobil for affording me the opportunity as an intern to conduct this project
work and granting me permission to publish technical details. Finally, I must thank all of
my coworkers in Operations Support at the Baton Rouge Refinery for their assistance
with the project discussed here.
v
Abstract
This thesis will first provide background information on fluid catalytic cracking
(FCC), a highly important unit operation to the process of petroleum refining, and a
description of Thermal DeNOx, an environmental treatment system common to FCC units
and other process units where high temperature furnaces are used. Next, this thesis will
detail a project which I had the chance to lead as a process engineering intern at
ExxonMobil’s Baton Rouge Refinery in the fall of 2016. The objective of the project
was to optimize Thermal DeNOx systems installed on two FCC units at the refinery.
Experiments were conducted on these units at different chemical injection rates and
temperatures, in order to determine the operating parameters at which the Thermal
DeNOx systems were as efficient and economical as possible. A control scheme was
implemented on the unit to maintain operation at these experimentally determined
parameters, with a projected economic benefit of $250,000 per year for the refinery.
This thesis also includes a discussion of my personal learnings and takeaways from this
experience, including the challenges one can face when leading an engineering project in
an industrial manufacturing setting.

vi
Table of Contents
Introduction..........................................................................................................................1
Case Study: FCC Thermal DeNOx Optimization..............................................................11
Background.............................................................................................................11
Methods..................................................................................................................12
Results and Discussion...........................................................................................16
Conclusion.........................................................................................................................24
Bibliography......................................................................................................................25

vii
List of Figures
Figure 1 A Typical High-Conversion Refinery: Simplified Process Flow................3
Figure 2 Simplified FCC Process Flow......................................................................4
Figure 3 Regenerator Flue Gas Treatment: General Layout......................................6
Figure 4 Temperature Effect of H2 on Thermal DeNOx..........................................10
Figure 5 PCLA CO Furnace Process Flow..............................................................11
Figure 6 Effect of Regenerator CO Percent on Thermal DeNOx Efficiency...........17
Figure 7 Effect of Hydrogen Injection on Thermal DeNOx Efficiency...................17

viii
List of Abbreviations
COF carbon monoxide furnace
DeNOx nitrogen oxide removal/destruction
FCC fluid catalytic cracking
KGO coker gas oil
LPG liquefied petroleum gas (primarily propane)
NH3 ammonia
NOx nitrogen oxides
OPEX operating expenses
PCLA powdered catalyst unit of Louisiana (ExxonMobil FCC unit)
PGO process gas oil
SNCR selective non-catalytic reduction
SOx sulfur oxides
Vppm volumetric parts per million (measure of concentration)
WGS wet gas scrubber
WHB waste heat boiler

1
Introduction
The development of the fluid catalytic cracking (FCC) process was critical to the
success of the petroleum refining industry in the 20th century, and the process remains
important today. Following the Industrial Revolution, including the invention of the
automobile, petroleum refiners faced a challenge – to match the volume demand for
petroleum products with the volume composition of crude oil. The volume demand for
gasoline had begun to increase much more rapidly than the volume demand for fuel oil,
making the heavier fractions of crude less valuable. Interestingly enough, refiners faced
the opposite problem in the 19th century, and it was common practice then to dump
excess gasoline while processing the crude oil required to meet fuel oil demand. With
petroleum refiners seeking a solution that limited waste of crude oil resource, engineers
worked to develop methods to convert the heavier fractions of crude into gasoline-range
molecules [2].
The first commercial operation that successfully addressed this economic
challenge facing the petroleum industry was the Houdry unit, started up in 1937 by Sun
Oil [4]. Named after the French inventor, Eugene Houdry, this unit relied upon a semi-
batch catalytic cracking process, enabling the large, heavier crude oil molecules to be
cracked into smaller gasoline-range molecules in the presence of a powdered catalyst.
The catalytic cracking reactions deposited coke (carbon) onto the catalyst and required
manual removal and restoration of the deactivated catalyst for each batch. Soon after the
startup of the Houdry unit, Standard Oil began an effort to develop a continuous catalytic

2
cracking process, culminating in 1942 with the startup of the first ever commercial FCC
unit, PCLA-1, in Baton Rouge, LA. This continuous process was made possible by
fluidizing the powdered microspherical catalyst via the addition of sufficient gas,
allowing the catalyst particles to flow as a fluid and be continuously regenerated.
Following this success, refiners worldwide began utilizing and improving upon similar
processes. The success of this FCC unit in converting the lower volume demand
fractions of crude into higher volume demand fractions (gasoline) became a key factor in
profitability for petroleum refiners. Today, nearly 50% of all gasoline produced comes
through FCC and ancillary units [4].
In order to understand how an FCC unit fits into the refining process, it is helpful
to understand the general process flow of a typical modern refinery. The refining process
begins with the crude unit, where crude oil (raw feed) is separated via distillation into
various fractions according to boiling point, before being sent to intermediate units for
further processing (see Figure 1). The FCC is typically fed process gas oil (PGO) from
the crude unit as well as coker gas oil (KGO) from the coker, a thermal cracking unit.
Gas oil is typically defined as the fraction of crude oil with a boiling point between 450oF
and 800oF [2]. Again, the value of the FCC is in its ability to selectively convert these
low-value feeds into high-value products. The final products from the FCC and ancillary
units include LPG, gasoline, and various fuel oils. Conveniently, adjustments to FCC
product fractionation can be made in order to shift product yields in accordance with
seasonal demand, a common practice for modern refiners [2].

3
Fig
. 1.
A T
ypic
al
Hig
h-C
onve
rsio
n R
efin
ery:
Sim
pli
fied
Pro
cess
Flo
w [
4]

4
A simplified process flow for a typical FCC unit is shown in Figure 2. The main
components of the FCC include the riser, disengaging vessel (“reactor”), regenerator, and
fractionator. As fresh feed enters the unit, it is mixed with recycle from the fractionator
(cycle oil) and fresh catalyst from the regenerator. Cracking reactions take place in the
riser as soon as the feed contacts the hot regenerated catalyst. The main driving force for
the catalyst traveling up the riser is, interestingly enough, the expanding volume of the
hydrocarbon gas [4]. The riser essentially acts as a plug-flow reactor as the gaseous
hydrocarbon feed and fluidized powdered catalyst travels through. Upon reaching the
disengaging vessel, the desired cracking process has nearly reached completion. This
vessel is also commonly referred to as the reactor, though today that is a bit of a
misnomer (in older designs significant cracking did take place in this vessel). In the
disengaging vessel, the spent catalyst is separated from the cracked hydrocarbon gas,
usually via multi-stage cyclones. The gaseous hydrocarbon product is routed to the
Fig. 2: Simplified FCC Process Flow [2]

5
fractionator, where it is cooled, liquefied, and distilled into various fractions. The lighter
fractions are sent downstream for further processing, and the residual hydrocarbon (cycle
oil) is recycled to the FCC feed.
One key characteristic of the FCC is the ability of the catalyst to be continuously
regenerated. During the cracking process, coke is deposited on the catalyst, which
inhibits active sites, and the catalyst is considered spent. Coke is made up of mostly
carbon, though other components include hydrogen, sulfur, and nitrogen compounds [4].
Conveniently, this coke is combustible and can be burned off in the regenerator, thus
restoring catalyst activity. Air blowers are used to supply the necessary combustion air,
as well as the air necessary to re-fluidize the spent catalyst as it flows to the regenerator.
Following regeneration of the catalyst by removal of the coke through combustion in the
regenerator, the catalyst is routed to the riser, where it is once again mixed with the feed
at the start of the process cycle. The driving force for this flow is usually the pressure
differential between the regenerator and the disengaging vessel, and steam is typically
added to aid in fluidization at the mixing point of the regenerated catalyst and
hydrocarbon feed. The regenerated catalyst, being around 200oF – 300oF hotter than the
feed, provides the heat necessary for both feed vaporization and cracking reactions to
take place in the riser [4].
In this manner, the catalyst is continually circulated within the unit, and the
catalyst circulation rate can be astoundingly large, about 70 tons per minute for larger
units! This metric provides a good idea of the size and scope of FCC units. Circulating
regenerated catalyst within the unit is referred to as equilibrium catalyst or “e-cat.”
6
Refiners must add fresh catalyst, however, to make up for catalyst losses and to replace e-
cat that is periodically withdrawn to maintain catalyst activity [4].
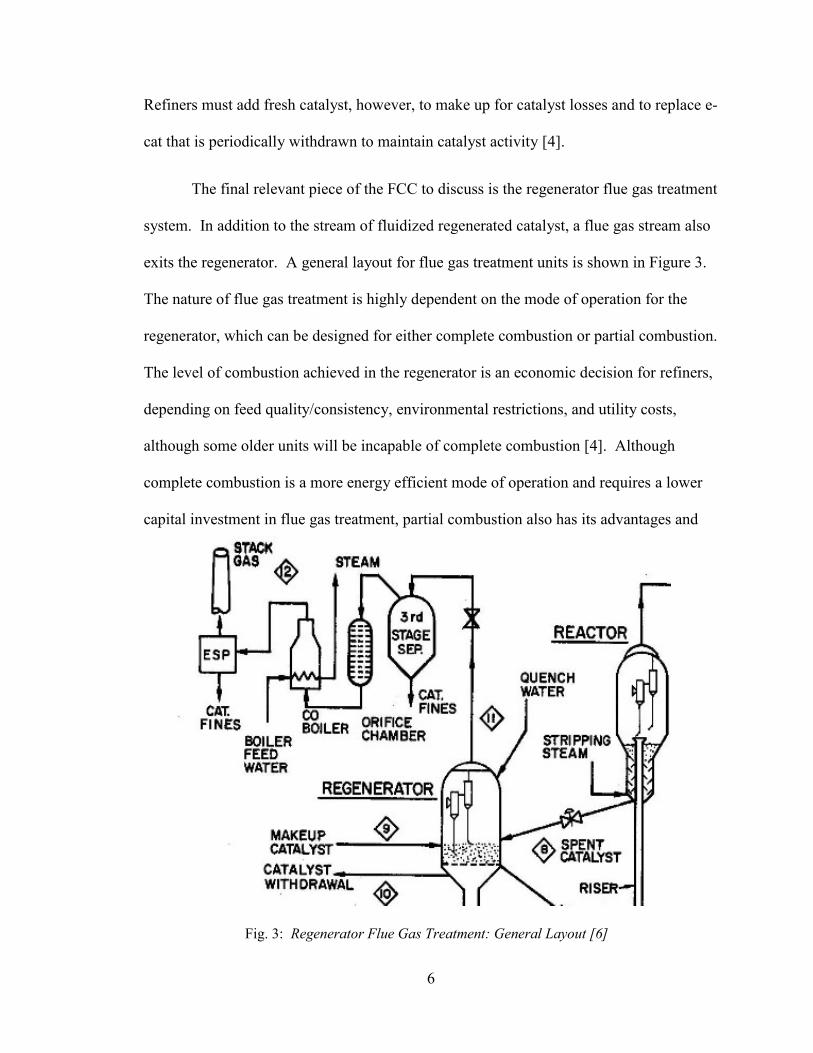
The final relevant piece of the FCC to discuss is the regenerator flue gas treatment
system. In addition to the stream of fluidized regenerated catalyst, a flue gas stream also
exits the regenerator. A general layout for flue gas treatment units is shown in Figure 3.
The nature of flue gas treatment is highly dependent on the mode of operation for the
regenerator, which can be designed for either complete combustion or partial combustion.
The level of combustion achieved in the regenerator is an economic decision for refiners,
depending on feed quality/consistency, environmental restrictions, and utility costs,
although some older units will be incapable of complete combustion [4]. Although
complete combustion is a more energy efficient mode of operation and requires a lower
capital investment in flue gas treatment, partial combustion also has its advantages and
Fig. 3: Regenerator Flue Gas Treatment: General Layout [6]

7
remains a common practice to this day. Partial combustion regeneration has the
advantage of offering a higher range of coke yields, translating into greater FCC feed
flexibility and product yield [4]. The level of combustion achieved, and consequently the
amount of CO present in the regenerator flue gas, is usually controlled by adjusting the
flow of supply air. Regenerator flue gas containing CO can be routed to a CO furnace or
CO boiler, where the CO is combusted to near completion with excess O2 present. Heat
energy in the CO furnace (COF) flue gas is usually captured via steam generation.
Finally, before being released to the atmosphere, the COF flue gas is sent through either
an electrostatic precipitator (ESP) and/or a wet gas scrubber (WGS) in order to remove
catalyst fines and various environmental pollutants.
The treatment of flue gas in FCC units is a process designed to eliminate or
significantly limit the release of harmful compounds to the atmosphere. The three types
of compounds of chief concern are carbon monoxide, sulfur oxides, and nitrogen oxides.
Strict environmental regulations surround the release of these compounds, as CO is a
toxic gas, and sulfur oxides (SOx) and nitrogen oxides (NOx) are known contributors to
ozone/smog and acid rain [1]. Carbon monoxide release from FCC units is almost
completely eliminated by combustion in the CO furnace or CO boiler. SOx release is
abated in various ways, including the utilization of scrubbers and the use of additives
with the catalyst in the regenerator [4]. The abatement of nitrogen oxides, however,
tends to be more complex and is most relevant to this paper, thus warranting further
discussion.
NOx produced by FCC units includes almost exclusively NO and NO2, about 90%
of which is NO [4]. NOx compounds are produced by the FCC regenerator from two

8
sources: nitrogen in combustion air and deposits on spent catalyst from nitrogen in the
feed. As combustion takes place in the regenerator, nitrogen reacts with oxygen to form
primarily NO in the following manner:
N2 + O2 2NO
While the concept of NOx formation during combustion is quite simple, methods
of reducing NOx emissions get more complicated. Now, various process variables
surrounding the FCC regenerator can be manipulated in order to mitigate NOx formation,
such as reducing excess O2 or reducing dense bed temperature. However, these methods
are marginal and are not usually sufficient to meet the required NOx abatement [4].
To date, one of the most effective methods, both chemically and economically, of
controlling NOx in flue gas was pioneered by Exxon Research & Engineering Co. in the
late 1970s. This method involves injecting vaporized ammonia in a process usually
referred to as Selective Non-Catalytic Reduction (SNCR) or Thermal DeNOx. This
process is only effective up to around a 70% reduction in NOx [3], but this is typically
adequate for FCC applications [4].
Thermal DeNOx involves the selective reduction of NO by vaporized ammonia
(NH3) in the presence of excess O2 [3]. Thermal DeNOx involves a complex chain of
free-radical reactions, the kinetics of which are highly temperature dependent; however,
the net overall effect of the process, given the correct temperature range is shown by the
following reaction:
NH2 + NO N2 + H2O
9
The fact that Thermal DeNOx requires a specific temperature window in order to
be effective can make its application challenging. There is not a known method to
increase the upper temperature limit; however, it is known that the addition of H2 can
make the method effective at lower temperatures (down to ~1300oF). According to the
generally accepted mechanism [3], the oxidation of H2 assists in creating more NH2
radicals at lower temperatures through the following series of reactions:
H2 + OH H + H2O
H + O2 OH + O
O + NH3 OH + NH2
OH + NH3 H2O + NH2
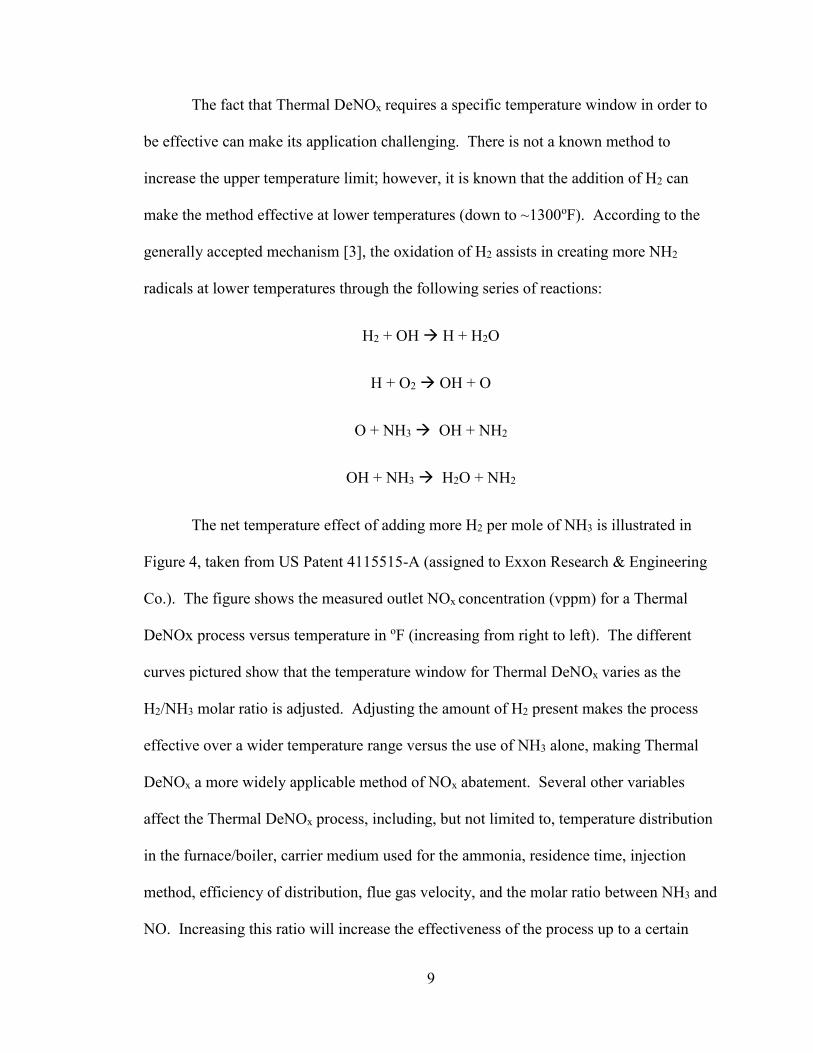
The net temperature effect of adding more H2 per mole of NH3 is illustrated in
Figure 4, taken from US Patent 4115515-A (assigned to Exxon Research & Engineering
Co.). The figure shows the measured outlet NOx concentration (vppm) for a Thermal
DeNOx process versus temperature in oF (increasing from right to left). The different
curves pictured show that the temperature window for Thermal DeNOx varies as the
H2/NH3 molar ratio is adjusted. Adjusting the amount of H2 present makes the process
effective over a wider temperature range versus the use of NH3 alone, making Thermal
DeNOx a more widely applicable method of NOx abatement. Several other variables
affect the Thermal DeNOx process, including, but not limited to, temperature distribution
in the furnace/boiler, carrier medium used for the ammonia, residence time, injection
method, efficiency of distribution, flue gas velocity, and the molar ratio between NH3 and
NO. Increasing this ratio will increase the effectiveness of the process up to a certain

10
point, beyond which unreacted ammonia is likely to “slip” past the furnace to the stack,
which can also be an environmental concern [4]. The effect and significance of each one
of these factors should be examined when examining the feasibility of a specific Thermal
DeNOx application.
Fig. 4: Temperature Effect of H2 on Thermal DeNOx [5]
Outl
et N
Ox c
once
ntr
atio
n (
vppm
)
Temperature (oF) – High to Low
Note: Curves labeled
by H2/NH3 mole ratio

11
Case Study: FCC Thermal DeNOx Optimization
Background
Having discussed Thermal DeNOx and FCC units in general, it is now possible to
discuss project work for a specific application on PCLA-2 and PCLA-3 (“Powdered
Catalyst Louisiana” FCC units) at ExxonMobil’s Baton Rouge Refinery. Interestingly
enough, this is the same site where the world’s first FCC unit, PCLA-1, was started up in
1942, which initially had a capacity of 12,000 barrels/day (bpd). After many additions
and improvements over the years, these two units are now capable of producing over ten
times that amount, 120,000 bpd each! This capacity equates to the production of
approximately 10 million gal/day of gasoline by these units alone.
The area of focus for this project is the flue gas section for both PCLA units,
specifically the CO furnace (COF) and Thermal DeNOx systems (see Figure 5). PCLA-2
and PCLA-3 operate in parallel, being nearly identical with few exceptions. Each unit
has its own CO furnace, but both share the same wet gas scrubber (WGS). A Thermal
DeNOx system is installed on each COF, where vaporized ammonia is injected through a
Fig. 5: PCLA CO Furnace Process Flow [courtesy of ExxonMobil]

12
series of nozzles using pressurized steam as a carrier. The combination of these systems
is designed to reduce NOx effluent concentration at the WGS to <50 vppm, in accordance
with environmental regulations.
About 18 months prior to the start of this project, waste heat boilers (WHB) were
removed from the PCLA-3 flue gas system as part of a turnaround, or a period designated
for equipment maintenance and replacement. An orifice chamber was installed in its
place in order to meet the necessary pressure drop for the process. As a result of this
change, the average operating temperature of the PCLA-3 COF increased from ~1600oF
to ~1750oF, varying within a temperature window of approximately 100oF.
Consequently, fuel gas feed to the furnace could be reduced, a cost savings for the
refinery. However, it was observed that the usage of ammonia, which had to be
purchased from an external vendor, by the PCLA-3 DeNOx system significantly
increased at this time. Following technical guidance, hydrogen feed to the DeNOx
system was reduced to a minimum. Ammonia usage decreased as a result but was still
greater than before WHB removal. Therefore, a project was initiated to scope the
possibility of optimizing the Thermal DeNOx system for each unit, specifically
concerning efficiency related to temperature shifts, with the goal of realizing OPEX
savings by reducing ammonia usage.
Methods
After consulting technical resources and learning how FCC process variables
affect Thermal DeNOx efficiency, the next logical step was to conduct experiments in

13
order to quantify the effect of these process variables and optimize unit controls
accordingly. Of course, the concentrations of NOx entering and exiting the COF are the
key variables for this system, with furnace temperature, ammonia, and hydrogen
flowrates also being of importance. The ability to measure or take into account each of
these process variables was not a trivial matter.
Fortunately, COF temperature was one process variable which could be measured
with relative ease. Because of the importance of COF temperature to the efficiency of
CO combustion in flue gas, it is a closely monitored variable. Parallel thermocouples are
installed on the CO furnace for each unit. Obviously, the high temperature (~1700oF)
makes the reliability of this instrumentation a challenge, and these thermocouples often
have to be replaced. However, that was not an issue for this specific test. It was assumed
that temperature distribution within the furnace was approximately even and considered
constant.
Ammonia flowrate was another variable where instrumentation was readily
available. The NH3 supply for this system, a ~30 wt. % aqueous solution, comes from a
large on-site tank with a capacity of several hundred tons. Flowmeters are installed on
the liquid supply to each DeNOx unit before the ammonia is vaporized by heat
exchangers. Therefore, the flowrate to each unit in lb/hr was a reliably measured process
variable. The distribution of ammonia within the furnace was assumed to be constant for
the purpose of this test. Carrier steam rate was monitored to ensure no major upsets to
this condition.
Hydrogen flowrate was a more difficult variable to accurately monitor.
Historically, the flowrate of H2 to each DeNOx unit was not a closely monitored variable,

14
having usually been controlled by providing a constant set point as input and leaving it in
place. Additionally, with the PCLA-3 DeNOx system now operating at a higher
temperature and requiring less hydrogen, the control valve is not appropriately sized for
the application, making flowrate precision a possible issue. It was also discovered that
this specific flowmeter did not have an accurate zero reading, requiring calibration by
instrumentation technicians before proceeding further with any testing.
Accounting for the inlet concentration of NOx was challenging. Unfortunately,
there are no analyzers on the gas feed to the COF to be relied upon. Fortunately, the
experimental design used required a constant inlet NOx concentration throughout the
testing period, so that an accurate NOx measurement was not essential. Unit process
variables such as feed composition and rate, regenerator combustion air rate, and
regenerator efficiency (i.e. CO percent in flue gas) were monitored and held as constant
as possible during the test, as each of these variables was known to impact regenerator
flue gas NOx. Therefore, the COF inlet NOx concentration could be assumed constant.
Measuring outlet NOx concentration was another challenge. The only NOx
analyzer available is installed at the wet gas scrubber, downstream of both CO furnaces
(PCLA-2 and PCLA-3 share the same WGS). Therefore, it is not possible to isolate the
outlet NOx concentration for either DeNOx unit. Therefore, it had to be assumed that
PCLA-2 NOx emissions to the WGS were constant throughout testing. The same
parameters that were monitored for PCLA-3 (feed rate and composition, regenerator
combustion air rate, and flue gas CO percent) were similarly monitored for PCLA-2.
Having identified the process variables involved and how to monitor each, it was
possible to consider how experimentation on the unit would be conducted. These
15
experiments were intended to measure the efficiency of the DeNOx system over a range
of furnace temperatures. The furnace temperature would be adjusted between the limits
of normal operation by changing fuel gas and combustion air rates. DeNOx efficiency
was measured by determining the flowrate of ammonia required to maintain the WGS
NOx concentration at a set point of 45 vppm (the usual target). This test would be
conducted for two distinct regenerator operating conditions: 6% CO and 7% CO, in
order to determine if this change in flue gas CO, a normal variation, would significantly
impact DeNOx efficiency. Most importantly, these experiments were to be run with zero
H2 in the system, so that the effect of having H2 present could be isolated in further
testing.
Conducting these first two experimental test runs involved a great deal of
preparation, most importantly regarding safety and environmental concerns surrounding
the adjustment of COF temperature. Conducting this test involved writing a procedure
for the unit controller to follow, along with establishing limits on certain process
conditions that, if exceeded, would require a stoppage of the test and a further review of
the test plan before attempting to repeat. Fortunately, each run conducted under this test
plan was successful on its first attempt, each requiring approximately four hours to
complete. Each test run was conducted on a separate day with the requirement that unit
conditions be approximately the same on each day.
The first test run was conducted at 6% CO in the flue gas entering the CO
furnace. To begin, H2 flow to the DeNOx system was shut off with a manual block valve.
The furnace was cooled by reducing fuel gas flow and increasing quench air flow, while
closely monitoring fuel/air ratio to avoid possible upset. Holding steady at around

16
1680oF, minute-average data values for temperature, NH3 flowrate, and WGS NOx
concentration were recorded for 30 minutes. The temperature was increased step-wise by
approximately 30oF, 30 minutes at each step, to ~1800oF. The second run of this test was
similarly conducted at 7% CO in the regenerator flue gas.
Following this initial testing, it was possible to conduct additional testing in order
to identify the effect of hydrogen on the system. Essentially, the same experimental
design was used with one exception – the addition of H2. Since it is known that DeNOx
chemistry is dependent on the ratio between H2 and NH3 and not an absolute amount, this
test required the creation and implementation of a ratio control on the unit. This control
was designed to adjust the H2 flowrate NH3 flowrate changes, according to a set mol:mol
ratio. Because the anticipated effect of adding H2 was to shift the efficiency curve to
lower temperatures, 6% CO was chosen as a target for the regenerator flue gas, as a lower
CO percent makes it possible to reach lower furnace temperatures. After the successful
run of this test, it was possible to examine the data and determine if optimization of unit
controls was economically feasible.
Results and Discussion
The data from the initial test runs at 6% and 7% CO is plotted along with a curve
fit in Figure 6. From this data, it was found that the efficiency of the Thermal DeNOx
unit varied greatly with temperature, finding maximum efficiency at approximately
1770oF. The maximum efficiency for this system is the point at which ammonia injection

17
Fig. 6: Effect of Regenerator CO Percent on Thermal DeNOx Efficiency:
Ammonia Injection Rate at Constant Outlet NOx vs. COF Temperature for zero H2
COF Temperature (oF)
NH
3 I
nje
ctio
n R
ate
(lb
/hr)
Fig. 7: Effect of Hydrogen Injection on Thermal DeNOx Efficiency:
Ammonia Injection Rate at Constant Outlet NOx vs. COF Temperature
COF Temperature (oF)
NH
3 I
nje
ctio
n R
ate
(lb
/hr)

18
rate is at a minimum for a given amount of NOx reduction, i.e. NOx concentration at the
WGS. As for the effect of regenerator CO%, it was found that this variable did not
significantly affect the efficiency of the DeNOx system either absolutely or relatively
with temperature.
The data from the second round of testing with the addition of H2 was plotted and
curve fit in a similar manner as previous tests. In Figure 7, this data is shown compared
to baseline data at 6% CO and zero H2 injection. The value of the H2:NH3 ratio used is
proprietary information to ExxonMobil and thus not published in this report. The data
gathered from this test supports the theory that increasing H2 relative to NH3 shifts the
DeNOx efficiency curve to a lower temperature range. The minimum of the curve, being
the point of maximum efficiency for the system, lies around 1720oF, a shift of
approximately 50oF from the baseline condition. This temperature shift is, again, within
the normal operating temperature variation for the CO furnace, which is driven by CO
percent in the flue gas. CO percent is an important variable for the unit driven by several
economic factors having to do with feed composition and, to a lesser extent, COF steam
production rates, but those factors are not detailed here. The objective of this project was
to optimize the Thermal DeNOx systems within the confines of these existing economic
parameters.
Having determined experimentally the per-mole temperature effect of additional
hydrogen on the DeNOx system, it became possible to design an optimal control scheme.
Knowing that, for optimal DeNOx efficiency, the H2:NH3 molar ratio needed to be zero at
1770oF and greater, and X mol:mol at 1720oF, it was possible to build off the simple ratio
control built for testing in order to adjust this ratio linearly with temperature. It was
19
suggested by available technical resources that this temperature effect increases linearly
with the H2:NH3 molar ratio and so determined that further testing was not necessary.
As a result of these experimental findings and modified unit controls, a 27%
reduction in ammonia usage was projected. The associated OPEX savings with this
improvement on PCLA-3, and following the implementation of this control scheme on
PCLA-2 following turnaround in 2017, are anticipated to be approximately $250,000 per
year. With these returns anticipated for the foreseeable future, this annual savings of
$250,000 can be expressed as having a present value of $2.5 million dollars, assuming a
conservative annual interest rate of 10 percent. Although this is not a tremendous amount
of money considering the scope of other projects at a petroleum refinery, it is important
to consider the market here. In a commodity market, as is the market for petroleum fuels,
any cost savings effort has a direct impact on profitability. The costs associated with this
project were quite minimal. Essentially the only cost was the time spent by the members
of the team - including unit controllers and supervisors, controls engineers, process
engineers, and an engineering intern - in the undertaking of unit testing over the course of
a few days and the design of a simple control program.
Beyond the tangible outcomes from this project, there are several other takeaways
to consider. First and foremost, it became quite obvious safety is priority number one
when it comes to any sort of activity in a manufacturing environment. This importance
cannot be overstated. At times, this can offer quite a challenge with planning and moving
forward with a process unit change, considering the propagating effect any sort of change
can have. Because of this, a number of reviews, modifications, and approvals are usually
required before taking action. For this particular application, the most important safety

20
consideration had to do with the manipulation of furnace controls. It was determined that
a risk of “tripping” or “flooding” the furnace, meaning the loss of combustion, existed
while conducting the unit tests. A furnace trip such as this could result in a CO release
near the unit, a significant environmental concern, as well as a safety concern for
personnel having to re-ignite the furnace. This risk was mitigated by placing limits on
furnace fuel gas and air feed, as well as ensuring controls were not adjusted too quickly
by operations. Especially at a refinery, steady-state operation is not usually upset by
quick manual control changes.
Along the lines of process controls, another challenging aspect of this project had
to do with instrumentation. Because it was not possible to have reliable and accurate
instrumentation for every variable considered, it was necessary to get creative with the
experimental design. This came into play in this project where gas analyzers were
lacking around the CO furnace. The experiment had to be designed so that the inlet NOx
concentration could confidently be held constant without being able to monitor it directly.
This meant many other upstream variables had to be monitored to confirm that the NOx
concentration variation was acceptable. The process control manipulation required for
the unit tests conducted here involved adjusting the steady state temperature of the CO
furnace, and again, these units are not designed for quick manual upsets of steady state,
which is an economically determined operating condition for the unit.
It also became apparent that the challenges associated with conducting an
experiment in an industrial manufacturing setting are quite different from those
associated with conducting an experiment in a laboratory or similar setting. This is
especially true in an environment as fast-paced as a petroleum refinery, where there can

21
be essentially an unlimited number of variables to consider. Practically must govern
one’s thought process here. The priority is not to achieve perfect experimental results,
but simply to achieve results that provide enough information and confidence to move
forward with a decision. Although ideas behind good experimental design, i.e.
identifying and controlling for important variables, can be universal between the two
settings, that is about where the similarities stop.
Some of the differences associated with conducting an experiment in industry are
evident in the data collected during this project as well. For the purposes of laboratory
research, these experimental results would likely not be adequate to draw reliable
conclusions. In the third test run, for example (Figure 7), the data was not as precise as
previous runs. However, the data was good enough to confirm predictions about the
effect of adding H2 to the process. Therefore, it was worthwhile to move forward in
creating a simple unit control rather than repeat the test for better data! Although
repeatability is required in science, in industry, if something suggests there is a good
chance of making money though a minor unit change, there is no reason to wait to
implement the idea (after the safety risk has been considered of course). This is
especially true for such a minor change as the one made from these experimental results.
Having considered the associated cost and risk (minimal) and the substantial potential
benefit, the decision to move forward was made with confidence.
Another point of discussion concerns the experimental methods used regarding
the measure of DeNOx efficiency. The best experimental method, perhaps, in a fully
controlled setting such as a lab, would be to measure the change in outlet NOx
concentration with temperature at a constant ammonia injection rate. However, this

22
method was not used for the tests conducted on existing units because of practical
considerations. Conducting the experiments with the chosen method allowed made it
possible to calculate not only the most efficient unit operating conditions for COF
Thermal DeNOx, but an estimate of the allowed reduction in ammonia injection rate at
the optimized unit operating conditions as well. Therefore, fewer experimental runs were
required to obtain the same information.
When working on a project in industry, difficulties can arise from prioritization
and scheduling. As stated before, there can be an overwhelming number of moving parts
in any given industrial environment, especially at a refinery. For this particular project,
priority was quite low, all things considered. This project did not involve a safety critical
unit change, and it was not one of the most pressing issues on the unit as far as economics
were concerned. With that being said, scheduling did cause concern at times. With an
upcoming multi-hundred million dollar turnaround for one of the FCC units, the
operations personnel required for conducting these unit tests were usually quite busy!
Once the experimental phase of this project was completed, it was important to move
quickly in order to translate the data into actionable results.
Another crucially important consideration for this project, and for engineering
projects in the general sense, is that of clear and concise communication. For any given
project, there will be numerous stakeholders to consider. It is crucially important to
effectively communicate the objective of the project as effectively as possible to
everyone involved so that all are on the same page. More specifically, in regards to a
written plan or procedure, communication must not only be detailed and accurate, but
concise and easy to understand. If communication is inadequate from any individual, the

23
whole team can be affected. The result of inadequate communication can have not only
significant safety ramifications, but can often result in an economic loss or waste of
available resources.
When it comes to leading an engineering project in an industrial manufacturing
setting, and specifically attempting a controlled experiment on a process unit, there are
many considerations that must be taken into account. In the unique case discussed here,
while several challenges were presented, all were addressed and mitigated so that the
project could be completed successfully. This methodology enabled the successful
undertaking of unit tests and implementation of unit control changes, with a projected
economic return of $250,000 per year for the foreseeable future.

24
Conclusion
My project work with the FCC Thermal DeNOx systems at the ExxonMobil Baton
Rouge Refinery involved overcoming many of the challenges that can be associated with
process engineering. This specific project required effectively designing a series of
controlled experiments and conducting them successfully on the unit. After gathering
data from these experimental runs, it was possible to draw conclusions on the effects on
various process variables on the FCC Thermal DeNOx system and adjust unit controls
accordingly, resulting in a projected economic return of $250,000 per year for the
refinery. With the assistance of my colleagues at ExxonMobil, I was able to overcome
both the technical challenges of unit testing and the interpersonal challenges associated
with leading an engineering project.

25
Bibliography
[1] Blaszczak, Robert J. Tech. N.p. Nitrogen Oxides (NOx): Why and How They Are
Controlled. U.S. Environmental Protection Agency, Nov. 1999. Web. Dec. 2016.
[2] Leffler, William L. Petroleum Refining in Nontechnical Language. Third ed. Tulsa,
OK: PenWell Corporation, 2000. Print.
[3] Lyon, Richard K. The Chemistry of the Thermal DeNOx Process: A Review of the
Technology’s Possible Application to Control of NOx from Diesel Engines. Tech.
N.p. OSTI, US Dept. of Energy Office of Scientific and Technical Information. 05
Aug. 2001. Web. Dec. 2016.
[4] Sadeghbeigi, Reza. Fluid Catalytic Cracking Handbook: An Expert Guide to the
Practical Operation, Design, and Optimization of FCC Units. 3rd ed. Amsterdam:
Elsevier, 2012. Print.
[5] Tenner, Arthur R., and David W. Turner. Method for Reducing NOx Emission to the
Atmosphere. Exxon Research and Engineering Company, assignee. Patent US
4115515 A. 2 June 1977. Print.
[6] Venuto, Paul B., and E. Thomas Habib. Fluid Catalytic Cracking with Zeolite
Catalysts. New York: M. Dekker, 1979. Print.


