The usefulness of accounting fundamentals and other
prospectus information in the valuation of IPO firms†
Asher Curtis
School of Accounting
University of New South Wales
Sydney, NSW, Australia 2052
Email: [email protected]
Andrew Lynch
Horwath Melbourne
Level 13, 600 St Kilda Road
Melbourne, Victoria 3004
Email: [email protected]
Julian Yeo ††
Columbia Business School
3022 Broadway, Uris 607
New York, NY 10027
Email: [email protected]
† We acknowledge the useful comments from Nerissa Brown, Woo-Jin Chan, Jeff Coulton, Neil Fargher, Sarah McVay, Gil Sadka, Andreas Simon and participants at the AFAANZ Annual Conference in 2005. This work was started by Andrew Lynch as part of his honour’s thesis at the University of Melbourne, and completed while Asher Curtis and Julian Yeo were PhD students at the University of New South Wales and the University of Melbourne respectively. All remaining errors are our own. †† Corresponding author
1
The usefulness of accounting fundamentals and other
prospectus information in the valuation of IPO firms
We empirically examine the usefulness of (i) forward-looking accounting
fundamentals, and (ii) ‘other prospectus information’ variables that prior literature
suggests are value drivers, in the valuation of Australian Initial Public Offer (IPO)
firms. We begin by examining the extent to which IPO offer price and first-day
closing price is captured by accounting fundamentals. We find that on average,
accounting fundamentals explain 57% of the prospectus offer price and 50% of the
closing price on the initial day of trading. The strong association between IPO prices
and accounting fundamentals is robust to controlling for scale effects and also the
inclusion of variables that correlate with continuing values and potential measurement
errors. In addition, we also show that some of these other information variables
provide incremental explanatory power in the valuation of IPOs. We find strong
support for growth proxies, but only weak support for measures of information
asymmetry and signals of quality through affiliations (i.e., choice of auditors and
underwriters). JEL classification: G12. Keywords: Initial public offerings, valuation, accounting fundamentals
2
1. Introduction
In this study, we empirically examine the association between accounting
fundamentals provided in prospectuses and the valuations of Initial Public Offers
(IPO). We further seek to identify factors that have incremental explanatory power
over forward-looking accounting fundamentals in explaining Initial Public Offer
(IPO) prices. We examine value drivers suggested by prior literature such as retained
ownership, signals of quality through affiliations, growth proxies, firm size, and age
(hereafter, other information). We use a sample of fixed-price offerings where
management forecasts of earnings, other prospectus information, and the fixed offer
price are all made available together within the prospectus. This allows us to gain
further insight into whether accounting fundamentals and other information are priced
differently by the issuers and the initial-day investors.
The use of firm-specific accounting information fundamentals in estimating the
‘intrinsic value’ of an IPO firm is a relatively unexplored issue. One method
commonly used to link fundamental accounting information to IPO value is to use the
comparable firms’ price-multiples approach (Kim and Ritter, 1999; How, Lam and
Yeo, 2006). Users of the comparable firm approach, however, are often left to
wonder how different price estimates based on different price-multiples can be
reconciled. More importantly, IPO valuation should take into account the uniqueness
of each IPO firm. Unlike prior studies that examine the association between IPO
prices and comparable firms’ price multiples, we have chosen to examine the
valuation of firm-specific accounting and other information instead of comparable
firm or industry information in our research design.
We use the residual income valuation model to derive our measure of accounting
fundamentals. When additional funds raised in the IPO are used to grow the business,
3
historical earnings may not capture the expected growth from investing these funds in
positive net present value projects. As share prices are based primarily on future
expectations of the firm’s performance, management’s assessment of the firm’s future
prospects in the form of management earnings forecasts are valued by investors. The
combination of trailing information (book-values) and forward information using the
residual income model allows us to take into consideration both the financial position
at the time of IPO (i.e., the pro-forma book value of equity including issue proceeds)
and expected payoffs (i.e., forecast of earnings) at the time of IPO. In the same
manner that returns need to be interpreted with reference to the amount of investment
in place, forecasts of earnings subsequent to the IPO need to be interpreted with
reference to book value of equities at the time of the IPO.
For firms with limited forward-looking accounting information, a continuing
value will become an important part of estimating value (Penman, 1998). With a
shorter horizon of forward-looking information, the importance of a continuing value
is more prominent for IPO firms than established firms. Understanding the factors
that are associated with the portion of IPO prices not captured by forward-looking
financial information is crucial in understanding the valuation of IPO firms. We
therefore seek to identify factors that have incremental explanatory power over
accounting fundamentals in explaining IPO prices. These factors, in turn, provide
insights into what issuers/investors consider to be signals of long-term growth for IPO
firms.
Our sample consists of Australian firms that went public between 1993 and
2000. We have chosen the Australian capital market for the following reasons. First,
the Australian setting provides an advantage in investigating the valuation
implications of voluntary earnings forecasts. In a more litigious environment such as
4
the United States, firms are less likely to issue voluntary earnings forecasts (Baginski,
Hassel, and Kimbrough, 2002). In Australia, How and Yeo (2001) report that almost
80% of IPO firms report forecast earnings and pro-forma book values in their
prospectus.
Second, whilst earnings forecasts are commonly provided in the prospectus, they
tend to be short-term in nature (Brown, Clarke, How and Lim, 2000). The relatively
short-term nature of forward information provided in the prospectus allows us to
question the importance of accounting fundamentals contained in prospectuses in the
setting of IPO prices. We are then able to identify factors that are associated with the
portion of IPO prices that are not captured by accounting fundamentals.
Third, IPOs are more often taken to market using fixed-price offerings in
Australia relative to the US. In contrast to the book building process, where the
assessment of demand for the issue and pricing implications are made explicit through
the use of a “road-show”, the offer price is included within the prospectus in a fixed
price offer.1 In contrast to the book building mechanism, where the offer price is
finalized close to the initial day of trading, the offer price is fixed for a significant
period of time (from the release of the prospectus until the listing of the IPO) in
Australia. We have no indication as to whether this pricing mechanism is any more or
less efficient than the book-building mechanism in terms of the pricing of the offer,
but the distinction between the participants in the formation of the offer price versus
the first-day closing price enables us to provide further insights into how IPOs are
priced by the issuers relative to the participants in the market.
1 Prior to the offer, a modified road show is conducted before the prospectus is registered. The modified road show is likely to only price in the demand of major institutional clients of the underwriter. See How and Yeo (2000).
5
Our results show that offer and first-day closing prices are strongly associated
with accounting fundamentals. This association is robust to controlling for variables
correlated with continuing values and potential measurement errors (such as the
forecast horizon and forecast errors). Since forward-looking accounting information
provided in prospectuses is relatively short-term in nature, we predict that signals of
long-term growth should also be priced. Confirming this prediction, we find some
evidence of an incremental role for other information contained in the prospectus,
relative to forward-looking accounting fundamentals in explaining IPO prices.
Specifically, we find strong support for growth proxies, but only weak support for
measures of information asymmetry and signals of quality through affiliations (i.e.,
choice of auditors and underwriters).
The remainder of the study is organized as follows. In section 2, we relate
accounting fundamentals and other prospectus information to the offer and first-day
closing IPO prices. Section 3 outlines our sample and descriptive statistics. Results
are presented in Section 4 with conclusions provided in Section 5.
2. Relating accounting fundamentals and other prospectus information to IPO
offer and first-day closing prices
In this section, we model the relation between accounting fundamentals, other
information, and the offer price or the first-day closing price. Using the residual
income valuation model, our research question considers the value relevance of
forward-looking accounting information disclosed (i.e., management earnings
forecasts), trailing accounting information (i.e., pro-forma book value), and other
prospectus information at IPO.
6
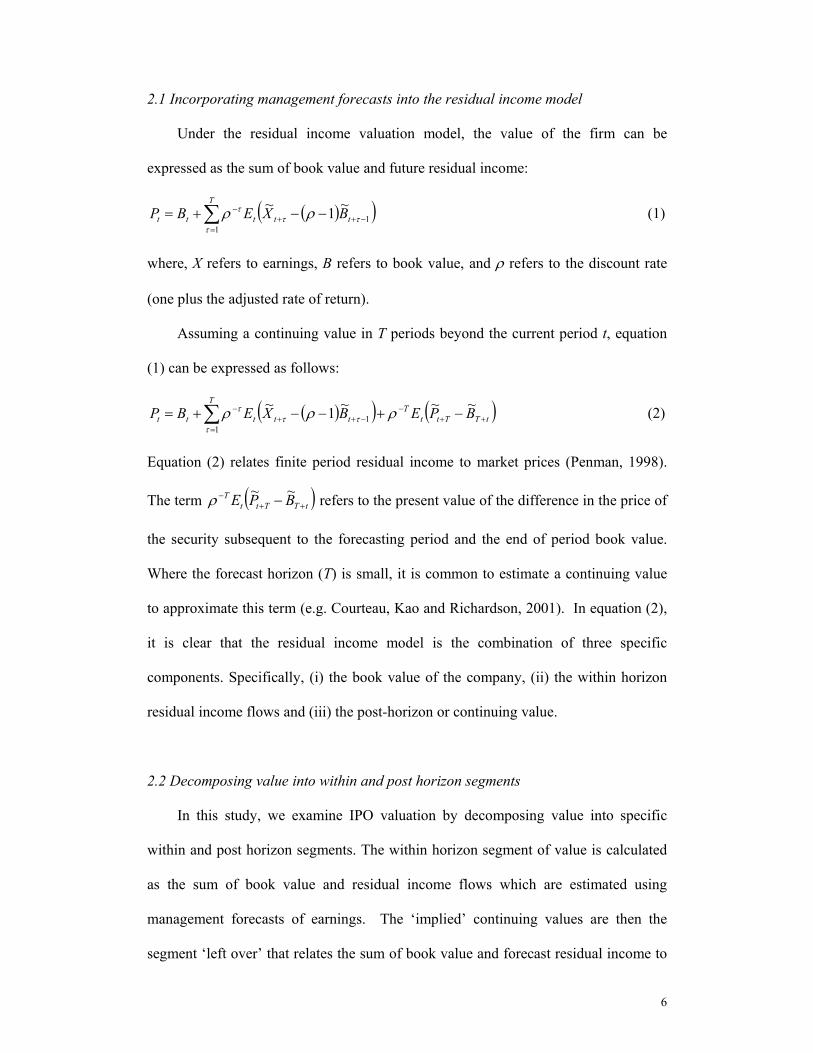
2.1 Incorporating management forecasts into the residual income model
Under the residual income valuation model, the value of the firm can be
expressed as the sum of book value and future residual income:
( )( )∑=
−++− −−+=
T
ttttt BXEBP1
1~1~
τττ
τ ρρ (1)
where, X refers to earnings, B refers to book value, and ρ refers to the discount rate
(one plus the adjusted rate of return).
Assuming a continuing value in T periods beyond the current period t, equation
(1) can be expressed as follows:
( )( ) ( )tTTttT
T
ttttt BPEBXEBP ++−
=−++
− −+−−+= ∑ ~~~1~1
1 ρρρτ
τττ (2)
Equation (2) relates finite period residual income to market prices (Penman, 1998).
The term ( )tTTttT BPE ++
− −~~ρ refers to the present value of the difference in the price of
the security subsequent to the forecasting period and the end of period book value.
Where the forecast horizon (T) is small, it is common to estimate a continuing value
to approximate this term (e.g. Courteau, Kao and Richardson, 2001). In equation (2),
it is clear that the residual income model is the combination of three specific
components. Specifically, (i) the book value of the company, (ii) the within horizon
residual income flows and (iii) the post-horizon or continuing value.
2.2 Decomposing value into within and post horizon segments
In this study, we examine IPO valuation by decomposing value into specific
within and post horizon segments. The within horizon segment of value is calculated
as the sum of book value and residual income flows which are estimated using
management forecasts of earnings. The ‘implied’ continuing values are then the
segment ‘left over’ that relates the sum of book value and forecast residual income to
7
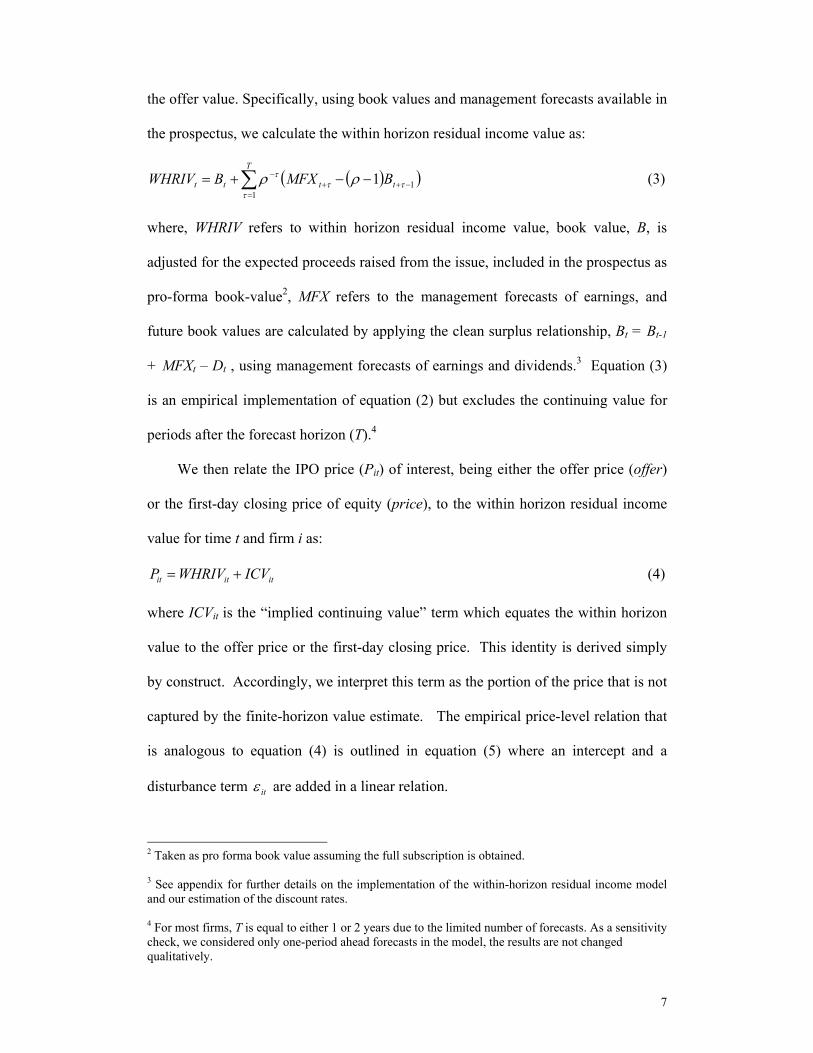
the offer value. Specifically, using book values and management forecasts available in
the prospectus, we calculate the within horizon residual income value as:
( )( )∑=
−++− −−+=
T
tttt BMFXBWHRIV1
11τ
τττ ρρ (3)
where, WHRIV refers to within horizon residual income value, book value, B, is
adjusted for the expected proceeds raised from the issue, included in the prospectus as
pro-forma book-value2, MFX refers to the management forecasts of earnings, and
future book values are calculated by applying the clean surplus relationship, Bt = Bt-1
+ MFXt – Dt , using management forecasts of earnings and dividends.3 Equation (3)
is an empirical implementation of equation (2) but excludes the continuing value for
periods after the forecast horizon (T).4
We then relate the IPO price (Pit) of interest, being either the offer price (offer)
or the first-day closing price of equity (price), to the within horizon residual income
value for time t and firm i as:
ititit ICVWHRIVP += (4)
where ICVit is the “implied continuing value” term which equates the within horizon
value to the offer price or the first-day closing price. This identity is derived simply
by construct. Accordingly, we interpret this term as the portion of the price that is not
captured by the finite-horizon value estimate. The empirical price-level relation that
is analogous to equation (4) is outlined in equation (5) where an intercept and a
disturbance term itε are added in a linear relation.
2 Taken as pro forma book value assuming the full subscription is obtained. 3 See appendix for further details on the implementation of the within-horizon residual income model and our estimation of the discount rates. 4 For most firms, T is equal to either 1 or 2 years due to the limited number of forecasts. As a sensitivity check, we considered only one-period ahead forecasts in the model, the results are not changed qualitatively.
8
ititit WHRIVP εαα ++= 10 (5)
In the equation 5 (the price-level regression specification), α0 represents the sample
mean of the ‘implied continuing value’ and the error term εit represents the firm
specific deviation of the firms’ implied continuing value from the mean. The
association between price and the fundamentals available in the IPO prospectus is
contained in α1. The expected value of the coefficient α1 is unity assuming that the
within horizon residual income value inputs are fully utilized in the price-setting
process. However, if the information in WHRIV is positively correlated with the
implied continuing values, the coefficient on WHRIV will be upwardly biased above
unity. That is, investors use finite horizon forecast information to infer the implied
continuing values or long-term growth. Alternatively, the coefficient could be less
than unity if the market does not fully incorporate all of the information in accounting
fundamentals, discounts the forecast information disclosed in the prospectus, or if
there is measurement error in WHRIV (i.e., estimation of the discount rate,
annualizing earnings forecasts).
The empirical implementation of the price-level relation outlined in equation (5)
potentially suffers from cross-sectional differences in scale leading to incorrect
inference. Scale problems likely result in the residual being heteroscedastic. In our
case, we are examining variation in the price per share of the firm, for which prior
research has highlighted the issue of scale effect (Akbar and Stark, 2003; Easton and
Sommers, 2003). In addition to our price-level analysis, we also follow Easton and
Sommers (2003) by employing price as a deflator. Even though our equations may
look odd at first; essentially, the deflator transforms our empirical specification into
weighted least squares where the weight is chosen to allow for deflation by price. The
estimates of the coefficients and the t-statistics are still interpreted in the usual fashion
9
for weighted least squares regressions. Deflating all of the variables in equation (4)
by Pit yields:
it
it
it
it
it
it
PICV
PWHRIV
PP
+= (6)
As ICVit is expected to be positive, and is expected to vary in cross-sectional samples
around a non-zero mean, similar to equation (5), we include an intercept in the
empirical model of equation (6) in equation (7). Specifically, including an intercept
deflated by Pi,t and a disturbance term itε yields the following linear relation:
itit
it
itit
it
PWHRIV
PPP εαα ++= 10
1 (7)
2.3 Incorporating other information into the IPO value framework
To ensure that our interpretations of the association between accounting
fundamentals and IPO prices are not subject to problems with omitted variables and
measurement errors, we further develop our price-level model and weighted least
squares model in equations (8) and (9).
itjititititit uOINFHORZFCERRWHRIVP +′++++= β3210 ββββ (8)
itit
jit
it
it
it
it
it
it
itit
it uP
OINFP
HORZP
FCERRP
WHRIVPP
P+
′
⎟⎟⎠
⎞⎜⎜⎝
⎛++++= β3210
1 ββββ (9)
Where, FCERR refers to the management earnings forecast error (relative to future
realized earnings), HORZ is the number of calendar days from the date of prospectus
registration to the date of the forecasted financial statements, OINF refers to other
prospectus information variables (such as growth proxies, affiliations and information
asymmetry variables which we discuss in detail below) and β refers to a vector of
slope coefficients, relating the other information variables to IPO prices.
10
One potential measurement error is the forecast bias inherent in management
earnings forecasts. The large forecast error documented in the literature questions the
relevance of forecast information in the valuation process adopted by potential
investors. Nevertheless, investors may still perceive earnings forecasts as highly
relevant information. Therefore, we include management forecast error, FCERR, as a
control for measurement error in WHRIV (as management forecasts are used in our
intrinsic value calculation) in equations (8) and (9). The empirical implementation of
the use of one-year ahead earnings forecasts require annualizing forecasts that span
part of the year and/or forecasts over two or more years. As forecasts are harder to
make accurately over a longer period of time, we include the number of calendar days
from the date of prospectus registration to the date of the forecasted financial
statements (HORZ) as a further potential control for measurement error in the forecast
component in WHRIV.
We employ only short-term earnings forecasts in the value model above. Given
the relatively short-term nature of these forecasts, the growth prospects of the IPO
firms are not expected to be completely captured in the short-term forecasts of
earnings. We therefore seek to identify what signals of growth are associated with the
component of price that is not captured by the short-term value measure. As we are
interested in the cross-sectional variation in the pricing of accounting fundamentals
and other information, we are interested in variables that have incremental
explanatory power over accounting fundamentals in explaining IPO prices.
For our other information variables (OINF), we use a selection of variables that
are commonly associated with underpricing in the literature (see for example, Lee,
Taylor and Walter, 1996). We focus on variables that are publicly available in the
prospectus. These variables include growth proxies, information asymmetry
11
measures, and signals of quality through affiliations. For our growth measure,
GROW, we use one minus net tangible assets backing per share divided by the offer
price. For information asymmetry, we examine the size of the firm (TA), the age of
the firm (AGE) and the amount of retained ownership held by insiders (OWN). We
measure the size of the firm using the total assets in place at the time of IPO. We
calculate the age of the firm using the number of calendar days from incorporation to
the date of prospectus and retained ownership as one minus the proportion of shares
offered to the public to the total shares outstanding. For signals of quality through
affiliation, we consider the affiliation of the IPO firm with prestigious auditor
(AUDIT) and underwriting firms (UW). We consider prestigious auditors to be the
Big 5 (Big 6) audit firms, and underwriter reputation we calculate in-sample as the
weighted issue proceeds underwritten by the IPO underwriter divided by the total
issue proceeds over the sample period.
In equations (8) and (9), the intercept term, β0, is no longer the sample mean of
the continuing value, as it is now conditioned on ‘other prospectus information’
variables. The inclusion of new variables (measurement errors and correlated
variables) will change the coefficient of our estimates of the association of IPO prices
with our measure of accounting fundamentals (WHRIV). This method helps to ensure
that our results (i.e., the slope coefficients on WHRIV and WHRIV/P) in equations 5
and 7 are not simply due to the omission of variables associated with continuing
values or measurement errors.
3. Sample and descriptive statistics
Our sample comprises Australian IPO firms that went public between 1993 and
2000. We exclude firms that are foreign-owned or affiliated companies and
12
companies that have either been previously listed or registered on a foreign stock
exchange before becoming listed on the Australian Stock Exchange (ASX). In
addition, we exclude companies formed through a scheme of arrangement, trust
companies, privatizations and demutualizations. We gathered firm-specific data
directly from the prospectus using the Connect4 database, and share prices and return
information from the AGSM-CRIF database.
The final sample includes 219 IPO firms that provided forecasts of earnings. Of
these firms 131 provide forecasts for at least one full year. The remaining firms
provide forecasts that span part of the year rather than a full year. Some of the firms
in our sample provide forecasts over two or more years, while some only provide
forecasts for a period of less than one year, we annualize partial year forecasts. Our
results however, are similar if we restrict our sample to only firms with at least one
full year of forecast information.
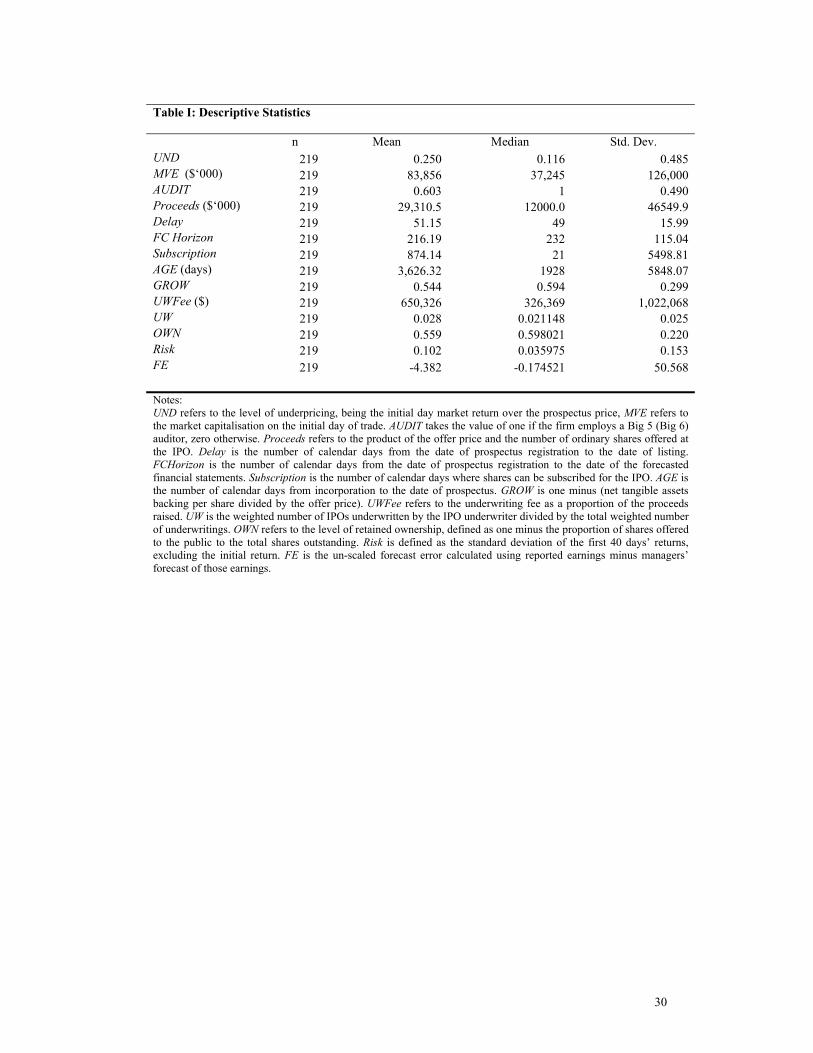
See TABLE I
We present descriptive statistics for the sample of 219 firms in Table I. On
average, first-day underpricing is 25% (median of 11.6%), which is consistent with
recent Australian studies (e.g. Chan and Curtis, 2006). The average first-day market
capitalization is $83.86 million (median of $37.25 million). The average (median)
IPO raises proceeds of $29.31 million ($12.00 million) and retains ownership over
55.9% (59.4%) of voting shares post IPO.
In fixed price offerings, the delay between the registration of the prospectus and
the listing date represents a period of time where significant new information can
reach the market. In our sample, the median delay period is 49 days. The median
13
expected subscription period set by the issuer, the number of calendar days were
shares can be subscribed as printed in the IPO prospectus, is 21 days. Forecasts are
voluntarily disclosed in the prospectus, on average the number of days between
prospectus registration and the end of the first forecast financial year end is 216 days.
The median firm was incorporated roughly 5.3 years (1,928 days) before registering
its prospectus.
We measure growth potential by taking unity less the ratio of net tangible assets
per share to offer price. Using this measure, the average firm’s growth potential is
54%. The 40-day post listing return volatility has a mean (median) of 10 percent (4
percent). The reputations of the auditor and the underwriter may impact the accuracy
of voluntary disclosed forecast earnings. The majority of IPOs (60.3%) use premium
audit companies (Big 6 prior to the PriceWaterhouseCoopers merger, and Big 5
thereafter). We consider the reputation of the underwriter to be reflected in their
proportional market share. The average IPO underwriter underwrites 2.8% of the
total issue proceeds in our sample.
4. Results
4.1 Descriptive analysis of value to price ratios
We begin by examining the proportion of the offer price that can be explained by
the trailing and forward financial information contained in the prospectus. It is
important to note that our within-horizon residual income model differs from prior
research that includes an explicit estimate of the continuing value. Accordingly, we
do not consider the ratio as able to identify any mispricing of accounting information
on fundamental value (e.g., Chan and Curtis, 2006). Instead, we consider the
interpretation of the ratio as the proportion of IPO prices that are captured by
14
accounting fundamentals in the prospectus and IPO prices that are not captured by the
accounting fundamentals (i.e., 1 – WHRIV/P).5
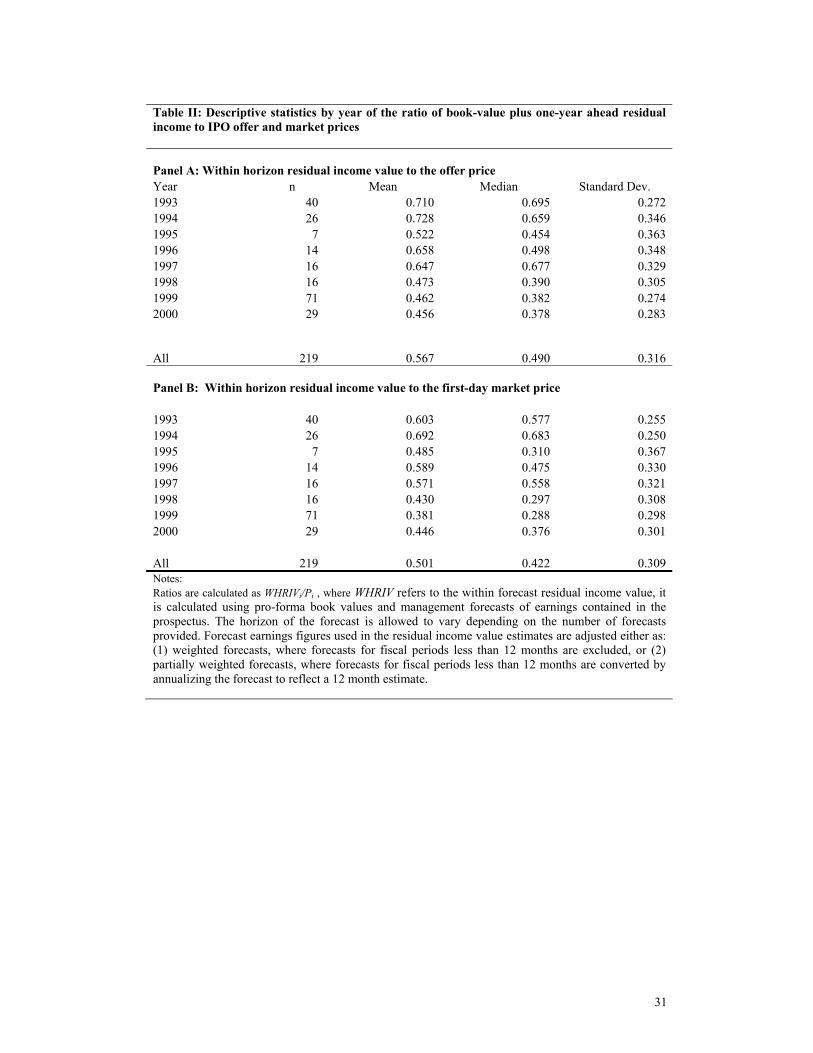
See TABLE II
In Panel A of Table II, we report the ratio of the within-horizon residual income
model to the offer price. The average ratio is 0.567, suggesting that the financial
information in book-value plus one period ahead residual earnings captures 56.7% of
the offer price on average. The median is slightly lower at 0.490. Overall, we
observe the average and the median ratios decline over the sample period. The
decline in ratios suggests that IPO prices incorporated a larger component of
continuing value (and a smaller component of accounting fundamentals) over the
sample period. This decline is also consistent with late 1990’s prices being more
divergent from fundamentals – a phenomenon that is well documented for listed firms
(Penman, 2003; Curtis, 2006).
In Panel B we report the ratio of the within-horizon residual income model to the
market price at the close of the initial-day of trading. Since underpricing is, on
average, positive, we expect that the ratio will be lower than the WHRIV-to-Offer.
This is true of all years in the sample. Overall, the average within horizon residual
income value to first-day trading price ratio is 0.501 and the median ratio is 0.422.
These descriptive results highlight that the continuing value is substantial within the
IPO context, which is important for our study as we wish to investigate what other
5 We leave the possible case where the forecast information can be priced in a biased manner for future research. For robustness, we control for forecast bias in our examination of the association between IPO prices and the within-horizon residual income value.
15
information commonly provided in the prospectus is associated with the portion of
IPO pricing that is not explained by financial information.
4.1 Regression analysis
The above descriptive analysis of WHRIV-to-price ratios does not control for
systematic biases that can be captured using the intercept and the slope coefficient in
regression analysis. Accordingly, we perform regression analysis with our residual
income value estimate as the independent variable and the offer price multiplied by
the number of (post IPO) shares issued as the dependent variable. As outlined above,
we conduct our regression analysis using two complementary methods. First, we
consider an undeflated price-level analysis. Second, we also report weighted least
squares using price as a deflator (i.e., a method similar to that of Easton and Sommers
(2003)) to assess the sensitivity of our results to scale effects.
A large literature documents a significant underpricing bias at the IPO (see for
example the review provided by Ritter and Welch, 2003). The documentation of
underpricing suggests that either managers allow for a discount to ‘fair value’ at the
offer, or that the market pays a premium over ‘fair value’ for IPO firms when they
first list on the market. Until recently, the majority of the literature has attributed this
bias to the building in of a discount in the offer price. Recent literature however, has
considered the case where the market price can stray from ‘fair value’ in the short-run
and revert towards ‘fair value’ in the long-run (e.g., Purnanandam and Swaminathan,
2004; How, Lam and Yeo, 2006). The comparison between the association of
accounting fundamentals with offer price and listing price therefore provides further
insights into how accounting fundamentals are priced differently by the issuers versus
initial-day investors.
16
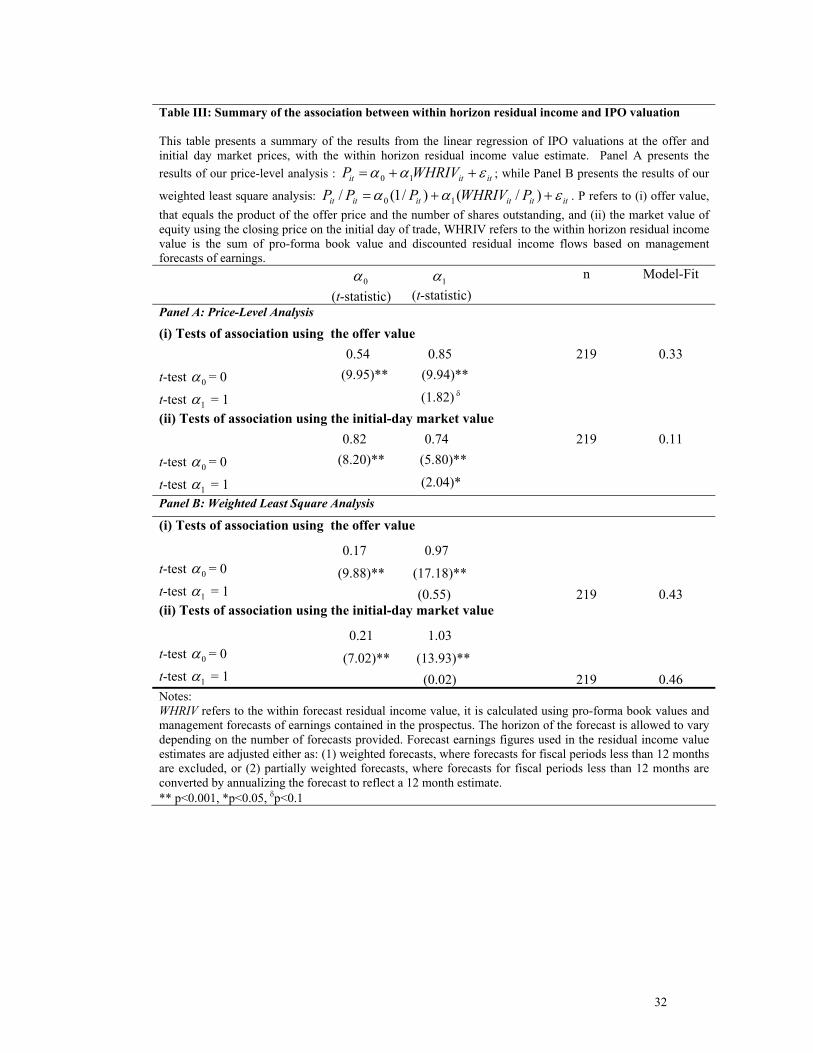
See TABLE III
In Panel A of Table III, we report the coefficient estimates of our price-level
analysis. Our focus in this section is only on the association of IPO prices with the
accounting fundamentals with the analysis of the other information signals to be
considered in the following section. As expected, given the relative short-term nature
of WHRIV, the intercept is statistically different to zero at a value of 0.54. This
indicates that on average, there is still a significant component of the offer price
which could potentially be explained by factors other than short-term forecasts of
financial information.
The coefficient α1 represents the proportion of the within-horizon residual income
model incorporated into the offer price, controlling for the average continuing value
(captured in α0). If accounting fundamentals are priced without bias, the coefficient
on accounting fundamentals should be unity. For our sample we find that the
coefficient on the within-horizon accounting fundamentals is 0.85. The t-tests
associated with this parameter suggest that accounting fundamentals are significantly
associated with offer price (t-statistic of 9.94 for the test of α1=0) as expected. The
coefficient is significantly below one, however, with a marginally significant t-
statistic of 1.82 (for the test of α1=1). This result supports the contention that the firm
and their affiliates incorporate the short-term financial information in WHRIV into
their offer prices, however, it is possible that measurement error or scale effects cause
the association to lie below unity.
We also present the association between first-day market prices and fundamental
accounting information. The intercept increases to a value of 0.82 and shows an
17
increase in the average continuing value. The increase in the intercept can be partially
explained by the positive underpricing in our sample. The association between the
scaled initial-day market price and the scaled within-horizon residual income value
decreases to 0.74, again the coefficient is statistically different to unity. We examine
two possible econometric explanations for the coefficient being below unity in the
following sections.
4.2 Controlling for scale effects
In Panel B of Table III we present the results of the regression of scaled offer and
first-day closing price with the within-horizon residual income model scaled by offer
and first-day closing price respectively. When we use the weighted least squares
(WLS) models we do not find reliable evidence that the slope coefficient on
WHRIV/P differs from unity. While there is some debate over the appropriateness of
this specification, the intuition behind using the WLS specification is that scale based
heteroscedasticity will cause the coefficient estimates to be inefficient (e.g. Easton
and Sommers, 2003). While we use the White Estimator for our price-level
regressions it is still possible that some form of scale-based heteroscedasticity will
impact our coefficient estimates as our sample size is not large (see Greene, 2003 p
220). We report these results to complement the price-level regressions, noting that
where the square of price is considered an appropriate weight for the residuals of the
model, then the combination of WLS and the White Estimator should lead to a better
model ( see Greene, 2003 pp 225-227).
Taken together the price-level and the weighted results provide support the use of
WHRIV as a measure of fundamental value available at the prospectus. In the
following analyses we control for potential measurement errors by included variables

18
that are potentially correlated with the measurement error in our within-horizon
residual income value.
4.3 Value-relevance of other prospectus information
Our analysis above suggests that while the accounting fundamentals presented in
the prospectus partially explains the variation in IPO prices, there is still, however, a
significant proportion that remains unexplained (both the systematic and unsystematic
proportions of the implied continuing value). In this section, we attempt to identify
factors that have explanatory power in explaining IPO prices over accounting
fundamentals.
The variables that we consider in this section are taken from the IPO prospectus.
We consider the following multivariate regression model which includes a selection
of other information variables considered in prior literature as signals of growth,
measures of information asymmetry and signals of quality. Again, we present in Panel
A and Panel B both the price-level and the weighted least squares analysis,
respectively. The definitions of the variables can be found in the previous section and
in the notes to Table IV. We delete variables that have one or more missing variables
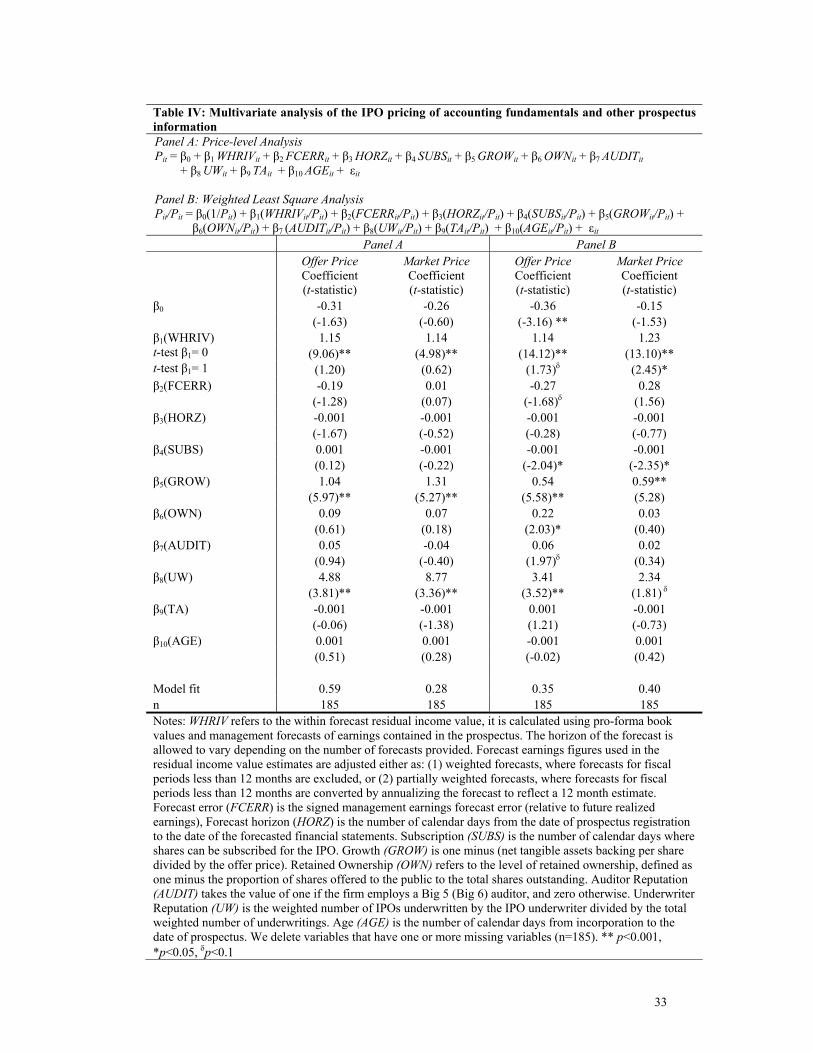
reducing our sample to 185.
See TABLE IV
In the first two columns of Panel A, we present results using the price-level
specification for both the offer price and the initial-day closing market price. In both
columns, the accounting fundamentals in WHRIV are consistently priced, with similar
coefficients at 1.15 and 1.14, for the offer and market prices respectively. In both

19
cases the slope coefficient on WHRIV is not found to be reliably different to unity,
which contrasts the opposite results presented in Table III. The significant
associations documented between accounting fundamentals and IPO prices show that
accounting fundamentals provided in the prospectus are priced by both the issuer and
the market, and the association is robust to controlling for potential correlated
variables.
In Panel B, however, we find a slightly different result when we specifiy the
model using the WLS specification, here the accounting fundamentals in WHRIV/P
are associated with the offer and market prices with coefficients at 1.14 and 1.23
respectively. Both coefficients are significantly different from unity in this
specification, and in a similar direction as in Table III (with the estimated association
on the fundamentals being larger for the market price than the offer price). Our
finding that these coefficients are significantly higher than unity is consistent with
WHRIV containing information that investors perceive as correlated with the long-
term value of the firm, conditional on the other information available at the
prospectus.
In both specifications, we include horizon and forecast errors as controls for the
measurement errors associated with the use of management forecasts in WHRIV. The
variable Horizon controls for the expectation that as the forecast horizon increases the
possible measurement error in the managers’ forecasts of earnings increases. We also
include an ex-post variable to control for the actual measurement error in the
managers’ earnings forecasts. Dropping the forecast error variable does not change
the qualitative conclusions we reach in this paper.
Given the relatively short-term nature of accounting fundamentals contained in the
prospectus, which we use to construct WHRIV, we find, as predicted, a strong positive
20
relationship between IPO prices and our growth measure. In Panel B, we show that
the coefficients are consistent between the offer and the market, with the coefficients
being (0.541, p<0.001) and (0.587, p<0.001) respectively.6 This result is consistent
with IPO prices incorporating expected growth in fundamentals into the continuing
value.
Based on the argument that IPOs suffer from a high amount of information
asymmetry, we employ proxies that measure information asymmetry to capture risk
factors at the time of IPO. We included a proxy for size, measured as the total assets
of a firm, as larger firms are assumed more informationally efficient. We include the
age of the firm as younger firms are assumed to have a higher level of asymmetric
information. Also, we include retained ownership as it is assumed to be a signal used
by insiders to lower information asymmetry. We find mixed results for these proxies
when controlling for accounting fundamentals (WHRIV). First, we do not find
significant associations of the offer or market prices with either the size or age of the
firm. Second, we find that while there is a positive and significant association of the
offer price with the level of retained ownership, this association is lower in magnitude
and not significantly different to zero when using the market price. Second, in the
price-level regression specification, the association between IPO prices and the level
of retained ownership is not significantly different to zero. These results provide some
support (albeit weak) for asymmetric information predictions when controlling for
accounting fundamentals and growth information at the IPO.
Prior literature also suggests that costly signals of quality can be made with
prestigious affiliations, such as with a big audit firm or a more recognized
underwriter. We include indicator variables in the regression to examine whether
6 For the remainder of this section, we focus our discussion of the reported results on the weighted least squares regression model and mention the differences with the price-level specification.
21
these variables are significantly priced as other information. We find that the
underwriter variable is positive and significantly associated with the offer price
(3.416, p<0.001), and the auditor variable is positive but only marginally statistically
associated with offer price (0.059, p<0.1). When we consider the market price both of
the associations deteriorate statistically, with prestigious auditors not being
significantly related to market price and prestigious underwriters only being
marginally significantly related to market price (2.341, p<0.1). These results do not
provide strong support for the use of auditors and underwriters as costly signals, when
controlling for accounting fundamentals and growth information at the IPO.
We also included a measure of the subscription period as a proxy for expected
underpricing. The subscription variable is based on higher demand pushing prices for
the offer upwards. We find evidence consistent with this expected demand being
priced consistently and negatively at both the offer and the market price. The
economic significance of this effect however, is doubtful, as the coefficient is very
small. The association does not hold in the price-level specification, casting further
doubt on whether this factor is priced by IPO investors. 7
In summary, we find a strong association between accounting fundamentals and
IPO prices. The association is robust after controlling for potential omitted variable
and measurement problems. We also find that our growth proxy, measured using net
tangible assets backing, has incremental explanatory power in explaining IPO prices
7 Although not reported, we also try a specification with both market price and offer price as the dependent variable. Specifically, by setting market price as the dependent variable but deflating by offer price yields:
itit
jit
it
it
it
it
itit
it vOffer
OINFOffer
FCERROffer
WHRIVOfferOffer
Market+
′
⎟⎟⎠
⎞⎜⎜⎝
⎛+++= λ210
1 λλλ
where ⎟⎟⎠
⎞⎜⎜⎝
⎛−1
it
it
OfferMarket
provides a measure of underpricing.
We find a significant association between accounting fundamentals and IPO prices. Results are quantitatively similar to those reported in Table 4.
22
over accounting fundamentals. Conditional on accounting fundamentals, we find
mixed support for measures of information asymmetry and signals via affiliation as
‘other prospectus information’ factors that are expected to help explain IPO prices.
5. Conclusion
Our study addresses several issues that are of potential interest to both academics
and practitioners. We provide evidence of the usefulness of firm-specific trailing and
forward accounting information in valuing IPOs. The use of offer and the initial-day
market price in our analysis provides further insight into how IPOs are priced by the
issuers and the market. In addition, we identify measures of ‘other prospectus
information’ that explain IPO prices in addition to accounting fundamentals. These
variables provide further insights into what issuers/investors consider as factors that
capture growth prospects of IPO firms (in addition to those contained in accounting
fundamentals provided in trailing and forward financial statements in prospectuses).
We address our research question by first examining the association between
accounting fundamentals and IPO offer/first-day market prices. Second, we
investigate the association of ‘other prospectus information’ variables with the portion
of IPO offer price and first-day closing price that are not captured by financial
information (termed as ‘implied continuing values’). We focus on the role of
information that is publicly available in the prospectus; specifically, growth proxies,
information asymmetry measures, and signals of quality through affiliations.
As we control for the short-term estimate of residual income value, we expect
that signals of long-term growth should also be priced. We find that conditional on
accounting fundamentals, growth proxies (measured using net tangible assets
backing) are the main determinants of value at the IPO. In addition, we find that

23
information asymmetry measures, such as retained ownership, and signals of quality
through affiliations such as auditor and underwriter are not consistently priced in the
market when controlling for fundamentals. In sum, we find strong support for growth
proxies, but only weak support for measures of information asymmetry and signals of
quality through affiliations (i.e., choice of auditors and underwriters).
Our results are subject to some limitations and should be interpreted accordingly.
First, we limit our study to only those firms that provide forecasts in their prospectus.
While the majority of firms issue forecasts, it is possible that our results are biased
towards larger and possibly more successful IPOs. Second, our sample is drawn from
Australian IPOs, where the institutional setting has historically led the majority of
IPOs to be offered using the fixed-price mechanism, whether other prospectus
information is incrementally useful given the differing information environment
created by using the book-building mechanism is beyond the scope of this paper.
24
Appendix
Further details on the implementation of the within-horizon residual income model
We take a practical approach to the construction of the within-horizon residual
income model by including all information that is available to investors in the
prospectus. The results we report in Table III use a mixture of the number of forecasts
used in the construction of the residual income model. In further analysis (not
reported here) we find similar results using (1) only one-year ahead forecasts, (2)
running the analysis separately for firms according to the number of forecasts that
they provide.
Discount rates
In estimating the discount rates, three alternative methods in line with prior
literature are employed (Penman and Sougiannis 1998, Frankel and Lee 1998,
D’Mello and Shroff 2000). The first method is the five-year T-Bill rate in the month
prior to listing plus a premium. The premium we use is a constant 3%8.
A second approach estimates the cost of capital for each firm using the capital
asset pricing model. This model is as follows:
εβ +−+= )( fTmtiftit RRrr (CAPM)
This model estimates a firms return on equity, itr , as a function of the risk-free
rate of return, ftr , plus the individual firms sensitivity, β , to the market risk premium,
fTmt RR − . Once again, the market premium will be a fixed 3%. The risk free rate in
this study is the 5-year T-Bill rate.
8 Premiums of 4%, 5% and 6% are used as sensitivity.
25
To ensure the most accurate betas (β) are calculated, regressions will be run using
50 months of returns data (or what ever data is available). The data used to calculate β
will be ex-post realizations for obvious practical reasons.9
The use of actual realisations in calculating firm-specific betas raises two
problems. The first is that given the time frame and the nature of IPO firms, it is not
possible to ensure that all firms have the full amount of observations. Secondly given
that the focus of this study is on the valuation of IPOs at the time of prospectus, it is
more logical to use an ex ante discount rate. Therefore a third method of calculating
discounts will be used.
Francis, Olsson and Oswald (2000) use an industry specific one-factor model that
can be defined as:
εβ +−+= )( fTmtEftE RRrr (ICAPM)
where Er is the return on the industry. This model employs industry returns based on
24 ASX industry codes for 50 months prior to listing. This overcomes the time frame
problem from the firm-specific CAPM and also provides as ex-ante measure of risk.
Adjustment of Management forecasts
The forecasted earnings figures provided in a prospectus are not for the first full
year. Rather they cover from the time of prospectus to the end of financial year.
However, to operationalise the residual income model, we require a full year’s future
earnings. We adjust the earnings figures in two ways. The first method (which we
label the weighted adjustment), considers only those firms who have enough
information available to construct a full one or two years earnings forecast are
included in the analysis. The earnings number therefore, is made up of partly of the 9 Because the IPO firms have no operating history, we are unable to acquire the inputs required to calculate betas. This we use actual data as a proxy for the relevant operating history.

26
remaining time between prospectus and the fiscal year end and partly of the time after
the fiscal year end up until a full year after prospectus.
In the second adjustment (known as the partially weighted adjustment), the same
process as the first adjustment is conducted but any data for partial years is
annualised. This second method enables us to consider more firms than the first
method. We conduct all analysis using both adjustments, we report the second
method, however, the use of the first does not affect the results qualitatively.
27
References
Akbar, S. and A. W. Stark (2003), ‘Deflators, net shareholder cash flows, dividends,
capital contributions and estimated models of corporate valuation’, Journal of
Business Finance & Accounting, Vol.30, pp.1211-33.
Baginski, S. P., J. M. Hassell, and M. D. Kimbrough (2002), ‘The Effect of Legal
Environment on Voluntary Disclosure: Evidence from Management Forecasts
Issued in U.S. and Canadian Markets’, The Accounting Review, Vol.77, No.1, pp.
25-50.
Brown, P., Clarke, A., How, J.C.Y. and Lim, K (2000), ‘The accuracy of management
dividend forecasts in Australia’, Pacific-Basin Finance Journal, Vol.8, No.3-4,
pp. 309-331.
Courteau, L., J. Kao, and G. Richardson (2001), ‘Equity valuation employing the
ideal versus ad hoc continuing value expressions’, Contemporary Accounting
Research, Vol.18 (Winter), pp. 625-661.
Chan, G. and A. Curtis (2006), ‘Accounting valuation, the market for IPOs and post-
listing returns: Australian Evidence’, Working paper, University of New South
Wales.
Curtis, A. (2006), ‘Can market price diverge from fundamentals for an extended
period? Evidence from the late 1990’s’, Working paper, University of New South
Wales. Available at SSRN: http://ssrn.com/abstract=820824
Curtis, A. and Fargher, N. L. (2003), ‘A Comparison of Residual Income and
Comparable Firm Valuation of Initial Public Offerings’, Working paper,
University of New South Wales Working Paper. Available at SSRN:
http://ssrn.com/abstract=408320
28
D’Mello, R., and P. Shroff (2000), ‘Equity undervaluation and decisions related to
repurchase tender offers: An empirical investigation’, Journal of Finance, Vol.55
(October), pp. 2399-2424.
Easton, P., G. Sommers (2003), ‘Scale and the scale effect in market-based
accounting research’, Journal of Business Finance & Accounting , Vol.30, No.1—
2 (January/March), pp. 25-55.
Francis, J., P. Olsson, and D. Oswald (2000), ‘Comparing the accuracy and
explainability of dividend, free cash flow, and abnormal earnings equity value
estimates’, Journal of Accounting Research, Vol.38 (Spring), pp. 45-70.
Greene, W. H. (2003), Econometric Analysis, 5th Ed. Prentice Hall, NJ.
How, J. and J. Yeo, (2000), ‘The pricing of underwriting services in the Australian capital
market’, Pacific-Basin Finance Journal, Vol.8, pp.347-373.
How, J., and J. Yeo (2001), ‘The impact of forecast disclosure and its accuracy on
equity pricing: An IPO perspective.’, Journal of Accounting, Auditing and
Finance, Vol.16, No.4 (Fall), pp.401-425.
How, J., J. Lam, and J. Yeo (2006), ‘Valuing IPOs in the Australian capital market’,
International Review of Financial Analysis, forthcoming.
Kim, M., and J. R. Ritter (1999), ‘Valuing IPOs’, Journal of Financial Economics,
Vol. 53 (September), pp. 409-437.
Lee, P. J., S. L. Taylor and T. S. Walter (1996), ‘Australian IPO pricing in the short
and long run’, Journal of Banking & Finance, Vol.20, No.7, pp. 1189-1210.

29
Penman, S. (1998), ‘A synthesis of equity valuation techniques and the continuing
value calculation for the dividend discount model’, Review of Accounting Studies,
Vol. 2, pp. 303-323.
Penman, S. (2003), ‘The quality of financial statements: Perspectives from the recent
stock market bubble’, Accounting Horizons, Vol.17, pp.77-96.
Penman, S., and T. Sougiannis (1998), ‘A comparison of dividend, cash flow and
earnings approaches to equity valuation’, Contemporary Accounting Research,
Vol.15 (Fall), pp. 343-383.
Purnanandam, A., and B. Swaminathan (2004), ‘Are IPOs underpriced?’, Review of
Financial Studies, Vol.17, pp.811-848.
30
Table I: Descriptive Statistics
n Mean Median Std. Dev. UND 219 0.250 0.116 0.485 MVE ($‘000) 219 83,856 37,245 126,000 AUDIT 219 0.603 1 0.490 Proceeds ($‘000) 219 29,310.5 12000.0 46549.9 Delay 219 51.15 49 15.99 FC Horizon 219 216.19 232 115.04 Subscription 219 874.14 21 5498.81 AGE (days) 219 3,626.32 1928 5848.07 GROW 219 0.544 0.594 0.299 UWFee ($) 219 650,326 326,369 1,022,068 UW 219 0.028 0.021148 0.025 OWN 219 0.559 0.598021 0.220 Risk 219 0.102 0.035975 0.153 FE 219 -4.382 -0.174521 50.568 Notes: UND refers to the level of underpricing, being the initial day market return over the prospectus price, MVE refers to the market capitalisation on the initial day of trade. AUDIT takes the value of one if the firm employs a Big 5 (Big 6) auditor, zero otherwise. Proceeds refers to the product of the offer price and the number of ordinary shares offered at the IPO. Delay is the number of calendar days from the date of prospectus registration to the date of listing. FCHorizon is the number of calendar days from the date of prospectus registration to the date of the forecasted financial statements. Subscription is the number of calendar days where shares can be subscribed for the IPO. AGE is the number of calendar days from incorporation to the date of prospectus. GROW is one minus (net tangible assets backing per share divided by the offer price). UWFee refers to the underwriting fee as a proportion of the proceeds raised. UW is the weighted number of IPOs underwritten by the IPO underwriter divided by the total weighted number of underwritings. OWN refers to the level of retained ownership, defined as one minus the proportion of shares offered to the public to the total shares outstanding. Risk is defined as the standard deviation of the first 40 days’ returns, excluding the initial return. FE is the un-scaled forecast error calculated using reported earnings minus managers’ forecast of those earnings.
31
Table II: Descriptive statistics by year of the ratio of book-value plus one-year ahead residual income to IPO offer and market prices
Panel A: Within horizon residual income value to the offer price Year n Mean Median Standard Dev. 1993 40 0.710 0.695 0.272 1994 26 0.728 0.659 0.346 1995 7 0.522 0.454 0.363 1996 14 0.658 0.498 0.348 1997 16 0.647 0.677 0.329 1998 16 0.473 0.390 0.305 1999 71 0.462 0.382 0.274 2000 29 0.456 0.378 0.283
All 219 0.567 0.490 0.316 Panel B: Within horizon residual income value to the first-day market price 1993 40 0.603 0.577 0.255 1994 26 0.692 0.683 0.250 1995 7 0.485 0.310 0.367 1996 14 0.589 0.475 0.330 1997 16 0.571 0.558 0.321 1998 16 0.430 0.297 0.308 1999 71 0.381 0.288 0.298 2000 29 0.446 0.376 0.301 All 219 0.501 0.422 0.309 Notes: Ratios are calculated as WHRIVi/Pi , where WHRIV refers to the within forecast residual income value, it is calculated using pro-forma book values and management forecasts of earnings contained in the prospectus. The horizon of the forecast is allowed to vary depending on the number of forecasts provided. Forecast earnings figures used in the residual income value estimates are adjusted either as: (1) weighted forecasts, where forecasts for fiscal periods less than 12 months are excluded, or (2) partially weighted forecasts, where forecasts for fiscal periods less than 12 months are converted by annualizing the forecast to reflect a 12 month estimate.
32
Table III: Summary of the association between within horizon residual income and IPO valuation This table presents a summary of the results from the linear regression of IPO valuations at the offer and initial day market prices, with the within horizon residual income value estimate. Panel A presents the results of our price-level analysis : ititit WHRIVP εαα ++= 10 ; while Panel B presents the results of our
weighted least square analysis: itititititit PWHRIVPPP εαα ++= )/()/1(/ 10 . P refers to (i) offer value, that equals the product of the offer price and the number of shares outstanding, and (ii) the market value of equity using the closing price on the initial day of trade, WHRIV refers to the within horizon residual income value is the sum of pro-forma book value and discounted residual income flows based on management forecasts of earnings.
0α (t-statistic)
1α (t-statistic)
n Model-Fit
Panel A: Price-Level Analysis (i) Tests of association using the offer value 0.54 0.85 219 0.33
t-test 0α = 0 (9.95)** (9.94)**
t-test 1α = 1 (1.82) δ (ii) Tests of association using the initial-day market value 0.82 0.74 219 0.11
t-test 0α = 0 (8.20)** (5.80)**
t-test 1α = 1 (2.04)* Panel B: Weighted Least Square Analysis
(i) Tests of association using the offer value 0.17 0.97 t-test 0α = 0 (9.88)** (17.18)** t-test 1α = 1 (0.55) 219 0.43 (ii) Tests of association using the initial-day market value
0.21 1.03 t-test 0α = 0 (7.02)** (13.93)** t-test 1α = 1 (0.02) 219 0.46 Notes: WHRIV refers to the within forecast residual income value, it is calculated using pro-forma book values and management forecasts of earnings contained in the prospectus. The horizon of the forecast is allowed to vary depending on the number of forecasts provided. Forecast earnings figures used in the residual income value estimates are adjusted either as: (1) weighted forecasts, where forecasts for fiscal periods less than 12 months are excluded, or (2) partially weighted forecasts, where forecasts for fiscal periods less than 12 months are converted by annualizing the forecast to reflect a 12 month estimate. ** p<0.001, *p<0.05, δp<0.1
33
Table IV: Multivariate analysis of the IPO pricing of accounting fundamentals and other prospectus information Panel A: Price-level Analysis Pit = β0 + β1 WHRIVit + β2 FCERRit + β3 HORZit + β4 SUBSit + β5 GROWit + β6 OWNit + β7 AUDITit
+ β8 UWit + β9 TAit + β10 AGEit + εit Panel B: Weighted Least Square Analysis Pit/Pit = β0(1/Pit) + β1(WHRIVit/Pit) + β2(FCERRit/Pit) + β3(HORZit/Pit) + β4(SUBSit/Pit) + β5(GROWit/Pit) +
β6(OWNit/Pit) + β7 (AUDITit/Pit) + β8(UWit/Pit) + β9(TAit/Pit) + β10(AGEit/Pit) + εit Panel A Panel B Offer Price Market Price Offer Price Market Price
Coefficient (t-statistic)
Coefficient (t-statistic)
Coefficient (t-statistic)
Coefficient (t-statistic)
β0 -0.31 -0.26 -0.36 -0.15 (-1.63) (-0.60) (-3.16) ** (-1.53) β1(WHRIV) 1.15 1.14 1.14 1.23 t-test β1= 0 (9.06)** (4.98)** (14.12)** (13.10)** t-test β1= 1 (1.20) (0.62) (1.73)δ (2.45)* β2(FCERR) -0.19 0.01 -0.27 0.28 (-1.28) (0.07) (-1.68)δ (1.56) β3(HORZ) -0.001 -0.001 -0.001 -0.001 (-1.67) (-0.52) (-0.28) (-0.77) β4(SUBS) 0.001 -0.001 -0.001 -0.001 (0.12) (-0.22) (-2.04)* (-2.35)* β5(GROW) 1.04 1.31 0.54 0.59** (5.97)** (5.27)** (5.58)** (5.28) β6(OWN) 0.09 0.07 0.22 0.03 (0.61) (0.18) (2.03)* (0.40) β7(AUDIT) 0.05 -0.04 0.06 0.02 (0.94) (-0.40) (1.97)δ (0.34) β8(UW) 4.88 8.77 3.41 2.34 (3.81)** (3.36)** (3.52)** (1.81) δ β9(TA) -0.001 -0.001 0.001 -0.001 (-0.06) (-1.38) (1.21) (-0.73) β10(AGE) 0.001 0.001 -0.001 0.001 (0.51) (0.28) (-0.02) (0.42) Model fit 0.59 0.28 0.35 0.40 n 185 185 185 185 Notes: WHRIV refers to the within forecast residual income value, it is calculated using pro-forma book values and management forecasts of earnings contained in the prospectus. The horizon of the forecast is allowed to vary depending on the number of forecasts provided. Forecast earnings figures used in the residual income value estimates are adjusted either as: (1) weighted forecasts, where forecasts for fiscal periods less than 12 months are excluded, or (2) partially weighted forecasts, where forecasts for fiscal periods less than 12 months are converted by annualizing the forecast to reflect a 12 month estimate. Forecast error (FCERR) is the signed management earnings forecast error (relative to future realized earnings), Forecast horizon (HORZ) is the number of calendar days from the date of prospectus registration to the date of the forecasted financial statements. Subscription (SUBS) is the number of calendar days where shares can be subscribed for the IPO. Growth (GROW) is one minus (net tangible assets backing per share divided by the offer price). Retained Ownership (OWN) refers to the level of retained ownership, defined as one minus the proportion of shares offered to the public to the total shares outstanding. Auditor Reputation (AUDIT) takes the value of one if the firm employs a Big 5 (Big 6) auditor, and zero otherwise. Underwriter Reputation (UW) is the weighted number of IPOs underwritten by the IPO underwriter divided by the total weighted number of underwritings. Age (AGE) is the number of calendar days from incorporation to the date of prospectus. We delete variables that have one or more missing variables (n=185). ** p<0.001, *p<0.05, δp<0.1

34


