ISSUE
RE
PO
RT
SEP
TE
MB
ER
2014
2014The State of Obesity:Better Policies for a Healthier America

2 TFAH • RWJF • StateofObesity.org
PEER REVIEWERS
TFAH thanks the following individuals and organizations for their time, expertise and insights in reviewing all or portions of the State of Obesity report. The opinions expressed in the report do not necessarily represent the views of these individuals or their organizations.
Niiobli Armah IV, MADirector, Health ProgramsNAACP
Cliff Despres, B.J., Communications Director, Salud America!, Institute for Health Promotion Research, The University of Texas Health Science Center at San Antonio
Kipling J. Gallion, M.A., Deputy Director, Salud America!, Institute for Health Promotion Research, The University of Texas Health Science Center at San Antonio
Daniella GrataleSenior Manager of AdvocacyNemours
Carla I. Plaza, MPHConsultantNational Council of La Raza
Amelie G. Ramirez, Dr.P.H., Director, Salud America!, Institute for Health Promotion Research, The University of Texas Health Science Center at San Antonio
Christopher J. Revere, MPADirector, Office of Child Health Policy & AdvocacyNemours
Jennifer Arice White, MSPHProgram Manager, Health Programs & PartnershipsNAACP
TFAH BOARD OF DIRECTORS
Gail Christopher, DNPresident of the Board, TFAHVice President for Policy and Senior AdvisorWK Kellogg Foundation
Cynthia M. Harris, PhD, DABTVice President of the Board, TFAHDirector and ProfessorInstitute of Public Health, Florida A&M University
Theodore SpencerSecretary of the Board, TFAHSenior Advocate, Climate CenterNatural Resources Defense Council
Robert T. Harris, MDTreasurer of the Board, TFAHMedical DirectorNorth Carolina Medicaid Support ServicesCSC, Inc.
Barbara Ferrer, PhD, MPH, EDHealth CommissionerBoston, Massachusetts
David Fleming, MDDirector of Public HealthSeattle King County, Washington
Arthur Garson, Jr., MD, MPHDirector, Health Policy Institute Texas Medical Center
John Gates, JDFounder, Operator and ManagerNashoba Brook Bakery
Tom MasonPresidentAlliance for a Healthier Minnesota
Eduardo Sanchez, MD, MPHDeputy Chief Medical OfficerAmerican Heart Association
REPORT AUTHORS
Jeffrey Levi, PhD.Executive DirectorTrust for America’s Healthand Professor of Health PolicyMilken Institute School of Public Health at the George Washington University
Laura M. Segal, MADirector of Public AffairsTrust for America’s Health
Rebecca St. LaurentHealth Policy Research ManagerTrust for America’s Health
Jack Rayburn, MPHSenior Government Relations ManagerTrust for America’s Health
CONTRIBUTORS
Susan D. Promislo, MASenior Communications OfficerRobert Wood Johnson Foundation
Kristen M. Gurdin, JDLegal CounselRobert Wood Johnson Foundation
Kimberly Elliott, MA Director of Policy OutreachRobert Wood Johnson Foundation
Burness Communications
AcknowledgementsTrust for America’s Health is a non-profit, non-partisan organization dedicated to saving lives by protecting the health of every
community and working to make disease prevention a national priority.
For more than 40 years the Robert Wood Johnson Foundation has worked to improve the health and health care of all Americans. We are
striving to build a national Culture of Health that will enable all Americans to live longer, healthier lives now and for generations to come. For
more information, visit www.rwjf.org. Follow the Foundation on Twitter at www.rwjf.org/twitter or on Facebook at www.rwjf.org/facebook.
TFAH would like to thank RWJF for their generous support of this report.
Cover photos, clockwise from top left, courtesy of: Shuttersock; © Jordan Gantz,
used with permission from RWJF; © Matt Moyer, used with permission from RWJF
Shutterstock; © Matt Moyer, used with permission from RWJF; Shutterstock

The State of Obesity:
Obesity Policy series
INT
RO
DU
CT
OR
Y LE
TT
ER
SEP
TE
MB
ER
2014
Since then, we’ve learned a lot
about what works to change public
policies, improve school and
community environments and
strengthen industry practices in ways
that support and promote healthy
eating and physical activity. We’ve
seen that when schools, parents,
policymakers, industry leaders and
community champions join forces,
they can create a Culture of Health
that helps to make healthy choices
the easy, affordable and accessible
choices for everyone.
So what is the “state of obesity” in
America today? We are starting to see
signs of progress. After decades of
alarming increases, this year’s report
shows us that childhood obesity rates
have stabilized in the past decade. We
also know that rates have declined
in a number of places around the
country — from Anchorage, Alaska to
Philadelphia, Pennsylvania.
This is success worth heralding,
brought about in part through
committed action by policy makers
INTRODUCTION
The State of ObesityThe following is a letter from Risa
Lavizzo-Mourey, MD, MBA, president
and CEO of the Robert Wood Johnson
Foundation (RWJF), and Jeffrey Levi,
PhD, executive director of the Trust
for America’s Health (TFAH)
After ten years of “F as in Fat,” we are excited to unveil a
new name for this report: “The State of Obesity: Better
Policies for a Healthier America.” Why? Well, quite
simply, we believe the “F” no longer stands for failure.
We launched the first “F as in Fat” report in response to
the urgent call from national leaders, including the U.S.
Surgeon General, to create a public health response that
matched the level of a crisis that had reached epidemic
proportions in the United States.1 Our goal was to raise
awareness about the seriousness of the obesity epidemic
and present ideas on how to overcome it.
4 TFAH • RWJF • StateofObesity.org
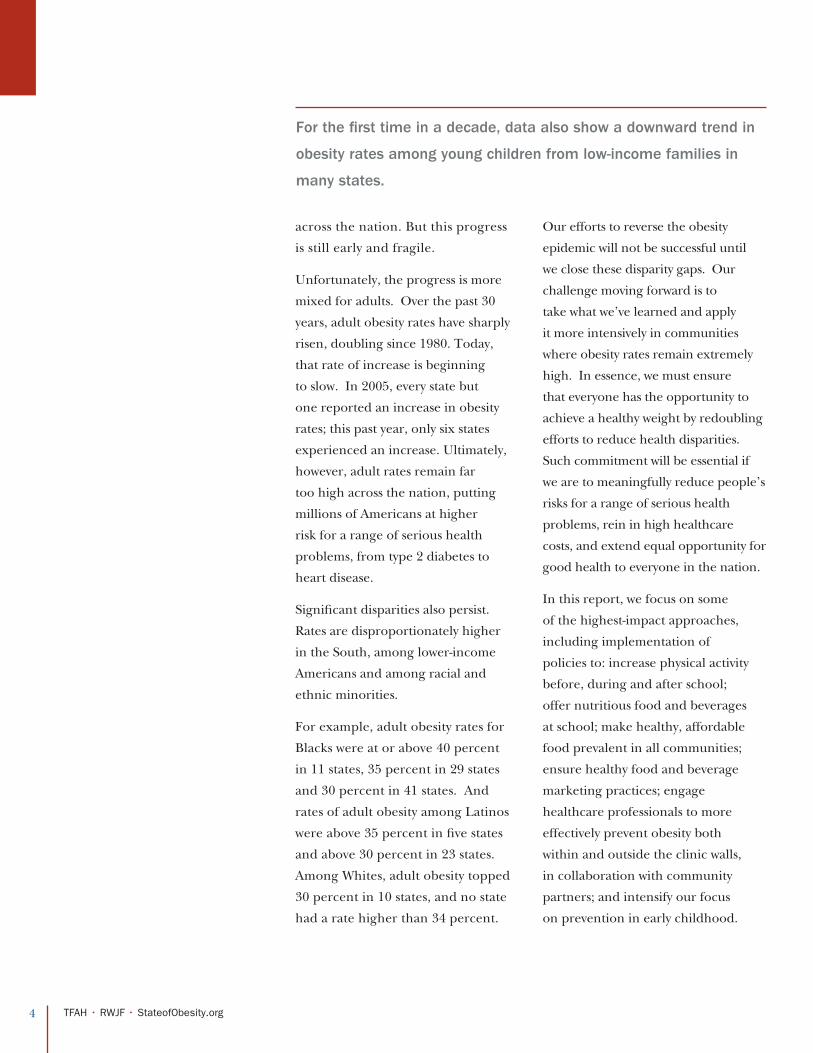
across the nation. But this progress
is still early and fragile.
Unfortunately, the progress is more
mixed for adults. Over the past 30
years, adult obesity rates have sharply
risen, doubling since 1980. Today,
that rate of increase is beginning
to slow. In 2005, every state but
one reported an increase in obesity
rates; this past year, only six states
experienced an increase. Ultimately,
however, adult rates remain far
too high across the nation, putting
millions of Americans at higher
risk for a range of serious health
problems, from type 2 diabetes to
heart disease.
Significant disparities also persist.
Rates are disproportionately higher
in the South, among lower-income
Americans and among racial and
ethnic minorities.
For example, adult obesity rates for
Blacks were at or above 40 percent
in 11 states, 35 percent in 29 states
and 30 percent in 41 states. And
rates of adult obesity among Latinos
were above 35 percent in five states
and above 30 percent in 23 states.
Among Whites, adult obesity topped
30 percent in 10 states, and no state
had a rate higher than 34 percent.
Our efforts to reverse the obesity
epidemic will not be successful until
we close these disparity gaps. Our
challenge moving forward is to
take what we’ve learned and apply
it more intensively in communities
where obesity rates remain extremely
high. In essence, we must ensure
that everyone has the opportunity to
achieve a healthy weight by redoubling
efforts to reduce health disparities.
Such commitment will be essential if
we are to meaningfully reduce people’s
risks for a range of serious health
problems, rein in high healthcare
costs, and extend equal opportunity for
good health to everyone in the nation.
In this report, we focus on some
of the highest-impact approaches,
including implementation of
policies to: increase physical activity
before, during and after school;
offer nutritious food and beverages
at school; make healthy, affordable
food prevalent in all communities;
ensure healthy food and beverage
marketing practices; engage
healthcare professionals to more
effectively prevent obesity both
within and outside the clinic walls,
in collaboration with community
partners; and intensify our focus
on prevention in early childhood.
For the first time in a decade, data also show a downward trend in
obesity rates among young children from low-income families in
many states.
5 TFAH • RWJF • StateofObesity.org
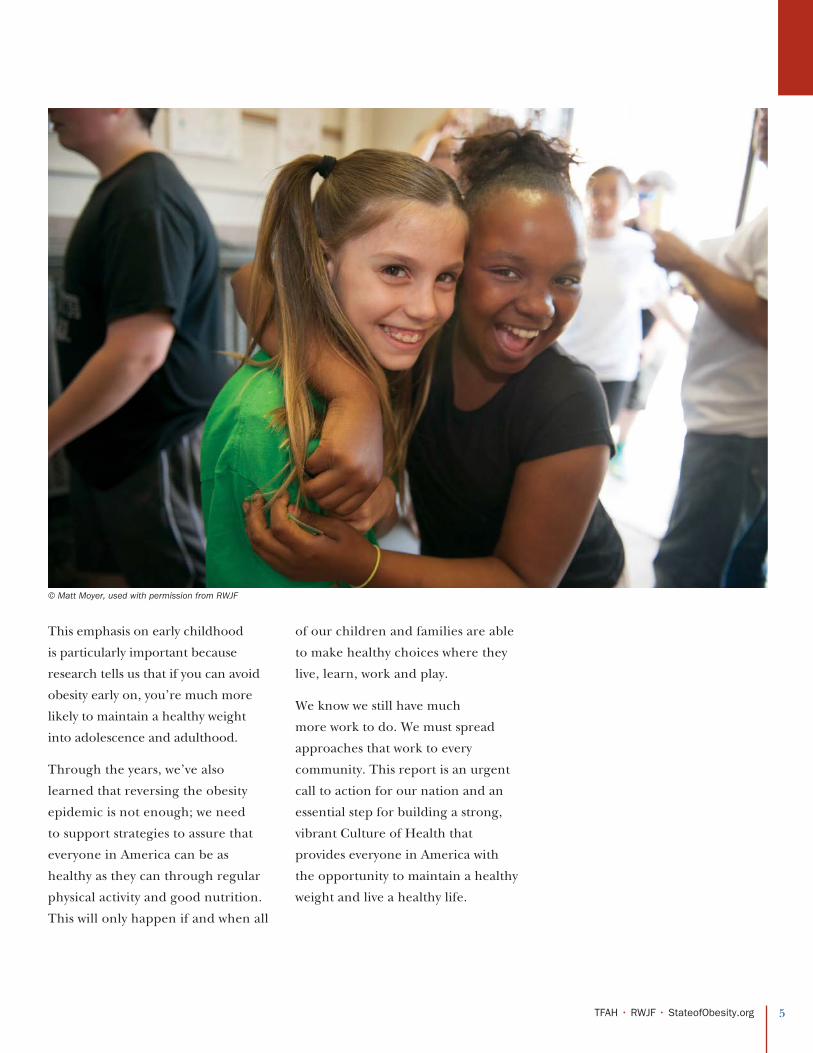
This emphasis on early childhood
is particularly important because
research tells us that if you can avoid
obesity early on, you’re much more
likely to maintain a healthy weight
into adolescence and adulthood.
Through the years, we’ve also
learned that reversing the obesity
epidemic is not enough; we need
to support strategies to assure that
everyone in America can be as
healthy as they can through regular
physical activity and good nutrition.
This will only happen if and when all
of our children and families are able
to make healthy choices where they
live, learn, work and play.
We know we still have much
more work to do. We must spread
approaches that work to every
community. This report is an urgent
call to action for our nation and an
essential step for building a strong,
vibrant Culture of Health that
provides everyone in America with
the opportunity to maintain a healthy
weight and live a healthy life.
© Matt Moyer, used with permission from RWJF
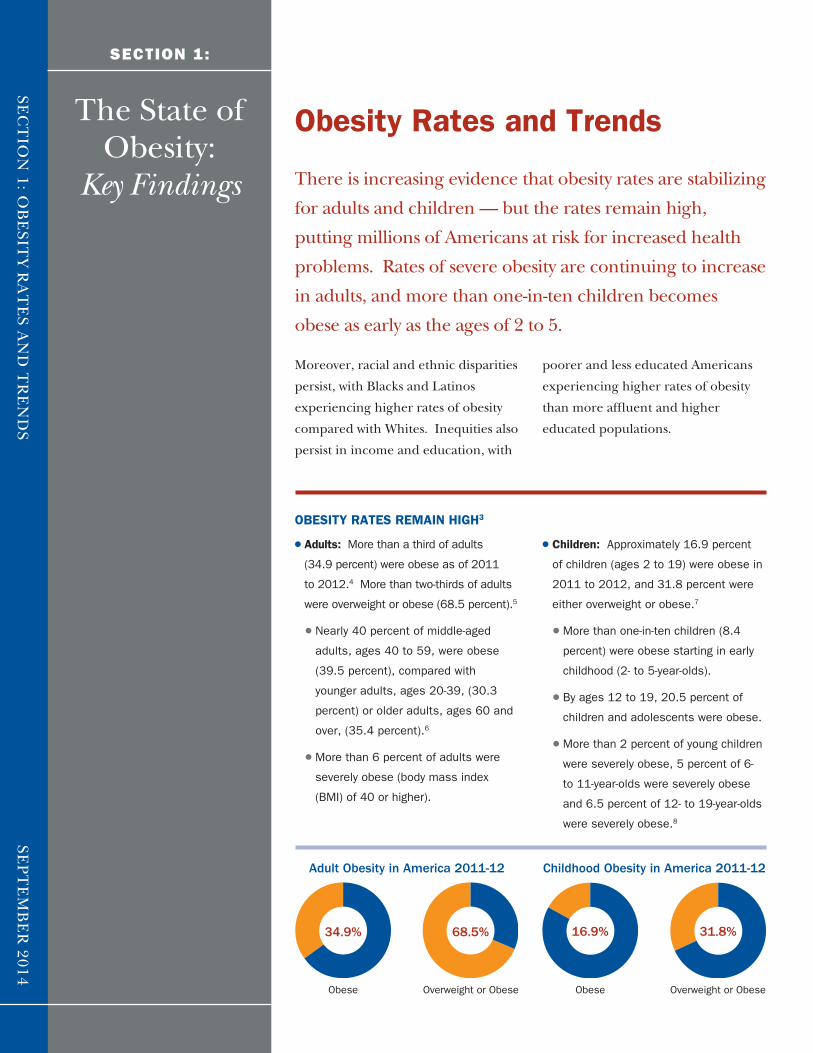
OBESITY RATES REMAIN HIGH3
l Adults: More than a third of adults
(34.9 percent) were obese as of 2011
to 2012.4 More than two-thirds of adults
were overweight or obese (68.5 percent).5
l Nearly 40 percent of middle-aged
adults, ages 40 to 59, were obese
(39.5 percent), compared with
younger adults, ages 20-39, (30.3
percent) or older adults, ages 60 and
over, (35.4 percent).6
l More than 6 percent of adults were
severely obese (body mass index
(BMI) of 40 or higher).
l Children: Approximately 16.9 percent
of children (ages 2 to 19) were obese in
2011 to 2012, and 31.8 percent were
either overweight or obese.7
l More than one-in-ten children (8.4
percent) were obese starting in early
childhood (2- to 5-year-olds).
l By ages 12 to 19, 20.5 percent of
children and adolescents were obese.
l More than 2 percent of young children
were severely obese, 5 percent of 6-
to 11-year-olds were severely obese
and 6.5 percent of 12- to 19-year-olds
were severely obese.8
Adult Obesity in America 2011-12
Obese ObeseOverweight or Obese Overweight or Obese
34.9% 68.5%
Childhood Obesity in America 2011-12
16.9% 31.8%
The State of Obesity:
Key Findings
SEC
TIO
N 1: O
BE
SITY R
AT
ES A
ND
TR
EN
DS
SECTION 1:
SEP
TE
MB
ER
2014
Obesity Rates and Trends
There is increasing evidence that obesity rates are stabilizing
for adults and children — but the rates remain high,
putting millions of Americans at risk for increased health
problems. Rates of severe obesity are continuing to increase
in adults, and more than one-in-ten children becomes
obese as early as the ages of 2 to 5.
Moreover, racial and ethnic disparities
persist, with Blacks and Latinos
experiencing higher rates of obesity
compared with Whites. Inequities also
persist in income and education, with
poorer and less educated Americans
experiencing higher rates of obesity
than more affluent and higher
educated populations.
7 TFAH • RWJF • StateofObesity.org
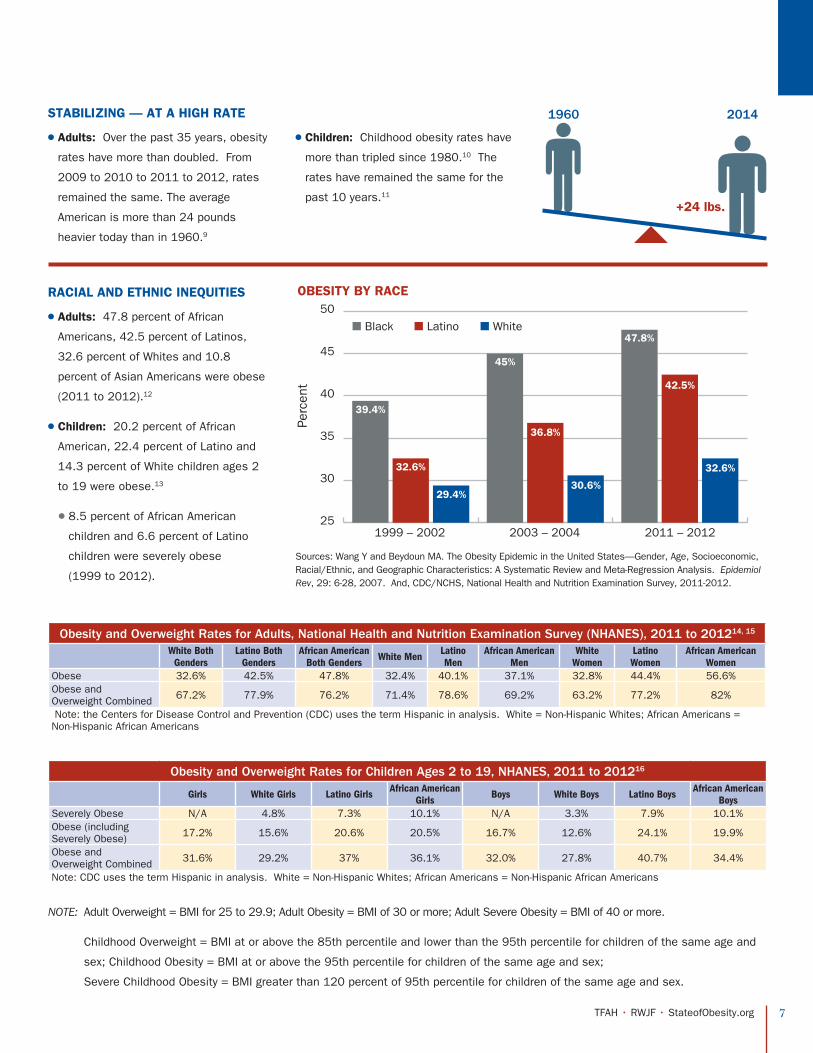
STABILIZING — AT A HIGH RATE
l Adults: Over the past 35 years, obesity
rates have more than doubled. From
2009 to 2010 to 2011 to 2012, rates
remained the same. The average
American is more than 24 pounds
heavier today than in 1960.9
l Children: Childhood obesity rates have
more than tripled since 1980.10 The
rates have remained the same for the
past 10 years.11
RACIAL AND ETHNIC INEQUITIES
l Adults: 47.8 percent of African
Americans, 42.5 percent of Latinos,
32.6 percent of Whites and 10.8
percent of Asian Americans were obese
(2011 to 2012).12
l Children: 20.2 percent of African
American, 22.4 percent of Latino and
14.3 percent of White children ages 2
to 19 were obese.13
l 8.5 percent of African American
children and 6.6 percent of Latino
children were severely obese
(1999 to 2012).
NOTE: Adult Overweight = BMI for 25 to 29.9; Adult Obesity = BMI of 30 or more; Adult Severe Obesity = BMI of 40 or more.
Childhood Overweight = BMI at or above the 85th percentile and lower than the 95th percentile for children of the same age and
sex; Childhood Obesity = BMI at or above the 95th percentile for children of the same age and sex;
Severe Childhood Obesity = BMI greater than 120 percent of 95th percentile for children of the same age and sex.
1960 2014
+24 lbs.
Obesity and Overweight Rates for Adults, National Health and Nutrition Examination Survey (NHANES), 2011 to 201214, 15
White Both Genders
Latino Both Genders
African American Both Genders White Men Latino
MenAfrican American
MenWhite
WomenLatino Women
African American Women
Obese 32.6% 42.5% 47.8% 32.4% 40.1% 37.1% 32.8% 44.4% 56.6%Obese and Overweight Combined 67.2% 77.9% 76.2% 71.4% 78.6% 69.2% 63.2% 77.2% 82%
Note: the Centers for Disease Control and Prevention (CDC) uses the term Hispanic in analysis. White = Non-Hispanic Whites; African Americans = Non-Hispanic African Americans
Obesity and Overweight Rates for Children Ages 2 to 19, NHANES, 2011 to 201216
Girls White Girls Latino Girls African American Girls Boys White Boys Latino Boys African American
BoysSeverely Obese N/A 4.8% 7.3% 10.1% N/A 3.3% 7.9% 10.1%Obese (including Severely Obese) 17.2% 15.6% 20.6% 20.5% 16.7% 12.6% 24.1% 19.9%
Obese and Overweight Combined 31.6% 29.2% 37% 36.1% 32.0% 27.8% 40.7% 34.4%
Note: CDC uses the term Hispanic in analysis. White = Non-Hispanic Whites; African Americans = Non-Hispanic African Americans
25
30
35
40
45
50
■ White■ Black ■ Latino
OBESITY BY RACE
1999 – 2002
39.4%
32.6%
29.4%30.6%
32.6%
36.8%
42.5%
45%
47.8%
Perc
ent
2003 – 2004 2011 – 2012
Sources: Wang Y and Beydoun MA. The Obesity Epidemic in the United States—Gender, Age, Socioeconomic, Racial/Ethnic, and Geographic Characteristics: A Systematic Review and Meta-Regression Analysis. Epidemiol Rev, 29: 6-28, 2007. And, CDC/NCHS, National Health and Nutrition Examination Survey, 2011-2012.

8 TFAH • RWJF • StateofObesity.org
A. ADULT OBESITY AND OVERWEIGHT RATES
Two states have adult obesity rates above 35 percent, 20
states have rates at or above 30 percent, 42 states have
rates above 25 percent and every state is above 20 percent.
In 1980, no state was above 15 percent; in 1991, no state was
above 20 percent; in 2000, no state was above 25 percent;
and, in 2007, only Mississippi was above 30 percent.
Since 2005, there has been some
evidence that the rate of increase
has been slowing across the states. In
2005, every state but one experienced
an increase in obesity rates from the
previous year; from 2007 to 2008,
rates increased in 37 states; from
2009 to 2010, rates increased in 28
states; and, from 2010 to 2011, rates
increased in 16 states (in 2011, CDC
changed methodologies for the
Behavioral Risk Factor Surveillance
System (BRFSS)), (see discussion
in rates and rankings methodology
for more details on the differences).
Between 2011 and 2012, only one
state had an increase. Between 2012
and 2013, six states had increases.
Mississippi and West Virginia had
the highest rates of obesity at 35.1
percent, while Colorado had the
lowest rate at 21.3 percent. Nine
of the 10 states with the highest
rates of obesity are in the South.
Northeastern and Western states
comprise most of the states with the
lowest rates of obesity.17
In 2010, the U.S. Department of
Health and Human Services (HHS)
set a national goal to reduce the adult
obesity rate from 33.9 percent to 30.5
percent by 2020, which would be a
10 percent decrease.18 Healthy People
2020 also set a goal of increasing the
percentage of people at a healthy
weight from 30.8 percent to 33.9
percent by 2020; as of 2012, 26 states
fell short of that goal.19

9 TFAH • RWJF • StateofObesity.org
DC
WA
NV
AZ
CO
NE
ND
MN
WI
IL
KY VA
NY
HI
MDDE
NJ
NH
VT
MA
RICT
NC
LA
AR
MS AL
SD
KS MO
TN
GASC
FL
IN OH
WV
PA
ME
MIIA
OK
TX
NM
ORID
MT
WY
UT
AK
CA
2013 ADULT OBESITY RATES
n <25%
n >25% & <30%
n >30% & <35%
n >35%
(Note: Reflects BRFSS methodological changes
made in 2011. Estimates should not be
compared to those prior to 2010)20
Territory Obesity RateGuam 27Puerto Rico 27.9

10 TFAH • RWJF • StateofObesity.org
CHART ON OBESITY AND OVERWEIGHT RATES AND RELATED HEALTH INDICATORS IN THE STATESADULTS CHILDREN AND ADOLESCENTS
Obesity Overweight & Obese Diabetes Physical Inactivity Hypertension 2013 YRBS 2011 PedNSS 2011 National Survey of Children’s Health
States 2013 Percentage (95% Conf Interval) Ranking 2013 Percentage
(95% Conf Interval)2013 Percentage
(95% Conf Interval) Ranking 2013 Percentage (95% Conf Interval) Ranking 2013 Percentage
(95% Conf Interval) Ranking States
Percentage of Obese High School
Students (95% Conf Interval)
Percentage of Overweight High School Students
(95% Conf Interval)
Percentage of High School Students Who Were
Physically Active At Least 60 Minutes on All 7 Days
Percentage of Obese Low-Income Children
Ages 2-4
Percentage of Obese Children
Ages 10-17 Ranking
Percentage Participating in Vigorous Physical Activity
Every Day Ages 6-17
Alabama 32.4% (+/-1.7) 8 68.2% (+/-1.7) 13.8% (+/-1.1)* 1 31.5% (+/-1.7)* 6 40.3% (+/-1.7) 2 Alabama 17.1 (+/- 2.7) 15.8 (+/- 2.7) 24.8 (+/- 2.4) 14.1% 18.6% (+/- 3.9) 11 32.7%Alaska 28.4% (+/-1.9)* 28 66.1% (+/-2) 7.1% (+/-1.1) 49 22.3% (+/-1.8)* 43 29.8% (+/-1.9) 39 Alaska 12.4 (+/- 2.1) 13.7 (+/- 2.6) 20.9 (+/- 2.8) N/A 14.0% (+/- 3.3) 32 32.9%Arizona 26.8% (+/-2.5) 34 61.8% (+/-2.7) 10.7% (+/-1.6) 15 25.2% (+/-2.5) 28 30.7% (+/-2.4) 32 Arizona 10.7 (+/- 2.7) 12.7 (+/- 1.9) 21.7 (+/- 2.5) 14.5% 19.8% (+/- 4.6) 7 26.4%Arkansas 34.6% (+/-1.9) 3 69.9% (+/-1.9) 11.5% (+/-1.1) 7 34.4% (+/-1.9)* 3 38.7% (+/-1.9) 7 Arkansas 17.8 (+/- 2.2) 15.9 (+/- 2.5) 27.5 (+/- 3.0) 14.2% 20.0% (+/- 4.2) 6 31.6%California 24.1% (+/-1.1) 46 60.1% (+/-1.3) 10.2% (+/-0.8) 21 21.4% (+/-1.1)* 45 28.7% (+/-1.1) 45 California N/A N/A N/A 16.8%V 15.1% (+/- 4.1) 21 25.2%Colorado 21.3% (+/-0.9) 51 56.4% (+/-1.1) 6.5% (+/-0.5)^ 51 17.9% (+/-0.9) 51 26.3% (+/-0.9) 50 Colorado N/A N/A N/A 10.0%* 10.9% (+/- 3.6) 47 28.3%Connecticut 25% (+/-1.5) 43 62.5% (+/-1.7) 8.3% (+/-0.8) 43 24.9% (+/-1.5)* 31 31.3% (+/-1.4) 27 Connecticut 12.3 (+/- 2.3) 13.9 (+/- 1.6) 26.0 (+/- 3.2) 15.8% 15.0% (+/- 3.2) 23 25.8%Delaware 31.1% (+/-1.8)* 13 64.6% (+/-1.9) 11.1% (+/-1.1) 10 27.8% (+/-1.7)* 14 35.6% (+/-1.7) 10 Delaware 14.2 (+/- 1.4) 16.3 (+/- 1.7) 23.7 (+/- 2.0) N/A 16.9% (+/- 4.1) 16 26.5%D.C. 22.9% (+/-1.9) 49 53.8% (+/-2.4) 7.8% (+/-1) 45 19.5% (+/-2) 49 28.4% (+/-1.8) 48 D.C. N/A N/A N/A 13.1% 21.4% (+/- 5.5) 3 26.8%Florida 26.4% (+/-1.1) 37 62.8% (+/-1.2) 11.2% (+/-0.7) 9 27.7% (+/-1.2)* 15 34.6% (+/-1.1) 13 Florida 11.6 (+/- 1.2) 14.7 (+/- 1.2) 25.3 (+/- 1.4) 13.1%V 13.4% (+/- 3.3) 38 31.5%Georgia 30.3% (+/-1.4) 18 65.7% (+/-1.5) 10.8% (+/-0.8) 14 27.2% (+/-1.4)* 17 35% (+/-1.4) 12 Georgia 12.7 (+/- 1.7) 17.1 (+/- 2.1) 24.7 (+/- 2.2) 13.2%V 16.5% (+/- 3.8) 17 30.6%Hawaii 21.8% (+/-1.4) 50 55.4% (+/-1.6) 8.4% (+/-0.9) 41 22.1% (+/-1.5)* 44 28.5% (+/-1.5) 47 Hawaii 13.4 (+/- 1.9) 14.9 (+/- 2.0) 22.0 (+/- 1.5) 9.2% 11.5% (+/- 2.6) 44 28.7%Idaho 29.6% (+/-1.8)* 23 64.9% (+/-1.9) 8.4% (+/-0.9) 41 23.7% (+/-1.7)* 36 29.4% (+/-1.6) 42 Idaho 9.6 (+/- 1.5) 15.7 (+/- 1.3) 27.9 (+/- 2.7) 11.5%V 10.6% (+/- 3.4) 49 25.5%Illinois 29.4% (+/-1.7) 25 64.7% (+/-1.8) 9.9% (+/-1) 23 25.1% (+/-1.7)* 29 30.1% (+/-1.7) 37 Illinois 11.5 (+/- 1.8) 14.4 (+/- 1.7) 25.4 (+/- 2.3) 14.7% 19.3% (+/- 3.9) 9 23.5%Indiana 31.8% (+/-1.2) 9 67.3% (+/-1.3) 11% (+/-0.7) 11 31% (+/-1.2)* 8 33.5% (+/-1.1) 17 Indiana N/A N/A N/A 14.3% 14.3% (+/- 3.7) 28 28.6%Iowa 31.3% (+/-1.4) 12 67% (+/-1.4)* 9.3% (+/-0.7) 30 28.5% (+/-1.4)* 11 31.4% (+/-1.3) 26 Iowa N/A N/A N/A 14.4%V 13.6% (+/- 3.2) 35 31.2%Kansas 30% (+/-0.8) 19 65.3% (+/-0.8) 9.6% (+/-0.4) 26 26.5% (+/-0.7)* 23 31.3% (+/-0.7) 27 Kansas 12.6 (+/- 2.1) 16.3 (+/- 1.8) 38.3 (+/- 2.3) 12.7%V 14.2% (+/- 3.6) 31 28.2%Kentucky 33.2% (+/-1.4) 5 67.3% (+/-1.4) 10.6% (+/-0.8) 17 30.2% (+/-1.4) 9 39.1% (+/-1.4) 5 Kentucky 18.0 (+/- 2.5) 15.4 (+/- 2.1) 22.5 (+/- 2.6) 15.5% 19.7% (+/- 3.9) 8 32.3%Louisiana 33.1% (+/-2.1) 6 67.4% (+/-2.2) 11.6% (+/-1.1) 6 32.2% (+/-2.1) 5 39.8% (+/-2) 4 Louisiana 13.5 (+/- 2.7) 16.4 (+/- 1.9) N/A N/A 21.1% (+/- 4.0) 4 31.1%Maine 28.9% (+/-1.3) 27 64.8% (+/-1.4) 9.6% (+/-0.8) 26 23.3% (+/-1.3)* 40 33.3% (+/-1.3) 19 Maine 11.6 (+/- 1.6) 14.2 (+/- 0.9) 22.3 (+/- 1.6) N/A 12.5% (+/- 3.0) 42 32.0%Maryland 28.3% (+/-1.2) 29 64.1% (+/-1.4) 9.8% (+/-0.7) 24 25.3% (+/-1.2)* 26 32.8% (+/-1.2) 20 Maryland 11.0 (+/- 0.4) 14.8 (+/- 0.4) 21.6 (+/- 0.6) 15.3%V 15.1% (+/- 3.7) 21 24.4%Massachusetts 23.6% (+/-1.1) 48 58% (+/-1.3) 8.5% (+/-0.7) 40 23.5% (+/-1.2)* 38 29.4% (+/-1.1) 42 Massachusetts 10.2 (+/- 1.8) 12.9 (+/- 1.7) 23.0 (+/- 2.3) 16.4%V 14.5% (+/- 3.5) 25 25.5%Michigan 31.5% (+/-1.1) 11 66.2% (+/-1.2) 10.4% (+/-0.7) 19 24.4% (+/-1.1) 32 34.6% (+/-1.1) 13 Michigan 13.0 (+/- 1.8) 15.5 (+/- 1.3) 26.7 (+/- 2.8) 13.2%V 14.8% (+/- 3.6) 24 27.7%Minnesota 25.5% (+/-1.4) 41 61.1% (+/-1.5)V 7.4% (+/-0.8) 48 23.5% (+/-1.4)* 38 27% (+/-1.3) 49 Minnesota N/A N/A N/A 12.6%V 14.0% (+/- 3.7) 32 28.7%Mississippi 35.1% (+/-1.6) 1 69.3% (+/-1.7) 12.9% (+/-1) 3 38.1% (+/-1.7)* 1 40.2% (+/-1.6) 3 Mississippi 15.4 (+/- 2.4) 13.2 (+/- 2.6) 25.9 (+/- 3.5) 13.9%V 21.7% (+/- 4.4) 1 27.7%Missouri 30.4% (+/-1.7) 16 65.5% (+/-1.7) 9.6% (+/-0.9) 26 28.3% (+/-1.6)* 13 32% (+/-1.6) 23 Missouri 14.9 (+/- 2.8) 15.5 (+/- 2.3) 27.2 (+/- 2.6) 12.9%V 13.5% (+/- 3.0) 36 33.7%Montana 24.6% (+/-1.2) 45 61.4% (+/-1.4) 7.7% (+/-0.7) 47 22.5% (+/-1.2)* 41 29.3% (+/-1.2) 44 Montana 9.4 (+/- 1.1) 12.9 (+/- 1.2) 27.7 (+/- 1.7) 11.7% 14.3% (+/- 3.4) 28 32.4%Nebraska 29.6% (+/-1.1) 23 65.5% (+/-1.2) 9.2% (+/-0.7)* 32 25.3% (+/-1.1)* 26 30.3% (+/-1.1) 36 Nebraska 12.7 (+/- 2.0) 13.8 (+/- 1.6) 32.3 (+/- 2.6) 14.3% 13.8% (+/- 3.1) 34 31.3%Nevada 26.2% (+/-2.3) 40 64.9% (+/-2.5) 9.6% (+/-1.5) 26 23.7% (+/-2.2) 36 30.6% (+/-2.3) 34 Nevada 11.4 (+/- 2.0) 14.6 (+/- 2.5) 24.0 (+/- 2.6) 12.7% 18.6% (+/- 4.2) 11 22.4%New Hampshire 26.7% (+/-1.5) 35 61.8% (+/-1.7) 9.2% (+/-0.9) 32 22.4% (+/-1.5)* 42 30.1% (+/-1.4) 37 New Hampshire 11.2 (+/- 1.7) 13.8 (+/- 1.6) 22.9 (+/- 2.3) 14.6%V 15.5% (+/- 3.6) 19 28.1%New Jersey 26.3% (+/-1.2)* 39 62.8% (+/-1.3) 9.2% (+/-0.7) 32 26.8% (+/-1.2)* 20 31.1% (+/-1.2) 30 New Jersey 8.7 (+/- 2.2) 14.0 (+/- 2.2) 27.6 (+/- 3.7) 16.6%V 10.0% (+/- 2.9) 50 25.3%New Mexico 26.4% (+/-1.3) 37 62.7% (+/-1.5) 10.7% (+/-0.9) 15 24.3% (+/-1.3)* 33 29.5% (+/-1.3) 41 New Mexico 12.6 (+/- 2.4) 15.0 (+/- 1.8) 31.1 (+/- 2.4) 11.3%V 14.4% (+/- 3.7) 27 29.6%New York 25.4% (+/-1.2) 42 61.3% (+/-1.4) 10.6% (+/-0.9) 17 26.7% (+/-1.3) 21 31.5% (+/-1.3) 25 New York 10.6 (+/- 1.1) 13.8 (+/- 1.1) 25.7 (+/- 3.3) 14.3%V 14.5% (+/- 3.2) 25 24.6%North Carolina 29.4% (+/-1.3) 25 66.1% (+/-1.4) 11.4% (+/-0.8) 8 26.6% (+/-1.3)* 22 35.5% (+/-1.3) 11 North Carolina 12.5 (+/- 1.9) 15.2 (+/- 2.2) 25.9 (+/- 2.6) 15.4% 16.1% (+/- 4.0) 18 31.6%North Dakota 31% (+/-1.5) 14 67.6% (+/-1.6) 8.9% (+/-0.8) 37 27.6% (+/-1.5)* 16 29.7% (+/-1.4) 40 North Dakota 13.5 (+/- 1.8) 15.1 (+/- 1.8) 24.7 (+/- 2.5) 13.1% 15.4% (+/- 3.8) 20 30.4%Ohio 30.4% (+/-1.2) 16 65.1% (+/-1.4) 10.4% (+/-0.7)V 19 28.5% (+/-1.3)* 11 33.5% (+/-1.2) 17 Ohio 13.0 (+/- 2.4) 15.9 (+/- 2.0) 25.9 (+/- 3.7) 12.4% 17.4% (+/- 3.7) 14 28.5%Oklahoma 32.5% (+/-1.4) 7 67.9% (+/-1.4) 11% (+/-0.8) 11 33% (+/-1.4)* 4 37.5% (+/-1.3) 9 Oklahoma 11.8 (+/- 2.0) 15.3 (+/- 2.4) 38.5 (+/- 3.4) N/A 17.4% (+/- 3.6) 14 34.9%Oregon 26.5% (+/-1.6) 36 59.9% (+/-1.7) 9.2% (+/-0.9) 32 18.5% (+/-1.5)* 50 31.8% (+/-1.5) 24 Oregon N/A N/A N/A 14.9% 9.9% (+/- 2.8) 51 28.5%Pennsylvania 30% (+/-1.2) 19 64.5% (+/-1.2) 10.1% (+/-0.7) 22 26.3% (+/-1.1)* 24 33.7% (+/-1.1) 16 Pennsylvania N/A N/A N/A 12.2%* 13.5% (+/- 3.5) 36 27.0%Rhode Island 27.3% (+/-1.5) 31 64.6% (+/-1.7) 9.3% (+/-0.9) 30 26.9% (+/-1.6)* 18 33.8% (+/-1.5) 15 Rhode Island 10.7 (+/- 1.3) 16.2 (+/- 2.5) 23.2 (+/- 3.8) 16.6% 13.2% (+/- 3.3) 41 25.2%South Carolina 31.7% (+/-1.3) 10 66.5% (+/-1.3) 12.5% (+/-0.8) 4 26.9% (+/-1.2)* 18 38.4% (+/-1.3) 8 South Carolina 13.9 (+/- 2.5) 16.8 (+/- 2.1) 23.8 (+/- 3.0) N/A 21.5% (+/- 4.1) 2 30.3%South Dakota 29.9% (+/-1.9) 21 67% (+/-1.9) 9.1% (+/-1) 36 23.8% (+/-1.7) 34 30.7% (+/-1.8) 32 South Dakota 11.9 (+/- 2.3) 13.2 (+/- 1.6) 27.7 (+/- 2.5) 15.2%V 13.4% (+/- 3.3) 38 30.2%Tennessee 33.7% (+/-1.8)* 4 68.4% (+/-1.8)* 12.2% (+/-1.1) 5 37.2% (+/-1.9)* 2 38.8% (+/-1.8) 6 Tennessee 16.9 (+/- 1.9) 15.4 (+/- 2.3) 25.4 (+/- 3.1) 14.2%* 20.5% (+/- 4.2) 5 34.5%Texas 30.9% (+/-1.4) 15 66.1% (+/-1.5) 10.9% (+/-0.9) 13 30.1% (+/-1.5)* 10 31.2% (+/-1.3) 29 Texas 15.7 (+/- 1.9) 15.6 (+/- 1.6) 30.0 (+/- 2.4) N/A 19.1% (+/- 4.5) 10 29.0%Utah 24.1% (+/-1) 46 59.2% (+/-1.2) 7.1% (+/-0.5) 49 20.6% (+/-1)* 46 24.2% (+/-0.9) 51 Utah 6.4 (+/- 1.9) 11.0 (+/- 2.2) 19.7 (+/- 2.7) N/A 11.6% (+/- 3.3) 43 18.1%Vermont 24.7% (+/-1.4) 44 61.9% (+/-1.6) 7.8% (+/-0.8) 45 20.5% (+/-1.3)* 47 31.1% (+/-1.4) 30 Vermont 13.2 (+/- 2.1) 15.8 (+/- 1.0) 25.4 (+/- 1.9) 12.9% 11.3% (+/- 2.7) 45 33.3%Virginia 27.2% (+/-1.3) 32 64% (+/-1.5) 9.8% (+/-0.8) 24 25.5% (+/-1.3)* 25 32.5% (+/-1.3) 21 Virginia 12.0 (+/- 1.3) 14.7 (+/- 1.4) 23.8 (+/- 1.6) N/A 14.3% (+/- 3.6) 28 26.1%Washington 27.2% (+/-1.2) 32 61.4% (+/-1.3) 8.6% (+/-0.6) 38 20% (+/-1.1) 48 30.4% (+/-1.1) 35 Washington N/A N/A N/A 14.0%V 11.0% (+/- 3.1) 46 28.5%West Virginia 35.1% (+/-1.5) 1 68.8% (+/-1.5) 13% (+/-0.9) 2 31.4% (+/-1.4) 7 41% (+/-1.5) 1 West Virginia 15.6 (+/- 2.3) 15.5 (+/- 2.0) 31.0 (+/- 2.4) 14.0% 18.5% (+/- 3.4) 13 34.1%Wisconsin 29.8% (+/-1.8) 22 66.5% (+/-1.9) 8.2% (+/-1) 44 23.8% (+/-1.7)* 34 32.3% (+/-1.7) 22 Wisconsin 11.6 (+/- 2.1) 13.0 (+/- 1.2) 24.0 (+/- 2.3) 14.0% 13.4% (+/- 3.1) 38 28.3%Wyoming 27.8% (+/-1.6)* 30 64.4% (+/-1.8) 8.6% (+/-0.8) 38 25.1% (+/-1.6)* 29 28.7% (+/-1.4) 45 Wyoming 10.7 (+/- 1.4) 12.8 (+/- 1.2) 28.2 (+/- 2.0) N/A 10.7% (+/- 4.2) 48 30.2%
Source: Behavior Risk Factor Surveillance System (BRFSS), CDC. Red and * indicates a statistically significant increase and green and V indicates a statistically significant decrease.

11 TFAH • RWJF • StateofObesity.org
CHART ON OBESITY AND OVERWEIGHT RATES AND RELATED HEALTH INDICATORS IN THE STATESADULTS CHILDREN AND ADOLESCENTS
Obesity Overweight & Obese Diabetes Physical Inactivity Hypertension 2013 YRBS 2011 PedNSS 2011 National Survey of Children’s Health
States 2013 Percentage (95% Conf Interval) Ranking 2013 Percentage
(95% Conf Interval)2013 Percentage
(95% Conf Interval) Ranking 2013 Percentage (95% Conf Interval) Ranking 2013 Percentage
(95% Conf Interval) Ranking States
Percentage of Obese High School
Students (95% Conf Interval)
Percentage of Overweight High School Students
(95% Conf Interval)
Percentage of High School Students Who Were
Physically Active At Least 60 Minutes on All 7 Days
Percentage of Obese Low-Income Children
Ages 2-4
Percentage of Obese Children
Ages 10-17 Ranking
Percentage Participating in Vigorous Physical Activity
Every Day Ages 6-17
Alabama 32.4% (+/-1.7) 8 68.2% (+/-1.7) 13.8% (+/-1.1)* 1 31.5% (+/-1.7)* 6 40.3% (+/-1.7) 2 Alabama 17.1 (+/- 2.7) 15.8 (+/- 2.7) 24.8 (+/- 2.4) 14.1% 18.6% (+/- 3.9) 11 32.7%Alaska 28.4% (+/-1.9)* 28 66.1% (+/-2) 7.1% (+/-1.1) 49 22.3% (+/-1.8)* 43 29.8% (+/-1.9) 39 Alaska 12.4 (+/- 2.1) 13.7 (+/- 2.6) 20.9 (+/- 2.8) N/A 14.0% (+/- 3.3) 32 32.9%Arizona 26.8% (+/-2.5) 34 61.8% (+/-2.7) 10.7% (+/-1.6) 15 25.2% (+/-2.5) 28 30.7% (+/-2.4) 32 Arizona 10.7 (+/- 2.7) 12.7 (+/- 1.9) 21.7 (+/- 2.5) 14.5% 19.8% (+/- 4.6) 7 26.4%Arkansas 34.6% (+/-1.9) 3 69.9% (+/-1.9) 11.5% (+/-1.1) 7 34.4% (+/-1.9)* 3 38.7% (+/-1.9) 7 Arkansas 17.8 (+/- 2.2) 15.9 (+/- 2.5) 27.5 (+/- 3.0) 14.2% 20.0% (+/- 4.2) 6 31.6%California 24.1% (+/-1.1) 46 60.1% (+/-1.3) 10.2% (+/-0.8) 21 21.4% (+/-1.1)* 45 28.7% (+/-1.1) 45 California N/A N/A N/A 16.8%V 15.1% (+/- 4.1) 21 25.2%Colorado 21.3% (+/-0.9) 51 56.4% (+/-1.1) 6.5% (+/-0.5)^ 51 17.9% (+/-0.9) 51 26.3% (+/-0.9) 50 Colorado N/A N/A N/A 10.0%* 10.9% (+/- 3.6) 47 28.3%Connecticut 25% (+/-1.5) 43 62.5% (+/-1.7) 8.3% (+/-0.8) 43 24.9% (+/-1.5)* 31 31.3% (+/-1.4) 27 Connecticut 12.3 (+/- 2.3) 13.9 (+/- 1.6) 26.0 (+/- 3.2) 15.8% 15.0% (+/- 3.2) 23 25.8%Delaware 31.1% (+/-1.8)* 13 64.6% (+/-1.9) 11.1% (+/-1.1) 10 27.8% (+/-1.7)* 14 35.6% (+/-1.7) 10 Delaware 14.2 (+/- 1.4) 16.3 (+/- 1.7) 23.7 (+/- 2.0) N/A 16.9% (+/- 4.1) 16 26.5%D.C. 22.9% (+/-1.9) 49 53.8% (+/-2.4) 7.8% (+/-1) 45 19.5% (+/-2) 49 28.4% (+/-1.8) 48 D.C. N/A N/A N/A 13.1% 21.4% (+/- 5.5) 3 26.8%Florida 26.4% (+/-1.1) 37 62.8% (+/-1.2) 11.2% (+/-0.7) 9 27.7% (+/-1.2)* 15 34.6% (+/-1.1) 13 Florida 11.6 (+/- 1.2) 14.7 (+/- 1.2) 25.3 (+/- 1.4) 13.1%V 13.4% (+/- 3.3) 38 31.5%Georgia 30.3% (+/-1.4) 18 65.7% (+/-1.5) 10.8% (+/-0.8) 14 27.2% (+/-1.4)* 17 35% (+/-1.4) 12 Georgia 12.7 (+/- 1.7) 17.1 (+/- 2.1) 24.7 (+/- 2.2) 13.2%V 16.5% (+/- 3.8) 17 30.6%Hawaii 21.8% (+/-1.4) 50 55.4% (+/-1.6) 8.4% (+/-0.9) 41 22.1% (+/-1.5)* 44 28.5% (+/-1.5) 47 Hawaii 13.4 (+/- 1.9) 14.9 (+/- 2.0) 22.0 (+/- 1.5) 9.2% 11.5% (+/- 2.6) 44 28.7%Idaho 29.6% (+/-1.8)* 23 64.9% (+/-1.9) 8.4% (+/-0.9) 41 23.7% (+/-1.7)* 36 29.4% (+/-1.6) 42 Idaho 9.6 (+/- 1.5) 15.7 (+/- 1.3) 27.9 (+/- 2.7) 11.5%V 10.6% (+/- 3.4) 49 25.5%Illinois 29.4% (+/-1.7) 25 64.7% (+/-1.8) 9.9% (+/-1) 23 25.1% (+/-1.7)* 29 30.1% (+/-1.7) 37 Illinois 11.5 (+/- 1.8) 14.4 (+/- 1.7) 25.4 (+/- 2.3) 14.7% 19.3% (+/- 3.9) 9 23.5%Indiana 31.8% (+/-1.2) 9 67.3% (+/-1.3) 11% (+/-0.7) 11 31% (+/-1.2)* 8 33.5% (+/-1.1) 17 Indiana N/A N/A N/A 14.3% 14.3% (+/- 3.7) 28 28.6%Iowa 31.3% (+/-1.4) 12 67% (+/-1.4)* 9.3% (+/-0.7) 30 28.5% (+/-1.4)* 11 31.4% (+/-1.3) 26 Iowa N/A N/A N/A 14.4%V 13.6% (+/- 3.2) 35 31.2%Kansas 30% (+/-0.8) 19 65.3% (+/-0.8) 9.6% (+/-0.4) 26 26.5% (+/-0.7)* 23 31.3% (+/-0.7) 27 Kansas 12.6 (+/- 2.1) 16.3 (+/- 1.8) 38.3 (+/- 2.3) 12.7%V 14.2% (+/- 3.6) 31 28.2%Kentucky 33.2% (+/-1.4) 5 67.3% (+/-1.4) 10.6% (+/-0.8) 17 30.2% (+/-1.4) 9 39.1% (+/-1.4) 5 Kentucky 18.0 (+/- 2.5) 15.4 (+/- 2.1) 22.5 (+/- 2.6) 15.5% 19.7% (+/- 3.9) 8 32.3%Louisiana 33.1% (+/-2.1) 6 67.4% (+/-2.2) 11.6% (+/-1.1) 6 32.2% (+/-2.1) 5 39.8% (+/-2) 4 Louisiana 13.5 (+/- 2.7) 16.4 (+/- 1.9) N/A N/A 21.1% (+/- 4.0) 4 31.1%Maine 28.9% (+/-1.3) 27 64.8% (+/-1.4) 9.6% (+/-0.8) 26 23.3% (+/-1.3)* 40 33.3% (+/-1.3) 19 Maine 11.6 (+/- 1.6) 14.2 (+/- 0.9) 22.3 (+/- 1.6) N/A 12.5% (+/- 3.0) 42 32.0%Maryland 28.3% (+/-1.2) 29 64.1% (+/-1.4) 9.8% (+/-0.7) 24 25.3% (+/-1.2)* 26 32.8% (+/-1.2) 20 Maryland 11.0 (+/- 0.4) 14.8 (+/- 0.4) 21.6 (+/- 0.6) 15.3%V 15.1% (+/- 3.7) 21 24.4%Massachusetts 23.6% (+/-1.1) 48 58% (+/-1.3) 8.5% (+/-0.7) 40 23.5% (+/-1.2)* 38 29.4% (+/-1.1) 42 Massachusetts 10.2 (+/- 1.8) 12.9 (+/- 1.7) 23.0 (+/- 2.3) 16.4%V 14.5% (+/- 3.5) 25 25.5%Michigan 31.5% (+/-1.1) 11 66.2% (+/-1.2) 10.4% (+/-0.7) 19 24.4% (+/-1.1) 32 34.6% (+/-1.1) 13 Michigan 13.0 (+/- 1.8) 15.5 (+/- 1.3) 26.7 (+/- 2.8) 13.2%V 14.8% (+/- 3.6) 24 27.7%Minnesota 25.5% (+/-1.4) 41 61.1% (+/-1.5)V 7.4% (+/-0.8) 48 23.5% (+/-1.4)* 38 27% (+/-1.3) 49 Minnesota N/A N/A N/A 12.6%V 14.0% (+/- 3.7) 32 28.7%Mississippi 35.1% (+/-1.6) 1 69.3% (+/-1.7) 12.9% (+/-1) 3 38.1% (+/-1.7)* 1 40.2% (+/-1.6) 3 Mississippi 15.4 (+/- 2.4) 13.2 (+/- 2.6) 25.9 (+/- 3.5) 13.9%V 21.7% (+/- 4.4) 1 27.7%Missouri 30.4% (+/-1.7) 16 65.5% (+/-1.7) 9.6% (+/-0.9) 26 28.3% (+/-1.6)* 13 32% (+/-1.6) 23 Missouri 14.9 (+/- 2.8) 15.5 (+/- 2.3) 27.2 (+/- 2.6) 12.9%V 13.5% (+/- 3.0) 36 33.7%Montana 24.6% (+/-1.2) 45 61.4% (+/-1.4) 7.7% (+/-0.7) 47 22.5% (+/-1.2)* 41 29.3% (+/-1.2) 44 Montana 9.4 (+/- 1.1) 12.9 (+/- 1.2) 27.7 (+/- 1.7) 11.7% 14.3% (+/- 3.4) 28 32.4%Nebraska 29.6% (+/-1.1) 23 65.5% (+/-1.2) 9.2% (+/-0.7)* 32 25.3% (+/-1.1)* 26 30.3% (+/-1.1) 36 Nebraska 12.7 (+/- 2.0) 13.8 (+/- 1.6) 32.3 (+/- 2.6) 14.3% 13.8% (+/- 3.1) 34 31.3%Nevada 26.2% (+/-2.3) 40 64.9% (+/-2.5) 9.6% (+/-1.5) 26 23.7% (+/-2.2) 36 30.6% (+/-2.3) 34 Nevada 11.4 (+/- 2.0) 14.6 (+/- 2.5) 24.0 (+/- 2.6) 12.7% 18.6% (+/- 4.2) 11 22.4%New Hampshire 26.7% (+/-1.5) 35 61.8% (+/-1.7) 9.2% (+/-0.9) 32 22.4% (+/-1.5)* 42 30.1% (+/-1.4) 37 New Hampshire 11.2 (+/- 1.7) 13.8 (+/- 1.6) 22.9 (+/- 2.3) 14.6%V 15.5% (+/- 3.6) 19 28.1%New Jersey 26.3% (+/-1.2)* 39 62.8% (+/-1.3) 9.2% (+/-0.7) 32 26.8% (+/-1.2)* 20 31.1% (+/-1.2) 30 New Jersey 8.7 (+/- 2.2) 14.0 (+/- 2.2) 27.6 (+/- 3.7) 16.6%V 10.0% (+/- 2.9) 50 25.3%New Mexico 26.4% (+/-1.3) 37 62.7% (+/-1.5) 10.7% (+/-0.9) 15 24.3% (+/-1.3)* 33 29.5% (+/-1.3) 41 New Mexico 12.6 (+/- 2.4) 15.0 (+/- 1.8) 31.1 (+/- 2.4) 11.3%V 14.4% (+/- 3.7) 27 29.6%New York 25.4% (+/-1.2) 42 61.3% (+/-1.4) 10.6% (+/-0.9) 17 26.7% (+/-1.3) 21 31.5% (+/-1.3) 25 New York 10.6 (+/- 1.1) 13.8 (+/- 1.1) 25.7 (+/- 3.3) 14.3%V 14.5% (+/- 3.2) 25 24.6%North Carolina 29.4% (+/-1.3) 25 66.1% (+/-1.4) 11.4% (+/-0.8) 8 26.6% (+/-1.3)* 22 35.5% (+/-1.3) 11 North Carolina 12.5 (+/- 1.9) 15.2 (+/- 2.2) 25.9 (+/- 2.6) 15.4% 16.1% (+/- 4.0) 18 31.6%North Dakota 31% (+/-1.5) 14 67.6% (+/-1.6) 8.9% (+/-0.8) 37 27.6% (+/-1.5)* 16 29.7% (+/-1.4) 40 North Dakota 13.5 (+/- 1.8) 15.1 (+/- 1.8) 24.7 (+/- 2.5) 13.1% 15.4% (+/- 3.8) 20 30.4%Ohio 30.4% (+/-1.2) 16 65.1% (+/-1.4) 10.4% (+/-0.7)V 19 28.5% (+/-1.3)* 11 33.5% (+/-1.2) 17 Ohio 13.0 (+/- 2.4) 15.9 (+/- 2.0) 25.9 (+/- 3.7) 12.4% 17.4% (+/- 3.7) 14 28.5%Oklahoma 32.5% (+/-1.4) 7 67.9% (+/-1.4) 11% (+/-0.8) 11 33% (+/-1.4)* 4 37.5% (+/-1.3) 9 Oklahoma 11.8 (+/- 2.0) 15.3 (+/- 2.4) 38.5 (+/- 3.4) N/A 17.4% (+/- 3.6) 14 34.9%Oregon 26.5% (+/-1.6) 36 59.9% (+/-1.7) 9.2% (+/-0.9) 32 18.5% (+/-1.5)* 50 31.8% (+/-1.5) 24 Oregon N/A N/A N/A 14.9% 9.9% (+/- 2.8) 51 28.5%Pennsylvania 30% (+/-1.2) 19 64.5% (+/-1.2) 10.1% (+/-0.7) 22 26.3% (+/-1.1)* 24 33.7% (+/-1.1) 16 Pennsylvania N/A N/A N/A 12.2%* 13.5% (+/- 3.5) 36 27.0%Rhode Island 27.3% (+/-1.5) 31 64.6% (+/-1.7) 9.3% (+/-0.9) 30 26.9% (+/-1.6)* 18 33.8% (+/-1.5) 15 Rhode Island 10.7 (+/- 1.3) 16.2 (+/- 2.5) 23.2 (+/- 3.8) 16.6% 13.2% (+/- 3.3) 41 25.2%South Carolina 31.7% (+/-1.3) 10 66.5% (+/-1.3) 12.5% (+/-0.8) 4 26.9% (+/-1.2)* 18 38.4% (+/-1.3) 8 South Carolina 13.9 (+/- 2.5) 16.8 (+/- 2.1) 23.8 (+/- 3.0) N/A 21.5% (+/- 4.1) 2 30.3%South Dakota 29.9% (+/-1.9) 21 67% (+/-1.9) 9.1% (+/-1) 36 23.8% (+/-1.7) 34 30.7% (+/-1.8) 32 South Dakota 11.9 (+/- 2.3) 13.2 (+/- 1.6) 27.7 (+/- 2.5) 15.2%V 13.4% (+/- 3.3) 38 30.2%Tennessee 33.7% (+/-1.8)* 4 68.4% (+/-1.8)* 12.2% (+/-1.1) 5 37.2% (+/-1.9)* 2 38.8% (+/-1.8) 6 Tennessee 16.9 (+/- 1.9) 15.4 (+/- 2.3) 25.4 (+/- 3.1) 14.2%* 20.5% (+/- 4.2) 5 34.5%Texas 30.9% (+/-1.4) 15 66.1% (+/-1.5) 10.9% (+/-0.9) 13 30.1% (+/-1.5)* 10 31.2% (+/-1.3) 29 Texas 15.7 (+/- 1.9) 15.6 (+/- 1.6) 30.0 (+/- 2.4) N/A 19.1% (+/- 4.5) 10 29.0%Utah 24.1% (+/-1) 46 59.2% (+/-1.2) 7.1% (+/-0.5) 49 20.6% (+/-1)* 46 24.2% (+/-0.9) 51 Utah 6.4 (+/- 1.9) 11.0 (+/- 2.2) 19.7 (+/- 2.7) N/A 11.6% (+/- 3.3) 43 18.1%Vermont 24.7% (+/-1.4) 44 61.9% (+/-1.6) 7.8% (+/-0.8) 45 20.5% (+/-1.3)* 47 31.1% (+/-1.4) 30 Vermont 13.2 (+/- 2.1) 15.8 (+/- 1.0) 25.4 (+/- 1.9) 12.9% 11.3% (+/- 2.7) 45 33.3%Virginia 27.2% (+/-1.3) 32 64% (+/-1.5) 9.8% (+/-0.8) 24 25.5% (+/-1.3)* 25 32.5% (+/-1.3) 21 Virginia 12.0 (+/- 1.3) 14.7 (+/- 1.4) 23.8 (+/- 1.6) N/A 14.3% (+/- 3.6) 28 26.1%Washington 27.2% (+/-1.2) 32 61.4% (+/-1.3) 8.6% (+/-0.6) 38 20% (+/-1.1) 48 30.4% (+/-1.1) 35 Washington N/A N/A N/A 14.0%V 11.0% (+/- 3.1) 46 28.5%West Virginia 35.1% (+/-1.5) 1 68.8% (+/-1.5) 13% (+/-0.9) 2 31.4% (+/-1.4) 7 41% (+/-1.5) 1 West Virginia 15.6 (+/- 2.3) 15.5 (+/- 2.0) 31.0 (+/- 2.4) 14.0% 18.5% (+/- 3.4) 13 34.1%Wisconsin 29.8% (+/-1.8) 22 66.5% (+/-1.9) 8.2% (+/-1) 44 23.8% (+/-1.7)* 34 32.3% (+/-1.7) 22 Wisconsin 11.6 (+/- 2.1) 13.0 (+/- 1.2) 24.0 (+/- 2.3) 14.0% 13.4% (+/- 3.1) 38 28.3%Wyoming 27.8% (+/-1.6)* 30 64.4% (+/-1.8) 8.6% (+/-0.8) 38 25.1% (+/-1.6)* 29 28.7% (+/-1.4) 45 Wyoming 10.7 (+/- 1.4) 12.8 (+/- 1.2) 28.2 (+/- 2.0) N/A 10.7% (+/- 4.2) 48 30.2%
Source: Youth Risk Behavior Survey (YRBS) 2013, CDC. YRBS data are collected every 2 years. Percent-ages are as reported on the CDC website and can be found at <http://www.cdc.gov/HealthyYouth/yrbs/index.htm>. Note that previous YRBS reports used the term "overweight" to describe youth with a BMI at or above the 95th percentile for age and sex and "at risk for overweight" for those with a BMI at or above the 85th percentile, but below the 95th percentile. However, this report uses the terms "obese" and "overweight" based on the 2007 recommendations from the Expert Committee on the Assessment, Prevention, and Treatment of Child and Adolescent Overweight and Obesity convened by the American Medical Association. "Physically active at least 60 minutes on all 7 days" means that the student did any kind of physical activity that increased their heart rate and made them breathe hard some of the time for a total of least 60 minutes per day on each of the 7 days before the survey.
Source: National Survey of Children's Health, 2011. Health Resources and Services Administration, Maternal and Child Health Bureau. * & red indicates a statistically significant increase and V & green indicates a statistically significant decrease (p<0.05) from 2007 to 2011. Over the same time period, SC had a statistically significant increase in obesity rates, while NJ saw a significant decrease.
Source: CDC. Obesity Among Low-Income, Preschool-Aged Children—United States, 2008-2011. Vital Signs, 62(Early Release): 1-6, 2013. http://www.cdc.gov/mmwr/preview/mmwrhtml/mm62e0806a1.htm. Red and * indicates a statistically significant increase and green and V indicates a statistically significant de-crease from 2008-2011.

12 TFAH • RWJF • StateofObesity.org
OBESITY RATES BY AGE AND ETHNICITY— 2013Obesity Rates by Age Obesity Rates by Ethnicity
18-25 Years Old 26-44 Years Old 45-64 Years Old 65+ Years Old Obesity among Blacks
Obesity among Latinos
Obesity among Whites
2013 Percentage (95% Conf Interval)
Rank2013 Percentage
(95% Conf Interval)
Rank2013 Percentage
(95% Conf Interval)
Rank2013 Percentage
(95% Conf Interval)
Rank2013 Percentage
(95% Conf Interval)
Rank2013 Percentage
(95% Conf Interval)
Rank2013 Percentage
(95% Conf Interval)
Rank
Alabama 20.6% (+/-2.7) 5 34.4% (+/-1.9) 5 38.6% (+/-1.4) 4 27.5% (+/-1.3) 14 41.8% (+/-1.9) 7 27.3% (+/-8.6) 38 29.8% (+/-1) 11Alaska 15.4% (+/-3) 28 27.4% (+/-2.1) 37 31.7% (+/-1.8) 30 28.8% (+/-2.7) 7 37.9% (+/-9.4) 21 28.4% (+/-6.8) 32 26.1% (+/-1.3) 32Arizona 18.9% (+/-3.6) 9 26.7% (+/-2.5) 40 30.3% (+/-2) 38 22.6% (+/-1.8) 44 32.5% (+/-7.5) 38 33.8% (+/-3.4) 8 22% (+/-1.2) 48Arkansas 26.2% (+/-3.9) 1 36.5% (+/-2.4) 3 38% (+/-1.7) 5 26.2% (+/-1.5) 26 42.2% (+/-3.5) 4 34.3% (+/-6.4) 7 32% (+/-1.3) 2California 13.9% (+/-1.5) 41 25.5% (+/-1.1) 43 29.3% (+/-1) 45 21.5% (+/-1.1) 47 34.8% (+/-3.1) 31 30.7% (+/-1.2) 21 22.4% (+/-0.7) 45Colorado 11.4% (+/-1.6) 50 21.6% (+/-1.1) 50 24.6% (+/-0.9) 51 19.4% (+/-1) 50 30.5% (+/-4.1) 40 28% (+/-1.8) 35 18.8% (+/-0.6) 50Connecticut 14.1% (+/-2.7) 40 26.3% (+/-1.6) 41 27.9% (+/-1.3) 48 25.5% (+/-1.4) 35 33.2% (+/-3.3) 36 32.5% (+/-3.1) 13 23.5% (+/-0.9) 43Delaware 14.6% (+/-2.8) 35 29.4% (+/-2.1) 24 34.7% (+/-1.7) 19 28.4% (+/-1.6) 11 37.3% (+/-2) 24 29.2% (+/-5.3) 30 27.4% (+/-1.1) 23D.C. 11.3% (+/-3.4) 51 21.1% (+/-2) 51 31.6% (+/-1.9) 31 23% (+/-1.8) 43 35.6% (+/-2) 28 18.5% (+/-5) 51 10% (+/-1.2) 51Florida 13.8% (+/-2.1) 42 27.7% (+/-1.6) 35 31.3% (+/-1.3) 33 23.7% (+/-1.1) 41 34.8% (+/-2.6) 31 26.4% (+/-2.1) 43 24.5% (+/-0.8) 38Georgia 17.8% (+/-2.5) 15 30.2% (+/-1.7) 20 34.7% (+/-1.3) 19 25.8% (+/-1.4) 32 37.2% (+/-1.9) 25 28.1% (+/-4) 34 26.2% (+/-1) 30Hawaii 15.3% (+/-2.3) 29 26.9% (+/-1.7) 39 25.2% (+/-1.4) 50 15.7% (+/-1.3) 51 41.1% (+/-11.2) 8 29.4% (+/-3.5) 29 19.3% (+/-1.5) 49Idaho 15.9% (+/-3) 24 28.2% (+/-2.1) 32 33.1% (+/-1.7) 28 27.1% (+/-1.7) 16 N/A N/A 35.3% (+/-4.9) 5 26.8% (+/-1.1) 26Illinois 13.8% (+/-2.6) 42 28.5% (+/-2) 28 34% (+/-1.6) 25 28.5% (+/-1.7) 9 38.7% (+/-3.5) 16 29.9% (+/-3.7) 24 27% (+/-1) 25Indiana 20.4% (+/-2.3) 6 31.8% (+/-1.5) 11 37.1% (+/-1.2) 7 28.9% (+/-1.2) 6 42.5% (+/-3.2) 3 33.2% (+/-4.3) 11 30.1% (+/-0.8) 8Iowa 17.2% (+/-2.3) 19 30.9% (+/-1.6) 16 35.9% (+/-1.2) 15 29.5% (+/-1.2) 4 39.5% (+/-7.1) 12 37.6% (+/-5.3) 1 30.1% (+/-0.8) 8Kansas 18.5% (+/-1.6) 11 31.8% (+/-1.1) 11 35.1% (+/-0.8) 16 26.1% (+/-0.8) 27 39.2% (+/-3) 15 33.5% (+/-2.7) 10 29.2% (+/-0.5) 13Kentucky 19.4% (+/-2.5) 7 33.1% (+/-1.6) 10 37.1% (+/-1.3) 7 28% (+/-1.4) 13 42% (+/-4) 5 24.5% (+/-6.6) 48 31% (+/-0.8) 3Louisiana 17.3% (+/-2.6) 17 36.9% (+/-2.1) 2 39.9% (+/-1.5) 1 30.5% (+/-1.5) 1 41.9% (+/-2.1) 6 32.6% (+/-7) 12 30.4% (+/-1.2) 6Maine 15.3% (+/-2.1) 29 29.7% (+/-1.5) 22 33% (+/-1) 29 25.9% (+/-1.1) 30 N/A N/A 24.2% (+/-6.8) 49 28.5% (+/-0.7) 19Maryland 15.1% (+/-2.4) 32 28.4% (+/-1.5) 31 33.7% (+/-1.2) 27 26.4% (+/-1.3) 24 37.5% (+/-1.7) 23 25.9% (+/-3.9) 45 25.3% (+/-0.8) 36Massachusetts 13.1% (+/-1.6) 47 22.4% (+/-1.1) 49 28% (+/-0.9) 47 23.1% (+/-1.1) 42 33.6% (+/-2.9) 35 31% (+/-2.2) 19 22.4% (+/-0.6) 45Michigan 18.1% (+/-1.9) 12 33.2% (+/-1.5) 9 36.1% (+/-1.1) 13 29.7% (+/-1.2) 2 39.3% (+/-2.4) 14 35.4% (+/-4.7) 3 30.1% (+/-0.8) 8Minnesota 14.4% (+/-1.8) 36 26% (+/-1.3) 42 30.2% (+/-1.1) 40 25% (+/-1.4) 38 29.8% (+/-3.9) 42 30.5% (+/-4.6) 22 25.5% (+/-0.7) 34Mississippi 25.1% (+/-2.8) 2 37.8% (+/-1.8) 1 39.9% (+/-1.3) 1 28.4% (+/-1.3) 11 42.9% (+/-1.7) 1 28.2% (+/-7) 33 30.7% (+/-1.1) 5Missouri 18% (+/-2.7) 13 30.7% (+/-1.9) 17 36.4% (+/-1.5) 11 27% (+/-1.5) 18 40% (+/-3.5) 11 33.6% (+/-7.3) 9 28.8% (+/-1) 15Montana 14.2% (+/-2) 37 24.9% (+/-1.5) 45 29.4% (+/-1.2) 43 22.6% (+/-1.2) 44 N/A N/A 29.6% (+/-6.1) 28 23.4% (+/-0.7) 44Nebraska 15.8% (+/-1.5) 26 30% (+/-1.1) 21 34.5% (+/-0.9) 22 27.4% (+/-0.9) 15 33.7% (+/-3.9) 34 30.4% (+/-2.7) 23 28.6% (+/-0.6) 17Nevada 13.8% (+/-2.9) 42 28.5% (+/-2.3) 28 29.4% (+/-2.1) 43 22.5% (+/-2.2) 46 34.9% (+/-5.4) 30 27.3% (+/-3.2) 38 24.7% (+/-1.3) 37New Hampshire 14.2% (+/-2.9) 37 28.6% (+/-1.8) 27 30.4% (+/-1.3) 37 25.6% (+/-1.3) 34 27.7% (+/-11.3) 43 24.7% (+/-8.3) 47 27.1% (+/-0.9) 24New Jersey 13.3% (+/-1.9) 46 24.8% (+/-1.2) 46 28.6% (+/-1) 46 26.1% (+/-1.2) 27 34.5% (+/-2) 33 27.5% (+/-1.8) 36 24.4% (+/-0.8) 40New Mexico 17.9% (+/-2.2) 14 30.5% (+/-1.5) 18 30.3% (+/-1.1) 38 20.3% (+/-1.2) 49 30.1% (+/-6.8) 41 29.8% (+/-1.2) 25 22.2% (+/-0.9) 47New York 11.7% (+/-2) 49 24.2% (+/-1.5) 48 29.6% (+/-1.3) 42 25.8% (+/-1.7) 32 32.7% (+/-2.7) 37 27.3% (+/-2.3) 38 23.6% (+/-0.9) 42North Carolina 19.1% (+/-2.3) 8 30.4% (+/-1.4) 19 34.6% (+/-1.2) 21 25.9% (+/-1.2) 30 40.4% (+/-1.9) 9 27% (+/-3.1) 42 26.6% (+/-0.9) 27North Dakota 16.3% (+/-2.6) 23 31.5% (+/-1.9) 14 36.2% (+/-1.5) 12 27.1% (+/-1.5) 16 24.7% (+/-11) 46 36.2% (+/-9) 2 29.1% (+/-0.9) 14Ohio 16.7% (+/-2.2) 21 31.2% (+/-1.4) 15 35.1% (+/-1.1) 16 28.7% (+/-1.2) 8 36% (+/-2.5) 27 30.9% (+/-5.5) 20 29.4% (+/-0.8) 12Oklahoma 23.8% (+/-2.8) 4 33.5% (+/-1.5) 8 36.9% (+/-1.2) 10 26.7% (+/-1.2) 21 38.7% (+/-3.6) 16 31.3% (+/-3.5) 17 31% (+/-0.9) 3Oregon 13.5% (+/-2.5) 45 28.8% (+/-1.9) 26 31.2% (+/-1.5) 34 25.4% (+/-1.4) 36 39.5% (+/-11) 12 31.2% (+/-4.6) 18 26.2% (+/-0.9) 30Pennsylvania 17.3% (+/-1.9) 17 29.4% (+/-1.3) 24 33.8% (+/-1.1) 26 29.1% (+/-1.1) 5 35.6% (+/-2.4) 28 34.8% (+/-3.9) 6 28.7% (+/-0.7) 16Rhode Island 15.1% (+/-2.8) 32 28.5% (+/-1.8) 28 30% (+/-1.3) 41 24.5% (+/-1.4) 40 31.4% (+/-4.9) 39 27.5% (+/-3.2) 36 25.9% (+/-1) 33South Carolina 18.8% (+/-2.1) 10 34.3% (+/-1.5) 6 37% (+/-1.2) 9 26.4% (+/-1.2) 24 42.6% (+/-1.5) 2 29.7% (+/-5.2) 26 27.5% (+/-0.8) 21South Dakota 16.9% (+/-2.7) 20 29.6% (+/-2) 23 34.1% (+/-1.8) 24 27% (+/-1.9) 18 26.1% (+/-12.7) 44 31.5% (+/-7.7) 16 28.1% (+/-1.1) 20Tennessee 16.4% (+/-3.4) 22 33.8% (+/-2.3) 7 37.7% (+/-1.8) 6 26.6% (+/-1.7) 23 40.4% (+/-3.5) 9 25.6% (+/-9.4) 46 30.2% (+/-1.2) 7Texas 17.7% (+/-2.1) 16 31.8% (+/-1.4) 11 36% (+/-1.4) 14 27% (+/-1.4) 18 38.2% (+/-2.9) 20 35.4% (+/-1.6) 3 26.5% (+/-1) 28Utah 12.8% (+/-1.4) 48 24.5% (+/-1) 47 31% (+/-1) 35 25.2% (+/-1.2) 37 26% (+/-7.9) 45 26.1% (+/-2.3) 44 24.1% (+/-0.6) 41Vermont 14.8% (+/-2.6) 34 25.5% (+/-1.7) 43 27.7% (+/-1.2) 49 24.9% (+/-1.3) 39 20.2% (+/-11.5) 47 27.1% (+/-8.5) 41 24.5% (+/-0.8) 38Virginia 15.2% (+/-2.5) 31 27.3% (+/-1.6) 38 34.5% (+/-1.4) 22 26.7% (+/-1.5) 21 38.5% (+/-2.4) 18 24.1% (+/-4) 50 26.3% (+/-0.9) 29Washington 14.2% (+/-1.7) 37 27.8% (+/-1.3) 34 31.6% (+/-1) 31 26.1% (+/-1) 27 37.6% (+/-5) 22 29.7% (+/-2.8) 26 27.5% (+/-0.7) 21West Virginia 24.3% (+/-3.2) 3 36% (+/-1.8) 4 38.7% (+/-1.4) 3 28.5% (+/-1.5) 9 36.5% (+/-6.4) 26 32.1% (+/-8.6) 15 33.8% (+/-0.9) 1
Wisconsin 15.9% (+/-3.2) 24 28.2% (+/-2.1) 32 34.8% (+/-1.7) 18 29.7% (+/-2) 2 38.5% (+/-5.7) 18 32.4% (+/-8.1) 14 28.6% (+/-1.1) 17
Wyoming 15.5% (+/-2.9) 27 27.7% (+/-1.9) 35 30.6% (+/-1.5) 36 21.5% (+/-1.4) 47 N/A N/A 29.2% (+/-4.5) 30 25.5% (+/-1) 34

13 TFAH • RWJF • StateofObesity.org
STATES WITH THE HIGHEST OBESITY RATES
Rank StatePercentage of Adult Obesity
(Based on 2013 Data, Including Confidence Intervals)
1 Mississippi 35.1% (+/-1.6)1 (tie) West Virginia 35.1% (+/-1.5)
3 Arkansas 34.6% (+/-1.9)4 Tennessee 33.7% (+/-1.8)5 Kentucky 33.2% (+/-1.4)6 Louisiana 33.1% (+/-2.1)7 Oklahoma 32.5% (+/-1.4)8 Alabama 32.4% (+/-1.7)9 Indiana 31.8% (+/-1.2)10 South Carolina 31.7% (+/-1.3)
STATES WITH THE LOWEST OBESITY RATES
Rank StatePercentage of Adult Obesity
(Based on 2013 Data, Including Confidence Intervals)
51 Colorado 21.3% (+/-0.9)50 Hawaii 21.8% (+/-1.4)49 D.C. 22.9% (+/-1.9)48 Massachusetts 23.6% (+/-1.1)
46 (tie) California 24.1% (+/-1.1)46 (tie) Utah 24.1% (+/-1)
45 Montana 24.6% (+/-1.2)44 Vermont 24.7% (+/-1.4)43 Connecticut 25% (+/-1.5)42 New York 25.4% (+/-1.2)
Note: For rankings, 1 = Highest rate of obesity. Note: For rankings, 51 = Lowest rate of obesity.
DC
WA
NV
AZ
CO
NE
ND
MN
WI
IL
KY VA
NY
HI
MDDC
DENJ
NH
VT
MA
RICT
NC
LA
AR
MS AL
SD
KS MO
TN
GASC
FL
IN OH
WV
PA
ME
MIIA
OK
TX
NM
ORID
MT
WY
UT
AK
CA
Obesity Rates for Baby Boomers (45-to 64-year-olds)
DC
WA
NV
AZ
CO
NE
ND
MN
WI
IL
KY VA
NY
HI
MDDE
NJ
NH
VT
MA
RICT
NC
LA
AR
MS AL
SD
KS MO
TN
GASC
FL
IN OH
WV
PA
ME
MIIA
OK
TX
NM
ORID
MT
WY
UT
AK
CA
Obesity Rates for Seniors (65-+ year-olds)
DC
WA
NV
AZ
CO
NE
ND
MN
WI
IL
KY VA
NY
HI
MDDC
DENJ
NH
VT
MA
RICT
NC
LA
AR
MS AL
SD
KS MO
TN
GASC
FL
IN OH
WV
PA
ME
MIIA
OK
TX
NM
ORID
MT
WY
UT
AK
CA
Obesity Rates for Young Adults (18- to 25-year-olds)
n <15%
n >15% & <20%
n >20% & <25%
n >25% <30%
n >30% <35%
n >35% <40%
n >40%

14 TFAH • RWJF • StateofObesity.org
PAST OBESITY TRENDS AMONG U.S. ADULTS
BRFSS: 1991, 1993 to 1995, 1998 to 2000, and
2005 to 2007 Combined Data
(BMI >30, or about 30lbs overweight for 5’4” person)
WA
NV
AZ
CO
NE
ND
MN
WI
IL
KY VA
NY
HI
MD DC
DE NJ
NH
VT
MA
RI CT
NC
LA
AR
MS AL
SD
KS MO
TN
GASC
FL
IN OH
WV
PA
ME
MI IA
OK
TX
NM
ORID
MT
WY
UT
AK
CA
1991
WA
NV
AZ
CO
NE
ND
MN
WI
IL
KY VA
NY
HI
MD DC
DE NJ
NH
VT
MA
RI CT
NC
LA
AR
MS AL
SD
KS MO
TN
GASC
FL
IN OH
WV
PA
ME
MI IA
OK
TX
NM
ORID
MT
WY
UT
AK
CA
1993–1995 Combined Data
WA
NV
AZ
CO
NE
ND
MN
WI
IL
KY VA
NY
HI
MD DC
DE NJ
NH
VT
MA
RI CT
NC
LA
AR
MS AL
SD
KS MO
TN
GASC
FL
IN OH
WV
PA
ME
MI IA
OK
TX
NM
ORID
MT
WY
UT
AK
CA
1998 to 2000 Combined Data
WA
NV
AZ
CO
NE
ND
MN
WI
IL
KY VA
NY
HI
MD DC
DE NJ
NH
VT
MA
RI CT
NC
LA
AR
MS AL
SD
KS MO
TN
GASC
FL
IN OH
WV
PA
ME
MI IA
OK
TX
NM
ORID
MT
WY
UT
AK
CA
2005 to 2007 Combined Data
n No Data
n <10%
n >10% & <15%
n >15% & <20%
n >20% <25%
n >25% <30%
n >30%

15 TFAH • RWJF • StateofObesity.org
RATES AND RANKINGS METHODOLOGY11
The analysis in The State of Obesity
compares data from the Behavioral Risk
Factor Surveillance System.
BRFSS is the largest ongoing telephone
health survey in the world. It is a
state-based system of health surveys
established by CDC in 1984. BRFSS
completes more than 400,000 adult
interviews each year. For most states,
BRFSS is the only source of population-
based health behavior data about chronic
disease prevalence and behavioral risk
factors.
BRFSS surveys a sample of adults in
each state to get information on health
risks and behaviors, health practices for
preventing disease and healthcare access
mostly linked to chronic disease and
injury. The sample is representative of the
population of each state.
Washington, D.C., is included in the
rankings because CDC provides funds
to the city to conduct a survey in an
equivalent way to the states.
The data are based on telephone surveys
by state health departments, with
assistance from the CDC. Surveys ask
people to report their weight and height,
which is used to calculate BMI. Experts
say rates of overweight and obesity are
probably slightly higher than shown by the
data because people tend to underreport
their weight and exaggerate their height.22
BRFSS made two changes in methodology
for its dataset starting in 2011 to make
the data more representative of the total
population. The changes included making
survey calls to cell phone numbers and
adopting a new weighting method:
l The first change is including and then
growing the number of interview calls
made to cell phone numbers. Estimates
today are that three in 10 U.S.
households have only cell phones.
l The second is a statistical measurement
change, which involves the way the
data are weighted to better match the
demographics of the population in the
state.
The new methodology means the BRFSS
data will better represent lower-income
and racial and ethnic minorities, as well
as populations with lower levels of formal
education. Although generalizing is difficult
because of these variables, it is likely
that the changes in methods will result
in somewhat higher estimates for the
occurrence of behaviors that are more
common among younger adults and to
certain racial and ethnic groups.
The change in methodology makes direct
comparisons to data collected prior to
2011 difficult.
More information on the methodology is
available in Appendix A.
16 TFAH • RWJF • StateofObesity.org
DEFINITIONS OF OBESITY AND OVERWEIGHT
Obesity is defined as an excessively high
amount of body fat or adipose tissue in
relation to lean body mass.23,24 Overweight
refers to increased body weight in relation
to height, which is then compared to a
standard of acceptable weight.25 Body
mass index is a common measure
expressing the relationship (or ratio) of
weight to height. The equation is:
Adults with a BMI of 25 to 29.9
are considered overweight, while
individuals with a BMI of 30 or more
are considered obese.
For children, overweight is defined as
a BMI at or above the 85th percentile
and lower than the 95th percentile
for children of the same age and sex;
childhood obesity is defined as a BMI
at or above the 95th percentile for
children of the same age and sex; and
severe childhood obesity is defined as
a BMI greater than 120 percent of 95th
percentile for children of the same age
and sex.
BMI is considered an important measure
for understanding population trends. For
individuals, it is one of many factors
that should be considered in evaluating
healthy weight, along with waist size, body
fat composition, waist-to-hip ratio, blood
pressure, cholesterol level and blood sugar.26
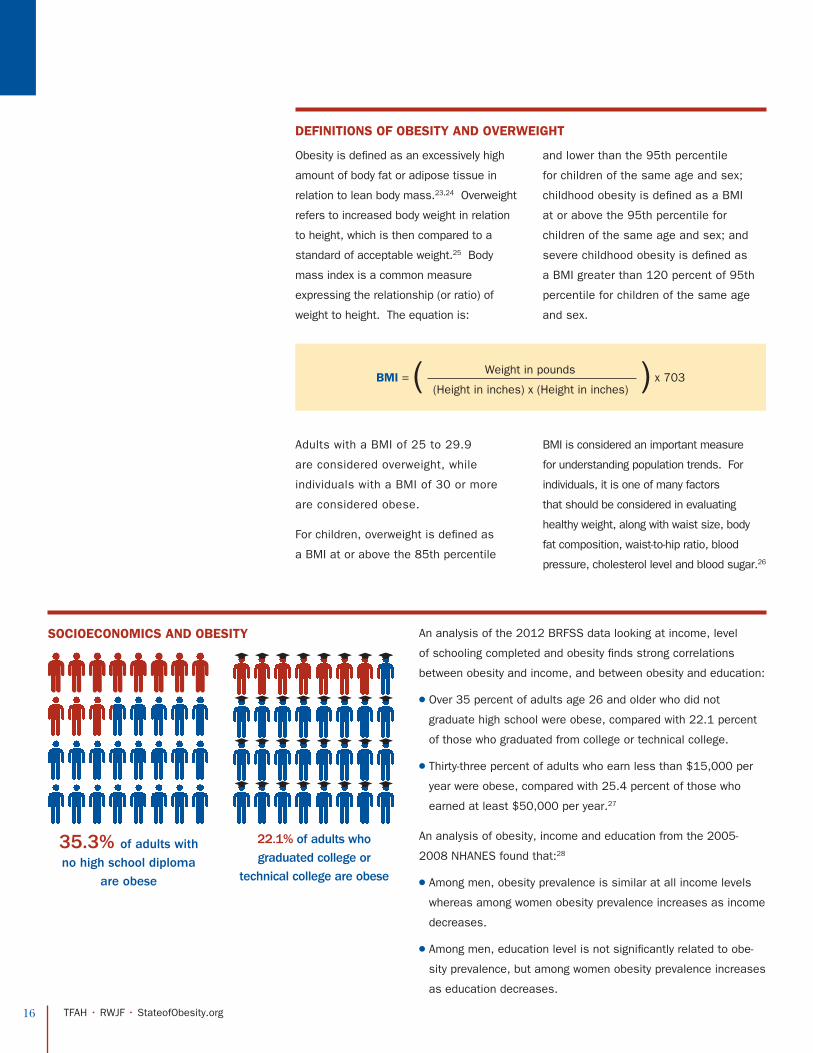
An analysis of the 2012 BRFSS data looking at income, level
of schooling completed and obesity finds strong correlations
between obesity and income, and between obesity and education:
l Over 35 percent of adults age 26 and older who did not
graduate high school were obese, compared with 22.1 percent
of those who graduated from college or technical college.
l Thirty-three percent of adults who earn less than $15,000 per
year were obese, compared with 25.4 percent of those who
earned at least $50,000 per year.27
An analysis of obesity, income and education from the 2005-
2008 NHANES found that:28
l Among men, obesity prevalence is similar at all income levels
whereas among women obesity prevalence increases as income
decreases.
l Among men, education level is not significantly related to obe-
sity prevalence, but among women obesity prevalence increases
as education decreases.
SOCIOECONOMICS AND OBESITY
35.3% of adults with no high school diploma
are obese
22.1% of adults who graduated college or
technical college are obese
BMI = ( Weight in pounds ) x 703
(Height in inches) x (Height in inches)

17 TFAH • RWJF • StateofObesity.org
B. CHILDHOOD AND YOUTH OBESITY AND OVERWEIGHT RATES
1. STUDY OF CHILDREN FROM LOW-INCOME FAMILIES (2011)
The Pediatric Nutrition Surveillance Survey (PedNSS), which
examines children between the ages of 2 and 5 from lower-
income families,29 found that 14.4 percent of this group
was obese in 2011, compared with 12.1 percent of all U.S.
children of a similar age.30 The data for PedNSS is based on
actual measurements rather than self-reported data.
The obesity rates increased from 1999
(12.7 percent) to 2011 (14.4 percent),
although rates have remained stable
since 2003. The highest obesity rates
were seen among American Indian and
Alaska Native children (20.8 percent)
and Latino children (17.5 percent).
From 2008 to 2011, 18 states out of the
40 states and D.C. that participate in the
survey and the U.S. Virgin Islands had a
statistically significant decrease, and only
three states increased during this time.
DC
WA
NV
AZ
CO
NE
ND
MN
WI
IL
KY VA
NY
HI
MD DC
DE NJ
NH
VT
MA
RI CT
NC
LA
AR
MS AL
SD
KS MO
TN
GASC
FL
IN OH
WV
PA
ME
MI IA
OK
TX
NM
ORID
MT
WY
UT
AK
CA
PedNSS 199831
DC
WA
NV
AZ
CO
NE
ND
MN
WI
IL
KY VA
NY
HI
MD DC
DE NJ
NH
VT
MA
RI CT
NC
LA
AR
MS AL
SD
KS MO
TN
GASC
FL
IN OH
WV
PA
ME
MI IA
OK
TX
NM
ORID
MT
WY
UT
AK
CA
PedNSS 2011
n No Data n <10% n >10% & <15% n >15%

18 TFAH • RWJF • StateofObesity.org
DC
WA
NV
AZ
CO
NE
ND
MN
WI
IL
KY VA
NY
HI
MD DC
DE NJ
NH
VT
MA
RI CT
NC
LA
AR
MS AL
SD
KS MO
TN
GASC
FL
IN OH
WV
PA
ME
MI IA
OK
TX
NM
ORID
MT
WY
UT
AK
CA
PROPORTION OF CHILDREN AGES 10 TO 17 CLASSIFIED AS OBESE BY STATE
Obese 10- to 17-Year-Olds, 2011 NSCH
n No Data n <10% n >10% & <15% n >15% & <20% n >20% <25%
n >25% <30% n >30%
2. STUDY OF CHILDREN AGES 10 TO 17 (2011)
The most recent data for childhood statistics on a state-by-
state level are from the 2011 National Survey of Children’s
Health (NSCH).32 According to the study, obesity rates
for children ages 10 to 17, defined as BMI greater than the
95th percentile for age group, ranged from a low of 9.9
percent in Oregon to a high of 21.7 percent in Mississippi.
Seven of the 10 states with the highest
rates of obese children are in the
South. Only two states had statistically
significant changes for rates of obese
children between the 2007 to 2011
surveys: South Carolina saw an increase
and New Jersey saw a decrease.
The NSCH study is based on a survey
of parents in each state. The data are
derived from parental reports, so they
are not as reliable as measured data,
such as NHANES and PedNSS, but
they are the only source of comparative
state-by-state data for children.
Source: National Survey on Children’s Health, 2011.

19 TFAH • RWJF • StateofObesity.org
STATES WITH THE HIGHEST RATES OF OBESE 10- TO 17-YEAR-OLDS
Rank States Percentage of Obese 10- to 17-year-olds (95 percent Confidence Intervals)
1 Mississippi 21.7% (+/- 4.4)2 South Carolina 21.5% (+/- 4.9)3 D.C. 21.4% (+/- 5.5)4 Louisiana 21.1% (+/- 4.0)5 Tennessee 20.5% (+/- 4.2)6 Arkansas 20.0% (+/- 4.2)7 Arizona 19.8% (+/- 4.6)8 Kentucky 19.7% (+/- 3.9)9 Illinois 19.3% (+/- 3.9)
10 Texas 19.1% (+/- 4.5)
STATES WITH THE LOWEST RATES OF OBESE 10- TO 17-YEAR-OLDS
Rank States Percentage of Obese 10- to 17-year-olds (95 percent Confidence Intervals)
51 Oregon 9.9% (+/- 2.8)50 New Jersey 10.0% (+/- 2.9)49 Idaho 10.6% (+/- 3.4)48 Wyoming 10.7% (+/- 4.2)47 Colorado 10.9% (+/- 3.6)46 Washington 11.0% (+/- 3.1)45 Vermont 11.3% (+/- 2.7)44 Hawaii 11.5% (+/- 2.6)43 Utah 11.6% (+/- 3.3)42 Maine 12.5% (+/- 3.0)
Note: For rankings, 1 = Highest rate of obesity.
Note: For rankings, 51 = Lowest rate of obesity.
Seven of the states with
the highest rates of obese
10- to 17-year-olds are
in the South.
© Matt Moyer, used with permission from RWJF

20 TFAH • RWJF • StateofObesity.org
3. STUDY OF HIGH SCHOOL STUDENTS (2013)
The Youth Risk Behavior Surveillance System (YRBSS) includes both national and state
surveys that provide data on adolescent obesity and overweight rates, most recently in
2013.33 The information from the YRBSS is based on self-reported information.
There was an increase from 1999 to
2013 in the prevalence of students
nationwide who were obese (10.6
percent to 13.7 percent) and who
were overweight (14.2 percent to 16.6
percent).35 Students also reported on
whether or not they participated in
at least 60 minutes of physical activity
every day of the week. The most recent
state surveys, conducted in 42 states,
found a wide range in the percentage
of high school students who were
physically active for at least 60 minutes
per day seven days a week, from a high
of 38.5 percent in Oklahoma to a low
of 19.7 percent in Utah, with a median
prevalence of 25.4 percent.
The latest state surveys also found
a range of obesity levels: a low of
6.4 percent in Utah to a high of
18.0 percent in Kentucky, with a
median prevalence of 12.4 percent.
Overweight prevalence among high
school students ranged from a low of
11.0 percent in Utah to a high of 17.1
percent in Georgia, with a median
prevalence of 14.9 percent.
PERCENTAGE OF HIGH SCHOOL STUDENTS WHO WERE OBESE —
Selected U.S. states, Youth Risk Behavior Surveillance System, 2013
WA
11
11
7
13
14MN
12
12
18 12
11
13
11149
11
13
101112
12
14
16
15 17
12
13 15
17
1314
12
15 13
16
PA
12
1313
12
16
13
OR 10
9
11
6
12
CA
n No Data n <10% n 10% – 14% n 15% – 19%
Source: YBRS. Trend maps from 2003 to 2013 are available at: http://www.cdc.gov/healthyyouth/
obesity/obesity-youth.htm.
According to the national survey,
13.7 percent of high school
students were obese, and 16.6
percent were overweight.34

21 TFAH • RWJF • StateofObesity.org
PERCENTAGE OF OBESE AND OVERWEIGHT U.S. HIGH SCHOOL STUDENTS BY SEX
Obese OverweightFemale 10.9% 16.6%Male 16.6% 16.5%Total 13.7% 16.6%
PERCENTAGE OF OBESE AND OVERWEIGHT U.S. HIGH SCHOOL STUDENTS BY RACE/ETHNICITY
Obese OverweightWhite* 13.1% 15.6%Black* 15.7% 19.1%Latino 15.2 % 18.3%Total** 13.7% 16.6%
Notes: CDC uses the term Hispanic in their analysis. *Non-Hispanic. **Other race/ethnicities are included in the total but are not presented separately.
PERCENTAGE OF OBESE AND OVERWEIGHT U.S. HIGH SCHOOL STUDENTS BY SEX AND RACE/ETHNICITY
Obese OverweightFemale Male Female Male
White* 9.7% 16.5% 14.3% 16.9%Black* 16.7% 14.8% 22.8% 15.2%Latino 11.4% 19.0% 19.2% 17.4%Total** 10.9% 16.6% 16.6% 16.5%
Notes: CDC uses the term Hispanic in their analysis. *Non-Hispanic. **Other race/ethnicities are included in the total but are not presented separately.
22 TFAH • RWJF • StateofObesity.org
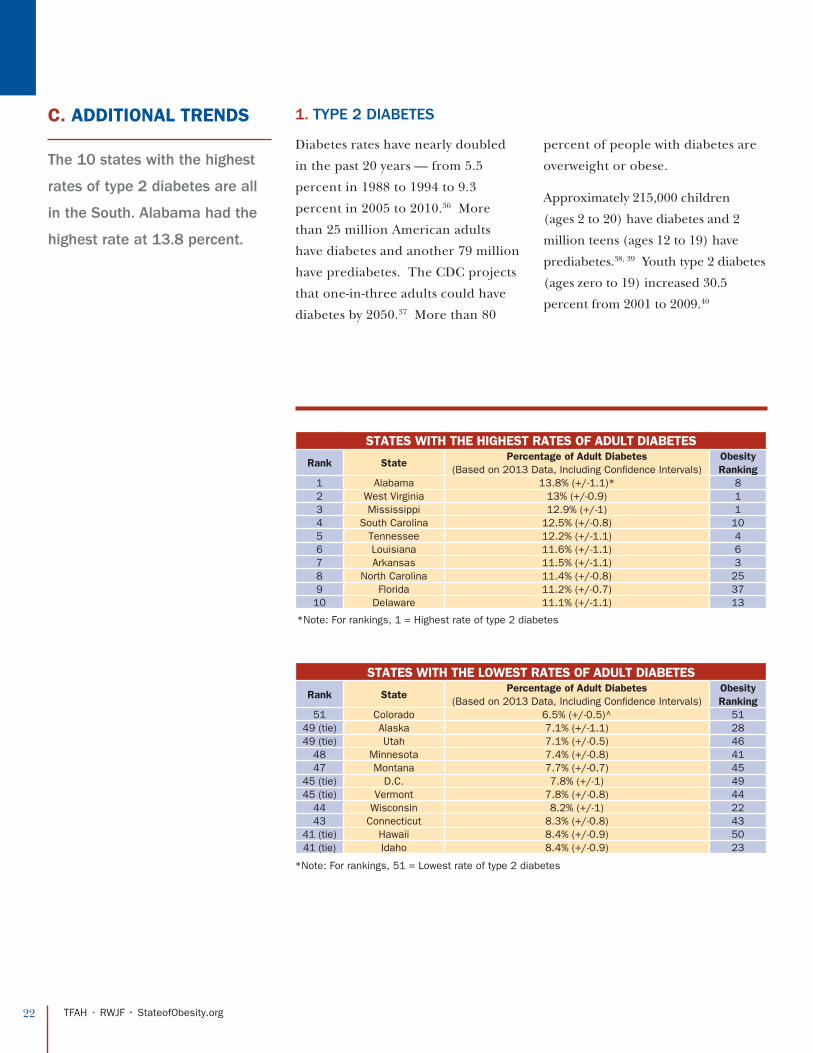
C. ADDITIONAL TRENDS 1. TYPE 2 DIABETES
Diabetes rates have nearly doubled
in the past 20 years — from 5.5
percent in 1988 to 1994 to 9.3
percent in 2005 to 2010.36 More
than 25 million American adults
have diabetes and another 79 million
have prediabetes. The CDC projects
that one-in-three adults could have
diabetes by 2050.37 More than 80
percent of people with diabetes are
overweight or obese.
Approximately 215,000 children
(ages 2 to 20) have diabetes and 2
million teens (ages 12 to 19) have
prediabetes.38, 39 Youth type 2 diabetes
(ages zero to 19) increased 30.5
percent from 2001 to 2009.40
*Note: For rankings, 1 = Highest rate of type 2 diabetes
*Note: For rankings, 51 = Lowest rate of type 2 diabetes
The 10 states with the highest
rates of type 2 diabetes are all
in the South. Alabama had the
highest rate at 13.8 percent.
STATES WITH THE HIGHEST RATES OF ADULT DIABETES
Rank StatePercentage of Adult Diabetes
(Based on 2013 Data, Including Confidence Intervals)Obesity Ranking
1 Alabama 13.8% (+/-1.1)* 82 West Virginia 13% (+/-0.9) 13 Mississippi 12.9% (+/-1) 14 South Carolina 12.5% (+/-0.8) 105 Tennessee 12.2% (+/-1.1) 46 Louisiana 11.6% (+/-1.1) 67 Arkansas 11.5% (+/-1.1) 38 North Carolina 11.4% (+/-0.8) 259 Florida 11.2% (+/-0.7) 37
10 Delaware 11.1% (+/-1.1) 13
STATES WITH THE LOWEST RATES OF ADULT DIABETES
Rank StatePercentage of Adult Diabetes
(Based on 2013 Data, Including Confidence Intervals)Obesity Ranking
51 Colorado 6.5% (+/-0.5)^ 5149 (tie) Alaska 7.1% (+/-1.1) 2849 (tie) Utah 7.1% (+/-0.5) 46
48 Minnesota 7.4% (+/-0.8) 4147 Montana 7.7% (+/-0.7) 45
45 (tie) D.C. 7.8% (+/-1) 4945 (tie) Vermont 7.8% (+/-0.8) 44
44 Wisconsin 8.2% (+/-1) 2243 Connecticut 8.3% (+/-0.8) 43
41 (tie) Hawaii 8.4% (+/-0.9) 5041 (tie) Idaho 8.4% (+/-0.9) 23

23 TFAH • RWJF • StateofObesity.org
2. HEART DISEASE AND HYPERTENSION
One in four Americans has some
form of cardiovascular disease.
Heart disease is the leading cause of
death — responsible for one in three
deaths — in the United States.41, 42
At least one out of every five U.S.
teens has abnormal cholesterol, a
major risk factor for heart disease
— among obese teens, 43 percent
(more than two in five) have
abnormal cholesterol.43
One in three adults has high blood
pressure, a leading cause of stroke.44
Approximately 30 percent of cases of
hypertension may be attributable to
obesity, and the figure may be as high
as 60 percent in men under age 45.45
People who are overweight are more
likely to have high blood pressure,
high levels of blood fats and high LDL
(bad cholesterol), which are all risk
factors for heart disease and stroke.46
*Note: For rankings, 51 = Lowest rate of hypertension.
*Note: For rankings, 1 = Highest rate of hypertension.
The 10 states with the highest
rates of hypertension are all in
the South. West Virginia had the
highest rate at 41 percent.
STATES WITH THE LOWEST RATES OF ADULT HYPERTENSION
Rank StatePercentage of Adult Hypertension
(Based on 2013 Data, Including Confidence Intervals)Obesity Ranking
51 Utah 24.2% (+/-0.9) 4650 Colorado 26.3% (+/-0.9) 5149 Minnesota 27% (+/-1.3) 4148 D.C. 28.4% (+/-1.8) 4947 Hawaii 28.5% (+/-1.5) 50
45 (tie) California 28.7% (+/-1.1) 4645 (tie) Wyoming 28.7% (+/-1.4) 30
44 Montana 29.3% (+/-1.2) 4542 (tie) Idaho 29.4% (+/-1.6) 2342 (tie) Massachusetts 29.4% (+/-1.1) 48
STATES WITH THE HIGHEST RATES OF ADULT HYPERTENSION
Rank StatePercentage of Adult Hypertension
(Based on 2013 Data, Including Confidence Intervals)Obesity Ranking
1 West Virginia 41% (+/-1.5) 12 Alabama 40.3% (+/-1.7) 83 Mississippi 40.2% (+/-1.6) 14 Louisiana 39.8% (+/-2) 65 Kentucky 39.1% (+/-1.4) 56 Tennessee 38.8% (+/-1.8) 47 Arkansas 38.7% (+/-1.9) 38 South Carolina 38.4% (+/-1.3) 109 Oklahoma 37.5% (+/-1.3) 7
10 Delaware 35.6% (+/-1.7) 13
24 TFAH • RWJF • StateofObesity.org
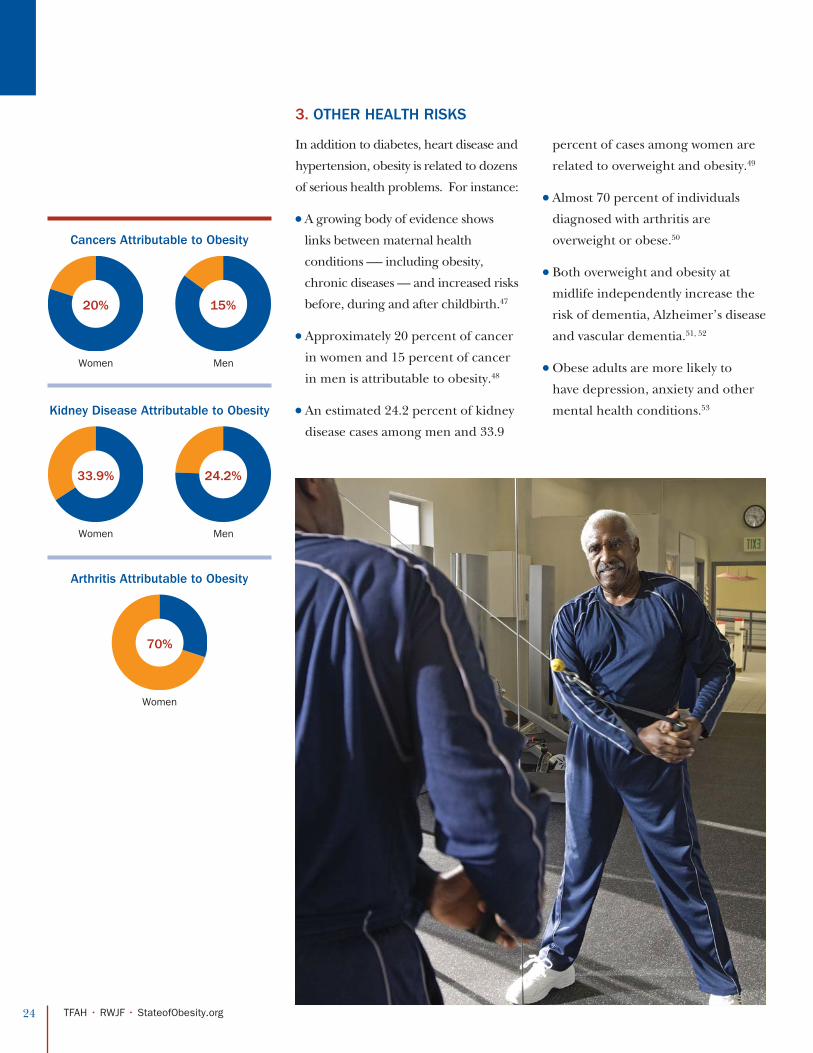
3. OTHER HEALTH RISKS
In addition to diabetes, heart disease and
hypertension, obesity is related to dozens
of serious health problems. For instance:
l A growing body of evidence shows
links between maternal health
conditions -— including obesity,
chronic diseases — and increased risks
before, during and after childbirth.47
l Approximately 20 percent of cancer
in women and 15 percent of cancer
in men is attributable to obesity.48
l An estimated 24.2 percent of kidney
disease cases among men and 33.9
percent of cases among women are
related to overweight and obesity.49
l Almost 70 percent of individuals
diagnosed with arthritis are
overweight or obese.50
l Both overweight and obesity at
midlife independently increase the
risk of dementia, Alzheimer’s disease
and vascular dementia.51, 52
l Obese adults are more likely to
have depression, anxiety and other
mental health conditions.53
Cancers Attributable to Obesity
Kidney Disease Attributable to Obesity
Arthritis Attributable to Obesity
Women
Women
Women
Men
Men
20%
33.9%
70%
15%
24.2%
25 TFAH • RWJF • StateofObesity.org
*Note: For rankings, 51 = Lowest rate of physical inactivity.
*Note: For rankings, 1 = Highest rate of physical inactivity.
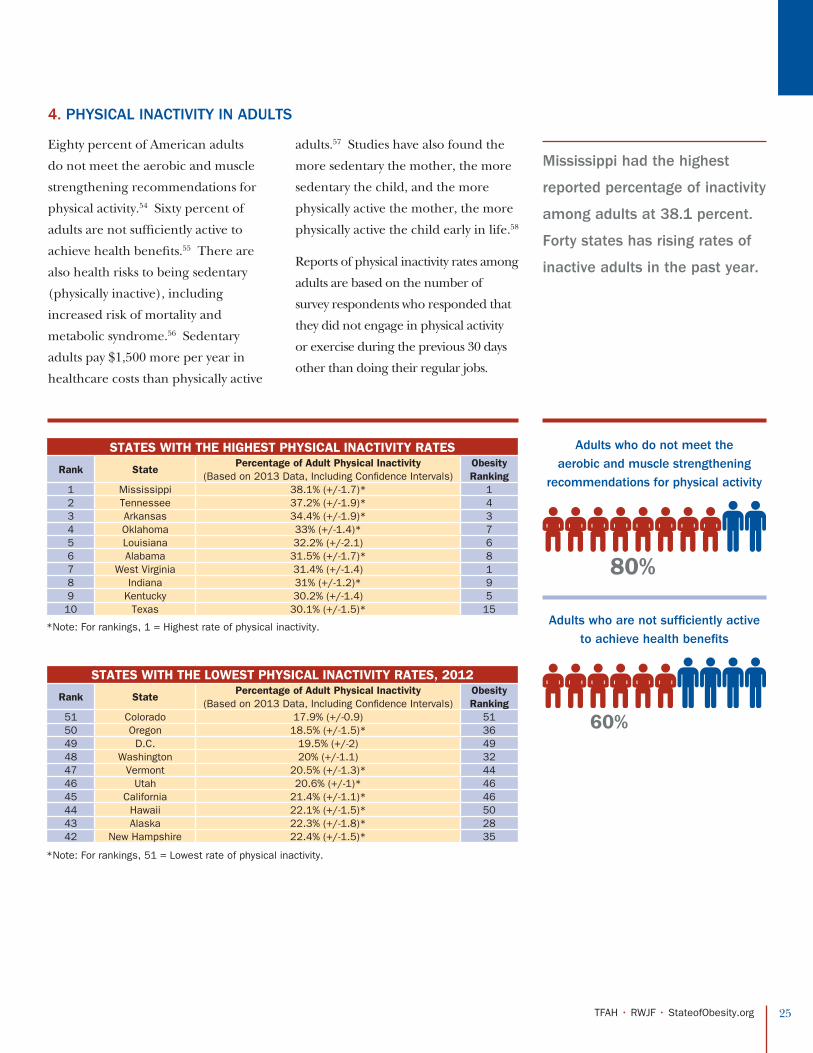
Mississippi had the highest
reported percentage of inactivity
among adults at 38.1 percent.
Forty states has rising rates of
inactive adults in the past year.
4. PHYSICAL INACTIVITY IN ADULTS
Eighty percent of American adults
do not meet the aerobic and muscle
strengthening recommendations for
physical activity.54 Sixty percent of
adults are not sufficiently active to
achieve health benefits.55 There are
also health risks to being sedentary
(physically inactive), including
increased risk of mortality and
metabolic syndrome.56 Sedentary
adults pay $1,500 more per year in
healthcare costs than physically active
adults.57 Studies have also found the
more sedentary the mother, the more
sedentary the child, and the more
physically active the mother, the more
physically active the child early in life.58
Reports of physical inactivity rates among
adults are based on the number of
survey respondents who responded that
they did not engage in physical activity
or exercise during the previous 30 days
other than doing their regular jobs.
STATES WITH THE LOWEST PHYSICAL INACTIVITY RATES, 2012
Rank StatePercentage of Adult Physical Inactivity
(Based on 2013 Data, Including Confidence Intervals)Obesity Ranking
51 Colorado 17.9% (+/-0.9) 5150 Oregon 18.5% (+/-1.5)* 3649 D.C. 19.5% (+/-2) 4948 Washington 20% (+/-1.1) 3247 Vermont 20.5% (+/-1.3)* 4446 Utah 20.6% (+/-1)* 4645 California 21.4% (+/-1.1)* 4644 Hawaii 22.1% (+/-1.5)* 5043 Alaska 22.3% (+/-1.8)* 2842 New Hampshire 22.4% (+/-1.5)* 35
STATES WITH THE HIGHEST PHYSICAL INACTIVITY RATES
Rank StatePercentage of Adult Physical Inactivity
(Based on 2013 Data, Including Confidence Intervals)Obesity Ranking
1 Mississippi 38.1% (+/-1.7)* 12 Tennessee 37.2% (+/-1.9)* 43 Arkansas 34.4% (+/-1.9)* 34 Oklahoma 33% (+/-1.4)* 75 Louisiana 32.2% (+/-2.1) 66 Alabama 31.5% (+/-1.7)* 87 West Virginia 31.4% (+/-1.4) 18 Indiana 31% (+/-1.2)* 99 Kentucky 30.2% (+/-1.4) 5
10 Texas 30.1% (+/-1.5)* 15
Adults who do not meet the aerobic and muscle strengthening
recommendations for physical activity
Adults who are not sufficiently active to achieve health benefits
80%
60%

26 TFAH • RWJF • StateofObesity.org
D. ADULT FRUIT AND VEGETABLE CONSUMPTION, 201159
The foods around us make it difficult to maintain a healthy
weight. Making healthy foods the easily available and
affordable option will improve our chances to achieve
and maintain a healthy weight.60 Diets high in fruits and
vegetables may reduce the risk of cancer and other chronic
diseases and also provide essential vitamins and minerals,
fiber and other nutrients that are important for good health.
Most fruits and vegetables are naturally low in fat and calories
and are filling.61 Increasing consumption of fruits and
vegetables is a necessary step to improving overall health.
Nationally, 37.7 percent of adults consume fruits less than one time a day and
22.6 consume vegetables less than one time a day.
© Lynn Johnson, used with permission from RWJF

National recommendations call for children and
adolescents to get at least 60 minutes of physical activity
per day, most of which should be moderate or vigorous in
intensity.62 The first U.S. report card on physical activity for
children and youth, which was released in April 2014 by the
National Physical Activity Plan Alliance and the American
College of Sports Medicine, found that only about a quarter
of children ages 6 to 15 meet that recommendation.63
According to the report, America earned a D- for overall
physical activity, a C- for school-based physical activity and
an F for active transportation, which primarily assessed the
percentage of youths who walk or bicycle to school.
Efforts to provide physical education
and increase physical activity often
focus on schools because that is where
school-age children spend a significant
portion of their day. There are a
number of types of physical activity
that schools can support as part of a
Comprehensive School Physical Activity
Program (CSPAP), which encompasses
physical education, interscholastic
sports, intermural sports and physical
activity clubs, classroom physical
activity breaks, before school access
to physical activity opportunities or
facilities, recess for elementary school
students, walking and biking to school,
sharing facilities with community
physical activity organizations, and
opening physical activity facilities to
families outside of school hours.
The Carol M. White Physical
Education Program (PEP), the only
federal funding stream for physical
education programs, provides
federal grants to school districts
and community organizations that
implement comprehensive physical
fitness and nutrition programs for
students designed to help reach
state physical education standards.
Authorized by the Elementary and
Secondary Education Act (ESEA),
$74.6 million was appropriated for
PEP in Fiscal Year (FY) 2014.64
The State of Obesity:
Obesity Policy Series
SECTION 2:
Physical Activity Before, During and After School
CURRENT STATUS:
PHYSIC
AL
AC
TIV
ITY B
EFO
RE
, DU
RIN
G A
ND
AFT
ER
SCH
OO
LSE
PT
EM
BE
R 2014

28 TFAH • RWJF • StateofObesity.org
While all 50 states have enacted physical education
standards or requirements, the scope of these laws and
the degree to which they are funded and enforced varies
significantly. Currently, no more than 5 percent of school
districts nationwide have a wellness policy that requires
the recommended amount of daily physical education
time,65 and children at highest risk for obesity are the
least likely to attend schools that offer recess.66
ESEA was last reauthorized in 2002
for five years; since 2007, Congress
has enacted temporary extensions
of the current law. In the interim,
proposals have included increasing
resources for PEP, providing funding
for schools to hire additional physical
education teachers and requiring
school boards to collect and publish
data on the extent to which they have
made progress in meeting national
physical education and physical
activity standards.
The Presidential Youth Fitness Program
provides a model for fitness education
that helps physical educators assess, track
and recognize youth fitness and physical
activity. The program provides resources
and tools for physical educators to
improve their current physical education
process, which includes:
l FITNESSGRAM® health-related
fitness assessment;
l Instructional strategies to promote
student physical activity and fitness;
l Communication tools to help
physical educators increase
awareness about their work in the
classroom; and
l Options to recognize fitness and
physical activity achievements.67
Hundreds of schools nationwide have
already received funding to help bring
Presidential Youth Fitness Program
resources to their schools.
Let’s Move! Active Schools is a
program that helps teachers,
principals, administrators and parents
create environments that enable
all students to get and stay active.
Schools that sign up for the program
are guided through a process that
helps them build a team, make a plan
and access free in-person trainings,
program materials and activation
grants, and direct, personal assistance
from certified professionals. Once
schools achieve their fitness goals,
they are publicly recognized and
celebrated for their achievement.68
The Presidential Youth Fitness
Program and Let’s Move!
Active Schools are two other
federal programs that help
schools improve students’
physical fitness.
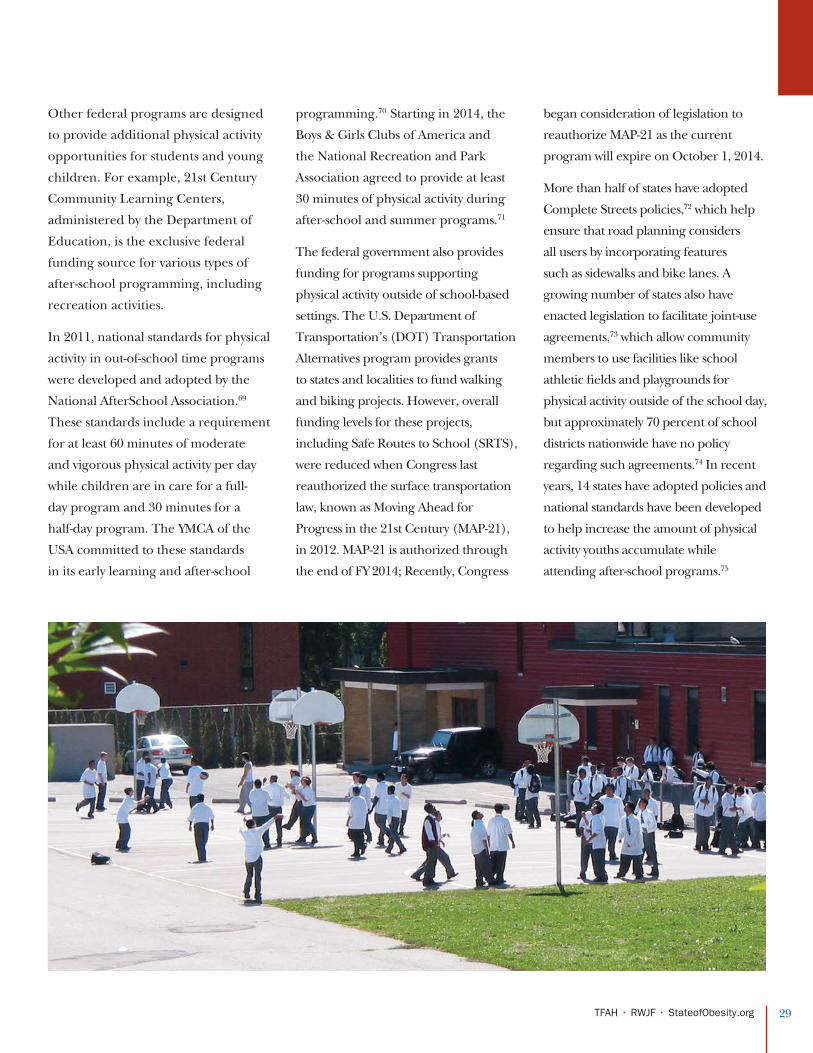
29 TFAH • RWJF • StateofObesity.org
Other federal programs are designed
to provide additional physical activity
opportunities for students and young
children. For example, 21st Century
Community Learning Centers,
administered by the Department of
Education, is the exclusive federal
funding source for various types of
after-school programming, including
recreation activities.
In 2011, national standards for physical
activity in out-of-school time programs
were developed and adopted by the
National AfterSchool Association.69
These standards include a requirement
for at least 60 minutes of moderate
and vigorous physical activity per day
while children are in care for a full-
day program and 30 minutes for a
half-day program. The YMCA of the
USA committed to these standards
in its early learning and after-school
programming.70 Starting in 2014, the
Boys & Girls Clubs of America and
the National Recreation and Park
Association agreed to provide at least
30 minutes of physical activity during
after-school and summer programs.71
The federal government also provides
funding for programs supporting
physical activity outside of school-based
settings. The U.S. Department of
Transportation’s (DOT) Transportation
Alternatives program provides grants
to states and localities to fund walking
and biking projects. However, overall
funding levels for these projects,
including Safe Routes to School (SRTS),
were reduced when Congress last
reauthorized the surface transportation
law, known as Moving Ahead for
Progress in the 21st Century (MAP-21),
in 2012. MAP-21 is authorized through
the end of FY 2014; Recently, Congress
began consideration of legislation to
reauthorize MAP-21 as the current
program will expire on October 1, 2014.
More than half of states have adopted
Complete Streets policies,72 which help
ensure that road planning considers
all users by incorporating features
such as sidewalks and bike lanes. A
growing number of states also have
enacted legislation to facilitate joint-use
agreements,73 which allow community
members to use facilities like school
athletic fields and playgrounds for
physical activity outside of the school day,
but approximately 70 percent of school
districts nationwide have no policy
regarding such agreements.74 In recent
years, 14 states have adopted policies and
national standards have been developed
to help increase the amount of physical
activity youths accumulate while
attending after-school programs.75
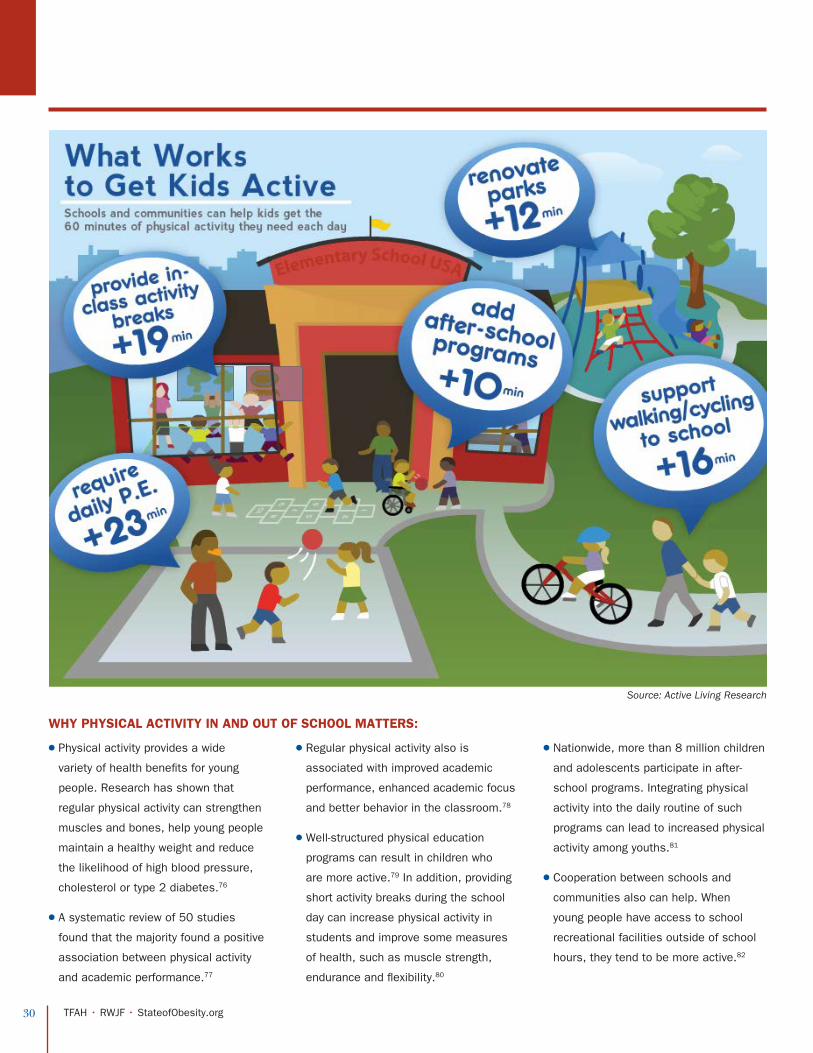
30 TFAH • RWJF • StateofObesity.org
WHY PHYSICAL ACTIVITY IN AND OUT OF SCHOOL MATTERS:
l Physical activity provides a wide
variety of health benefits for young
people. Research has shown that
regular physical activity can strengthen
muscles and bones, help young people
maintain a healthy weight and reduce
the likelihood of high blood pressure,
cholesterol or type 2 diabetes.76
l A systematic review of 50 studies
found that the majority found a positive
association between physical activity
and academic performance.77
l Regular physical activity also is
associated with improved academic
performance, enhanced academic focus
and better behavior in the classroom.78
l Well-structured physical education
programs can result in children who
are more active.79 In addition, providing
short activity breaks during the school
day can increase physical activity in
students and improve some measures
of health, such as muscle strength,
endurance and flexibility.80
l Nationwide, more than 8 million children
and adolescents participate in after-
school programs. Integrating physical
activity into the daily routine of such
programs can lead to increased physical
activity among youths.81
l Cooperation between schools and
communities also can help. When
young people have access to school
recreational facilities outside of school
hours, they tend to be more active.82
Source: Active Living Research
31 TFAH • RWJF • StateofObesity.org
l School districts, with support from federal, state and local governments, should provide
regular physical activity opportunities in schools and communities to help children and
adolescents be active for at least 60 minutes per day.
l Schools should conduct student fitness assessments to help assess rates of childhood obesity
and evaluate the extent to which physical education and/or physical activity programs help
students maintain or achieve a healthy weight.
l School wellness policies should address physical education and physical activity in
after-school and out-of-school programs, including school partnerships with nonprofit
organizations. Wellness programs also should consider the needs of faculty and staff, so
they can be role models for students and more healthy and productive educators.
l Schools and communities nationwide should prioritize joint-use agreements to provide
access to school facilities for recreational use outside of school hours.
l 21st Century Community Learning Centers and other after-school providers should adopt
the National AfterSchool Association’s Healthy Eating and Physical Activity standards.
Policy Recommendations:
ADDITIONAL RESOURCES:
Institute of Medicine: Educating the Student Body: Taking
Physical Activity and Physical Education to School:
http://www.iom.edu/Reports/2013/Educating-the-Student-Body-
Taking-Physical-Activity-and-Physical-Education-to-School.aspx
U.S. Department of Health and Human Services: Physical
Activity Guidelines for Americans Midcourse Report: Strategies
to Increase Physical Activity Among Youth:
http://www.health.gov/paguidelines/
Active Living Research: School Policies on Physical Education
and Physical Activity:
http://www.activelivingresearch.org/schoolpolicy
Active Living Research: Active Education: Physical
Education, Physical Activity and Academic Performance:
http://www.activelivingresearch.org/activeeducation
Active Living Research: Policies and Standards for
Promoting Physical Activity in After-School Programs:
http://www.activelivingresearch.org/afterschool
CDC’s Comprehensive School Physical Activity Programs:
A Guide for Schools.
http://www.cdc.gov/healthyyouth/physicalactivity/cspap.htm

32 TFAH • RWJF • StateofObesity.org
STATE SCHOOL-BASED PHYSICAL ACTIVITY AND HEALTH SCREENING LAWS
Physical Education and Activity
l Every state has some physical
education requirements for students.
However, these requirements are
often limited or not enforced, and
many programs are inadequate.83
Many states have started enacting laws
requiring schools to provide a certain
number of minutes and/or a specified
difficulty level of physical activity.
Twenty-one specifically require schools
to provide physical activity or recess
during the school day: Arizona, Colorado,
Connecticut, Hawaii, Illinois, Indiana, Iowa,
Kentucky, Louisiana, Maine, Mississippi,
Missouri, Nevada, New Hampshire, North
Carolina, North Dakota, Ohio, South
Carolina, Tennessee, Texas and Virginia.
Shared-use Agreements
l Twenty-eight states currently
have laws supporting shared use
of facilities, including: Alabama,
Arizona, Arkansas, California,
Delaware, Georgia, Hawaii, Idaho,
Indiana, Kansas, Kentucky,
Louisiana, Michigan, Minnesota,
Mississippi, Missouri, Nebraska,
North Carolina, North Dakota,
Oklahoma, South Carolina, South
Dakota, Tennessee, Texas,
Utah, Virginia, Washington and
Wisconsin.
Many communities do not have enough
safe and accessible places for people
to be physically active, indoors and out.
Schools often have gymnasiums,
playgrounds, tracks and fields, but they
are not accessible to the community.
Many schools keep their facilities closed
after school hours for fear of liability in
the event of an injury, vandalism and
the cost of maintenance and security.
Some states and communities have
laws encouraging or requiring schools
to make facilities available for use by
the community through shared- or joint-
use agreements.84 These agreements
allow school districts, local governments
and community-based organizations to
overcome common concerns, costs and
responsibilities that come along with
opening school property to the public
after hours.

33 TFAH • RWJF • StateofObesity.org
HEALTH ASSESSMENT AND HEALTH EDUCATION
Physical activity, nutrition and other factors impact the overall health of students. A number of states have instituted legislation
to conduct health assessments to help parents, schools and communities understand the health of children and teens, and
nearly every state requires some form of health education classes for students.
Health Assessments
l Twenty-one states currently
have legislation that requires
BMI screening or weight-related
assessments other than BMI.
l States with BMI screening
requirements: Arkansas, California*,
Florida, Illinois, Maine, Missouri,
New York, North Carolina, Ohio,
Oklahoma, Pennsylvania, Tennessee,
Vermont and West Virginia.
l States with other weight-related
screening requirements: Delaware,
Iowa, Louisiana, Massachusetts,
Nevada, South Carolina and Texas.
l As of July 2010, statewide distribu-
tion of diabetes risk information to
schoolchildren, California Education
Code § 49452.7, replaced individual
BMI reporting, California Education
Code § 49452.6.
BMI and other health assessments
are intended to help schools and
communities assess rates of childhood
obesity, educate parents and students
and serve as a means to evaluate obesity
prevention and control programs in that
school and community. The American
Academy of Pediatrics (AAP) recommends
that BMI should be calculated and
plotted annually for all youth as part of
normal health supervision within the
child’s medical home, and the Institute
of Medicine (IOM) recommends annual
school-based BMI screenings.85, 86 CDC
has identified safeguards for schools who
conduct BMI screenings to ensure they
focus on promoting health and positive
wellness for children.87
Health Education
l Only two states — Colorado and
Oklahoma — do not require schools
to provide health education.
Health education curricula often include
community health, consumer health,
environmental health, family life, mental
and emotional health, injury prevention
and safety, nutrition, personal health,
prevention and control of disease and
substance use and abuse. The goal of
school health education is to prevent
premature deaths and disabilities by
improving the health literacy of students.88
According to a 2012 CDC study, health
education standards and curricula vary
greatly from school to school.89
l The percentage of states that require
districts or schools to follow national
or state health education standards
increased from 60.8 percent in 2000
to over 90 percent in 2012; the
percentage of districts that required
this of their schools increased from
68.8 percent to 82.4 percent.
l Just over 88 percent of states and
39.1 percent of districts required
each school to have a school health
education coordinator.
Wellness Policies
Wellness policies are written documents
that guide a local education agency or
school district’s process to establish a
healthy school environment. Wellness
policies were originally required by the
Child Nutrition and WIC Reauthorization
Act of 2004 and updated and
strengthened by the Healthy Hunger-Free
Kids Act (HHFKA) of 2010. Each local
education agency participating in the
National School Lunch Program (NSLP)
and/or School Breakfast Program must
develop a wellness policy. At a minimum,
wellness policies must include specific
goals for: nutrition promotion; nutrition
education; physical activity; and other
school-based activities that promote
student wellness. Since the update to
the rule in 2010, local education agencies
are now required to periodically measure
and provide an assessment of the
wellness program to the public including
the implementation of the wellness policy,
the extent to which the schools are in
compliance with the policy, how well the
policy compares to model policies and
a description of the progress made in
attaining the wellness policy goals.90

34 TFAH • RWJF • StateofObesity.org
STATE ACTIVE TRANSPORTATION LAWS
Safe Routes to Schools
l Safe Routes to School programs
operate in all 50 states and
Washington, D.C., benefiting close
to 15,000 schools. Every state
and Washington, D.C., has an SRTS
coordinator.
SRTS was created by the U.S.
Department of Transportation to
promote walking and biking to school.
The program supports improving
sidewalks, bike paths and safe street
crossings; reducing speeds in schools
zones and neighborhoods; addressing
distracted driving; and educating
people about pedestrian and bike
safety. The program includes a range of
partners, such as educators, parents,
students, government officials, city
planners, business and community
leaders, health officials and members
of the community. Early studies of the
program have shown a positive effect on
physically active travel among children
and a reduction in crashes involving
pedestrians.91, 92, 93 While every state
currently participates in some form of
SRTS activities, implementation and
funding support varies.
Complete Streets Policies
l Twenty-eight states and Washington,
D.C. have adopted Complete Streets
Policies: California, Colorado,
Connecticut, Delaware, Florida,
Georgia, Hawaii, Illinois, Louisiana,
Maryland, Massachusetts, Michigan,
Minnesota, Mississippi, New Jersey,
New York, North Carolina, Oregon,
Pennsylvania, Rhode Island, South
Carolina, Tennessee, Texas, Vermont,
Virginia, Washington, West Virginia
and Wisconsin.
Complete Streets policies encourage
physical activity and green
transportation, walking and cycling and
building or protecting urban transport
systems that are fuel-efficient, space-
saving and promote healthy lifestyles.
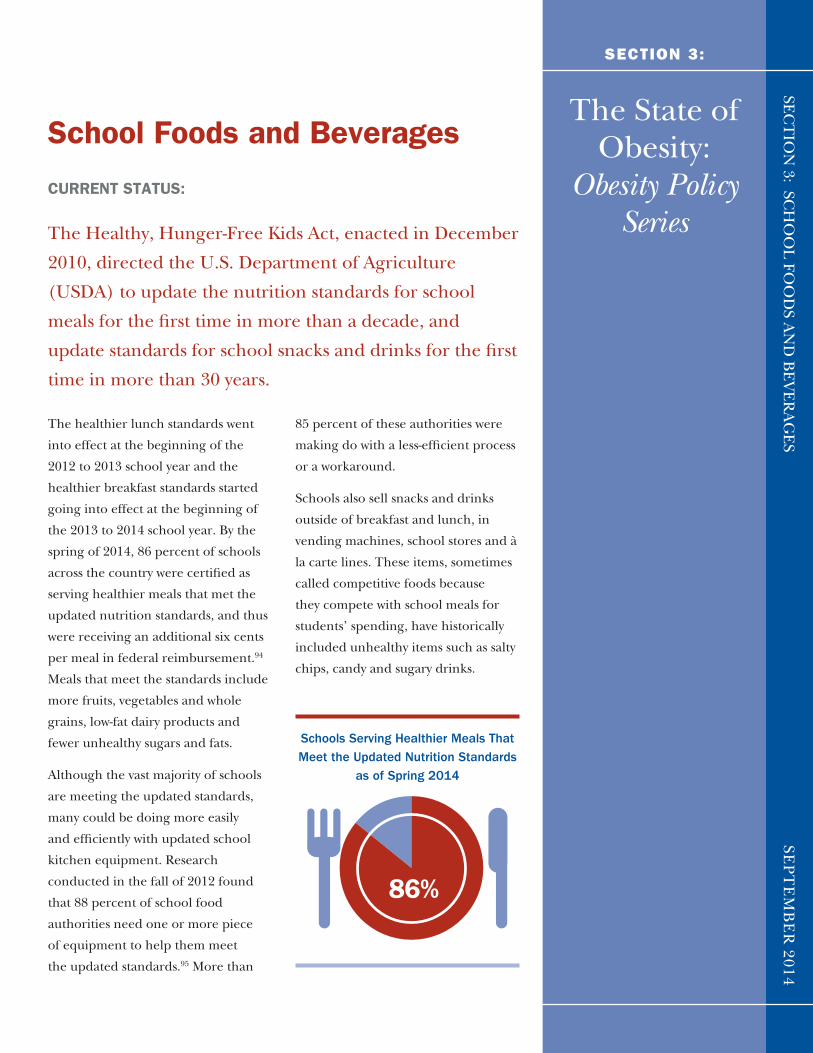
School Foods and Beverages
CURRENT STATUS:
The Healthy, Hunger-Free Kids Act, enacted in December
2010, directed the U.S. Department of Agriculture
(USDA) to update the nutrition standards for school
meals for the first time in more than a decade, and
update standards for school snacks and drinks for the first
time in more than 30 years.
The healthier lunch standards went
into effect at the beginning of the
2012 to 2013 school year and the
healthier breakfast standards started
going into effect at the beginning of
the 2013 to 2014 school year. By the
spring of 2014, 86 percent of schools
across the country were certified as
serving healthier meals that met the
updated nutrition standards, and thus
were receiving an additional six cents
per meal in federal reimbursement.94
Meals that meet the standards include
more fruits, vegetables and whole
grains, low-fat dairy products and
fewer unhealthy sugars and fats.
Although the vast majority of schools
are meeting the updated standards,
many could be doing more easily
and efficiently with updated school
kitchen equipment. Research
conducted in the fall of 2012 found
that 88 percent of school food
authorities need one or more piece
of equipment to help them meet
the updated standards.95 More than
85 percent of these authorities were
making do with a less-efficient process
or a workaround.
Schools also sell snacks and drinks
outside of breakfast and lunch, in
vending machines, school stores and à
la carte lines. These items, sometimes
called competitive foods because
they compete with school meals for
students’ spending, have historically
included unhealthy items such as salty
chips, candy and sugary drinks.
The State of Obesity:
Obesity Policy Series
SECTION 3:
SEC
TIO
N 3: SC
HO
OL
FOO
DS A
ND
BE
VE
RA
GE
SSE
PT
EM
BE
R 2014
86%
Schools Serving Healthier Meals That Meet the Updated Nutrition Standards
as of Spring 2014

36 TFAH • RWJF • StateofObesity.org
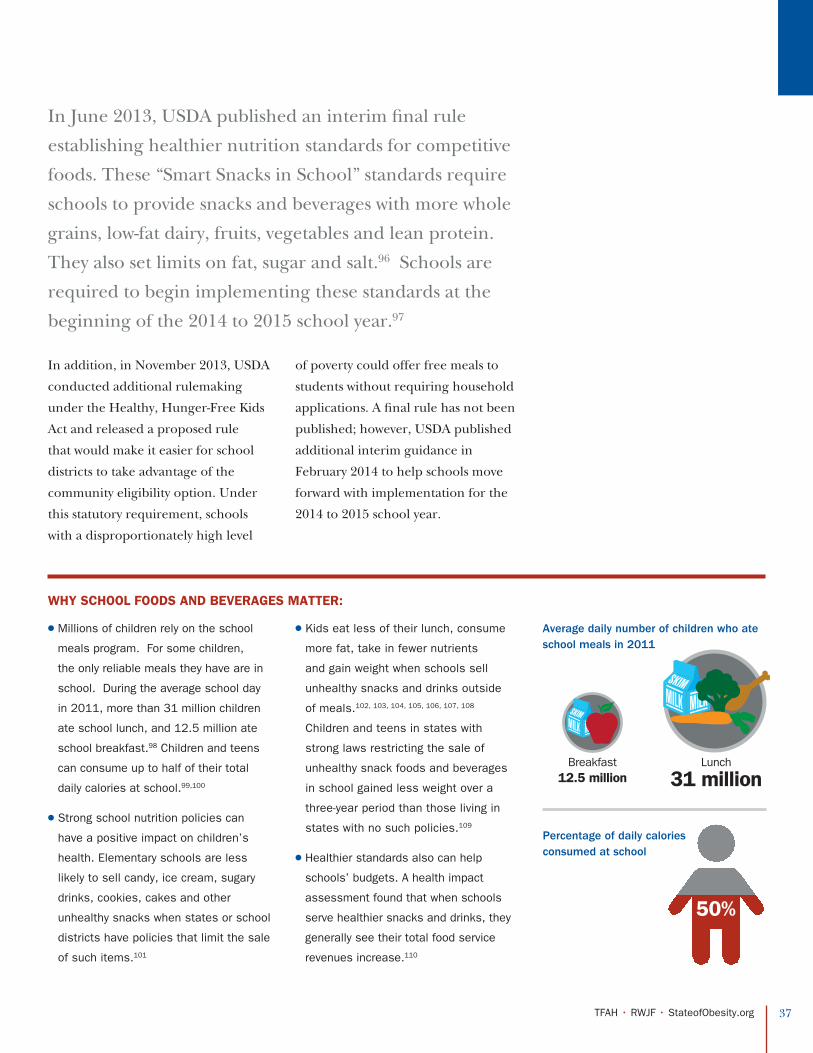
37 TFAH • RWJF • StateofObesity.org
WHY SCHOOL FOODS AND BEVERAGES MATTER:
Average daily number of children who ate school meals in 2011
Percentage of daily calories consumed at school
Breakfast 12.5 million
Lunch
31 million
50%
In June 2013, USDA published an interim final rule
establishing healthier nutrition standards for competitive
foods. These “Smart Snacks in School” standards require
schools to provide snacks and beverages with more whole
grains, low-fat dairy, fruits, vegetables and lean protein.
They also set limits on fat, sugar and salt.96 Schools are
required to begin implementing these standards at the
beginning of the 2014 to 2015 school year.97
In addition, in November 2013, USDA
conducted additional rulemaking
under the Healthy, Hunger-Free Kids
Act and released a proposed rule
that would make it easier for school
districts to take advantage of the
community eligibility option. Under
this statutory requirement, schools
with a disproportionately high level
of poverty could offer free meals to
students without requiring household
applications. A final rule has not been
published; however, USDA published
additional interim guidance in
February 2014 to help schools move
forward with implementation for the
2014 to 2015 school year.
l Millions of children rely on the school
meals program. For some children,
the only reliable meals they have are in
school. During the average school day
in 2011, more than 31 million children
ate school lunch, and 12.5 million ate
school breakfast.98 Children and teens
can consume up to half of their total
daily calories at school.99,100
l Strong school nutrition policies can
have a positive impact on children’s
health. Elementary schools are less
likely to sell candy, ice cream, sugary
drinks, cookies, cakes and other
unhealthy snacks when states or school
districts have policies that limit the sale
of such items.101
l Kids eat less of their lunch, consume
more fat, take in fewer nutrients
and gain weight when schools sell
unhealthy snacks and drinks outside
of meals.102, 103, 104, 105, 106, 107, 108
Children and teens in states with
strong laws restricting the sale of
unhealthy snack foods and beverages
in school gained less weight over a
three-year period than those living in
states with no such policies.109
l Healthier standards also can help
schools’ budgets. A health impact
assessment found that when schools
serve healthier snacks and drinks, they
generally see their total food service
revenues increase.110

38 TFAH • RWJF • StateofObesity.org
Policy Recommendations: l The USDA should continue to monitor state and local implementation of both updated school meal and snack food and beverage standards and provide adequate training and technical assistance where needed to states, localities, industry and school nutrition organizations.
l Adequate funding is important for ensuring schools
have the tools and resources they need to provide
healthy and appealing meals necessary to meet nutrition
standards set by USDA.
l States and localities should consider reinforcing updated
national standards by providing additional funding and
technical assistance for implementing healthier standards,
encouraging inclusion of nutrition goals on school
improvement plans, or applying nutrition standards more
broadly by extending the standards beyond the school day
via an updated school wellness policy.
l School districts should take advantage of the community
eligibility option to help ensure students are consuming
meals that comply with the updated school meal
nutrition standards. The community eligibility option
enables school districts with a certain percentage of
students qualifying for free or reduced-price meals to
provide free meals to all students, reducing paperwork
burdens for both families and schools and ensuring all
students have easy access to free, healthy meals.
l Free and clean drinking water should be made available
to all students throughout the school day.

39 TFAH • RWJF • StateofObesity.org
ADDITIONAL RESOURCES:
Kids’ Safe & Healthful Foods Project: Health Impact Assessment: National Nutrition Standards for Snack and a la Carte Foods
and Beverages Sold in Schools:
http://www.pewhealth.org/uploadedFiles/PHG/Content_Level_Pages/Reports/KS_HIA_revised%20WEB%20FINAL%2073112.pdf
Kids’ Safe & Healthful Foods Project: States Need Updated School Kitchen Equipment:
http://www.healthyschoolfoodsnow.org/states-need-updated-school-kitchen-equipment/
Robert Wood Johnson Foundation: Competitive Foods Resources:
http://www.rwjf.org/en/topics/rwjf-topic-areas/school-snacks.html
Healthy Eating Research: Influence of Competitive Food and Beverage Policies on Children’s Diets and Childhood Obesity:
http://www.rwjf.org/en/research-publications/find-rwjf-research/2012/07/influence-of-competitive-food-and-beverage-policies-on-
children-.html
Institute of Medicine: Nutrition Standards for Foods in Schools: Leading the Way toward Healthier Youth:
http://www.iom.edu/Reports/2007/Nutrition-Standards-for-Foods-in-Schools-Leading-the-Way-toward-Healthier-Youth.aspx
CDC: Implementing Strong Nutrition Standards in Schools: Financial Implications.
http://www.cdc.gov/healthyyouth/nutrition/pdf/financial_implications.pdf

40 TFAH • RWJF • StateofObesity.org
2012 NATIONAL SCHOOL MEAL STANDARDS
The new requirements are being phased in over five years, starting during the 2012-13 school year. States with standards that
are stronger than the new national standards will be able to retain those standards.
Source: Food and Nutrition Service, USDA. Ounce equivalent (ounce equivalent) means the having the same nutritional value as in a standard ounce of that food group. http://www.fns.usda.gov/cnd/Governance/Legislation/comparison.pdf
FOOD GROUP PAST REQUIREMENTS NEW REQUIREMENTS
Fruits and Vegetables ½ to ¾ cup of fruit and vegetables combined per day
¾ to 1 cup of vegetables plus ½ to 1 cup of fruit per day
Vegetables No specifications as to type of vegetable subgroup
Weekly requirements for: dark green, red/orange, beans/peas, starchy, others (as defined in 2010 Dietary Guidelines)
Meat/Meat Alternate 1.5- to 2-ounce equivalent (daily minimum) (ounce equivalent minimum)
Daily minimum and weekly ranges:
Grades K-5: 1-ounce equivalent minimum daily (8 to 10 ounces weekly)
Grades 6-8: 1-ounce equivalent minimum daily (9 to 10 ounces weekly)
Grades 9-12: 2-ounce equivalent minimum daily (10 to 12 ounces weekly)
Grains 8 servings per week (minimum of 1 serving per day)
Daily minimum and weekly ranges:
Grades K-5: 1-ounce equivalent minimum daily (8 to 9 ounces weekly)
Grades 6-8: 1-ounce equivalent minimum daily (8 to 10 ounces weekly)
Grades 9-12: 2-ounce equivalent minimum daily (10 to 12 ounces weekly)
Whole Grains Encouraged At least half of the grains must be whole grain-rich beginning July 1, 2012. Beginning July 1, 2014, all grains must be whole grain-rich.
Milk 1 cup; Variety of fat contents allowed; flavor not restricted
1 cup; Must be fat-free (unflavored/flavored) or 1% low-fat (unflavored)
Sodium Reduce, no set standards TARGET 1: SY 2014-15
Lunch
≤1230mg (K-5);
≤1360mg (6-8);
≤1420mg (9-12)
Breakfast
≤540mg ( K-5);
≤600mg (6-8);
≤640mg (9-12)
Water No set standards Schools participating in the NSLP are required to make potable water available to children at no charge in the place where lunches are served during the meal service.
TARGET 2: SY 2017-18
Lunch
≤935mg (K-5)
≤1035mg (6-8);
≤1080mg (9-12)
Breakfast
≤485mg ( K-5);
≤535mg (6-8);
≤570mg (9-12)
TARGET 3: SY 2019-20
Lunch
≤640mg (K-5);
≤710mg (6-8);
≤740mg (9-12)
Breakfast
≤430mg ( K-5);
≤470mg (6-8);
≤500mg (9-12)

41 TFAH • RWJF • StateofObesity.org
STATE SCHOOL-BASED NUTRITION AND FOOD LAWS
Competitive Foods
The Healthy, Hunger-Free Kids Act of
2010 required USDA to release new
national standards for competitive foods
in schools. USDA defines competitive
foods as any food or beverage served
or sold at school that is not part of the
USDA school meals program.111 These
foods are sold in à la carte lines, in
school vending machines, in school
stores, or through bake sales. The
interim final rule for Smart Snacks in
School was released in June 2013 and
becomes effective during the 2014 to
2015 school year.112 States with stan-
dards that are stronger than the new
national standards will be able to retain
those standards.
The nonprofit, nonpartisan Bridging
the Gap organization conducts an
analysis of all current state competitive
foods laws, available at http://foods.
bridgingthegapresearch.org/#, and re-
cently released a new report examining
whether existing state laws are aligned
with the new USDA standards. The
report found that 38 states have com-
petitive food standards, but none of
the states’ laws fully met USDA’s stan-
dards. On average, states met four
out of the 18 USDA competitive food
provisions and states were more likely
to meet the USDA beverage provisions
than snack provisions. Overall, the
report concluded that implementation
and compliance of the new provisions
will likely be easier in states with exist-
ing laws and that technical assistance
should be provided to those areas that
have few to no competitive food provi-
sions in place.113

42 TFAH • RWJF • StateofObesity.org
SMART SNACKS IN SCHOOL NUTRITION STANDARDS
FOOD/NUTRIENT STANDARD EXEMPTION TO STANDARD
General Standard for Competitive Food.
To be allowable, a competitive food item must:
1. Meet all of the proposed competitive food nutrient standards; and
2. Be a grain product that contains 50 percent or more whole grains by weight or have whole grains as the first ingredient*; or
3. Have as the first ingredient*one of the non-grain main food groups: fruits, vegetables, dairy, or protein foods (meat, beans, poultry, seafood, eggs, nuts, seeds, etc.); or
4. Be a combination food that contains at least ¼ cup fruit and/or vegetable; or
5. Contain 10 percent of the Daily Value (DV) of a nutrient of public health concern (i.e., calcium, potassium, vitamin D, or dietary fiber).
*If water is the first ingredient, the second ingredient must be one of items 2, 3 or 4 above.
l Fresh fruits and vegetables with no added ingredients except water are exempt from all nutrient standards.
l Canned and frozen fruits with no added ingredients except water, or are packed in 100 percent juice, extra light syrup, or light syrup are exempt from all nutrient standards.
l Canned vegetables with no added ingredients except water or that contain a small amount of sugar for processing purposes to maintain the quality and structure of the vegetable are exempt from all nutrient standards.
NSLP/School Breakfast Program (SBP) Entrée Items Sold A la Carte
Any entrée item offered as part of the lunch program or the breakfast program is exempt from all competitive food standards if it is sold as a competitive food on the day of service or the day after service in the lunch or breakfast program.
Sugar-Free Chewing Gum
Sugar-free chewing gum is exempt from all competitive food standards.
Grain Items Acceptable grain items must include 50 percent or more whole grains by weight, or have whole grains as the first ingredient.
Total Fats Acceptable food items must have ≤ 35 percent calories from total fat as served.
l Reduced fat cheese (including part-skim mozzarella) is exempt from the total fat standard.
l Nuts and seeds and nut/seed butters are exempt from the total fat standard.
l Products consisting of only dried fruit with nuts and/or seeds with no added nutritive sweeteners or fats are exempt from the total fat standard.
l Seafood with no added fat is exempt from the total fat standard.
Combination products are not exempt and must meet all the nutrient standards.
Saturated Fats Acceptable food items must have < 10 percent calories from saturated fat as served.
Trans Fats Zero grams of trans fat as served
Sugar Acceptable food items must have ≤ 35 percent of weight from total sugar as served.
l Dried whole fruits or vegetables; dried whole fruit or vegetable pieces; and dehydrated fruits or vegetables with no added nutritive sweeteners are exempt from the sugar standard.
l Dried whole fruits, or pieces, with nutritive sweeteners that are required for processing and/or palatability purposes (i.e. cranberries, tart cherries, or blueberries) are exempt from the sugar standard.
l Products consisting of only exempt dried fruit with nuts and/or seeds with no added nutritive sweeteners or fats are exempt from the sugar standard.

43 TFAH • RWJF • StateofObesity.org
FOOD/NUTRIENT STANDARD EXEMPTION TO STANDARD
Sodium Snack items and side dishes sold a la carte: ≤ 230 mg sodium per item as served, lowered to ≤ 200 mg July 1, 2016.
Entrée items sold a la carte: ≤ 480 mg sodium per item as served, including any added accompaniments.
Calories Snack items and side dishes sold a la carte: ≤ 200 calories per item as served, including any added accompaniments.
Entrée items sold a la carte: ≤ 350 calories per item as served including any added accompaniments.
Entrée items served as an NSLP or SBP entrée are exempt on the day of or day after service in the program meal.
Accompaniments Use of accompaniments is limited when competitive food is sold to students in school. The accompaniment must be included in the nutrient profile as part of the food item served and meet all proposed standards.
Caffeine Elementary and middle school: foods and beverages must be caffeine-free with the exception of trace amounts of naturally occurring caffeine substances.
High School: foods and beverages may contain caffeine.
Beverages Elementary School:
l Plain water or plain carbonated water;
l Low fat milk, unflavored (≤ 8 fl oz);
l Nonfat milk, flavored or unflavored (≤ 8 fl oz), including nutritionally equivalent milk alternatives as permitted by the school meal requirements;
l 100 percent fruit/vegetable juice (≤ 8 fl oz); and
l 100 percent fruit/vegetable juice diluted with water (with or without carbonation) and no added sweeteners (≤ 8 fl oz).
Middle School
l Plain water or plain carbonated water (no size limit);
l Low-fat milk, unflavored (≤12 fl oz);
l Non-fat milk, flavored or unflavored (≤12 fl oz), including nutritionally equivalent milk alternatives as permitted by the school meal requirements;
l 100 percent fruit/vegetable juice (≤12 fl oz); and
l 100 percent fruit/vegetable juice diluted with water (with or without carbonation) and no added sweeteners (≤12 fl oz).
High School
l Plain water or plain carbonated water (no size limit);
l Low-fat milk, unflavored (≤12 fl oz);
l Non-fat milk, flavored or unflavored (≤12 fl oz), including nutritionally equivalent milk alternatives as permitted by the school meal requirements;
l 100 percent fruit/vegetable juice (≤12 fl oz);
l 100 percent fruit/vegetable juice diluted with water (with or without carbonation) and no added sweeteners (≤12 fl oz);
l Other flavored and/or carbonated beverages (≤20 fl oz)that are labeled to contain ≤5 calories per 8 fl oz, or ≤10 calories per 20 fl oz; and
l Other flavored and/or carbonated beverages (≤12 fl oz) that are labeled to contain ≤40 calories per 8 fl oz, or ≤60 calories per 12 fl oz.
Source: USDA, http://www.fns.usda.gov/sites/default/files/allfoods_summarychart.pdf

44 TFAH • RWJF • StateofObesity.org
WATER AVAILABILITY
Research shows that children are not drinking recommended
levels of water during the school day114 and that children who
drink more water consume less sugar and other beverages.115
Although water fountains have been available in most schools
for decades, there are issues that discourage students from
drinking water at school. For example, many schools do not
have enough water fountains to supply all of the students,
and most schools do not make cups available to encourage
students to take more water from the fountains. The cost of
providing cups may be a barrier in some schools.116
The Healthy, Hunger-Free Kids Act of 2010 requires schools to
provide easily accessible, clean water to students at no cost.
In 2013, the Partnership for a Healthier America launched a
“Drink Up” campaign to support increased water availability
and consumption everywhere, not just in schools.117
According to new research by Bridging the Gap, during the 2011
to 2012 school year 86 percent of elementary, 87 percent
of middle, and 89 percent of high school students attended
schools that reported meeting the drinking water requirement.118
FARM-TO-SCHOOL PROGRAMS
Farm-to-school programs have shown results in improving
students’ nutritional intake.119 For example, a study by
researchers at the University of California, Davis found that
farm-to-school programs not only increase consumption of
fruits and vegetables, but actually change eating habits,
leading students to choose healthier options at lunch.120 A
recent health impact assessment examining the Oregon
farm-to-school reimbursement law found that the law
would create and maintain jobs for Oregonians, increase
student participation in the school meals program, improve
household food security and strengthen connections within
Oregon’s food economy.121
l All 50 states and Washington, D.C. have farm-to-school
programs but only 35 states and Washington, D.C. have
established mandatory programs. Also, within states, many
programs cover only select students or schools rather than
all students or schools.
HOW SCHOOLS MET FEDERAL DRINKING WATER REQUIREMENTS, 2011 TO 2012
Elementary Schools Middle Schools High Schools
Fountains only 64.1% 61.9% 60.6%
Dispensers only 13.3% 14.9% 11.9%
Fountains and dispensers 7.5% 9.3% 16.6%
Other combinations 1.4% 1.4% 0.3%
Did not meet requirement 13.6% 12.6% 10.6%
Source: Colabianchi N, Turner L, Hood NE, Chaloupka FJ, Johnston LD. Availability of drinking water in US public school cafeterias. A BTG Research Brief. Chicago, IL: Bridging the Gap, 2014.
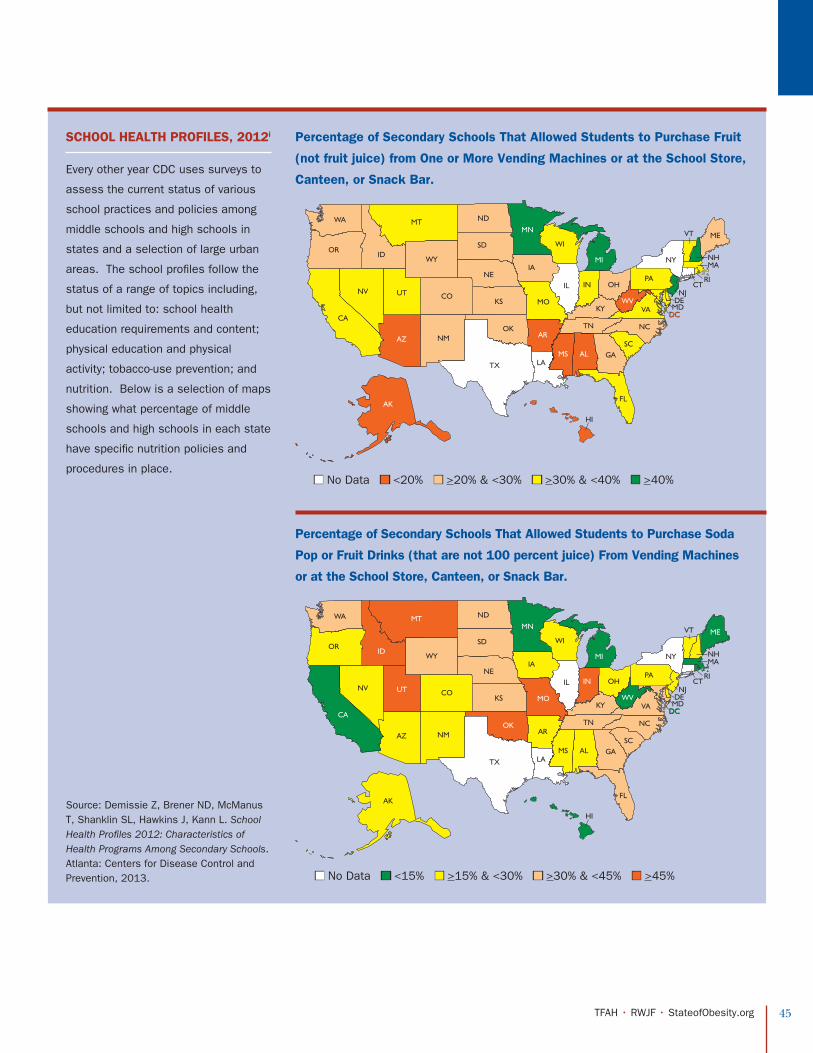
45 TFAH • RWJF • StateofObesity.org
SCHOOL HEALTH PROFILES, 2012i
Every other year CDC uses surveys to
assess the current status of various
school practices and policies among
middle schools and high schools in
states and a selection of large urban
areas. The school profiles follow the
status of a range of topics including,
but not limited to: school health
education requirements and content;
physical education and physical
activity; tobacco-use prevention; and
nutrition. Below is a selection of maps
showing what percentage of middle
schools and high schools in each state
have specific nutrition policies and
procedures in place.
DC
WA
NV
AZ
CO
NE
ND
MN
WI
IL
KY VA
NY
HI
MDDC
DENJ
NH
VT
MA
RICT
NC
LA
AR
MS AL
SD
KS MO
TN
GASC
FL
IN OH
WV
PA
ME
MIIA
OK
TX
NM
ORID
MT
WY
UT
AK
CA
DC
WA
NV
AZ
CO
NE
ND
MN
WI
IL
KY VA
NY
HI
MDDC
DENJ
NH
VT
MA
RICT
NC
LA
AR
MS AL
SD
KS MO
TN
GASC
FL
IN OH
WV
PA
ME
MIIA
OK
TX
NM
ORID
MT
WY
UT
AK
CA
n No Data n <20% n >20% & <30% n >30% & <40% n >40%
n No Data n <15% n >15% & <30% n >30% & <45% n >45%
Percentage of Secondary Schools That Allowed Students to Purchase Fruit
(not fruit juice) from One or More Vending Machines or at the School Store,
Canteen, or Snack Bar.
Percentage of Secondary Schools That Allowed Students to Purchase Soda
Pop or Fruit Drinks (that are not 100 percent juice) From Vending Machines
or at the School Store, Canteen, or Snack Bar.
Source: Demissie Z, Brener ND, McManus T, Shanklin SL, Hawkins J, Kann L. School Health Profiles 2012: Characteristics of Health Programs Among Secondary Schools. Atlanta: Centers for Disease Control and Prevention, 2013.
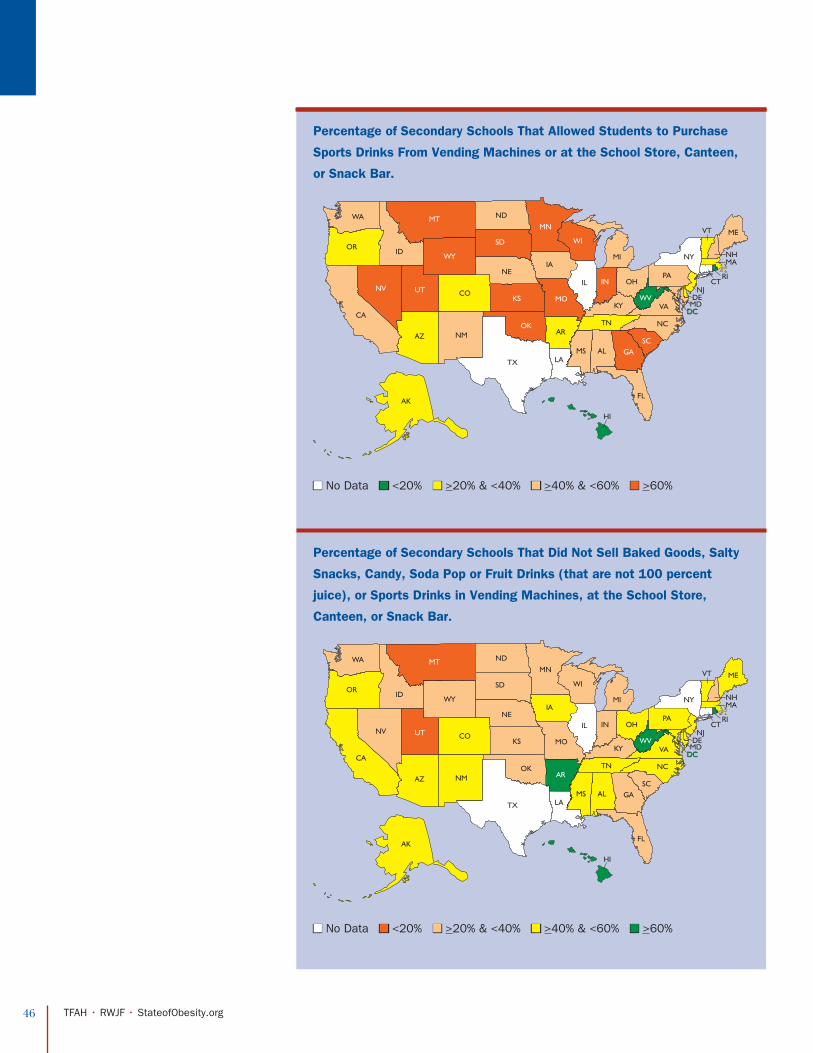
46 TFAH • RWJF • StateofObesity.org
DC
WA
NV
AZ
CO
NE
ND
MN
WI
IL
KY VA
NY
HI
MDDC
DENJ
NH
VT
MA
RICT
NC
LA
AR
MS AL
SD
KS MO
TN
GASC
FL
IN OH
WV
PA
ME
MIIA
OK
TX
NM
ORID
MT
WY
UT
AK
CA
DC
WA
NV
AZ
CO
NE
ND
MN
WI
IL
KY VA
NY
HI
MDDC
DENJ
NH
VT
MA
RICT
NC
LA
AR
MS AL
SD
KS MO
TN
GASC
FL
IN OH
WV
PA
ME
MIIA
OK
TX
NM
ORID
MT
WY
UT
AK
CA
n No Data n <20% n >20% & <40% n >40% & <60% n >60%
n No Data n <20% n >20% & <40% n >40% & <60% n >60%
Percentage of Secondary Schools That Allowed Students to Purchase
Sports Drinks From Vending Machines or at the School Store, Canteen,
or Snack Bar.
Percentage of Secondary Schools That Did Not Sell Baked Goods, Salty
Snacks, Candy, Soda Pop or Fruit Drinks (that are not 100 percent
juice), or Sports Drinks in Vending Machines, at the School Store,
Canteen, or Snack Bar.

47 TFAH • RWJF • StateofObesity.org
DC
WA
NV
AZ
CO
NE
ND
MN
WI
IL
KY VA
NY
HI
MDDC
DENJ
NH
VT
MA
RICT
NC
LA
AR
MS AL
SD
KS MO
TN
GASC
FL
IN OH
WV
PA
ME
MIIA
OK
TX
NM
ORID
MT
WY
UT
AK
CA
DC
WA
NV
AZ
CO
NE
ND
MN
WI
IL
KY VA
NY
HI
MDDC
DENJ
NH
VT
MA
RICT
NC
LA
AR
MS AL
SD
KS MO
TN
GASC
FL
IN OH
WV
PA
ME
MIIA
OK
TX
NM
ORID
MT
WY
UT
AK
CA
n No Data n <5% n >5% & <10% n >10% & <15% n >15%
n No Data n <45% n >45% & <55% n >55% & <65% n >65%
Percentage of Secondary Schools That Priced Nutritious Foods and Bever-
ages at a Lower Cost While Increasing the Price of Less Nutritious Foods
and Beverages.
Percentage of Secondary Schools That Prohibited Advertisements
for Candy, Fast-Food Restaurants, or Soft Drinks on School Grounds
(including on the outside of the school building, on playing fields, or
other areas of the campus).
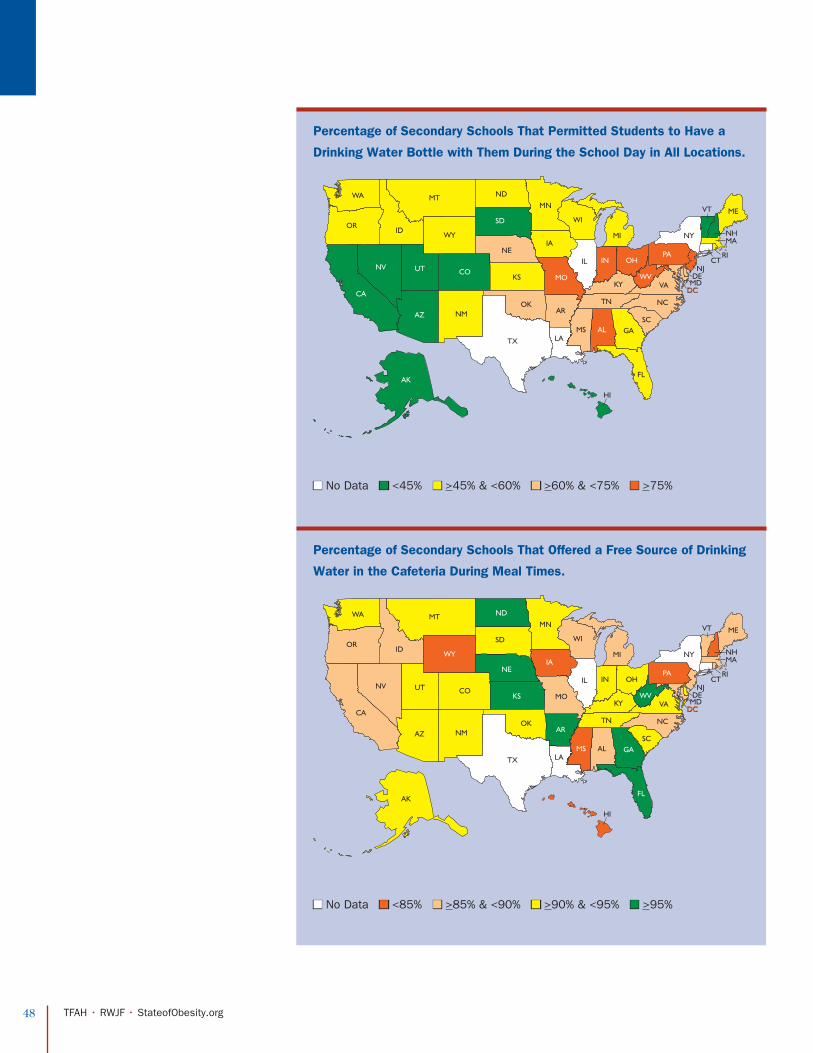
48 TFAH • RWJF • StateofObesity.org
DC
WA
NV
AZ
CO
NE
ND
MN
WI
IL
KY VA
NY
HI
MDDC
DENJ
NH
VT
MA
RICT
NC
LA
AR
MS AL
SD
KS MO
TN
GASC
FL
IN OH
WV
PA
ME
MIIA
OK
TX
NM
ORID
MT
WY
UT
AK
CA
DC
WA
NV
AZ
CO
NE
ND
MN
WI
IL
KY VA
NY
HI
MDDC
DENJ
NH
VT
MA
RICT
NC
LA
AR
MS AL
SD
KS MO
TN
GASC
FL
IN OH
WV
PA
ME
MIIA
OK
TX
NM
ORID
MT
WY
UT
AK
CA
n No Data n <45% n >45% & <60% n >60% & <75% n >75%
n No Data n <85% n >85% & <90% n >90% & <95% n >95%
Percentage of Secondary Schools That Permitted Students to Have a
Drinking Water Bottle with Them During the School Day in All Locations.
Percentage of Secondary Schools That Offered a Free Source of Drinking
Water in the Cafeteria During Meal Times.

Healthy, Affordable Foods
CURRENT STATUS:
More than 29 million Americans lack access to healthy,
affordable foods. They live in “food deserts,” meaning
they do not have a supermarket or supercenter within a
mile of their home if they live in an urban area, or within
10 miles of their home if they live in a rural area.122
Families living in lower-income
neighborhoods and in communities
of color are particularly hard hit: ZIP
codes with the highest concentration of
Blacks have about half the number of
chain supermarkets compared with ZIP
codes with the highest concentration of
Whites, and ZIP codes with the highest
concentrations of Latinos have only a
third as many.123 Many of these same
neighborhoods also are struggling with
high rates of obesity, unemployment
and depressed economies. One study
evaluating food accessibility on 22
Native American reservations in
Washington state observed physical
and financial barriers to accessing
healthy food: 15 reservations did not
have an on-reservation supermarket or
grocery store, yet the cost of shopping
at off-reservation supermarkets was
about 7 percent higher than the
national reference cost.124
Data from the Bureau of Labor
Statistics shows that relative food
costs have fallen over the past three
decades, but not for lower-income
families and individuals. In 2011,
the most recent year with data, the
poorest Americans spent 16.1 percent
of their income on food while middle-
and high-income residents spent
only 13.2 percent and 11.6 percent
respectively.125 Increasing access to
healthy foods has become a priority
for policy-makers across the country.
One strategy is the use of Healthy
Food Financing Initiatives (HFFI), a
public-private partnership in which
grants and loans are provided to
full-service supermarkets or farmers’
markets that locate in lower-income
urban or rural communities.
The State of Obesity:
Obesity Policy Series
SECTION 4:
SEC
TIO
N 4: H
EA
LT
HY, A
FFOR
DA
BL
E FO
OD
SSE
PT
EM
BE
R 2014
Difference in Chain Supermarket Distribution between Communities
Predominantly White Communities
50% Less
66% Less
Predominantly Black Communities
Predominantly Latino Communities
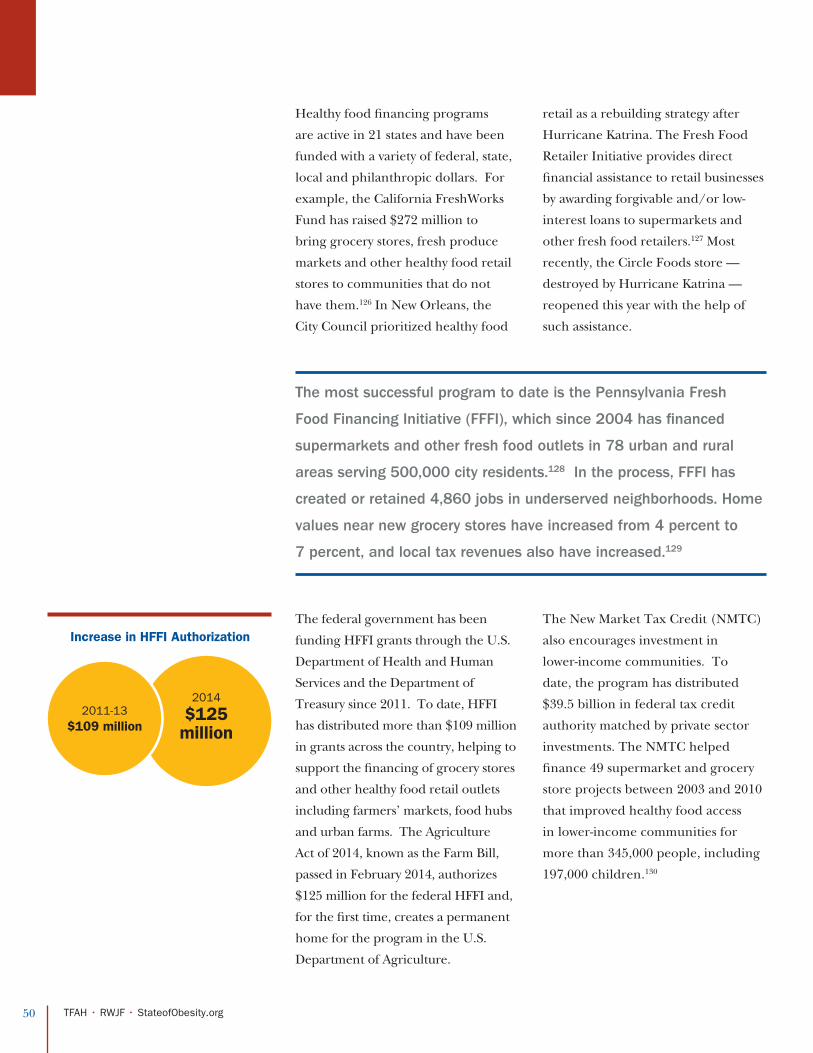
50 TFAH • RWJF • StateofObesity.org
2014
$125 million
Healthy food financing programs
are active in 21 states and have been
funded with a variety of federal, state,
local and philanthropic dollars. For
example, the California FreshWorks
Fund has raised $272 million to
bring grocery stores, fresh produce
markets and other healthy food retail
stores to communities that do not
have them.126 In New Orleans, the
City Council prioritized healthy food
retail as a rebuilding strategy after
Hurricane Katrina. The Fresh Food
Retailer Initiative provides direct
financial assistance to retail businesses
by awarding forgivable and/or low-
interest loans to supermarkets and
other fresh food retailers.127 Most
recently, the Circle Foods store —
destroyed by Hurricane Katrina —
reopened this year with the help of
such assistance.
The federal government has been
funding HFFI grants through the U.S.
Department of Health and Human
Services and the Department of
Treasury since 2011. To date, HFFI
has distributed more than $109 million
in grants across the country, helping to
support the financing of grocery stores
and other healthy food retail outlets
including farmers’ markets, food hubs
and urban farms. The Agriculture
Act of 2014, known as the Farm Bill,
passed in February 2014, authorizes
$125 million for the federal HFFI and,
for the first time, creates a permanent
home for the program in the U.S.
Department of Agriculture.
The New Market Tax Credit (NMTC)
also encourages investment in
lower-income communities. To
date, the program has distributed
$39.5 billion in federal tax credit
authority matched by private sector
investments. The NMTC helped
finance 49 supermarket and grocery
store projects between 2003 and 2010
that improved healthy food access
in lower-income communities for
more than 345,000 people, including
197,000 children.130
The most successful program to date is the Pennsylvania Fresh
Food Financing Initiative (FFFI), which since 2004 has financed
supermarkets and other fresh food outlets in 78 urban and rural
areas serving 500,000 city residents.128 In the process, FFFI has
created or retained 4,860 jobs in underserved neighborhoods. Home
values near new grocery stores have increased from 4 percent to
7 percent, and local tax revenues also have increased.129
Increase in HFFI Authorization
2011-13 $109 million
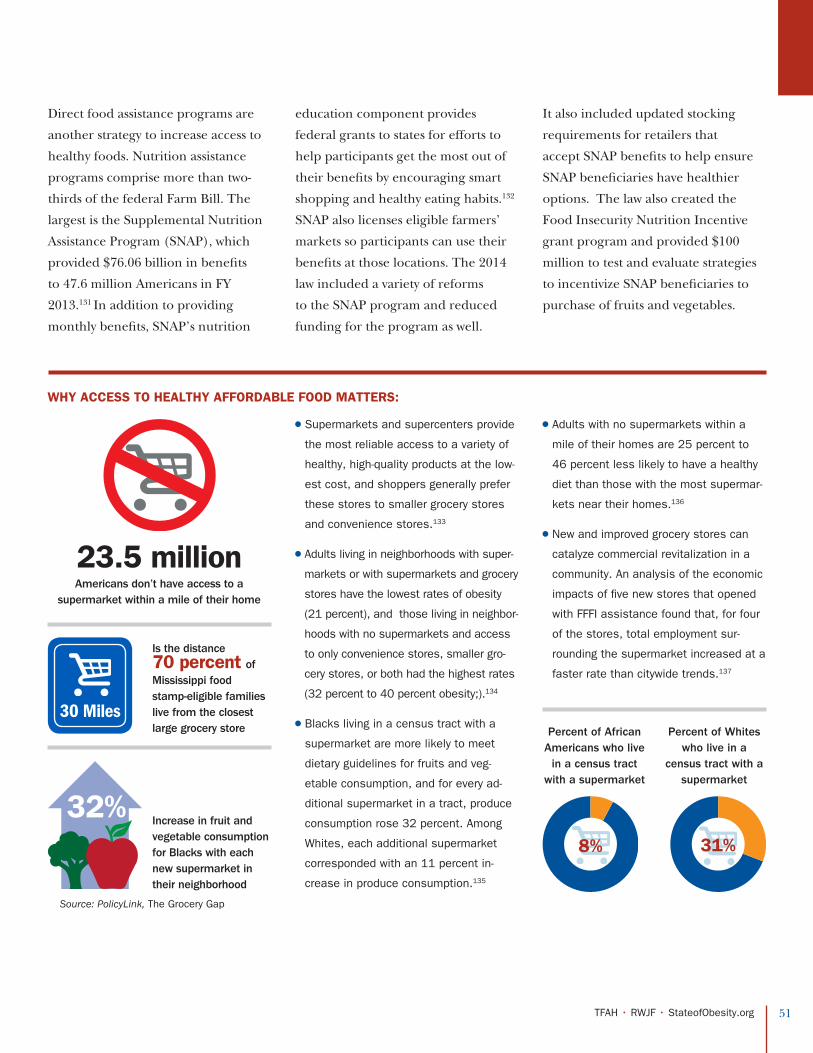
51 TFAH • RWJF • StateofObesity.org
Direct food assistance programs are
another strategy to increase access to
healthy foods. Nutrition assistance
programs comprise more than two-
thirds of the federal Farm Bill. The
largest is the Supplemental Nutrition
Assistance Program (SNAP), which
provided $76.06 billion in benefits
to 47.6 million Americans in FY
2013.131 In addition to providing
monthly benefits, SNAP’s nutrition
education component provides
federal grants to states for efforts to
help participants get the most out of
their benefits by encouraging smart
shopping and healthy eating habits.132
SNAP also licenses eligible farmers’
markets so participants can use their
benefits at those locations. The 2014
law included a variety of reforms
to the SNAP program and reduced
funding for the program as well.
It also included updated stocking
requirements for retailers that
accept SNAP benefits to help ensure
SNAP beneficiaries have healthier
options. The law also created the
Food Insecurity Nutrition Incentive
grant program and provided $100
million to test and evaluate strategies
to incentivize SNAP beneficiaries to
purchase of fruits and vegetables.
23.5 millionAmericans don’t have access to a
supermarket within a mile of their home
Increase in fruit and vegetable consumption for Blacks with each new supermarket in their neighborhood
Is the distance 70 percent of Mississippi food stamp-eligible families live from the closest large grocery store
WHY ACCESS TO HEALTHY AFFORDABLE FOOD MATTERS:
l Supermarkets and supercenters provide
the most reliable access to a variety of
healthy, high-quality products at the low-
est cost, and shoppers generally prefer
these stores to smaller grocery stores
and convenience stores.133
l Adults living in neighborhoods with super-
markets or with supermarkets and grocery
stores have the lowest rates of obesity
(21 percent), and those living in neighbor-
hoods with no supermarkets and access
to only convenience stores, smaller gro-
cery stores, or both had the highest rates
(32 percent to 40 percent obesity;).134
l Blacks living in a census tract with a
supermarket are more likely to meet
dietary guidelines for fruits and veg-
etable consumption, and for every ad-
ditional supermarket in a tract, produce
consumption rose 32 percent. Among
Whites, each additional supermarket
corresponded with an 11 percent in-
crease in produce consumption.135
l Adults with no supermarkets within a
mile of their homes are 25 percent to
46 percent less likely to have a healthy
diet than those with the most supermar-
kets near their homes.136
l New and improved grocery stores can
catalyze commercial revitalization in a
community. An analysis of the economic
impacts of five new stores that opened
with FFFI assistance found that, for four
of the stores, total employment sur-
rounding the supermarket increased at a
faster rate than citywide trends.137
32%
Percent of African Americans who live
in a census tract with a supermarket
Percent of Whites who live in a
census tract with a supermarket
8% 31%
30 Miles
Source: PolicyLink, The Grocery Gap
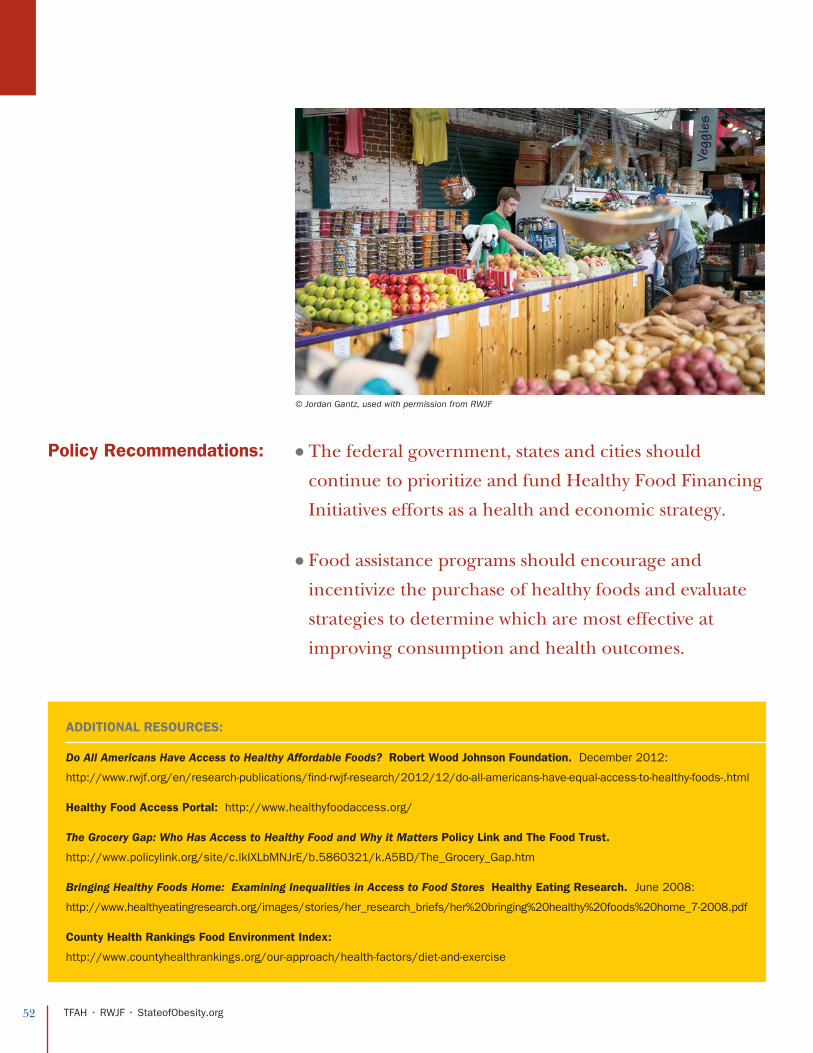
52 TFAH • RWJF • StateofObesity.org
l The federal government, states and cities should
continue to prioritize and fund Healthy Food Financing
Initiatives efforts as a health and economic strategy.
l Food assistance programs should encourage and
incentivize the purchase of healthy foods and evaluate
strategies to determine which are most effective at
improving consumption and health outcomes.
Policy Recommendations:
ADDITIONAL RESOURCES:
Do All Americans Have Access to Healthy Affordable Foods? Robert Wood Johnson Foundation. December 2012:
http://www.rwjf.org/en/research-publications/find-rwjf-research/2012/12/do-all-americans-have-equal-access-to-healthy-foods-.html
Healthy Food Access Portal: http://www.healthyfoodaccess.org/
The Grocery Gap: Who Has Access to Healthy Food and Why it Matters Policy Link and The Food Trust.
http://www.policylink.org/site/c.lkIXLbMNJrE/b.5860321/k.A5BD/The_Grocery_Gap.htm
Bringing Healthy Foods Home: Examining Inequalities in Access to Food Stores Healthy Eating Research. June 2008:
http://www.healthyeatingresearch.org/images/stories/her_research_briefs/her%20bringing%20healthy%20foods%20home_7-2008.pdf
County Health Rankings Food Environment Index:
http://www.countyhealthrankings.org/our-approach/health-factors/diet-and-exercise
© Jordan Gantz, used with permission from RWJF

53 TFAH • RWJF • StateofObesity.org
STATE SUGAR-SWEETENED BEVERAGE TAXES
A number of studies have shown that relative prices of foods and
beverages can lead to changes in how much people consume
them.138, 139, 140 Several studies have estimated that a 10 percent
increase in the price of sugar-sweetened beverages (SSBs) (in-
cluding soft drinks and juices) could reduce consumption of them
by 8 percent to 11 percent.141, 142, 143 As of 2012, the tax rate for
every state with a soda tax is 7 percent or below and, of those
with a soda tax, 14 states have a tax rate of 5 percent or lower.144
Researchers at Yale University estimated that, if a national
soda tax of a penny per 12 ounces were instituted, it would
generate $1.5 billion a year, and the Congressional Budget
Office estimated that a federal excise tax of three cents per 12
ounces of SSBs could have generated an estimated $24 billion
in revenue between 2009 and 2013.145, 146
l 34 states and Washington, D.C., currently include soda
among items for which they charge sales tax: Alabama,
Arkansas, California, Colorado, Connecticut, Florida, Hawaii,
Idaho, Illinois, Indiana, Iowa, Kansas, Kentucky, Maine,
Maryland, Minnesota, Mississippi, Missouri, New Jersey,
New York, North Carolina, North Dakota, Ohio, Oklahoma,
Pennsylvania, Rhode Island, South Dakota, Tennessee, Texas,
Utah, Virginia, Washington, West Virginia and Wisconsin.147
SUGAR-SWEETENED BEVERAGES: CONSUMPTION AND IMPACT
l Sugar-sweetened beverage consumption: Consumption
of SSBs rose significantly from the 1970s until 1999.148
From 1999 to 2010, consumption has begun to decline
(a decrease of 63 calories for youth and 45 calories for
adults.)149 However, SSB consumption is still high. Accord-
ing to the 2011 BRFSS from six states, almost 25 percent
of adults drank SSBs at least once a day and over 10 per-
cent consumed at least two SSBs per day.150 BRFSS found
that odds of drinking SSBs one or more times per day were
significantly greater among younger adults; males; Blacks;
adults with lower education; low-income adults; and adults
who were physically inactive.151 According to studies through
the mid-2000s, 90 percent of children ages 6 to 11 drank
an SSB daily, and SSBs were the top calorie source for
teens.152, 153 Nearly half of 2- to 3-year-olds consume a SSB
daily, and a quarter to a third consume whole rather than
low-fat or nonfat milk.154, 155, 156, 157 Children ages 2 to 5 are
estimated to consume 124 calories per day—7 percent of
their total daily energy intake—from SSBs.158
l Increased health risks related to sugar-sweetened bever-
age consumption: The growing body of evidence from many
studies reveals that regular consumption of SSBs contrib-
utes to weight gain and is also a major contributor to obesity
and type 2 diabetes.159 A number of studies have shown a
significant link between SSB consumption and weight gain
in children.160 A recent study found that children who con-
sumed a large amount of SSBs (at least five servings per
week) were almost 3.5 times more likely to be obese than
those who never or almost never consumed SSBs.161 Adults
who drink a soda or more per day are 27 percent more likely
to be overweight than those who do not drink sodas, regard-
less of income or ethnicity. They also have a 26 percent
higher risk for developing type 2 diabetes and a 20 percent
higher risk for a heart attack.162, 163, 164
l Improved health from lowering sugar-sweetened beverage
consumption: Children who reduced their consumption of
added sugar by the equivalent of one can of soda per day
had improved glucose and insulin levels. Eliminating one
can of soda per day, regardless of any other diet or exercise
change, can reduce a child’s risk for type 2 diabetes.165 An
analysis from 1999 to 2010 found that among a representa-
tive sample of adults in the United States, intake of SSBs
has trended down, and several biomarkers of chronic dis-
ease have significantly improved over the past 12 years.166

The State of Obesity:
Key Findings
SEC
TIO
N 5: FO
OD
AN
D B
EV
ER
AG
E M
AR
KE
TIN
G
SECTION 5:
SEP
TE
MB
ER
2014
Food and Beverage MarketingCURRENT STATUS:
The food and beverage industry spends nearly $2 billion
annually to market foods and beverages to children and
adolescents in the U.S., reaching young people in the places
where they live, learn and play. A report from the Institute of
Medicine concluded that food advertising affects children’s
food choices, food purchase requests, diets and health.167
Although there has been some progress in reducing the
amount of food marketing directed at children, the majority
of foods marketed to children remains unhealthy.168
In the last year, some individual com-
panies have made changes regarding
their marketing practices. In October
2013, the Produce Marketing Asso-
ciation (PMA) and Sesame Workshop
made commitments to the Partnership
for a Healthier America (PHA)—an
organization dedicated to working with
the private sector to address childhood
obesity—that will enable PMA to use
Sesame Street characters for free to pro-
mote fruits and vegetables to children.
Subway committed to PHA that its chil-
dren’s menu items would meet nutrition
standards and that it would spend $41
million over the next three years on ef-
forts to market the healthier menus and
fruit and vegetable options to children.

55 TFAH • RWJF • StateofObesity.org
In addition to steps taken by
individual companies, the industry’s
overall self-regulatory effort, the
Children’s Food and Beverage
Advertising Initiative (CFBAI), has
made changes. In January 2014,
CFBAI adopted new uniform nutrition
criteria for the 17 participating
companies.169 The new standards
set stronger limits on the amount
of calories, sugar, fats and sodium
in the foods marketed to children
than did earlier, company-specific
standards. But the standards still allow
companies to market some unhealthy
foods and beverages to young people,
including popsicles, fruit-flavored
snacks, marshmallow treats and
several sugary cereals.
The CFBAI standards also use a narrow
definition of marketing. The nutrition
criteria do not cover marketing on
packages or in stores, toy give-aways
and other premiums, many forms of
marketing in elementary schools, any
marketing in middle and high schools,
branded merchandise, or brand
advertising—advertising that promotes
an overall brand, not a specific product.
Finally, CFBAI only covers children up
to age 11, even though recent research
shows that adolescents are vulnerable
to many of the marketing tactics
companies use.170 Older children
and adolescents may be particularly
vulnerable to advertising because
they are more independent, use more
media, and are more likely to eat and
drink unhealthy foods and beverages.
One key place where food and bev-
erage companies continue to reach
children is through schools. This mar-
keting happens through signs, score-
boards, posters, branded fundraisers,
corporate incentive programs, scholar-
ships and education materials. Only
20 percent of public school districts
have a policy that addresses food mar-
keting, and only half of those districts
specifically prohibit unhealthy food
and beverage marketing.171 To ad-
dress the problem, the USDA, as part
of its rule making for local school well-
ness policy implementation, included
a provision to limit unhealthy food
and beverage marketing in schools.
Once the rule is finalized, school
districts would need to have policies
in place that only allow marketing of
foods and beverages that meet the
updated Smart Snacks in School nutri-
tion standards set by USDA.172
McDonald’s said it would phase out the listing of soda on the kids’ meal section of its menu boards.
WHY FOOD MARKETING MATTERS:
l Food and beverage companies spent
$1.79 billion in 2009 on marketing to
young people ages 2 to 17.173
l The same year, companies spent $149
million on in-school marketing, the
third largest spending category behind
television and premiums, or incentives
to purchase foods, such as toys
with fast-food meals, t-shirts, music
downloads, etc.174
l During the 2010 to 2011 school year,
10 percent of school districts had
strong policies restricting the marketing
of unhealthy foods.175 Ten percent of
elementary schools and 30 percent of
high schools serve branded fast food
weekly; 19 percent of high schools
serve it every day.176
l Vending contracts remain a major form
of in-school marketing, but contribute
minimal financial support to schools:
approximately $2 to $4 per student
annually. Middle and high schools with
a high percentage of lower-income
students have more vending contracts
than other schools.177
$1.79 Billion!
$149 Million!
YUM!
Cool!Cool!
Spending by Food and Beverage Companies on Marketing to 2 to 17 year-olds in 2009
Spending by Food and Beverage Companies’ on In-School Marketing in 2009
56 TFAH • RWJF • StateofObesity.org
l USDA’s final local school wellness policy regulation should include strong implementation, monitoring, compliance and reporting requirements for food and beverage marketing.
l Once schools put into place their updated local school wellness policies limiting unhealthy food and beverage marketing on school campuses, school officials, students, parents and other key stakeholders must work to ensure that food and beverage marketing is limited to those foods that meet the USDA’s Smart Snacks in School nutrition standards.
l CFBAI should strengthen its nutrition standards for food marketing to children to include a strong positive nutritional requirement, cover children up to age 14, and ensure that all companies’ self-regulatory policies cover all media.
l Media and entertainment companies should jointly adopt meaningful, uniform nutrition standards to prevent the marketing of unhealthy foods and beverages to children.
l Government agencies, researchers and independent groups should continue to monitor and evaluate food marketing expenditures and practices, children’s exposure to marketing and advertising for unhealthy foods and beverages and the effectiveness of industry’s voluntary actions.
l State and local governments should consider regulation of marketing in local communities, including in schools, publicly owned facilities, stores, restaurants and outdoor advertising. Local governments should enforce existing or adopt strong zoning restrictions on marketing, such as limits on signs in store windows.
Policy Recommendations:
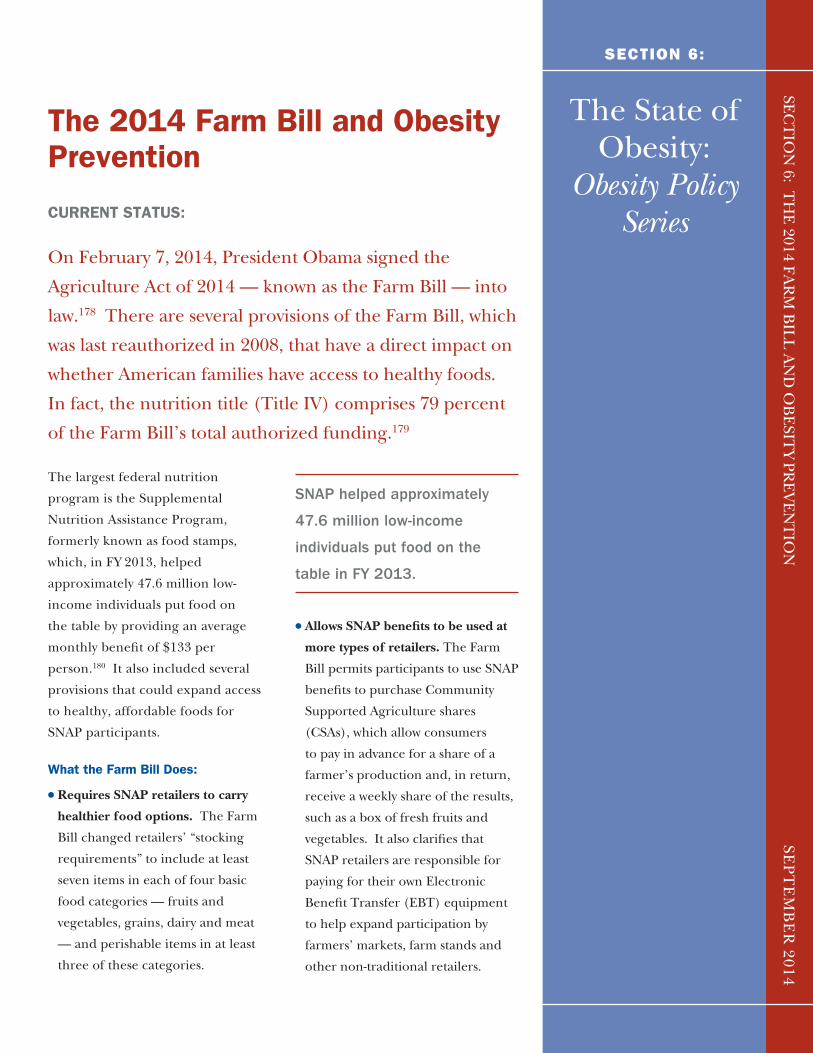
The 2014 Farm Bill and Obesity Prevention
CURRENT STATUS:
On February 7, 2014, President Obama signed the
Agriculture Act of 2014 — known as the Farm Bill — into
law.178 There are several provisions of the Farm Bill, which
was last reauthorized in 2008, that have a direct impact on
whether American families have access to healthy foods.
In fact, the nutrition title (Title IV) comprises 79 percent
of the Farm Bill’s total authorized funding.179
The largest federal nutrition
program is the Supplemental
Nutrition Assistance Program,
formerly known as food stamps,
which, in FY 2013, helped
approximately 47.6 million low-
income individuals put food on
the table by providing an average
monthly benefit of $133 per
person.180 It also included several
provisions that could expand access
to healthy, affordable foods for
SNAP participants.
What the Farm Bill Does:
l Requires SNAP retailers to carry
healthier food options. The Farm
Bill changed retailers’ “stocking
requirements” to include at least
seven items in each of four basic
food categories — fruits and
vegetables, grains, dairy and meat
— and perishable items in at least
three of these categories.
l Allows SNAP benefits to be used at
more types of retailers. The Farm
Bill permits participants to use SNAP
benefits to purchase Community
Supported Agriculture shares
(CSAs), which allow consumers
to pay in advance for a share of a
farmer’s production and, in return,
receive a weekly share of the results,
such as a box of fresh fruits and
vegetables. It also clarifies that
SNAP retailers are responsible for
paying for their own Electronic
Benefit Transfer (EBT) equipment
to help expand participation by
farmers’ markets, farm stands and
other non-traditional retailers.
The State of Obesity:
Obesity Policy Series
SECTION 6:
SEC
TIO
N 6: T
HE
2014 FAR
M B
ILL
AN
D O
BE
SITY PR
EV
EN
TIO
NSE
PT
EM
BE
R 2014
SNAP helped approximately
47.6 million low-income
individuals put food on the
table in FY 2013.
58 TFAH • RWJF • StateofObesity.org
l Expands nutrition education and
obesity prevention activities. The
Farm Bill added promotion of
“physical activity” as a component
of SNAP’s nutrition education
program (SNAP-Ed), which provides
grants to state SNAP agencies for
nutrition education and obesity
prevention activities.
l Incentivizes expanded access
to healthy foods in low-income
communities. The Farm Bill
creates numerous grant programs
to incentivize expanded access
to healthy foods in low-income
communities, including 1) $125
million in funding for the federal
HFFI to provide grants and tax
incentives to food retailers to
operate in underserved communities
(for more details see the report section on
Healthy, Affordable Foods); 2) a pilot
program to give up to eight states
flexibility in procuring unprocessed
fruits and vegetables for school
nutrition programs; 3) Food
Insecurity Nutrition Incentive grants
for SNAP retailers, government
agencies and organizations that seek
to increase the purchase of fruits
and vegetables by SNAP participants
through incentives at the point of
purchase; 4) a food and agriculture
service learning grant program to
increase knowledge and improve
nutritional health among children in
school settings; 5) a grant program
to provide up to 50 percent of the
costs of local incentive programs that
give SNAP participants additional
benefits for produce when they
purchase fruits and vegetables; and
6) a Pulse School Pilot that provides
the U.S. Department of Agriculture
$10 million through 2017 to
purchase peas, lentils, chickpeas and
hummus to use in school breakfasts
and lunches.
Another strategy the Farm Bill takes
to promote healthier eating is a shift
in its approach to subsidies. U.S. farm
policy has traditionally encouraged
the overproduction and use of cheap
commodities, while the prices for
fruits and vegetables have steadily
increased.181 In the 2014 Farm Bill,
traditional commodity subsidies were
cut by more than 30 percent, to $23
billion over 10 years, while funding
for fruits and vegetables and organic
programs increased by more than
50 percent over the same period, to
about $3 billion.182
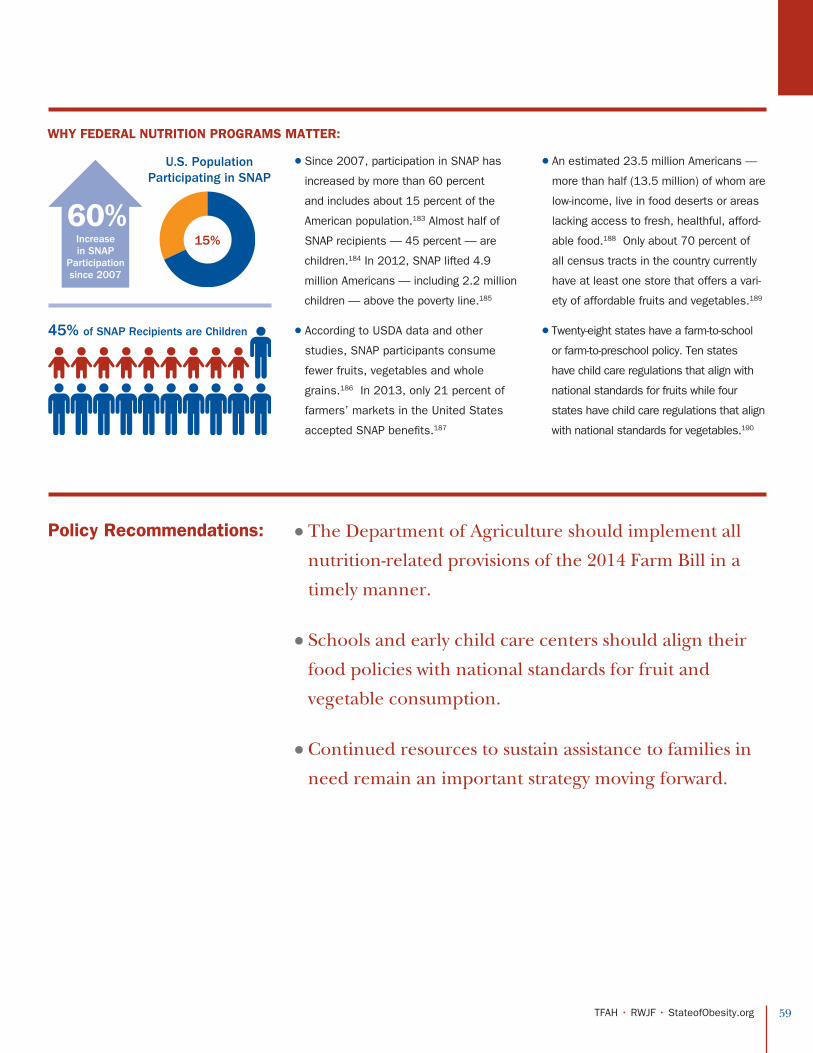
59 TFAH • RWJF • StateofObesity.org
l The Department of Agriculture should implement all
nutrition-related provisions of the 2014 Farm Bill in a
timely manner.
l Schools and early child care centers should align their
food policies with national standards for fruit and
vegetable consumption.
l Continued resources to sustain assistance to families in
need remain an important strategy moving forward.
Policy Recommendations:
WHY FEDERAL NUTRITION PROGRAMS MATTER:
l Since 2007, participation in SNAP has
increased by more than 60 percent
and includes about 15 percent of the
American population.183 Almost half of
SNAP recipients — 45 percent — are
children.184 In 2012, SNAP lifted 4.9
million Americans — including 2.2 million
children — above the poverty line.185
l According to USDA data and other
studies, SNAP participants consume
fewer fruits, vegetables and whole
grains.186 In 2013, only 21 percent of
farmers’ markets in the United States
accepted SNAP benefits.187
l An estimated 23.5 million Americans —
more than half (13.5 million) of whom are
low-income, live in food deserts or areas
lacking access to fresh, healthful, afford-
able food.188 Only about 70 percent of
all census tracts in the country currently
have at least one store that offers a vari-
ety of affordable fruits and vegetables.189
l Twenty-eight states have a farm-to-school
or farm-to-preschool policy. Ten states
have child care regulations that align with
national standards for fruits while four
states have child care regulations that align
with national standards for vegetables.190
60%Increase in SNAP
Participation since 2007
U.S. Population Participating in SNAP
45% of SNAP Recipients are Children
15%

60 TFAH • RWJF • StateofObesity.org
Improving the Health of Communities by Increasing Access to Affordable, Locally Grown Foods
When my son was diagnosed with type 1 diabetes, I became
painfully aware of the direct connection between food and
health. As a chef, this realization caused me to transform
the way I fed my family and customers. Fresh, nutrient-
dense, locally grown foods became the foundation for the
type of diet that would give my son and restaurant guests
the best long-term health.
Quickly, though, I recognized that not
every family can afford to purchase
healthy foods. As a result, I founded
Wholesome Wave in 2007.
We work collaboratively with
underserved communities, nonprofits,
farmers, farmers’ markets, healthcare
providers and government entities
to form networks that improve
health, increase fruit and vegetable
consumption and generate revenue
for small and mid-sized farms.
DOUBLE VALUE COUPON PROGRAM
In 2008, we launched the Double
Value Coupon Program (DVCP), a
network of more than 50 nutrition
incentive programs operated at 305
farmers markets in 24 states and
Washington, D.C. The program
provides customers with a monetary
incentive when they spend their federal
nutrition benefits at participating
farmers markets. The incentive
matches the amount spent and can be
used to purchase healthy, fresh, locally
grown fruits and vegetables.
Farmers and farmers’ markets benefit
from this approach, and have been
key allies as we work towards federal
and local policy change. In 2013,
federal nutrition benefits and DVCP
incentives accounted for $2.45 million
in sales at farmers’ markets.191
Communities also see an increase
in economic activity. The $2.45
million spent at local farmers’
markets creates a significant ripple
effect. In addition to the dollars
Wholesome Wave is a 501(c)(3)
nonprofit dedicated to making
healthy, locally and regionally
grown food affordable to
everyone, regardless of income.
EXPERT COMMENTARY
BY MICHEL NISCHAN, CEO and Founder,
Wholesome Wave

61 TFAH • RWJF • StateofObesity.org
spent at markets, almost one-third of DVCP consumers
said they planned to spend an average of nearly $30 at
nearby businesses on market day, resulting in more than
$1 million spent at local businesses. We also see that the
demographics of market participants are more diverse
— our approach breaks down social barriers and allows
consumers who receive federal benefits to be seen as
critical participants in local economies.192
Equally as important, people are eating healthier. Our
2011 Diet and Behavior Shopping Study indicated
90 percent of DVCP consumers increased or greatly
increased their consumption of fresh fruit and vegetables
— a behavior change that hopefully continues well after
market season ends.193
Today, the program reaches more than 35,800
participants and their families and impacts more
than 3,500 farmers.
Combined with the new Food Insecurity Nutrition
Incentives Program in the latest Farm Bill, this approach
is now being scaled up with $100 million allocated for
nutrition incentives over five years.
FRUIT AND VEGETABLE PRESCRIPTION PROGRAM
We developed the Fruit and Vegetable Prescription
Program (FVRx) to measure health outcomes linked to
fruit and vegetable consumption. The four to six month
program is designed to provide assistance to overweight
and obese children who are affected by diet-related diseases
such as type 2 diabetes. In 2013, the program impacted
1,288 children and adults in five states and Washington,
D.C. Nearly two-thirds of the participants are enrolled in
SNAP and roughly a quarter receive Women, Infants and
Children (WIC) benefits.
The model works within the normal doctor-patient
relationship. During the visit, the doctor writes a prescription
for produce that the patient’s family can redeem at
participating farmers’ markets. The prescription includes
at least one serving of produce per day for each patient and
each family member — i.e., a family of four would receive $28
per week to spend on produce.
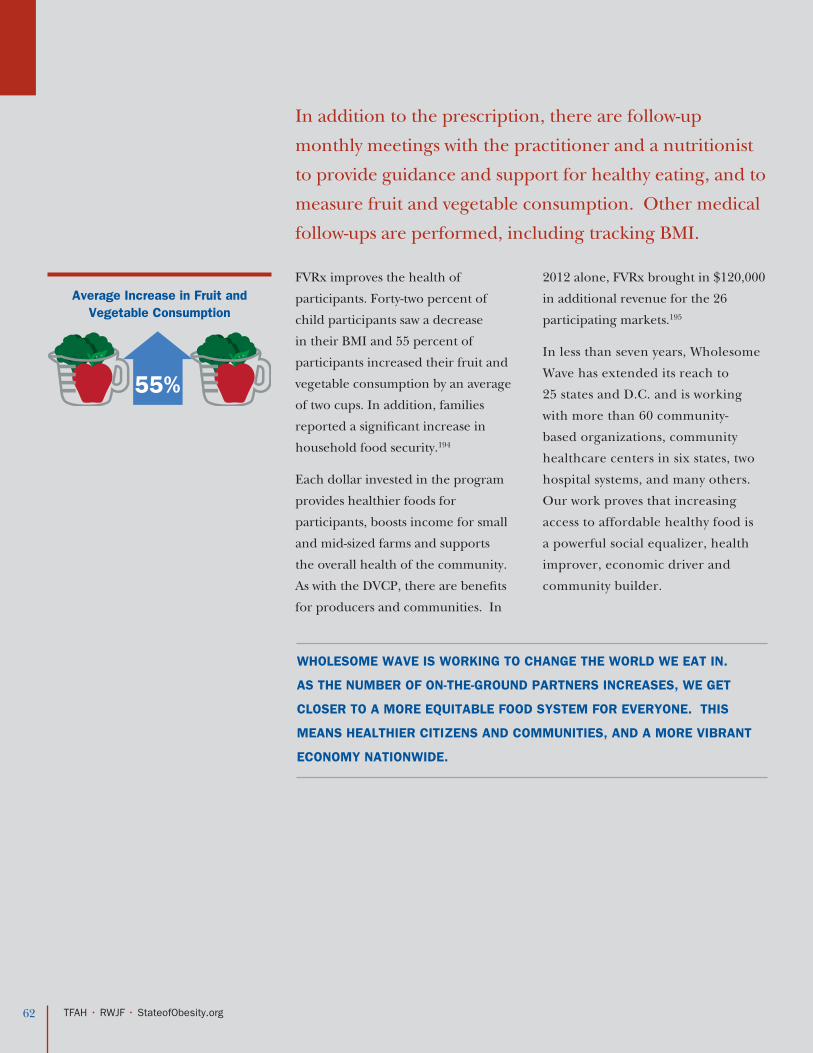
In addition to the prescription, there are follow-up
monthly meetings with the practitioner and a nutritionist
to provide guidance and support for healthy eating, and to
measure fruit and vegetable consumption. Other medical
follow-ups are performed, including tracking BMI.
FVRx improves the health of
participants. Forty-two percent of
child participants saw a decrease
in their BMI and 55 percent of
participants increased their fruit and
vegetable consumption by an average
of two cups. In addition, families
reported a significant increase in
household food security.194
Each dollar invested in the program
provides healthier foods for
participants, boosts income for small
and mid-sized farms and supports
the overall health of the community.
As with the DVCP, there are benefits
for producers and communities. In
2012 alone, FVRx brought in $120,000
in additional revenue for the 26
participating markets.195
In less than seven years, Wholesome
Wave has extended its reach to
25 states and D.C. and is working
with more than 60 community-
based organizations, community
healthcare centers in six states, two
hospital systems, and many others.
Our work proves that increasing
access to affordable healthy food is
a powerful social equalizer, health
improver, economic driver and
community builder.
62 TFAH • RWJF • StateofObesity.org
WHOLESOME WAVE IS WORKING TO CHANGE THE WORLD WE EAT IN.
AS THE NUMBER OF ON-THE-GROUND PARTNERS INCREASES, WE GET
CLOSER TO A MORE EQUITABLE FOOD SYSTEM FOR EVERYONE. THIS
MEANS HEALTHIER CITIZENS AND COMMUNITIES, AND A MORE VIBRANT
ECONOMY NATIONWIDE.
55%
Average Increase in Fruit and Vegetable Consumption
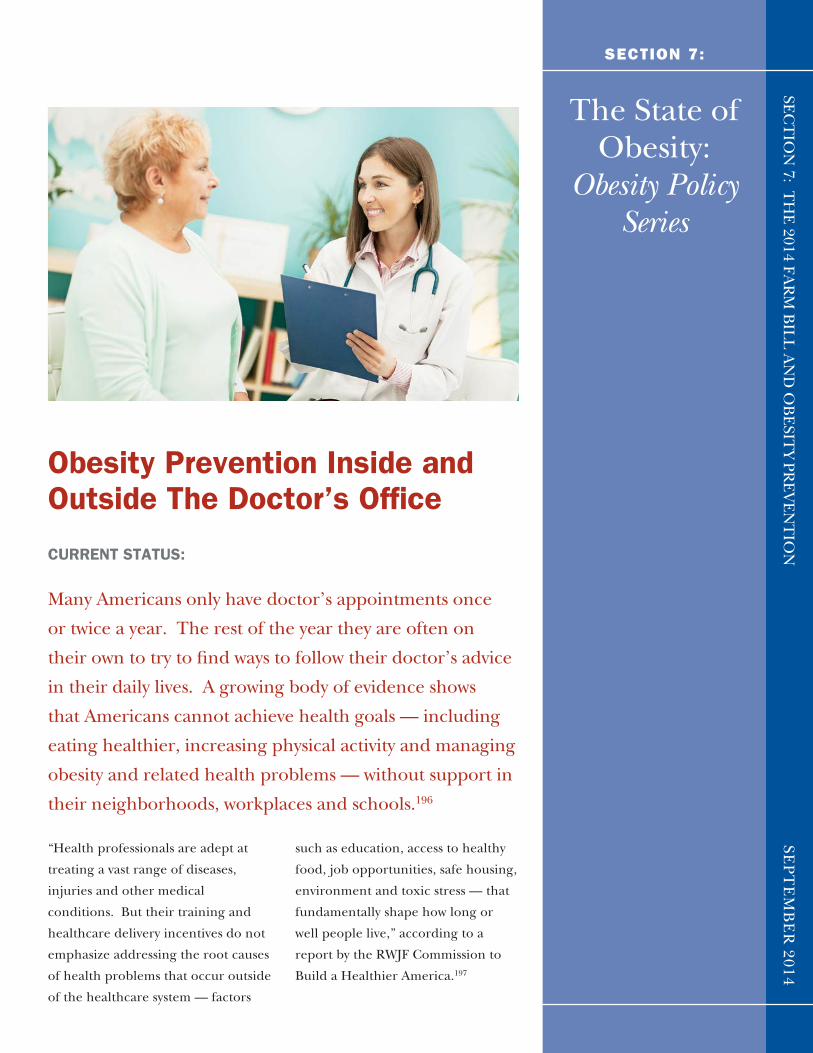
Obesity Prevention Inside and Outside The Doctor’s Office
CURRENT STATUS:
Many Americans only have doctor’s appointments once
or twice a year. The rest of the year they are often on
their own to try to find ways to follow their doctor’s advice
in their daily lives. A growing body of evidence shows
that Americans cannot achieve health goals — including
eating healthier, increasing physical activity and managing
obesity and related health problems — without support in
their neighborhoods, workplaces and schools.196
“Health professionals are adept at
treating a vast range of diseases,
injuries and other medical
conditions. But their training and
healthcare delivery incentives do not
emphasize addressing the root causes
of health problems that occur outside
of the healthcare system — factors
such as education, access to healthy
food, job opportunities, safe housing,
environment and toxic stress — that
fundamentally shape how long or
well people live,” according to a
report by the RWJF Commission to
Build a Healthier America.197
The State of Obesity:
Obesity Policy Series
SECTION 7:
SEC
TIO
N 7: T
HE
2014 FAR
M B
ILL
AN
D O
BE
SITY PR
EV
EN
TIO
NSE
PT
EM
BE
R 2014

64 TFAH • RWJF • StateofObesity.org
For instance, individuals whose
doctors counsel them that they are
at risk for health problems related
to obesity, such as prediabetes, are
often left to try to follow their doctors’
advice on their own in their daily lives
where nutritious foods are costly and
can be hard to access, and it is hard to
find time and convenient, safe places
for physical activity.
Connecting healthcare inside the
doctor’s office with community-
based health and other social
service programs and resources
can provide ongoing support,
education and opportunities to
improve health where people
live, learn, work and play.
Approaches can range from doctors
providing direction and information for
patients, such as writing prescriptions
for healthy, active living, including
good nutrition and physical activity
to educating families about the
importance of healthy eating habits,
regular activity and sleep at every
well-child visit to referring patients
to resources or health management
programs in their community, such
as at their local YMCA or nutrition
counseling support.
These approaches, however, are often
not taken because the U.S. health
system has traditionally focused on
covering activities that occur directly
within a healthcare setting and are
aimed at helping someone who is sick
get well. The old, disjointed fee-for-
service model and siloed systems have
dis-incentivized coordinated care, and
have been ineffective at preventing
chronic disease and reducing
healthcare costs.198
For example, outdated regulations
and billing practices have constrained
insurers from paying for programs that
are not directly delivered by doctors
and other licensed medical providers,
such as community health workers and
obesity counselors, or that help support
the health of an entire neighborhood
rather than focusing on a specific
individual who is tied to a specific
diagnosis and billing code. Currently,
nearly half of all Americans do not
access many commonly recommended
preventive services, which can include
obesity and nutrition education
or prediabetes and blood pressure
screenings.199 Some private insurers
cover some evidence-based community
prevention programs, such as the
Diabetes Prevention Program (DPP),
but these efforts are limited and not
well known or understood in the
provider community.
© Matt Moyer, used with permission from RWJF

65 TFAH • RWJF • StateofObesity.org
In response, many public and private
insurers are increasingly expanding
coverage for proven community-based
programs to achieve better results
for improving health and reducing
obesity rates. One factor that
contributed to this was the enactment
of the Affordable Care Act (ACA),
which has helped create incentives
and mechanisms for new models
to improve focus on a coordinated
continuum of care that begins with
a focus on prevention — inside and
outside the doctor’s office. Several
provisions that help support the
prevention and control of obesity and
related diseases include:
l Requiring new plans (private, self-
insurers and Medicare) to cover
screening and counseling for obesity
with no cost to the patient through co-
payments, co-insurance or deductibles.
l Providing incentives to encourage
state Medicaid programs to cover
more preventive services. In
2013, the Centers for Medicare
and Medicaid Services (CMS)
issued a rule that would give
states greater flexibility in what
types of providers could provide
recommended preventive services,
such as for obesity education and
counseling activities.
l Integrating public health and
healthcare via new approaches, such
as Accountable Care Organizations
(ACOs) and global payment
and “wellness trust” models.
Coordination efforts can increase
the focus on improving the overall
health of the insurance pool and
offer strong incentives to providers
to deliver the most effective care
strategies possible, and to maximize
effectiveness, including community-
based prevention programs and
services to provide support to
patients to be able to follow doctor’s
advice in their daily lives. ACOs
are groups of healthcare providers
that prioritize coordinated care and
quality goals to achieve improved
health for their patients which
reduce costs.200
l Updating tax-exempt hospitals’
community benefit requirement by
requiring a community health needs
assessment and implementation
strategy in order to maintain tax-
exempt status. New U.S. Treasury
Regulations on community benefit
administered by the Internal Revenue
Service could address whether a
community benefit implementation
strategy may include activities related
to obesity prevention.
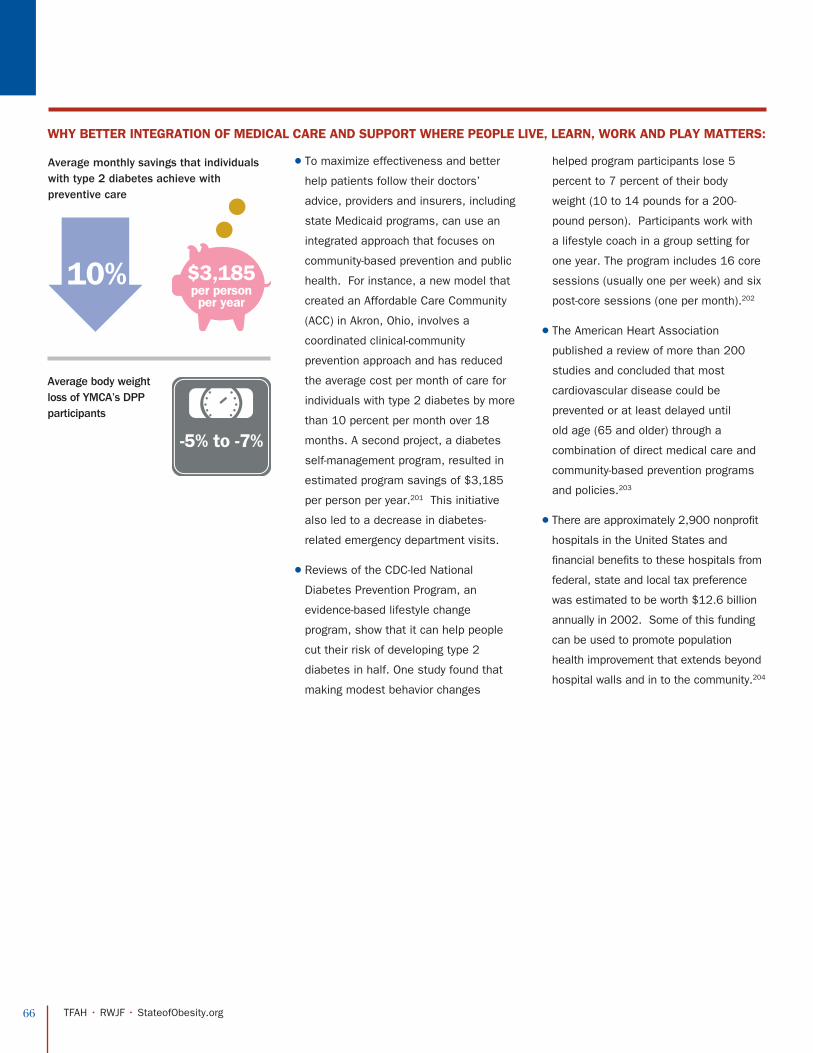
66 TFAH • RWJF • StateofObesity.org
WHY BETTER INTEGRATION OF MEDICAL CARE AND SUPPORT WHERE PEOPLE LIVE, LEARN, WORK AND PLAY MATTERS:
l To maximize effectiveness and better
help patients follow their doctors’
advice, providers and insurers, including
state Medicaid programs, can use an
integrated approach that focuses on
community-based prevention and public
health. For instance, a new model that
created an Affordable Care Community
(ACC) in Akron, Ohio, involves a
coordinated clinical-community
prevention approach and has reduced
the average cost per month of care for
individuals with type 2 diabetes by more
than 10 percent per month over 18
months. A second project, a diabetes
self-management program, resulted in
estimated program savings of $3,185
per person per year.201 This initiative
also led to a decrease in diabetes-
related emergency department visits.
l Reviews of the CDC-led National
Diabetes Prevention Program, an
evidence-based lifestyle change
program, show that it can help people
cut their risk of developing type 2
diabetes in half. One study found that
making modest behavior changes
helped program participants lose 5
percent to 7 percent of their body
weight (10 to 14 pounds for a 200-
pound person). Participants work with
a lifestyle coach in a group setting for
one year. The program includes 16 core
sessions (usually one per week) and six
post-core sessions (one per month).202
l The American Heart Association
published a review of more than 200
studies and concluded that most
cardiovascular disease could be
prevented or at least delayed until
old age (65 and older) through a
combination of direct medical care and
community-based prevention programs
and policies.203
l There are approximately 2,900 nonprofit
hospitals in the United States and
financial benefits to these hospitals from
federal, state and local tax preference
was estimated to be worth $12.6 billion
annually in 2002. Some of this funding
can be used to promote population
health improvement that extends beyond
hospital walls and in to the community.204
Average body weight loss of YMCA’s DPP participants
Average monthly savings that individuals with type 2 diabetes achieve with preventive care
10% $3,185per personper year
-5% to -7%
67 TFAH • RWJF • StateofObesity.org
Policy Recommendations: l Encourage and incentivize new health system
approaches, such as ACOs, to incorporate community
obesity prevention programs to help them be successful
in improving health and lowering costs.
l Government and private insurers should implement
policies and programs to increase the use and
improved integration of clinical and community-based
preventive services, particularly among communities
where services are underutilized.
l Medicaid should provide additional technical assistance
and education to increase uptake in use of the new
regulations for preventive services that allow states to
reimburse a broader array of health providers and entities.
l Medicaid should identify and disseminate community
prevention best practices by Medicaid programs,
including Medicaid Managed Care Organizations.
l Broader healthcare delivery reform efforts, such as
the CMS Innovation Center-funded State Innovation
Models, should ensure that community-based
prevention to control obesity costs are included.
l The U.S. Department of Treasury should continue
to clarify the use of community benefit dollars by
nonprofit hospitals to improve population health.

68 TFAH • RWJF • StateofObesity.org
ADDITIONAL RESOURCES:
Total Health: Public Health and Healthcare in Action Case Study. T. Norris. Kaiser Permanente:
http://healthyamericans.org/health-issues/prevention_story/total-health-public-health-and-health-care-in-action
Hospital Community Benefits after the ACA: Present Posture, Future Challenges. The Hilltop Institute Hospital Community
Benefit Program:
http://www.hilltopinstitute.org/publications/HospitalCommunityBenefitsAfterTheACA-PresentFutureIssueBrief8-October2013.pdf
EXAMPLES OF IMPROVING THE CLINICAL-COMMUNITY CONTINUUM OF CARE
l A number of providers have been using the Chronic Disease
Self-Management Program (also known as Better Choices,
Better Health), which helps doctors connect patients to
community-based health workshops. Referred patients have
an extended opportunity during a series of
workshops to learn about effective exercise,
good nutrition, communicating with health
professionals and families about needs and
other strategies. The program, which is
based on an evidence-based model devel-
oped at Stanford University, has shown re-
sults in improved health outcomes, reduced
utilization of healthcare and increase use of
self-management techniques.205
l A number of health systems and providers are also creating
referral systems to connect patients with community-support
programs. For example:
l The Division of Health Promotion and Chronic Disease Pre-
vention in the Iowa Department of Health has partnered with
the Iowa Primary Care Association (IPCA) and local boards
of health to create a Community Referral Project, so doctors
have access and information about programs in their commu-
nities and can refer and match patients to those resources.
l The Boston Medical Center and Boston
Bikes have partnered to create a Prescribe-
a-Bike program. Doctors and nurses can
write prescriptions for the local bike share
program, New Balance Hubway, that allow
their patients to rent a bike for $5 to $80
less than the regular charge. The program
helps support health, equity and access to
affordable transportation for more lower-
income Boston residents.206
l Integrating clinical care with community-based programs is
a focus of HHS’s Million Hearts®, a national initiative that
aims to prevent 1 million heart attacks and strokes by 2017.
A key objective is reducing uncontrolled high blood pressure
— which obesity can contribute to — by supporting improved
nutrition, increased physical activity, integrated medical care
and other strategies.
$20 for Prescribe-a-Bike
Connecting Diabetes Care from the Clinic to the Community
In 2011, the Bon Secours St. Francis Health System in
Greenville, South Carolina created a Diabetes Integrated
Practice Unit (IPU) to foster a new environment that
improves the health of patients with, or at risk of
developing, type 2 diabetes.
Since most of the factors that influence
health exist outside of the doctor’s
office, we’ve learned the importance of
connecting our patients to resources
in their communities. This helps them
in their daily lives and better supports
their ongoing medical care.
The goal of the Diabetes IPU is to
connect patients with community
resources that can help benefit their
health through improved nutrition,
increased physical activity and support
to manage their condition. The
program also ensures that physicians
and other caregivers have sufficient
time to focus on their patient’s needed
care. This added time also allows
providers and patients to work together
to understand how obesity, prediabetes
and diabetes can affect health and daily
life and to set goals that work for each
patient’s unique circumstances.
The program also emphasizes
the importance of prevention,
to avoid developing additional
health risks or problems in the
future. We help prediabetics
avoid the progression to
diabetes and help diabetics
avoid developing additional
conditions.
The program is designed around a
network of community and clinical
resources, providers and technology.
While the program hub is at St.
Francis Millennium, the programs
themselves are delivered where
patients are—at work, home, and
throughout the community.
EXPERT COMMENTARY
BY JOHNNA REED, vice president,
business development, Bon Secours
Health System
69 TFAH • RWJF • StateofObesity.org
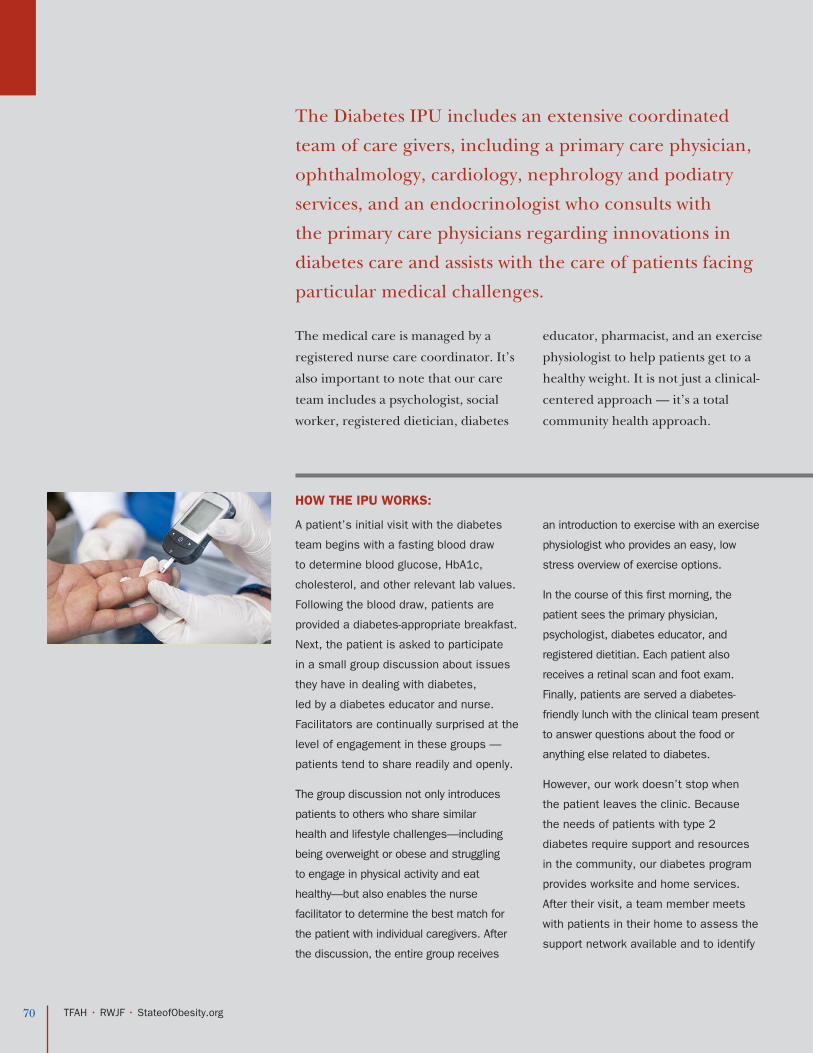
HOW THE IPU WORKS:
A patient’s initial visit with the diabetes
team begins with a fasting blood draw
to determine blood glucose, HbA1c,
cholesterol, and other relevant lab values.
Following the blood draw, patients are
provided a diabetes-appropriate breakfast.
Next, the patient is asked to participate
in a small group discussion about issues
they have in dealing with diabetes,
led by a diabetes educator and nurse.
Facilitators are continually surprised at the
level of engagement in these groups —
patients tend to share readily and openly.
The group discussion not only introduces
patients to others who share similar
health and lifestyle challenges—including
being overweight or obese and struggling
to engage in physical activity and eat
healthy—but also enables the nurse
facilitator to determine the best match for
the patient with individual caregivers. After
the discussion, the entire group receives
an introduction to exercise with an exercise
physiologist who provides an easy, low
stress overview of exercise options.
In the course of this first morning, the
patient sees the primary physician,
psychologist, diabetes educator, and
registered dietitian. Each patient also
receives a retinal scan and foot exam.
Finally, patients are served a diabetes-
friendly lunch with the clinical team present
to answer questions about the food or
anything else related to diabetes.
However, our work doesn’t stop when
the patient leaves the clinic. Because
the needs of patients with type 2
diabetes require support and resources
in the community, our diabetes program
provides worksite and home services.
After their visit, a team member meets
with patients in their home to assess the
support network available and to identify
The Diabetes IPU includes an extensive coordinated
team of care givers, including a primary care physician,
ophthalmology, cardiology, nephrology and podiatry
services, and an endocrinologist who consults with
the primary care physicians regarding innovations in
diabetes care and assists with the care of patients facing
particular medical challenges.
The medical care is managed by a
registered nurse care coordinator. It’s
also important to note that our care
team includes a psychologist, social
worker, registered dietician, diabetes
educator, pharmacist, and an exercise
physiologist to help patients get to a
healthy weight. It is not just a clinical-
centered approach — it’s a total
community health approach.
70 TFAH • RWJF • StateofObesity.org
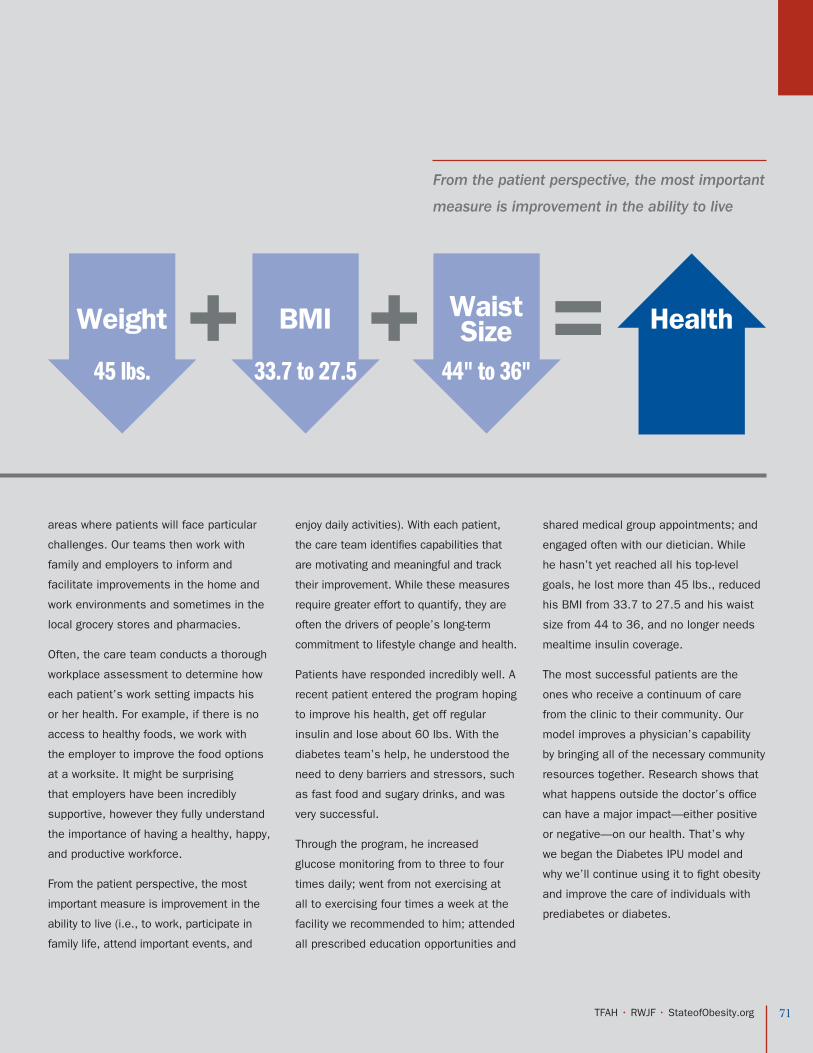
areas where patients will face particular
challenges. Our teams then work with
family and employers to inform and
facilitate improvements in the home and
work environments and sometimes in the
local grocery stores and pharmacies.
Often, the care team conducts a thorough
workplace assessment to determine how
each patient’s work setting impacts his
or her health. For example, if there is no
access to healthy foods, we work with
the employer to improve the food options
at a worksite. It might be surprising
that employers have been incredibly
supportive, however they fully understand
the importance of having a healthy, happy,
and productive workforce.
From the patient perspective, the most
important measure is improvement in the
ability to live (i.e., to work, participate in
family life, attend important events, and
enjoy daily activities). With each patient,
the care team identifies capabilities that
are motivating and meaningful and track
their improvement. While these measures
require greater effort to quantify, they are
often the drivers of people’s long-term
commitment to lifestyle change and health.
Patients have responded incredibly well. A
recent patient entered the program hoping
to improve his health, get off regular
insulin and lose about 60 lbs. With the
diabetes team’s help, he understood the
need to deny barriers and stressors, such
as fast food and sugary drinks, and was
very successful.
Through the program, he increased
glucose monitoring from to three to four
times daily; went from not exercising at
all to exercising four times a week at the
facility we recommended to him; attended
all prescribed education opportunities and
shared medical group appointments; and
engaged often with our dietician. While
he hasn’t yet reached all his top-level
goals, he lost more than 45 lbs., reduced
his BMI from 33.7 to 27.5 and his waist
size from 44 to 36, and no longer needs
mealtime insulin coverage.
The most successful patients are the
ones who receive a continuum of care
from the clinic to their community. Our
model improves a physician’s capability
by bringing all of the necessary community
resources together. Research shows that
what happens outside the doctor’s office
can have a major impact—either positive
or negative—on our health. That’s why
we began the Diabetes IPU model and
why we’ll continue using it to fight obesity
and improve the care of individuals with
prediabetes or diabetes.
From the patient perspective, the most important
measure is improvement in the ability to live
71 TFAH • RWJF • StateofObesity.org
45 lbs. 33.7 to 27.5 44" to 36"+ + =Weight Waist
SizeBMI Health

The State of Obesity:
Key Findings
SEC
TIO
N 8: C
OST
CO
NT
AIN
ME
NT
AN
D O
BE
SITY P
RE
VE
NT
ION
SECTION 8:
SEP
TE
MB
ER
2014
Cost Containment and Obesity Prevention
CURRENT STATUS:
Obesity is one of the biggest drivers of preventable
chronic diseases and healthcare costs in the United
States. Currently, estimates for these costs range from
$147 billion to nearly $210 billion per year.207 In
addition, job absenteeism related to obesity costs $4.3
billion annually.208
If obesity rates continue on their
current trajectory, by 2030, combined
medical costs associated with treating
preventable obesity-related diseases
are estimated to increase by between
$48 billion and $66 billion per year,
and the loss in economic productivity
could be between $390 billion and
$580 billion annually.209
As obesity rates rise, the risk of
developing obesity-related health
problems — type 2 diabetes, coronary
heart disease and stroke, hypertension,
arthritis and obesity-related cancer
— increases exponentially.210 Twenty
years ago, only 7.8 million Americans
had been diagnosed with diabetes
but, today, approximately 25.8 million
Americans have the disease.211 More
than 75 percent of hypertension cases
can be attributed to obesity.212 And,
approximately one-third of cancer
deaths are linked to obesity or lack of
physical activity.213
Hypertension Attributed to
Obesity
75%
Cancer Deaths Linked to Obesity
33%2014
25.8 million
Americans Diagnosed with Diabetes
1994 7.8
million
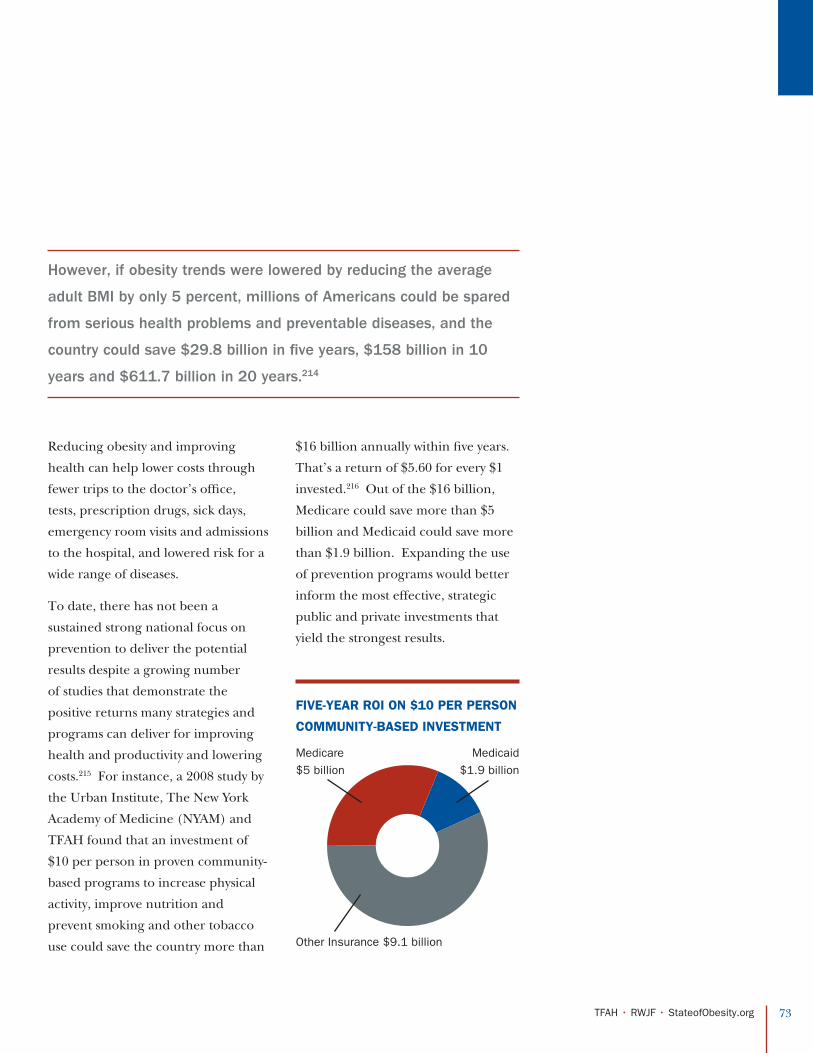
73 TFAH • RWJF • StateofObesity.org
However, if obesity trends were lowered by reducing the average
adult BMI by only 5 percent, millions of Americans could be spared
from serious health problems and preventable diseases, and the
country could save $29.8 billion in five years, $158 billion in 10
years and $611.7 billion in 20 years.214
Reducing obesity and improving
health can help lower costs through
fewer trips to the doctor’s office,
tests, prescription drugs, sick days,
emergency room visits and admissions
to the hospital, and lowered risk for a
wide range of diseases.
To date, there has not been a
sustained strong national focus on
prevention to deliver the potential
results despite a growing number
of studies that demonstrate the
positive returns many strategies and
programs can deliver for improving
health and productivity and lowering
costs.215 For instance, a 2008 study by
the Urban Institute, The New York
Academy of Medicine (NYAM) and
TFAH found that an investment of
$10 per person in proven community-
based programs to increase physical
activity, improve nutrition and
prevent smoking and other tobacco
use could save the country more than
$16 billion annually within five years.
That’s a return of $5.60 for every $1
invested.216 Out of the $16 billion,
Medicare could save more than $5
billion and Medicaid could save more
than $1.9 billion. Expanding the use
of prevention programs would better
inform the most effective, strategic
public and private investments that
yield the strongest results.
FIVE-YEAR ROI ON $10 PER PERSON
COMMUNITY-BASED INVESTMENT
Medicaid $1.9 billion
Medicare $5 billion
Other Insurance $9.1 billion

74 TFAH • RWJF • StateofObesity.org
HIGHER HEALTHCARE COSTS FOR ADULTS
l Obese adults spend 42 percent more
on direct healthcare costs than healthy-
weight people.217
l Per capita healthcare costs for severely
or morbidly obese (BMI >40) were 81
percent greater than for normal weight
adults.218 Around $11 billion was spent
on medical expenditures for morbidly
obese U.S. adults in 2000.
l Moderately obese (BMI between 30 and
35) individuals are more than twice as
likely as normal weight individuals to be
prescribed prescription pharmaceuticals
to manage medical conditions.219
l Costs for patients presenting at
emergency rooms with chest pains
were 41 percent higher for severely
obese patients, 28 percent higher for
obese patients and 22 percent higher
for overweight patients than for normal-
weight patients.220
HIGHER HEALTHCARE COSTS FOR CHILDREN
l Obesity contributes an estimated
incremental lifetime medical cost of
$19,000 per 10-year-old child when
compared with a normal-weight 10-year-
old child. When multiplied by the
number of obese 10-year-olds in the
United States, lifetime medical costs
for just this cohort would amount to
approximately $14 billion in direct
medical costs.221, 222
l Obese children had $194 higher
outpatient visit expenditures, $114
higher prescription drug expenditures
and $25 higher emergency room
expenditures, based on a two-year
Medical Expenditure Panel Survey.223
l Overweight and obesity in childhood
is associated with $14.1 billion in
additional prescription drug, emergency
room and outpatient visit costs annually.
l The average total health cost for a
child treated for obesity under private
insurance is $3,743, while the average
health cost for all children covered by
private insurance is $1,108.224
l Hospitalizations of children and youths
with a diagnosis of obesity nearly
doubled between 1999 and 2005, while
total costs for children and youths with
obesity-related hospitalizations increased
from $125.9 million in 2001 to $237.6
million in 2005 (in 2005 dollars).225
DECREASED WORKER PRODUCTIVITY
AND INCREASED ABSENTEEISM
l Obesity-related job absenteeism costs
$4.3 billion annually.226
l Obesity is associated with lower
productivity while at work (presenteeism),
which costs employers $506 per obese
worker per year.227
l As a person’s BMI increases, so do the
number of sick days, medical claims and
healthcare costs associated with that
person.228 Obese women used 5.19 more
sick days and obese men used an excess
of 3.48 sick days compared with normal
weight individuals, according to a 2014
German study.229
HIGHER WORKERS’ COMPENSATION CLAIMS
l A number of studies have shown
obese workers have higher workers’
compensation claims.230, 231, 232, 233, 234, 235
Medical claims cost $7,503 for healthy-
weight workers and $51,091 for obese
workers (annual costs, United States).236
WHY CONTAINING OBESITY-RELATED HEALTHCARE COSTS MATTERS:
Total Annual Private Insurance Child Healthcare Expenses
Obesity-related Hospitalization Costs for Children and Youths
Annual Medical Claims per 100 Full-time Employees
Difference in Emergency Room Costs for Patients Presenting With Chest Pains Compared with a Normal-weight Patient
All Children $1,108
Obese Children $3,743
2005
$237.6 million
2001 $125.9 million
Healthy-weight $7,503
Obese $51,091
41%Higher
22%Higher
28%Higher
Severly ObeseObeseOverweight

75 TFAH • RWJF • StateofObesity.org
l Preventing obesity and its related chronic diseases should
be a major focus of healthcare cost-containment efforts.
l Funding for obesity-prevention programs will be
important to achieve results in improving health and
reducing healthcare costs. Programs and policies
should include a wide range of partners to ensure
success, including businesses, schools, community- and
faith-based organizations, economic and community
developers and health and social service providers.
l Because community-based obesity- and disease-
prevention programs can significantly cut healthcare
costs, funding for evidence-based programs at all levels of
government will continue to be important.
l Community-based programs must include the ability to
evaluate effectiveness and cost savings, and demonstrate
how savings can be shared among partners, including
businesses and the healthcare system, and reinvested to
continue to support and expand prevention activities.
Policy Recommendations:
ADDITIONAL RESOURCES:
Bending the Obesity Cost Curve. Trust for America’s Health. February 2012:
http://healthyamericans.org/assets/files/TFAH%202012ObesityBrief06.pdf
Return on Investments in Public Health Saving Lives and Money. The Robert Wood Johnson Foundation.
December 2013: http://www.rwjf.org/en/research-publications/find-rwjf-research/2013/12/return-on-investments-in-public-health.html
Assessing the Economics of Obesity and Obesity Interventions. M.J. O’Grady and J.C. Capretta.
Campaign to End Obesity. March 2012: http://www.rwjf.org/en/about-rwjf/newsroom/newsroom-content/2012/03/new-report-
shows-importance-of-calculating-full-cost-savings-of-.html

76 TFAH • RWJF • StateofObesity.org
FEDERAL FUNDING FOR OBESITY PREVENTION
Public health programs are funded through
a combination of federal, state and local
dollars. Analyses from a number of or-
ganizations, including the IOM, NYAM,
CDC and a range of other experts have
found that public health has been severely
underfunded for decades and does not re-
ceive sufficient support to carry out many
core functions, including programs to pre-
vent disease and obesity.237
Much of the federal support for obesity
prevention is through grants to states
distributed through CDC’s National Cen-
ter for Chronic Disease Prevention and
Health Promotion (NCCDPHP).
Federal funding for chronic disease
prevention reached an all-time high of
$1.16 billion in FY 2012, but then ex-
perienced a 17 percent cut in FY 2013.
The FY 2014 Omnibus Appropriations
Bill restored $185 million to chronic dis-
ease programs, largely as part of Pre-
vention and Public Health Fund dollars
— to reach a total of $1.15 billion.
Despite the increase, the overall limited
nature of funding for prevention has
meant decreased and inconsistent
support for the various categorical
disease-prevention and health-
promotion programs.
For example, while the Division of
Nutrition, Physical Activity and Obesity
(DNPAO)—a division that specifically
focuses on the obesity epidemic,
improving nutrition, and increasing
activity within NCCDPHP—received
total amounts of ($47.5 million) in FY
2013 and ($49.5 million) in FY 2014,
the division experienced a 21 percent
cut to its core activities. Instead of
adding to the funding base to be able
to focus on high-priority initiatives,
including breastfeeding, early child
care education and a new “high-
risk” obesity initiative that provides
$5 million in competitive grants to
communities where obesity rates are
above 40 percent, the funds to support
these efforts have been carved out
from DNPAO’s overall budget, leaving
significantly less money for grants to
states and core program activities.
Although the State Public Health Actions
funding opportunity announcement (FOA)
provides funding to all 50 states and D.C.
to conduct public health functions related
to obesity prevention such as epidemiology
and surveillance activities, DNPAO funding
for state level obesity prevention strategies
with expanded reach and impact related
to nutrition and physical activity has de-
creased and are funded at lower levels
that those related to diabetes and heart
disease. For example, in FY2013 DNPAO
provided $16.7 million to states for obe-
sity prevention, while diabetes and heart
disease received $20.7 million and $23.3
million, respectively. Currently, CDC does
not have sufficient or sustained funds to
maintain obesity prevention activities or to
build upon or scale effective programs.
In FY 2013, NCCDPHP released a FOA
that brings together four programs that
were previously standalone programs:
heart disease and stroke; nutrition,
physical activity and obesity; school
health; and diabetes. The FOA, entitled
State Public Health Actions to Prevent
and Control Diabetes, Heart Disease,
Obesity and Associated Risk Factors and
Promote School Health, aims to efficiently
implement cross-cutting strategies in a
variety of settings that improve multiple
chronic diseases and conditions, while
maintaining categorical appropriation
funding levels and performance targets.
Coordination is intended to improve the
impact of efforts to prevent obesity and
conditions related to obesity, such as
diabetes and heart disease.
DIVISION OF NUTRITION, PHYSICAL ACTIVITY AND OBESITY FY 2013 TO 2014 FUNDINGFY 2013 FY 2014
DNPAO Total $47.5 million $49.5 million
• Breastfeeding initiative $2.5 million $8 million
• Early child care education (ECE) $4 million $4 million
• High-risk obesity n/a $5 million
Total unrestricted for core activities $41 million $32.5 million
*21 percent decrease in unrestricted funds from FY 2013 to 2014
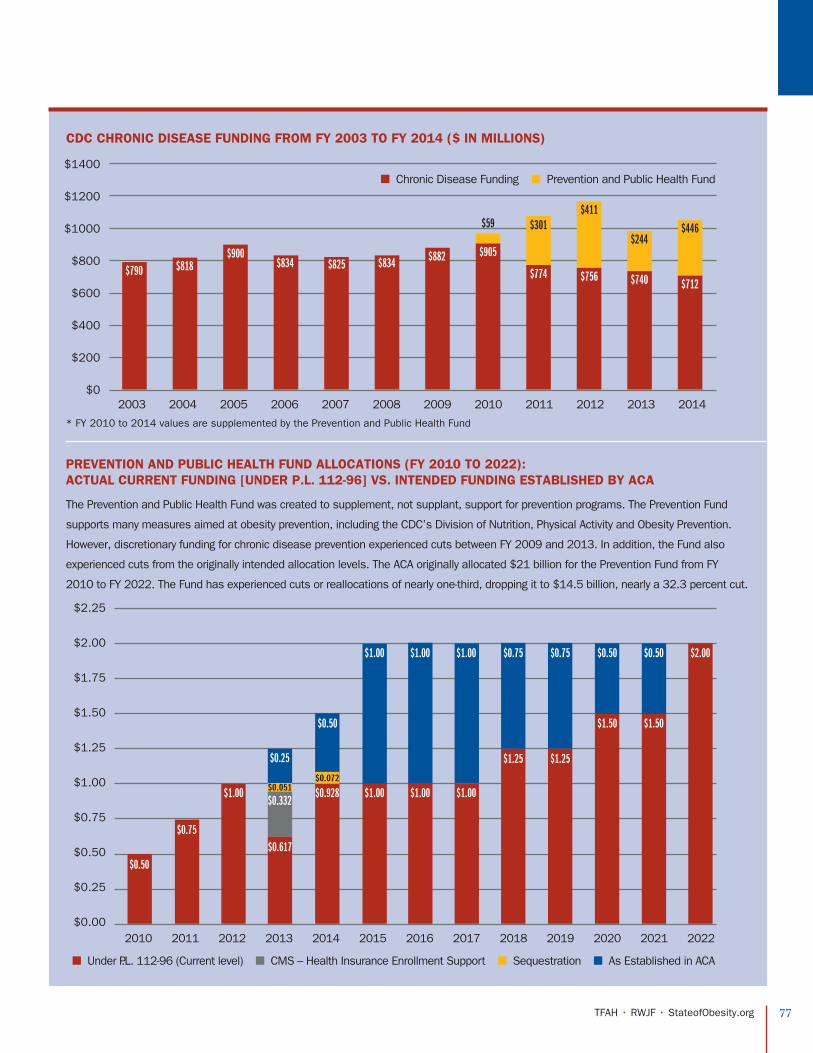
77 TFAH • RWJF • StateofObesity.org
CDC CHRONIC DISEASE FUNDING FROM FY 2003 TO FY 2014 ($ IN MILLIONS)
$1400
$1200
$1000
$800
$600
$400
$200
$02003 2004 2005 2006 2007 2008 2009 2010 2011 2012 2013 2014
$790 $818 $834 $825 $834 $882 $905
$59
$774
$301
$756
$411
$740
$244
$712
$446
$900
■ Chronic Disease Funding ■ Prevention and Public Health Fund
* FY 2010 to 2014 values are supplemented by the Prevention and Public Health Fund
$2.25
$2.00
$1.75
$1.50
$1.25
$1.00
$0.75
$0.50
$0.25
$0.00
$0.051
■ Under P.L. 112-96 (Current level) ■ CMS – Health Insurance Enrollment Support ■ Sequestration ■ As Established in ACA
$0.072
$0.50
$0.75
$0.332
$0.617
$0.25
$0.928
$0.50
$1.00 $1.00
$1.00 $1.00
$1.00
$1.00
$1.25
$0.75
$1.25
$0.75
$1.50
$0.50
$1.50
$0.50 $2.00
$1.00
2010 2011 2012 2013 2014 2015 2016 2017 2018 2019 2020 2021 2022
PREVENTION AND PUBLIC HEALTH FUND ALLOCATIONS (FY 2010 TO 2022): ACTUAL CURRENT FUNDING [UNDER P.L. 112-96] VS. INTENDED FUNDING ESTABLISHED BY ACA
The Prevention and Public Health Fund was created to supplement, not supplant, support for prevention programs. The Prevention Fund
supports many measures aimed at obesity prevention, including the CDC’s Division of Nutrition, Physical Activity and Obesity Prevention.
However, discretionary funding for chronic disease prevention experienced cuts between FY 2009 and 2013. In addition, the Fund also
experienced cuts from the originally intended allocation levels. The ACA originally allocated $21 billion for the Prevention Fund from FY
2010 to FY 2022. The Fund has experienced cuts or reallocations of nearly one-third, dropping it to $14.5 billion, nearly a 32.3 percent cut.
78 TFAH • RWJF • StateofObesity.org
DIVISION OF NUTRITION, PHYSICAL ACTIVITY AND OBESITY
DNPAO supports healthy eating,
active living and obesity prevention
by creating healthy options in our
nation’s child care centers, schools,
worksites, cities and communities.
Partnerships with state, local, territo-
rial and tribal health departments,
private enterprise, nonprofit organiza-
tions and healthcare professionals
and coordination with other agencies
extend their work and reinforce
consistent public health recommenda-
tions with promising practice.
The division focuses on improving dietary
quality to support healthy child devel-
opment and reduce chronic disease;
increasing physical activity for people of
all ages; and decreasing prevalence of
obesity through prevention of weight gain
and maintenance of healthy weight.
DIVISION OF POPULATION HEALTH, SCHOOL HEALTH BRANCH
CDC’s Division of Population Health
(DPH), School Health Branch addresses
nutrition, physical activity and obesity
in schools. In addition to research
and evaluation activities, the School
Health Branch in DPH supports the
school specific activities in the CDC
Funding Opportunity Announcement,
State Public Health Actions to Prevent
and Control Diabetes, Heart Disease,
Obesity and Associated Risk Factors
and Promote School Health. With
this funding, the division supports
all 50 states by funding state health
departments to address nutrition and
physical activity in schools. It also
provides additional enhanced funding
to 32 of the 50 states to support
even more work around policies and
practices around school physical
activity, nutrition and managing chronic
conditions in schools, including obesity.
CUTS TO STATE PUBLIC HEALTH FUNDING
In addition to the funding cuts at
the national level, state-level public
health funding has also experienced
significant cuts, with median per
capita spending decreasing from
$33.71 in FY 2008 to $27.49 in FY
2013. This represents a cut of more
than $1.3 billion, based on the total
states’ budgets from those years,
adjusted for inflation.238 Budget
cuts have led state and local health
departments to cut more than 45,700
jobs across the country since 2008.239

79 TFAH • RWJF • StateofObesity.org
STATE GRANTS CHART
CDC funds many state and local efforts to prevent and control obesity and related diseases. The table below provides a summary
of these grants.
State Public Health Actions: Enhanced Component School Health Grants1 REACH1, 2 Community Transformation
Grants1
Alabama 3 3
Alaska 3Arizona 3 3 3Arkansas 3 3California 3 3 3 3Colorado 3 3 3 3Connecticut 3 3 3 3Delaware 3 3D.C. 3 3Florida 3 3 3 3Georgia 3 3 3Hawaii 3 3Idaho 3 3Illinois 3 3 3Indiana 3 3 3 3Iowa 3 3 3Kansas 3 3 3 3Kentucky 3 3 3 3Louisiana 3 3 3Maine 3 3 3Maryland 3 3 3 3Massachusetts 3 3 3 3Michigan 3 3 3 3Minnesota 3 3 3Mississippi 3 3 3Missouri 3 3 3Montana 3 3 3Nebraska 3 3 3Nevada 3 3New Hampshire 3New Jersey 3 3 3 3New Mexico 3 3 3New York 3 3 3 3North Carolina 3 3 3 3North Dakota 3 3Ohio 3 3 3Oklahoma 3 3Oregon 3 3 3 3Pennsylvania 3 3 3 3Rhode Island 3 3South Carolina 3 3 3 3South Dakota 3 3Tennessee 3 3 3Texas 3 3 3Utah 3 3 3 3Vermont 3 3Virginia 3 3 3 3Washington 3 3 3 3West Virginia 3 3
Wisconsin 3 3 3 3
Wyoming 3
# of States 32 50* 30 40
* The new Funding Opportunity Announcement (FOA) (launched Oct 1 2014) — State Public Health Actions to Prevent and Control Diabetes, Heart Disease, Obesity and associated Risk Factors, and promote School Health — provides a basic level of funding to all 50 states ((School health range: $46,000- $76,000); and an enhanced level of funding to 32 states ((school health range: $78,000-$223,000).
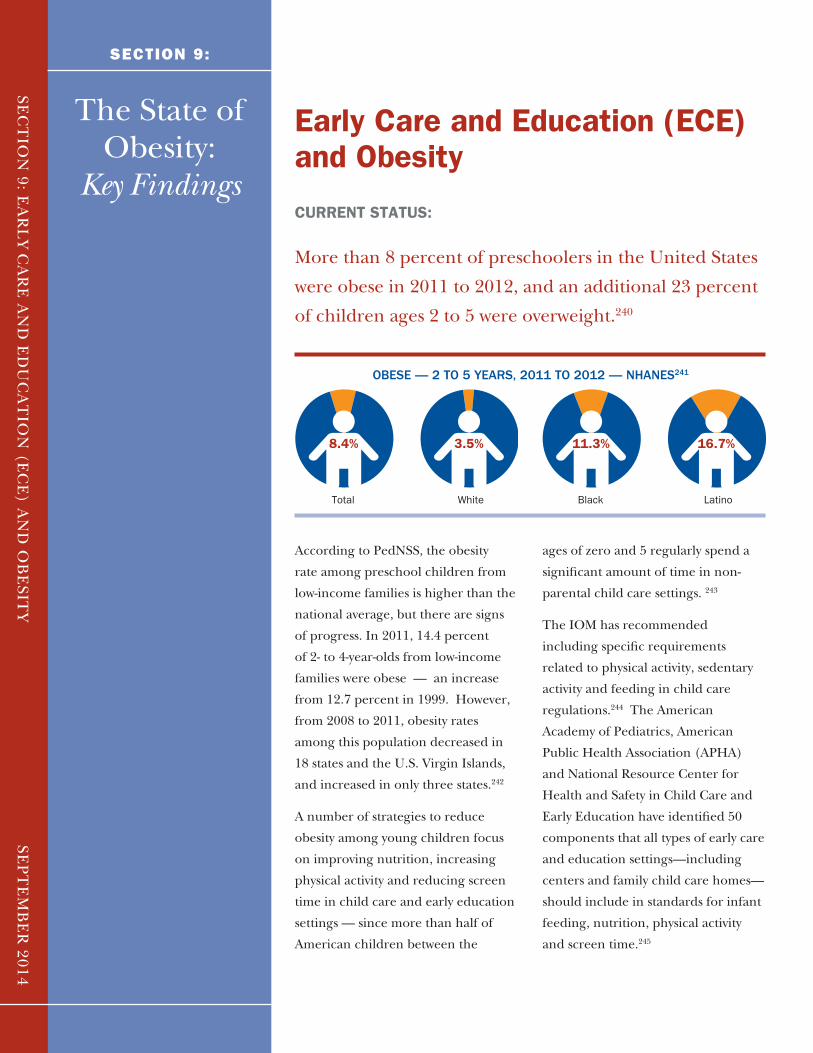
The State of Obesity:
Key Findings
SEC
TIO
N 9: E
AR
LY C
AR
E A
ND
ED
UC
AT
ION
(EC
E) A
ND
OB
ESIT
Y
SECTION 9:
SEP
TE
MB
ER
2014
Early Care and Education (ECE) and Obesity
CURRENT STATUS:
More than 8 percent of preschoolers in the United States
were obese in 2011 to 2012, and an additional 23 percent
of children ages 2 to 5 were overweight.240
According to PedNSS, the obesity
rate among preschool children from
low-income families is higher than the
national average, but there are signs
of progress. In 2011, 14.4 percent
of 2- to 4-year-olds from low-income
families were obese — an increase
from 12.7 percent in 1999. However,
from 2008 to 2011, obesity rates
among this population decreased in
18 states and the U.S. Virgin Islands,
and increased in only three states.242
A number of strategies to reduce
obesity among young children focus
on improving nutrition, increasing
physical activity and reducing screen
time in child care and early education
settings — since more than half of
American children between the
ages of zero and 5 regularly spend a
significant amount of time in non-
parental child care settings. 243
The IOM has recommended
including specific requirements
related to physical activity, sedentary
activity and feeding in child care
regulations.244 The American
Academy of Pediatrics, American
Public Health Association (APHA)
and National Resource Center for
Health and Safety in Child Care and
Early Education have identified 50
components that all types of early care
and education settings—including
centers and family child care homes—
should include in standards for infant
feeding, nutrition, physical activity
and screen time.245
8.4% 3.5% 11.3% 16.7%
OBESE — 2 TO 5 YEARS, 2011 TO 2012 — NHANES241
Total BlackWhite Latino
81 TFAH • RWJF • StateofObesity.org
SOME KEY RECENT EFFORTS AND PROGRAMS TO IMPROVE CHILD CARE QUALITY WITH RESPECT TO OBESITY PREVENTION INCLUDE:
l Lets’ Move! Child Care encourages
ECE providers to meet a basic set of
best practices in five goal areas:
1) Physical activity: provide one
to two hours of physical activity
throughout the day, including
outside play when possible;
2) Screen time: none for children
under age 2 and for those 2 years
and older, limit screen time to 30
minutes per week during child
care and no more than one to two
hours per day at home;
3) Food: serve fruits or vegetables
at every meal, eat meals family-
style whenever possible and avoid
serving fried foods;
4) Beverages: give water during
meals and throughout the day
and avoid sugary drinks. For
children two years and older,
serve low- or non-fat milk and
four to six ounces maximum of
100 percent juice a day; and
5) Infant feeding: provide breast
milk to infants of mothers who
wish to breastfeed, welcome
mothers to nurse mid-day and
support parents’ decisions with
infant feeding.246
The Department of Defense, General
Services Administration, Bright
Horizons, Knowledge Universe, the
Learning Care Group, New Horizons,
YMCA, the Boys and Girls Clubs
of America and others have made
commitments to meet the Let’s
Move! Child Care goals as part of the
Partnership for a Healthier America.247
l The Child and Adult Care
Food Program (CACFP) is a
federal nutrition assistance
entitlement program that provides
reimbursement for meals and
snacks for more than 3.2 million
children from low-income families
in child care centers and child care
services provided in family homes.
CACFP regulates meal patterns and
portion sizes, provides nutrition
education and offers sample menus
and training in meal planning
and preparation to help providers
comply with nutrition standards.248
ECE programs or facilities that are not
required to meet CACFP meal pattern
standards can do so voluntarily to
ensure that meals and snacks meet
the nutritional needs of infants and
children.249 The Healthy, Hunger-
Free Kids Act directed USDA to
improve and better align the CACFP
nutrition standards with the dietary
guidelines, though updated standards
have not yet been proposed.
l The Child Care and Development
Block Grant (CCDBG) is the primary
federal funding stream for child
care in the United States, providing
subsidies for low-income families
to obtain child care so parents can
pursue work, education, or training
opportunities.250 CCDBG offers broad
guidance and flexibility to states for
creating both the child care assistance
program and a program of basic
regulation for child care operations.
The CCDBG Reauthorization Act of
2014 (S.1086) would reauthorize the
program through FY 2020. For the
first time, the bill includes provisions
for child care provider training
around healthy eating and physical
activity as an allowable activity for
quality improvement and would
allow states to make healthy eating
and physical activity a part of their
health and safety requirements. The
bill cleared the Senate in March
2014 but has not yet been considered
by the House as of July 2014.
Additionally, in May 2013, the
Administration for Children and
Families proposed a rule to require
states to provide pre-service training
to participating providers regarding
“age-appropriate nutrition, feeding,
including support for breastfeeding
and physical activity” as a component
of the minimum health and safety
training. The public comment
period has closed, but the final rule
is still pending.
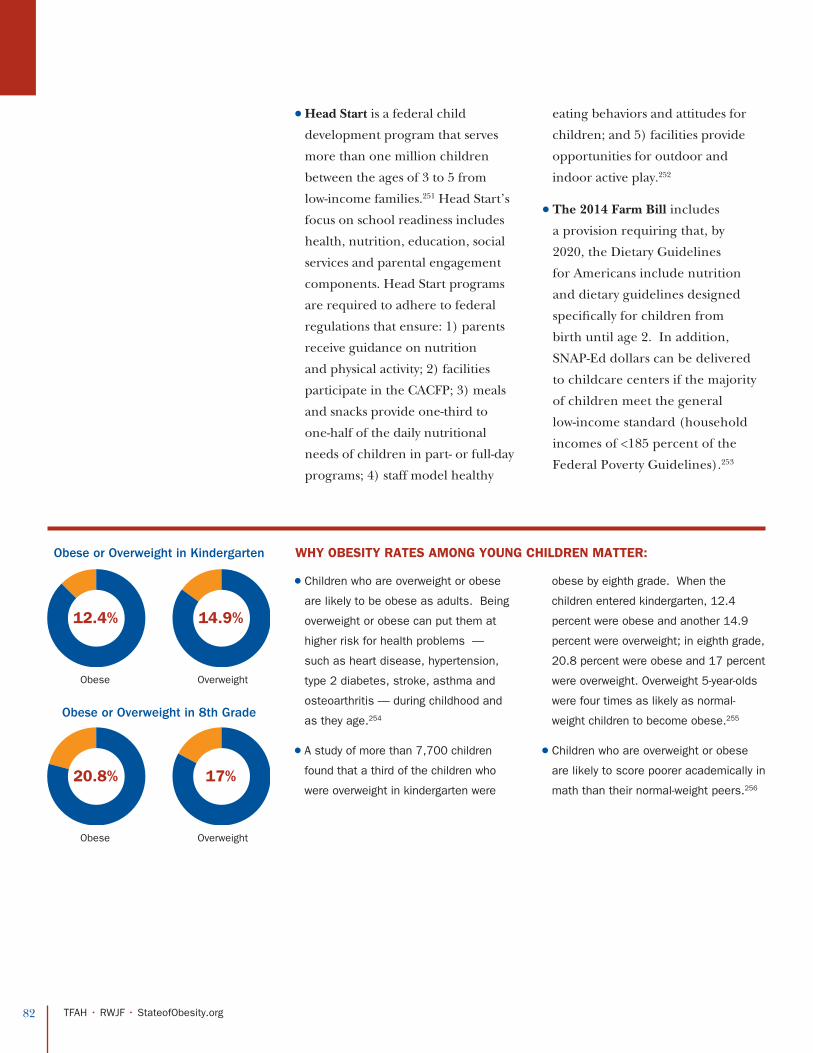
82 TFAH • RWJF • StateofObesity.org
l Head Start is a federal child
development program that serves
more than one million children
between the ages of 3 to 5 from
low-income families.251 Head Start’s
focus on school readiness includes
health, nutrition, education, social
services and parental engagement
components. Head Start programs
are required to adhere to federal
regulations that ensure: 1) parents
receive guidance on nutrition
and physical activity; 2) facilities
participate in the CACFP; 3) meals
and snacks provide one-third to
one-half of the daily nutritional
needs of children in part- or full-day
programs; 4) staff model healthy
eating behaviors and attitudes for
children; and 5) facilities provide
opportunities for outdoor and
indoor active play.252
l The 2014 Farm Bill includes
a provision requiring that, by
2020, the Dietary Guidelines
for Americans include nutrition
and dietary guidelines designed
specifically for children from
birth until age 2. In addition,
SNAP-Ed dollars can be delivered
to childcare centers if the majority
of children meet the general
low-income standard (household
incomes of <185 percent of the
Federal Poverty Guidelines).253
l Children who are overweight or obese
are likely to be obese as adults. Being
overweight or obese can put them at
higher risk for health problems —
such as heart disease, hypertension,
type 2 diabetes, stroke, asthma and
osteoarthritis — during childhood and
as they age.254
l A study of more than 7,700 children
found that a third of the children who
were overweight in kindergarten were
obese by eighth grade. When the
children entered kindergarten, 12.4
percent were obese and another 14.9
percent were overweight; in eighth grade,
20.8 percent were obese and 17 percent
were overweight. Overweight 5-year-olds
were four times as likely as normal-
weight children to become obese.255
l Children who are overweight or obese
are likely to score poorer academically in
math than their normal-weight peers.256
WHY OBESITY RATES AMONG YOUNG CHILDREN MATTER:
12.4% 14.9%
20.8% 17%
Obese or Overweight in Kindergarten
Obese or Overweight in 8th Grade
Obese
Obese
Overweight
Overweight
83 TFAH • RWJF • StateofObesity.org
l Child care providers and early childhood educators should provide opportunities for physical activity and healthy eating for the children they serve, including:
• Entering into shared-use agreements with community partners to utilize outdoor space for physical activity.
• Identifying creative ways to purchase and prepare healthy foods and physical activity equipment at a lower cost, including local sourcing, purchasing cooperatives, group purchasing organizations and central kitchens.
• Establishing gardens and participating in farm-to-child care programs, if available.
• Engaging families in menu planning and physical activity events.
l USDA should issue updated meal patterns for CACFP, as per the Healthy, Hunger-Free Kids Act.
l The Office of Head Start should ensure that nutrition and physical activity standards and initiatives are reviewed and updated regularly to ensure they reflect current national recommendations.
l Obesity prevention strategies should be incorporated into the licensing of child care facilities and states should inte-grate obesity prevention (nutrition, physical activity, screen time, professional development and parent and family en-gagement) into their Quality Rating and Improvement Sys-tem (QRIS) — a state’s voluntary, comprehensive approach that incentivizes quality improvement of ECE programs.
l States and localities should provide comprehensive obesity prevention pre-service training as well as technical assistance and continuing education for child care and early education providers.
Policy Recommendations:

84 TFAH • RWJF • StateofObesity.org
CASE STUDIES
l Maryland requires all child care
providers, including home-based
care, to follow CACFP nutrition
guidelines and additional nutrition
standards, including 1) making
water available inside and outside;
2) serving skim or one percent
milk to children over 2-years-old;
3) serving whole milk to 1- to
2-year-olds who are not on breast
milk or formula, or 2 percent
milk to those at risk for obesity
or hypercholesterolemia; and 4)
developing a plan for introducing
age-appropriate solid foods.
Maryland’s success in implementing
the guidelines has been attributed
to its collaborative work and
to its regular dissemination of
information and resources to
child care providers across the
state. The state’s education and
health departments work together
in partnership with outside
organizations and local child care
resource and referral agencies.257
l The Texas Farm to Child Care
program’s goal is to improve the
health and nutrition of children
in child care and early education
settings by encouraging the
purchase of local produce. In
2010, USDA’s Food and Nutrition
Service awarded $1 million
in CACFP grants to the Texas
Department of Agriculture. A
portion of the grant was used
to establish Farm to Child Care
initiatives in centers and home-
based day care across the state.
The grants were used to establish
connections with local growers
and farmers, to develop direct
purchasing relationships to buy
local fruits and vegetables for
CACFP snacks and meals and
sustain change in child care
settings.The initiative reached 292
child care centers and day care
homes serving more than 14,000
preschool children and their
parents or guardians. Caregivers
partnered with parents to bring
some of the same lessons being
taught in school to homes — such
as teaching children and parents
how to start their own gardens so
they could serve more fruits and
vegetables.258
l California’s CACFP has created
a recognition program called
Preschools Shaping Healthy
Impressions through Nutrition
and Exercise (SHINE). An early
child care facility can become
a Preschools SHINE site if
they require online training,
attend training forums, conduct
self-assessments of their
environments and develop
policies and practices related to
enhanced nutrition standards,
mealtime environments,
classroom nutrition education,
edible gardens, physical activity,
wellness policies, professional
development, partnerships and
leadership teams.259

85 TFAH • RWJF • StateofObesity.org
CDC AND ECE PROGRAMS
CDC has made obesity prevention in
early care and education a high priority.
The agency provides funding, training
and technical assistance to a variety
of state and community agencies
and other organizations to implement
obesity prevention efforts targeting ECE
settings. Some key projects include:
l Development of a framework and
technical assistance materials for
obesity prevention efforts targeting
ECE settings and regular convening of
stakeholders working on these efforts
and dissemination of resources.260
l State Public Health Actions to
Prevent and Control Diabetes, Heart
Disease, Obesity and Associated Risk
Factors and Promote School Health:
This five-year cooperative agreement
funds all 50 states and Washington,
D.C. for chronic disease prevention
efforts. All grant recipients are
required to promote physical activity
in ECE settings and many are also
implementing nutrition standards.
l National Early Care and Education
Learning Collaboratives Project:
This five-year cooperative agreement,
launched in 2012, funds Nemours
to establish and implement ECE
learning collaboratives in states to
make improvements in nutrition,
breastfeeding support, physical
activity and screen time. Participating
providers exchange ideas with
peers, learn from experts, share
tools and receive training to assist
them in improving their policies
and practices. Year one (FY 2012)
provided funding to Arizona, Florida,
Indiana, Kansas, Missouri and
New Jersey and year two (FY 2013)
funding expanded the project to
Kentucky, Los Angeles County and
Virginia. By the end of FY 2014,
Nemours expects to reach almost
64,000 children in 717 centers
across nine states.261
l Childhood Obesity Research
Demonstration Project (CORD):
This four-year cooperative agreement
provides funding to four grantees to
improve nutrition and physical activity
behaviors among children ages 2 to
12 years covered by the Children’s
Health Insurance Program. CORD
project grantees are working with
60 ECEs in Texas, California and
Massachusetts to provide training,
technical assistance and support.

8686 TFAH • RWJF • StateofObesity.org
Nemours: Childhood Obesity Prevention Toolkit for Rural Communities
Children living in rural areas are 25
percent more likely than those living
in metropolitan areas to be obese or
overweight.262 Often, long distances
separate the home from opportunities
for physical activity or healthy eating, as
well as from healthcare providers, which
can prevent families from addressing
obesity and promoting health.263
To help rural communities address
these barriers, Nemours, a foundation
that operates an integrated children’s
health system, prepared a Childhood
Obesity Prevention Toolkit for Rural
Communities. The toolkit provides
a range of strategies and success
stories to assist practitioners in child-
serving sectors, including: early care
and education, schools, out-of-school
time, community initiatives and health-
care. The toolkit also includes policy
recommendations and an overview of
their evaluation process.
Obesity prevention initiatives profiled
in the toolkit incorporate the following
elements: dynamic leadership from
within the community; multi-sector
partnerships focused on shared goals
and culturally appropriate messages;
youth empowerment and family en-
gagement; training for providers;
hands-on learning techniques for chil-
dren and families; leveraging of public
and private funding; and creative solu-
tions. The profiled communities lever-
age their unique rural resources and
benefit from close community bonds to
improve children’s health.
ADDITIONAL RESOURCES:
Let’s Move! Child Care. Nemours:
http://www.healthykidshealthyfuture.org/welcome.html
Preventing Childhood Obesity in Early Care and Education Programs. American Academy of Pediatrics, American Public Health
Association and National Resource Center for Health and Safety in Child Care and Early Education:
http://nrckids.org/default/assets/File/PreventingChildhoodObesity2nd.pdf
Childhood Obesity Prevention Toolkit for Rural Communities. Nemours:
http://www.nemours.org/content/dam/nemours/wwwv2/filebox/service/healthy-living/growuphealthy/nhps/Childhood%20
Obesity%20Prevention%20Strategies%20for%20Rural%20Communities.pdf
87 TFAH • RWJF • StateofObesity.org
Good Nutrition is Key to a Good Start for Children
When I started Georgetowne Home Preschool in Ocala,
Florida 20 years ago, I was more than 100 pounds
overweight and had little understanding of how important
eating healthy was to happiness, health and success.
I was raised with poor nutritional
habits in a poor family — we
seemingly didn’t have the money or
the information we needed to buy
healthy foods.
This all changed when I started to
take care of other people’s children.
Part of my preparation for becoming a
child care provider included reviewing
an incredibly helpful nutrition
curriculum and additional healthy
eating information supplied by the
state of Florida. I started to realize the
importance of diverse and healthy
foods. As I began practicing good
nutrition, my eating habits changed and
my activity levels improved dramatically.
I lost 100 pounds as a result.
I had to bring this good feeling to
my kids. I joined Florida’s Child
Care Food Program (CCFP) to
help these children eat healthy and
improve their overall learning skills.
Thankfully, our state’s nutrition
standards are quite strong—for more
than a decade, CCFP has limited
sugary foods and drinks and has
required fruit and vegetables at
breakfast and snack time.
Florida’s efforts were ahead of its
time! In 2010, the Healthy, Hunger-
Free Kids Act required the USDA to
develop standards for CACFP meals
that are consistent with the Dietary
Guidelines for Americans. This new
national standard will help preschools
in other states with less rigorous
standards than Florida’s.
I guarantee that once preschools
fully buy into providing nutritious
meals and snacks, their children
will be happier, healthier and
more productive.
Of course, we need to ensure kids buy
into this concept of eating healthy.
When some parents bring me their
little 4-year-olds, they say things like
“my son is a picky eater. He only eats
mac ‘n cheese or chicken nuggets and
doesn’t like fruits or vegetables.”
EXPERT COMMENTARY
BY DEBRA POOLE, owner, Georgetowne
Home Preschool

88 TFAH • RWJF • StateofObesity.org
Quite frankly, I think we underestimate a child’s ability to adapt and willingness to explore.
For example, when I start teaching
and working with the children, I show
them a plate and say, “let’s put a lima
bean on there.” If they say they don’t
want it, I turn it into a fun adventure
and tap into their imagination. I get
out the magnifying glasses and have
them check their tongues for the
“lima bean taste bud” or tell them it
will give them superpowers—which,
when you think about the health
benefits of fruits and vegetables, isn’t
so far off. They love it! Sure enough,
an adventurous and tough 4-year-old
volunteers and the rest follow suit
— and soon everyone is eating lima
beans and other fruits and vegetables.
We put up pictures of fruits and
vegetables they’ve never seen before.
And then we set up a “grocery store” in
the kitchen and the kids go shopping
and pretend to buy these things.
Typical days also include as much
physical activity as possible, including
stretching, dancing, playing, bike riding
and swimming. And, of course, we focus
on learning from start to finish, with
kindergarten preparatory assignments,
computer work, 3-D projects, or
dramatic play (acting out grocery store
shopping, for instance) and group
action games on our circle time rug.
People always want to know how all
this is possible on a tight budget. First,
I serve everything family style, which
teaches responsibility and gives me the
opportunity to introduce foods at the
right pace and portion size for each
child. I also shop at warehouses and
roadside stands and avoid canned foods
— buying fresh or frozen is typically
healthier and tastes better, too.
I’ve found that my parents are highly
supportive of this approach—they
appreciate what it means for their
kids, and have been inspired to eat
healthier at home as well
Our emphasis on nutrition is the
foundation on which our success has
been built. It’s all about giving children
the tools and skills they need to make
healthy choices and grow up healthy.
WE MAKE ALL OF OUR OWN FOOD ON SITE WITH THE KIDS. THE
CHILDREN SMELL AND TOUCH AND INTERACT WITH FOODS.

Obesity Prevention in Black Communities
CURRENT STATUS:
Inequities in a range of factors — income, stable and
affordable housing, access to quality education and
others — all influence a person’s chance to live a longer,
healthier life.264 These inequities and disparate access
to affordable, healthy food or safe places to be physically
active, contribute to higher rates of obesity and related
illnesses in Black communities.
l African American adults are nearly 1.5
times as likely to be obese compared
with White adults. Approximately
47.8 percent of African Americans
are obese (including 37.1 percent
of men and 56.6 percent of women)
compared with 32.6 percent of Whites
(including 32.4 percent of men and
32.8 percent of women).265 More
than 75 percent of African Americans
are overweight or obese (including 69
percent of men and 82.0 percent of
women) compared with 67.2 percent
of Whites (including 71.4 percent of
men and 63.2 percent of women).266
The State of Obesity:
Obesity Policy Series
SECTION 10:
SEC
TIO
N 10: O
BE
SITY PR
EV
EN
TIO
N IN
BL
AC
K C
OM
MU
NIT
IES
SEP
TE
MB
ER
2014
African American Obesity or Overweight
69% 82%
Men Women
© Lynn Johnson, used with permission from RWJF
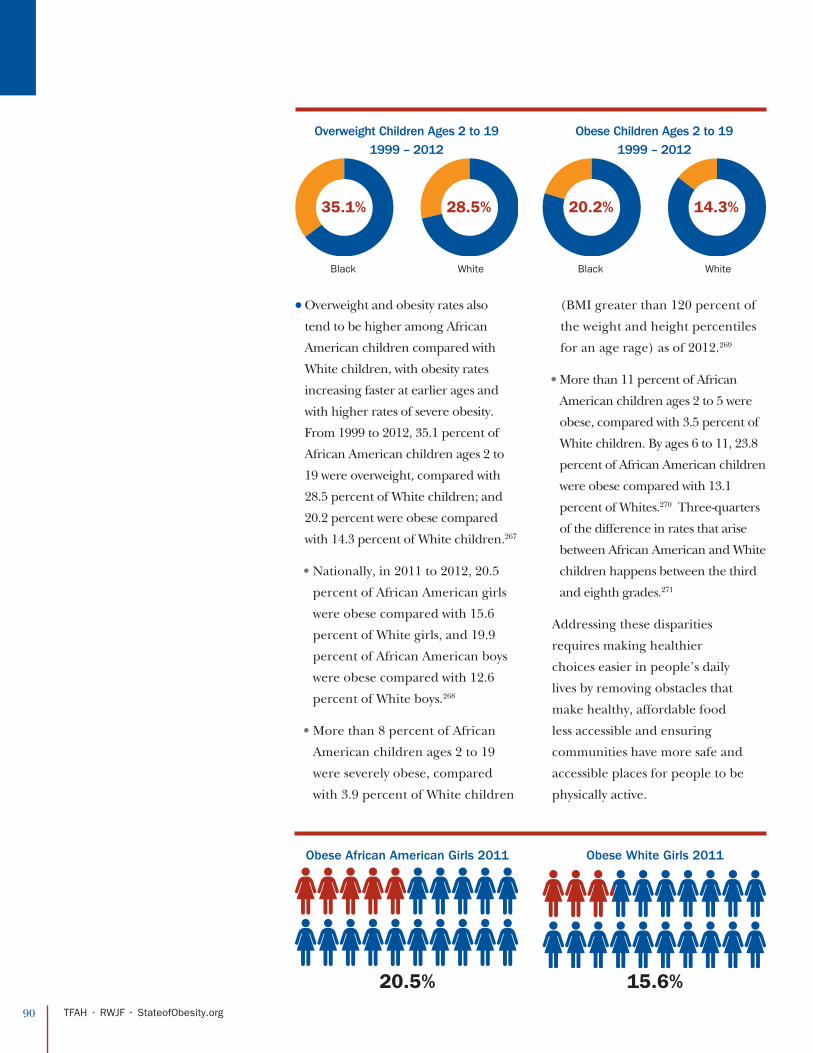
90 TFAH • RWJF • StateofObesity.org
l Overweight and obesity rates also
tend to be higher among African
American children compared with
White children, with obesity rates
increasing faster at earlier ages and
with higher rates of severe obesity.
From 1999 to 2012, 35.1 percent of
African American children ages 2 to
19 were overweight, compared with
28.5 percent of White children; and
20.2 percent were obese compared
with 14.3 percent of White children.267
• Nationally, in 2011 to 2012, 20.5
percent of African American girls
were obese compared with 15.6
percent of White girls, and 19.9
percent of African American boys
were obese compared with 12.6
percent of White boys.268
• More than 8 percent of African
American children ages 2 to 19
were severely obese, compared
with 3.9 percent of White children
(BMI greater than 120 percent of
the weight and height percentiles
for an age rage) as of 2012.269
• More than 11 percent of African
American children ages 2 to 5 were
obese, compared with 3.5 percent of
White children. By ages 6 to 11, 23.8
percent of African American children
were obese compared with 13.1
percent of Whites.270 Three-quarters
of the difference in rates that arise
between African American and White
children happens between the third
and eighth grades.271
Addressing these disparities
requires making healthier
choices easier in people’s daily
lives by removing obstacles that
make healthy, affordable food
less accessible and ensuring
communities have more safe and
accessible places for people to be
physically active.
Obese African American Girls 2011
20.5% 15.6%
Obese White Girls 2011
Obese Children Ages 2 to 19 1999 – 2012
Overweight Children Ages 2 to 19 1999 – 2012
35.1% 28.5% 20.2% 14.3%
Black BlackWhite White

91 TFAH • RWJF • StateofObesity.org
l Access to affordable, healthy food:
Lower-incomes and poverty correlate
strongly with an increase in obesity,
since less nutritious, calorie-dense
foods are often less expensive than
healthier foods.272 African American
families have earned $1 for every $2
earned by White families for the past
30 years.273 More than 38 percent of
African American children under
age 18 and 42.7 percent of children
under age 5 live below the poverty
line,274 and more than 12 percent
of African American families live in
deep poverty (at less than 50 percent
of the federal poverty threshold).275
One in four African American
families are food insecure (not
having consistent access to adequate
food due to lack of money or other
resources), compared with 11
percent of White households.276
Families in predominantly minority
and low-income neighborhoods
have limited access to supermarkets
and fresh produce. A study of
selected communities found that
only 8 percent of African American
residents lived in areas with one or
more supermarkets, compared with
31 percent of White residents.277
When compared with other
neighborhoods, without regard
to income, predominantly Black
neighborhoods have the most
limited access to supermarkets and
to the healthier foods such markets
sell.278 According to the 2013 YRBS,
11.3 percent of Black youths did
not eat vegetables during the prior
week, compared to 4.5 percent of
White youths.279 Black high school
students are almost twice as likely
to not eat breakfast daily compared
with their White peers, which can be
a contributing factor to less healthy
eating patterns overall, weight gain
and poorer performance in school.280
l Higher exposure to marketing of
less nutritious foods: Each day,
African American children see
twice as many calories advertised
in fast food commercials as White
children.281 The products most
frequently marketed to African
Americans are high-calorie, low-
nutrition foods and beverages.
Billboards and other forms of
outdoor advertisements, which often
promote foods of low nutritional
value, are 13 times denser in
predominantly African American
neighborhoods than White
neighborhoods.282
l Limited access to safe places to be
physically active: Achieving a healthy
energy balance also requires engaging
in sufficient amounts of physical activ-
ity.283 As of 2010, African Americans
were 70 percent less likely to engage
in physical activity than Whites.284 Ac-
cording to the 2013 YRBS, 21.5 per-
cent of Black youth did not participate
in at least one hour of daily physical ac-
tivity during the prior week, compared
with 12.7 percent of White youth.285
Children in neighborhoods that lack
access to parks, playgrounds and
recreation centers have a 20 percent
to 45 percent greater risk of becoming
overweight.286 National-based studies
show that access to public parks, public
pools and green space is much lower
in neighborhoods largely occupied by
African Americans.287 Safety concerns
also further limit outdoor activities
among African American children.
Sidewalks in African American
communities are 38 times more likely
to be in poor condition According to
a recent study, how African American
mothers perceive neighborhood safety,
and specifically the threat of violence,
strongly influences the amount of daily
outdoor play in which their young
daughters participate.288
Americans Living in Communities With One or More Supermarkets
Black White
8% 31%
African American Children Living Below the Poverty Line
African American children under the age of 18
African American children under the age of 5
38% 42.7%
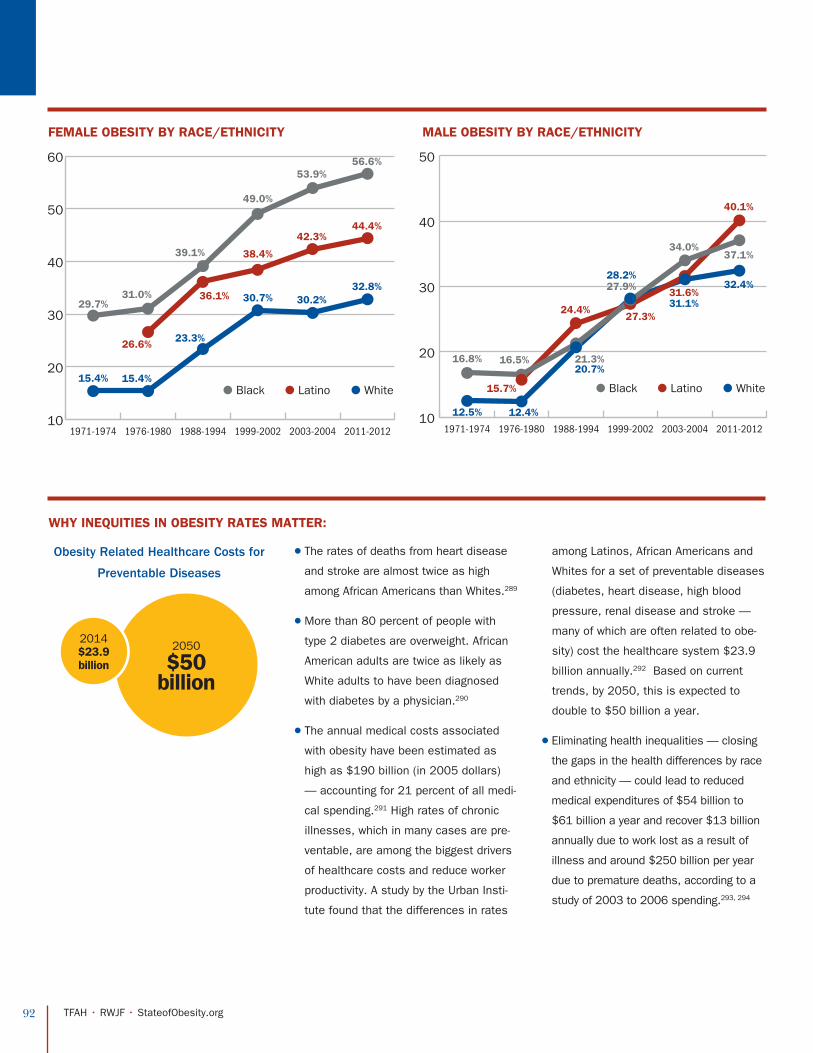
92 TFAH • RWJF • StateofObesity.org
l The rates of deaths from heart disease
and stroke are almost twice as high
among African Americans than Whites.289
l More than 80 percent of people with
type 2 diabetes are overweight. African
American adults are twice as likely as
White adults to have been diagnosed
with diabetes by a physician.290
l The annual medical costs associated
with obesity have been estimated as
high as $190 billion (in 2005 dollars)
— accounting for 21 percent of all medi-
cal spending.291 High rates of chronic
illnesses, which in many cases are pre-
ventable, are among the biggest drivers
of healthcare costs and reduce worker
productivity. A study by the Urban Insti-
tute found that the differences in rates
among Latinos, African Americans and
Whites for a set of preventable diseases
(diabetes, heart disease, high blood
pressure, renal disease and stroke —
many of which are often related to obe-
sity) cost the healthcare system $23.9
billion annually.292 Based on current
trends, by 2050, this is expected to
double to $50 billion a year.
l Eliminating health inequalities — closing
the gaps in the health differences by race
and ethnicity — could lead to reduced
medical expenditures of $54 billion to
$61 billion a year and recover $13 billion
annually due to work lost as a result of
illness and around $250 billion per year
due to premature deaths, according to a
study of 2003 to 2006 spending.293, 294
WHY INEQUITIES IN OBESITY RATES MATTER:
Obesity Related Healthcare Costs for
Preventable Diseases
2050
$50 billion
2014 $23.9 billion
● White● Black ● Latino
FEMALE OBESITY BY RACE/ETHNICITY
10
20
30
40
50
60
1971-1974 1976-1980 1988-1994 1999-2002 2003-2004 2011-2012
29.7%
15.4%
31.0%
26.6%
15.4%
39.1%
23.3%
36.1%
49.0%
38.4%
30.7%
53.9%
42.3%
30.2%
56.6%
44.4%
32.8%
● White● Black ● Latino
MALE OBESITY BY RACE/ETHNICITY
10
20
30
40
50
1971-1974 1976-1980 1988-1994 1999-2002 2003-2004 2011-2012
16.8%
12.5%
16.5%
15.7%
12.4%
21.3%20.7%
24.4%
27.9%
27.3%
28.2%
34.0%
31.6%31.1%
37.1%
40.1%
32.4%

93 TFAH • RWJF • StateofObesity.org
l All public and private investments in community prevention should directly involve local communities throughout the process, including partnering with Black residents and organizations, as well as understanding the assets and resources within each community, to determine priorities and develop culturally relevant and sustainable solutions.
l Equity should be a criterion and measure for grants authorized to address obesity in communities in order to ensure that addressing disparities is a priority goal for a given project or program, and that grantees are held accountable for addressing disparities. For example, at the outset, a program’s needs assessments should identify gaps in health outcomes, behaviors and other community features, and evaluation plans should include measures to demonstrate progress toward closing those gaps. Grant requirements must be assessed for feasibility in all communities, to ensure the goals are appropriate and match the existing resources of communities with high percentages of racial and ethnic minorities and low-income populations.
l Support should be increased at the federal, state and local levels to address racial and ethnic inequities in obesity.
l Policies should require that health programs include culturally sensitive communications and language, and a variety of communication methods and channels — including social media — should be used to most effectively reach communities of color.
Policy Recommendations:

94 TFAH • RWJF • StateofObesity.org
l Strategies and programs need to be developed in conjunction with and led by community leaders and members, including the implementation of common practices, such as joint-use agreements, to allow community members to use playgrounds and fields when school is not in session and improving zoning rules for increased grocery stores in low-income communities.
l Increase grant programs encouraging minority business owners to open grocery stores in low-income communities and ensure that initiatives are sustainable and provide the appropriate support — ranging from financing initiatives to safe, accessible transportation for members of the community — to keep groceries stores open.
l Standards should be set to limit the amount of advertising of foods and beverages of low nutritional value, particularly advertising targeting Black children, via television, radio, new digital media (internet, social media, digital apps, mobile phones, tablets, etc.), outdoor ads and point-of-sale product placements. Policies should help encourage increased marketing of healthy foods and beverages to children and families.
Policy Recommendations:

95 TFAH • RWJF • StateofObesity.org
EXAMPLES OF STRATEGIES AND CASE STUDIES:
l Nutrition assistance programs can help lower-income families
gain access to more affordable food and provide information
about healthy eating. In 2011, more than 3.9 million African
American families received SNAP benefits,295 and, as of
2012, 20 percent of women and children enrolled in the WIC
program were African American.296 Programs such as SNAP-
Ed, a partnership between USDA and the states that provides
education to help families learn how to eat healthier within a
limited budget, and revisions to the WIC food packages that
include healthier options, have resulted in increased con-
sumption of more nutritious foods among participants.297, 298
l Over the last decade, Philadelphia has implemented a com-
prehensive strategy to reduce obesity rates among children.
Between 2006 and 2010, the city experienced nearly a 5 per-
cent reduction in the obesity rates among children in grades K
through 12. The biggest declines were reported among kids and
teens of color: the obesity rate among African American boys
dropped by 7.6 percent. The city created strategies to help im-
prove access to healthy foods and increase physical activity and
engaged a wide-range of partners. Efforts included removing all
sodas and sugar-sweetened drinks from public school vending
machines; implementing a comprehensive, district-wide school
wellness policy; banning deep fryers in school kitchens and
switching to 1 percent and skim milk; and requiring chain restau-
rants to post calorie information on menus and menu boards.
In addition, they targeted interventions in neighborhoods most
in need, such as providing education to public school students
whose families were eligible for SNAP and creating new financ-
ing methods to attract grocers to open stores in lower-income
neighborhoods and supporting safe recreation spaces.
l The state of Mississippi passed a law in 2012 authorizing
local schools boards to allow school property to be used by
the public for recreation and sports during nonschool hours.
The NAACP Mississippi State Conference is working to imple-
ment shared-use agreements with their partner organizations in
majority minority school districts. Their initial efforts have been
focused in the Jackson and Indianola school districts. Although
the work of the NAACP Mississippi State Conference has been
health-focused, they have helped leverage shared-use agree-
ments to help improve health at the same time they help meet
other needs within the community. This has spoken directly to
the needs of the communities they serve.
l For decades, Tennessee’s childhood obesity rates have steadily
increased, while equity gaps between Black and White children
widen. In Tennessee, 43.9 percent of African American children
are obese compared with 21.1 percent of White children.299 To
address childhood obesity, the NAACP Tennessee State Confer-
ence developed an advocacy action plan that expands existing
competitive foods guidelines in Jackson-Madison and Haywood
County School Districts. This policy addresses competitive
food sales at school activities such as fundraisers and conces-
sions. To gain support for the competitive food sales policy, the
NAACP Tennessee State Conference developed partnerships
with key stakeholders, including parents and families, faith-
and community-based organizations, businesses, and others,
and engaged the NAACP youth councils to help with proposed
alternative food and non-food options for school fundraisers.
Many states, including Tennessee, have existing policies on the
built environment, school-based policies and competitive foods.
However, many of these policies are not being implemented
or expanded. Closing persistent disparities requires advocates
and public health professionals to build upon existing policies
and hold the responsible entities accountable for implementing
them and measuring progress.
ADDITIONAL RESOURCES:
NAACP Childhood Obesity Advocacy Manual: http://action.naacp.org/page/s/childhood-obesity-manual
Office of Minority Health: U.S. Department of Health and Human Services. http://minorityhealth.hhs.gov/
96 TFAH • RWJF • StateofObesity.org
Maximizing The Impact of Obesity-Prevention Efforts In Black Communities: KEY FINDINGS AND STRATEGIC RECOMMENDATIONS
Black health leaders and activists are deeply aware of the
challenges they face in combating the obesity epidemic that
disproportionately affects Black communities. They come
to the debate with very clear insight into these challenges,
from specific barriers at the community level to broader,
systemic hurdles that extend state- and nationwide.
These health leaders generally feel that
many identified policy approaches to
prevent and control obesity offer strong
promise, but that there have been a
number of hurdles that get in the way
of these policies being successfully
implemented in Black communities.
They identified three key areas to work
on to improve the implementation of
policies, including:
1. Addressing socioeconomic and
environmental factors, particularly
less access to healthy, affordable
foods and a shortage of safe,
accessible spaces for physical activity;
2. Providing increased education
about healthy choices and how to
make these choices more relevant
to their daily lives;
3. Developing partnerships and
sustained programs, including the
need to 1) engage leaders to feel
and take shared ownership of the
long-term success of an initiative;
and 2) create models where local,
state and national organizations
form lasting collaborations, access
to ongoing resource and a shared
set of priorities and goals.
MAY 2014On behalf of the Trust For America’s Health, the Robert Wood Johnson Foundation
and the NAACP, Greenberg Quinlan Rosner Research conducted a set of nine one-on-
one, in-depth-interviews among public health leaders in Black communities across
the country. The participants represent both the public and private sectors and include
health professionals, academics and community organizers, among others. The study
was designed to evaluate barriers to and pinpoint solutions for reducing obesity in
Black communities. All interviews were conducted between April 29 and May 8, 2014.
97 TFAH • RWJF • StateofObesity.org
ADDRESSING SOCIOECONOMIC AND ENVIRONMENTAL FACTORS TO PROMOTE HEALTHY, AFFORDABLE NUTRITION AND ACCESS TO SAFE PLACES TO BE ACTIVE.
Recommendation: Focus on making existing policy initiatives more scalable, sustainable and equitable across all
neighborhoods and income levels.
The health leaders interviewed felt there is
a lot of attention on making healthier foods
more affordable and accessible, and devel-
oping safe, accessible places for people to
be physically active — but the hurdles to
achieving these goals are still very steep.
While the general policy approaches toward
obesity prevention and control are viewed
favorably, there is a strong sense that the
initiatives introduced on the ground level are
not scalable or sustainable in their current
forms. There is also recognition that the re-
sources invested in these solutions are often
short-term grants and are woefully insufficient
to match the scope of the problems.
Some key policies the health leaders
stressed included:
l Allowing the community to use school
facilities for non-school recreational
activities before and after school hours.
l Making healthy foods more affordable
and available in all neighborhoods.
l Adopting public safety and crime reduction
initiatives to give families safe access to
recreational facilities and parks.
l Focusing on improving nutrition and
increasing activity for young children,
such as through efforts or regulations
in daycare centers.
They stressed the importance of devel-
oping strategies for the range of other
factors that impact health — such as ac-
cessible, safe, affordable transportation
and housing — as a coordinated part of
any successful effort to address obesity.
They also quickly point out the need to find
improved ways to make these initiatives
equitable — across all neighborhoods.
There is an acute sense of the different
resources available in higher-income versus
lower-income neighborhoods — ranging from
well-kept green spaces to quality grocery
stores. And there is a desire for continued
focus on policy changes that help improve
resources for everyone, which, they believe,
will help an entire community thrive. For
instance, the leaders emphasized that the
inability to access healthy food was both
a financial and geographical hurdle. Many
work with low-income individuals living in
food deserts or food “swamps” (where there
is a glut of unhealthy fast food options) and
if healthy food is available, it is usually not
economical.
These leaders also stress the importance of
designing or redesigning the physical infra-
structure of a neighborhood to incorporate
safe, accessible sidewalks, public transpor-
tation options, parks and exercise trails.
Many work with low-income individuals living in food deserts or food “swamps”
(where there is a glut of unhealthy fast food options) and if healthy food is
available, it is usually not economical.
“We need to increase the opportunity for healthy food. All
healthy options are concentrated in one area of my city;
availability is different, based on different neighborhoods.”
“ A healthy community should have some place that’s safe and welcoming. And the ability for all family members to be outdoors, to exercise openly in a safe environment.”
“ The access is there, but for people with limited resources, they can’t afford it.”
ACCESSIBLE, AFFORDABLE
HEALTHY NUTRITION
SAFE, ACCESSIBLE PLACES TO BE ACTIVE
“ Equitable access to green space. On the more affluent side of my city, there are sidewalks—
a lot of them have been redone. There are biking lanes. And then you have other areas; we
have three income-based housing projects within a half mile radius, and there’s not much
green space available there. There is also a city park, but it’s been largely neglected.”
98 TFAH • RWJF • StateofObesity.org
EDUCATING ABOUT HEALTHY CHOICES AND MAKING THEM MORE RELEVANT TO DAILY LIFE
Recommendation: Focus on policies and programs that are social, enjoyable and integrated into daily life and routines.
The health leaders raised concerns that
there is not enough information available
in many Black communities about why and
how to make healthy choices. Specifically,
there was concern about the lack of edu-
cation provided by both schools and the
medical community. Giving a community
funding to combat obesity is not enough—
Black community leaders are quick to
point out that change cannot start to take
hold unless there is a proper education
campaign to accompany these resources.
Another challenge is that conversations
about the obesity epidemic often focus
on the issue of weight rather than on
health. For example, education about
how good nutrition and increased physi-
cal activity can reduce risk for or help
manage type 2 diabetes, heart disease
and stress is lacking. There also is not
enough information about ways to man-
age buying healthy food within a budget.
The participants also emphasized a real
need to increase education attainment to
combat the greater socioeconomic and envi-
ronmental factors at play. For instance, the
health leaders emphasized the need to in-
crease education to promote good nutrition
and increased physical activity to counter
the fact that food of lower nutritional value
is often more easily available and cheaper,
and there is such heavy intensity of market-
ing junk food in these communities.
The health leaders stressed that some of the
most important ingredients to creating suc-
cessful, long-lasting programs are often not
addressed: making them social, enjoyable
and integrated into daily life and routines.
For instance, the health leaders in these
Black communities place a high premium
on the need to teach healthy behaviors in
a social atmosphere. As an example, some
of the most effective programs they high-
lighted—or would like to see implemented
in their own communities—are healthy
cooking classes, and taking advantage of
shared-use agreements to start walking
clubs, athletic teams and dance classes
for both children and adults.
In addition, they emphasized the need to
meet people where they are, and make ef-
forts fit into people’s needs. Every person,
neighborhood, or community has different
needs; a “one size fits all” approach to re-
ducing obesity is not sustainable. This goes
hand in hand with the social aspect —the
programs need to be relevant to the specific
community. Many of the participants high-
lighted cooking classes as an effective way
to reach Black communities, not just for the
social aspect but also for the usefulness in
teaching nutrition and even food budgeting.
“This needs to become part of the lifestyle.
We need to figure out ways to make South-
ern cuisine healthier. There has to be a way
to retain some of the style and tradition, but
with healthier options,” said one participant.
The participants also emphasized a real need to increase education attainment to
combat the greater socioeconomic and environmental factors at play.
INCREASED EDUCATION ABOUT
HEALTH AND HEALTHY CHOICES“It takes commitment from the community to see that this is not fly by night. We need to continue to work with young people to get them to see, early on in life, that if you’re healthier, you feel better, you learn better.”
“For kids, [these efforts] would work if you make it fun and social, if you did it around games, activities and sports. Kids want to be part of the group; it’s social for them.”
“There’s very little preventive advice. Most times, people aren’t getting any advice on how to get healthy and make small changes, even from their doctor.”
MAKING INITIATIVES SOCIAL AND FUN “There was a man in our community that was working on losing some weight,
and so he was getting on the radio, encouraging and challenging parents,
students, everybody, to come walk with him. And he wanted a really, really
large group of people—they would walk for 30 minutes, and for kids, every time
you walked, you got to put your name in for a drawing. That worked really well.”
“Schools need to educate students about nutrition, so they can make better choices. Parents need to be educated because they did not have the advantage of schools that were providing that sort of information…I think we can all become better advocates for promoting healthy options.”

99 TFAH • RWJF • StateofObesity.org
DEVELOPING PARTNERSHIPS AND SUSTAINABILITY
Recommendations: Focus on building lasting programs and community engagement — including buy-in from the outset,
shared ownership and goals, coordination with existing assets and efforts and providing programs and services that
help connect with the needs and interests of the members of the community — from the outset.
The health leaders reported feeling that
many of the obesity initiatives introduced
in their communities do not have built-in
goals of sustainability, long-term focus or
strategies that engage people within the
community to take ownership. They report
there is a need to improve the connection
between state and national agencies and
local communities, including mechanisms
to get “buy-in” from individuals within the
community, as well as from policymakers
and other change agents.
Building sustainable programs in a
community requires this buy-in at the
outset. National and state groups often
have the ability to develop and evaluate
particular approaches and provide
financial resources, but unless the
community has shared ownership and
a shared sense that an initiative is a
priority or fit for that community, there
is little likelihood that the initiative will
gain traction or be successful. Local
health leaders have a strong interest
in partnering with national and state
groups because they recognize the
expertise and resources those groups
provide. Yet local health leaders also are
calling for more shared priority-setting
and additional support for technical
assistance aimed at engaging and
training leaders in communities to take
ownership of initiatives.
The leaders reported the main procedural
barrier to programs comes from a lack of
coordination — which could be addressed
by ensuring there is a shared vision
from the outset and that there is clear,
consistent communication across groups.
It is also important to learn about the
organizations and agencies already in a
neighborhood or community. In many
cases, there are groups — such as
initiatives by other community- and faith-
based organizations or are provided through
education or other social service systems
— that already exist with shared visions,
but there may be limited or no attempts
to understand, connect and coordinate
with their efforts. The leaders stress the
importance of making sure public health
officials consult with the communities about
existing assets, structures and processes
as an essential ingredient when trying to
make systemic changes.
The leaders discussed examples of
effective programs, which included having
a community leader or organization heavily
involved in the effort and a sense that
the initiative was helping support multiple
objectives within a community, such as
a shared-use agreement that supports
youth sports or walking clubs, which can
help foster stronger social and community
connections, provide a safe afterschool
environment and serve as a crime
prevention strategy. The most positive
examples of policies and activities focused
on making healthy decisions part of a daily
routine for both adults and children.
The leaders acknowledge there is often
a lot of discussion about community
engagement as part of public health
initiatives and underscore the importance
of having a shared definition of what this
means from the community’s perspective.
100 TFAH • RWJF • StateofObesity.org
ADDITIONAL RESOURCES:
NAACP Childhood Obesity Advocacy Manual.:
http://action.naacp.org/page/s/childhood-obesity-manual
Office of Minority Health,: U.S. Department of Health and Human Services.
http://minorityhealth.hhs.gov/
Overweight and Obesity Among African American Youth. Leadership for
Healthy Communities. Spring 2014.
http://www.leadershipforhealthycommunities.org/resources-mainmenu-40/
fact-sheets/700-overweight-and-obesity-among-african-american-youths
The leaders discussed examples of effective programs,
which included having a community leader or organization
heavily involved in the effort and a sense that the
initiative was helping support multiple objectives within a
community, such as a shared-use agreement that supports
youth sports or walking clubs…
BUILDING SUSTAINABILITY
IMPROVING PARTNERSHIPS AND COORDINATION
“Someone has to step up, take the
lead, and say, ‘Here’s what we’d
like to do, would you like to sit at
the table with us?’”
“There’s sometimes a general lack of engagement between organizations. Organizations become sort
of a silo, and I’m thinking it becomes siloed because of funding. Everybody wants to identify funding
sources and go out and do the work. But the challenge in that is that even if you’re competing against
organizations—in some sense—to get the funding, you want to hold on to what you have. And…they
don’t fully engage other organizations in a way where everybody benefits from it.”
“I think what works is when groups and organizations, and even individuals, get community buy-in. That’s very important, because when you look at it from the standpoint of implementing programs or policies, then it has to be sustainable…so even if funding runs out, then you’ve made inroads within the community.”
“I think, when you have these parachute programs where they kind
of drop in, do work and disappear, that’s not effective. But when
there’s an investment in empowering the community to become the
program, and become leaders of the program, that’s very effective.”
“I think we need to get the word out in a way that the community understands. And I think, often, the state agencies don’t drill it down, or they don’t know how to get it to the folks that need it the most.”
“For me, from start to finish, the process has to include community
engagement and data engagement. So, every decision that we make along
the way, we make it based on community input AND data input. And let both
tell us where we need to go.”

101 TFAH • RWJF • StateofObesity.org
The Next Step in Reducing Obesity in Cities, Towns and Counties: Focusing on Vulnerable Populations
Not too long ago, managing obesity was seen solely as an
individual responsibility. However, as obesity rates began
their steady climb upward over the last decade or so, local
leaders and residents began to understand more fully the
risks obesity can pose to their neighborhoods, communities
and cities, and the role good government policy and action
can have in helping people get and stay healthy.
As this shift in public consciousness
grew, mayors in cities across the
country began to champion public
policies that promote healthy
eating and active living. These
policies are meant to create more
walkable, bikeable and transit-
accessible neighborhoods, and
to encourage better use of and
increased connectivity between
recreation centers and parks. They
have commonly been implemented
through shared-use agreements, land
use agreements, community gardening
initiatives and complete streets and
active transportation policies.
Clearly, mayors have an important
role to play in forming partnerships
and using their influence to put
policies aimed at reducing obesity in
motion. They are uniquely positioned
to encourage citywide implementation
of policies and programs that promote
healthy communities.
Today, policies to increase healthy
eating and active living are being
implemented all across the country.
For instance, in Philadelphia, Mayor
Michael Nutter has led a number
of policies that have revamped how
the city approaches public health
through food financing. The mayor,
his staff and partners have forged
public-private partnerships and
provided incentives resulting in
almost 20 retail sites offering fresh
fruits and vegetables to low-income
neighborhoods in Philadelphia.
Elsewhere in Pennsylvania and across
the country, we’ve seen the Fresh
Food Financing Initiative become
a major model for assisting lower
income people gain access to fresh,
affordable food.
EXPERT COMMENTARY
BY LEON T. ANDREWS, Jr., Senior Fellow,
National League of Cities
The most effective policies
have been put in place by local
leaders that were able to tap into
specific community resources.
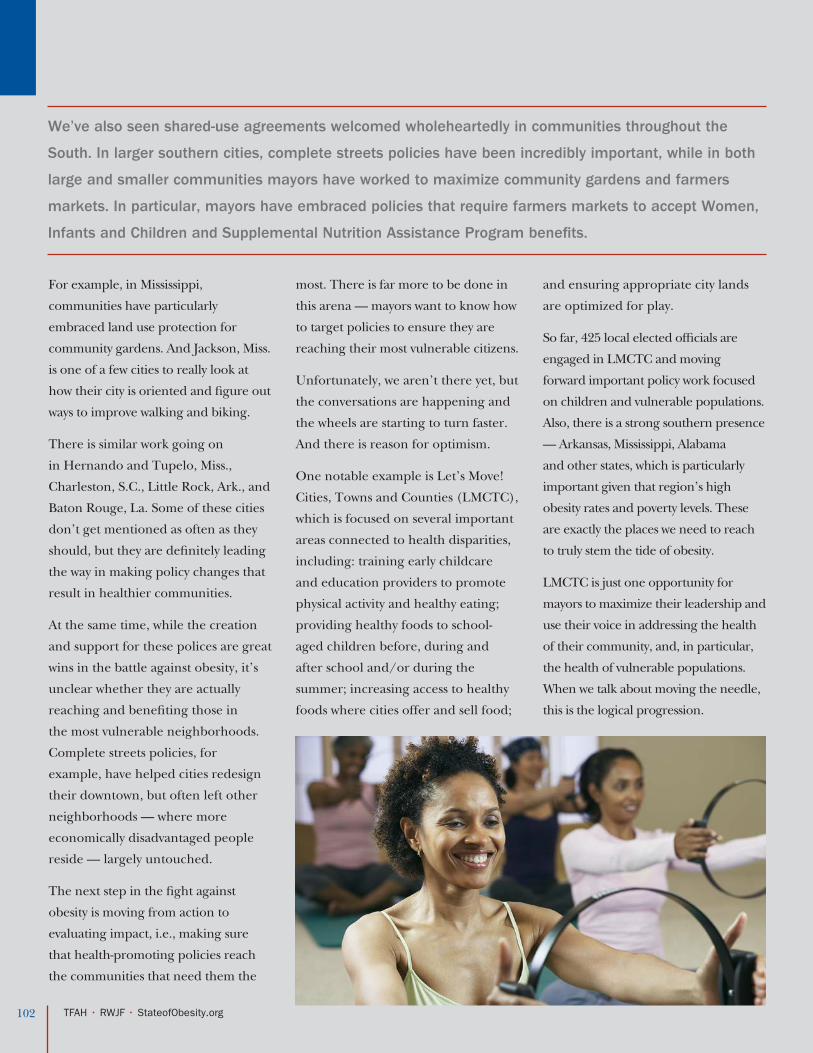
For example, in Mississippi,
communities have particularly
embraced land use protection for
community gardens. And Jackson, Miss.
is one of a few cities to really look at
how their city is oriented and figure out
ways to improve walking and biking.
There is similar work going on
in Hernando and Tupelo, Miss.,
Charleston, S.C., Little Rock, Ark., and
Baton Rouge, La. Some of these cities
don’t get mentioned as often as they
should, but they are definitely leading
the way in making policy changes that
result in healthier communities.
At the same time, while the creation
and support for these polices are great
wins in the battle against obesity, it’s
unclear whether they are actually
reaching and benefiting those in
the most vulnerable neighborhoods.
Complete streets policies, for
example, have helped cities redesign
their downtown, but often left other
neighborhoods — where more
economically disadvantaged people
reside — largely untouched.
The next step in the fight against
obesity is moving from action to
evaluating impact, i.e., making sure
that health-promoting policies reach
the communities that need them the
most. There is far more to be done in
this arena — mayors want to know how
to target policies to ensure they are
reaching their most vulnerable citizens.
Unfortunately, we aren’t there yet, but
the conversations are happening and
the wheels are starting to turn faster.
And there is reason for optimism.
One notable example is Let’s Move!
Cities, Towns and Counties (LMCTC),
which is focused on several important
areas connected to health disparities,
including: training early childcare
and education providers to promote
physical activity and healthy eating;
providing healthy foods to school-
aged children before, during and
after school and/or during the
summer; increasing access to healthy
foods where cities offer and sell food;
and ensuring appropriate city lands
are optimized for play.
So far, 425 local elected officials are
engaged in LMCTC and moving
forward important policy work focused
on children and vulnerable populations.
Also, there is a strong southern presence
— Arkansas, Mississippi, Alabama
and other states, which is particularly
important given that region’s high
obesity rates and poverty levels. These
are exactly the places we need to reach
to truly stem the tide of obesity.
LMCTC is just one opportunity for
mayors to maximize their leadership and
use their voice in addressing the health
of their community, and, in particular,
the health of vulnerable populations.
When we talk about moving the needle,
this is the logical progression.
102 TFAH • RWJF • StateofObesity.org
We’ve also seen shared-use agreements welcomed wholeheartedly in communities throughout the
South. In larger southern cities, complete streets policies have been incredibly important, while in both
large and smaller communities mayors have worked to maximize community gardens and farmers
markets. In particular, mayors have embraced policies that require farmers markets to accept Women,
Infants and Children and Supplemental Nutrition Assistance Program benefits.

Obesity Prevention in Latino Communities
CURRENT STATUS:
Inequities in access to healthcare, the quality of care
received and opportunities to make healthy choices where
people live, learn, work and play all contribute to the rates
of obesity being higher for Latino adults and children
compared to Whites. Also contributing to the higher rates
of obesity is the fact that Latino communities experience
higher rates of hunger and food insecurity, limited
access to safe places to be physically active and targeted
marketing of less nutritious foods.300, 301
Latinos are the fastest growing
population in the United States — it
is estimated that nearly one in three
children will be Latino by 2030
— so addressing these disparities
is essential for the well-being of
individuals and families and to help
contain skyrocketing U.S. healthcare
spending and increase the nation’s
productivity.302
l 42 percent of Latino adults are
obese compared with 32.6 percent of
Whites.303 More than 77 percent of
Latino adults are overweight or obese,
compared with 67.2 percent of Whites.
l 22.4 percent of Latino children ages
2 to 19 are obese, compared with
14.3 percent of White children.304
More than 38.9 percent of Latino
children are overweight or obese,
compared with 28.5 percent of
White children.
l Rates of severe obesity (BMI greater
than 120 percent of the weight and
height percentiles for an age rage) are
also higher among Latino children
ages 2 to 19 (6.6 percent) compared
with White children (3.9 percent).305
The State of Obesity:
Obesity Policy Series
SECTION 11:
SEC
TIO
N 11: O
BE
SITY PR
EV
EN
TIO
N IN
LA
TIN
O C
OM
MU
NIT
IES
SEP
TE
MB
ER
2014
Obese or Overweight Adults
Obese or Overweight Children Ages 2 to 19
77% 67.2%
38.9% 28.5%
Latino
Latino
White
White
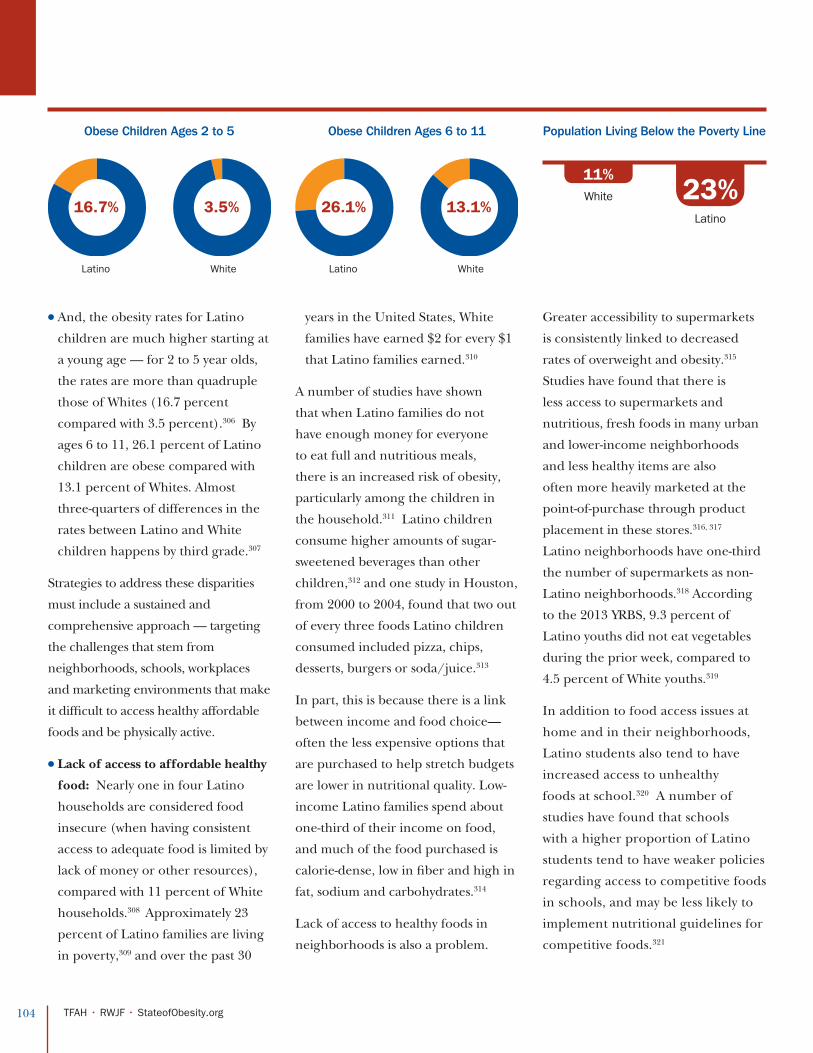
104 TFAH • RWJF • StateofObesity.org
l And, the obesity rates for Latino
children are much higher starting at
a young age — for 2 to 5 year olds,
the rates are more than quadruple
those of Whites (16.7 percent
compared with 3.5 percent).306 By
ages 6 to 11, 26.1 percent of Latino
children are obese compared with
13.1 percent of Whites. Almost
three-quarters of differences in the
rates between Latino and White
children happens by third grade.307
Strategies to address these disparities
must include a sustained and
comprehensive approach — targeting
the challenges that stem from
neighborhoods, schools, workplaces
and marketing environments that make
it difficult to access healthy affordable
foods and be physically active.
l Lack of access to affordable healthy
food: Nearly one in four Latino
households are considered food
insecure (when having consistent
access to adequate food is limited by
lack of money or other resources),
compared with 11 percent of White
households.308 Approximately 23
percent of Latino families are living
in poverty,309 and over the past 30
years in the United States, White
families have earned $2 for every $1
that Latino families earned.310
A number of studies have shown
that when Latino families do not
have enough money for everyone
to eat full and nutritious meals,
there is an increased risk of obesity,
particularly among the children in
the household.311 Latino children
consume higher amounts of sugar-
sweetened beverages than other
children,312 and one study in Houston,
from 2000 to 2004, found that two out
of every three foods Latino children
consumed included pizza, chips,
desserts, burgers or soda/juice.313
In part, this is because there is a link
between income and food choice—
often the less expensive options that
are purchased to help stretch budgets
are lower in nutritional quality. Low-
income Latino families spend about
one-third of their income on food,
and much of the food purchased is
calorie-dense, low in fiber and high in
fat, sodium and carbohydrates.314
Lack of access to healthy foods in
neighborhoods is also a problem.
Greater accessibility to supermarkets
is consistently linked to decreased
rates of overweight and obesity.315
Studies have found that there is
less access to supermarkets and
nutritious, fresh foods in many urban
and lower-income neighborhoods
and less healthy items are also
often more heavily marketed at the
point-of-purchase through product
placement in these stores.316, 317
Latino neighborhoods have one-third
the number of supermarkets as non-
Latino neighborhoods.318 According
to the 2013 YRBS, 9.3 percent of
Latino youths did not eat vegetables
during the prior week, compared to
4.5 percent of White youths.319
In addition to food access issues at
home and in their neighborhoods,
Latino students also tend to have
increased access to unhealthy
foods at school.320 A number of
studies have found that schools
with a higher proportion of Latino
students tend to have weaker policies
regarding access to competitive foods
in schools, and may be less likely to
implement nutritional guidelines for
competitive foods.321
Obese Children Ages 6 to 11Obese Children Ages 2 to 5
16.7% 3.5% 26.1% 13.1%
Latino LatinoWhite White
Population Living Below the Poverty Line
White
Latino
11%23%

105 TFAH • RWJF • StateofObesity.org
l Barriers due to language, culture and
immigration status: Several factors
can prevent many Latinos from
participating in programs that could
provide increased access to healthier
choices. Health education and
programs — including ones designed
to improve nutrition, increase activity
and prevent obesity-related health
problems — are often not made
available in Spanish and not sensitive
to cultural differences. In addition,
many health education workers
have not been trained to work with
Latino populations. Often access to
needed programs is further impeded
when immigration status is related to
eligibility for different nutrition and
health programs, or when potential
beneficiaries fear involvement of
immigration officials. There can
be limited information and lack
of understanding by the potential
participants and the workers in the
programs themselves, who also may
not be trained to understand how
to provide services for people of
different immigration status or for
Spanish speakers. Finally, there exists
a history of issues and stigma within
systems, which can make it harder
for many Latinos to choose to take
advantage of available benefits. In
2011, 34.9 percent of all Latinos
were eligible for SNAP but only 21.4
percent received benefits.322, 323
l Higher exposure to marketing of
less nutritious foods: Latinos are a
major and increasing target for food
marketers, particularly due to their
increasing proportion of the U.S.
population and relative spending
power. Between 2010 and 2013, fast
food restaurants increased their over-
all advertising expenditures on Span-
ish-language TV by 8 percent. Latino
preschoolers viewed almost one fast
food ad on Spanish-language TV
every day in 2013, a 16 percent in-
crease from 2010. In addition, low-in-
come Latino neighborhoods have up
to nine times the density of outdoor
advertising for fast food and sugary
drinks as high-income White neigh-
borhoods,324 and Latino children are
more likely to attend a school that
is close to fast-food restaurants and
convenience stores.325
STUDIES HAVE FOUND THAT 84 PERCENT OF YOUTH-TARGETED FOOD ADVERTISING ON SPANISH-
LANGUAGE TV PROMOTES FOOD OF LOW NUTRITIONAL VALUE.
SNAP Participation by Latinos in 2011
21.4%Latinos receivedbenefits 34.9%
Latinos eligible for SNAP
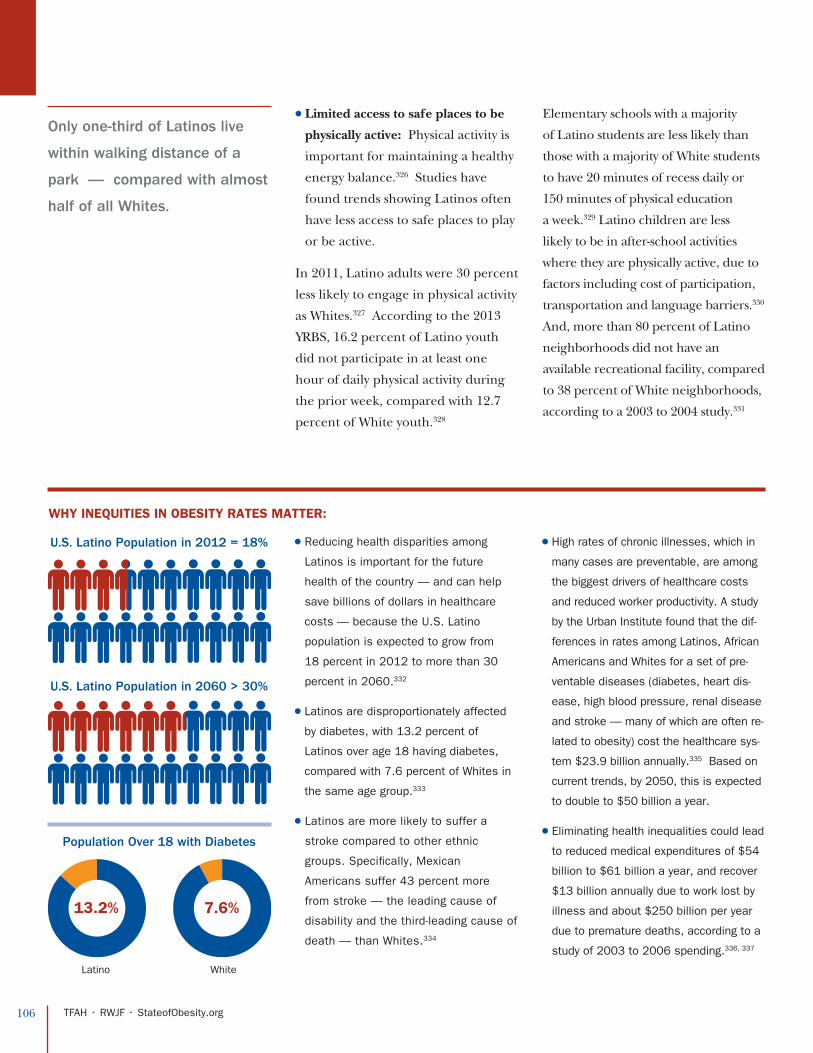
106 TFAH • RWJF • StateofObesity.org
l Limited access to safe places to be
physically active: Physical activity is
important for maintaining a healthy
energy balance.326 Studies have
found trends showing Latinos often
have less access to safe places to play
or be active.
In 2011, Latino adults were 30 percent
less likely to engage in physical activity
as Whites.327 According to the 2013
YRBS, 16.2 percent of Latino youth
did not participate in at least one
hour of daily physical activity during
the prior week, compared with 12.7
percent of White youth.328
Elementary schools with a majority
of Latino students are less likely than
those with a majority of White students
to have 20 minutes of recess daily or
150 minutes of physical education
a week.329 Latino children are less
likely to be in after-school activities
where they are physically active, due to
factors including cost of participation,
transportation and language barriers.330
And, more than 80 percent of Latino
neighborhoods did not have an
available recreational facility, compared
to 38 percent of White neighborhoods,
according to a 2003 to 2004 study.331
l Reducing health disparities among
Latinos is important for the future
health of the country — and can help
save billions of dollars in healthcare
costs — because the U.S. Latino
population is expected to grow from
18 percent in 2012 to more than 30
percent in 2060.332
l Latinos are disproportionately affected
by diabetes, with 13.2 percent of
Latinos over age 18 having diabetes,
compared with 7.6 percent of Whites in
the same age group.333
l Latinos are more likely to suffer a
stroke compared to other ethnic
groups. Specifically, Mexican
Americans suffer 43 percent more
from stroke — the leading cause of
disability and the third-leading cause of
death — than Whites.334
l High rates of chronic illnesses, which in
many cases are preventable, are among
the biggest drivers of healthcare costs
and reduced worker productivity. A study
by the Urban Institute found that the dif-
ferences in rates among Latinos, African
Americans and Whites for a set of pre-
ventable diseases (diabetes, heart dis-
ease, high blood pressure, renal disease
and stroke — many of which are often re-
lated to obesity) cost the healthcare sys-
tem $23.9 billion annually.335 Based on
current trends, by 2050, this is expected
to double to $50 billion a year.
l Eliminating health inequalities could lead
to reduced medical expenditures of $54
billion to $61 billion a year, and recover
$13 billion annually due to work lost by
illness and about $250 billion per year
due to premature deaths, according to a
study of 2003 to 2006 spending.336, 337
WHY INEQUITIES IN OBESITY RATES MATTER:
U.S. Latino Population in 2012 = 18%
U.S. Latino Population in 2060 > 30%
Population Over 18 with Diabetes
Only one-third of Latinos live
within walking distance of a
park — compared with almost
half of all Whites.
13.2% 7.6%
Latino White

107 TFAH • RWJF • StateofObesity.org
l Ensure community-based obesity prevention and control strategies are culturally and linguistically appropriate and use sustained and comprehensive interventions to maximize effectiveness. Policy solutions must consider and target the variety of factors that impact an individual’s environment. Efforts must be culturally competent and include English- and Spanish-language communications campaigns and delivery of social services that use respected, trusted messengers and appropriate channels.
l Increase access to and utilization of promotores (community health workers, peer leaders and health advocates) who more effectively connect Latino communities with public health services, the healthcare system and other social services. Promotores play an important role in promoting community-based health education and prevention in a manner that is culturally and linguistically appropriate.338 New Medicaid regulations permitting reimbursement of community health workers should be leveraged to increase the role of promotores in obesity prevention.
l Provide education to Latino parents about childhood obesity, and the importance of healthy eating and physical activity, in a culturally sensitive way. Education should include information about enrolling in federal programs designed to ensure healthy and adequate nutrition, such as SNAP.
Policy Recommendations:

108 TFAH • RWJF • StateofObesity.org
l Standards should be set to limit the amount of advertising of foods of low nutritional value, particularly advertising targeting Latino children, via television, radio, new digital media (internet, social media, digital apps, mobile phones, tablets, etc.), outdoor ads and point-of-sale product place-ments. Policies should help encourage increased marketing of healthier food products to children and families.
l Healthy food financing initiatives should help to recruit additional grocery stores and support the availability of affordable, healthy products within existing stores in predominately Latino communities.
l Partnerships between government, businesses, faith-based groups, community organizations, schools and others should be promoted to increase access to healthy, affordable food and safe places for physical activity in Latino communities and neighborhoods. These partnerships should leverage the local resources and abilities of each of these partners.
l Support for addressing racial and ethnic inequities in obesity — at the federal, state and local levels — should be increased.
Policy Recommendations:
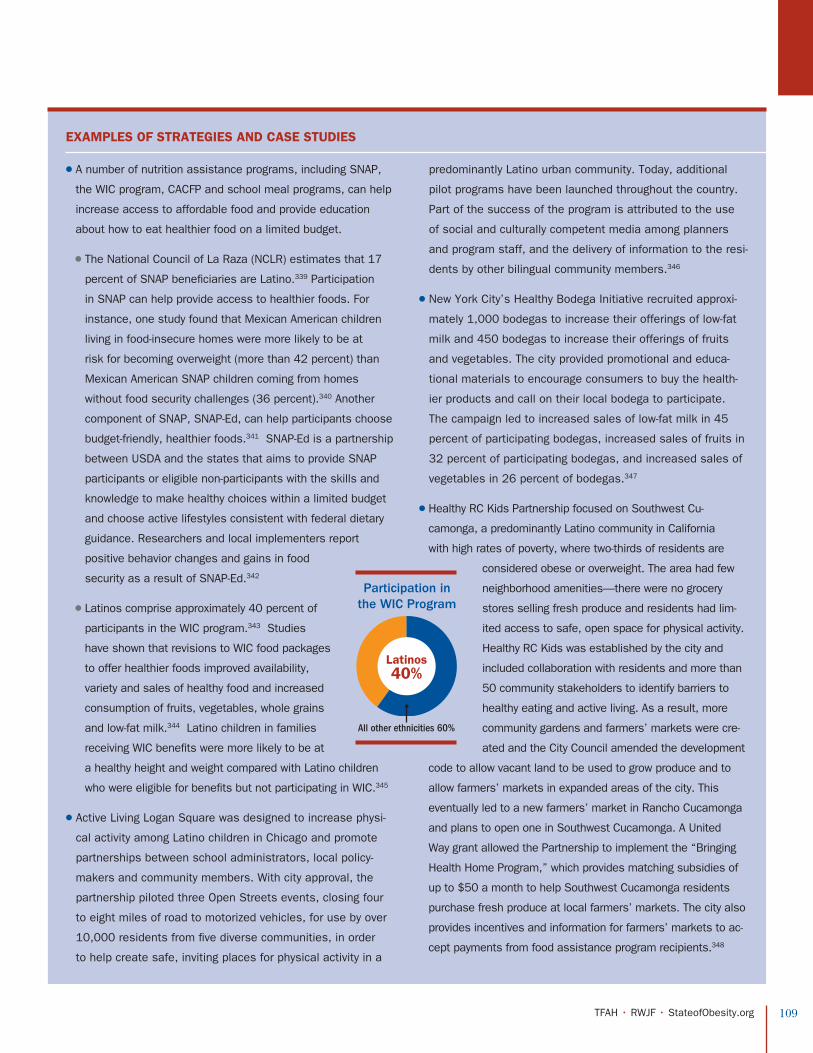
109 TFAH • RWJF • StateofObesity.org
EXAMPLES OF STRATEGIES AND CASE STUDIES
l A number of nutrition assistance programs, including SNAP,
the WIC program, CACFP and school meal programs, can help
increase access to affordable food and provide education
about how to eat healthier food on a limited budget.
l The National Council of La Raza (NCLR) estimates that 17
percent of SNAP beneficiaries are Latino.339 Participation
in SNAP can help provide access to healthier foods. For
instance, one study found that Mexican American children
living in food-insecure homes were more likely to be at
risk for becoming overweight (more than 42 percent) than
Mexican American SNAP children coming from homes
without food security challenges (36 percent).340 Another
component of SNAP, SNAP-Ed, can help participants choose
budget-friendly, healthier foods.341 SNAP-Ed is a partnership
between USDA and the states that aims to provide SNAP
participants or eligible non-participants with the skills and
knowledge to make healthy choices within a limited budget
and choose active lifestyles consistent with federal dietary
guidance. Researchers and local implementers report
positive behavior changes and gains in food
security as a result of SNAP-Ed.342
l Latinos comprise approximately 40 percent of
participants in the WIC program.343 Studies
have shown that revisions to WIC food packages
to offer healthier foods improved availability,
variety and sales of healthy food and increased
consumption of fruits, vegetables, whole grains
and low-fat milk.344 Latino children in families
receiving WIC benefits were more likely to be at
a healthy height and weight compared with Latino children
who were eligible for benefits but not participating in WIC.345
l Active Living Logan Square was designed to increase physi-
cal activity among Latino children in Chicago and promote
partnerships between school administrators, local policy-
makers and community members. With city approval, the
partnership piloted three Open Streets events, closing four
to eight miles of road to motorized vehicles, for use by over
10,000 residents from five diverse communities, in order
to help create safe, inviting places for physical activity in a
predominantly Latino urban community. Today, additional
pilot programs have been launched throughout the country.
Part of the success of the program is attributed to the use
of social and culturally competent media among planners
and program staff, and the delivery of information to the resi-
dents by other bilingual community members.346
l New York City’s Healthy Bodega Initiative recruited approxi-
mately 1,000 bodegas to increase their offerings of low-fat
milk and 450 bodegas to increase their offerings of fruits
and vegetables. The city provided promotional and educa-
tional materials to encourage consumers to buy the health-
ier products and call on their local bodega to participate.
The campaign led to increased sales of low-fat milk in 45
percent of participating bodegas, increased sales of fruits in
32 percent of participating bodegas, and increased sales of
vegetables in 26 percent of bodegas.347
l Healthy RC Kids Partnership focused on Southwest Cu-
camonga, a predominantly Latino community in California
with high rates of poverty, where two-thirds of residents are
considered obese or overweight. The area had few
neighborhood amenities—there were no grocery
stores selling fresh produce and residents had lim-
ited access to safe, open space for physical activity.
Healthy RC Kids was established by the city and
included collaboration with residents and more than
50 community stakeholders to identify barriers to
healthy eating and active living. As a result, more
community gardens and farmers’ markets were cre-
ated and the City Council amended the development
code to allow vacant land to be used to grow produce and to
allow farmers’ markets in expanded areas of the city. This
eventually led to a new farmers’ market in Rancho Cucamonga
and plans to open one in Southwest Cucamonga. A United
Way grant allowed the Partnership to implement the “Bringing
Health Home Program,” which provides matching subsidies of
up to $50 a month to help Southwest Cucamonga residents
purchase fresh produce at local farmers’ markets. The city also
provides incentives and information for farmers’ markets to ac-
cept payments from food assistance program recipients.348
Participation in the WIC Program
40%Latinos
All other ethnicities 60%

110 TFAH • RWJF • StateofObesity.org
COMER BIEN349
In an effort to gain greater understand-
ing of the food environment among
Latino families, NCLR conducted a
video and story-banking project that
captured the experiences of Latino
parents and caregivers around the
country in feeding their families. The
stories feature individuals who range
from multigenerational U.S. citizens to
first-generation immigrants raising their
U.S.-born children. Respondents talked
to NCLR about buying and preparing
food, community resources and the
health of their children. The interviews
help gain perspective into the barriers
Latinos face in feeding their families
and strategies for how to improve nutri-
tion, ranging from monthly budgeting
to learning to cook traditional cultural
foods in healthier ways.

111 TFAH • RWJF • StateofObesity.org
PROMOTORES: USING LATINO COMMUNITY HEALTH WORKERS TO REACH VULNERABLE POPULATIONS
Promotores play an important role in
promoting community-based health edu-
cation and prevention in a manner that
is culturally and linguistically appropri-
ate, particularly among populations that
have been historically underserved and
uninsured.350 Promotores are especially
important because they typically share
the ethnicity, language, socioeconomic
status and life experience of the com-
munity members they serve.351
Evidence shows that promotores help
improve intervention outcomes. A
systematic review of evidence-based
obesity treatment interventions for La-
tino adults in the U.S. found that the
two interventions with the largest effect
sizes used promotores.352 Both studies
involved promotores as the intervention
implementers in the community.353, 354
In 2011, HHS launched the Promotores
de Salud Initiative in an effort to
educate the Latino community about
available healthcare services and other
benefits made possible by the ACA.
Since the launch, the HHS Promotores
de Salud Steering Committee has
worked to improve Latino access to
health information and services.355
Salud America!356, 357, 358
Salud America! is an RWJF-funded re-
search network that aims to prevent
obesity among Latino children. Since the
start of Salud America! in 2007, the net-
work has developed essential scientifıc
evidence, research, communications and
a wealth of information to raise aware-
ness of Latino childhood obesity, build
the field of researchers working to reduce
the epidemic and empower stakeholders
to take action and create change.
Salud America! works to improve Latino
children’s health by targeting six key
areas that could make the greatest ad-
vances in reducing obesity in the least
amount of time: sugary drinks, healthier
marketing, active play, active spaces,
better food in the neighborhood and
healthier school snacks.
Salud America! launched a Growing Healthy
Change initiative to bring together evidence,
new policies, success stories, social media
and resources to help individuals and com-
munities develop capacity to create healthy
policy changes in the six key areas. The
Growing Healthy Change website allows
you to input your address and find concrete
policy initiatives happening in your neigh-
borhood, school, city or state to improve
nutrition, physical activity and marketing
aimed at Latino kids. The website also of-
fers many resources, success stories and
videos of real-life Salud Heroes of change
to inspire and help individuals, groups and
communities to create their own change.
ADDITIONAL RESOURCES:
Salud America!: The RWJF Research Network to Prevent Obesity Among Latino Children: http://salud-america.org/
Salud America! Growing Healthy Change: http://www.communitycommons.org/salud-america/
Comer Bien. National Council of La Raza:
http://www.nclr.org/index.php/issues_and_programs/health_and_nutrition/healthy_foods_families/comer_bien/
Office of Minority Health, U.S. Department of Health and Human Services: http://minorityhealth.hhs.gov/
© AP Images/Paul Chou

Maximizing The Impact of Obesity-Prevention Efforts In Latino Communities: KEY FINDINGS AND STRATEGIC RECOMMENDATIONS
Health leaders interviewed for the study are acutely
aware of how the Latino community is disproportionately
affected by America’s obesity epidemic — but they are
also optimistic about how well-thought-out and effectively
implemented policies can help achieve better health.
Overall, they feel the general policy approaches that have
been identified for how to respond to the obesity epidemic
are on the right track but policy development is only half
the battle, and the implementation of those policies has
been relatively limited in the Latino community.
The interviews revealed two core
issues that must be addressed to
improve implementation:
1. Community engagement needs
to happen simultaneously with
investment of resources, or else the
investment will not bring the level
of cultural change that is needed.
This includes making community
input, leadership, accountability
and sustainability priority goals
at the outset — and building
programs that match the interests
of the community and will motivate
participation.
2. Prevention efforts must be true
partnerships between national/state
organizations and communities.
Resources and technical assistance
typically flow from top down, but
effective implementation requires
understanding and integrating with
the priorities, perspectives and existing
resources within those communities.
This means going beyond prescriptive
measures and grants by improving
coordination and synergies with other
efforts, establishing shared goals and
ownership and providing training and
assistance to build leadership within
the community.
MAY 2014
On behalf of Trust For America’s Health
and Salud America!, Greenberg Quinlan
Rosner Research conducted a set of
10 one-on-one, in-depth-interviews
among public health leaders in Latino
communities across the country.
The participants represent both the
public and private sectors and include
academics, health professionals and
community and business leaders,
among others. The study was designed
to assess barriers to and identify
solutions for reducing and preventing
obesity in Latino communities. All
interviews were conducted between
April 22 and May 1, 2014.
112 TFAH • RWJF • StateofObesity.org

113 TFAH • RWJF • StateofObesity.org
NUTRITION, ACTIVITY AND SOCIOECONOMICS
BARRIER: Socioeconomic factors amplify the barriers that can get in the way of physical activity and access to healthy food.
RECOMMENDATION: Help make healthier choices easier by increasing access to and opportunities for physical activity
and healthy eating — but don’t stop there.
The leaders in the Latino communities were
very supportive of a wide range of obesity
prevention policy approaches — ranging
from healthy food financing initiatives to im-
proving the built environment to improving
nutrition and activity in schools to improving
and increasing public education initiatives
to supporting shared-use agreements to
allow members of the community to have
access to school and community centers
for recreational purposes during off-hours.
But they unanimously agreed that: 1)
more resources are needed to support
these efforts; 2) these programs must
become more focused and efficient, and
also be developed within the context of
programs that address other socioeco-
nomically linked issues, such as quality
housing, education, crime reduction and
transportation; and 3) efforts must proac-
tively engage members of the community.
For example, instead of just opening
schools for community use during non-
school hours, soccer leagues, walking
clubs, community cooking classes and
other organized social programs should be
developed so the community has a way to
make use of these expanded resources.
In addition, a number of the leaders rec-
ommended focusing on solutions that
improve health along with overall quality of
life, including:
l Helping people integrate health into their
daily lives by making communities more
walkable and improving public transit.
l Making opportunities for good health fun
and social, such as cooking classes,
walking clubs and community gardens.
AFFORDABLE, ACCESSIBLE FOOD AND SAFE PLACES TO BE ACTIVE
Socioeconomics
Structural Concerns and
Building Motivation
“Awesome. Improving nutrition
and increasing activity for young
children, such as through efforts
or regulations in daycare centers]
would work, because little kids
want to be part of the group.
Make it social.”
“I would definitely support [shared use agreements], and I think it would work. I think a significant number
of people in my community can’t afford a gym, so it’s important for them to have access. A place to walk,
do laps, get moving. But there’s also a need to have a structure and organization in place—groups walking
together, for example. We need to put a motivation and structure in place, along with access.”
“The obstacles are finances,
which is not unique. But we
also have less access to
healthy food; stores don’t have
healthy products.”
“We have healthy food in close
proximity, but we don’t have
AFFORDABLE, healthy food.”
“The built environment doesn’t make
healthy choices easy for individuals. There
aren’t safe parks for kids to play. As a
result, poor choices are made. We need
safe and fun recreational activities.”
“Good. But [shared-use
agreements] would be most
effective if schools have an
active role in organizing and
supporting it.”
“[Making water available as an alternative to
sugary drinks is] good, but there needs to be a
lot more. You need infrastructure — new pipes
because the water tastes bad or is unsafe. You
need education on why water is better.”

114 TFAH • RWJF • StateofObesity.org
EDUCATION AND CULTURE
BARRIER: Education and cultural differences contribute to less knowledge
about nutrition and activity. Many people do not understand which options are
healthier or why they should choose healthier options. This is reinforced by
disproportionate marketing of unhealthy foods in these communities.
RECOMMENDATION: Keep educating and raising awareness; make it relevant
to people’s lives.
The Latino health leaders emphasized that
simply putting the physical resources into
place is not enough. Physical resources
need to go hand-in-glove with education cam-
paigns that focus on how to eat healthier
and be more physically active—and how eat-
ing well and being active can be enjoyable,
help reduce stress, and lower risk for or help
manage type 2 diabetes and other chronic
diseases. The health leaders noted the
importance of personal responsibility, but
also acknowledged that there needs to be
increased education about which resources
are available and how to be healthy, includ-
ing how to make healthy choices easier even
within the context of economic constraints.
In fact, increasing education was viewed as
even more important to give people the tools
and information about resources to combat
economic barriers — particularly to actively
promote healthy foods in areas where un-
healthy options are often more easily avail-
able and viewed as cheaper.
Neither cultural nor language barriers were
raised organically during the interviews, but
when asked directly, the leaders responded
that cultural issues in particular contribute to
obesity. For instance, many Latino families
work to maintain cultural food traditions, but
then the problem is exacerbated by habits
rooted in U.S. culture, including driving more
instead of walking, adopting bigger portion
sizes, buying more processed foods or using
less healthy ingredients because they are
readily available. While the leaders acknowl-
edge that immigration status can impact
access to healthcare, they universally agreed
that the bigger concern is that the less
healthy habits adopted by many immigrants
after they come to the United States have a
negative impact on their health. The leaders
largely reported that most of the informa-
tion about nutrition and physical activity was
available in both Spanish and English, but
they were concerned about getting useful in-
formation in a sustained and supportive way
to the people who could most benefit from it.
The health leaders stressed the importance
of tailoring policies and approaches in ways
that make better nutrition and increased
physical activity relevant to people’s daily
lives. For instance, one participant ex-
plained that some activities, like soccer and
dancing, are often more popular, are more
social and have more cultural resonance
than others, such as weightlifting.
Investing in a social component for obesity
prevention initiatives is also important. A
number of health leaders raised concerns
about a lack of social cohesion in the Latino
community, which takes away the motivation
to learn from others, positive peer pressure
influences and the ability to join in com-
munity activities. For example, shared-use
agreements can help serve as an impetus
for getting members of the community to-
gether and creating groups like recreational
sports, walking or exercise groups, or cook-
ing clubs, where healthy activities are com-
bined with positive social experiences.
115 TFAH • RWJF • StateofObesity.org
Education Cultural Influences “As an immigrant, I think
it’s more about a later
adoption of unhealthy,
American eating habits. The
longer you’re here, you start
to pick up on unhealthy
habits like fast food.”
“The question is how
to improve while still
retaining cultural aspects—
you can be healthy eating
Latino food.”
“There definitely needs to be more education for kids, but also older adults. We need to make it part of normal daily activities, integrate it into school and home life. They need to hear this message everywhere, that it’s OK and important—they need to hear at school, church, at the doctor, in retail, on TV and in the media. A lot of times there are resources, but people don’t know about them.”
Social Solutions
“We have failed a lot. But what has
finally worked is the social aspect. We
created social programs where we eat
together, exercise together, play, laugh,
experience life together. And while we’re
gathering, we tackle the issues that
contribute to obesity.”
“We need people to come
together. There almost
needs to be a social
pressure that everyone
feels, that they need to
get on board. There has
to be a social element.”
“The programs most embraced are the ones
that are free and open to everyone. Also
the ones that are fun. People want to feel
better — they may not know they need to lose
weight or have diabetes, but they are willing
to try riding a bike to feel better generally.
Fun and accessible, people will respond to.”

116 TFAH • RWJF • StateofObesity.org
COLLABORATION, SHARED OWNERSHIP AND SUSTAINABILITY
BARRIER: Programs and efforts often 1) are based on short-term initiatives
or grants and 2) do not include community input or leadership recruitment,
coordination with other efforts within the given community or partnership building
at the outset. As a result, programs do not gain traction and are not sustainable.
RECOMMENDATION: Make sustainability, continuity and community input
primary goals at the outset.
Health leaders emphasized that if people
from the communities themselves are not
empowered to have ownership of obesity-
prevention initiatives, the programs
are not viable. Currently, there is not a
systemic or widely successful replicable
model for how to create empowerment
and leadership within local communities.
There is a weak connection to state and
national entities, where the local groups
are appreciative of resources, but there is
also a feeling that these organizations and
funding mechanisms tend to drop in and
out, leaving local leaders overwhelmed
and unable to create lasting change alone.
At the same time, local communities also
need support and technical assistance
that the national and state groups can pro-
vide. Policies must strike a balance that
allows local leaders to identify priorities
and approaches that are most appropriate
within their own community and also builds
on the expertise and support provided by
national research and initiatives.
In addition, many times new initiatives are
introduced without considering existing pro-
grams, resources and expertise in a given
community. These initiatives are not coordi-
nated with or built on existing local efforts,
identified priorities or the culture of a given
area. Health leaders expressed that im-
proved coordination and context would help
programs be more efficient and gain trac-
tion more quickly with community members
who are already invested. For instance, if
a community has worked hard to build a
crime reduction effort that has gained mo-
mentum and community engagement within
a neighborhood, then it would be most ef-
ficient to find ways to build physical activity
programs, such as neighborhood walking
programs or improving parks, within the
context of that existing movement.
Health leaders also emphasized the need
to consider the sustainability of programs
over time, rather than focus on short-term
initiatives. This requires thinking about
ongoing funding opportunities, tying new
resources with ongoing programs and creat-
ing partnerships within a community to en-
sure that communities are fully invested in
efforts. Getting upfront input and ownership
is also key to sustainability. The leaders ex-
pressed the importance of letting the com-
munity itself be part of the oversight and
evaluation of a program to ensure efforts
are efficiently and effectively meeting the
community’s goals. The fact that resources
are scarce and critical, but often not well
spent, is a great source of frustration.

117 TFAH • RWJF • StateofObesity.org
Sustainability
“There are a lot of people doing
similar things. Some groups take
ownership and that’s great. But
there’s not a lot of communication
between groups trying to do the
same thing. It creates duplication.”
“The things that work are when the
programming includes training the
community members and empowering
people who participate so they can
take over. Need to encourage them to
go on and start their own walking club.”
“Right now there is a lot of activity going on
across the country, but it’s very chaotic. And
within each community there’s not typically
much alignment of interests. Resources
get diluted quickly. Or there are too many
things being done with too few resources.
There’s too much going on and not enough
coordination and organization.”
“The only way is if the people who participate take ownership. It’s not fair to fund two-year programs—results won’t happen in that short a window. There needs to be longer periods of time to implement and educate. We need time to start to see the benefits—once people see that they can take ownership and go help others.”
Upfront Community Engagement and Shared Ownership
Coordination and Improved Efficiency and Effectiveness
“We need to define what each
sector is doing so it’s in synergy
with what other sectors are doing.
So everyone’s action is coordinated
instead of being a mixed basket.”
“We don’t need national
groups to prescribe the
remedy, but we do need
help in determining a
roadmap for achieving it.”
“We often fail to identify natural community leaders that can organize
and mobilize people.”
“What makes it work is a very well-oiled and
coordinated infrastructure—at the national level or
local level—but the best examples are happening at
both levels. The infrastructure has the money and
know-how to provide support to local communities.”
“Making individuals part of the process. Build
community participation so it doesn’t stop when
the grant is over. The question is how do we get
a relatively small grant to have an afterlife?”
“A lot of things are two-
year grants that just
go away. Those are not
successful.”
Coordination and Thoughtful Planning
© AP Images/Paul Chou
118 TFAH • RWJF • StateofObesity.org
Tu Salud Si Cuenta: How Improving Health Benefits the Entire Community
In 2000, the University of Texas School of Public Health
placed a satellite campus in Brownsville, a largely Latino
city on the Texas-Mexico border. Researchers set to work—
identifying the health risks our community faced and
designing creative solutions for our unique population.
One of the first things the research
team did in response was launch
“Tu Salud Si Cuenta,” a Spanish-
language program on local TV and
radio stations. Dr. Belinda Reininger,
an assistant professor at the School
of Public Health, developed the
program. She understood the
importance of educating people about
their health, but she also knew she
and her team had to do more.
That’s when Dr. McCormick, dean
of the Brownsville campus invited
me to participate in their efforts. He
and his team believed it was critical to
involve clinicians in public health. At
the time, I was a practicing physician
and the day I met Dr. McCormick my
public health education began.
I started by writing a weekly column in
the newspaper. I wrote about playing
outside at my grandmother’s house
when I was a kid and the healthy
meals she’d cook for us—activities that
had fallen by the wayside with time. I
challenged community leaders to make
sidewalks and bicycle trails a priority
instead of building tollways. The
column captured attention and the
community began to listen and learn.
The researchers found that 80
percent of Brownsville residents
were overweight or obese and
one-third were diabetic—half of
those people didn’t even know
they had diabetes.
EXPERT COMMENTARY
BY DR. ROSE GOWEN, MD, Commissioner
At-large, Brownsville, Texas
CULTIVATING ACCESS TO HEALTHY FOODS
We also backed our words with action.
Dr. Reininger suggested starting a
farmers’ market to help make fresh
fruits and vegetables more affordable
and accessible. We looked at examples
of successful farmers’ markets as we
considered where to locate; what
shoppers would purchase; and how to
attract growers. Our goal was to create
a certified Texas farmers’ market in
a city park, which meant navigating a
great deal of “red tape” and securing a
modest amount of funding.
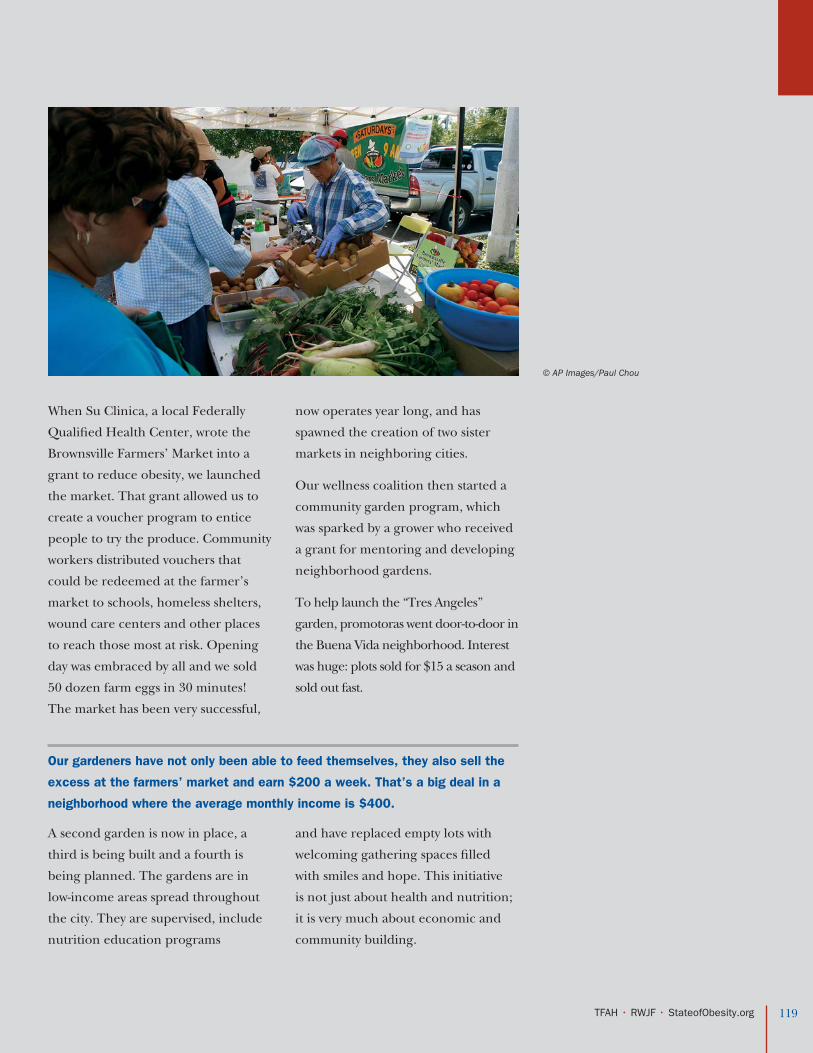
119 TFAH • RWJF • StateofObesity.org
When Su Clinica, a local Federally
Qualified Health Center, wrote the
Brownsville Farmers’ Market into a
grant to reduce obesity, we launched
the market. That grant allowed us to
create a voucher program to entice
people to try the produce. Community
workers distributed vouchers that
could be redeemed at the farmer’s
market to schools, homeless shelters,
wound care centers and other places
to reach those most at risk. Opening
day was embraced by all and we sold
50 dozen farm eggs in 30 minutes!
The market has been very successful,
now operates year long, and has
spawned the creation of two sister
markets in neighboring cities.
Our wellness coalition then started a
community garden program, which
was sparked by a grower who received
a grant for mentoring and developing
neighborhood gardens.
To help launch the “Tres Angeles”
garden, promotoras went door-to-door in
the Buena Vida neighborhood. Interest
was huge: plots sold for $15 a season and
sold out fast.
A second garden is now in place, a
third is being built and a fourth is
being planned. The gardens are in
low-income areas spread throughout
the city. They are supervised, include
nutrition education programs
and have replaced empty lots with
welcoming gathering spaces filled
with smiles and hope. This initiative
is not just about health and nutrition;
it is very much about economic and
community building.
Our gardeners have not only been able to feed themselves, they also sell the
excess at the farmers’ market and earn $200 a week. That’s a big deal in a
neighborhood where the average monthly income is $400.
© AP Images/Paul Chou

HELPING PEOPLE BE MORE ACTIVE
In addition to helping people eat
healthier, we also needed to make it as
easy as possible for them to be active.
This was challenging because in many
parts of the city, sidewalks were nonexis-
tent, in disrepair or disconnected.
We passed complete streets, sidewalk
and safe-passing ordinances. Then we
began a Build a Better Block Project
(BBB). The BBB concept involves
turning a block into an optimal
version of itself—wide sidewalks,
street lights, bicycle lanes, engaging
storefronts—for a day. The idea is to
let people “try it on for size.”
At first, we chose a block downtown
in need of revitalization. To prepare
for BBB, the School of Public Health’s
dietician worked with restaurants to
develop healthier options and streets
were transformed into pedestrian-
only spaces. Businesses on the block
and even those several blocks away
saw increased foot traffic and earned
more money in one day than they
usually do in a month.
We looked further at the built
environment and designed the Belden
Trail. By using grants and leveraging
additional funds from the city,
community and national foundations,
we turned a dangerous alleyway into
a well-lit mile-long concrete path that
connects several schools in a low-
income neighborhood.
The biggest lesson we’ve learned about
addressing health among the Latino
community in Brownsville is that we
can’t just talk about health. We have to
explain how good health benefits all.
Healthy children are happier and do
better in school. Businesses see more
customers when it’s safe and easy for
people to walk and bicycle around
town. Farmers’ markets and gardens
stimulate local economies and help
families on tight budgets.
Working collaboratively and
proactively is working in Brownsville.
Together we’re making changes that
will benefit our children today and
future generations to come.
Kids who were only a block
or two from school had to
take a bus each day because
their streets were not safe for
walking or biking.
120 TFAH • RWJF • StateofObesity.org
© AP Images/Paul Chou

Methodology for Behavioral Risk Factor Surveillance System for Obesity, Physical Activity and Fruit and Vegetable Consumption RatesMethodology for Obesity and Other Rates Using BRFSSAnnual Data
Data for this analysis was obtained from
the Behavioral Risk Factor Surveillance
System dataset (publicly available on the
web at www.cdc.gov/brfss). The data
were reviewed and analyzed for TFAH and
RWJF by Daniel Eisenberg, PhD, Associate
Professor, Health Management and Policy
at the University of Michigan School of
Public Health.
BRFSS is an annual cross-sectional survey
designed to measure behavioral risk
factors in the adult population (18 years of
age or older) living in households. Data are
collected from a random sample of adults
(one per household) through a telephone
survey. The BRFSS currently includes data
from 50 states, the District of Columbia,
Puerto Rico, Guam and the Virgin Islands.
Variables of interest included BMI,
physical inactivity, diabetes, hypertension
and consumption of fruits and vegetables
five or more times a day. BMI was
calculated by dividing self-reported weight
in kilograms by the square of self-reported
height in meters. The variable ‘obesity’
is the percentage of all adults in a given
state who were classified as obese
(where obesity is defined as BMI greater
than or equal to 30). Researchers also
provide results broken down by race/
ethnicity — researchers report results for
Whites, Blacks and Latinos — and gender.
Another variable, ‘overweight’ was created
to capture the percentage of adults in a
given state who were either overweight or
obese. An overweight adult was defined
as one with a BMI greater than or equal
to 25 but less than 30. For the physical
inactivity variable a binary indicator equal
to one was created for adults who reported
not engaging in physical activity or exercise
during the previous thirty days other than
their regular job. For diabetes, researchers
created a binary variable equal to one if
the respondent reported ever being told
by a doctor that he/she had diabetes.
Researchers excluded all cases of
gestational and borderline diabetes as
well as all cases where the individual was
either unsure, or refused to answer.
To calculate prevalence rates for
hypertension, researchers created a dummy
variable equal to one if the respondent
answered “Yes” to the following question:
“Have you ever been told by a doctor, nurse or
other health professional that you have high
blood pressure?” This definition excludes
respondents classified as borderline
hypertensive and women who reported being
diagnosed with hypertension while pregnant.
The State of Obesity:
Appendix A
APPE
ND
IX A
: LA
TIN
OS A
ND
OB
ESIT
Y PRE
VE
NT
ION
SE
PT
EM
BE
R 2014
122 TFAH • RWJF • StateofObesity.org
Endnotes
1 The Surgeon General’s Call To Action To Prevent and Decrease Overweight and Obesity. Rockville, MD: U.S. Department of Health and Human Services, 2001.
2 Robbins JM, Mallya G, Polansky M, Schwarz DF. Prevalence, Disparities, and Trends in Obesity and Severe Obesity Among Students in the Philadelphia, Pennsylvania, School District, 2006–2010. Prev Chronic Dis, 9, 2012.
3 Defining Overweight and Obesity. In Centers for Disease Control and Prevention. http://www.cdc.gov/obesity/adult/defin-ing.html (accessed May 2014).
4 Centers for Disease Control and Preven-tion. National Health and Nutrition Ex-amination Survey, 2011-2012. Prevalence of Obesity among Adults: United States, 2011-2012.
5 Ogden CL, Carroll MD, Kit BK, Flegal KM. Prevalence of childhood and adult obesity in the United States, 2011-2012. JAMA. 2014;311(8):806-814.
6 Centers for Disease Control and Prevention. National Health and Nutrition Examination Survey, 2011-2012. Prevalence of Obesity among Adults: United States, 2011-2012.
7 Ogden CL, Carroll MD, Kit BK, Flegal KM. Prevalence of childhood and adult obesity in the United States, 2011-2012. JAMA. 2014;311(8):806-814.
8 Skinner AC, Skelton J, Prevalence and Trends in Obesity and Severe Obesity Among Children in the United States, 1999-2012. JAMA Pediatrics, doi:10.1001/jamapediatrics.2014.21, 2014.
9 Odgen CL. Childhood Obesity in the United States: The Magnitude of the Prob-lem. Power Point. http://www.cdc.gov/about/grand-rounds/archives/2010/down-load/GR-062010.pdf (accessed June 2013).
10 Fryar CD, Carroll MD and Ogden, CL. Prevalence of Overweight, Obesity, and Extreme Obesity Among Adults: United States, Trends 1960-1962 Through 2009-2010. National Center for Health Statistics, September 2012. http://www.cdc.gov/nchs/data/hestat/obesity_adult_09_10/obesity_adult_09_10.htm (accessed May 2013).
11 Ogden CL, Carroll MD, Kit BK, Flegal KM. Prevalence of childhood and adult obesityin the United States, 2011-2012. JAMA. 2014;311(8):806-814.
12 Ibid.
13 Ibid.
14 Ibid.
15 An R. Prevalence and Trends of Adult Obesity in the US, 1999-2012. Obesity, 2014.
16 Ogden CL, Carroll MD, Kit BK, Flegal KM. Prevalence of childhood and adult obesity in the United States, 2011-2012. JAMA. 2014;311(8):806-814.
17 Census regions of the United States. North-east: CT, ME, MA, NH, NJ, NY, PA, RI, VT; Midwest: IL, IN, IA, KS, MI, MN, MO, NE, ND, OH, SD, WI; South: AL, AR, DE, DC, FL, GA, KY, LA, MD, MS, NC, OK, SC, VA, TN, TX, VA, WV; West: AK, AZ, CA, CO, HI, ID, MT, NM, NV, OR, UT, WA, WY.
18 Nutrition and Weight Status. In Healthypeople 2020. http://www.healthypeople.gov/2020/topicsobjectives2020/objectiveslist.aspx?topicId=29 (accessed June 2013).
19 Prevalence and Trends Data, Overweight and Obesity (BMI)—2012. In Centers for Dis-ease Control and Prevention. http://apps.nccd.cdc.gov/brfss/list.asp?cat=OB&yr=2012&qkey=8261&state=All (accessed May 2014).
20 Pregnant women were included in cal-culations of BMI prior to 2011 and the height standards also changed in that year. Users can see that the calculated variables changed from _BMI4 to _BMI5 (and _BMI4CAT and _BMI5CAT). They can also see that the variable for height used in the calculations changed in that year. Data users are cautioned against trending before and after 2011. Docu-mentation on the changes can be found on the BRFSS website in the calculated variable reports for the respective years.
21 Description of BRFSS and changes in methodology provided by CDC.
22 Merrill RM and Richardson JS. Validity of Self-reported Height, Weight, and Body Mass Index: Findings from the National Health and Nutrition Examination Survey, 2001-
2006. Preventing Chronic Disease, 6(4):2009. http://www.cdc.gov/pcd/issues/2009/oct/08_0229.htm (accessed March 2010).
23 Stunkard AJ and Wadden TA. Obesity: Theory and Therapy. Second ed. New York, NY: Raven Press, 1993.
24 National Research Council. Diet and Health: Implications for Reducing Chronic Disease Risk. Washington, D.C.: National Academy Press, 1989.
25 Ibid.
26 Parker-Pope T. “Watch Your Girth.” The New York Times May 13, 2008.
27 Trust for America's Health and Robert Wood Johnson Foundation. F as in Fat: How Obesity Threatens America's Future, 2013
28 Ogden CL, Lamb MM, Carroll MD, Flegal KM. Obesity and Socioeconomic Status in Adults: United States, 2005-2008. NCHS Data Brief, 50, 2010.
29 PedNSS uses existing data from the fol-lowing public health programs for nutri-tion surveillance: Special Supplemental Nutrition Program for Women, Infants and Children (WIC); Early and Periodic Screening, Diagnosis and Treatment (EPSDT) Program; and Title V Maternal and Child Health Program (MCH).
30 Ogden CL, Carroll MD, Kit BK and Flegal KM. Prevalence of obesity and trends in body mass index among U.S. children and adolescents, 1999-2010. Journal of the Ameri-can Medical Association, 307(5): 483-490, 2012.
31 U.S. Centers for Disease Control and Pre-vention. Obesity Prevalence Among Low-Income, Preschool-Aged Children—United States, 1998-2008. Morbidity and Mortality Weekly Report, 58(28): 769-773, 2009.
32 National Survey of Children’s Health, 2007. Overweight and Physical Activity Among Children: A Portrait of States and the Nation 2009, Health Resources and Services Ad-ministration, Maternal and Child Health Bureau. http://www.cdc.gov/nchs/slaits/nsch.htm (accessed May 24, 2011).

123 TFAH • RWJF • StateofObesity.org
33 U.S. Centers for Disease Control and Prevention. Youth Risk Behavior Surveil-lance — United States, 2013. Morbidity and Mortality Weekly Report, 63(SS04): 1-168, 2014.
34 Ibid.
35 U.S. Centers for Disease Control and Pre-vention. Youth Online: High School YRBS http://nccd.cdc.gov/youthonline/App/Default.aspx (Accessed June 2014).
36 Selvin E, Parrinello CM, Sacks DB, Coresh J. Trends in Prevalence and Control of Diabetes in the United States, 1988-1994 and 1999-2010. Annals of Internal Medicine, 160: 517-525, 2014.
37 U.S. Centers for Disease Control and Pre-vention, (2010). Number of Americans with Diabetes Projected to Double or Triple by 2050. [Press Release]. http://www.cdc.gov/media/pressrel/2010/r101022.html (accessed March 2011).
38 Total Prevalence of Diabetes & Pre-Diabetes. In American Diabetes Association. http://diabetes.org/diabetes-statistics/prevalence.jsp (accessed April 2008).
39 Ibid.
40 Dabelea D, et al. Prevalence of Type 1 and Type 2 Diabetes Among Children and Adolescents From 2001 to 2009. JAMA, 311(17): 1778-1786, 2014.
41 American Heart Association. Heart Disease and Stroke Statistics — 2006 Update. Dallas: American Heart Association, 2006.
42 Roger VL, Go AS, Lloyd-Jones DM, et al. Heart disease and stroke statistics — 2011 up-date: a report from the American Heart Associa-tion. Circulation, 123:e18—209, 2011.
43 U.S. Centers for Disease Control and Pre-vention. Prevalence of Abnormal Lipid Levels among Youths — United States, 1999-2006. Morbidity and Mortality Weekly Report, 59(2): 29-33, 2010.
44 American Heart Association. Heart Disease and Stroke Statistics — 2006 Update. Dallas: American Heart Association, 2006.
45 Obesity Statistics — U.S. Trends. In The Obe-sity Society. http://www.obesity.org/statistics/obesity_trends.asp (accessed April 2008).
46 What Are the Health Risks of Overweight and Obesity? In National Heart, Lung, and Blood Institute. http://www.nhlbi.nih.gov/health/dci/Diseases/obe/obe_risks.html (accessed May 14, 2010).
47 Trust for America’s Health. Healthy Women: The Path to Healthy Babies: The Case for Preconception Care. Washington, D.C.: TFAH, 2008.
48 Obesity and Cancer Risk. In National Can-cer Institute at the National Institutes of Health. http://www.cancer.gov/cancertopics/fact-sheet/Risk/obesity (accessed May 2014).
49 Wang Y, Chen X, Song Y, Caballero B, Cheskin LJ. Association between Obesity and Kidney Disease. Kidney International, 73: 19-33, 2008.
50 NHIS Arthritis Surveillance. In U.S. Centers for Disease Control and Prevention. http://www.cdc.gov/arthritis/data_statistics/national_data_nhis.htm#excess (accessed June 2008).
51 Beydoun et al. Obesity and Central Obesity as Risk Factors for Incident Dementia and Its Subtypes: A Systematic Review and Meta-Analysis. Obes Rev, 9(3): 204-218, 2008.
52 Xu WL, Atti AR, Gatz M, et al. Midlife overweight and obesity increases late-life dementia risk: A population-based twin study. Neurology, 76(18): 1568-1574, 2011.
53 Petry NM, Barry D, Pietrzak RH, Wagner JA. Overweight and obesity are associated with psychiatric disorders: results from the National Epidemiologic Survey on Alcohol and Related Conditions. Psychosom Med, 70:288–297, 2008.
54 U.S. Centers for Disease Control and Prevention, (2013). One in Five Adults Meet Overall Physical Activity Guidelines. [Press Release]. http://www.cdc.gov/media/releases/2013/p0502-physical-activity.html (accessed June 2013).
55 U.S. Department of Health and Human Services, Public Health Service, Centers for Disease Control and Prevention, National Center for Chronic Disease Prevention and Health Promotion, and Division of Nutri-tion and Physical Activity. Promoting Physical Activity: A Guide for Community Action. Vol. 1. Champaign, IL: Human Kinetics, 1999.
56 Rezende LF, Rey-López JP, Matsudo VK, Luiz OD. Sedentary behavior and health outcomes among older adults: a systematic review. BMC Public Health, 14(1):333, 2014.
57 Anderson LH, Martinson BC, Crain AL, et al. Healthcare Charges Associated with Physical Inactivity, Overweight, and Obesity. Preventing Chronic Disease, 2(4): A09, 2005.
58 KR, et al. Activity levels in mothers and their preschool children. Pediatrics, 133(4):e973-80, 2014.
59 Centers for Disease Control and Preven-tion. State Indicator Report on Fruits and Vegetables, 2013. Atlanta, GA: Centers for Disease Control and Prevention, 2013.
60 Institute of Medicine. Accelerating Progress in Obesity Prevention: Food and Drink. Wash-ington, D.C.: National Academies, 2012. http://www.iom.edu/Reports/2012/Accelerating-Progress-in-Obesity-Pre-vention/~/media/Files/Report%20Files/2012/APOP/IOM_FoodDrink_brief_v4.pdf (accessed May 2014).
61 Nutrition for Everyone: Fruits and Veg-etables. In Centers for Disease Control and Prevention. http://www.cdc.gov/nutrition/everyone/fruitsvegetables/index.html?s_cid=tw_ob191 (accessed May 2014).
62 2008 Physical Activity Guidelines for Americans. In U.S. Department of Health and Human Services. http://www.health.gov/paguidelines/guidelines/summary.aspx (accessed June 2013).
63 National Physical Activity Plan. The 2014 United States Report Card on Physical Activ-ity for children and Youth. https://www.informz.net/acsm/data/images/Nation-alReportCard_longform_final%20for%20web%282%29.pdf (accessed April 2014)..
64 Department of Education Fiscal Year 2014 Congressional Action Table. In U.S. Depart-ment of Education. http://www2.ed.gov/about/overview/budget/budget14/14action.pdf (accessed April 2014).
124 TFAH • RWJF • StateofObesity.org
65 Chriqui JF, Resnick EA, Schneider L, Scherm-beck R, Adcock T, Carrion V, Chaloupka FJ. School District Wellness Policies: Evaluating Prog-ress and Potential for Improving Children’s Health Five Years after the Federal Mandate. School Years 2006–07 through 2010-11. Volume 3. Chicago, IL: Bridging the Gap Program, Health Policy Center, Institute for Health Research and Policy, University of Illinois at Chicago, 2013, www.bridgingthegapresearch.org.
66 Active Living Research. Increasing Physical Activity Through Recess, Research Brief, January 2012. http://www.activelivin-gresearch.org/files/ALR_Brief_Recess.pdf
67 Presidential Youth Fitness Program: About. In Presidential Youth Fitness Program. http://pyfp.org/about/index.shtml (ac-cessed June 2014).
68 About Us. In Let’s Move! Active Schools. http://letsmoveschools.org/about/ (ac-cessed June 2014).
69 National AfterSchool Alliance. Standards for Healthy Eating and Physical Activity in Out-of-School Time Settings. http://naaweb.org/images/HEPAStandards8-4-11final.pdf (accessed April 2014)
70 YMCA of the USA, (2011). The Y Makes Commitment to Advance First Lady’s Efforts to keep Kids Healthy. [Press Release]. http://www.ymca.net/news-releases/20111130-KeepingKidsHealthy.html (accessed April 2014).
71 Partnership for a Healthier America, (2014). PHA Announces BGCA and NRPA Commitment to Create Healthier Environ-ment for Kids [Press Release]. http://ahealthieramerica.org/media/news-releases/#5482,news (accessed April 2014).
72 Policy Atlas. In National Complete Streets Coali-tion. http://www.smartgrowthamerica.org/complete-streets/changing-policy/com-plete-streets-atlas (accessed April 2014).
73 National Conference of State Legislatures. State Actions to Promote Healthy Communi-ties and Prevent Childhood Obesity, 2012. http://www.rwjf.org/content/dam/farm/reports/reports/2012/rwjf73173 (ac-cessed June 2013).
74 Chriqui JF, Resnick EA, Schneider L, Scherm-beck R, Adcock T, Carrion V, Chaloupka FJ. School District Wellness Policies: Evaluating Prog-ress and Potential for Improving Children’s Health Five Years after the Federal Mandate. School Years 2006–07 through 2010-11. Volume 3. Chicago, IL: Bridging the Gap Program, Health Policy Center, Institute for Health Research and Policy, University of Illinois at Chicago, 2013, www.bridgingthegapresearch.org.
75 Active Living Research. Policies and Standards for Promoting Physical Activity in After-School Programs, 2012. http://activelivingresearch.org/files/ALR_Brief_Afterschool_May2012_0.pdf (accessed March 2014).
76 Physical Activity Guidelines for Americans Midcourse Report: Strategies to Increase Physical Activity Among Youth. Washington, D.C.: U.S. Department of Health and Human Services, 2012. http://www.health.gov/paguidelines/midcourse/pag-mid-course-report-final.pdf (accessed June 2013).
77 Centers for Disease Control and Prevention. The association between school based physical activity, including physical education, and aca-demic performance. Atlanta, GA: U.S. Depart-ment of Health and Human Services; 2010
78 Active Living Research. Active Education: Physical Education, Physical Activity and Academic Performance, 2009. http://www.activelivingresearch.org/files/ALR_Brief_ActiveEducation_Summer2009.pdf (ac-cessed June 2013).
79 Luepker RV, Perry CL, McKinlay SM, et al. Outcomes of a field trial to improve children’s dietary patterns and physical activity. The Child and Adolescent Trial for Cardiovascular Health. CATCH collab-orative group. Journal of American Medical Association, 275(10):768–778, 1996.
80 Active Living Research. Do Short Physical Activity Breaks in Classrooms Work? 2013. http://www.rwjf.org/en/research-pub-lications/find-rwjf-research/2013/02/do-short-physical-activity-breaks-in-class-rooms-work-.html (accessed June 2013).
81 Gortmaker SL, et al. Impact of an After-school Intervention on Increases in Chil-dren’s Physical Activity. Medicine & Science in Sports & Exercise, 44(3):450–57, 2012.
82 Active Living Research. Promoting Physi-cal Activity Through the Shared Use of School and Community Recreational Resources, 2012. http://activelivingresearch.com/files/ALR_Brief_SharedUse_April2012.pdf (ac-cessed June 2013).
83 Johnston LD, O’Malley PM, Terry-McEl-rath YM, & Colabianchi N. School policies and practices to improve health and prevent obesity: National secondary school survey re-sults, school years 2006–07 through 2009 –10. Volume 2. Ann Arbor, MI: Bridging the Gap Program, Survey Research Center, Institute for Social Research, 2012.
84 Model Joint Use Agreement Resources: Increasing physical activity by opening up school grounds. In ChangeLab Solutions. http://changelabsolutions.org/publications/model-JUAs-national (accessed May 2013).
85 American Academy of Pediatrics. Policy State-ment: Prevention of Pediatric Overweight and Obesity. Pediatrics, 112(2):424-430, 2003 and Murray R. Response to ‘Parents’ Perceptions of Curricular Issues Affecting Children’s Weight in Elementary Schools. Journal of School Health, 77(5): 223-230, 2007.
86 Institute of Medicine. Preventing Childhood Obesity: Health in the Balance. Washington, D.C.: The National Academies Press, 2005.
87 Nihiser et al. Body Mass Index Measurement in Schools. J Sch Health. 2007;77(10):651.
88 American Association of Health Education. Comprehensive School Health Education: A Position Statement of the American As-sociation of Health Education, 2003.
89 SHPPS 2012: School Health Policies and Practices Study. In U.S. Centers for Disease Control and Prevention. http://www.cdc.gov/healthyyouth/shpps/ (accessed May 2014).
125 TFAH • RWJF • StateofObesity.org
90 Local School Wellness Policy Implemen-tation Under the Healthy, Hunger-Free Kids Act of 2010: Summary of the Pro-posed Rule. In United States Department of Agriculture. http://www.fns.usda.gov/sites/default/files/LWPproprulesum-mary.pdf (accessed May 2014).
91 Chillon P, et al. A Systematic Review of Interventions for Promoting Active Trans-portation to School. International Journal of Behavioral Nutrition and Physical Activity, 8(10), 2011. http://www.ijbnpa.org/con-tent/8/1/10 (accessed April 2013).
92 Wendel AM, Dannenberg AL. Reversing declines in walking and bicycling to school. Preventive Medicine, 48(6):513-15, 2009.
93 Dumbaugh E, Frank L. Traffic Safety and Safe Routes to Schools: Synthesizing the Empirical Evidence. Transportation Re-search Record, 2009(1):89-97, 2007.
94 National School Lunch Program: Partici-pation and Lunches Served (Data as of March 7, 2014) In U.S. Department of Agri-culture, Food and Nutrition Service. http://www.fns.usda.gov/pd/child-nutrition-tables (accessed March 2014).
95 Kids’ Safe and Healthful Foods Project. Serving Health School Meals: Schools need updated kitchen equipment. The Robert Wood Johnson Foundation and The Pew Charitable Trusts: 2013. http://www.healthyschoolfoodsnow.org/wp-content/uploads/2013/12/KITS_Equipment_Re-port.pdf (accessed May 2014).
96 United States Department of Agricul-ture, (2013). Agriculture Secretary Vil-sack Highlights New “Smart Snacks in School” Standards; Will Ensure School Vending Machines, Snack Bars Include Healthy Choices. [Press Release]. http://www.usda.gov/wps/portal/usda/usdahome?contentid=2013/06/0134.xml (accessed May 2014).
97 United States Department of Agriculture. National School Lunch Program and School Breakfast Program: Nutrition Stan-dards for All Foods Sold in School as Re-quired by the Healthy, Hunger-Free Kids Act of 2010; Interim Final Rule. Federal Register, 78(125), 2013. http://www.gpo.gov/fdsys/pkg/FR-2013-06-28/pdf/2013-15249.pdf (accessed May 2014).
98 National School Lunch Program. In United States Department of Agriculture. http://www.fns.usda.gov/cnd/Lunch/AboutLunch/NSLPFactSheet.pdf (accessed June 2013).
99 Gleason P and Suitor C. Food for thought: children’s diets in the 1990s. Princeton, NJ: Mathematica Policy Research, Inc., 2001.
100 Briefel RR, Wilson A, Gleason PM. Con-sumption of low-nutrient, energy-dense foods and beverages at school, home, and other locations among school lunch participants and nonparticipants. J Am Diet Assoc,109:Suppl-90, 2009.
101 Chriqui JF, Turner L, Taber DR, Cha-loupka FJ. Association between district and state policies and US public elemen-ary school competitive food and beverage environments. JAMA Pediatr., 167(8): 714-722, 2013. http://archpedi.jamanet-work.com/article.aspx?articleid=1696280 (accessed May 2014).
102 Larson N, Story M. Are Competitive Foods Sold at Schools Making Our Children Fat? Health Affairs, 29(3):430?435, 2010.
103 Fox MK, Gordon A, Nogales R, Wilson A. Availability and Consumption of Competitive Foods in US Public Schools. Journal of the American Dietetic Association, 109: S57?S66, 2009.
104 Cullen KW, Zakeri I. Fruits, Vegetables, Milk, and Sweetened Beverages Con-sumption and Access to a la Carte/Snack Bar Meals at School. American Journal of Public Health, 94: 463–467, 2004.
105 Kubik MY, Lytle LA, Hannan PJ, Perry CL, Story M. The Association of the School Food Environment with Dietary Behaviors of Young Adolescents. American Journal of Public Health, 93: 1168?1173, 2003.
106 Kakarala M, Keast DR, Hoerr S. Schoolchil-dren’s Consumption of Competitive Foods and Beverages, Excluding a la Carte. Jour-nal of School Health, 80: 429?435, 2010.
107 Rovner AJ, Nansel TR, Wang J, Ian-notti RJ. Food Sold in School Vending Machines Is Associated with Overall Stu-dent Dietary Intake. Journal of Adolescent Health, 48: 13?19, 2011.
108 Schwartz MB, Movak SA, Fiore SS. The Im-pact of Removing Snacks of Low Nutritional Value from Middle Schools. Health Education & Behavior, 36(6): 999?1011, 2009.
109 Taber DR, Chriqui JF, Perna FM, Powell LM, Chaloupka FJ. Weight Status Among Adolescents in States That Govern Com-petitive Food Nutrition Content. Pediat-rics, 130: 437-444, 2012.
110 Kids Safe and Healthful Foods Project, (2012). School Budgets, Student Health to Benefit from Higher Nutrition Stan-dards. [Press Release]. http://www.healthyschoolfoodsnow.org/school-bud-gets-student-health-to-benefit-from-higher-nutrition-standards/ (accessed June 2013).
111 U.S. Government Accountability Office. School Meal Programs: Competitive Foods Are Available in Many Schools; Actions Taken to Restrict Them Differ by State and Locality. Wash-ington, D.C.: U.S. Government Accountabil-ity Office, 2004. http://www.gao.gov/new.items/d04673.pdf (accessed May 2009).
112 School Meals: Smart Snacks in School. In U.S. Department of Agriculture Food and Nutrition Service. http://www.fns.usda.gov/school-meals/smart-snacks-school (accessed April 2014).
113 Chriqui JF, et al. USDA Snack food and beverage standards: how big of a stretch for the states? Bridging the Gap Brief, 2014.
114 Hudson W. “For Schoolchildren, Where’s the Water?” CNN April 18, 2011. http://www.cnn.com/2011/HEALTH/04/18/water.school.chil-dren/ (accessed April 2011).
126 TFAH • RWJF • StateofObesity.org
115 Kant AK and Graubard BI. Contribu-tors of water intake in US children and adolescents: associations with dietary and meal characteristics—National Health and Nutrition Examination Survey 2005-2006. Am J Clin Nutr, 92(4): 887-96, 2010.
116 Hudson W. “For Schoolchildren, Where’s the Water?” CNN April 18, 2011. http://www.cnn.com/2011/HEALTH/04/18/water.school.children/ (accessed April 2011).
117 Drink Up. In Partnership for a Healthier America. http://www.youarewhatyou-drink.org/ (accessed May 2014).
118 Hood NE, Turner L, Colabianchi N, Cha-loupka FJ, Johnston LD. Availability of drinking water in US public school cafete-rias. J of the Academy of Nutr & Dietetics, doi.org/10.1016/j.jand.2014.02.001, 2014.
119 Joshi A., Kalb M, Beery M. Going Local: Paths to Success for Farm to School Programs. Los Angeles: Occidental College and Community Food Security Coalition, 2006. http://departments.oxy.edu/uepi/cfj/publications/goinglocal.pdf (accessed March 19, 2009).
120 Ibid.
121 Upstream Public Health. HB 2800: Oregon Farm to School and School Garden Policy. May 2011. http://www.upstreampublichealth.org/F2SHIA (accessed August 2012).
122 Ver Ploeg M, Breneman V, Dutko P, et al. Access to Affordable and Nutritious Food: Updated Estimates of Distance to Supermarkets Using 2010 Data, ERR-143, U.S. Department of Agriculture, Eco-nomic Research Service, 2012. http://www.ers.usda.gov/media/956784/err143.pdf (accessed June 2013).
123 Morton LW. Access to Affordable & Nu-tritious Food: Understanding Food Des-erts. USDA ERS Workshop Powerpoint, 2008. http://www.farmfoundation.org/news/articlefiles/450-Morton.pdf (ac-cessed April 2014).
124 O’Connell, M., Buchwald, D.S., Duncan, G.E. Food Access and Cost in American Indian Communities in Washington State. Journal of the American Dietetic Asso-ciation, Vol. 111, 2011.
125 100 Years of U.S. Consumer Spending: Data for the Nation, New York City, and Boston. In Bureau of Labor Statistics. http://www.bls.gov/opub/uscs/ (accessed April 2014). 126 Healthy Food. Close to Home. In Freshworks. http://www.cafreshworks.com/ (accessed April 2014).
127 New Orleans Fresh Food Retailer Initiative. In Hope Enterprise Corporation. http://www.hope-ec.org/index.php/new-orleans-fresh-food-retailer-initiative (accessed April 2014).
128 Treuhaft S and Karpyn A. The Grocery Gap: How Has Access to Healthy Food and Why It Matters. Policy Link and The Food Trust, 2010. www.policylink.org/atf/cf/%7B97C6D565-BB43-406D-A6D5-ECA3BBF35AF0%7D/FINALGrocer-yGap.pdf (accessed April 2014).
129 T he Reinvestment Fund. Reinvestment Brief: The Economic Impacts of Supermar-kets on their Surrounding Communities. The Reinvestment Fund, 2006.
130 Ernst & Young (EY). The Campaign to End Obesity. The New Markets Tax Credit: Opportunities for Investment in Healthy Foods and Physical Activity, 2013. http://cam-paigntoendobesity.org//documents/ExecutiveSummaryofNMTCStudy.pdf
131 Supplemental Nutrition Assistance Pro-gram Fiscal Summary. In U.S. Department of Agriculture. http://www.fns.usda.gov/pd/34snapmonthly.htm (accessed April 2014).
132 Supplemental Nutrition Assistance Pro-gram Facts. In U.S. Department of Agri-culture. http://www.nal.usda.gov/snap/SNAP-EdFactsheet2012.pdf (accessed April 2014).
133 Healthy Eating Research. Bringing Healthy Foods Home: Examining Inequali-ties in Access to Food Stores, 2008. http://healthyeatingresearch.org/wp-content/uploads/2013/12/HER-Bringing-Healthy-Foods-Home_7-2008.pdf (ac-cessed April 2014).
134 Morland K, Roux A, Wing S. Supermar-kets, Other Food Stores, and Obesity: The Atherosclerosis Risk in Communi-ties Study. American Journal of Preventive Medicine, 30(4): 333-339, 2006.
135 Morland K, Wing S, Roux A. The Contextual Effect of the Local Food Environment on Residents’ Diets: The Atherosclerosis Risk in Communities Study. American Journal of Public Health, 92(11): 1761-1767, 2002.
136 Moore L, Roux A, Nettleton J, and Ja-cobs D. Associations of the Local Food Environment with Diet Quality—A Com-parison of Assessments Based on Surveys and Geographic Information Systems: The Multi-Ethnic Study of Atherosclero-sis. American Journal of Epidemiology 167: 917-924, 2008.
137 The Reinvestment Fund. The Economic Impacts of Supermarkets on their Surrounding Communities, Philadelphia, PA: The Rein-vestment Fund, 2008.
138 Andreyeva, T, Long M, Brownell K. The Impact of Food Prices on Consump-tion: a Systematic Review of Research on Price and Elasticity of Demand for Food. American Journal of Public Health, 2009.
139 Yen S, Lin B, Smallwood D, et al. Demand for Non-alcoholic Beverages: the Case of Low-income Households. Agribusiness, 20(3): 309-321, 2004.
140 Raper, K, Wanzala M, Nayga R. Food Ex-penditures and Household Demographic Composition in the US: a Demand Sys-tems Approach. Applied Economics, 34(8): 981-992, 2002.

127 TFAH • RWJF • StateofObesity.org
141 Bergtold J, Akobundo E, Peterson E. The FAST Method: Estimating Uncondi-tional Demand Elasticities for Processed Foods in the Presence of Fixed Effects. Journal of Agricultural and Resource Econom-ics, 29(2): 276-295, 2004.
142 Yen S, Lin B, Smallwood D et al. De-mand for Non-alcoholic Beverages: the Case of Low-income Households. Agri-business, 20(3): 309-321, 2004.
143 Bahl R, Bird R, Walker M. The Uneasy Case Against Discriminatory Excise Taxa-tion: Soft Drink Taxes in Ireland. Public Finance Review, 31(5): 510-533, 2003.
144 Healthy Eating Research and Bridging the Gap. Sugar-Sweetened Beverage Taxes and Public Health, 2009. http://www.healthyeatingresearch.org/images/stories/her_research_briefs/ssb_taxes_and_pub-lic_health_herresearch_brief_7.31.09_final.pdf (accessed June 2013).
145 Jacobson MH and Brownell KD. Small Taxes on Soft Drinks and Snack Foods to Promote Health. American Journal of Public Health, 90(6): 854-57, 2000.
146 Congressional Budget Office. Healthcare Budget Options, Volume 1. Washington, D.C.: U.S. Congress, 2008, p. 206.
147 Chriqui JF, Eidson SS, Chaloupka FJ. State Sales Taxes on Regular Soda (as of January 1, 2014) — BTG Fact Sheet. Chicago, IL: Bridging the Gap Program, Health Policy Center, Institute for Health Research and Policy, University of Illinois at Chicago, 2014. http://www.bridgingth-egapresearch.org (accessed April 2014).
148 Bleich SN, Wang CY, Wang Y et al. Increasing consumption of sugar-sweetened beverages among US adults: 1988–1994 to 1999–2004. Am J Clin Nutr, 89: 372–381, 2009.
149 Kit BK, et al. Trends in sugar-sweetened beverage consumption among youth and adults in the United States: 1999-2010. Am J Clin Nutr, 2013.
150 Park S, Pan L, Sherry B, Blanck HM. Con-sumption of Sugar-Sweetened Beverages Among US Adults in 6 States: Behavioral Risk Factor Surveillance System, 2011
151 Park S, Pan L, Sherry B, Blanck HM. Con-sumption of Sugar-Sweetened Beverages Among US Adults in 6 States: Behavioral Risk Factor Surveillance System, 2011
152 Lasater G, Piernas C, Popkin BM. Bever-age patterns and trends among school-aged children in the US, 1989-2008. Nutr J., 10: 103, 2011.
153 Mean Intake of Energy and Mean Con-tribution (kcal) of Various Foods Among US Population, by Age, NHANES 2005–06. In National Cancer Institute. ,http://riskfactor.cancer.gov/diet/foodsources/ (accessed June 2012).
154 Fox MK, Reidy K, Novak T, Ziegler P. Sources of energy and nutrients in the diets of infants and toddlers. J Am Diet Assoc, 106(1 Suppl 1):S28-42, 2006.
155 Devaney B, Ziegler P, Pac S, Karwe V, Barr SI. Nutrient intakes of infants and toddlers. J Am Diet Assoc, 104(1 Suppl 1):s14-21, 2004.
156 Skinner JD, Ziegler P, Ponza M. Transi-tions in infants’ and toddlers’ beverage patterns. J Am Diet Assoc, 104(1 Suppl 1):s45-50, 2004.
157 Fox MK, Pac S, Devaney B, Jankowski L. Feeding infants and toddlers study: What foods are infants and toddlers eating? J Am Diet Assoc, 104(1 Suppl 1):s22-30, 2004.
158 Wang YC, Bleich SN, Gortmaker SL. Increasing caloric contribution from sugar-sweetened beverages and 100% fruit juices among US children and adolescents, 1988–2004. Pediatrics, 121(6):e1604-e1614, 2008.
159 Hu FB. Resolved: there is sufficient scientific evidence that decreasing sugar-sweetened beverage consumptions will reduce the prevalence of obesity and obesity-related disease. Obesity Reviews, 14: 606-619, 2013.
160 Malik VS, Willett WC, Hu FB. Sugar-sweetened beverages and BMI in chil-dren and adolescents: reanalyses of a meta-analysis. Am J Clin Nutr, 89:438-9; author reply 9-40, 2009.
161 Martin-Calvo N, et al. Sugar-sweetened carbonated beverage consumption and childhood/adolescent obesity: a case-con-trol study. Public Health Nutr, 31: 1-9, 2014.
162 Babey SH, Jones M, Yu H and Goldstein H. Bubbling Over: Soda Consumption and Its link to Obesity in California. UCLA Cen-ter for Health Policy Research, 2009.
163 Malik VS, Popkin BM, Bray GA, Despres JP, Willett WC, Hu FB. Sugar-sweetened beverages and risk of metabolic syn-drome and type 2 diabetes: a meta-analy-sis. Diabetes Care, 33:2477-83, 2010.
164 de Koning L, Malik VS, Kellogg MD, Rimm EB, Willett WC, Hu FB. Sweet-ened beverage consumption, incident coronary heart disease, and biomarkers of risk in men. Circulation, 125:1735-41, S1, 2012.
165 Bremer AA, Auinger P, and Byrd RS. Relationship between Insulin Resis-tance–Associated Metabolic Parameters and Anthropometric Measurements with Sugar-Sweetened Beverage Intake and Physical Activity Levels in U.S. Adoles-cents. Findings from the 1999-2004 Na-tional Health and Nutrition Examination Survey. Archives and Pediatric and Adoles-cent Medicine, 163(4): 328-35, 2009.
166 Hert KA, Fisk PS, Rhee YS, Brunt AR. De-creased consumption of sugar-sweetened beverages improved selected biomarkers of chronic disease risk among US adults: 1999 to 2010. Nutrition Research, 34: 58-65, 2014.
167 Institute of Medicine. Food Marketing to Children: Threat or Opportunity? Washing-ton, DC: National Academies Press, 2006.
128 TFAH • RWJF • StateofObesity.org
168 Powell LM, Schermbeck RM, Chaloupka FJ. Nutritional content of food and beverage products in television advertise-ments seen on children’s programming. Child Obes., 2013.
169 CFBAI uniform standards: CFBAI’s Cate-gory Specific Uniform Nutrition Criteria: http://www.bbb.org/storage/16/docu-ments/cfbai/CFBAI%20Uniform%20Nu-trition%20Criteria%20Fact%20Sheet%20-FINAL.pdf (accessed May 2014).
170 Harris/Rudd recent brief. Older but still vul-nerable: All children need protection from unhealthy food marketing.http://www.yaleruddcenter.org/resources/upload/docs/what/reports/Protecting_Older_Chil-dren_3.14.pdf (accessed May 2014).
171 Chriqui JF, Resnick EA, Schneider L, Schermbeck R, Adcock T, Carrion V, Chaloupka FJ. School District Wellness Policies: Evaluating Progress and Poten-tial for Improving Children’s Health Five Years after the Federal Mandate. Volume 3. Chicago, IL: Bridging the Gap Pro-gram, Health Policy Center, Institute for Health Research and Policy, University of Illinois at Chicago, 2013.
172 United States Department of Agricul-ture. Local School Wellness Policy Implementation under Healthy, Hunger-Free Kids Act of 2010. Federal Register, 79(38): 10693-10706, 2014.
173 Federal Trade Commission. A review of food marketing to children and adoles-cents—follow-up report. Washington, D.C.: Federal Trade Commission, 2012. http://www.ftc.gov/sites/default/files/documents/reports/review-food-mar-keting-children-and-adolescents-follow-report/121221foodmarketingreport.pdf (accessed May 2014).
174 Federal Trade Commission. A review of food marketing to children and adoles-cents—follow-up report. Washington, D.C.: Federal Trade Commission, 2012. http://www.ftc.gov/sites/default/files/documents/reports/review-food-mar-keting-children-and-adolescents-follow-report/121221foodmarketingreport.pdf (accessed May 2014).
175 Chriqui JF, Resnick EA, Schneider L, Schermbeck R, Adcock T, Carrion V, Cha-loupka FJ. School District Wellness Poli-cies: Evaluating Progress and Potential for Improving Children’s Health Five Years after the Federal Mandate. School Years 2006–07 through 2010–11. Volume 3. Chicago, IL: Bridging the Gap Program, Health Policy Center, Institute for Health Research and Policy, University of Illinois at Chicago, 2013. http://www.bridgingth-egapresearch.org/research/district_well-ness_policies/ (accessed May 2014).
176 Terry-McElrath YM, Turner L, Sandoval A, Johnston LD, Chaloupka FJ. Commercial-ism in US elementary and secondary school nutrition environments: trends from 2007 to 2012. JAMA Pediatrics, 168(3), 2014.
177 Terry-McElrath YM, Turner L, Sandoval A, Johnston LD, Chaloupka FJ. Commer-cialism in US elementary and secondary school nutrition environments: trends from 2007 to 2012. JAMA Pediatrics, 168(3), 2014.
178 HR 2642
179 2014 Farm Bill Drill Down: The Bill by the Numbers. In National Sustainable Agriculture Coalition. http://sustainablea-griculture.net/blog/2014-farm-bill-by-numbers/ (accessed May 2014).
180 Supplemental Nutrition Assistance Pro-gram. In U.S. Department of Agriculture. http://www.fns.usda.gov/pd/SNAPsum-mary.htm (accessed May 2014).
181 Schoonover H, Muller M. Food Without Thought: How U.S. Farm Policy Contributes to Obesity. Minneapolis, MN: Institute for Agriculture and Trade Policy, 2006.
182 Steinhauer J. “Farm Bill Reflects Shift-ing American Menu and a Senator’s Persistent Tilling.” The New York Times March 8, 2014. http://www.nytimes.com/2014/03/09/us/politics/farm-bill-reflects-shifting-american-menu-and-a-senators-persistent-tilling.html?_r=0 (accessed May 2014).
183 United States Department of Agricul-ture. Building a Healthy America: A Profile of the Supplemental Nutrition Assistance Program. Alexandria, VA: United States Department of Agriculture Food and Nu-trition Services, 2012.
184 United States Department of Agricul-ture. Building a Healthy America: A Profile of the Supplemental Nutrition Assistance Program. Alexandria, VA: United States Department of Agriculture Food and Nutrition Services, 2012.
185 Rosenbaum D. “Ryan Budget Would Slash SNAP by $137 Billion Over 10 Years.” Center on Budget and Policy Priorities April 4, 2014. http://www.cbpp.org/cms/?fa=view&id=4118 (accessed May 2014).
186 United States Department of Agricul-ture. Building a Healthy America: A Profile of the Supplemental Nutrition Assistance Program. Alexandria, VA: United States Department of Agriculture Food and Nu-trition Services, 2012.
187 U.S. Centers for Disease Control and Pre-vention. State Indicator Report on Fruits and Vegetables. Atlanta, GA: CDC, 2013. http://www.cdc.gov/nutrition/down-loads/State-Indicator-Report-Fruits-Vege-tables-2013.pdf (accessed May 2014).
188 Food Deserts. In U.S. Department of Agriculture. http://apps.ams.usda.gov/fooddeserts/foodDeserts.aspx (accessed May 2014).
189 U.S. Centers for Disease Control and Prevention. State Indicator Report on Fruits and Vegetables. Atlanta, GA: CDC, 2013. http://www.cdc.gov/nutrition/down-loads/State-Indicator-Report-Fruits-Vege-tables-2013.pdf (accessed May 2014).
190 U.S. Centers for Disease Control and Prevention. State Indicator Report on Fruits and Vegetables. Atlanta, GA: CDC, 2013. http://www.cdc.gov/nutrition/down-loads/State-Indicator-Report-Fruits-Vege-tables-2013.pdf (accessed May 2014).
129 TFAH • RWJF • StateofObesity.org
191 2009-2012 Outcomes and Trends Full Report. In Wholesome Wave’s Double Value Coupon. https://drive.google.com/file/d/0B9xO2Xo4OIC4UU12c2JQV 0VhdnM/edit?pli=1 (accessed May, 2014).
192 Ibid.
193 Ibid.
194 2012 Project Report, Executive Sum-mary. In Wholesome Wave’s Fruit and Vegetable Prescription Program. https://drive.google.com/file/d/ 0B9xO2Xo4OIC4QXFRczZ2dVl2dVU/edit?pli=1 (accessed May, 2014).
195 Ibid.
196 Robert Wood Johnson Foundation. Time to Act: Investing in the Health of Our Children and Communities. Princeton, NJ: RWJF, 2014. http://www.rwjf.org/con-tent/dam/farm/reports/reports/2014/rwjf409002 (accessed May 2014).
197 Ibid.
198 State Health Care Cost Containment Commission. Cracking the Code on Health Care Costs. Charlottesville, VA: Miller Center, University of Virginia, 2014. http://web1.millercenter.org/commis-sions/healthcare/HealthcareCommis-sion-Report.pdf (accessed May 2014).
199 Centers for Disease Control and Preven-tion. Use of Selected Clinical Preventive Services Among Adults—United States, 2007-2010. MMWR, 61, 2012.
200 Accountable Care Organizations (ACO). In Centers for Medicare and Medicaid Ser-vices. http://www.cms.gov/Medicare/Medicare-Fee-for-Service-Payment/ACO/ (accessed May 2014).
201 Healthier by Design: Creating Account-able Care Communities. In Accountable Care Community. http://www.abiakron.org/1accountable-care-community (ac-cessed May 2014).
202 National Diabetes Prevention Program. In Centers for Disease Control and Preven-tion. http://www.cdc.gov/diabetes/pre-vention/about.htm (accessed May 2014).
203 Weintrub WS et al. AHA Policy State-ment: Value of Primordial and Primary Prevention for Cardiovascular Disease. Circulation, 124: 967-990, 2011.
204 The Hilltop Institute. What are Hospi-tal Community Benefits? 2013. http://www.hilltopinstitute.org/publications/WhatAreHCBsTwoPager-February2013.pdf (accessed May 2014).
205 Chronic Disease Self-Management Pro-gram (Better Choices, Better Health Workshop). In Stanford Patient Education Resource Center. http://patienteducation.stanford.edu/programs/cdsmp.html (ac-cessed May 2014).
206 City of Boston, Boston Bikes. State of the Hub: Boston Bikes 2013 Update Presented March 2014. http://www.cityofboston.gov/images_documents/2013%20reportfinal_tcm3-44028.pdf (accessed April 2014).
207 Cawley J and Meyerhoefer C. The Medi-cal Care Costs of Obesity: An Instrumen-tal Variables Approach. Journal of Health Economics, 31(1): 219-230, 2012; And Finkelstein, Trogdon, Cohen, et al. An-nual Medical Spending Attributable to Obesity. Health Affairs, 2009.
208 Cawley J, Rizzo JA, Haas K. Occupation-specific Absenteeism Costs Associated with Obesity and Morbid Obesity. Journal of Occupational and Environmental Medi-cine, 49(12):1317–24, 2007.
209 Wang YC et al. Health and Economic Bur-den of the Projected Obesity Trends in the USA and the UK. The Lancet, 378, 2011.
210 Trust for America’s Health and Robert Wood Johnson Foundation. F as in Fat: How Obesity Threatens America’s Future. Washington, D.C.: Trust for America’s Health, 2012.
211 Ibid.
212 Health Effects of Obesity. In Obesity Soci-ety. http://www.obesity.org/ (accessed June 2013).
213 American Cancer Society. Cancer Facts and Figures, 2012. Atlanta, GA: American Cancer Society, 2012.
214 For individuals, obesity is defined as a body mass index rate above 30. On an individual level, an adult reducing BMI by one per-cent is the equivalent to a weight loss of 2.2 pounds (for an adult of average weight). According to CDC, the average weight of men is 194.7 and women is 164.7. http://www.cdc.gov/nchs/fastats/bodymeas.htm
215 Return on Investments in Public Health: Saving Lives and Money. In Robert Wood Johnson Foundation, April 2013. http://rwjf.org/content/dam/farm/reports/issue_briefs/2013/rwjf72446 (accessed May 2013).
216 Trust for America’s Health. Prevention for a Healthier America: Investments in Disease Prevention Yield Significant Savings, Stron-ger Communities, 2008. http://healthy-americans.org/reports/prevention08/ (accessed April 2013).
217 Finkelstein EA, Trogdon JG, Cohen JW, Dietz W. Annual Medical Spending At-tributable to Obesity: Payer-and Service-Specific Estimates. Health Affairs, 28(5): w822-831, 2009.
218 Arterburn DE, Maciejewski ML, Tsevat J. Impact of morbid obesity on medical expenditures in adults. Int J Obes, 29(3): 334-339, 2005.
219 Teuner CM, Menn P, Heier M, Holle R, John J, Wolfenstetter SB. Impact of BMI and BMI change on future drug expen-ditures in adults: results from the MON-ICA/KORA cohort study. BMC Health Services Research, 13(424), 2013.
220 Peitz GW, et al. Association of body mass index with increased cost of care and length of stay for emergency department patients with chest pain and dyspnea. Circ Cardiovasc Qual Outcomes, 7(2): 292-298, 2014.
221 Finkelstein EA, Graham WC, Malhotra R. Lifetime direct medical costs of child-hood obesity. Pedatrics, DOI: 10.1542/peds.2014-0063, 2014.

130 TFAH • RWJF • StateofObesity.org
222 Trasande L. and Chatterjee S. The Im-pact of Obesity on Health Service Utili-zation and Costs in Childhood. Obesity, 17(9):1749–54, 2009.
223 Trasande L and Chatterjee S. The Im-pact of Obesity on Health Service Utili-zation and Costs in Childhood. Obesity, 17(9): 1749-1754, 2009.
224 Marder W and Chang S. Childhood Obesity: Costs, Treatment Patterns, Disparities in Care, and Prevalent Medical Conditions. Thom-son Medstat Research Brief, 2006. http://www.medstat.com/pdfs/childhood_obe-sity.pdf (accessed March 2010.)
225 Trasande L, Liu Y, Fryer G, et al. Effects of Childhood Obesity On Hospital Care and Costs, 1999–2005. Health Affairs, 28(4): w751–60, 2009.
226 Trasande L, Liu Y, Fryer G, et al. Ef-fects of Childhood Obesity On Hospital Care and Costs, 1999–2005. Health Affairs, 28(4): w751–60, 2009.227 Gates D, Succop P, Brehm B, et al. Obesity and Presenteeism: The Impact of Body Mass Index on Workplace Productivity. Journal of Occupational and Environmental Medicine, 50(1):39-45, 2008.
228 The Robert Wood Johnson Foundation, the American Stroke Association, and the American Heart Association. A Na-tion at Risk: Obesity in the United States, A Statistical Sourcebook. Dallas, TX: Ameri-can Heart Association, 2005. http://www.americanheart.org/downloadable/heart/1114880987205NationAtRisk.pdf (accessed April 14, 2008).
229 Lehnert T, et al. Sick leave days and costs associated with overweight and obesity in Germany. JOEM, 56(1): 20-27, 2014.
230 Ostbye T, Dement JM, Krause KM. Obe-sity and Workers’ Compensation: Re-sults from the Duke Health and Safety Surveillance System. Archives of Internal Medicine, 167(8): 766-73, 2007.
231 Pronk NP, Martinson B, Kessler RC, et al. The Association between Work Per-formance and Physical Activity, Cardiore-spiratory Fitness, and Obesity. Journal of Occupational and Environmental Medicine, 46(1):19-25, 2004.
232 Aldana SG and Pronk NP. Health Pro-motion Programs, Modifiable Health Risks, and Employee Absenteeism. Jour-nal of Occupational and Environmental, 43(1): 36-46, 2001.
233 Gordian Health Solutions. Managing the Obesity Problem: A Case Study with Mea-surable Results. Nashville, TN: Gordian Health Solutions, 2007.
234 Wang F, McDonald T, Champagne LJ, et al. Relationship of Body Mass Index and Physical Activity to Healthcare Costs among Employees. Journal of Occupational and Envi-ronmental Medicine, 46(5): 428-36, 2004.
235 Burton WN, Chen CY, Schultz AB, et al. The Economic Costs Associated with Body Mass Index in a Workplace. Journal of Occupational and Environmental Medi-cine, 40(9): 786-92, 1998.
236 Burton WN, Chen CY, Schultz AB, et al. The Economic Costs Associated with Body Mass Index in a Workplace. Journal of Occupational and Environmental Medi-cine, 40(9): 786-92, 1998.
237 Institute of Medicine. The Future of the Public’s Health in the 21st Century. Wash-ington, D.C, 2003. U.S. Centers for Disease Control and Prevention. Public Health’s Infrastructure — A Status Report. Atlanta, Georgia, 2001 and Trust for America’s Health. Blueprint for a Health-ier America: Modernizing the Federal Public Health System to Focus on Prevention and Preparedness, 2008.
238 Trust for America’s Health. Investing in America’s Health: A State-By-State Look at Public Health Funding and Key Health Facts, 2014. http://www.healthyamericans.org/report/83/ (accessed May 2014).
239 Association of State and Territorial Health Officials. Budget Cuts Continue to Affect the Health of Americans: Up-date August 2012. http://www.astho.org/Research/Data-and-Analysis/ASTHO-Budget-Cuts-Impact-Research-Brief-Update-(August-2012)/ (accessed December 2012).
240 Ogden CL, Carroll MD, Kit BK, Flegal KM. Prevalence of childhood and adult obesity in the United States, 2011-2012. JAMA, 311(8): 806-814, 2014.
241 Ogden CL, Carroll MD, Kit BK, Flegal KM. Prevalence of childhood and adult obesity in the United States, 2011-2012. JAMA, 311(8): 806-814, 2014.
242 Progress on Childhood Obesity, August 2013. In Centers for Disease Control and Pre-vention. http://www.cdc.gov/vitalsigns/childhoodobesity/ (accessed May 2014).
243 Child Care. In Public Health Law Center. http://publichealthlawcenter.org/top-ics/healthy-eating/child-care (accessed May 2014).
244 Institute of Medicine. Early Childhood Obe-sity Prevention Policies. Washington, DC: National Academies Press, 2011.
245 American Academy of Pediatrics, Ameri-can Public Health Association, and National Resource Center for Health and Safety in Child Care and Early Education. 2012. Pre-venting Childhood Obesity in Early Care and Edu-cation: Selected Standards from Caring for Our Children: National Health and Safety Performance Standards; Guidelines for Early Care and Educa-tion Programs, 3rd Edition. http://nrckids.org/CFOC3/PDFVersion/preventing_obesity.pdf (accessed May 2014).
246 What are the Main Goals? In Let’s Move Child Care. http://www.healthykid-shealthyfuture.org/home/startearly/thegoal.html (accessed May 2014).
247 Our Partners. In Partnership for a Health-ier America. http://ahealthieramerica.org/our-partners/ (accessed May 2014).

131 TFAH • RWJF • StateofObesity.org
248 U.S. Department of Agriculture. Build-ing for the Future. http://www.fns.usda.gov/sites/default/files/4Future.pdf (ac-cessed May 2014).
249 National Resource Center. Preventing Childhood Obesity. http://nrckids.org/de-fault/assets/File/PreventingChildhoodO-besity2nd.pdf (accessed May 2014).
250 S.1086 - Child Care and Development Block Grant Act of 2014. In Congress.gov. http://beta.congress.gov/bill/113th-congress/senate-bill/1086 (accessed May 2014).
251 About Head Start. In Head Start: An Office of the Administration for Children and Fami-lies Early Childhood Learning and Knowledge Center. http://eclkc.ohs.acf.hhs.gov/hslc/hs/about (accessed May 2014).
252 Head Start Program Performance Standards and Other Regulations. In Head Start: An Office of the Administration for Children and Families Early Childhood Learning and Knowledge Center. http://eclkc.ohs.acf.hhs.gov/hslc/standards/Head%20Start%20Requirements (ac-cessed May 2014).
253 Snap-Ed Guidance. In U.S. Department of Agriculture. http://snap.nal.usda.gov/snap/Guidance/GuidingPrinciples2015.pdf (accessed June 2014).
254 Freedman DS, Kettel L, Serdula MK, Dietz WH, Srinivasan SR, Berenson GS. The relation of childhood BMI to adult adiposity: The Bogalusa Heart Study. Pedi-
atrics, 115: 22-27, 2005.
255 Cunningham SA, Kramer MR, Narayan V. Incidence of Childhood Obesity in the United States. N Engl J Med, 370: 403-411, 2014.
256 Gable S, Krull JL, Chang Y. Boys’ and girls’ weight status and math performance from kindergarten entry through fifth grade: A mediated analysis. Child Development, doi: 10.1111/j.1467-8624.2012.01803.x, 2012
257 Let’s Move! Childcare Checklist Quiz is Incorporated Into Maryland’s Quality Rating Improvement System (QRIS) and CACFP Program. In Let’s Move! Child Care. http://www.healthykidshealthy-future.org/home/resources/success/maryland-qris.html (accessed May 2014).
258 Farm to Child Care Takes Root in Texas. In Let’s Move! Child Care. http://www.healthykidshealthyfuture.org/home/re-sources/success/texas-ftc.html (accessed May 2014).
259 Food Research and Action Center. Im-proving Nutrition and Promoting Wellness in Child Care with CACFP. Washington, DC: FRAC, http://frac.org/pdf/cacfp_im-proving_nutrition_report_print.pdf (ac-cessed May 2014).
260 Spectrum of Opportunities for Obesity Prevention in the Early Care and Educa-tion Setting (ECE) CDC Technical As-sistance Briefing Document. In U.S. Centers for Disease Control and Prevention. http://www.cdc.gov/obesity/downloads/spectrum-of-opportunities-for-obesity-prevention-in-early-care-and-education-set-ting_tabriefing.pdf (accessed May 2014).
261 National Early Care and Education Learning Collaboratives. In Nemours. http://www.healthykidshealthyfuture.org/home/collaborate/ecelcproject/about.html (accessed March 2014).
262 Lutfiyya, MN, Lipsky, MS, Wisdom-Behounek, J, Inpanbutr-Martinkus. (2007). Is rural residency a risk factor for overweight and obesity for U.S. children? Obesity. 15(9): 2348-2356.
263 Hawley SR, Beckman H, Bishop T. Develop-ment of an obesity prevention and manage-ment program for children and adolescents in a rural setting. Journal of Community Health Nursing, 23(2): 69–80, 2006.
264 National Research Council, U.S. Health Perspective: Shorter Lives, Poorer Health. Washington: DC: The National Acad-emies Press, 2013.
265 Ogden CL, Carroll MD, Kit BK, Flegal KM. Prevalence of obesity among adults: United States, 2011–2012. NCHS data brief, no. 131. Hyattsville, MD: National Center for Health Statistics, 2013.
266 An R. Prevalence and Trends of Adult Obesity in the US, 1999-2012. Obesity, 2014.
267 Skinner AC, Skelton J, Prevalence and Trends in Obesity and Severe Obesity Among Children in the United States, 1999-2012. JAMA Pediatrics, doi:10.1001/jamapediatrics.2014.21, 2014.
268 Skinner AC, Skelton J, Prevalence and Trends in Obesity and Severe Obesity Among Children in the United States, 1999-2012. JAMA Pediatrics, doi:10.1001/jamapediatrics.2014.21, 2014.
269 Skinner AC, Skelton J, Prevalence and Trends in Obesity and Severe Obesity Among Children in the United States, 1999-2012. JAMA Pediatrics, doi:10.1001/jamapediatrics.2014.21, 2014.
270 Skinner AC, Skelton J, Prevalence and Trends in Obesity and Severe Obesity Among Children in the United States, 1999-2012. JAMA Pediatrics, doi:10.1001/jamapediatrics.2014.21, 2014.
271 Rendall MS, Weden MM, Fernandes M, Vaynman I. Hispanic and black US chil-dren’s paths to high adolescent obesity prev-alence. Pediatric Obesity, 7: 423-435, 2012.
272 Trust for America’s Health. F as in Fat: How Obesity Threatens America’s Health. Washington, D.C.: Trust for America’s Health, 2013.
273 McKernan S, Ratcliffe C, Steuerle E, Zhang S. Less Than Equal: Racial Dispari-ties in Wealth Accumulation. Washington, D.C.: Urban Institute, 2013. http://www.urban.org/UploadedPDF/412802-Less-Than-Equal-Racial-Disparities-in-Wealth-Accumulation.pdf (accessed May 2014).
274 U.S. Census Bureau Current Population Survey (CPS).

132 TFAH • RWJF • StateofObesity.org
275 DeNavas-Walt C, Proctor BD, Smith JC. Income, Poverty, and Health Insurance Cover-age in the United States: 2012. U.S. Census Bureau, 2013.
276 Coleman-Jensen A, Nord M, Singh A. Household Food Security in the United States in 2012, Table 2. USDA ERS, 2013.
277 Childhood Obesity. In Children’s Defense Fund. http://www.childrensdefense.org/policy-priorities/childrens-health/child-nutrition/childhood-obesity.html (accessed May 2014).
278 Johns Hopkins Hub staff report, 12/9/13 NEED MORE INFO HERE
279 U.S. Centers for Disease Control and Prevention. Youth Risk Behavior Surveil-lance — United States, 2013. Morbidity and Mortality Weekly Report, 63(SS04): 1-168, 2014
280 U.S. Centers for Disease Control and Prevention. Youth Risk Behavior Surveil-lance — United States, 2013. Morbidity and Mortality Weekly Report, 63(SS04): 1-168, 2014
281 Harris JL. Fast food FACTS: Evaluat-ing fast food nutrition and marketing to youth. Rudd Center for Food Policy and Obesity, 2010.
282 Yancey AK, Cole BL, et al. A cross-sectional prevalence study of ethnically targeted and general audience outdoor-related advertising. Milbank Q, 2009: 87(1): 155-184, 2009.
283 National Recreation and Park Association. Parks and Recreation in Underserved Areas: A Public Health Perspective. Ashburn, VA: National Recreation and Park Association, 2013. http://www.nrpa.org/uploadedFiles/nrpa.org/Publications_and_Research/Research/Papers/Parks-Rec-Underserved-Areas.pdf (accessed May 2014).
284 Obesity and African Americans. In U.S. Department of Health and Human Services Office of Minority Health. http://minori-tyhealth.hhs.gov/templates/content.aspx?ID=6456 (accessed May 2014).
285 U.S. Centers for Disease Control and Pre-vention. Youth Risk Behavior Surveillance — United States, 2013. Morbidity and Mor-tality Weekly Report, 63(SS04): 1-168, 2014
286 Armah N. “Making Equity Count in the Built Environment.” NAACP Blog April 7, 2014. http://www.naacp.org/blog/entry/making-equity-count-in-the-built-environment (accessed May 2014).
287 National Recreation and Park Association. Parks and Recreation in Underserved Areas: A Public Health Perspective. Ashburn, VA: National Recreation and Park Association, 2013. http://www.nrpa.org/uploadedFiles/nrpa.org/Publications_and_Research/Research/Papers/Parks-Rec-Underserved-Areas.pdf (accessed May 2014).
288 Dias JJ, Whitaker RC. Black mothers’ perceptions about urban neighborhood safety and outdoor play for their preado-lescent daughters. Journal of Health Care Poor & Underserved, 24(1): 206-219, 2013.
289 Obesity and African Americans. In U.S. Department of Health and Human Services Office of Minority Health. http://minori-tyhealth.hhs.gov/templates/content.aspx?ID=6456 (accessed May 2014).
290 Obesity and African Americans. In U.S. Department of Health and Human Services Office of Minority Health. http://minori-tyhealth.hhs.gov/templates/content.aspx?ID=6456 (accessed May 2014).
291 Consequences of Adult and Overweight Obesity. In Food Research and Action Center. http://frac.org/initiatives/hunger-and-obesity/what-are-the-conse-quences-of-adult-overweight-and-obesity/ (accessed May 2014).
292 Waidmann T. Estimating the Cost of Racial and Ethnic Health Disparities. Washington, D.C.: The Urban Institute, 2009. http://www.urban.org/UploadedPDF/411962_health_disparities.pdf (accessed May 2014).
293 LaVeist TA, Gaskin D, Richard P. Esti-mating the economic burden of racial health inequalities in the United States. Int J Health Serv, 41(2): 231-238, 2011.
294 LaVeist TA, Gaskin D, Richard P. Esti-mating the economic burden of racial health inequalities in the United States. Int J Health Serv, 41(2): 231-238, 2011.
295 U.S. Census Bureau, American Fact Finder, 2011 American Community Sur-vey 1-Year Estimates
296 WIC Program Racial and Ethnic Data, April 2010, published February 2012.
297 Food Research and Action Center. A Review of Strategies to Bolster SNAP’s Role in Improving Nutrition as well as Food Security. Washington, D.C.: FRAC, 2013. http://frac.org/wp-content/uploads/2011/06/SNAPstrategies.pdf (accessed May 2014).
298 Bridging the Gap and Salud America! Better Food in the Neighborhood and La-tino Kids, Issue Brief June 2013. https://salud-america.org/sites/saludamerica/files/Better-Food-in-the-Neighborhood-Issue-Brief.pdf (accessed March 2014).
299 Tennessee Department of Education. Tennessee Coordinated School Health 2008-2009 Executive Summary. Available from: http://www.tennessee.gov/education/schoolhealth/
300 Profiles of Latino Health: A Closer Look at Latino Child Nutrition. In National Council of La Raza. http://www.nclr.org/index.php/issues_and_programs/health_and_nutrition/health_care_re-form/hcrarchive/healthprofiles/nutri-tionprofiles/ (accessed May 2014).
301 Research Packages. In Salud America! https://salud-america.org/research (ac-cessed May 2014).
302 Population by Race and Hispanic Origin: 2012 to 2060. In U.S. Census Bureau. http://www.census.gov/newsroom/releases/img/racehispanic_graph.jpg (accessed May 2014).
303 Ogden CL, Carroll MD, Kit BK, Flegal KM. Prevalence of obesity among adults: United States, 2011–2012. NCHS data brief, no. 131. Hyattsville, MD: National Center for Health Statistics, 2013.
133 TFAH • RWJF • StateofObesity.org
304 Ogden CL, Carroll MD, Kit BK, Flegal KM. Prevalence of childhood and adult obesity in the United States, 2011-2012. JAMA, 311(8): 806-814, 2014.
305 Skinner AC, Skelton J, Prevalence and Trends in Obesity and Severe Obesity Among Children in the United States, 1999-2012. JAMA Pediatrics, doi:10.1001/jamapediatrics.2014.21, 2014.
306 Skinner AC, Skelton J, Prevalence and Trends in Obesity and Severe Obesity Among Children in the United States, 1999-2012. JAMA Pediatrics, doi:10.1001/jamapediatrics.2014.21, 2014.
307 Rendall MS, Weden MM, Fernandes M, Vaynman I. Hispanic and black US chil-dren’s paths to high adolescent obesity prevalence. Pediatric Obesity, 7: 423-435, 2012.
308 Coleman-Jensen A, Nord M, Singh A. Household Food Security in the United States in 2012, Table 2. USDA ERS, 2013.
309 Macartney S, Bishaw A, Fontenot K. Poverty Rates for Selected Detailed Race and Hispanic Groups by State and Place: 2007-2011. Washington, D.C.: U.S. Census Bureau, 2013. http://www.census.gov/prod/2013pubs/acsbr11-17.pdf (ac-cessed May 2014).
310 McKernan S, Ratcliffe C, Steuerle E, Zhang S. Less Than Equal: Racial Dispari-ties in Wealth Accumulation. Washington, D.C.: Urban Institute, 2013. http://www.urban.org/UploadedPDF/412802-Less-Than-Equal-Racial-Disparities-in-Wealth-Accumulation.pdf (accessed May 2014).
311 National Council of La Raza. Profiles of Latino Health: A Closer Look at Latino Child Nutrition, Issue 5: The Links Between Food Insecurity and Latino Child Obesity, 2010.
312 Bridging the Gap and Salud America! Sugar Drinks and Latino Kids, Issue Brief Sep-tember 2013. https://salud-america.org/sites/salud-america/files/Sugary-Drinks-issue-brief.pdf (accessed March 2014).
313 Wilson TA, Adolph AL, Butte NF. Nutri-ent adequacy and diet quality in non-overweight and overweight Hispanic children of low socioeconomic status: the Viva la Familia Study. J Am Diet Assoc., 109(6): 1012-1021, 2009.
314 Cortes DE. Improving Food Purchas-ing Selection Among Low-Income Spanish-Speaking Latinos. Salud America!, 2011. http://salud-america.org/sites/salud-america/files/grantee-research/Cor-tes2011-research-brief_0.pdf (accessed May 2014).
315 Bridging the Gap and Salud America! Better Food in the Neighborhood and Latino Kids, Issue Brief June 2013. https://salud-america.org/sites/saludamerica/files/Better-Food-in-the-Neighborhood-Issue-Brief.pdf (accessed March 2014).
316 Economic Research Service (ERS), U.S. Department of Agriculture (USDA). Food Access Research Atlas, http://www.ers.usda.gov/data-products/food-access-research-atlas.aspx (accessed June 2013).
317 Dahl S, Eagle L, Baez C. Analyzing ad-vergames: Active diversions or actually deception. An exploratory study of on-line advergames content. Young Consum-ers, 10(1): 46-59, 2009.
318 U.S. Centers for Disease Control and Pre-vention. Youth Risk Behavior Surveillance — United States, 2013. Morbidity and Mor-tality Weekly Report, 63(SS04): 1-168, 2014
319 U.S. Centers for Disease Control and Prevention. Youth Risk Behavior Surveil-lance — United States, 2013. Morbidity and Mortality Weekly Report, 63(SS04): 1-168, 2014
320 Beam CK. Competitive Foods and Beverages Among Latino Students. Salud America!, 2013. http://salud-america.org/sites/saludamerica/files/Healthier%20School%20Snacks%20-%20Research%20Review.pdf (accessed May 2014).
321 Ibid.
322 Nord M, Andrews M, Carlson S. House-hold Food Security in the United States, 2008. Washington, D.C.: Economic Research Services, U.S. Department of Agricul-ture, 2009; Wolkwitz K. Detailed Tables of Food Stamp Program Participation Rates: 2000-2005. Food and Nutrition Service, Office of Research and Analysis. Alexandria, VA: U.S. Department of Ag-riculture, 2008.
323 Fact Sheet: Hunger and Poverty in the His-panic Community. In Bread for the World. http://www.bread.org/ol/2012/domestic-nutrition/pdf/fact-sheet-latino-hunger-and-poverty.pdf (accessed May 2014).
324 Bridging the Gap and Salud America!, Healthier Marketing and Latino Kids, Issue Brief, August 2013
325 Bridging the Gap and Salud America!, Healthier School Snacks and Latino Kids, Issue Brief, May 2013
326 National Recreation and Park As-sociation. Parks and Recreation in Underserved Areas: A Public Health Per-spective. Ashburn, VA: National Recre-ation and Park Association, 2013. http://www.nrpa.org/uploadedFiles/nrpa.org/Publications_and_Research/Research/Papers/Parks-Rec-Underserved-Areas.pdf (accessed May 2014).
327 Obesity and African Americans. In U.S. Department of Health and Human Services Office of Minority Health. http://minori-tyhealth.hhs.gov/templates/content.aspx?ID=6456 (accessed May 2014).
328 U.S. Centers for Disease Control and Pre-vention. Youth Risk Behavior Surveillance — United States, 2013. Morbidity and Mor-tality Weekly Report, 63(SS04): 1-168, 2014
329 Bridging the Gap and Salud America!, Active Play and Latino Kids, Issue Brief, July 2013
330 After-school fitness programs can im-prove children’s health. In Salud America! http://salud-america.org/grantee-re-search/309 (accessed May 2014).

134 TFAH • RWJF • StateofObesity.org
331 Bridging the Gap and Salud America!, Active Spaces and Latino Kids, Issue Brief, July 2013
332 Population by Race and Hispanic Origin: 2012 to 2060. In U.S. Census Bureau. http://www.census.gov/newsroom/releases/img/racehispanic_graph.jpg (accessed May 2014).
333 CDC 2012, Summary Health Statistics for US Adults: 2010.
334 Rodriguez CY. “Beautiful but deadly: Latinos’ curves put them at risk.” CNN.com October 17, 2013. http://www.cnn.com/2013/10/15/health/latino-cardiovascular-disparities/ (accessed May 2014).
335 Waidmann T. Estimating the Cost of Racial and Ethnic Health Disparities. Washington, D.C.: The Urban Institute, 2009. http://www.urban.org/UploadedPDF/411962_health_disparities.pdf (accessed May 2014).
336 LaVeist TA, Gaskin D, Richard P. Esti-mating the economic burden of racial health inequalities in the United States. Int J Health Serv, 41(2): 231-238, 2011.
337 LaVeist TA, Gaskin D, Richard P. Esti-mating the economic burden of racial health inequalities in the United States. Int J Health Serv, 41(2): 231-238, 2011.
338 HHS Promotores de Salud Initiative. In U.S. Department of Health and Human Services. http://minorityhealth.hhs.gov/templates/browse.aspx?lvl=2&lvlid=207 (accessed April 2014).
339 Nevarez G. Latinos Impacted By $5 Bil-lion Cut To Food Stamps Program. Huff-ington Post November 3, 2013. http://www.huffingtonpost.com/2013/11/03/latinos-food-stamps_n_4208305.html (ac-cessed May 2014).
340 Casey PH, et al. The Association of Child and Household Food Insecurity with Childhood Overweight Status. Pediatrics, 118(5): e1406-e1413, 2006.
341 Cortes DE. Improving Food Purchasing Se-lection Among Low-Income Spanish-Speaking Latinos. Salud America!, 2011. http://salud-america.org/sites/salud-america/files/grantee-research/Cortes2011-re-search-brief_0.pdf (accessed May 2014).
342 Food Research and Action Center. A Re-view of Strategies to Bolster SNAP’s Role in Improving Nutrition as well as Food Security. Washington, D.C.: FRAC, 2013.
343 Connor P, et al. WIC Participant and Program Characteristics 2008. Food and Nutrition Service, Office of Research and Analysis. Alexandria, VA: U.S. Depart-ment of Agriculture, 2010.
344 Bridging the Gap and Salud America! Better Food in the Neighborhood and La-tino Kids, Issue Brief June 2013. https://salud-america.org/sites/saludamerica/files/Better-Food-in-the-Neighborhood-Issue-Brief.pdf (accessed March 2014).
345 Children’s Sentinel Nutrition Assessment Program. The Impact of Food Insecurity on the Development of Young Low-Income Black and Latino Children. Washington, D.C.: Joint Center for Political and Economic Studies Health Policy Institute, 2006.

135 TFAH • RWJF • StateofObesity.org
346 Salud America! Increasing Out-of-School and Out-of-Class Physical Activity among Latino Children. Princeton, NJ: Robert Wood Johnson Foundation, 2013.
347 Salud America! Food Retail and Financing Initiatives to Address Obesity in Latino Com-munities. Princeton, NJ: Robert Wood Johnson Foundation, 2013.
348 California Obesity Prevention Commu-nity Grants 2011 Case Studies. In Califor-nia Department of Public Health. http://www.cdph.ca.gov/programs/COPP/Doc-uments/COPP-CaseStudies-2010-2011.pdf; www.healthykidshealthycommuni-ties.org (accessed May 2014).
349 Comer Bien. In National Council of La Raza. http://www.nclr.org/index.php/issues_and_programs/health_and_nutri-tion/healthy_foods_families/comer_bien/ (accessed April 2014).
350 HHS Promotores de Salud Initiative. In U.S. Department of Health and Human Services. http://minorityhealth.hhs.gov/templates/browse.aspx?lvl=2&lvlid=207 (accessed April 2014).
351 Ayala GX, et al. Longitudinal interven-tion effects on parenting of the Aven-turas para Ninos Study. Am J Prev Med, 38(2): 154-162, 2010.
352 Perez LG, et al. Evidence-based obesity treatment interventions for Latino adults in the U.S.: A systematic review. Am J Prev Med, 44(5): 550-560, 2013.
353 Avila P, Hovell MF. Physical activity training for weight loss in Latinas: a con-trolled trial. Int J Obes Relat Metab Disord, 18(7): 476-482, 1994.
354 Keller C, Cantue A. Camina por Salud: walking in Mexican-American women. Appl Nurs Res, 21(2): 110-113, 2008.
355 Snapshot of Promotores de Salud Initiative Activities/Accomplish-ments. In U.S. Department of Health and Human Services. http://minority-health.hhs.gov/templates/content.aspx?ID=9505&lvl=3&lvlID=577 (ac-cessed April 2014).
356 Ramirez AG, Gallion KJ, Despres CE, Adeigbe RT. Salud America!: a national research network to build the field and evidence to prevent Latino childhood obesity. American Journal of Preventive Med-icine, 44, (Suppl 3), S178-S185, 2013.
357 Ramirez AG, Gallion KJ, Despres CE, Adeigbe RT. Salud America!: a national research network to build the field and evidence to prevent Latino childhood obesity. American Journal of Preventive Med-icine, 44, (Suppl 3), S178-S185, 2013.
358 Ottoson JM, Ramirez AG, Green LW, Gallion KJ. Exploring potential research contributions to policy: the Salud America! Experience. American Journal of Preventive Medicine, 44, (Suppl 3), S282-S289, 2013.

1730 M Street, NW, Suite 900Washington, DC 20036
(t) 202-223-9870(f) 202-223-9871
www.rwjf.orgRoute 1 and College Road East
P.O. Box 2316Princeton, NJ 08543-2316


