
The Polls and The 2015 ElectionJohn Curtice
9 June 2015

22
Two Halves The exit poll
The pre-polling day polls

33
The Difficulties of Exit Polling Very geographically clustered sample.
No precinct level counts, so difficult to draw a sample of districts that is known to have been representative of the result last time.
Some polling locations are easier to cover than others!
Relatively high (and potentially differential) refusal rate.
Most voting takes place in the early evening, giving little time to analyse the data!
44
The Solution Geographical variation in change in party support
much less than variation in the level of party support.
Thus any sample of locations more likely to produce an accurate estimate of change in vote share than in level.
But need an estimate of vote share last time.
So poll in the same places as last time, and compare exit poll results this time with last time.
Invite respondents to complete mock ballot paper
55
The Design in 2015 Covered 141 polling stations. Interview random 1 in n
sample, where n function of station electorate.
Four were instances where polling district split into two; so 139 estimates of change since 2010.
129 were places covered by 2010 exit poll, though some had undergone boundary change. Only two locations replaced.
Six new locations added in Scotland and four in areas of UKIP strength. In each case, attempted to select a polling station representative of the constituency.

66
Thereafter… Model the 139 changes (for each party) using
whatever constituency data appears theoretically and empirically appropriate.
Use resulting equation to estimate change in vote shares in each constituency – and thus vote shares.
From these vote shares estimate probability of each party to win each seat.
Forecast seats for each party is sum of probabilities. (No national vote forecast.)

77
How close were we?
Con Lab SNP Lib Dem Others0
50
100
150
200
250
300
350316
239
58
1027
331
232
56
823
Forecast Outcome

88
The Previous Record - 2010
Con Lab Lib Dem Others0
50
100
150
200
250
300
350307
255
5929
307
258
5728
Forecast Result

99
The Previous Record - 2005
Con Lab Lib Dem Others0
50
100
150
200
250
300
350
400
209
356
5328
198
356
6230
Forecast Seats

1010
Performance of Final Polls
Based on 10 polls whose fieldwork did not end before 5.5; Polls by Opinium; YouGov; Survation; ComRes; Populus; Ashcroft, Ipsos MORI: BMG Research, Panelbase; ICM Research
Con Lab UKIP Lib Dem Green Others0
5
10
15
20
25
30
35
40
34 34
13
9
5 6
38
31
13
8
46
Poll Average Result

1111
A Longer Term Pattern?
1992 1997 2001 2005 2010 2015
-6
-4
-2
0
2
4
6
-5
-1
-3
-1-1
-4
43
4
1
-2
3
ConLab
Ave
rage
Err
or in
Pol
ls

1212
Modal Differences
Con Lab UKIP Lib Dem Green Others0
5
10
15
20
25
30
35
4035 34
119
4.56.5
33 33
14
9
5 6
Phone Internet

1313
Possible Explanations Late Swing
Shy Tories
Lazy Labour
Question Order/Wording
Poor samples that are inadequately weighted (perhaps because they cannot be!)
1414
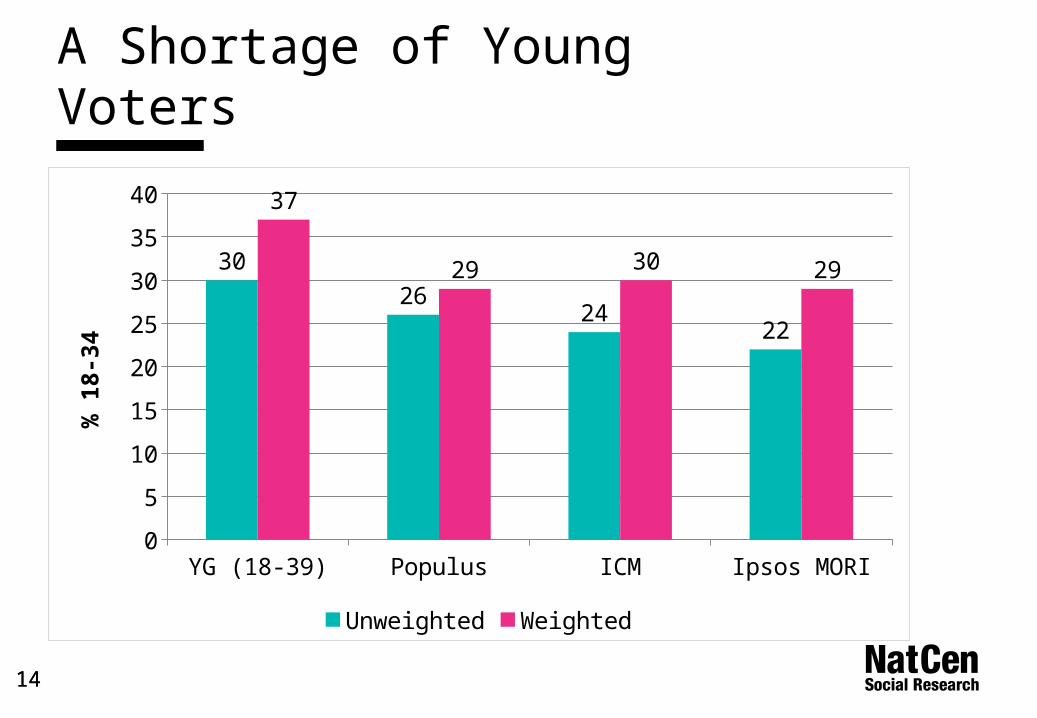
A Shortage of Young Voters
YG (18-39) Populus ICM Ipsos MORI0
5
10
15
20
25
30
35
40
30
2624
22
37
29 30 29
Unweighted Weighted
% 1
8-34

1515
An Excess of Middle Class Ones
YouGov Populus ICM Ipsos MORI0
10
20
30
40
50
60
7061 61 62
5956 54 56 54
Unweighted Weighted

1616
The Inquiry Sponsored by BPC and MRS
Chaired by Prof. Patrick Sturgis, Director of NCRM
Eight other members – 5 academics, 3 commercial researchers
None directly involved in polling in 2010
Asked to report by March 2016
First open public meeting, RSS, 19 June
Call for evidence: www.ncrm.ac.uk/polling/


