For comments, suggestions or further inquiries please contact:
Philippine Institute for Development StudiesSurian sa mga Pag-aaral Pangkaunlaran ng Pilipinas
The PIDS Discussion Paper Seriesconstitutes studies that are preliminary andsubject to further revisions. They are be-ing circulated in a limited number of cop-ies only for purposes of soliciting com-ments and suggestions for further refine-ments. The studies under the Series areunedited and unreviewed.
The views and opinions expressedare those of the author(s) and do not neces-sarily reflect those of the Institute.
Not for quotation without permissionfrom the author(s) and the Institute.
The Research Information Staff, Philippine Institute for Development Studies5th Floor, NEDA sa Makati Building, 106 Amorsolo Street, Legaspi Village, Makati City, PhilippinesTel Nos: (63-2) 8942584 and 8935705; Fax No: (63-2) 8939589; E-mail: [email protected]
Or visit our website at http://www.pids.gov.ph
June 2014
DISCUSSION PAPER SERIES NO. 2014-32
Rafaelita M. Aldaba
The Philippine Manufacturing IndustryRoadmap: Agenda for New Industrial Policy,High Productivity Jobs, and Inclusive Growth
Abstract
In the light of the weak performance of the Philippine manufacturing industry and the
absence of structural transformation of the economy from agriculture to manufacturing in the
last two decades, the paper calls for the implementation of a new industrial policy. This is
crucial not only to upgrade Philippine industries, generate more and better jobs and reduce
poverty but also to take advantage of the market opportunities and face the challenges arising
from the ASEAN Economic Community.
Based on the sectoral roadmaps submitted by industries to the Department of Trade
and Industry and Board of Investments, the paper has formulated a comprehensive industrial
strategy to enable manufacturing firms to upgrade, thrive and become catalysts and engines
for sustained and inclusive growth. The long-term vision of the Manufacturing Industry
Roadmap is to develop a globally competitive manufacturing industry supported by strong
backward and forward linkages with both domestic and global supply chains. Through the
implementation of the Roadmap, manufacturing contribution to the economy would account
for 30% of total value added and generate 15% of total employment.
Industry policies will focus on horizontal and vertical measures and a coordination
mechanism to enhance firm productivity, strengthen supply chains to enable firms to move up
the technology scale, link domestic firms with multinational companies and aggressively
court more investment. Horizontal measures will cover human resource development, SME
development, technology upgrading and innovation, investment promotion, and a competitive
exchange rate policy. It will also address issues such as high power and logistics cost,
smuggling, and infrastructure weaknesses. Vertical measures will address gaps in industry
supply chains and expand the domestic market base as springboard for exports. A
coordination mechanism will be designed to allow more interaction between government
agencies and industries in identifying obstacles and determining the most appropriate
interventions.
The roadmap implementation will be private-sector led while the government acts as
facilitator. As facilitating government, it will encourage producers to take risks, correct
market and government failures and address changes in policies and institutions. By creating
the proper environment and strengthening industries, the government can promote the success
of domestic firms in both the local and international markets that will lead to economic
transformation. Only with the right environment can manufacturing unleash its full potentials
to take advantage of the market opportunities currently facing us and become an engine for
sustained and inclusive growth.
Key words: manufacturing industry, structural transformation, Philippines

1
Executive Summary
Around the world, growth patterns and sources of competitiveness are changing
dramatically with emerging economies becoming key players as the US, EU, and Japan
continue to face slow growth. In the context of these rapidly changing global conditions, the
Philippines is now seen as a new growth market. Many see the impressive 7.6% third first half
growth rate in 2013 and 6.6% growth posted in 2012 as providing the necessary momentum
that would drive the country to a higher and more rapid growth path. The creation of the
ASEAN Economic Community in 2015 and the emergence of regional and international
production networks offer increased trade and investment opportunities. It is from this global
perspective that both the government and private sector must formulate their strategies to adapt
to changing market trends.
Globalization also brings with it more competition and to survive and take advantage
of the opportunities, industries must be competitive. On the overall, the performance of the
manufacturing industry in the past two decades has been weak in terms of its contribution to
growth and employment generation. From the 1980s up to the early 2000s, manufacturing
growth was slow. Modest growth was posted in the 2000s averaging around 4.1 percent. The
contribution of manufacturing to total output remained unchanged at 24 percent in the 1990s
and 2000s. In terms of employment contribution, manufacturing failed in creating enough
employment to absorb new entrants to the labor force as its share to total employment remained
stagnant at 9 percent from the 1990s till the 2000s. This implies that there has been no structural
transformation of the economy from agriculture to manufacturing, no rapid industrial growth
led by manufacturing but instead, what we observe is a rising services and a declining
manufacturing industry. This is in stark contrast to the substantial increases in manufacturing
that neighboring countries like Thailand, Indonesia, Malaysia and China have experienced.
Is there still a chance for the Philippines to catch up with our neighbors? Yes, there are
potential growth areas where the Philippine manufacturing industry can play an important role.
The Philippines has remained competitive in classic products such as copper ores,
unmanufactured tobacco, vegetable textile fibers, knitted clothing, machinery products like
electric distribution equipment, radio broadcast receiver, transistors and valves; and chemical
products like phenol and alcohol. The country also has emerging product champions given
this product group’s rising competitiveness in the 2000s. This include animal products like milk
and cream; manufactured tobacco, parts of electric power machinery, parts of machinery
apparatus, and parts for tractors and motor vehicles; glass and chemical products like metal
salts and inorganic acid. For certain products such as veneers, plywood, sugars, molasses,
cocoa, natural rubber, fish, animal and vegetable oils, pottery furniture, cushions, clothing
accessories and fabric; competitiveness has been diminishing. For this group, the main focus is

2
how to move up the value chain or product or technology ladder to more sophisticated products.
There are also marginal or promising group where competitiveness has remained low for most
years but has shown recent significant improvements in the last three or four years. This
includes pulp and paper, cereal preparations, edible products, ship, boat, motorcycles, aircraft
associated equipment, medical instruments, arms and ammunitions as well as chemical
products like soap and cleaners. The policy focus is to observe and craft measures to help them
grow, survive import competition and become exporters.
In a separate study by Usui (2012), there are opportunities in the following “nearby”
products (essentially these are low hanging fruits because the requirements for operating in
these products are already present in the country): complete digital processing machines,
cameras, appliances and parts, woven fabrics of synthetic material, precious jewelry, refined
sugar, jewelry, woven fabric of synthetic material, clocks, watches, and cameras. For “middle”
products (some of the required capabilities are present in the country), the opportunities are in
angles, shapes, sections and sheet filing of iron and steel, chemical products such as salts of
metallic acids, phenoplasts, aminoplasts, felts and articles of felts and bonded fiber fabrics, and
fiber building board of wood or other vegetable material. For “far-away” products
(requirements are still not developed in the country), the opportunities are in printing and
writing paper, chassis fitted with engines for vehicles, bodies for vehicles, other parts and
accessories of vehicles, paper and paperboard products, salts and derivatives, and special
products of textile materials. Foreign direct investment is crucial in moving to both “middle”
and “far-away” products.
To take advantage of the above opportunities that would enable us to catch up, it is
crucial to formulate a strategy for technology upgrading and transformation of the
manufacturing industry. This would entail the identification of the most binding constraints to
the upgrading of product quality and entry of new firms in these potential growth areas. Thus,
a new industrial policy is necessary to help the government determine measures to address the
most binding constraints to growth and strengthen industries and the business environment in
which they operate.
Transforming and upgrading the manufacturing industry is the best way to achieve
inclusive growth, create quality jobs, increase income and reduce poverty. The long-term vision
of the Manufacturing Industry Roadmap is to develop a globally competitive manufacturing
industry supported by strong backward and forward linkages within the economy.
In the short run, the policy focus should be on strengthening existing industries
especially those with strong potentials to generate employment, address missing gaps, move up
the product ladder and create linkages and spill-over effects in sectors such as automotive,
electronics, food, garments, motorcycle, shipbuilding, chemicals, and allied or support
industries. During this initial stage, policies and programs should aim at exploiting economies

3
of scale and learning by doing. Automotive, electronics and garments are industries
characterized by global/regional production networks. Deepening our participation in these
networks would be crucial for industries and SMEs in particular to benefit from the on-going
regional economic integration in ASEAN and East Asia.
Figure 1: Objectives: Industry Roadmap for Structural Transformation, Job Creation
and Poverty Reduction
Goal: a globally competitive manufacturing industry supported by a strong parts and
components
Targets: manufacturing contribution of 30% of total vale added and 15% of total employment
In the medium-term and as domestic capacities are reached, efforts in the initial stage
should lead to expansion and new investments especially in the upstream, intermediate or core
sectors such as iron and steel and other metals as well as in parts and components industries.
By linking manufacturing with agriculture, mining, and services; supply chain gaps will be
addressed and forward and backward linkages will be strengthened.
In the long-run, a globally competitive manufacturing industry with strong forward and
backward linkages is envisioned as the Philippines play a vital role in the regional and
international production networks of automotive, electronics, garments and food.
The Manufacturing Industry Upgrading Roadmap aims to increase the contribution of
manufacturing to 30 percent of total output and 15 percent of total employment. There are three
main pillars to achieve these targets: vertical measures, horizontal measures, and government-
industry coordination mechanism.
Short-run: 2014-2017
-maintain competitiveness of comparative advantage industries
-strengthen emerging products
-rebuild existing capacity of industries
Long-run: 2021-2025
-globally competitive manufacturing industry with strong forward & backward linkages
Medium-run: 2017-2021
-shift to high value added activities
-investments in upstream or core sectors
-link & integrate industries within the economy
4
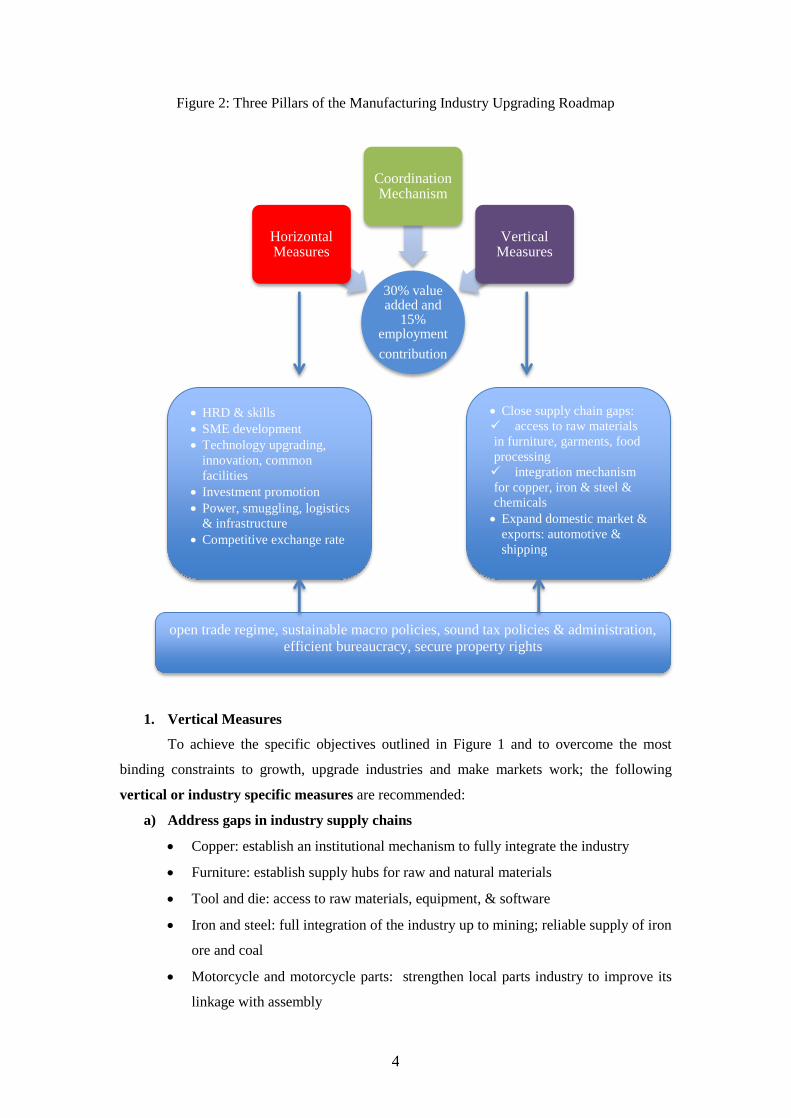
Figure 2: Three Pillars of the Manufacturing Industry Upgrading Roadmap
1. Vertical Measures
To achieve the specific objectives outlined in Figure 1 and to overcome the most
binding constraints to growth, upgrade industries and make markets work; the following
vertical or industry specific measures are recommended:
a) Address gaps in industry supply chains
Copper: establish an institutional mechanism to fully integrate the industry
Furniture: establish supply hubs for raw and natural materials
Tool and die: access to raw materials, equipment, & software
Iron and steel: full integration of the industry up to mining; reliable supply of iron
ore and coal
Motorcycle and motorcycle parts: strengthen local parts industry to improve its
linkage with assembly
30% value added and
15% employment
contribution
Horizontal Measures
Coordination Mechanism
Vertical Measures
HRD & skills
SME development
Technology upgrading,
innovation, common
facilities
Investment promotion
Power, smuggling, logistics
& infrastructure
Competitive exchange rate
Close supply chain gaps:
access to raw materials
in furniture, garments, food
processing
integration mechanism
for copper, iron & steel &
chemicals
Expand domestic market &
exports: automotive &
shipping
open trade regime, sustainable macro policies, sound tax policies & administration,
efficient bureaucracy, secure property rights

5
Petrochemical: enhance the competitiveness of downstream products
Plastic: encourage the growth of the recycling industry; provide incentives for
upgrading
Biodiesel: develop feedstock through seedling development for high yield
coconuts and other energy crops; map suitable areas for biodiesel feedstock
production
b) Expand the domestic market base and exports
Automotive: fiscal and non-fiscal incentives to rebuild the domestic market.
Ship building: implement RA 9295 (retirement of old vessels, restrictions on vessel
importation); demand development in domestic offshore and maritime sectors.
2. Horizontal Measures
To overcome the cross-cutting constraints, the following horizontal measures are
recommended:
a) HRD and skills training programs
Design human resource development and training programs to improve skills in the and at the
same time, establish tie-ups with universities and training institutions. Note that with educated
and well-trained workers, it is easier to learn new skills and enter new trades.
b) SME development and innovation
Support SME development through appropriate innovation incentives and mechanisms such
common service facilities (for example, quality testing) and R&D facilities, clustering, and
industry-academe linkages for new product development and applied technology for
indigenous products/raw materials. Grants, loans, innovation vouchers, and counterpart
funding to innovative firms and technical assistance to promote long-term research
collaboration between universities and business are also important.
c) FDI Promotion
Pursue aggressive and strategic promotion and marketing programs to attract more foreign
direct investments especially those that would bring in foreign technologies. Consolidate and
intensify the investment promotion efforts of BOI, PEZA, Clark, and Subic.
d) Business environment improvement
Improve the business environment by addressing smuggling, high cost of power, high domestic
shipping (including port charges), inadequate infrastructure. Speed up and facilitate the

6
implementation of Private Public Partnership programs to finance ports, airports, highways,
electricity grids, telecommunications and other infrastructure along with improvements in
institutional effectiveness particularly in curbing smuggling.
e) Competitive exchange rate
Maintain a competitive exchange rate in order to support and strengthen the new industrial
policy of the government. Manage the exchange rate to tip the balance slightly in favor of
exports, prevent surge of capital inflows and avoid excessive appreciation of the peso. Aware
of these concerns, the BSP has implemented some measures such as the ban on foreign funds
in special deposit accounts (SDA), lowering of SDA interest rates, and cap on non-deliverable
forwards for banks (to take effect in March 2014); although many still perceive these measures
to be relatively mild and suggest more stringent forms if inflows persist and the need to balance
the inflation objective versus the competiveness goal.
3. Coordination Mechanism
Industry transformation and upgrading entails an important role for the government as
it needs to coordinate policies and necessary support measures that will address the obstacles
to the entry and expansion of domestic firms. Industry analysis and consultations show that
coordination failures are the most crucial factors that must be addressed to catalyze industry
development in the country. For instance, implementation of approved legislations (RA 9295
in shipping); strict enforcement of product quality standards; measures providing access to raw
materials, intermediate inputs and common service facilities; and aggressive investment
promotion and marketing to attract investments are some of the measures that can be
implemented by the present administration. In all these, close coordination among government
agencies and the private sector as well as effective policy implementation would be vital for
industry development. Equally important is for the government to focus its efforts in addressing
the high cost of power, domestic shipping, and smuggling which are the most binding
horizontal constraints affecting most industries.
Coordination mechanism through industry councils would allow more interaction
between government agencies and industries in identifying obstacles and determining the most
appropriate interventions. The Department of Trade and Industry will lead the process of
coordination among the different government agencies, local government units and industries.
Industry and government champions have been identified by the DTI-BOI in carrying out these
coordinative functions.
While the private sector is seen as the major driver of growth, the government has an
important role to play in coordinating and facilitating policies and necessary support
measures that will address the most binding obstacles to the entry and growth of domestic

7
firms and creation of the right policy framework to encourage the development of the
private sector along the lines of the country’s latent comparative advantage. In the short-
run, the granting of fiscal incentives is not the most binding constraint affecting the growth of
most industries. The analysis has shown that close coordination among government agencies
and effective policy implementation are the most crucial factors for industry development.
Implementation of legislations; strict enforcement of product quality standards; measures
providing access to raw materials, intermediate inputs and common service facilities; and
aggressive investment promotion and marketing to attract investments are some of the
immediate measures that the present administration can already put in place. To encourage
investments in new areas that are aligned with the country’s latent comparative advantage,
limited fiscal incentives and other support may be granted to the first mover(s). The granting
of temporary incentives would be based on strict criteria and guidelines on the potential of the
activity to (i) generate employment, (ii) address missing gaps in the supply/value chain or to
move up the value chain or product ladder, (iii) generate spill-over effects to the economy, and
(iv) promote a competitive market environment.
By creating the proper environment and strengthening industries to ensure that they are
not disadvantaged by international competitors, the government can promote the success of
domestic firms in both the local and international markets that will lead to economic
transformation. Only with the right environment can manufacturing unleash its full potentials
to take advantage of the market opportunities currently facing us and become an engine for
sustained, inclusive growth, creation of quality jobs, and poverty reduction.

8
The Philippine Manufacturing Industry Roadmap:
Agenda for New Industrial Policy, High Productivity Jobs and Inclusive Growth1
Rafaelita M. Aldaba2
I. Introduction
These are exciting times for the Philippines as we now face a decisive moment for the
future of the economy. The economic outlook remains positive with 6.8% growth rate posted
in 2012 and 7.8% in the first quarter of 2013. With the Philippines’ steady growth pace,
international credit rating agencies recently upgraded the country’s rating to investment grade.
In the context of rapidly changing global conditions, the Philippines is now seen as a new
growth area especially as investors look for alternative areas after the Japan quake and Thai
flooding that disrupted many supply chains as well as the rising yen and increasing labor costs
in China.
Nomura Research (2010) indicated that the Philippines has comparative advantage in
electronics sub-sectors like printers, multifunction peripheral, projectors, scanners, and digital
cameras. Nomura identified missing linkages in the electronics supply chain such as
photovoltaic cell, LEDs, rechargeable batteries for hybrid electric vehicles and electric vehicles
and mobile digital devices, and next generation energy infrastructure. In a separate report,
Nomura (2012) also highlighted our potentials in shipbuilding especially in view of plans by
Korea and Japan to expand in overseas market. All these imply possible areas for investment
in the country.
With the popularity and high trust rating of the Aquino administration and its
continuing efforts to improve the country’s infrastructure and investment climate as well as our
strengths such as low and stable wages, abundant, young, skilled, English speaking workers;
the Philippines is well positioned to attract new investments that would catalyze growth and
development of industries. To realize this, the government needs a strong, diversified and
inclusive growth model where the industrial sector plays a key role in generating investment,
employment, and innovation. A strong and modern industrial base will enable the real economy
to lead the country’s high level and sustained growth.
Our experience shows that trade liberalization does not automatically lead to growth
nor to a competitive domestic market economy. Though imports are effective in disciplining
domestic manufacturing firms, the government has an important role to play particularly in
1 The study is one of the major outputs of the Philippine Institute for Development Studies -Department
of Trade and Industry-Board of Investments (PIDS-DTI-BOI) Development of a Comprehensive
Industry Plan and Sectoral Roadmaps Project. 2Senior Research Fellow, Philippine Institute for Development Studies.

9
creating and maintaining a competitive environment. It needs to coordinate policies to
implement trade liberalization in tandem with necessary support measures that will address the
obstacles to the entry, exit and growth of domestic firms. An industrial policy must be deployed
to strengthen our industrial base and remove the binding constraints affecting industrial growth.
Central to the new industrial policy framework is the process of competition,
innovation, and productivity that serves as channels through which a more open trading
environment affects growth and generation of employment. The literature on trade and
productivity shows that productivity improves following trade liberalization.3 As Melitz (2002)
points out, trade opening may induce a market share reallocation towards more efficient firms
and generate an aggregate productivity gain. Through increases in competition, increasing
evidence supports the claim that international trade enhances innovation leading to productivity
growth.4
Given the opportunities and challenges, firms must be able to formulate their strategies
from a global perspective to adapt to changing market trends. By creating the proper
environment and ensuring that domestic industries are not disadvantaged by international
competitors, the government can promote the success of our firms in both the domestic and
international markets leading to economic transformation. Only with the right environment can
industries unleash their full potentials to become an engine for inclusive growth and creation
of new jobs and new skills.
Based on the sectoral roadmaps submitted by industries to the Department of Trade
and Industry and Board of Investments, the report aims to formulate a comprehensive industrial
strategy to enable manufacturing firms to upgrade, thrive and become catalysts and engines for
sustained and inclusive growth. Industry policies will focus on horizontal and vertical measures
and coordination mechanisms to enhance firm productivity, strengthen supply chains to enable
firms to move up the technology scale, link domestic firms with multinational companies and
aggressively court more investment.
The Report is divided into five parts. After the introduction, Part II assesses the current
state of the manufacturing industry. Part III discusses the need for a new industrial policy and
the overall diagnostics framework used in formulating the industry strategy. Part IV analyzes
the potential areas for growth and identifies the most binding constraints to realizing these
potentials. Part V presents the roadmap and outlines the major horizontal, vertical and
coordination recommendations.
3 This result has been shown in countries like Chile (Pavcnik 2000), Columbia (Fernandes 2003), India
(Topalova 2003), Indonesia (Amiti and Konings 2004; Muendler 2002), and Brazil (Schor 2003). 4 See Impulliti and Licandro 2010 and 2009 and Licandro 2010.
10
II. Current State of the Philippine Manufacturing Industry
A. Overall Performance and Contribution to the Economy
1) Value Added Structure and Growth
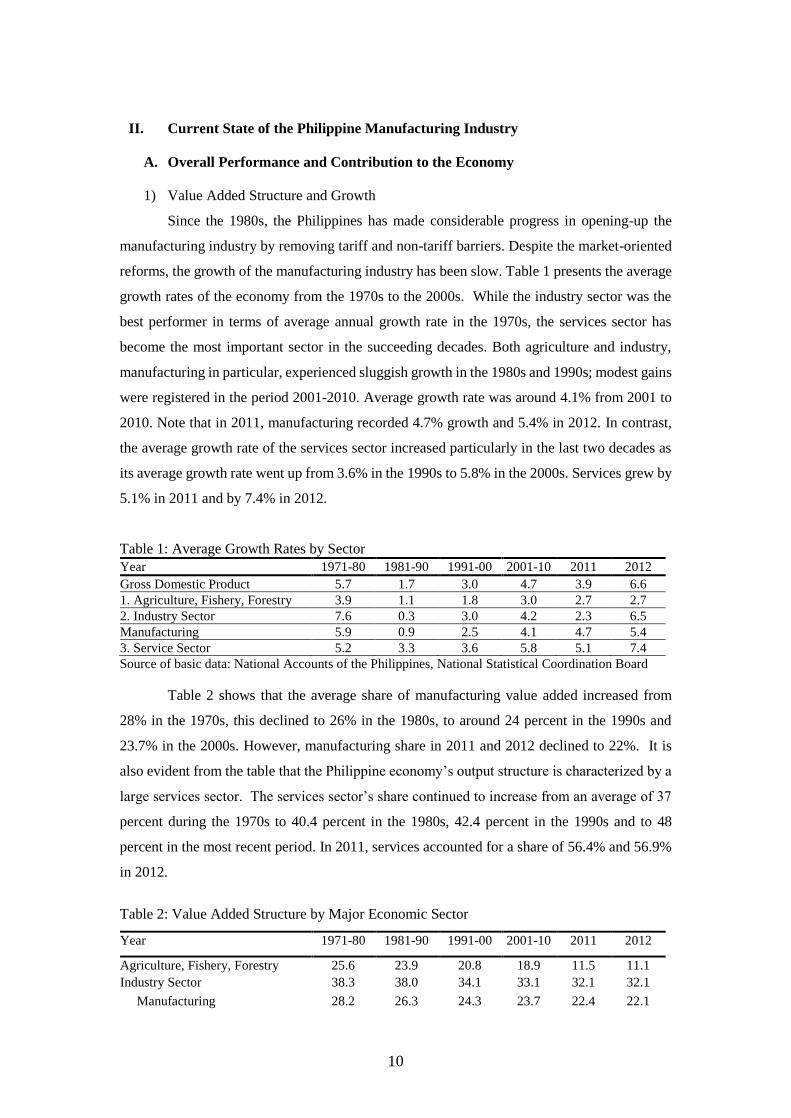
Since the 1980s, the Philippines has made considerable progress in opening-up the
manufacturing industry by removing tariff and non-tariff barriers. Despite the market-oriented
reforms, the growth of the manufacturing industry has been slow. Table 1 presents the average
growth rates of the economy from the 1970s to the 2000s. While the industry sector was the
best performer in terms of average annual growth rate in the 1970s, the services sector has
become the most important sector in the succeeding decades. Both agriculture and industry,
manufacturing in particular, experienced sluggish growth in the 1980s and 1990s; modest gains
were registered in the period 2001-2010. Average growth rate was around 4.1% from 2001 to
2010. Note that in 2011, manufacturing recorded 4.7% growth and 5.4% in 2012. In contrast,
the average growth rate of the services sector increased particularly in the last two decades as
its average growth rate went up from 3.6% in the 1990s to 5.8% in the 2000s. Services grew by
5.1% in 2011 and by 7.4% in 2012.
Table 1: Average Growth Rates by Sector
Year 1971-80 1981-90 1991-00 2001-10 2011 2012
Gross Domestic Product 5.7 1.7 3.0 4.7 3.9 6.6
1. Agriculture, Fishery, Forestry 3.9 1.1 1.8 3.0 2.7 2.7
2. Industry Sector 7.6 0.3 3.0 4.2 2.3 6.5
Manufacturing 5.9 0.9 2.5 4.1 4.7 5.4
3. Service Sector 5.2 3.3 3.6 5.8 5.1 7.4
Source of basic data: National Accounts of the Philippines, National Statistical Coordination Board
Table 2 shows that the average share of manufacturing value added increased from
28% in the 1970s, this declined to 26% in the 1980s, to around 24 percent in the 1990s and
23.7% in the 2000s. However, manufacturing share in 2011 and 2012 declined to 22%. It is
also evident from the table that the Philippine economy’s output structure is characterized by a
large services sector. The services sector’s share continued to increase from an average of 37
percent during the 1970s to 40.4 percent in the 1980s, 42.4 percent in the 1990s and to 48
percent in the most recent period. In 2011, services accounted for a share of 56.4% and 56.9%
in 2012.
Table 2: Value Added Structure by Major Economic Sector
Year 1971-80 1981-90 1991-00 2001-10 2011 2012
Agriculture, Fishery, Forestry 25.6 23.9 20.8 18.9 11.5 11.1
Industry Sector 38.3 38.0 34.1 33.1 32.1 32.1
Manufacturing 28.2 26.3 24.3 23.7 22.4 22.1

11
Service Sector 36.6 40.4 42.4 48.0 56.4 56.9
Source of basic data: National Accounts of the Philippines, National Statistical Coordination Board
Table 3 shows a more detailed structure of manufacturing value added. Consumer
products continue to dominate the sector, although its share dropped from 57 percent during
the 1980s to 50 percent in the 1990s and 51% during the 2000s. In 2011, its share declined to
48% but recovered quickly in 2012 as its share went up to 50%. Food manufactures remained
the largest subsector with a share of 40% in the 2000s, although this declined to 37% in 2011
and 38% in 2012. Average growth continued to increase from 0.2% in the 1980s to 1.8% in
the 1990s and to 4.6% in the 2000s. In 2011, its growth hit 7.3% and 10.3% in 2012.
Table 3: Structure and Growth of Manufacturing Value Added (in percent)
Average Share Average Growth Rate
80s 90s 20s 2011 2012 80s 90s 20s 2011 2012
Consumer Goods 57 50 51 48 50 0.2 1.8 4.6 7.3 10.3
Food manufactures 44 36 40 37 38 -0.7 1.8 5.9 3.1 6.9
Beverage industries 4 4 4 4 4 7.1 2.3 3.8 17.2 4.4
Tobacco manufactures 3 3 1 0.4 0.4 1.0 1.2 -9.7 -18.8 -0.2
Footwear, wearing apparel 5 6 4 3 3 5.7 1.5 -2.0 3.9 39.0
Furniture and fixtures 1 1 1 3 4 1.6 2.0 6.2 94.8 38.7
Intermediate Goods 31 35 27 20 20 1.7 1.6 2.4 4.3 3.8
Textile manufactures 4 3 2 2 2 0.3 -4.6 0.8 -2.3 -0.5
Wood and cork products 2 2 1 1 1 -4.6 -4.0 -2.7 -8.7 18.1
Paper and paper products 1 1 1 1 1 4.0 -0.7 0.6 14.6 -4.5
Publishing and printing 1 2 1 1 1 3.2 1.4 0.6 -5.6 1.8
Leather and leather prod. 0 0 0 -3.4 5.3 -4.8
Rubber products 2 1 1 2 2 1.4 -2.2 1.1 7.6 8.1
Chemical & chemical prod. 7 6 6 7 7 -0.7 2.5 4.4 18.1 4.0
Products of petroleum & coal 12 17 14 4 4 6.1 3.7 2.6 -9.1 -3.9
Non-metallic mineral prod. 2 3 2 2 3 2.3 2.1 5.0 2.9 15.1
Capital Goods 10 13 19 29 27 1.9 6.2 5.5 0.2 0.1
Basic metal industries 3 2 3 2 2 9.5 -1.8 13.1 -0.6 -
18.1
Metal industries 2 2 2 1 1 3.9 0.1 5.3 6.7 0.1
Machinery except electrical 1 1 1 3 3 0.4 5.9 -0.5 2.7 8.6
Electrical machinery 3 6 12 21 20 7.3 13.2 5.7 0.4 -0.7
Transport equipment 1 1 1 2 2 -5.0 2.4 7.5 -6.4 12.3
Miscellaneous manufactures 2 2 3 4 3 8.0 4.9 7.9 12.5 -6.8
Total Manufacturing 100 100 100 100 100 0.9 2.3 4.1 4.7 5.4
Source: National Income Accounts.
Intermediate goods like petroleum and coal products and chemical and chemical
products follow, accounting for an average share of 31 percent in the 1980s to 35 percent in the
1990s, however, its share dropped markedly to 27% in the 2000s. In both 2011 and 2012, its
12
share declined and remained at 20%. Its average growth rate posted 2.4% during the 2000s, an
improvement from 1.6% in the 1990s and 1.7% in the 1980s.
The share of capital goods increased substantially from approximately 10 percent in
the 1980s to 17 percent in 1990s. Its average share is about 19 percent in the 2000s. This can
be attributed to the strong growth of the electrical machinery sub-sector which increased
substantially from 7.3% in the 1980s to 13.2% in the 1990s. Electrical machinery was the best
performer from the 1980s up to the 1990s. Although in the 2000s, its growth slowed down to
2.7% due to the 2008 global economic crisis. In terms of share, this went up from 3% in the
1980s to 6% in the 1990s and 12 percent in the period 2000s. In 2011, capital goods recorded
a share of 29% but dropped to 27% in 2011. Electrical machinery share posted a 21% share in
2011 and 20% in 2012.
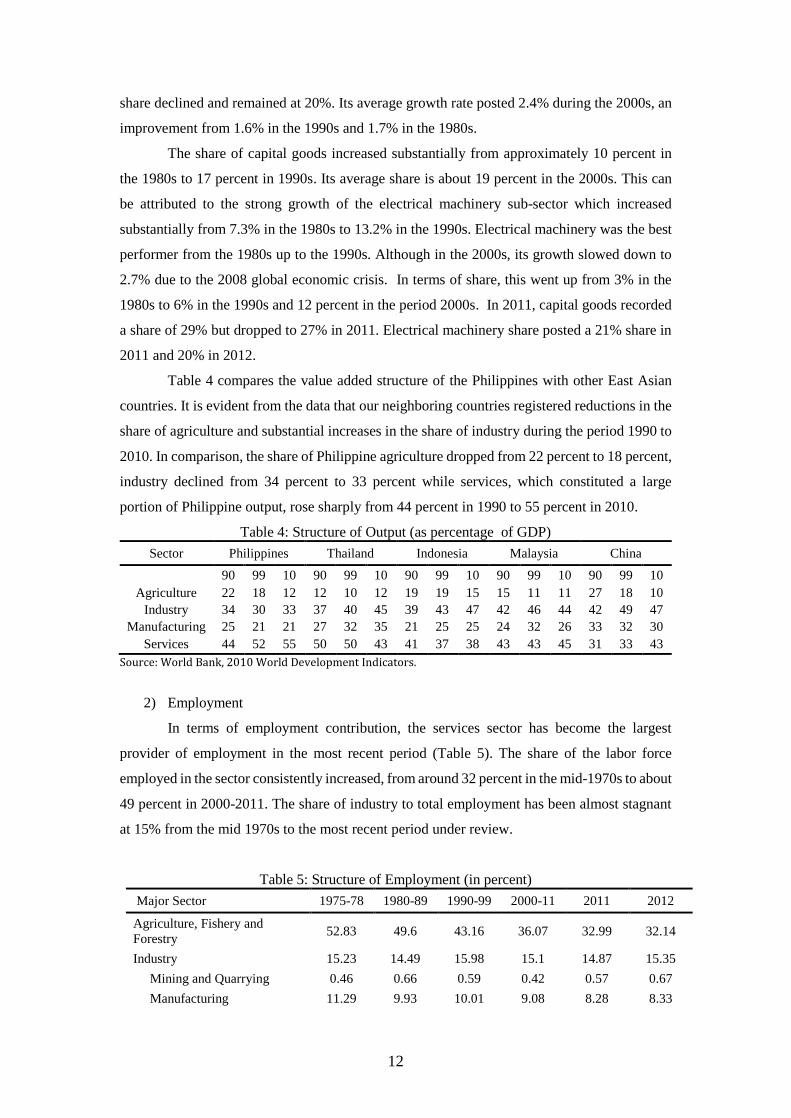
Table 4 compares the value added structure of the Philippines with other East Asian
countries. It is evident from the data that our neighboring countries registered reductions in the
share of agriculture and substantial increases in the share of industry during the period 1990 to
2010. In comparison, the share of Philippine agriculture dropped from 22 percent to 18 percent,
industry declined from 34 percent to 33 percent while services, which constituted a large
portion of Philippine output, rose sharply from 44 percent in 1990 to 55 percent in 2010.
Table 4: Structure of Output (as percentage of GDP)
Sector Philippines Thailand Indonesia Malaysia China
90 99 10 90 99 10 90 99 10 90 99 10 90 99 10
Agriculture 22 18 12 12 10 12 19 19 15 15 11 11 27 18 10
Industry 34 30 33 37 40 45 39 43 47 42 46 44 42 49 47
Manufacturing 25 21 21 27 32 35 21 25 25 24 32 26 33 32 30
Services 44 52 55 50 50 43 41 37 38 43 43 45 31 33 43
Source: World Bank, 2010 World Development Indicators.
2) Employment
In terms of employment contribution, the services sector has become the largest
provider of employment in the most recent period (Table 5). The share of the labor force
employed in the sector consistently increased, from around 32 percent in the mid-1970s to about
49 percent in 2000-2011. The share of industry to total employment has been almost stagnant
at 15% from the mid 1970s to the most recent period under review.
Table 5: Structure of Employment (in percent)
Major Sector 1975-78 1980-89 1990-99 2000-11 2011 2012
Agriculture, Fishery and
Forestry 52.83 49.6 43.16 36.07 32.99 32.14
Industry 15.23 14.49 15.98 15.1 14.87 15.35
Mining and Quarrying 0.46 0.66 0.59 0.42 0.57 0.67
Manufacturing 11.29 9.93 10.01 9.08 8.28 8.33

13
Electricity, Gas and Water 0.35 0.36 0.44 0.4 0.4 0.43
Construction 3.13 3.54 4.94 5.22 5.62 5.92
Services 31.87 35.9 40.94 48.82 52.14 52.51
Wholesale and Retail Trade 10.32 12.55 14.54 18.65 19.89 18.75
Transportation, Storage &
Communication 4.08 4.45 5.8 7.46 7.46 7.85
Financing, Insurance, Real
Estate & Business Services 4.55 1.79 2.18 3.55 7.56 8.23
Community, Social &
Personal Services 14.05 17.11 18.42 19.17 17.23 17.68
Industry not Elsewhere
Classified 0.49 0.02 0.05 0 0.01 0.01
Sources: Yearbook of Labor Statistics (1980-2000) and Current Labor Statistics (2001-2002), Bureau of
Labor and Employment Statistics, Department of Labor and Employment and Employed Persons by
Major Industry Group, National Statistics Office Labor Force Survey (1970, 1975-1976, 1977-1978,
2003-2009).
The manufacturing sector has failed in creating enough employment to absorb new
entrants to the labor force as well as those who move out of the agricultural sector. Its share
dropped from 11 percent in the mid-1970s to 9 percent in the 2000-2011 period. While the
share of agriculture has been declining, the sector has remained an important source of
employment. From 52.8 percent in the mid-1970s, the agriculture sector’s share in total
employment continuously declined in the succeeding decades and is currently around 36
percent. Note that in 2011 and 2012, manufacturing posted a share of only 8%.
Table 6 and Figure 1 presents the average unemployment and underemployment rates
from the 1950s to present. Unemployment increased steadily from an average of 4.9% in the
1970s to 7% in the 1980s, 9.8% in the 1990s and 11% during the early 2000s.
Underemployment rate was high and was more than double the unemployment rate up to the
1990s. It declined from 26% in the 1980s to 21% in the 1990s and to 17% in the early 2000s.
Note that due to the change in the definition of unemployment in 2005, there has been a big
drop in the unemployment rate and an increase in the underemployment rate for the period
2005-2010.
Table 6: Labor Market Indicators
Year Unemployment Rate Underemployment Rate GDP growth rate
1956-60 8.01 -- --
1961-70 7.26 -- 6.2
1971-75 4.86 21.00 4.8
1981-90 7.43 25.74 5.7
1991-00 9.75 21.39 1.7
2001-04 11.43 17.20 3.0
2005-10 7.87 20.14 4.9
2011 7.02 19.25 3.9
2012 6.98 19.95 6.6
Sources: Yearbook of Labor Statistics. BLES-DOLE. The rates for 2011 & 2012 are from Labor Force
Survey of NSO. Notes: (1) Starting April 2005, unemployed persons include all persons 15 years old &

14
over & are reported as (i) without work & currently available for work & seeking work & (ii) without
work & currently available for work but not seeking for work due to the following reasons: tired/believed
no work available; awaiting results of previous job application; bad weather; & waiting for rehire/job
recall. (2) Prior to 1976, working age population covered 10 years old and over, and from 1976 onwards,
15 years and above.
Source: Yearbook of Labor Statistics. BLES-DOLE. The rates for 2011 & 2012 are from Labor Force
Survey of NSO. Note: Starting April 2005, NSO changed the definition of unemployment (see above).
Table 7 presents the relative wages of skilled to unskilled workers 5 using the
Occupational Wages Survey of the Bureau of Labor Statistics. The Survey covers average
monthly wage rates of time-rate workers on full-time basis employed in non-agricultural
establishments employing 20 or more workers. These are based on basic pay referring to pay
for normal/regular working time before deductions for employees’ contributions and
withholding taxes and excluding overtime, night shift differential and other premium pay. On
the average, the data show a general downward trend between 2004 and 2010 except for certain
sectors such as wood, wood products ex. furniture; rubber and plastic products; and motor
vehicles, trailers, and semi-trailers.
Table 7: Relative Wages of Skilled and Unskilled Workers Sector 2004 2006 2008 2010
Food Products and Beverages 1.69 1.55 1.37 1.61
Manufacture of Textiles 1.33 1.23 1.22 1.17
Manufacture of Wearing Apparel 1.36 1.25 1.06 1.19
Tanning and Dressing of Leather;
Luggage, Handbags and Footwear 1.20 1.16 1.14 1.14
Wood, Wood Products except Furniture 1.28 1.29 1.25 1.34
Paper and Paper Products 1.76 1.48 1.50 1.31
Publishing and Printing 1.51 1.36 1.27 1.36
Coke, Refined Petroleum and Other Fuel
Products 3.14 1.71 2.20
Chemicals and Chemical Products 2.08 1.73 1.88 1.97
Rubber Products 1.37 1.74 1.44 1.74
Plastic Products 1.27 1.25 1.28 1.46
Other Non-Metallic Mineral Products 1.93 1.58 2.06 1.79
Basic Metals 1.37 1.23 1.29 1.26
Fabricated Metal Products, except
Machinery and Equipment 1.21 1.36 1.25 1.10
Machinery and Equipment, n.e.c. 1.47 1.15 1.56 1.29
5 Skilled workers include production supervisors, general foremen, engineers, quality inspectors,
accounting and bookeeping clerks, production clerks and related workers. Unskilled refers to other
workers excluding janitors, messengers, and freight.
0.00
10.00
20.00
19
56
19
58
19
60
19
62
19
64
19
66
19
68
19
70
19
72
19
74
19
76
19
78
19
80
19
82
19
84
19
86
19
88
19
90
19
92
19
94
19
96
19
98
20
00
20
02
20
04
20
06
20
08
20
10
20
12
Figure 1: Philippine Unemployment Rate, 1956-2012
15
Electrical Machinery and Apparatus,
n.e.c. 1.70 1.64 1.80 1.29
Radio, Television and Communication
Equipment and Apparatus 1.55 1.31 1.52 1.35
Motor Vehicles, Trailers and Semi-
Trailers 1.88 1.37 1.60 1.92
Building and Repairing of Ships and
Boats 1.98 1.46 1.18 1.31
Manufacture and Repair of Furniture 1.25 1.30 1.23 1.19
Average 1.54 1.48 1.43 1.45
Source: Bureau of Labor Statistics Occupational Labor Survey
Source of basic data: Skills wage premiums are calculated as ratio of hourly pay of each skill group relative to
comparator skill group. World Bank 2010. Philippine Skills Report.
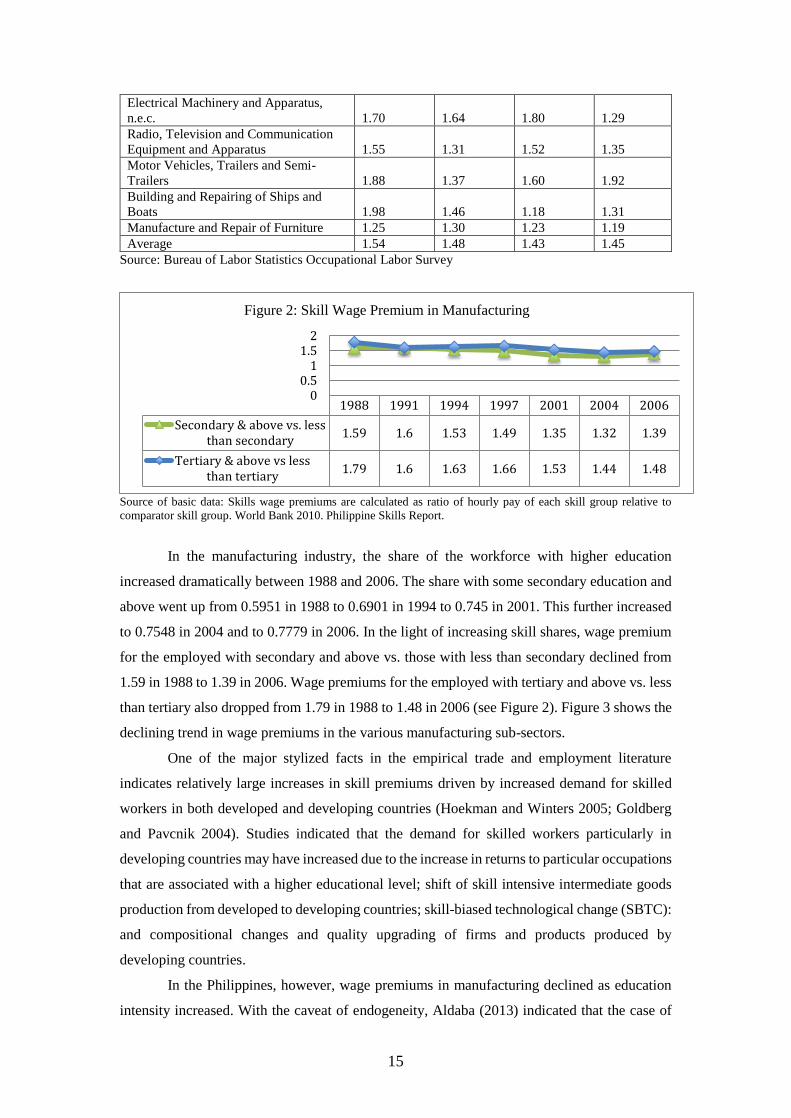
In the manufacturing industry, the share of the workforce with higher education
increased dramatically between 1988 and 2006. The share with some secondary education and
above went up from 0.5951 in 1988 to 0.6901 in 1994 to 0.745 in 2001. This further increased
to 0.7548 in 2004 and to 0.7779 in 2006. In the light of increasing skill shares, wage premium
for the employed with secondary and above vs. those with less than secondary declined from
1.59 in 1988 to 1.39 in 2006. Wage premiums for the employed with tertiary and above vs. less
than tertiary also dropped from 1.79 in 1988 to 1.48 in 2006 (see Figure 2). Figure 3 shows the
declining trend in wage premiums in the various manufacturing sub-sectors.
One of the major stylized facts in the empirical trade and employment literature
indicates relatively large increases in skill premiums driven by increased demand for skilled
workers in both developed and developing countries (Hoekman and Winters 2005; Goldberg
and Pavcnik 2004). Studies indicated that the demand for skilled workers particularly in
developing countries may have increased due to the increase in returns to particular occupations
that are associated with a higher educational level; shift of skill intensive intermediate goods
production from developed to developing countries; skill-biased technological change (SBTC):
and compositional changes and quality upgrading of firms and products produced by
developing countries.
In the Philippines, however, wage premiums in manufacturing declined as education
intensity increased. With the caveat of endogeneity, Aldaba (2013) indicated that the case of
1988 1991 1994 1997 2001 2004 2006
Secondary & above vs. lessthan secondary
1.59 1.6 1.53 1.49 1.35 1.32 1.39
Tertiary & above vs lessthan tertiary
1.79 1.6 1.63 1.66 1.53 1.44 1.48
00.5
11.5
2
Figure 2: Skill Wage Premium in Manufacturing
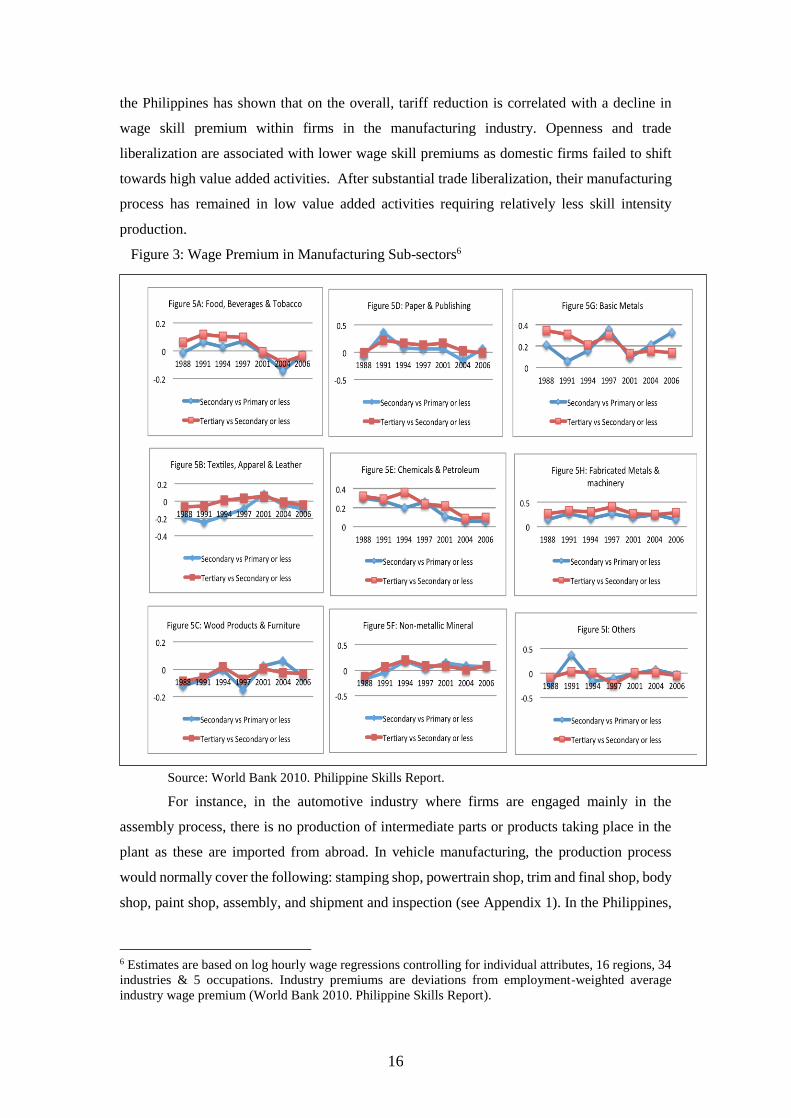
16
the Philippines has shown that on the overall, tariff reduction is correlated with a decline in
wage skill premium within firms in the manufacturing industry. Openness and trade
liberalization are associated with lower wage skill premiums as domestic firms failed to shift
towards high value added activities. After substantial trade liberalization, their manufacturing
process has remained in low value added activities requiring relatively less skill intensity
production.
Figure 3: Wage Premium in Manufacturing Sub-sectors6
Source: World Bank 2010. Philippine Skills Report.
For instance, in the automotive industry where firms are engaged mainly in the
assembly process, there is no production of intermediate parts or products taking place in the
plant as these are imported from abroad. In vehicle manufacturing, the production process
would normally cover the following: stamping shop, powertrain shop, trim and final shop, body
shop, paint shop, assembly, and shipment and inspection (see Appendix 1). In the Philippines,
6 Estimates are based on log hourly wage regressions controlling for individual attributes, 16 regions, 34
industries & 5 occupations. Industry premiums are deviations from employment-weighted average
industry wage premium (World Bank 2010. Philippine Skills Report).

17
CKD (completely knocked down) packs are imported and only welding, painting, trimming,
and inspection are carried out in assembly plants with a few parts sourced domestically. This is
further elaborated in the productivity decomposition analysis below which highlights the
absence of industrial upgrading in Philippine manufacturing.
3) Productivity
The traditional way of measuring productivity at the plant level is to compute value-
added per worker7. On the average, labor productivity in manufacturing declined substantially
from around P84,000 during the 1980s to P78,000 in the 1990s (see Figure 4), although in the
current period, this improved to around P98,000.
Herrin and Pernia (2003) attributed the deterioration in the country’s labor productivity
from the mid-1970s to the 1990s to three factors: the failure of firms to invest in state-of-the-
art technology and implement best practice, the lack of investments in human capital, and the
relatively quick expansion of employment in low productivity services sector.
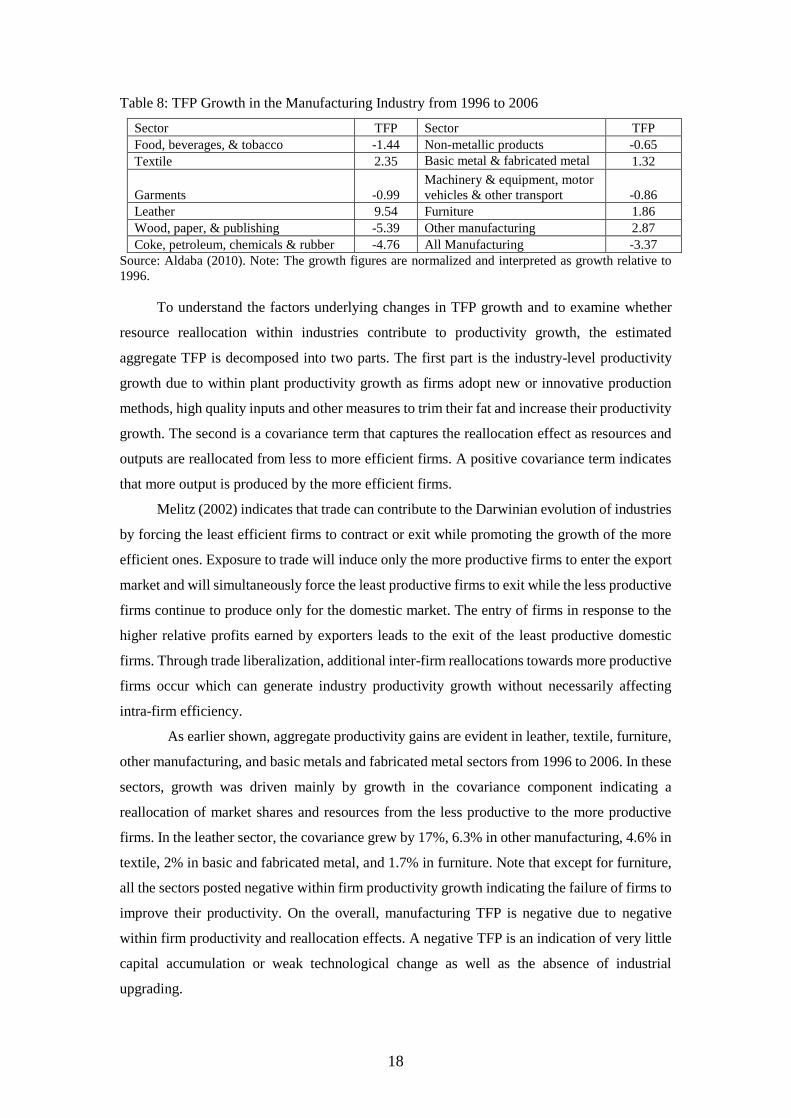
Table 8 shows total factor productivity (TFP)8 growth figures for manufacturing which
are normalized and interpreted as growth relative to 1996. Aggregate productivity gains are
evident in leather, textile, furniture, other manufacturing, and basic metals and fabricated metal
sectors during the same period. On the whole, however, the manufacturing sector’s aggregate
productivity is negative with manufacturing declining by 3.4% from 1996 to 2006.
Figure 4: Average Labor Productivity in Manufacturing, in '000 pesos
7 While this is easy to calculate and reflects labor productivity, it focuses productivity measurement only
on labor. 8 Total factor productivity measures the efficiency with which inputs of labor and capital are used. TFP
was estimated using the methodology of Levinsohn and Petrin (2001). The choice between TFP and
labor productivity is fundamental because increases in labor productivity can result from increases in the
capital-labor ratio without changes in the underlying technology. TFP provides more information about
changes in technology than does labor productivity and is the preferred concept despite problems arising
from the measurement of capital service flows.
7678808284868890929496
1970s 1980s 1990s 2000s
84.09 83.98
78.02
97.54
Avg. Labor Productivity
18
Table 8: TFP Growth in the Manufacturing Industry from 1996 to 2006
Source: Aldaba (2010). Note: The growth figures are normalized and interpreted as growth relative to
1996.
To understand the factors underlying changes in TFP growth and to examine whether
resource reallocation within industries contribute to productivity growth, the estimated
aggregate TFP is decomposed into two parts. The first part is the industry-level productivity
growth due to within plant productivity growth as firms adopt new or innovative production
methods, high quality inputs and other measures to trim their fat and increase their productivity
growth. The second is a covariance term that captures the reallocation effect as resources and
outputs are reallocated from less to more efficient firms. A positive covariance term indicates
that more output is produced by the more efficient firms.
Melitz (2002) indicates that trade can contribute to the Darwinian evolution of industries
by forcing the least efficient firms to contract or exit while promoting the growth of the more
efficient ones. Exposure to trade will induce only the more productive firms to enter the export
market and will simultaneously force the least productive firms to exit while the less productive
firms continue to produce only for the domestic market. The entry of firms in response to the
higher relative profits earned by exporters leads to the exit of the least productive domestic
firms. Through trade liberalization, additional inter-firm reallocations towards more productive
firms occur which can generate industry productivity growth without necessarily affecting
intra-firm efficiency.
As earlier shown, aggregate productivity gains are evident in leather, textile, furniture,
other manufacturing, and basic metals and fabricated metal sectors from 1996 to 2006. In these
sectors, growth was driven mainly by growth in the covariance component indicating a
reallocation of market shares and resources from the less productive to the more productive
firms. In the leather sector, the covariance grew by 17%, 6.3% in other manufacturing, 4.6% in
textile, 2% in basic and fabricated metal, and 1.7% in furniture. Note that except for furniture,
all the sectors posted negative within firm productivity growth indicating the failure of firms to
improve their productivity. On the overall, manufacturing TFP is negative due to negative
within firm productivity and reallocation effects. A negative TFP is an indication of very little
capital accumulation or weak technological change as well as the absence of industrial
upgrading.
Sector TFP Sector TFP
Food, beverages, & tobacco -1.44 Non-metallic products -0.65
Textile 2.35 Basic metal & fabricated metal
products 1.32
Garments -0.99
Machinery & equipment, motor
vehicles & other transport -0.86
Leather 9.54 Furniture 1.86
Wood, paper, & publishing -5.39 Other manufacturing 2.87
Coke, petroleum, chemicals & rubber -4.76 All Manufacturing -3.37

19
Table 9: Aggregate Productivity Growth Decomposition from 1996 to 2006
Source: Aldaba (2010). Note: The growth figures are normalized and interpreted as growth relative to
1996
Imports and Exports
Trade (exports plus imports of goods and services) increased from an average of around
82% of GDP in the 1990s to 89% in the 2000s (Figure 5). On average, exports of goods &
services as % of GDP rose from 38% to 43% during the same period, and imports from 44% to
47%. Trade balance, however, has been unfavorable with imports surpassing exports except in
1999-2000.
Figure 5: Trade as Percentage of GDP, 1990-2011
Source: World Development Indicators 2012, World Bank
Figures 6 and 7 present the structure of exports and imports by 2-digit level PSIC. In
1988, 60% of our exports consisted of electrical machinery & apparatus, nec (22%), food and
beverages (17%), and wearing apparel and textile (21%). Over the years, however, the
Philippine export base has become less diversified. In 2008, 66% of the country’s exports
relied on only one sector: machinery equipment & transport. Meanwhile, the shares of
traditional exports such as food and beverages as well as wearing apparel and textile declined
0
20
40
60
80
100
120
19
90
19
91
19
92
19
93
19
94
19
95
19
96
19
97
19
98
19
99
20
00
20
01
20
02
20
03
20
04
20
05
20
06
20
07
20
08
20
09
20
10
20
11
Exports of goodsand services (%of GDP)
Imports of goodsand services (%of GDP)
Trade (% of GDP)
Sector TFP Within firm productivity Covariance
Food, beverages, & tobacco -1.44 -1.93472 0.49602 Textile 2.35 -2.26561 4.61733 Garments -0.99 -2.5954 1.60258 Leather 9.54 -7.69629 17.23975 Wood, paper, & publishing -5.39 -1.40469 -3.98371 Coke, petroleum, chemicals &
rubber -4.76 -2.13054 -2.63366
Non-metallic products -0.65 -2.37125 1.72388 Basic metal & fabricated metal
products
1.32 -0.70002 2.02053 Machinery & equipment, motor
vehicles & other transport -0.86 0.82884 -1.68693
Furniture 1.86 0.20054 1.66347 Other manufacturing 2.87 -3.44865 6.31391 All Manufacturing -3.37 -1.47782 -1.89236

20
from 17% to 5% for the former and from 21% to 5% for the latter. Note that within these major
product groups, exports are highly concentrated in low value added and labor-intensive
products sectors. These goods are considerably dependent on imported inputs and have weak
backward and/or upward linkages with the rest of the manufacturing sectors.
Figure 6: Merchandise Export Structure 1988, 2006, and 2008 (in %)
Source of Basic Data: Foreign Trade Statistics, National Statistics Office.
Figure 7: Merchandise Import Structure 1988, 2006, and 2008 (in %)
Source of Basic Data: Foreign Trade Statistics, National Statistics Office.
5 5
66
24
Exports 2008
Food, Products, & Beverages
Textile & Garments
Machinery, Equipment, &Transport
Others
17
21
22
40
Exports 1988
Food Products andBeverages
Textile & Garments
Machinery, Equipment &Transport
Others
14 5 2
17
45
17
Imports 2008
Non-Metallic Mining &QuarryingFood Products & Beverages
Textile & Garments
Coke, Refined Petroleum,Chemicals, & RubberMachinery, Equipment, &Transport
146
11
1529
25
Imports 1988
Non-Metallic Mining and Quarrying
Manufacture of Food Products and
BeveragesTextile & Garments
Coke, Refined Petroleum,
Chemicals, & RubberMachinery, Equipment & Transport
Others

21
In 1988, Philippine imports were composed of machinery equipment & transport which
represented the bulk of the total with a share of 29%, chemicals had a share of 15%, while non-
metallic mining & quarrying had 14%. Textiles and garments registered a share of 11% and
food and beverages had 6%. Following the changes in the country’s export structure, in 2008,
the share of machinery & transport increased significantly to 45%, chemicals also increased to
17% while textiles & garments dropped to 2%.
Figure 8 shows the country’s export structure by Leamer commodity group from 1991
to 2010. For the period 1991-1995, Philippine exports were dominated by labor-intensive
products (30%) followed by machinery (25%). Tropical agriculture (10%) followed along with
cereal and other products (9.5%) and forest products (9%). The next periods showed a steady
decline in the share of labor-intensive products from 30% in 1991-1995 to 18% in 1996-2000,
14% in 2001-2005, and to 4% in 2006-2010. Machinery products increased substantially from
25% in 1991-1995 to 64% in 1996-2000, 71% in 2001-2005, but declined to 65% in 2006-
2010. Note, however, that the bulk of machinery exports has been dominated by transistors,
valves, etc which accounted for, on the average, 60% of total machinery exports in in 1991-
1995, 86% in 1996-2000, 81% in 2001-2005, and to 72% in 2006-2010.
For the other export groups, their average shares declined between the periods 1991-
1995 and 2001-2005, although some improvement in their average shares are evident during
the period 2006-2010. On the average, raw materials share went up from 2.5% in 2001-2005 to
6.3% in 2006-2010. Similarly, forest products share increased from 1.1% in 2001-2005 to 3.3%.
4) Revealed Comparative Advantage
To see how the Philippine’s international specialization has evolved over time, Table
10 presents measures of revealed comparative advantage (RCA) from 1991 to 2011. Based on
0.00
10.00
20.00
30.00
40.00
50.00
60.00
70.00
80.00
Figure 8: Philippine Exports (in %)
1991-1995
1996-2000
2001-2005
2006-2010

22
Balassa’s (1986) concept of RCA, these give an indication of those industries in which a
country may have a comparative advantage. The RCA compares how much a country is
exporting a given product relative to its total trade, in comparison to the share of that product
in world trade. A country is said to have a revealed comparative advantage when its share of
export of a given product exceeds the equivalent share of export of the world. This is captured
when the RCA is above 1. An RCA below 1 suggests that the country does not have a revealed
comparative advantage in a given product.
RCA indicators were calculated for products based on the 3-digit Standard International
Trade Classification (SITC) commodity categories. The products are aggregated following
Leamer classification (1984) which consists of ten major sectors: (i) petroleum, (ii) raw
materials, (iii) forest products, (iv) tropical agriculture, (v) animal products, (vi) cereals, etc,
(vii) labor intensive, (viii) capital intensive, (ix) machinery, and (x) chemicals.
Table 10: RCA Indicators
Period 1991-95 1996-00 2001-05 2006-10 2011
I. Petroleum
Petroleum oils, crude 0.08 0.00 0.02 0.06 0.26
Petroleum products 0.75 0.44 0.39 0.36 0.33
Average 0.41 0.22 0.21 0.21 0.29
II. Raw materials
Fertilizers, crude 0.18 0.02 0.09 0.05 0.22
Stone, sand and gravel 1.09 0.58 0.51 0.44 0.47
Sulphur,unrstd.iron pyrs 0.01 0.00 0.11 0.23 0.32
Natural abrasives, nes 0.12 0.01 0.03 0.03 0.11
Other crude minerals 0.41 0.24 0.11 0.12 0.26
Iron ore, concentrates 0.70 1.46 1.02 0.70 0.11
Ferrous waste and scrap 0.20 0.21 0.92 1.00 0.92
Copper ores,concentrates 14.41 1.26 0.31 1.18 2.85
Non-ferrous waste,scrap 1.44 1.22 1.02 0.55 0.61
Prec.metal ores,conctrts 31.11 5.28 1.35 2.57 4.36
Uranium,thorium ores,etc 0.00 0.00 0.00 0.00 0.00
Coal,not agglomerated 0.00 0.00 0.00 0.22 0.47
Liquefied propane,butane 0.17 0.00 0.01 0.00 0.00
Natural gas 0.00 0.00 0.00 0.00 0.00
Petroleum gases, nes 26.40 3.44 0.69 2.62 2.34
Coal gas,water gas, etc. 0.00 0.00 0.00 0.00 0.00
Electric current 0.00 0.00 0.00 0.00 0.00
Silver,platinum,etc. 0.07 0.02 0.04 0.25 0.25
Copper 5.40 1.71 1.73 2.92 3.91
Nickel 0.03 0.00 0.00 0.00 0.00
Aluminium 0.02 0.03 0.01 0.01 0.02
Lead 0.03 0.02 0.06 0.17 0.52
Zinc 0.00 0.01 0.02 0.02 0.02
Tin 2.54 0.55 0.11 0.67 1.66
Radio-active materials 0.00 0.00 0.00 0.00 0.00
Misc.non-ferr.base metal 0.83 1.49 2.55 0.93 1.03
Average 3.28 0.67 0.41 0.56 0.79
III. Forest products

23
Fuel wood, wood charcoal 23.11 6.24 3.25 3.28 4.05
Wood rough,rough squared 0.01 0.00 0.00 0.00 0.00
Wood, simply worked 0.39 0.15 0.08 0.09 0.27
Cork,natural,raw;waste 0.00 0.00 0.02 0.22 0.02
Pulp and waste paper 0.79 0.36 0.34 0.44 1.03
Veneers, plywood, etc. 1.10 0.15 0.12 0.16 0.31
Wood manufactures, nes 6.62 2.15 1.45 9.51 27.08
Cork manufactures 0.01 0.01 0.00 0.00 0.00
Paper and paperboard 0.03 0.09 0.15 0.20 0.27
Paper,paperboard,cut etc 0.67 0.25 0.14 0.30 0.68
Average 3.27 0.94 0.55 1.42 3.37
IV. Tropical agriculture
Fruit,nuts excl.oil nuts 7.12 2.56 2.75 2.86 5.67
Fruit,preserved,prepared 12.04 4.19 4.07 4.55 7.22
Vegetables 0.46 0.25 0.20 0.12 0.22
Vegtables,prpd,prsvd,nes 0.42 0.06 0.06 0.05 0.10
Sugars,molasses,honey 4.63 1.37 0.86 0.93 3.57
Sugar confectionery 1.50 0.77 0.86 1.45 2.46
Coffee,coffee substitute 0.30 0.04 0.08 0.04 0.02
Cocoa 2.56 0.54 0.21 0.07 0.14
Chocolate,oth.cocoa prep 0.04 0.07 0.04 0.03 0.03
Tea and mate 0.00 0.02 0.05 0.19 0.23
Spices 0.06 0.02 0.13 0.03 0.10
Non-alcohol.beverage,nes 0.45 0.09 0.12 0.31 0.87
Alcoholic beverages 0.17 0.06 0.15 0.13 0.19
Natural rubber, etc. 1.30 0.73 0.81 0.67 0.86
Synthetic rubber, etc. 0.02 0.01 0.02 0.02 0.01
Average 2.07 0.72 0.69 0.76 1.45
V. Animal products
Live animals 0.12 0.04 0.06 0.06 0.13
Bovine meat 0.00 0.00 0.00 0.00 0.00
Other meat, meat offal 0.01 0.00 0.01 0.08 0.27
Meat,ed.offl,dry,slt,smk 0.00 0.00 0.01 0.03 0.01
Meat,offl.prpd,prsvd,nes 0.01 0.02 0.03 0.16 0.36
Milk and cream 0.03 0.05 0.63 1.06 1.82
Butter,other fat of milk 0.00 0.01 0.00 0.00 0.01
Cheese and curd 0.01 0.01 0.01 0.03 0.05
Eggs,birds,yolks,albumin 0.01 0.01 0.04 0.00 0.00
Fish,fresh,chilled,frozn 1.53 0.82 0.62 0.91 1.29
Fish etc.prepd,prsvd.nes 8.28 2.36 1.93 3.41 4.83
Hides,skins(ex.furs),raw 0.02 0.02 0.07 0.07 0.04
Furskins, raw 0.00 0.00 0.00 0.00 0.00
Crude animal materls.nes 0.80 0.19 0.18 0.11 0.20
Crude veg.materials, nes 1.97 1.14 0.89 1.04 3.48
Animal,veg.fats,oils,nes 1.81 0.80 1.10 0.82 0.84
Average 0.91 0.34 0.35 0.49 0.83
VI. Cereals, etc
Wheat, meslin, unmilled 0.00 0.00 0.00 0.00 0.00
Rice 0.23 0.00 0.00 0.02 0.04
Maize unmilled 0.07 0.03 0.00 0.01 0.00
Other cereals, unmilled 0.00 0.08 0.00 0.00 0.00
Meal,flour of wheat,msln 0.00 0.00 0.11 0.38 0.59
Other cereal meal,flours 0.02 0.02 0.02 0.02 0.04
Cereal preparations 0.46 0.35 0.41 0.55 0.95
Animal feed stuff 1.51 0.40 0.27 0.31 0.38

24
Margarine and shortening 0.29 0.04 0.03 0.04 0.10
Edible prod.preprtns,nes 0.81 0.41 0.53 0.60 0.97
Tobacco, unmanufactured 2.44 0.89 0.72 1.83 4.71
Tobacco, manufactured 0.37 0.13 0.73 1.48 3.57
Oilseed(sft.fix veg.oil) 0.05 0.00 0.00 0.00 0.00
Silk 0.06 0.00 0.00 0.00 0.00
Wool, other animal hair 0.00 0.00 0.00 0.00 0.05
Cotton 0.00 0.00 0.01 0.02 0.00
Jute,oth.textl.bast fibr 0.00 0.00 0.00 0.01 0.02
Vegetable textile fibres 24.28 9.24 3.68 6.60 7.56
Synthetic fibres 0.24 0.01 0.02 0.05 0.01
Worn clothing,textl.artl 0.66 0.43 1.00 1.18 0.63
Animal oils and fats 0.27 0.00 0.02 0.07 0.08
Fixed veg.fat,oils, soft 0.00 0.01 0.02 0.00 0.00
Fixed veg.fat,oils,other 41.53 13.04 9.69 7.95 11.28
Average 3.19 1.09 0.75 0.92 1.35
VII. Labor intensive
Lime,cement,constr.matrl 0.39 0.25 0.61 0.55 0.54
Clay,refrct.constr.matrl 0.11 0.03 0.04 0.03 0.04
Mineral manufactures,nes 0.15 0.08 0.15 0.29 0.49
Glass 0.85 0.47 1.07 1.05 0.55
Glassware 0.27 0.23 0.14 0.26 0.34
Pottery 4.49 1.95 1.02 0.76 0.37
Pearls,precious stones 0.08 0.07 0.06 0.05 0.05
Furniture,cushions,etc. 2.72 1.15 0.77 0.44 0.45
Trunk,suit-cases,bag,etc 3.89 3.79 1.95 0.83 0.34
Mens,boys clothng,x-knit 3.03 2.48 2.00 1.91 0.93
Women,girl clothng,xknit 3.34 3.09 3.01 1.76 2.34
Mens,boys clothing,knit 9.30 5.48 3.45 2.04 2.71
Women,girls clothng.knit 5.21 2.53 2.37 3.52 2.87
Othr.textile apparel,nes 5.45 2.29 1.48 1.26 1.03
Clothing accessrs,fabric 1.53 0.88 0.66 0.52 0.58
Clothng,nontxtl;headgear 1.62 1.24 0.57 0.21 0.24
Footwear 2.03 0.64 0.18 0.08 0.05
Musical instruments,etc. 0.14 0.09 0.26 0.02 0.01
Printed matter 0.07 0.06 0.07 0.19 0.14
Articles,nes,of plastics 0.61 0.44 0.38 0.41 0.57
Baby carriage,toys,games 3.65 1.38 0.84 0.71 0.98
Office,stationery suppls 0.17 0.18 0.03 0.04 0.07
Works of art,antique etc 0.03 0.04 0.04 0.06 0.02
Gold,silverware,jewl nes 1.20 0.24 0.38 0.31 0.27
Misc manufctrd goods nes 7.07 1.77 0.99 0.64 0.93
Coin nongold noncurrent 0.02 6.22 0.48 0.20 0.04
Average 2.21 1.43 0.88 0.70 0.65
VIII. Capital intensive
Leather 0.06 0.08 0.03 0.03 0.07
Manufact.leather etc.nes 0.68 0.51 0.17 0.13 0.61
Furskins,tanned,dressed 0.02 0.00 0.02 0.54 1.50
Materials of rubber 0.12 0.06 0.06 0.04 0.07
Articles of rubber, nes 0.33 0.34 0.36 0.48 0.75
Textile yarn 0.61 0.33 0.28 0.22 0.29
Cotton fabrics, woven 0.10 0.07 0.22 0.11 0.02
Fabrics,man-made fibres 0.20 0.28 0.27 0.07 0.08

25
Oth.textile fabric,woven 0.04 0.08 0.07 0.05 0.07
Tulle,lace,embroidry.etc 1.95 0.93 1.08 1.22 1.71
Special yarn,txtl.fabric 0.60 0.29 0.37 0.28 0.43
Textile articles nes 1.64 1.04 0.50 0.34 0.36
Floor coverings, etc. 0.23 0.10 0.10 0.08 0.11
Pig iron,spiegeleisn,etc 0.87 0.09 0.00 0.01 0.02
Ingots etc.iron or steel 0.03 0.00 0.00 0.03 0.19
Flat-rolled iron etc. 0.18 0.08 0.01 0.26 0.01
Iron,stl.bar,shapes etc. 0.03 0.03 0.01 0.01 0.01
Railway track iron,steel 0.00 0.01 0.00 0.01 0.00
Wire of iron or steel 0.00 0.01 0.01 0.01 0.00
Tubes,pipes,etc.iron,stl 0.48 0.16 0.08 0.20 0.68
Manufacts.base metal,nes 0.25 0.23 0.20 0.27 0.50
Metallic structures nes 0.59 0.35 0.18 0.19 0.15
Containers,storage,trnsp 0.09 0.20 0.16 0.22 0.37
Wire products excl.elect 0.03 0.07 0.06 0.04 0.03
Nails,screws,nuts,etc. 0.19 0.21 0.09 0.69 1.33
Tools 0.06 0.11 0.12 0.07 0.07
Cutlery 0.41 0.16 0.07 0.01 0.00
Household equipment,nes 0.89 0.56 0.38 0.19 0.25
Manufacts.base metal,nes 0.25 0.23 0.20 0.27 0.50
Plumbng,sanitry,eqpt.etc 0.55 0.34 0.53 0.92 0.19
Average 0.38 0.23 0.19 0.23 0.34
IX. Machinery
Steam gener.boilers,etc. 0.56 0.63 0.50 0.32 0.04
Agric.machines,ex.tractr 0.01 0.01 0.03 0.00 0.00
Office machines 0.01 0.39 1.27 0.63 0.09
Metal removal work tools 0.01 0.23 0.04 0.02 0.04
Mach-tools,metal-working 0.03 0.08 0.09 0.04 0.04
Civil engineering equipt 0.03 0.15 0.16 0.10 0.11
Elect power machny.parts 0.75 0.47 0.57 4.43 6.20
Electr distribt.eqpt nes 6.84 2.90 2.84 2.96 4.61
Television receivers etc 0.72 0.83 0.26 0.04 0.00
Radio-broadcast receiver 2.33 1.05 1.32 1.12 1.26
Dom.elec,non-elec.equipt 0.46 0.18 0.09 0.06 0.07
Electro-medcl,xray equip 0.00 0.00 0.01 0.09 0.26
Transistors,valves,etc. 4.62 10.12 11.39 11.75 7.50
Electric.mach.appart.nes 0.28 0.22 1.83 2.21 0.49
Pass.motor vehcls.ex.bus 0.00 0.00 0.05 0.05 0.05
Goods,spcl transport veh 0.00 0.00 0.01 0.00 0.03
Road motor vehicles nes 0.04 0.04 0.00 0.00 0.00
Parts,tractors,motor veh 0.49 0.54 1.02 1.58 2.33
Cycles,motorcycles etc. 0.42 0.51 0.54 0.42 0.58
Aircraft,assoctd.equipnt 0.01 0.05 0.29 0.49 0.01
Ship,boat,float.structrs 0.01 0.25 0.24 0.36 1.34
Optical instruments,nes 0.68 0.65 0.27 0.07 0.08
Medical instruments nes 0.10 0.12 0.11 0.27 0.71
Photo.cinematogrph.suppl 0.01 0.01 0.00 0.02 0.04
Cine.film exposd.develpd 8.78 2.19 0.02 0.01 0.02
Watches and clocks 0.39 1.46 1.72 0.51 0.04
Arms and ammunition 0.22 0.11 0.20 0.35 0.82
Average 1.03 0.86 0.92 1.03 0.99
X. Chemicals

26
Hydrocarbons,nes,derivts 0.01 0.00 0.00 0.19 1.05
Alcohol,phenol,etc.deriv 1.92 0.60 0.52 1.07 2.09
Carboxylic acids,derivts 0.10 0.02 0.02 0.01 0.01
Nitrogen-funct.compounds 0.07 0.01 0.01 0.01 0.00
Organo-inorganic compnds 0.00 0.00 0.00 0.00 0.00
Other organic chemicals 0.02 0.01 0.01 0.01 0.01
Inorganic chem.elements 0.67 0.25 0.21 0.33 0.55
Metal.salts,inorgan.acid 0.07 0.12 0.27 3.93 8.33
Other chemical compounds 0.35 0.09 0.02 0.01 0.02
Radio-active materials 0.00 0.00 0.00 0.00 0.00
Residual petrol.products 0.04 0.02 0.00 0.24 1.20
Synth.colours,lakes,etc. 0.08 0.04 0.03 0.02 0.01
Dyeing,tanning materials 0.19 0.07 0.06 0.11 0.12
Pigments, paints, etc. 0.11 0.06 0.11 0.09 0.08
Medicines,etc.exc.grp 542 0.04 0.05 0.02 0.01 0.00
Medicaments 0.16 0.06 0.03 0.03 0.06
Essntl.oil,perfume,flavr 0.12 0.07 0.08 0.11 0.14
Perfumery,cosmetics,etc. 0.24 0.11 0.15 0.34 0.58
Soap,cleaners,polish,etc 0.96 0.35 0.34 0.84 2.09
Fertilizer,except grp272 3.81 0.92 0.69 0.54 1.07
Explosives,pyrotechnics 2.16 0.83 0.42 0.70 0.58
Polymers of ethylene 0.01 0.05 0.02 0.26 0.55
Polymers of styrene 0.14 0.03 0.04 0.02 0.02
Polymers,vinyl chloride 0.01 0.06 0.19 0.23 0.36
Polyacetal,polycarbonate 0.08 0.02 0.06 0.07 0.13
Oth.plastic,primary form 0.13 0.07 0.07 0.04 0.04
Insecticides, etc. 0.10 0.09 0.05 0.04 0.19
Starches,inulin,etc. 0.04 0.08 0.08 0.11 0.23
Explosives,pyrotechnics 2.16 0.83 0.42 0.70 0.58
Preprd additives,liquids 0.06 0.02 0.02 0.07 0.01
Misc.chemical prodts.nes 0.57 0.21 0.16 0.13 0.19
Average 0.41 0.14 0.12 0.32 0.66
For these product groups, the number of sectors with RCAs>1 declined from six (6)
out of ten (10) sectors in 1991-1995 to only two sectors (2) in 1996-2000, one (1) in 2001-2005
and two (2) in the most recent period, 2006-2010. During 1991-1995, the Philippines had a
comparative advantage in a wide range of product groups such as raw materials, forest products,
tropical products, cereals and other related products, labor intensive and machinery. In the next
period 1996-2000, however, our comparative advantage seemed to have disappeared as the
number of sectors with comparative advantage was confined only two product groups, cereals
and labor-intensive products. The same trend was evident in the succeeding periods, in 2001-
2002, our comparative advantage was demonstrated only in tropical products and in 2006-2010,
forest and machinery products.

27
5) Size Structure
In 2006, micro enterprises dominated the economy accounting for 92% of the total
while small and medium enterprises (SMEs) accounted for only 7.04 % (Table 11).9 Since
2003, the total number of enterprises has fallen from 839,114 to 783,165 in 2006. In terms of
employment contribution, micro and large enterprises registered the same employment share
of 33% in 2006 while SMEs recorded a share of 34%.
Within manufacturing, micro enterprises accounted for 89.5% of total establishments
while SMEs recorded a share of 9.7% (Table 12). Accounting for only 0.8% of total enterprises,
large firms contributed the highest share of employment at 53%. SMEs contributed 28% and
micro enterprises 19%. Medium size enterprises constitute a small share not only of the SME
sector but also of the overall manufacturing and total Philippine industry structure, such that
the country’s industrial structure has remained “hollow”. Lack of new medium-sized entrants
may indicate that large incumbent firms do not face credible threat of potential competition.
SMEs have continued to face competitiveness problems along with difficulties in finance and
market access.
Table 11: Total Number of Enterprises and Employees in the Philippines
Number of Enterprises
Year Micro % Small % Medium % Large % Total
1995 449950 91 39848 8 2712 1 2447 0.5 495057
2000 747740 91 67166 8 3070 0.4 2984 0.4 821060
2003 762573 91 69175 8 3521 0.4 3745 0.4 839114
2006 720191 92 57439 7 2839 0.4 2596 0.3 783165
Number of Employees
Year Micro % Small % Medium % Large % Total
1995 1345175 31 945401 22 366890 8 1664076 39 4321603
2000 2165100 37 1522227 26 416686 7 1798173 30 5902256
2003 2214278 34 1556206 24 485891 8 2218419 34 6474860
2006 1667824 33 1279018 26 381013 8 1657028 33 4984950
Source: National Statistics Office
Table 12: Total Number of Enterprises and Employees in the Manufacturing Industry
Number of Enterprises
Year Micro % Small % Medium % Large % Total
1995 86900 88.8 8928 9.1 1027 1.0 982 1.0 97837
2000 108998 86.9 14121 11.3 1110 0.9 1238 1.0 125467
2003 107398 88.6 11910 9.8 853 0.7 1024 0.8 121184
2006 105083 89.5 10274 8.8 1004 0.9 985 0.8 117346
Number of Employees
Year Micro % Small % Medium % Large % Total
1995 271699 22.0 227949 18.0 137384 11.0 615874 49 1252906
9 Micro enterprises have from 1-9 employees. Small enterprises are defined as having 10-99 employees;
medium as having 100-199 employees; and large as having over 200 employees (The National Statistics
Office and Small and Medium Enterprise Development Council Resolution No. 1, Series 2003).
28
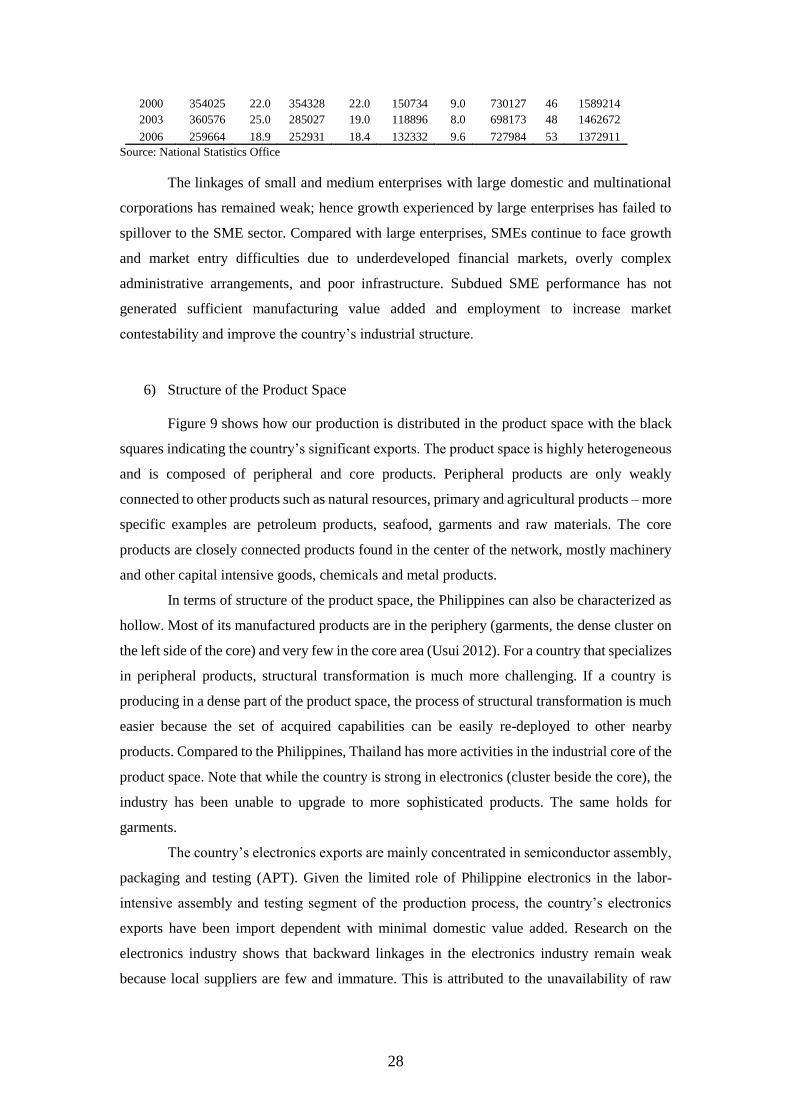
2000 354025 22.0 354328 22.0 150734 9.0 730127 46 1589214
2003 360576 25.0 285027 19.0 118896 8.0 698173 48 1462672
2006 259664 18.9 252931 18.4 132332 9.6 727984 53 1372911
Source: National Statistics Office
The linkages of small and medium enterprises with large domestic and multinational
corporations has remained weak; hence growth experienced by large enterprises has failed to
spillover to the SME sector. Compared with large enterprises, SMEs continue to face growth
and market entry difficulties due to underdeveloped financial markets, overly complex
administrative arrangements, and poor infrastructure. Subdued SME performance has not
generated sufficient manufacturing value added and employment to increase market
contestability and improve the country’s industrial structure.
6) Structure of the Product Space
Figure 9 shows how our production is distributed in the product space with the black
squares indicating the country’s significant exports. The product space is highly heterogeneous
and is composed of peripheral and core products. Peripheral products are only weakly
connected to other products such as natural resources, primary and agricultural products – more
specific examples are petroleum products, seafood, garments and raw materials. The core
products are closely connected products found in the center of the network, mostly machinery
and other capital intensive goods, chemicals and metal products.
In terms of structure of the product space, the Philippines can also be characterized as
hollow. Most of its manufactured products are in the periphery (garments, the dense cluster on
the left side of the core) and very few in the core area (Usui 2012). For a country that specializes
in peripheral products, structural transformation is much more challenging. If a country is
producing in a dense part of the product space, the process of structural transformation is much
easier because the set of acquired capabilities can be easily re-deployed to other nearby
products. Compared to the Philippines, Thailand has more activities in the industrial core of the
product space. Note that while the country is strong in electronics (cluster beside the core), the
industry has been unable to upgrade to more sophisticated products. The same holds for
garments.
The country’s electronics exports are mainly concentrated in semiconductor assembly,
packaging and testing (APT). Given the limited role of Philippine electronics in the labor-
intensive assembly and testing segment of the production process, the country’s electronics
exports have been import dependent with minimal domestic value added. Research on the
electronics industry shows that backward linkages in the electronics industry remain weak
because local suppliers are few and immature. This is attributed to the unavailability of raw

29
materials, difficulty of finding local suppliers, unreliability of local suppliers, high cost of local
raw materials, and failure to meet required quality standards.
Since the 1990s, the garments sector also face the same problems of limited linkages
and weak competitiveness. The lack of locally sourced quality raw materials and dependency
on imported raw materials such as fabrics and accessories from China, Taiwan, Hong Kong,
and India resulted in longer lead times. Note that the Philippines does not have an integrated
textile industry that can support the requirements of the garments industry.10 Other problems
that negatively affected industry competitiveness included the high cost of labor and power,
slow productivity growth due to lack (decline) of investments. Given the lack of design
capabilities and minimal linkages between local designers and manufacturers, the industry was
not able to move up the value chain and engage in original brand manufacturing activity. As of
2008, garments exports accounted for only 5% of total exports in contrast to its 21% share in
1988.
7) Foreign Direct Investment
FDI inflows from the 1970s to the 1980s were small and erratic, due mainly to the
political and economic instability that characterized the country in these decades (see Figure
10 In the absence of an integrated textile industry, textile millers also faced difficulties sourcing their raw materials importing about 80 percent of their input requirements like polyester fiber, cotton, rayon, and acrylic.
Figure 9: Philippine Product Space and Thailand as Comparator
Thailand Philippines
Garments Core Electronics Source: Usui (2012)
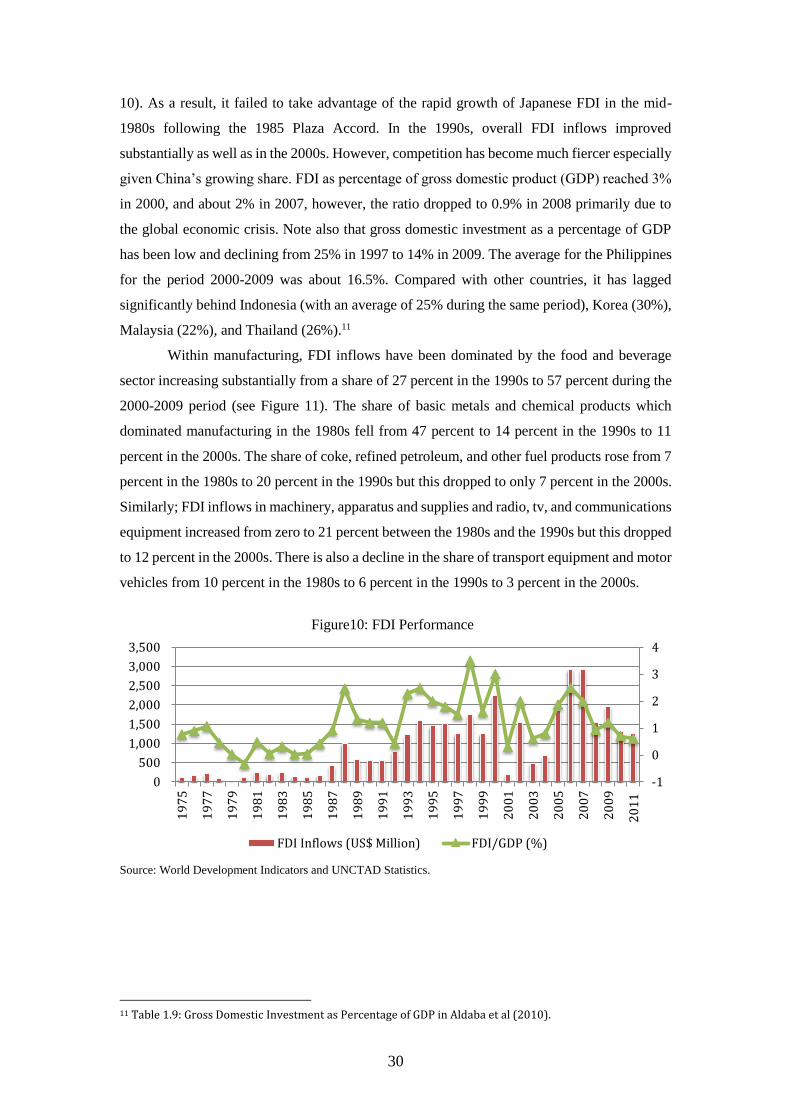
30
10). As a result, it failed to take advantage of the rapid growth of Japanese FDI in the mid-
1980s following the 1985 Plaza Accord. In the 1990s, overall FDI inflows improved
substantially as well as in the 2000s. However, competition has become much fiercer especially
given China’s growing share. FDI as percentage of gross domestic product (GDP) reached 3%
in 2000, and about 2% in 2007, however, the ratio dropped to 0.9% in 2008 primarily due to
the global economic crisis. Note also that gross domestic investment as a percentage of GDP
has been low and declining from 25% in 1997 to 14% in 2009. The average for the Philippines
for the period 2000-2009 was about 16.5%. Compared with other countries, it has lagged
significantly behind Indonesia (with an average of 25% during the same period), Korea (30%),
Malaysia (22%), and Thailand (26%).11
Within manufacturing, FDI inflows have been dominated by the food and beverage
sector increasing substantially from a share of 27 percent in the 1990s to 57 percent during the
2000-2009 period (see Figure 11). The share of basic metals and chemical products which
dominated manufacturing in the 1980s fell from 47 percent to 14 percent in the 1990s to 11
percent in the 2000s. The share of coke, refined petroleum, and other fuel products rose from 7
percent in the 1980s to 20 percent in the 1990s but this dropped to only 7 percent in the 2000s.
Similarly; FDI inflows in machinery, apparatus and supplies and radio, tv, and communications
equipment increased from zero to 21 percent between the 1980s and the 1990s but this dropped
to 12 percent in the 2000s. There is also a decline in the share of transport equipment and motor
vehicles from 10 percent in the 1980s to 6 percent in the 1990s to 3 percent in the 2000s.
Figure10: FDI Performance
Source: World Development Indicators and UNCTAD Statistics.
11 Table 1.9: Gross Domestic Investment as Percentage of GDP in Aldaba et al (2010).
-1
0
1
2
3
4
0
500
1,000
1,500
2,000
2,500
3,000
3,500
19
75
19
77
19
79
19
81
19
83
19
85
19
87
19
89
19
91
19
93
19
95
19
97
19
99
20
01
20
03
20
05
20
07
20
09
20
11
FDI Inflows (US$ Million) FDI/GDP (%)

31
Figure 11: Distribution of Manufacturing FDI (in %)
Source of basic data: Bangko Sentral ng Pilipinas (BSP)
Figure 12: FDI by source country (in percent)
Source: Bangko Sentral ng Pilipinas (BSP).
Figure 13: FDI Inflows to ASEAN 6 (in million US$)
Source: UNCTAD FDI Database.
Up to the 1980s, the US was the country’s largest source of FDI inflows with a
cumulative share of 60 percent (see Figure 12). However, this dropped significantly to only 15
percent in the 1990s but increased to 17 percent in the 2000s. US dominance has been
substantially diluted by the increasing presence of Japan, UK, and Singapore. Japan’s share
increased from 15 percent in the 1980s to 27 percent in the 1990s, although this fell to 17
0
10
20
30
40
50
60
70
1980-89 1990-99 2000-2009
Basic Metals & Chemicals
Coke, Refined Petroleum andOther Fuel Products
Food Products and Beverages
Transport & Motor vehicles
Mach, App, Suppl.& Radio, TV &Communications eqipment
0
10
20
30
40
50
60
1982-1989 1990-1999 2000-2011
U.S.A.
Japan
Netherlands
Hongkong
U.K.
Singapore
-10000
0
10000
20000
30000
40000
50000
60000
70000
19
75
19
77
19
79
19
81
19
83
19
85
19
87
19
89
19
91
19
93
19
95
19
97
19
99
20
01
20
03
20
05
20
07
20
09
20
11
Indonesia
Malaysia
Philippines
Singapore
Thailand
Viet Nam

32
percent in the 2000s. Singapore increased its share from less than one percent during the 1980s
to four percent in the 1990s and to 9 percent in the recent period. The share of the Netherlands
rose from six percent to 11 percent, but declined to just 2.5 percent in 2000-2008. In addition,
during 2009 to 2011, Netherlands had negative inflows to the country. The share of the UK, on
the other hand, went up from 3 percent in the 1980s to around 6 percent in the 1990s and 2000s.
While the investment policy reforms and opening up of more sectors to foreign
investors in the past decade resulted in improvements in FDI inflows to the country, on the
overall, FDI inflows to the Philippines have been limited; hence the country’s performance has
lagged behind its neighbors in Southeast Asia. Figure 13 compares FDI inflows to the
Philippines with inflows to Singapore, Thailand, Malaysia, Indonesia, and Vietnam from the
mid-1970s up to 2011. The figure shows that huge differences are evident in FDI inflows to
the ASEAN 6 countries with the Philippines receiving the lowest level of FDI inflows
particularly in the 1990s and the 2000s.
Figure 14: FDI Stock in ASEAN 6 (in billion US$)
Source: UNCTAD FDI Database.
Figure 15: FDI as Percentage of GDP
Source of basic data: World Development Indicators, 2012
0
100
200
300
400
500
600
Indonesia Malaysia Philippines Singapore Thailand Viet Nam
1990 1995 2000 2005 2010 2011
-4.0
-2.0
0.0
2.0
4.0
6.0
8.0
10.0
12.0
1995199619971998199920002001200220032004200520062007200820092010
Philippines Cambodia Indonesia
Malaysia Thailand Viet Nam

33
Figure 14 presents the FDI stock in the ASEAN countries. In 1990, cumulative FDI
inflows to the Philippines amounted to US$ 4.5 billion while Vietnam registered a total of US$
1.65 billion. In 2000, Vietnam surpassed the Philippines total of US$18.2 billion as its total
FDI reached US$20.6 billion. In 2011, Vietnam soared to US$73 billion while the Philippine
total barely increased at US$28 billion.
In terms of FDI as percentage of GDP, the Philippines along with Indonesia have been
lagging in the ASEAN region. In the Philippines, the indicator showed a slight increase from
2% in 1995 to 3% in 2000 and 2.5% in 2006 but it then dropped to 2% again in 2007 until it
reached just 0.9% in 2010. Indonesia dropped substantially from 2.2% in 1995 to -2.8% in 2000
but increased to 1.6% in 2007. In 2010, Singapore registered 18.5%, Cambodia 7%, Indonesia
1.9%, Malaysia 4%, Thailand 2%, while the Philippines posted 1%.
B. Business Environment
Table 13 presents three sets of competitiveness indicators: global competitiveness,
macro environment, and public institutions indices along with the rankings of the Philippines
and other Southeast Asian countries out of a total of 102, 133, and 144 countries for the years
2004, 2009, and 2012 respectively. The macro environment index is based on macroeconomic
stability, country credit risk, and wastage in government expenditures while the public
institutions index is based on measures of the enforcement of contracts and law and degree of
competition. The results show that the Philippines performed substantially poorly than
Malaysia, Thailand, and Indonesia in 2009 and although still lagging in 2012 it improved
considerably in the rankings. Public institutions index worsened for the Philippines in 2009 but
improved substantially in 2012. Overall, the Philippine ranking improved from 71 (out of 133
countries) in 2009 to 65 (out of 144 countries) in 2012.
Table 13: Competitiveness Indicators Rankings for Selected Southeast Asian Countries
Global Competitiveness
Index
Macro Environment
Index
Public Institution
Index
2004 2009 2012 2004 2009 2012 2004 2009 2012
Malaysia 29 21 25 27 38 35 34 30 29
Thailand 32 34 38 26 41 27 37 57 77
Philippines 66 71 65 60 53 36 85 105 94
Indonesia 72 54 50 64 52 25 76 68 72
Source: World Economic Forum, Global Competitiveness Report, 2003-2004, 2008-2009 and 2012-2013.
Based on the World Bank’s cost of doing business, Table 14 shows a comparison of
the business costs indicators for the Philippines and its East Asian neighbors. The table reveals
that in general, the Philippines, along with Indonesia, performed significantly below the other
East Asian countries in terms of corruption-related indicators. Across time, improvements are
observed for time to start a business and time to enforce a contract for the Philippines. For
instance, number of days to start a business which is 60 days in 2004 was reduced to 52 in 2009
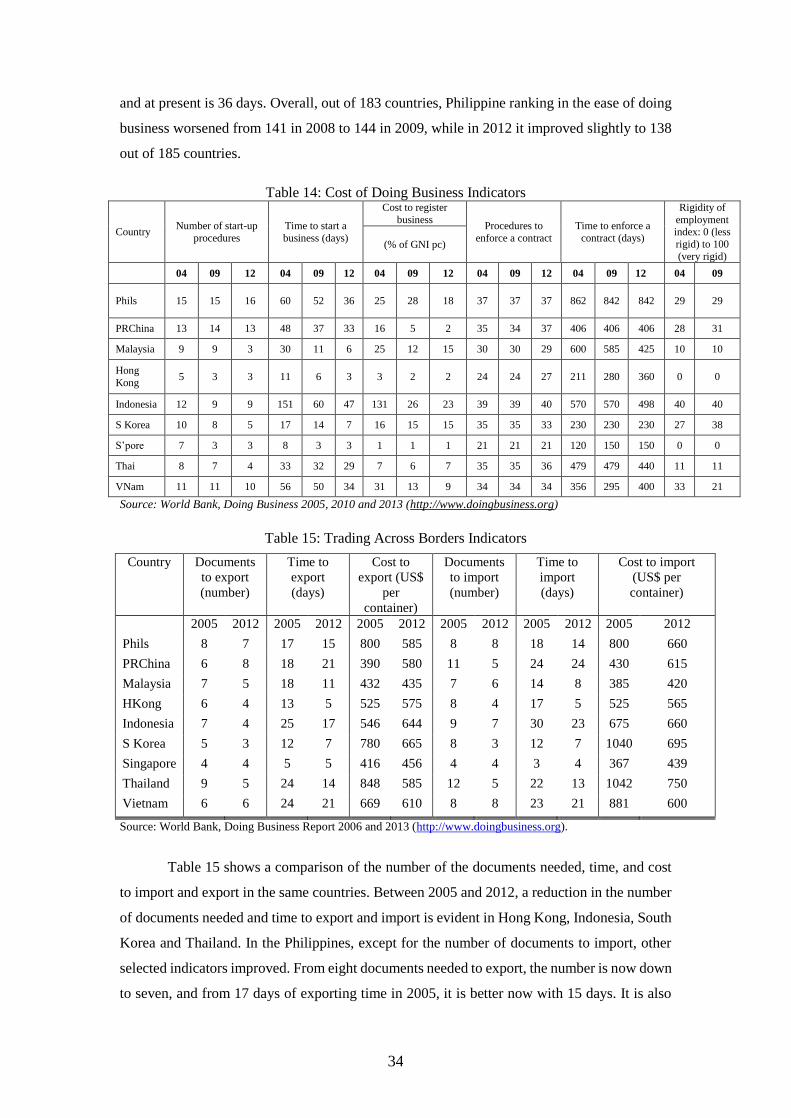
34
and at present is 36 days. Overall, out of 183 countries, Philippine ranking in the ease of doing
business worsened from 141 in 2008 to 144 in 2009, while in 2012 it improved slightly to 138
out of 185 countries.
Table 14: Cost of Doing Business Indicators
Country Number of start-up
procedures
Time to start a
business (days)
Cost to register
business Procedures to
enforce a contract
Time to enforce a
contract (days)
Rigidity of
employment index: 0 (less
rigid) to 100
(very rigid) (% of GNI pc)
04 09 12 04 09 12 04 09 12 04 09 12 04 09 12 04 09
Phils 15 15 16 60 52 36 25 28 18 37 37 37 862 842 842 29 29
PRChina 13 14 13 48 37 33 16 5 2 35 34 37 406 406 406 28 31
Malaysia 9 9 3 30 11 6 25 12 15 30 30 29 600 585 425 10 10
Hong
Kong 5 3 3 11 6 3 3 2 2 24 24 27 211 280 360 0 0
Indonesia 12 9 9 151 60 47 131 26 23 39 39 40 570 570 498 40 40
S Korea 10 8 5 17 14 7 16 15 15 35 35 33 230 230 230 27 38
S’pore 7 3 3 8 3 3 1 1 1 21 21 21 120 150 150 0 0
Thai 8 7 4 33 32 29 7 6 7 35 35 36 479 479 440 11 11
VNam 11 11 10 56 50 34 31 13 9 34 34 34 356 295 400 33 21
Source: World Bank, Doing Business 2005, 2010 and 2013 (http://www.doingbusiness.org)
Table 15: Trading Across Borders Indicators
Source: World Bank, Doing Business Report 2006 and 2013 (http://www.doingbusiness.org).
Table 15 shows a comparison of the number of the documents needed, time, and cost
to import and export in the same countries. Between 2005 and 2012, a reduction in the number
of documents needed and time to export and import is evident in Hong Kong, Indonesia, South
Korea and Thailand. In the Philippines, except for the number of documents to import, other
selected indicators improved. From eight documents needed to export, the number is now down
to seven, and from 17 days of exporting time in 2005, it is better now with 15 days. It is also
Country Documents
to export
(number)
Time to
export
(days)
Cost to
export (US$
per
container)
Documents
to import
(number)
Time to
import
(days)
Cost to import
(US$ per
container)
2005 2012 2005 2012 2005 2012 2005 2012 2005 2012 2005 2012
Phils 8 7 17 15 800 585 8 8 18 14 800 660
PRChina 6 8 18 21 390 580 11 5 24 24 430 615
Malaysia 7 5 18 11 432 435 7 6 14 8 385 420
HKong 6 4 13 5 525 575 8 4 17 5 525 565
Indonesia 7 4 25 17 546 644 9 7 30 23 675 660
S Korea 5 3 12 7 780 665 8 3 12 7 1040 695
Singapore 4 4 5 5 416 456 4 4 3 4 367 439
Thailand 9 5 24 14 848 585 12 5 22 13 1042 750
Vietnam 6 6 24 21 669 610 8 8 23 21 881 600

35
faster by four days to import now compared in 2005. In terms of cost to export, the Philippines
has still one of the highest costs at US$585 per container at present, only lower than Indonesia,
South Korea and Vietnam. Cost to import is still high but the country is lower compared to
South Korea and Thailand.
III. Overall Framework and the Need for a New Industrial Policy
A. Philippine Trade Liberalization Experience: What has happened and Where Do
We Go From Here?
1. Trade Policy Reforms in the Philippines
After more than three decades of protectionism and import substitution from the 1950s
up to the 1970s, the government started to liberalize the trade regime by removing tariff and
non-tariff barriers in the 1980s. In 1982, the country’s first tariff reform program (TRP 1)
substantially reduced the average nominal tariff and the high rate of effective protection that
characterized our industrial structure. TRP I also reduced the number of regulated products with
the removal of import restrictions on 1,332 product lines between 1986 and 1989.
In 1991, the second phase of the tariff reform program (TRP II) further narrowed down
the tariff range with the majority of tariff lines falling within the three to 30 percent tariff range.
It also allowed the tariffication of quantitative restrictions for 153 agricultural products and
tariff realignment for 48 commodities. As such, the number of regulated products declined to
about three percent in 1996 and by 1998, most quantitative restrictions were removed except
those for rice.
In 1995, the government initiated the third round of tariff reform (TRP III) as a first
major step in its plan to adopt a uniform five percent tariff by 2005. This further narrowed down
the tariff range for industrial products to within three and ten percent range. In June 1999,
Executive Order 63 was issued to increase the tariff rates on textiles, garments, petrochemicals,
pulp and paper, and pocket lighters and at the same time, froze tariff rates at their 2000 levels.
In 2001, another legislation (TRP IV) was passed to adjust the tariff structure towards
a uniform tariff rate of 5 percent by the year 2004. However, this was not implemented, instead,
in October and December 2003, the government issued Executive Orders 241 and 264 which
modified the tariff structure to protect selected industries. These Executive Orders restructured
tariffs such that the rates on products that were not locally produced were made as low as
possible while the tariff rates on products that were locally produced were adjusted upward.
Since 2004, no major unilateral tariff changes have been made; mostly the tariff reductions
carried out were those covered by the ASEAN Free Trade Area-Common Effective Preferential
Tariff (AFTA-CEPT) scheme.
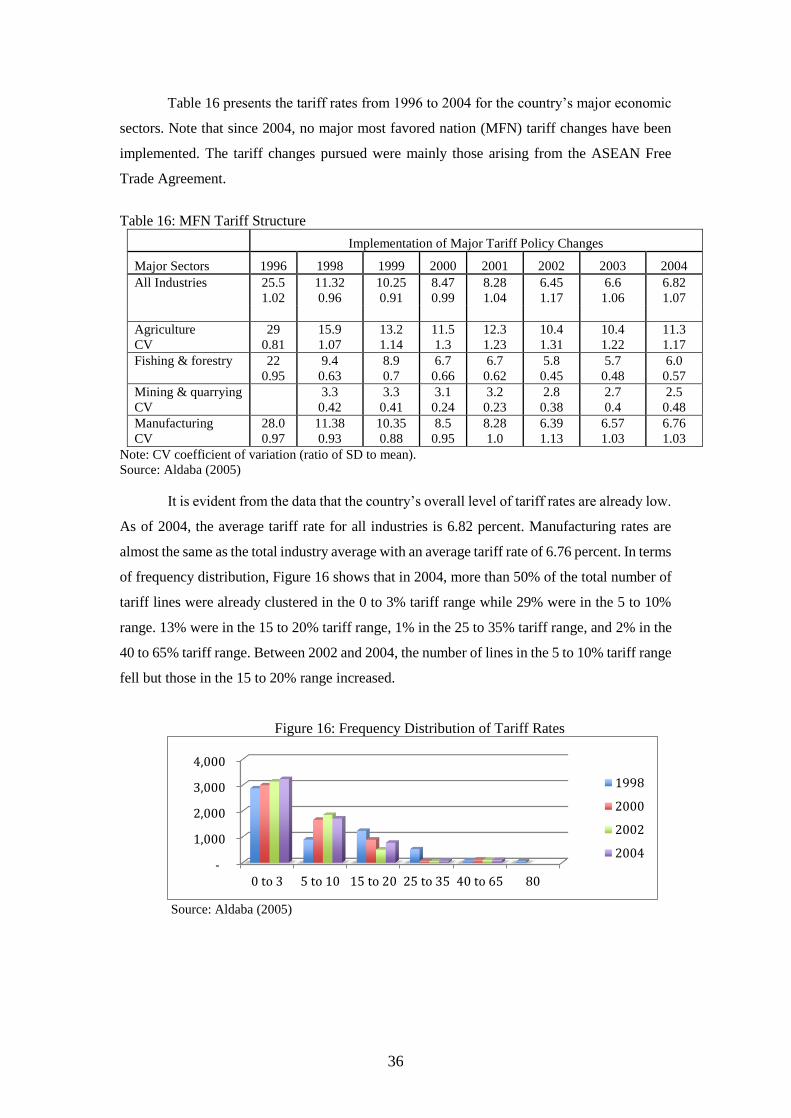
36
Table 16 presents the tariff rates from 1996 to 2004 for the country’s major economic
sectors. Note that since 2004, no major most favored nation (MFN) tariff changes have been
implemented. The tariff changes pursued were mainly those arising from the ASEAN Free
Trade Agreement.
Table 16: MFN Tariff Structure
Implementation of Major Tariff Policy Changes
Major Sectors 1996 1998 1999 2000 2001 2002 2003 2004
All Industries
25.5
1.02
11.32
0.96
10.25
0.91
8.47
0.99
8.28
1.04
6.45
1.17
6.6
1.06
6.82
1.07
Agriculture
CV
29
0.81
15.9
1.07
13.2
1.14
11.5
1.3
12.3
1.23
10.4
1.31
10.4
1.22
11.3
1.17
Fishing & forestry
22
0.95
9.4
0.63
8.9
0.7
6.7
0.66
6.7
0.62
5.8
0.45
5.7
0.48
6.0
0.57
Mining & quarrying
CV 3.3
0.42
3.3
0.41
3.1
0.24
3.2
0.23
2.8
0.38
2.7
0.4
2.5
0.48
Manufacturing
CV
28.0
0.97
11.38
0.93
10.35
0.88
8.5
0.95
8.28
1.0
6.39
1.13
6.57
1.03
6.76
1.03
Note: CV coefficient of variation (ratio of SD to mean).
Source: Aldaba (2005)
It is evident from the data that the country’s overall level of tariff rates are already low.
As of 2004, the average tariff rate for all industries is 6.82 percent. Manufacturing rates are
almost the same as the total industry average with an average tariff rate of 6.76 percent. In terms
of frequency distribution, Figure 16 shows that in 2004, more than 50% of the total number of
tariff lines were already clustered in the 0 to 3% tariff range while 29% were in the 5 to 10%
range. 13% were in the 15 to 20% tariff range, 1% in the 25 to 35% tariff range, and 2% in the
40 to 65% tariff range. Between 2002 and 2004, the number of lines in the 5 to 10% tariff range
fell but those in the 15 to 20% range increased.
Figure 16: Frequency Distribution of Tariff Rates
Source: Aldaba (2005)
-
1,000
2,000
3,000
4,000
0 to 3 5 to 10 15 to 20 25 to 35 40 to 65 80
1998
2000
2002
2004

37
Figure 17: Effective Protection Rates (1985-2004)
Source: Medalla, E (1990), Tan, E. (1995), Manasan, R. & V. Pineda (1999), and Aldaba (2005)
Compared to tariff rates, effective protection rates (EPRs)12 provide a more meaningful
indicator of the impact of the system of protection. EPRs measure the net protection received
by domestic producers from the protection of their outputs and the penalty from the protection
of their inputs. Figure 17 shows that average effective protection rates for all sectors declined
from 49% in 1985 to 36% in 1988. In 1995, this further dropped to around 25%, to 15% in 1998
and to 10.9% in 2004. For manufacturing, EPR fell from 73% in 1985 to 55% in 1988 and to
28% in 1996. This further declined to 11.4% in 2000 to about 10% in 2004. Note that with the
tariffication of agricultural tariffs in 1992 and 1996, protection shifted from manufacturing
towards agriculture. Within the manufacturing sector, the highest average level of protection
has been enjoyed by food processing
2. Failure to Industrialize and The Need for Structural Transformation
As the analysis in Part II indicated; despite the breadth and depth of market-oriented
reforms, the impact on the manufacturing industry’s growth, employment, investment, and
productivity has been limited. The overall performance of manufacturing has been weak and
there has been no structural transformation of the economy from agriculture to manufacturing,
no rapid industrial growth led by manufacturing but instead, as Fabella and Fabella (2012)
highlighted, development progeria (premature ageing) characterized the Philippine economy.
This is manifested by the rise in the share of services and fall in the share of industry and
12 EPRs are rates of protection of value added, are more meaningful than actual tariff rates and implicit
tariff rates (representing excess of domestic price of a product over its international price) since it is
value added (rather than the value of the product) that is contributed by the domestic activity being
protected. EPRs measure the net protection received by domestic producers from the protection of their
outputs and the penalty from the protection of their inputs. However, as Francois and Reinert (1997)
cited, EPRs are partial equilibrium rather than equilibrium measure. It assumes that there is no change
in technology in shifting between actual and world prices. It assumes that there is perfect substitutability
between domestic and foreign goods, whereas most modern trade models assume imperfect
substitutability or the so-called “Armington assumption”.
0
10
20
30
40
50
60
70
80
19
85
19
86
19
88
19
90
19
91
19
92
19
93
19
94
19
95
19
96
19
97
19
98
19
99
20
00
20
01
20
02
20
03
20
04
All Sectors
Agriculture
Manufacturing
Food Processing

38
manufacturing sectors. Due to industry’s lackluster growth, it was services that absorbed
workers moving out from agriculture and new entrants to the labor force.
On the average, unemployment rate was around 7.6% during the 2005-2010 period
while underemployment remained high at 20.14% during the same period. In contradiction to
major stylized facts in the trade and employment empirical literature, Philippines experience
shows that openness and trade liberalization are associated with lower wage skill premium as
domestic firms shifted their manufacturing process towards low value added activities requiring
relatively less skill intensity production.
In terms of export performance, the country’s export base has become less diversified
as manufactured exports became largely concentrated in three product groups. These consisted
of electronics, garments and textile, and machinery and transport equipment which together
accounted for around 76% of total exports in 2008. These goods are considerably dependent on
imported inputs and have weak backward and/or upward linkages with the rest of the
manufacturing industry. Trade indicators show the heavy concentration of Philippine exports
on three major products groups: electronics, garments and textiles and auto parts. Within these
major product groups, exports are highly concentrated in low value added and labor-intensive
products sectors.
The industrial structure has remained “hollow” or “missing” in the middle and medium
enterprises have never seriously challenged the large entrenched incumbents. The linkages
between SMEs and large enterprises have also remained weak. SMEs have continued to face
competitiveness problems along with difficulties in finance and market access.
Figure 18: GDP and Manufacturing Growth Rate: 1949-2012
Figure 18 presents a historical picture of GDP annual growth rate that is characterized
by a boom-bust cycle. The 1950s represented the best decade with GDP growth average of
-15.00
-10.00
-5.00
0.00
5.00
10.00
15.00
20.00
25.00
19
49
19
52
19
55
19
58
19
61
19
64
19
67
19
70
19
73
19
76
19
79
19
82
19
85
19
88
19
91
19
94
19
97
20
00
20
03
20
06
20
09
20
12
GDP growth (annual, %) Manufacturing growth (annual, %)
Importsubstitution1951-60: 9.4%1961-70: 5.7%1971-80: 5.9%
Trade liberalization1981-90: 0.9%1991-00: 2.5%
Globalization/Regional Integration:2001-10: 4.2%2011: 4.7%2012: 5.4%

39
6.2%. From the seventies to the nineties, the Philippines experienced three major crises: the
first occurred in 1984 when the GDP shrank by 7.3 % followed by another crisis in 1991 when
GDP contracted by 0.6% and again in 1998 when GDP shrank by 0.6%. The 1980s, marked as
the lost decade, witnessed the country’s average growth rate plummet to 1.7%. This placed the
Philippines significantly below its neighbors who were able to attain respectable growth rates
during the same period. While our neighboring countries registered substantial increases in the
share of industry, in the Philippines, the share of industry declined and remained stagnant in
the past two decades. The 1990s to 2000s witnessed the economy’s attempt to recover and catch
up with its neighbors.
Why has trade liberalization not led to industrialization? In understanding Philippine
industrialization from a historical perspective, de Dios and Williamson (2013) characterized
the country’s behavior as deviant. While the Philippines was among the league of leading
industrial performers during the early 1900s up to about 1940s, it started to deviate from the
group of high performing countries in the 1980s and has continued to lag behind since then.
The authors pointed out that since the 1960s the deviant behavior of the country has been
attributed to protectionist policy, political instability (coups in 1987, 1989, 1990; further
instability in 2000-2001 leading to the second EDSA Revolution; coup attempts in 2003, 2006,
2007), missed FDI opportunity (political crisis in 1984-1991 which coincided with the
relocation of Japanese companies to Southeast Asia), foreign capital dependency and two
financial crises. The authors also indicated that the real peso appreciation between 2003 and
2010 coincided with the emergence of current account surpluses arising from overseas workers’
remittances, rapid decline in manufacturing competitiveness and further losses in
manufacturing jobs. They also noted that Dutch disease caused by overseas migrant remittances
are relevant beginning in the early 1990s only. While overseas workers’ migration provided an
opportunity to those who could not be employed due to failure of manufacturing to grow in the
1980s; it has led to Dutch Disease and caused a sustained real appreciation and imposing a
penalty on tradable manufacturing by the late 2000s.
Medalla (2002) wrote that the more than two decades of trade liberalization have not
yet led to rapid industrial growth due to the slow adjustment and restructuring process within
the industry. She noted that new investments are only starting to be made in the more recent
years. This delayed response may be due to the failure of the government to implement
necessary complementary measures particularly with respect to the exchange rate. The
prolonged peso appreciation inhibited much of the potential growth from a more open
economy.
Studies on Philippine economic development by the World Bank and Asian
Development Bank have extensively discussed the constraints to growth, investment, and
employment generation in the country (World Bank, 2007; ADB, 2007). The most important

40
constraints include tight fiscal condition due to huge fiscal deficits, lack of infrastructure, and
weak investor confidence arising from governance issues like corruption and political
instability as well as the inability of the government to address market failures leading to a
small industrial base.
Aldaba (2005) noted that the shift from a highly protected and highly distorted
economic regime towards a more market-oriented has not been a smooth one for the Philippine
economy. Trade liberalization in the manufacturing industry has been a long and tedious
process with many stops and starts due to the policy reversals that took place in midstream.
Philippine experience has shown that trade liberalization does not automatically lead to a
competitive domestic market economy. While imports are effective in disciplining domestic
manufacturing firms, the government has failed to create and maintain a competitive
environment to sustain the benefits from these reforms. Coordination policies among the
government agencies tasked to implement continued liberalization and deregulation policies
along with support measures have been weak.
There was no master plan that would have guided and managed the adjustment process
as the economy tries to shift from a highly protected system to a more open one. 13 No
adjustment programs were formulated to facilitate the adjustment process as the economy shifts
from one state to another. It would have been helpful had there been accompanying policies
and programs that facilitated the movement of firms from import-substituting towards export-
oriented activities and reallocated resources that become unused as a result of the adjustment
process. Accompanying structural policy reforms such as labor market flexibility as well as
functioning capital and credit markets and policies to encourage adjustment by firms to
liberalization such as the removal of entry and exit barriers especially for SMEs were absent.
Several episodes of policy reversals that took place substantially reduced the credibility of
reforms and negatively affected private sector investment response.
Competition has also been significantly lessened by government regulatory policies,
behavioral restraints and structural characteristics of the market that acted as barriers to entry
(see WB-OECD, 1999)14. Obstacles to the entry, exit and growth of domestic firms, particularly
13 In June 1998, an Industrial Development Plan of the Philippines was formulated under the leadership
of former President Fidel Ramos. The Plan was not successfully implemented due to the changes in
political administration and the Asian financial crisis in 1998. No similar plans were drafted during the
Estrada and Arroyo administrations.
14 Regulatory barriers are barriers imposed by government policies including investment licensing, tariff
and non-tariff measures, antidumping and countervailing duties along with safeguard measures, special
permits, license to operate, regulations influencing the use of some inputs, discriminatory export
practices, exclusionary lists, and ownership restrictions.
Behavioral barriers are associated with abuse of dominant position where “relatively large” firms engage
in anti-competitive conduct by preventing entry or forcing exit of competitors through various kinds of
monopolistic conduct including predatory pricing and market foreclosure.

41
those affecting small and medium enterprises, have not been fully addressed. Many
complementary policies and institutions that are necessary to support trade reforms and
generate supply-side responses leading to employment and growth are missing. These include
“behind the border” complementary policies that define the business environment including
investment in human capital, infrastructure, and the quality of governance in the country.
The above discussions all point to the need to industrialize in order to attain a more
inclusive and sustained growth. To achieve this, we need to transform and upgrade
manufacturing and shift toward more diversified and sophisticated export products. This would
require climbing the industrial ladder and moving into higher value added sectors as sources of
production advance. To drive the demand for skilled labor and skill intensive manufacturing
processes; technological upgrading along with further upgrading of education levels, promoting
productivity growth, and increasing technological capability would be crucial.
It is in within this context that a roadmap is being formulated. It is important to identify
where to devote government’s energies and resources as well as to craft a strategy and define
priorities to upgrade industries and facilitate transformation. In the succeeding discussions, the
experiences of more successful countries and the role of markets and governments are presented
along with the necessary elements that should accompany economic transformation and the
overall growth process.
B. Role of Market Fundamentals and Government in the Growth Process
In studying the growth experiences (rapid growth with equity) of the “Four Tigers” –
Hong Kong, Korea, Singapore, and Taiwan and the three newly industrializing economies
(NIEs) of Southeast Asia – Indonesia, Malaysia, and Thailand (collectively called high
performing Asian economies or HPAEs); the World Bank’s (1993) East Asian Miracle15
highlighted two broad lessons of success in these 8 HPAEs. One, having the correct
fundamentals was essential: high levels of domestic savings, broadly based human capital, good
macroeconomic management, and limited price distortions served as the basis for growth and
means by which the gains of productivity change were realized. Important policies include
policies to assist the financial sector capture nonfinancial savings and to increase household
and corporate savings; liberal foreign direct investment and licensing policies that allowed
technology acquisition were crucial to rapid productivity growth; public investment
complemented private investment and increased its orientation to exports; and education
Structural barriers are due solely to conditions outside the control of market participants. Economies of
scale (increasing returns to scale) is an example of a structural barrier. 15 These countries have been grouped together because they had rapid, sustained growth between 1960
and 1990, which is unusual among developing countries and what is unique is they combine this rapid,
sustained growth with highly equal income distributions. They have also been characterized by rapid
demographic transitions, strong and dynamic agriculture and unusually rapid export growth.

42
policies that stressed universal primary schooling and improvements at primary and secondary
levels.
Two, careful policy interventions through subsidies, tariffs or interest rate controls;
aware of the costs of these interventions, HPAE governments generally held costs within well-
defined limits. Price distortions were mild, interest rate controls used international interest rates
as a benchmark, and explicit subsidies were kept within fiscally manageable bounds. In
assessing these policy interventions, the World Bank argued that generally these did not work
in the promotion of specific industries and therefore holds little promise for developing
countries. As a guiding principle for interventions attempting to guide resource allocation to
succeed, they must address market failures such as coordination failures which can lead markets
to fail especially in the early stages of development. Otherwise, markets would perform the
allocation function more efficiently. Some of these interventions contributed to the
extraordinary growth of Japan, Korea, and Taiwan because of their highly unusual historical
and institutional circumstances. They were successful than most in combining the benefits of
economic cooperation with the benefits of vigorous competition. They did this by creating
contests with exports as the yardstick of success, with subsidized credit and other government-
controlled favors as prizes and with government officials as competent and usually honest
referees. In other economies, similar interventions have failed because governments offered
incentives without a clear link to economic performance and strong institutional support.
Export-push strategies have been by far the most successful combination of
fundamentals and policy interventions and hold the most promise for other developing
economies. The book pointed out that subsidies to exports and directed credit programs linked
to exports are not generally consistent with the GATT and may invite retaliation from trading
partners. Its suggestions include policies creating a free trade environment for exporters,
providing finance and support services for SME-exporters, improving trade-related aspects of
the civil service, aggressively courting foreign direct investment, and focusing infrastructure
on areas that encourage exports.
While there is no recipe for success, positive lessons from the East Asian miracle
include: stable macro economy, focus on early education, agriculture must not be neglected,
use banks to build a sound financial system, be open to foreign ideas and technology, and let
relative prices reflect economic scarcity. What should not be done or negative lessons are:
promoting specific industries or attempting to leap stages of technological development will
generally fail, strongly negative real interest rates and large subsidies to borrowers debilitate
the financial system, and directing credit without adequate monitoring and selection of
borrowers distorts allocation.
The World Bank’s Economic Growth in the 1990s (2005) confirms the findings of the
East Asian Miracle (1993) highlighting the importance for growth of macro-stability, market

43
forces governing the allocation of resources, and openness. However, the book also emphasized
that these general principles translate into diverse policy and institutional paths, implying that
for economic policies to be effective, they must be country specific and institution sensitive.
The central message is there is no one size fits all or unique universal set of rules. Sustained
growth depends on key functions that must be fulfilled overtime: accumulation of physical and
human capital, efficiency in the allocation of resources, adoption of technology, and the sharing
of the benefits of growth.
The Growth Report (2008) by the Commission on Growth and Development examined
13 successful economies that have sustained, high growth in the postwar period. The 13
economies consist of a diverse group of countries such as Botswana, Brazil, China, Hong Kong,
Indonesia, Japan, Korea, Malaysia, Malta, Oman, Singapore, Taiwan, and Thailand. The Report
identified five common characteristics: they fully exploited the world economy; maintained
macroeconomic stability; mustered high rates of savings and investment; let markets allocate
resources; and had committed, credible, and capable governments. The Report recommended
a framework for high, sustained growth with the following elements:
Openness: the high-growth countries imported ideas, technology and knowhow from
the rest of the world and exploited global demand, which provided a deep, elastic
market for their goods. The inflow of knowledge dramatically increased the economy’s
productive potential and the global market provided the demand necessary to fulfill it.
Macroeconomic stability: modest inflation, sustainable public finances, governments
were fiscally responsible. Macroeconomic volatility and unpredictability damage
private sector investment and hence, growth. During their most successful periods, the
13 high-growth countries avoided the worst of this turbulence.
Future orientation: they all mustered high rates of savings and investment, not least
public investment in infrastructure; foregoing consumption in the present to have
higher level of income in the future.
Market allocation: prices guide resources, resources follow prices
Leadership and governance: credible commitment to growth, credible commitment
to inclusion, capable administration
Policy suggestions cover five categories: accumulation, innovation, allocation,
stabilization and inclusion. Strong, enduring growth would require high levels of investment,
overall investment rates of 25% of GDP or above are needed for both public and private
expenditures. The high-growth countries also invested at least another 7-8% of GDP in
education, training, and health (both public and private spending). One channel to promote
technology transfer is foreign direct investment and policies to attract more FDI and measures
to extract more knowledge from a given amount of investment should be pursued such as

44
requiring investors to hire and train local staff. Policies to maintain competition and allow
structural change to take place through the entry of new, productive firms and exit of ailing
ones should also be promoted. In intervening, governments should be guided by two principles:
they should try to protect people, not jobs and if social protection cannot be provided, they
should me more careful in their economic reforms. The speed of job destruction should not
outstrip the pace of job creation. In labor markets, governments should pursue policies that
increase labor mobility, workers will find it easier to pick up new skills and enter new trades if
they are literate and educated.
On export promotion and industrial policy, if an economy is failing to diversify its
exports and failing to generate productive jobs in new industries, governments should look for
ways to jump-start the process, these efforts, however, should be subject to certain disciplines.
They should be temporary; evaluated critically and abandoned quickly if they are not producing
the desired results; and export promotion is not a good substitute for other key supportive
ingredients such as education, infrastructure, and responsive regulation.
Efforts to shepherd exchange rates are as controversial as industrial policy, they can be
thought of a form of industrial policy. The use of exchange rates for industrial policy has the
advantage of being neutral between industrial sectors. However, it has its own costs and risks.
At best, the management of the exchange rate can be used for two purposes, one is to tip the
balance slightly in favor of exports in the early stages of growth to overcome informational
asymmetries and other potential transitory frictions. The other is to prevent a surge of capital
inflows from disrupting the profitability and growth of the export sectors.
The Report also cited certain bad policies including providing open-ended protection
of specific sectors, industries, firms, and jobs from competition; banning exports for long
periods of time to keep domestic prices low for consumers at the expense of producers; allowing
the exchange rate to appreciate excessively before the economy is ready for the transition
towards higher productivity industry, among others.
Recent work by Justin Lin (2010, 2012) highlights the need to rethink government’s
economic role and the challenge for industrial policy to assist governments in crafting programs
in which public and private sectors coordinate to develop new technologies and industries. He
points out that except for a few oil-exporting economies, no country has ever become rich
without industrializing. Most countries in the world, intentionally or not, pursue an industrial
policy in one form or other. Historical evidence shows that in countries that successfully
transformed from an agrarian to a modern economy (in Western Europe, North America and
East Asia), governments coordinated key investments by private firms that helped to launched
new industries, and often provided incentives to pioneering firms through direct subsidies, tax
credits or loans from development banks in order to bolster growth and support job creation.
Measures including public financing of airports, highways, electricity grids,

45
telecommunications, and other infrastructure along with improvements in institutional
effectiveness, emphasis on education and skills, and a clearer legal framework have been
pursued to strengthen industrial policy.
46
Box 1: The Thai Industrial Restructuring Plan
As the Thai manufacturing industry exhibited declining signs, the Ministry of Industry (MOI)
started to formulate the Industrial Restructuring Plan (IRP) in 1997. The IRP was approved by the
Cabinet in January 1998. The National Committee for Industrial Development launched it in June
1998. The implementation program budget allocation was US$1.19 billion. The IRP focused on
upgrading Thailand’s competitiveness through a set of strategies including allocating soft loans to
targeted sectors, dispatching experts to provide technical assistance and establishing funds and
government organizations to support industrial development.
The IRP identified thirteen (13) industries and formulated eight (8) programs to address observed
constraints and bring back the industry path to sustainable growth. The 13 industries were: food and
animal feed; textile and garment; footwear and leather; wooden products and furniture;
pharmaceutical and chemicals; rubber and rubber products; plastic products; ceramic and glassware;
electrical appliances and electronic; automobile and parts; gems and jewelry; iron and steel; and
petrochemicals.
The 13 programs covered the following: improvement of industrial productivity and streamlining
of production processes to increase competitiveness in production cost and product delivery; move
towards production of high value added products for middle to higher markets with quality standards
by upgrading technological capabilities; improving labor skills; incubation and strengthening of
small and medium supporting industries; promoting product design and development, global
marketing channels; promoting the decentralization and relocation of labor-intensive industries to
regional and rural areas; inducing FDI un targeted industries with technologies of the future; and
relocating and managing polluting industries and promoting clean technology.
The formulation and implementation of the IRP was done through Steering Committees (see
Appendix 2A for the mechanism). The National Committee for Industrial Development, which was
responsible for providing overall guidance in the formulation of the IRP was chaired by the Deputy
Prime Minister and managed by the MOI together with members from related ministries, business
and academe. The main task of the Committee is to examine and discuss basic policy and overall
direction. A Sub-committee on National Industrial Restructuring, chaired by the Deputy Minister
of the MOI, was responsible for drafting the IRP’s detailed measures and actions. Institutes that
were operated jointly by public and private sectors were established as venues for information
sharing, monitoring and policy formulation and coordination with line ministries, Thai EXIM
BANK, industry associations, and commercial banks.
The institutes that were established as part of the IRP include the Thailand Productivity Institute,
Thai-German Institute, Thailand Textile Institute, National Food Institute, Management Systems
Certification Institute, Thailand Automotive Institute, Electrical and Electronics Institute,
Foundation for Cane and Sugar Research Institute, Institute for SME Development, and The Iron
and Steel Institute of Thailand.
The IRP helped to recover and stimulate industrial growth with manufacturing growth of 10% in
2003 and 8% in 2004 (see Appendix 2B). Hence, the Ministry of Industry developed the IRP to be
a national industrial policy: Industrial Restructuring Strategy: 2005-2008. This was similar to the
IRP and included new strategic plans to generate high value added industries particularly those that
are innovation or knowledge-based. Other measures included human capital development, industrial
clustering, efficient energy consumption, and creation of new entrepreneurs.

47
Lin notes that most developing countries have failed in playing a facilitating role due
to governments’ inability to align their country’s resource base and level of development. The
propensity to target overly ambitious industries that were misaligned with available resources
and skills explains why their attempts to “pick winners” ended up in “picking losers”. In
contrast, successful economies have focused on strengthening industries that have done well in
countries with comparable factor endowments. Lin emphasized that the lesson from economic
history and development is government support aimed at upgrading and diversifying industry
must be anchored in the requisite endowments. That way, once constraints on new industries
are removed, private firms in those industries quickly become competitive domestically and
globally.
Lin’s framework (growth identification and facilitation framework) suggests that
policymakers identify tradable industries that have performed well in countries with similar
resources and skills and with a per capita income about double their own. If domestic private
firms are already present, policymakers should identify and remove constraints on those firms’
technological upgrading or on entry by new firms. If there are no domestic firms present,
policymakers should aim to attract foreign investors from the countries being emulated or
organize programs for incubating new firms.
Box 1 presents the case of Thailand as it tried to implement its Industrial Restructuring
Plan during the period 1998-2002. Thailand took about 20 years to increase its manufacturing
contribution from 22% to 30% and double its employment share from 7.5% to 15%. The
average share of manufacturing went up substantially from 23.8% from 1981 to 1985 to almost
28% during the period 1991 to 1995, which is a span of about ten years. In the next decade, its
average share increased from 27% during the period 1996 to 2000 to 30.38% in 2001 to 2005.
In terms of its employment contribution to the total, its average share also rose from 7.5% in
1981-1985 to 8% during 1991-1995 and 11% in 1996-2000. In the succeeding ten years, it
reached almost 15% in 2001 to 2005.
C. Analytical Framework
Firms and industries operate in a market environment affected by international and
domestic factors. International factors include multilateral, bilateral and regional trade
agreements that brings about trade and investment liberalization. The international environment
also encompasses globalization and new forms of industrial organizations such as regional or
international production networks. IPNs16 are usually found in trade in automotive, electronics,
16 Vertical specialization has been one of the most notable trends in the international organization of
production during the past few decades. Due to reductions in communication costs, transportation costs
and other trade barriers, multinational firms have sliced up their supply chains and dispersed their
production activities across multiple countries. (Alyson Ma and Ari Van Assche. 2011 Global Production

48
machinery, and garments industries. All these external factors can pose both risks and
opportunities to firms and industries. For instance, with the removal of trade and investment
barriers, opportunities such as bigger export markets and increased foreign direct investment
flows can arise but at the same time, the entry of competing imports or more competitive global
players in the domestic market would increase competition which might pose risks to the
survival of relatively smaller, less competitive and what used to be highly protected firms in
the domestic economy.
Networks in the Post-crisis Era. Ch.21 in Mona Haddad and Ben Shepherd, eds. Managing Openness:
Trade and Outward Oriented Growth after the Crisis. World Bank. 2011)

Figure 19: Business Environment and Market Process Affecting Industry Growth and Development Competition, Innovation, Productivity
Industry specific factors • Industrial policies:
tariffs, fiscal incentives, industry development programs
• Production capacity • Managerial, technical,
financial capacity • Human resources • Market orientation • Raw material sources • Forward and
backward linkages • Foreign equity
Competition
Innovation
Productivity Competitiveness
Industry Growth And
Employment
International factors: globalization, regional/bilateral/multilateral trading arrangements, global & regional production networks
Domestic factors: rule of law, government policies and institutions, infrastructures, macro stability, peace and order, political climate
AGRICULTURE FISHING FORESTRY MINING
SERVICES CONSTRUCTION
MANUFACTURING

50
Domestic factors include the macroeconomic condition, political situation, peace and
order, infrastructure, and government policies and regulation. Within the domestic
environment, there are industry-specific or internal factors that affect the growth and
development of firms and industries. These are government trade and investment policies such
as tariffs, import restrictions as well as investment incentive measures like income tax holidays
or tax and duty exemptions on imports. These may also include industry capacity, market
orientation, foreign equity participation, raw materials, components and inputs, forward and
backward linkages with other sectors of the economy, capabilities and strengths of the industry.
The interplay of all these factors (external and internal) can affect industry growth.
Within the context of an open economy, there are three important channels or mechanisms in
which trade can affect growth: competition, innovation, and productivity. The internal and
external elements comprise the overall business environment in which firms and industries
operate. Any changes in these factors can affect the process of competition, innovation and
productivity which in turn determines the growth of the industry.
Trade openness and economic growth are linked through the relationships between
competition, innovation, and productivity. The old theory of international trade tells us that
welfare gains from trade arise from specialization based on comparative advantage. In the new
trade theory, gains result from economies of scale and product varieties available to consumers.
Empirical evidence based on micro level data shows that an additional source of gains arise
from improved productivity. In these studies, the assumption of firm heterogeneity within an
industry has been adopted in contrast to traditional models that rely on the representative firm
assumption. In the presence of within-industry firm heterogeneity, trade liberalization may lead
to improved productivity through the exit of inefficient firms and the reshuffling of resources
and outputs from less to more efficient firms. With the exit of inefficient firms, resources (labor
and capital) will be freed and will move to other industries where they can be used more
productively. Trade liberalization drives the process of restructuring and reshuffling of
resources within and across sectors of the economy such that unprofitable activities contract
while profitable ones expand. As Melitz (2002) points out, trade opening may induce a market
share reallocation towards more efficient firms and generate an aggregate productivity gain,
without any change at the firm level.
Studies indicating that productivity improves following liberalization include Pavcnik
(2000) for Chile, Fernandes (2003) for Columbia, Topalova (2003) for India, Amiti and
Konings (2004) and Muendler (2002) for Indonesia along with Schor (2003) for Brazil. In India,
Krishna and Mitra (1998) also found evidence of a significant favorable effect of reforms on
industrial productivity.
The most recent literature on trade and growth shows that international trade affects
firms’ innovative activities through increased competition. As Licandro (2010) noted,

51
increasing evidence support the claim that international trade enhances innovation and
productivity growth through an increase in competition. Impulliti and Licandro (2009, 2010)
introduced a framework where trade affects both firm selection and innovation through the
competition channel. Given an oligopolistic environment, trade liberalization leads to an
increase in the number of firms in the domestic market which raises product market competition
and lowers the markup rate. The selection effect of trade operates through endogenous markups
resulting from oligopolistic competition among firms. The reduction in the markup rate (or
increase in competition) due to trade liberalization reduces profits, increases the productivity
threshold above which firms can profitably produce and forces the less productive firms out of
the market. Resources are reallocated from exiting firms to the higher productivity surviving
firms which innovate at a faster pace.
In an environment characterized by increasing globalization and economic integration
through free trade agreements and given the relationships between trade openness, competition,
innovation, productivity and growth; it should be pointed out that the impacts of trade and
openness are not automatic, government’s role will be crucial especially during the transition.
Currently, there are two important challenges that industries are faced with: (i) intense
competition from imports within the domestic market and (ii) improving capacity to penetrate
export markets and take advantage of increasing returns to scale and market access
opportunities arising from free trade agreements and increasing regional integration.
The framework to economic development outlined by Lin (2011) will be adapted to
help identify the industries with latent comparative advantage and facilitate private sector
development in a competitive manner. Lin’s framework is based on the principle that
developing countries can dynamically transform their economic structure by following their
comparative advantage and industrial upgrading needs a facilitating state. The other key
concepts include openness, competitiveness and strong fiscal and external accounts, large
economic surplus and high return on investments which characterize high-growth countries in
the world.
Market and coordination failures are inherent to the process of industrial upgrading and
diversification and must be addressed through government’s facilitative role. For instance,
starting a new industry may be difficult because of the lack of complementary inputs or
adequate infrastructure for the new industry even if the targeted industry is consistent with the
economy’s comparative advantage determined by its factor endowments. Private firms will not
be able to internalize the investments of those intermediate inputs or infrastructure in their
upgrading or diversification decisions. Hence, the government has a crucial role to play in
providing or coordinating investments in necessary infrastructure and complementary inputs
(Lin, J. 2011).

52
Another market failure is caused by important information externalities. Economic
innovations (whether successful or not) yield information about profitable and unprofitable
market opportunities. But because much of this information is available not only to the
innovators themselves but also to competitors and potential imitators, who do not bear any of
the costs of the innovation, it will tend to be undersupplied by the market. Government
subsidies are one possible mechanism for encouraging innovation and offsetting this first-
mover disadvantage. (J. Lin and H. Chang, 2009).
Within the context of the above, the following steps and guidelines will be applied in
evaluating the industry roadmaps:
o First, what are the growth potentials of the industry in both domestic and export
markets?
Are there any potential growth areas where the industry might have
latent comparative advantage?
The different industrial activities where the Philippines may have potential
opportunities for sustained growth and employment generation will be examined. This will
include industries and activities identified in the Philippine Development Plan, those suggested
by Usui (2012) based on the product space concept and those identified in the industry
roadmaps.
o Second, what are the obstacles preventing the firms from upgrading the quality
of their products? What are the barriers that may be discouraging other firms from
entering?
Growth diagnostics and value-chain analyses are applied (see Appendix
3) along with the information and evaluation provided by the industry
roadmaps.
o Third, recommend policy mix to overcome constraints, manage liberalization and
upgrade the industry. The policy mix will consist of horizontal and vertical
interventions as well as coordination mechanisms that would be formulated in
order to allow firms and industry to increase competitiveness, latch on to regional
production networks, increase capacity to export and enable domestic firms
(especially SMEs) to increase their chances of surviving competition.
Usui (2012) defines horizontal or broad-based interventions as those that provide the
framework in which firms and industries operate and where the market mechanism is the key
determinant of their development. These include protection of property rights, improvement of
overall business and investment environment, and R&D strategies.
Vertical interventions are “targeted” ones focused on specific firms, industries and
sectors. They include selected provision of subsidized loans, subsidies, tax incentives and
infrastructure provision and human capital development for specific industries. Lin (2011)
53
notes that the government can compensate firms through time-limited tax incentives, co-
financing investments, or access to raw materials. These incentives are for compensating the
externalities created by first movers and for encouraging firms to form clusters. Lin emphasizes
that the incentives provided by the government could and should be limited both in time and in
financial cost, and should not be in the form of monopoly rent, high tariffs, or other distortions
so as to avoid rent seeking and political capture.
Coordination mechanisms such as industry councils are important venues for
interaction between the government and the private sector in identifying obstacles in exporting
these products and determining the most appropriate interventions. These could also help in
sharing information on investment ideas, achieving coordination and facilitating changes in
legislation and regulation to support private investments.
It is important to note that sufficient caution must be exercised to avoid unintended rent
transfers to well-connected entrepreneurs and self-interested government officials. Thus, strong
political leadership at the top is critical as well as competent and honest bureaucrats along with
the incorporation of check and balances mechanisms in public support programs. Usui (2011)
identified certain principles as guide in designing public support measures: clear objectives and
targets, monitoring and evaluation mechanisms with performance indicators and benchmarks,
sunset clauses and exit strategies, simple and flexible interventions, cost recovery schemes, and
participatory and transparent public-private dialogue.
IV. Potential Areas for Growth and the Most Binding Constraints
A. RCA Analysis and Product Space: Where are the Potential Opportunities
In June 1998, the Industrial Development Plan of the Philippines was formulated by
the Industry Development Council under the leadership of then Department of Trade and
Industry Secretary Cesar B. Bautista and approved by former President Fidel Ramos. The
central focus of the Plan was on technology and skills upgrading. Based on the latent or actual
competitiveness, industry size and impact on jobs; the Plan identified 16 winning industries
consisting of: copper products, decorative crafts (basketworks, ceramics, holiday décor,
jewelry), electronics, fertilizer, footwear and leather goods, fresh fruits, furniture, garments and
textile, industrial tree plantation including rubber products, iron and steel including metal
products, marine products, motor vehicles and components, oleochemical, petrochemical,
processed food and carrageenan. Table provides a list of the constraints along with the
recommended strategies and actions plans of the selected industries. The Plan was not
successfully implemented due to the changes in political administration and the Asian financial
crisis in 1998. No similar plans were drafted during the Estrada and Arroyo administrations.

54
Figure 20: Average RCA Measures (by Leamer Product Classification)
The present Philippine Development Plan 2011-2016 envisions a globally-competitive
and innovative industry and services sector that contributes significantly to inclusive growth
and employment generation. The Plan focuses on improved business environment, increased
productivity and efficiency, and enhanced consumer welfare. The following key areas will be
pursued in the medium term: tourism, business process outsourcing, electronics, mining,
housing, agribusiness/forest-based industries, logistics, shipbuilding, infrastructure, other high-
potential industries such as homestyle products (furniture and furnishings, holiday décor,
houseware and ceramics, woodcraft, giftware excluding toys, shellcraft, and basketwork),
wearables (jewelry), motor vehicle parts and components, garments, and construction and
related materials.
Figure 20 shows the declining number of sectors with average RCAs>1 from 1991 to
2010. The calculated RCAs were further classified into four groups: classic, disappearing,
emerging champions, and marginals (see Record, R. and K. Nghardsaysone, 2010). Figure 21
presents the share of each RCA group classification to total exports. Classics are products in
which Philippine RCA is high in the earlier periods and remains high at the most recent period;
this implies long term competitiveness and strong export performance that should be
maintained. As Figure 19 shows, their share to total exports has remained high although this
has been gradually declining especially in the more recent years. Table 17.1 presents the
classics which include copper ores and copper (raw materials); fuel wood, wood charcoal
(forest products); fish, etc, prepared, preserved, nes (animal product); tobacco unmanufactured
and vegetable textile fibers (cereal, etc); men’s, boys clothing, knitted; women, girl clothing,
knitted; other textile apparel (labor-intensive); tulle, lace, embroidery, etc (capital-intensive);
electric distribution equipment, nes; radio broadcast receiver; transistors, valves (machinery);
and alcohol, phenol (chemicals).
0
0.5
1
1.5
2
2.5
3
3.5
1991-1995
1996-2000
2001-2005
2006-2011

55
Table 17.1: Classics Average Exports (in thousand US$)
Classics 1991-1995 1996-2000 2001-2005 2006-2010
Copper ores,concentrates Raw materials 134,811.88 38,603.75 17,371.01 155,770.64
Prec.metal ores,conctrts Raw materials 76,462.92 48,841.63 21,676.40 112,430.72
Petroleum gases, nes Raw materials 84,165.29 66,228.13 23,386.65 100,192.73
Copper Raw materials 287,885.05 277,457.86 343,400.48 1,211,341.76
Fuel wood, wood charcoal Forest
products 10,295.94 9,677.86 6,874.13 9,855.51
Wood manufactures, nes Forest
products 117,481.72 149,313.22 126,657.41 837,945.30
Fish etc.prepd,prsvd.nes Animal
products 126,172.83 116,490.01 117,694.32 246,822.79
Crude veg.materials, nes Animal
products 57,932.58 91,025.58 85,023.58 115,002.02
Tobacco, unmanufactured Cereals, etc 29,189.52 30,806.03 22,755.74 68,794.77
Vegetable textile fibres Cereals, etc 21,676.01 21,170.56 12,465.56 17,006.41
Fixed veg.fat,oils,other Cereals, etc 488,823.69 551,449.19 502,423.36 843,472.30
Mens,boys clothng,x-knit Labor-
intensive 180,132.36 514,549.83 454,888.29 390,149.75
Women,girl clothng,xknit Labor-
intensive 204,445.21 638,818.16 766,480.61 447,323.73
Mens,boys clothing,knit Labor-
intensive 118,835.11 263,220.62 206,329.32 156,604.26
Women,girls clothng.knit Labor-
intensive 116,190.27 210,891.65 243,238.12 487,722.58
Othr.textile apparel,nes Labor-
intensive 405,519.82 604,515.10 527,798.13 500,349.33
Tulle,lace,embroidry.etc Capital-
intensive 15,220.17 21,969.95 32,743.82 35,340.50
Electr distribt.eqpt nes Machinery 337,936.20 563,624.83 677,316.11 936,781.54
Radio-broadcast receiver Machinery 81,479.45 91,429.30 101,989.29 62,380.68
Transistors,valves,etc. Machinery 1,074,814.09 12,307,684.18 14,722,887.90 15,566,269.93
Alcohol,phenol,etc.deriv Chemicals 40,058.76 42,602.98 53,199.27 146,450.49
Emerging champions are products in which Philippine RCA is low in the earlier period
but is high in the recent period; this implies the emergence of competitiveness and the need to
build on these product discoveries. As Table 17.2 shows, emerging champions are few and
consist of machinery products such as parts of electric power machinery; electric machinery
0
10
20
30
40
50
60
70
80
90
2000 2001 2002 2003 2004 2005 2006 2007 2008 2009 2010 2011
Figure 21: Classification of Exports based on RCAs, 2000-2011
Emerging Marginal Diminishing Classics
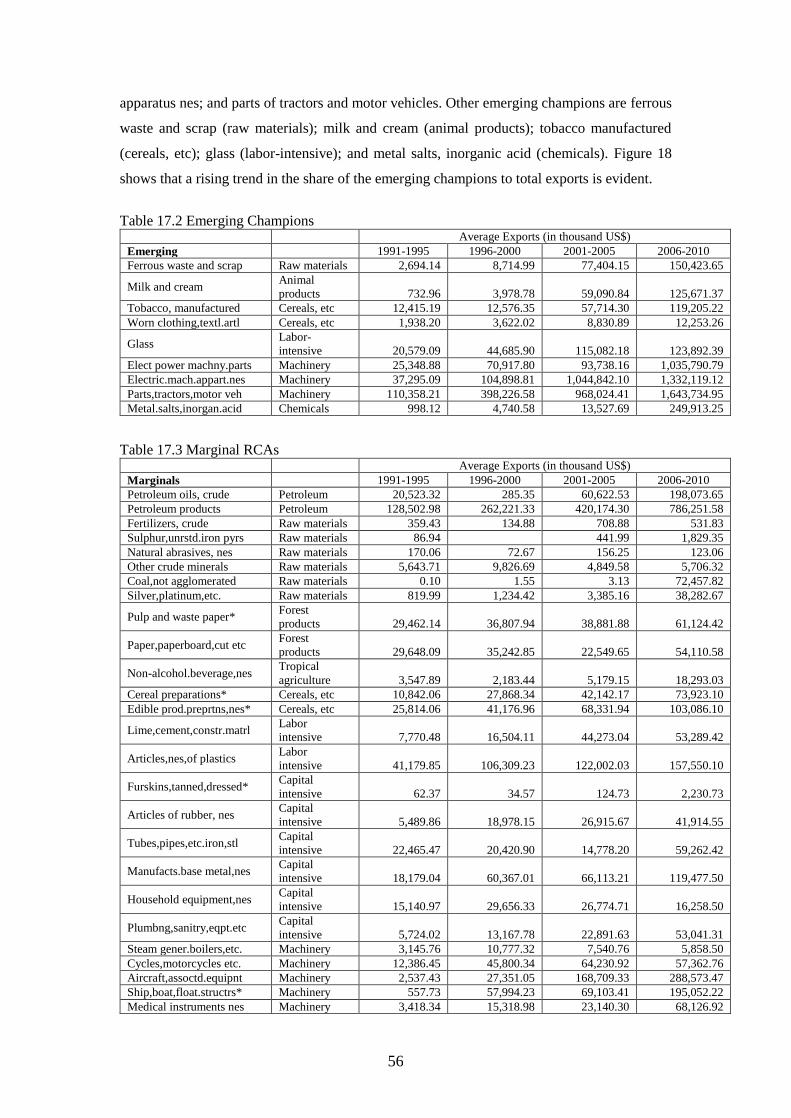
56
apparatus nes; and parts of tractors and motor vehicles. Other emerging champions are ferrous
waste and scrap (raw materials); milk and cream (animal products); tobacco manufactured
(cereals, etc); glass (labor-intensive); and metal salts, inorganic acid (chemicals). Figure 18
shows that a rising trend in the share of the emerging champions to total exports is evident.
Table 17.2 Emerging Champions Average Exports (in thousand US$)
Emerging 1991-1995 1996-2000 2001-2005 2006-2010
Ferrous waste and scrap Raw materials 2,694.14 8,714.99 77,404.15 150,423.65
Milk and cream Animal
products 732.96 3,978.78 59,090.84 125,671.37
Tobacco, manufactured Cereals, etc 12,415.19 12,576.35 57,714.30 119,205.22
Worn clothing,textl.artl Cereals, etc 1,938.20 3,622.02 8,830.89 12,253.26
Glass Labor-
intensive 20,579.09 44,685.90 115,082.18 123,892.39
Elect power machny.parts Machinery 25,348.88 70,917.80 93,738.16 1,035,790.79
Electric.mach.appart.nes Machinery 37,295.09 104,898.81 1,044,842.10 1,332,119.12
Parts,tractors,motor veh Machinery 110,358.21 398,226.58 968,024.41 1,643,734.95
Metal.salts,inorgan.acid Chemicals 998.12 4,740.58 13,527.69 249,913.25
Table 17.3 Marginal RCAs Average Exports (in thousand US$)
Marginals 1991-1995 1996-2000 2001-2005 2006-2010
Petroleum oils, crude Petroleum 20,523.32 285.35 60,622.53 198,073.65
Petroleum products Petroleum 128,502.98 262,221.33 420,174.30 786,251.58
Fertilizers, crude Raw materials 359.43 134.88 708.88 531.83
Sulphur,unrstd.iron pyrs Raw materials 86.94 441.99 1,829.35
Natural abrasives, nes Raw materials 170.06 72.67 156.25 123.06
Other crude minerals Raw materials 5,643.71 9,826.69 4,849.58 5,706.32
Coal,not agglomerated Raw materials 0.10 1.55 3.13 72,457.82
Silver,platinum,etc. Raw materials 819.99 1,234.42 3,385.16 38,282.67
Pulp and waste paper* Forest
products 29,462.14 36,807.94 38,881.88 61,124.42
Paper,paperboard,cut etc Forest
products 29,648.09 35,242.85 22,549.65 54,110.58
Non-alcohol.beverage,nes Tropical
agriculture 3,547.89 2,183.44 5,179.15 18,293.03
Cereal preparations* Cereals, etc 10,842.06 27,868.34 42,142.17 73,923.10
Edible prod.preprtns,nes* Cereals, etc 25,814.06 41,176.96 68,331.94 103,086.10
Lime,cement,constr.matrl Labor
intensive 7,770.48 16,504.11 44,273.04 53,289.42
Articles,nes,of plastics Labor
intensive 41,179.85 106,309.23 122,002.03 157,550.10
Furskins,tanned,dressed* Capital
intensive 62.37 34.57 124.73 2,230.73
Articles of rubber, nes Capital
intensive 5,489.86 18,978.15 26,915.67 41,914.55
Tubes,pipes,etc.iron,stl Capital
intensive 22,465.47 20,420.90 14,778.20 59,262.42
Manufacts.base metal,nes Capital
intensive 18,179.04 60,367.01 66,113.21 119,477.50
Household equipment,nes Capital
intensive 15,140.97 29,656.33 26,774.71 16,258.50
Plumbng,sanitry,eqpt.etc Capital
intensive 5,724.02 13,167.78 22,891.63 53,041.31
Steam gener.boilers,etc. Machinery 3,145.76 10,777.32 7,540.76 5,858.50
Cycles,motorcycles etc. Machinery 12,386.45 45,800.34 64,230.92 57,362.76
Aircraft,assoctd.equipnt Machinery 2,537.43 27,351.05 168,709.33 288,573.47
Ship,boat,float.structrs* Machinery 557.73 57,994.23 69,103.41 195,052.22
Medical instruments nes Machinery 3,418.34 15,318.98 23,140.30 68,126.92
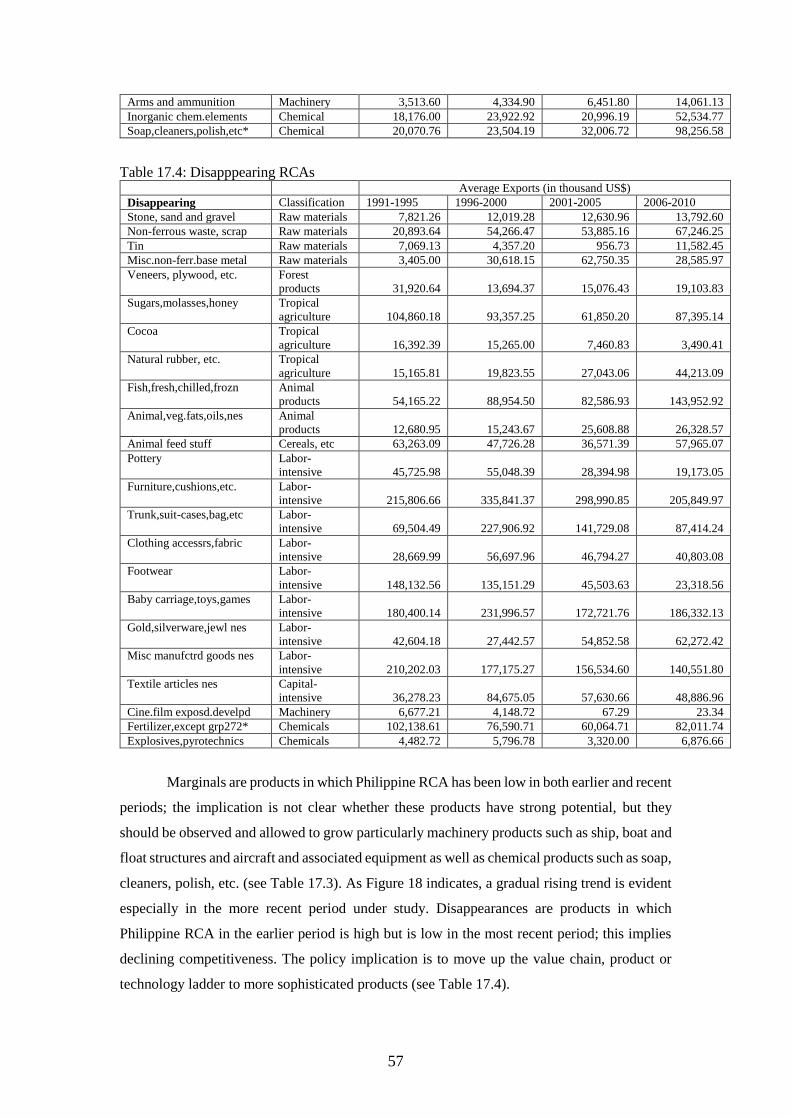
57
Arms and ammunition Machinery 3,513.60 4,334.90 6,451.80 14,061.13
Inorganic chem.elements Chemical 18,176.00 23,922.92 20,996.19 52,534.77
Soap,cleaners,polish,etc* Chemical 20,070.76 23,504.19 32,006.72 98,256.58
Table 17.4: Disapppearing RCAs Average Exports (in thousand US$)
Disappearing Classification 1991-1995 1996-2000 2001-2005 2006-2010
Stone, sand and gravel Raw materials 7,821.26 12,019.28 12,630.96 13,792.60
Non-ferrous waste, scrap Raw materials 20,893.64 54,266.47 53,885.16 67,246.25
Tin Raw materials 7,069.13 4,357.20 956.73 11,582.45
Misc.non-ferr.base metal Raw materials 3,405.00 30,618.15 62,750.35 28,585.97
Veneers, plywood, etc. Forest
products 31,920.64 13,694.37 15,076.43 19,103.83
Sugars,molasses,honey Tropical
agriculture 104,860.18 93,357.25 61,850.20 87,395.14
Cocoa Tropical
agriculture 16,392.39 15,265.00 7,460.83 3,490.41
Natural rubber, etc. Tropical
agriculture 15,165.81 19,823.55 27,043.06 44,213.09
Fish,fresh,chilled,frozn Animal
products 54,165.22 88,954.50 82,586.93 143,952.92
Animal,veg.fats,oils,nes Animal
products 12,680.95 15,243.67 25,608.88 26,328.57
Animal feed stuff Cereals, etc 63,263.09 47,726.28 36,571.39 57,965.07
Pottery Labor-
intensive 45,725.98 55,048.39 28,394.98 19,173.05
Furniture,cushions,etc. Labor-
intensive 215,806.66 335,841.37 298,990.85 205,849.97
Trunk,suit-cases,bag,etc Labor-
intensive 69,504.49 227,906.92 141,729.08 87,414.24
Clothing accessrs,fabric Labor-
intensive 28,669.99 56,697.96 46,794.27 40,803.08
Footwear Labor-
intensive 148,132.56 135,151.29 45,503.63 23,318.56
Baby carriage,toys,games Labor-
intensive 180,400.14 231,996.57 172,721.76 186,332.13
Gold,silverware,jewl nes Labor-
intensive 42,604.18 27,442.57 54,852.58 62,272.42
Misc manufctrd goods nes Labor-
intensive 210,202.03 177,175.27 156,534.60 140,551.80
Textile articles nes Capital-
intensive 36,278.23 84,675.05 57,630.66 48,886.96
Cine.film exposd.develpd Machinery 6,677.21 4,148.72 67.29 23.34
Fertilizer,except grp272* Chemicals 102,138.61 76,590.71 60,064.71 82,011.74
Explosives,pyrotechnics Chemicals 4,482.72 5,796.78 3,320.00 6,876.66
Marginals are products in which Philippine RCA has been low in both earlier and recent
periods; the implication is not clear whether these products have strong potential, but they
should be observed and allowed to grow particularly machinery products such as ship, boat and
float structures and aircraft and associated equipment as well as chemical products such as soap,
cleaners, polish, etc. (see Table 17.3). As Figure 18 indicates, a gradual rising trend is evident
especially in the more recent period under study. Disappearances are products in which
Philippine RCA in the earlier period is high but is low in the most recent period; this implies
declining competitiveness. The policy implication is to move up the value chain, product or
technology ladder to more sophisticated products (see Table 17.4).
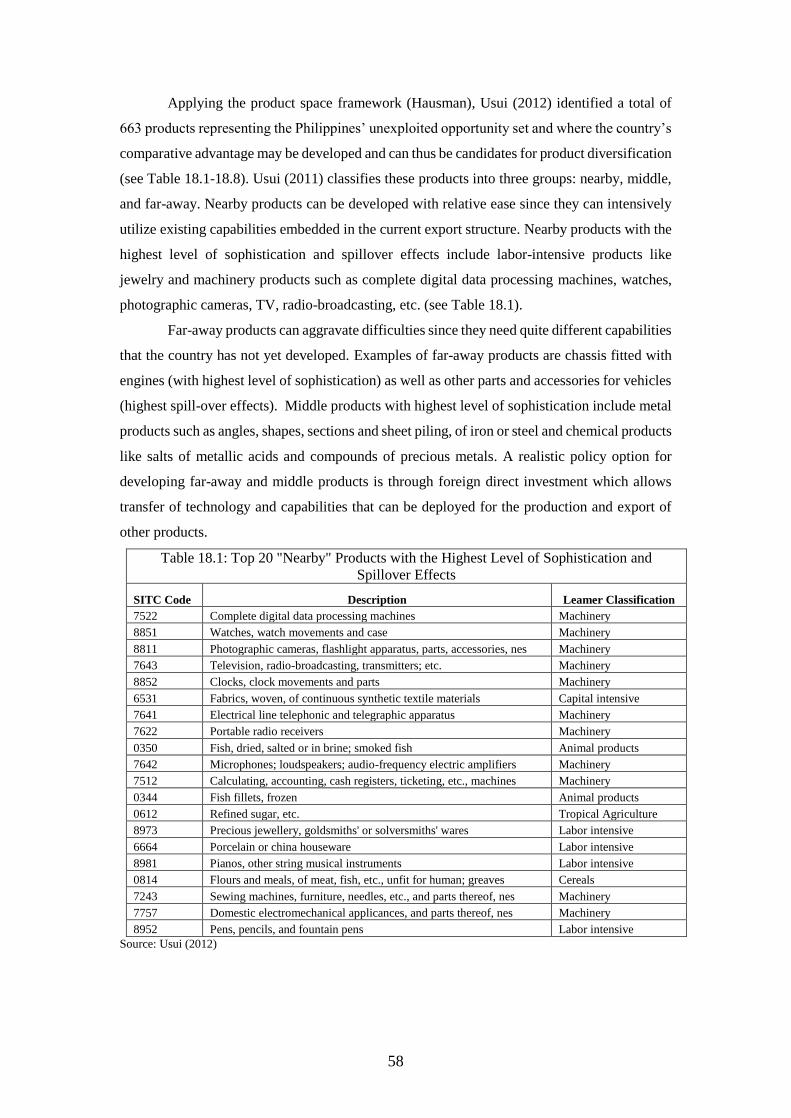
58
Applying the product space framework (Hausman), Usui (2012) identified a total of
663 products representing the Philippines’ unexploited opportunity set and where the country’s
comparative advantage may be developed and can thus be candidates for product diversification
(see Table 18.1-18.8). Usui (2011) classifies these products into three groups: nearby, middle,
and far-away. Nearby products can be developed with relative ease since they can intensively
utilize existing capabilities embedded in the current export structure. Nearby products with the
highest level of sophistication and spillover effects include labor-intensive products like
jewelry and machinery products such as complete digital data processing machines, watches,
photographic cameras, TV, radio-broadcasting, etc. (see Table 18.1).
Far-away products can aggravate difficulties since they need quite different capabilities
that the country has not yet developed. Examples of far-away products are chassis fitted with
engines (with highest level of sophistication) as well as other parts and accessories for vehicles
(highest spill-over effects). Middle products with highest level of sophistication include metal
products such as angles, shapes, sections and sheet piling, of iron or steel and chemical products
like salts of metallic acids and compounds of precious metals. A realistic policy option for
developing far-away and middle products is through foreign direct investment which allows
transfer of technology and capabilities that can be deployed for the production and export of
other products.
Table 18.1: Top 20 "Nearby" Products with the Highest Level of Sophistication and
Spillover Effects
SITC Code Description Leamer Classification
7522 Complete digital data processing machines Machinery
8851 Watches, watch movements and case Machinery
8811 Photographic cameras, flashlight apparatus, parts, accessories, nes Machinery
7643 Television, radio-broadcasting, transmitters; etc. Machinery
8852 Clocks, clock movements and parts Machinery
6531 Fabrics, woven, of continuous synthetic textile materials Capital intensive
7641 Electrical line telephonic and telegraphic apparatus Machinery
7622 Portable radio receivers Machinery
0350 Fish, dried, salted or in brine; smoked fish Animal products
7642 Microphones; loudspeakers; audio-frequency electric amplifiers Machinery
7512 Calculating, accounting, cash registers, ticketing, etc., machines Machinery
0344 Fish fillets, frozen Animal products
0612 Refined sugar, etc. Tropical Agriculture
8973 Precious jewellery, goldsmiths' or solversmiths' wares Labor intensive
6664 Porcelain or china houseware Labor intensive
8981 Pianos, other string musical instruments Labor intensive
0814 Flours and meals, of meat, fish, etc., unfit for human; greaves Cereals
7243 Sewing machines, furniture, needles, etc., and parts thereof, nes Machinery
7757 Domestic electromechanical applicances, and parts thereof, nes Machinery
8952 Pens, pencils, and fountain pens Labor intensive
Source: Usui (2012)

59
Table 18.2 Top 20 "Nearby" Products with the Highest Labor Intensity
SITC Code Description Leamer Classification
6674 Synthetic of reconstructed precious or semi-precious stones Labor intensive
8981 Pianos, other string musical instruments Labor intensive
6522 Knitted, not elastic nor rubberized, of fibers other than synthetic Capital intensive
8952 Pens, pencils, and fountain pens Labor intensive
8998 Smallwares and toilet articles, nes; sieves; tailors' dummies, etc. Labor intensive
6531 Fabrics, woven, of continuous synthetic textile materials Capital intensive
8852 Clocks, clock movements and parts Machinery
8973 Precious jewellery, goldsmiths' or solversmiths' wares Labor intensive
8851 Watches, watch movements and case Machinery
6664 Porcelain or china houseware Labor intensive
8811 Photographic cameras, flashlight apparatus, parts, accessories, nes Machinery
0350 Fish, dried, salted or in brine; smoked fish Animal products
0344 Fish fillets, frozen Animal products
7243 Sewing machines, furniture, needles, etc., and parts thereof, nes Machinery
7522 Complete digital data processing machines Machinery
7641 Electrical line telephonic and telegraphic apparatus Machinery
7643 Television, radio-broadcasting, transmitters; etc. Machinery
0814 Flours and meals, of meat, fish, etc., unfit for human; greaves Cereals
7642 Microphones; loudspeakers; audio-frequency electric amplifiers Machinery
7622 Portable radio receivers Machinery
Source: Usui (2012)
Table 18.3 Top 20 "Middle" Products with the Highest Level of Sophistication
SITC Code Description Leamer Classification
5415 Hormones, natural, or reproduced by synthesis, in bulk Chemicals
5148 Other nitrogen-funcion compounds Chemicals
6733 Angles, shapes, sections and sheet piling, of iron or steel Metal products
8996 Orthopedic appliances, hearing aids, artificial parts of the body Labor intensive
5851 Modified natural resins etc; derivatives of natural rubber Chemicals
7362 Metal forming machine-tool Machinery
0015 Equine species, live Animal products
5146 Oxygen-function amino-compounds Chemicals
8744 Nonmechanical or electrical instruments for physical, etc., analysis Machinery
7923 Aircraft of an unladen weight from 2,000 kg to 15,000 kg Machinery
5826 Epoxide resins Chemicals
6647 Safety glass consisting of toughened or laminated glass, cut or not Labor intensive
0013 Swine, live Animal products
7741 Electro-medical equipment Machinery
5841 Regenerated cellulose Chemicals
5233 Salts of metallic acids; compounds of precious metals Chemicals
6643 Drawn or blown glass (flashed glass), unworked, in rectangles Labor intensive
7499 Other non-electric parts and accessories of machinery, nes Machinery
5139 Oxygen-function acids, and their derivatives Chemicals
5411 Provitamins and vitamins Chemicals
Source: Usui (2012)
Table 18.4 : Top 20 "Middle" Products with the Highest Spillover Effect
SITC Code Description Leamer Classification
7492 Cocks, valve and similar appliances, for pipes boiler shells, etc. Machinery
7431 Air pumps, vacuum pumps, and air or gas compressors Machinery
6571 Felt, articles of felt, nes, whether or not impregnated or coated Capital intensive
6573 Coated or impregnated textile fabrics and products, nes Capital intensive

60
8935 Articles of electric lighting of plastic Labor intensive
5821 Phenoplasts Chemicals
6422 Correspondence stationery Forest products
8922 Newspapers, journals, and periodicals Labor intensive
6785 Tube and pipes fittings, of iron or steel Metal products
6289 Other articles of rubber, nes Capital intensive
6572 Bonded fiber fabrics, etc, whether or not impregnated or coated Capital intensive
6282 Transmission, conveyor or elevator belts, of vulcanized rubber Capital intensive
7499 Other non-electric parts and accessories of machinery, nes Machinery
7112 Auxiliary plant for boilers of heading 7111; condensers Machinery
6997 Articles of iron or steel, nes Metal products
8939 Miscellaneous articles of plastic Labor intensive
6996 Miscellaneous articles of base metal Metal products
7239 Parts, nes of machinery and equipment of headings 72341 to 72346 Machinery
5822 Aminoplasts Chemicals
8989 Parts, nes of and accessories of musical instrucments; metronomes Labor intensive
Source: Usui (2012)
Table 18.5 Top 20 "Middle" Products with the Highest Labor Intensity
SITC Code Description Leamer Classification
2786 Slag, scalings, dross, and similar wastes, nes Raw materials
2772 Other natural abrasives Raw materials
2925 Seeds, fruits and spores, nes, for planting Animal products
8989 Parts, nes of and accessories of musical instrucments; metronomes Labor intensive
0430 Barley, unmilled Cereals
0811 Hay and fodder, green or dry Cereals
0411 Durum wheat, unmilled Cereals
0452 Oats, unmilled Cereals
8794 Other articles of precious metals or rolled precious metals, nes Labor intensive
9610 Coin (other than gold coin), not being legal tender Labor intensive
6416 Fiber building board of wood or other vegetable material Forest products
6352 Casks, barrels; other coopers sproducts and parts, including staves Forest products
6330 Cork manufactures Forest products
6553 Knitted, or crocheted fabrics, elastic or rubberized Capital intensive
0013 Swine, live Animal products
0015 Equine species, live Animal products
2682 Wool degreased, uncombed of sheep or lambs Cereals
2681 Wool greasy or fleece-washed of sheep or lambs Cereals
6571 Felt, articles of felt, nes, whether or not impregnated or coated Capital intensive
6572 Bonded fiber fabrics, etc, whether or not impregnated or coated Capital intensive
Source: Usui (2012)
Table 18.6 Top 20 "Far Away" Products with the Highest Level of Sophistication
SITC Code Description Leamer Classification
5147 Amide-function compounds excluding urea Chemicals
5155 Other organo-inorganic compounds Chemicals
6412 Printing paper and writing paper, in rolls or sheets Forest products
7368 Work holders, dividing head for machine tools, etc.; tool holders Machinery
5157 Sulphonamides, sultones, and sultams Chemicals
5416 Glycosides, glands, antisera, vaccines, and similar products Chemicals
7412 Furnace burners; mechanical stokers, etc., and parts thereof, nes Machinery
0121 Bacon, ham, other dried, salted or smoked meat of domestic swine Animal products
5838 Ion exchangers of the polymerization or copolymerization type Chemicals
6880 Uranium depleted in U235, thorium, and alloys, nes; waste and scrap Raw materials

61
7452 Other non-electrical machines and parts thereof, nes Machinery
8821 Chemical products and flashlight materials for use in photography Machinery
5827 Silicones Chemicals
5156 Heterocyclic compund; nucleic acids Chemicals
5982 Anti-knock preparation, anti-corrosive; viscosity improvers; etc. Chemicals
7841 Chasis fitted with engines, for vehicles of headings 722, 781-783 Machinery
7269 Parts, nes of machines falling within headings 72631, 7264, 7267 Machinery
6832 Nickel and nickel alloys, worked Raw materials
7281 Machine-tolls for specialized industries; parts or accessories, nes Machinery
5145 Amine-function compounds Chemicals
Source: Usui (2012)
Table 18.7: Top 20 "Far Away" Products with the Highest Spillover Effect
SITC Code Description Leamer Classification
5162 Aldehyde, ketone, and quinone--function compounds Chemicals
3345 Lubricating petroleum oils, and preparations, nes Petroleum
7439 Parts, nes of the machines falling within headings 7435 and 7436 Machinery
5163 Inorganic esters, their salts and derivatives Chemicals
7732 Electrical insulating equipment Machinery
7412 Furnace burners; mechanical stokers, etc., and parts thereof, nes Machinery
7212 Harvesting and threshing machines; fodder presses, etc.; parts nes Machinery
7188 Engines and motors, nes (wind, hot air engines, water wheel, etc.) Machinery
7429 Parts, nes of pumps and liquids elevators falling in heading 742 Machinery
7849 Other parts and accessories, for vehicles of headings 722, 781-783 Machinery
5335 Glazes, driers, putty etc. Chemicals
6579 Special products of textile materials Capital intensive
7423 Rotary pumps (other than those of heading 74281) Machinery
0913 Lard, pig, and poultry fat, rendered or solvent-extracted Cereals
6418 Paper and paperboard, coated, impregnated, etc., in rolls or sheets Forest products
7224 Wheeled tractors (other than those falling in heading 74411, 7832) Machinery
7129 Parts, nes of steam and power units Machinery
7269 Parts, nes of machines falling within headings 72631, 7264, 7267 Machinery
5824 Polyamides Chemicals
7435 Centrifuges Machinery
Source: Usui (2012)
Table 18.8 Top 20 "Far Away" Products with the Highest Labor Intensity
SITC Code Description Leamer Classification
2741 Sulphur (other than sublimed, precipitated or colloidal) Raw materials
2234 Linseed Cereals
2652 True hemp, raw or processed but not spun, its tow and waste Cereals
6591 Linoleum and similar floor covering Capital intensive
6579 Special products of textile materials Capital intensive
8121 Central heating equipment, not electrically heated parts, nes Capital intensive
7187 Nuclear reactors and parts thereof, nes Machinery
6635 Wool; expanding or insulating mineral materials, nes Labor intensive
6632 Abrasive power or grain, on a base of woven fabrics Labor intensive
7842 Bodies, for vehicles of headings 722, 781-783 Machinery
7913 Mechanically propelled railway, tramway, trolleys, etc. Machinery
7849 Other parts and accessories for vehicles of headings 722, 781-783 Machinery
7919 Railway track fixtures, and fittings, etc., parts nes of heading 791 Machinery
6953 Other hand tools Metal products
6940 Nails, screws, nuts, bolts, rivets, etc., of iron, steel or copper Metal products
6954 interchangeable tools for hand or machine tools (tips, blades, etc.) Metal products

62
6999 Other base metal manufactures, nes; and of cermets Metal products
7929 Parts, nes of the aircraft heading 792 Machinery
8822
Photographic film, plates and paper (other than cinematograph
film) Machinery
6418 Paper and paperboard, coated, impregnated, etc., in rolls or sheets Forest products
Source: Usui (2012)
B. Most Binding Constraints to Growth: What is preventing us from taking
advantage of the potential opportunities
A total of 18 manufacturing industries submitted their sectoral roadmaps to the DTI-
BOI. These covered the following sectors: rubber, copper, biodiesel, furniture, engineered
bamboo, chemicals, petrochemicals, cement, motorcycle, motorcycle parts, automotive,
automotive parts, tool and die, iron and steel, plastics, paper, metal casting, and shipbuilding.
Based on the review of the roadmaps and industry consultations that were conducted, the most
common horizontal constraints that were identified were in the areas of infrastructure and
logistics particularly the high cost or power and domestic shipping as well as in governance
and regulation specifically smuggling, bureaucracy and red tape and the lack of streamlining
and automation of interrelated government procedures.
Table 19: Major Horizontal Constraints
Major Area Main Issues & Constraints
Infrastructure & Logistics High cost & unpredictability of power
High cost of domestic shipping
Governance & Regulation Smuggling, corruption, bureaucracy/red tape
Lack of streamlining/automation of interrelated business
procedures
SME development Access to finance, technology upgrade, inability to comply with
product standard regulations
Human resource
development
Lack of skilled workers, training
Innovation Industry-academe linkages new product development, R&D
facilities
The high cost of power has been raised by almost all sectors, in particular copper,
cement, paper, auto and autoparts, chemical, petrochemical, biodiesel and iron and steel sectors.
High shipping and transportation costs are important concerns in the copper, furniture,
chemicals, and iron and steel sectors. Improvement in infrastructure is of high importance to
automotive, autoparts, chemical and petrochemicals, and cement industries. The problem of
smuggled products has been cited by almost all industries specifically copper, automotive, auto
parts, chemical, petrochemical and iron and steel sectors. The proliferation of counterfeit

63
products and parts has been raised by the motorcycle industry. The industries have also
indicated the lack of streamlining in government procedures particularly at the Bureau of
Customs.
SMEs continue to face lack of access to finance, access to technology as well as
difficulties with product quality standards. The lack of skilled workers remains a major
constraint particularly in industries such as metal casting, tool and die, auto and motorcycle
parts, furniture, chemical, rubber, plastic, iron and steel industries. The need to create linkages
between industry and academe in product development and R&D activities has also been
highlighted.
In terms of vertical or industry specific constraints, the analysis showed that firms in
various sectors continue to face major constraints such as lack of domestic raw material
suppliers, parts and components; as well as lack of highly skilled workers. The
underdevelopment of parts and components industries and high cost of raw materials have
severely affected their competitiveness. In the face of increasing competition from imports, the
lack of adjustment measures like temporary industry support measures and training and job
search assistance for displaced workers has led to the inability of firms to cope with the new
operating environment.
Table 20 summarizes the vertical constraints into five major areas consisting of issues
affecting the industry supply/value chain; domestic market base; SME development; human
resource development; and innovation. As already indicated in the overall analysis in Part II of
the report, broken linkages in the supply/value chain characterize many of our industries. The
lack of materials processing has severely affected the competitiveness of the Philippine parts
and supplies industries and hampered the ability of high-technology industries to move up the
value chain. Due to weak backward linkages within the manufacturing industry, automotive
and electronics have continued to rely on imported parts and remained at the assembly stage of
the supply chain.
Table 20: Major Vertical Constraints
Major Area Main Issues & Constraints Industries
Supply/value
chain gaps
Absence of raw materials (upstream);
weak parts & components sector (mid-
stream); downstream
Furniture, paper, copper,
iron and steel, plastic,
automotive
Domestic
market
expansion as
base for exports
Need economies of scale, build on
domestic supply base as platform
towards expansion into exports
Auto, motorcycle, ship
building
In the iron and steel industry, which is critical for the manufacture of parts and
equipment, competitiveness issues have remained due to the high cost of raw materials (apart

64
from the high costs of power and logistics, unabated smuggling, and limited government
capacity to monitor product standards). With the shutdown of Global Steel, local production of
hot-rolled coil/sheet, cold-rolled coil sheet, tin plates and wire rods have been completely
displaced by imports.
In terms of forward linkages, the local tool and die industry has to compete heavily
against imported dies and molds while its backward linkages are weak due to the unavailability
of most raw materials, equipment, and software. Special steels and castings, general and
specialized metal machining equipment, and software are all imported. Labor is the only
component of the value chain that is locally sourced. Though the country has natural resources
that would provide important metals like iron and copper, there are no processing plants
(capital-intensive blast furnace, steel making facility) that would produce the form of metal that
the industry requires. There is no reliable aluminum casting facility for molds used in molding
large plastic components like refrigerator liners.
In the export-oriented copper industry, firms have hardly any linkage with the domestic
economy. Copper ores are all exported and although the country has a copper smelting facility,
it imports 100 percent of its copper ore requirements and exports 100 percent of its output due

65
to the absence of a copper rod facility. Manufacturers of wiring harness, a major export product
and user of copper rods, import all of their copper rod requirements.
Lack of integration also characterize the pulp and paper industry as firms continue to
face high cost of raw materials due to the absence of a pulp mill in the country. The furniture
industry also attributed their inability to compete due to the high cost and lack of raw materials.
Though the potentials are high for engineered bamboo products, the shortage of bamboo poles
has been a major constraint preventing the industry from taking part in the global market for
bamboo products.
Box 2: Automotive Industry Roadmap
The automotive industry is a highly global and technology-driven industry. It is complex with large number
of parts and components (textiles, glass, plastics, electronics, rubber, steel, and other metals) involving
different production processes. Given these interlinkages, the promotion of the automotive industry can lead
to an expansion of many complementary investments by automotive parts firms and help lay the foundation
for broad-based industrial growth.
In the last 10 years, the Philippine automotive industry has seen intense import competition as a result of
trade liberalization. Through the ASEAN Trade in Goods Agreement (ATIGA), tariffs were eliminated in
early 2010. With increasing regional integration, domestic assemblers in the country have been shifting
away from assembly or completely knocked down (CKD) operations toward completely built units (CBU)
imports. As its CKD operations declined from 92 percent of total sales in 2003 to 49 percent in 2009 and
further to 41 percent in 2011, Ford Motors decided to close down its assembly plant in the Philippines.
The industry has been facing competitiveness issues due to the absence of economies of scale and a weak
supply base. These are the fundamental issues that must be addressed in order to strengthen the industry
and integrate it with regional production networks of foreign automakers. To achieve this, there is a need
for strategic industrial upgrading policy and carefully designed temporary support that would target
improvement of firm competitiveness as well as rebuilding the market for domestically assembled vehicles.
Moreover, strong political will be needed to address the illegal entry of new and used vehicles.
Amid these challenges, there are market opportunities that globalization brings and which the industry can
take advantage of. Forecasts show that Asia will be the most dynamic market in the world especially with
the steady growth of China, India, and the Southeast Asian countries. The creation of the ASEAN Economic
Community in 2015 offers increased trade and investment opportunities. There are also strong growth
potentials in specializing in certain core processes and alternative fuel and E-vehicles and parts. Investors
will not put all their eggs in one basket especially in the light of the supply chain disruptions that occurred
after the Japan quake and Thai flooding. The Philippine auto industry must be ready as investors search for
alternative locations.
As the country aspires to become a regional hub like Thailand, large investments would be necessary in
critical parts like body panel stampings, large injection moldings, and engines. Three major strategies are
proposed to be implemented: (i) enhance the competitiveness of Filipino parts and components firms; (ii)
create an incentive program to support the adjustment of the automotive industry as it transforms from
completely knocked down assembly to full manufacturing; and (iii) establish a more predictable
environment for business operations. Through the effective implementation of these policy measures, the
auto industry is expected to realize its potential of being one the key drivers of manufacturing growth by
2020, producing not only for the domestic market but also for the regional and world markets.
Sources: PACCI (2012); Aldaba (2012)

66
Domestic market base expansion is important for the automotive, motorcycle, and ship-
building industries. For instance, the automotive industry has been facing competitiveness
issues due to the absence of economies of scale and a weak parts supply base (see Box 2). These
are the fundamental issues that must be addressed in order to strengthen the industry and
integrate it with regional production networks of foreign automakers. In the case of
shipbuilding, Nomura (2012) indicated the strong potential of the Philippines especially in view
of plans by Korea and Japan to expand their overseas market. By expanding the domestic base,
the country can be an attractive site for foreign shipbuilding companies.
V. Manufacturing Industry Roadmap and Recommendations
A. SWOT Analysis
Given its popularity and high trust rating, the Aquino administration is expected to
continue implementing solid reforms and actions to overcome the difficult challenges in
realizing the country’s potentials. Now seen as a new growth area, the Philippines is well
positioned to attract new investments that would catalyze growth and development especially
in the light of our recent investment upgrade. Many see the impressive 6.8 percent growth in
gross domestic product for 2012 and 7.8% growth during the first quarter as a sign of increasing
economic momentum that is necessary to drive the country toward a higher growth path in the
succeeding years.
Table 21: Analysis of Strengths, Weaknesses, Opportunities, and Threats (SWOT)
Strengths
Good macro environment
Political stability
Abundant young, skilled, English speaking
workers
Export zones’ legal framework & incentives
Weaknesses
• High power cost
• Inadequate infrastructure
• Weak competitiveness of
industries
Opportunities
• 2011 flooding in Thailand that drove investors
to seek alternative locations
• Earthquake in Japan leading to supply chain
disruptions
• Rising labor cost in China
• Increasing tension between Japan & China due
to maritime territorial dispute
• ASEAN Economic Community 2015,
ASEAN+1FTAs: ASEAN represents a large
potential market of 600 million people
Threats
• Strong peso
• Global uncertainty, economic
slowdown in the developed world

67
Large market opportunities for our industries are offered by the ASEAN Economic
Community market of 600 million people. At the same time, there are also opportunities for
the Philippines as an alternative investment site given the rising costs in China, conflict between
China and Japan, and the calamities in Japan and Thailand that affected their industry supply
chains. One important threat, however, is the peso appreciation, although recently, the peso has
been depreciating (refer to the SWOT Analysis).
With strong collaboration among national agencies, local government units, and the
private sector to improve the country’s infrastructure and investment climate; strengths such as
low and stable wages, abundant, young, skilled, English speaking workers and a Roadmap
providing the strategy and direction for the upgrading, diversification and transformation of the
manufacturing industry; the Philippines is well positioned to attract new investments that would
catalyze growth and development of the manufacturing industry.
A new industrial policy is needed not only to generate jobs and reduce poverty but also
to take advantage of these market opportunities. To lay the foundation of becoming a major
growth driver, technology upgrading and transformation of the manufacturing industry would
be required. Structural transformation refers to the process of climbing the industrial ladder,
moving into higher value added sectors as sources of production advance. Industrial and
technological upgrading are best promoted by a facilitating government, a government that
facilitates private sector’s ability to exploit the country’s comparative advantage.
B. Necessary Conditions for Industry Upgrading
The main components of the new industrial policy are described in Table 22. Good
infrastructure and efficient institutions are necessary to support the new economic environment.
The government should substantially increase investment spending and strengthen its weak
institutional and regulatory environment. Note that removing the obstacles to growth is not
enough, a growth oriented action is needed as an accompanying strategy. Efficient resource
allocation would require a competitive exchange rate, an open trade regime and institutions that
can enforce contracts and enable markets to function. To attract capital accumulation,
government should have sustainable macroeconomic policies, sound tax policies and
administration and an efficient bureaucracy. Moreover, the private sector would require secure
property rights, stable macro economy, and access to finance. To encourage technological
catch-up, institutions that promote adaptive research and patent regime along with trade and
investment policies that attract foreign direct investment are necessary. To make growth more
inclusive, focus on SME development as well as on growth outside the economic centers of
NCR, Central Luzon and CALABARZON. Equally important is the need to increase the
productivity of the agriculture sector and strengthen its linkages with the manufacturing
industry towards the development of the agribusiness sector.
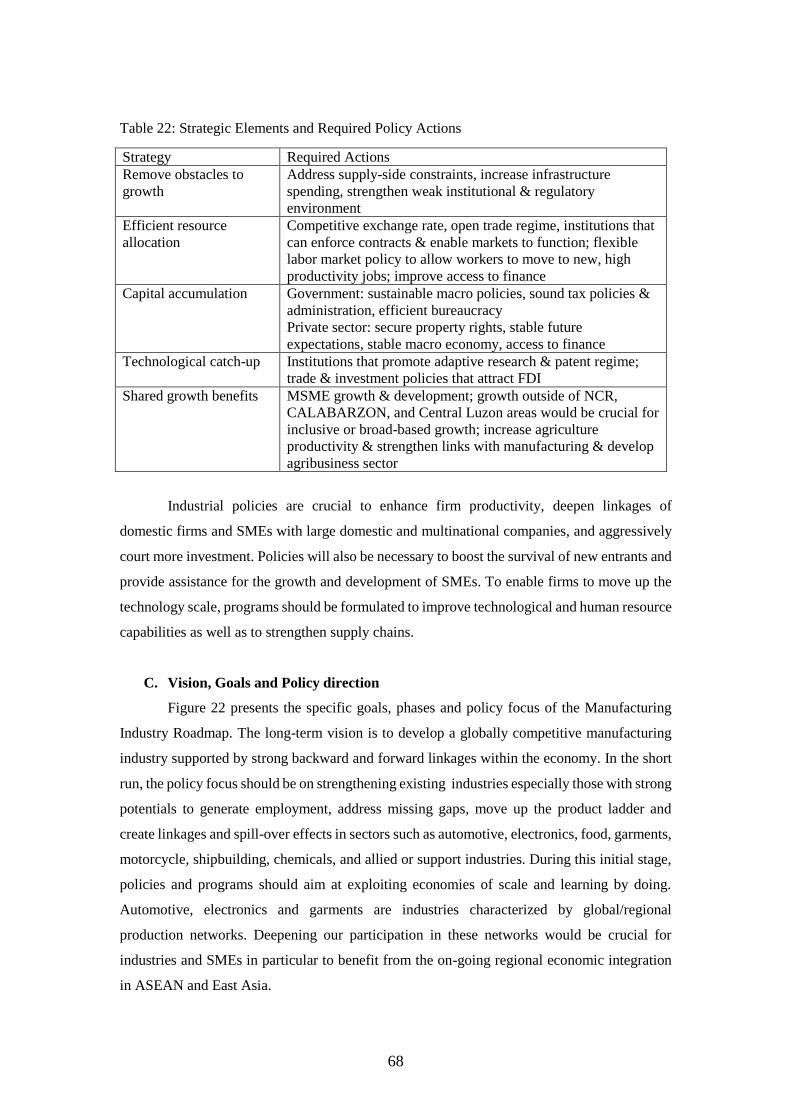
68
Table 22: Strategic Elements and Required Policy Actions
Industrial policies are crucial to enhance firm productivity, deepen linkages of
domestic firms and SMEs with large domestic and multinational companies, and aggressively
court more investment. Policies will also be necessary to boost the survival of new entrants and
provide assistance for the growth and development of SMEs. To enable firms to move up the
technology scale, programs should be formulated to improve technological and human resource
capabilities as well as to strengthen supply chains.
C. Vision, Goals and Policy direction
Figure 22 presents the specific goals, phases and policy focus of the Manufacturing
Industry Roadmap. The long-term vision is to develop a globally competitive manufacturing
industry supported by strong backward and forward linkages within the economy. In the short
run, the policy focus should be on strengthening existing industries especially those with strong
potentials to generate employment, address missing gaps, move up the product ladder and
create linkages and spill-over effects in sectors such as automotive, electronics, food, garments,
motorcycle, shipbuilding, chemicals, and allied or support industries. During this initial stage,
policies and programs should aim at exploiting economies of scale and learning by doing.
Automotive, electronics and garments are industries characterized by global/regional
production networks. Deepening our participation in these networks would be crucial for
industries and SMEs in particular to benefit from the on-going regional economic integration
in ASEAN and East Asia.
Strategy Required Actions
Remove obstacles to
growth
Address supply-side constraints, increase infrastructure
spending, strengthen weak institutional & regulatory
environment
Efficient resource
allocation
Competitive exchange rate, open trade regime, institutions that
can enforce contracts & enable markets to function; flexible
labor market policy to allow workers to move to new, high
productivity jobs; improve access to finance
Capital accumulation
Government: sustainable macro policies, sound tax policies &
administration, efficient bureaucracy
Private sector: secure property rights, stable future
expectations, stable macro economy, access to finance
Technological catch-up
Institutions that promote adaptive research & patent regime;
trade & investment policies that attract FDI
Shared growth benefits
MSME growth & development; growth outside of NCR,
CALABARZON, and Central Luzon areas would be crucial for
inclusive or broad-based growth; increase agriculture
productivity & strengthen links with manufacturing & develop
agribusiness sector

69
Figure 22: Manufacturing Industry Roadmap for Structural Transformation And Inclusive
Growth: Specific Goals and Policy Guidelines
In the medium-term and as domestic capacities are reached, efforts in the initial stage
should lead to expansion and new investments especially in the upstream, intermediate or core
sectors such as iron and steel and other metals as well as in parts and components industries.
By linking manufacturing with agriculture, mining, and services; supply chain gaps will be
addressed and forward and backward linkages will be strengthened.
Note that strengthening the manufacturing industry would require a more
comprehensive approach aimed towards the same goal of transforming the agriculture sector
towards the growth and development of agribusiness (which is strongly linked to
manufacturing). Similarly, productivity increases in the services sector must also be pursued.
The services sector goes beyond the IT and IT enabled services sub-sector and covers a broad
range of sectors such as transport, education, health, construction, tourism, and others.
Intensified focus should be given to increasing infrastructure investment, a necessary condition
to generate supply-side responses arising from market reforms. A “big bang” infrastructure
spending is crucial in order to address main problems of infrastructure development
contributing to the poor performance of industries. Improvements in infrastructure facilities and
services translate into productivity gains and competitiveness increases in industries notably in
manufacturing, agriculture, and tourism.
In the long-run, a globally competitive manufacturing industry with strong forward and
backward linkages is envisioned to increase its contribution to 30% of total value added and
15% of total employment. Supported by a strong parts and components sector and inputs from
Short-run: 2014-2017
-maintain competitiveness of comparative advantage industries
-strengthen emerging products particularly those linked with global/regional production networks
Long-run: 2021-2025
-globally competitive manufacturing industry with strong forward & backward linkages
-deepen participation in regional economic integration by serving as hub for auto, electronics, machinery, garments, and food
Medium-run: 2017-2021
-shift to high value added activities
-investments in upstream or core sectors
-link & integrate manufacturing, agriculture & services
-transform agriculture, increase productivity of agribusiness
- close gaps in value/supply chains
-big bang infrastructure spending

70
a productive agriculture sector as well as well-managed supply chains, the Philippines is
expected to play a vital role in the regional and international production networks of companies
engaged in automotive, electronics, garments and food.
D. Three Pillars of the Roadmap: Vertical Measures, Horizontal Measures and
Coordination Mechanism
The Manufacturing Industry Upgrading Roadmap aims to increase the contribution of
manufacturing to 30 percent of total output and 15 percent of total employment. There are three
main pillars to achieve these targets: vertical measures, horizontal measures, and government-
industry coordination mechanism (see Figure 23).
Figure 23: Three Pillars of the Manufacturing Industry Upgrading Roadmap
30% value added and
15% employment
contribution
Horizontal Measures
Coordination Mechanism
Vertical Measures
HRD & skills
SME development
Technology upgrading,
innovation, common
facilities
Investment promotion
Power, smuggling, logistics
& infrastructure
Competitive exchange rate
Close supply chain gaps:
access to raw materials
in furniture, garments, food
processing
integration mechanism
for copper, iron & steel &
chemicals
Expand domestic market &
exports: automotive &
shipping
open trade regime, sustainable macro policies, sound tax policies & administration,
efficient bureaucracy, secure property rights

71
1. Vertical Measures
To achieve the specific objectives outlined in Figure 22 and to overcome the most
binding constraints to growth, upgrade industries and make markets work; the following
vertical or industry specific measures are recommended:
a) Address gaps in industry supply chains
Copper: establish an institutional mechanism to fully integrate the industry
Furniture: establish supply hubs for raw and natural materials
Tool and die: access to raw materials, equipment, & software
Iron and steel: full integration of the industry up to mining; reliable supply of iron
ore and coal
Motorcycle and motorcycle parts: strengthen local parts industry to improve its
linkage with assembly
Petrochemical: enhance the competitiveness of downstream products
Plastic: encourage the growth of the recycling industry; provide incentives for
upgrading
Biodiesel: develop feedstock through seedling development for high yield
coconuts and other energy crops; map suitable areas for biodiesel feedstock
production
Paper: expand fiber raw material base, develop massive tress plantations and
commercial agro forestry integrated with virgin wood pulp production
Engineered bamboo: establish plantations where processing will also be carried
out; create a task force to find 100,000 hectares of land and a working group of
scientists to identify the plantations to be used as source of quality planting stocks
b) Expand the domestic market base and exports
Automotive: fiscal and non-fiscal incentives to rebuild the domestic market.
Ship building: implement RA 9295 (retirement of old vessels, restrictions on vessel
importation); demand development in domestic offshore and maritime sectors.
Note that industry upgrading is fraught with market failures and to allow the market to
work, a pro-active government to address externalities and coordination problems such as
access to raw materials, access to finance or measures to encourage first movers in new areas
to address information externalities would be crucial. To address information externalities, the
first mover has to be compensated. Entry into a new area can yield two results, success or
failure; both provide a source of information. If entry is successful, a signal is sent to other
market players that the activity is profitable and society benefits. But if entry leads to a failure,
costs are borne by the firm alone. Given this asymmetry, the government must intervene.

72
For instance, the necessary parts and supplies for motor vehicles are not yet present in
the country. The production of vehicle engine would be brought in the country only when it
becomes feasible to assemble vehicles at a certain volume. To rebuild domestic automotive
production, temporary and limited fiscal support along with non-fiscal measures would be
needed in order to expand domestic market and achieve scale economies that would allow the
industry to participate in the international and regional production activities of global
automakers. Government support will be crucial if we want to become a major player in the
third wave of motorization which is expected to take place in the Philippines by 2016.
Under similar circumstances, limited fiscal incentives and other support may be
granted to the first mover. The granting of temporary incentives would be based on strict
criteria and guidelines on the potential of the activity to (i) generate employment, (ii) address
missing gaps in the supply/value chain or to move up the value chain or product ladder, (iii)
generate spill-over effects to the economy, and (iv) promote a competitive market environment.
2. Horizontal Measures
To overcome the cross-cutting constraints, the following horizontal measures are
recommended:
a) HRD and skills training programs
Design human resource development and training programs to improve skills in the and at the
same time, establish tie-ups with universities and training institutions. Note that with educated
and well-trained workers, it is easier to learn new skills and enter new trades. The following
skills have been identified as crucial for the development of industries:
Auto parts; tool and die: design, tool making, prototyping, molding, die & casting
Chemical, rubber, plastics: chemical engineering, materials engineering
Furniture: supervisory, managerial, consultancy for improved productivity
Metal casting: foundry technology, metallurgical engineering, mechanical
engineering, industrial engineering, metal casting engineering
Iron and steel: vocational trainings from TESDA
b) SME development and innovation
Support SME development through appropriate innovation incentives and mechanisms such
common service facilities (for example, quality testing) and R&D facilities, clustering, and
industry-academe linkages for new product development and applied technology for
indigenous products/raw materials. Grants, loans, innovation vouchers, and counterpart
funding to innovative firms and technical assistance to promote long-term research
collaboration between universities and business are also important.
73
c) FDI promotion
Pursue aggressive and strategic promotion and marketing programs to attract more foreign
direct investments especially those that would bring in foreign technologies. Consolidate and
intensify the investment promotion efforts of BOI, PEZA, Clark, and Subic.
d) Business environment improvement
Improve the business environment by addressing smuggling, high cost of power, high domestic
shipping (including port charges), inadequate infrastructure. Speed up and facilitate the
implementation of Private Public Partnership programs to finance ports, airports, highways,
electricity grids, telecommunications and other infrastructure along with improvements in
institutional effectiveness particularly in curbing smuggling.
e) Competitive exchange rate
Maintain a competitive exchange rate17 in order to support and strengthen the new industrial
policy of the government. Manage the exchange rate to tip the balance slightly in favor of
exports, prevent surge of capital inflows and avoid excessive appreciation of the peso. Aware
of these concerns, the BSP has implemented some measures such as the ban on foreign funds
in special deposit accounts (SDA), lowering of SDA interest rates, and cap on non-deliverable
forwards for banks (to take effect in March 2014); although many still perceive these measures
to be relatively mild and suggest more stringent forms if inflows persist and the need to balance
the inflation objective versus the competiveness goal.
3. Coordination Mechanism
While the private sector is seen as the major driver of growth, the government has an
important role to play in coordinating policies and necessary support measures that will address
the obstacles to the entry and growth of domestic firms. In the short-run, except for a very few
sectors (automotive) and SME support mechanisms such as innovation and common support
facilities; the granting of temporary hard industrial policy measures like fiscal incentives is not
the most binding constraint affecting the growth of most industries. Industry analysis and
consultations show that coordination failures are the most crucial factors that must be addressed
to catalyze industry development in the country. For instance, implementation of approved
legislations (RA 9295 in shipping); strict enforcement of product quality standards; measures
providing access to raw materials, intermediate inputs and common service facilities; and
aggressive investment promotion and marketing to attract investments are some of the measures
17 The peso has been depreciating recently after the US Federal Reserve’s announcement that it would
end its aggressive monetary stimulus along with jitters over China’s economic slowdown.

74
that can be implemented by the present administration. In all these, close coordination among
government agencies and the private sector as well as effective policy implementation would
be vital for industry development. Equally important is for the government to focus its efforts
in addressing the high cost of power, domestic shipping, and smuggling which are the most
binding horizontal constraints affecting most industries.
It is within this context that coordination mechanisms will be designed to allow more
interaction between government agencies and industries in identifying obstacles and
determining the most appropriate interventions. The Department of Trade and Industry will
lead the process of coordination with the different government agencies, local government units
and industries. Industry and government champions have been identified by the DTI-BOI in
carrying out these coordinative functions. Table 23 identifies the roles of the different agencies
in implementing the roadmaps of the different industries.
Table 23: Government Coordination Needed in the Implementation of Vertical Measures Sector Policy Area Agencies Responsible
Auto fiscal & non-fiscal incentives to attract
manufacturers
DTI-BOI, DOF
Auto parts fiscal & non-fiscal incentives
competitiveness measures
SME access to finance
DTI-BOI, DOF, DTI-SBC
Engineered
Bamboo 100,000 hectares of land for bamboo
plantations
R&D support
DOST, DA, DENR
Biodiesel implement mandate for B5 DOE
Chemicals industry clustering DTI, PEZA, DILG
Ceramic Tiles implementation of mandatory certification
rule
DTI-BPS
Copper mechanisms for industry integration &
clustering
DTI-BOI
Furniture supply hubs for raw materials, marketing
and promotion support
DILG, DTI
Iron & Steel support for transition to high value
products
DOST, DTI
Metal casting establish foundry institute, training &
education programs; SME finance access
CHED, TESDA, DTI-SBC
Motorcycle
assembly streamlining BOC and LTO regulations,
testing facility upgrade
BOC, LTO, DTI, DOST
Motorcycle
parts capacity building & technology upgrade DOST, DTI
Paper expansion of fiber raw material base, tree
plantations & integration of agro-forestry-
pulp production
DA, DENR, DTI-BOI
Petrochemicals review of EO61 NEDA, DTI, TC
Plastics support for recycling industry; research-
based waste management programs
DTI, DILG
Rubber
Products EO for Phil Rubber Industry Council;
testing facilities
DA, DOST
Shipbuilding investment promotion campaign;
retirement of old vessels
DTI, MARINA

75
Tool & Die inclusion in IPP, fiscal incentives; SME
finance access
DTI-BOI, DOF, DTI-SBC
For the roadmap to be successfully implemented, the support of the following
government agencies would be critical:
• DOE: energy plan; cost, supply adequacy and reliability
• DPWH, PPA, PPPC: infrastructure development (roads, airports, ports)
• DOLE: policies affecting hiring and firing of workers; movement of workers towards
new, high productivity jobs
• TESDA, DOLE, PRC, CHED, DepEd: human resource development, training of
workers, skilled workers needed (supply gap)
• DOST: innovation strategy, R&D, common facilities/laboratories for product testing
and certification, expansion of incubation facilities
• NEDA: national development plan
• DA: agriculture roadmap
• Tariff Commission: review tariff structure to address distortions, implementation of
anti-dumping and safeguard measures
• DTI-BPS, DOH-BFAD, DA-BAFPS: establishment and enforcement of product
standards
• Bureau of Customs: smuggling, trade and customs facilitation
• IPOPHIL: patents, secure intellectual property rights
• Department of Finance, DBM: temporary incentive measures
• BSP: exchange rate policy
• BOI, PEZA, Clark, Subic and other Investment Promotion Agencies: industry
promotion
• DTI-MSMED, DOST: MSME development
• LGUs: business permits and regulations (double taxation)
• DENR: environmental permits, plantations
• PPA and MARINA: regulatory and port charges; domestic shipping policy
E. Concluding Remarks
The Roadmap is about facilitation and coordination to remove the most binding
constraints to growth and creation of the right policy framework to encourage the development
of the private sector along the lines of our country’s latent comparative advantage. The
government is not the proximate cause of growth but private sector, entrepreneurship and
investment. The roadmap implementation will be private-sector led while the government acts
as facilitator. As facilitating government, it will encourage producers to take risks, correct

76
market and government failures and address changes in policies and institutions. Support
programs will be regularly monitored and evaluated in terms of performance and contribution
to growth and employment.
Through the creation of industry councils, government and industry can collaborate in
continuously pursuing technological upgrading and sustained growth. By creating the proper
environment and strengthening industries to ensure that they are not disadvantaged by
international competitors, the government can promote the success of domestic firms in both
the local and international markets that will lead to economic transformation. Firms, in turn,
are expected to put innovation (product, process, marketing) and technology upgrading at the
apex of their strategy in order to improve their productivity that can lead to “smart” growth.
Only with the right environment can manufacturing unleash its full potentials to take advantage
of the market opportunities currently facing us and become an engine for sustained, inclusive,
and smart growth, quality job creation, and ultimately, poverty reduction.
References
Aldaba, R. 2010. “Does Trade Protection Improve Firm Productivity? Evidence from Philippine Micro
Data”. Paper submitted to ERIA in March 2010.
Amiti, Mary and Jozef Konings. (2004). “Trade Liberalization, Intermediate Inputs and Productivity:
Evidence from Indonesia.” IMF Working Paper No. WP/05/146. International Monetary Fund.
Asian Development Bank. 2007. Country Diagnostics Study. Manila Philippines.
Commission on Growth and Development. 2008. The Growth Report Strategies for Sustained Growth
and Inclusive Development. The IBRD/World Bank.
Fabella, R. and M.C. Fabella. 2012. Development Progeria? In Looking Back, moving Forward. Business
World Publishing Corp. Quezon City.
Fernandes, A. (2003). “Trade Policy, Trade Volumes and Plant Level Productivity in Columbian
Manufacturing Industries.” World Bank Working Paper 3064.
Hausman, Ricardo, Dani Rodrik and Andres Velasco. 2005. Growth Diagnostics.
Herrin, A.N. and E.M. Pernia. 2003. Population, human resources, and employment. In The Philippine
economy: development, policies and challenges, edited by A. Balisacan and H. Hill. New York:
Oxford University Press
Krishna, Pravin And Devashish Mitra (1998). “Trade Liberalization, Market Discipline and Productivity
Growth: New Evidence from India.”Journal of Development Economics, 56(2): pp 447-462.
Impulliti, G. and Omar Licandro. 2009. “Trade, Firm Selection, and Innovation: The Competition
Channel”. May 2009.
Licandro, O. and Antonio N. Ruiz. 2010. “Trade Liberalization, Competition and Growth”. February
2010.
Lin, Justin Yifu. 2011. “From Flying Geese to Leading Dragons: New Opportunities and Strategies for
Structural Transformation in Developing Countries”. WIDER Lecture, Maputo, Mozambique.
4 May 2011. http://papers.ssrn.com/sol3/papers.cfm?abstract_id=1871599
Lin, Justin Yifu. 2012. Structural Economics A Framework for Rethinking Development and Policy. The
World Bank. Washington, D.C.
Melitz, M. (2002). “The Impact of Trade on Intra-Industry Reallocations and Aggregate Industry
Productivity.”NBER Working Paper Series 8881.
Muendler, M-A. (2004). “Trade, Technology, and Productivity: A Study of Brazilian Manufactures,
1986-1998.”Mimeo. UC San Diego.
Pavcnik, N. (2000). “Trade Liberalization, Exit, and Productivity Improvements: Evidence from Chilean
Plants.” NBER Working Paper No. W7852
Nomura Research Institute, Ltd. JICA. 2010. Study on the Supply Chain Electronics Industry in the
Philippines.

77
Nomura Research Institute, Ltd. JICA. 2012. Accelerating FDIs in Philippine Shipbuilding Industry.
Powerpoint presentation. DTI/BOI Shipbuilding Workshop. November 23, 2012.
Record, Richard and Konesawang Nghardsaysone. 2010. Lao PDR Development Report 2010. Export
Dynamics and Diversification in Lao PDR. An analysis of the product space. Lao PDR Trade
Development Facility.
Schor, A. (2004). “Heterogeneous Productivity Response to Tariff Reduction: Evidence from Brazilian
Manufacturing Firms.” NBER Working Paper 10544.
Topalova, P. (2004). “Trade Liberalization and Firm Productivity: The Case of India.” IMF Working
Paper WP/04/28.
Usui, Norio. 2012. Taking the Right Road to Inclusive Growth: Industrial Upgrading and Diversification
in the Philippines. Asian Development Bank. Manila
World Bank. 2007. “Philippines invigorating growth, enhancing its impact”, Report No. 39226-PH,
PREM Unit East Asia and Pacific Region.
World Bank. 1993. The East Asian Miracle Economic Growth and Public Policy. Oxford University
Press. New York.
Appendix 1: Production Process in Auto Manufacturing
Source: Auto Alliance Thailand
P.19
u Parts supplier
u Paint shop
u Trim & Final Shop
u Body shop
Body u Inspection u Shipment
Part warehouse
u Parts supplier Steel Sheet
Press Arranging & carrying
Painting Vehicle assembly
Sequence Delivery Lot carrying
Engine & Suspension
Transmission
Chassis ASSY
u Powertrain shop
Order production & Supply of parts
Ø 177 Production Component Suppliers.
Ø 15 Suppliers in surrounding ESIE.
Body Parts
u Stamping shop
Closure Panel
Production Process in Manufacturing

78
Appendix 2A: Thai Mechanism for the Industry Restructuring Plan Formulation and
Implementation
Appendix 2B: Philippines and Thailand Figure 1 compares the manufacturing shares of the Philippines, Thailand, Malaysia, and Indonesia.
Though the Philippines was ahead of Thailand in the early 1980s, after 1987, Thailand’s manufacturing
share started to rise and reached its peak at 30% during the period 2001-2005 and 31% in 2006-2010.
Thailand took about 20 years to increase manufacturing contribution from 22% to 30% and double its
employment share from 7.5% to 15%. The table below shows that in Thailand, the average share of
manufacturing went up substantially from 23.8% from 1981 to 1985 to almost 28% during the period
1991 to 1995, which is a span of about ten years. In the next decade, its average share increased from
27% during the period 1996 to 2000 to 30.38% in 2001 to 2005.In terms of its employment contribution
0.00
5.00
10.00
15.00
20.00
25.00
30.00
35.00
19
81
19
83
19
85
19
87
19
89
19
91
19
93
19
95
19
97
19
99
20
01
20
03
20
05
20
07
20
09
20
11
Sh
are
, in
%
Figure 1: Manufacturing Share, 1981-2011
PH
TH
MAL
INDO
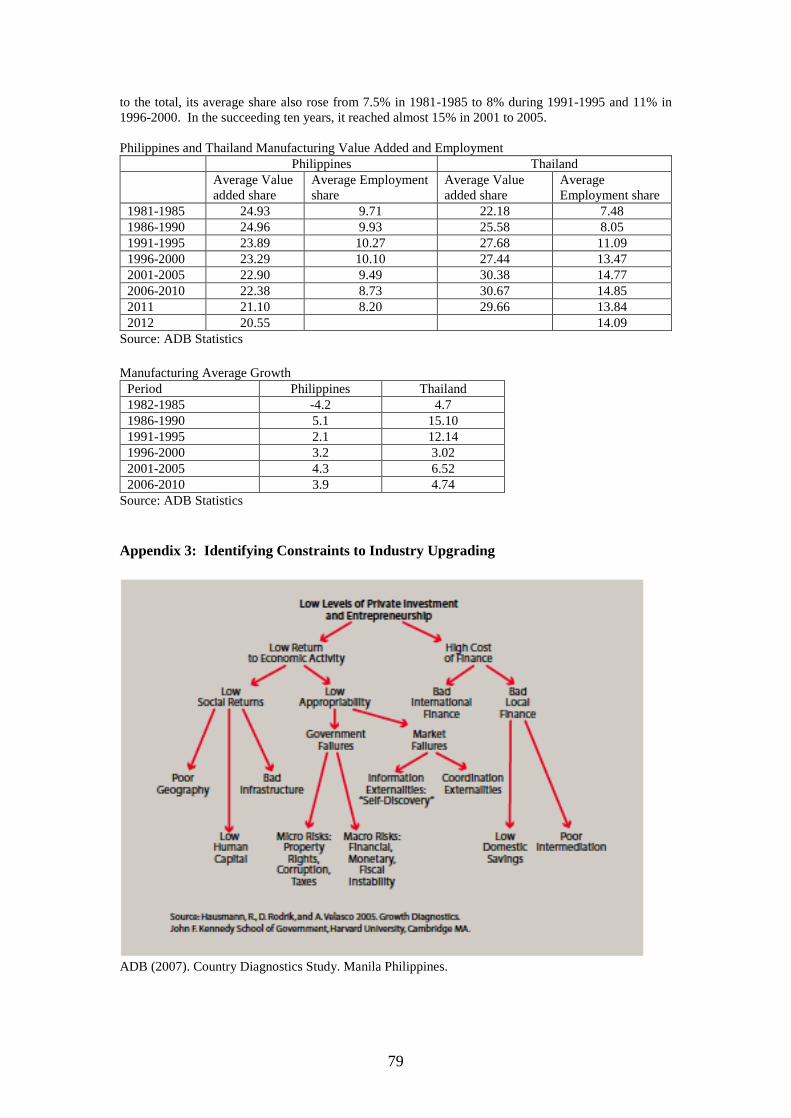
79
to the total, its average share also rose from 7.5% in 1981-1985 to 8% during 1991-1995 and 11% in
1996-2000. In the succeeding ten years, it reached almost 15% in 2001 to 2005.
Philippines and Thailand Manufacturing Value Added and Employment
Philippines Thailand
Average Value
added share
Average Employment
share
Average Value
added share
Average
Employment share
1981-1985 24.93 9.71 22.18 7.48
1986-1990 24.96 9.93 25.58 8.05
1991-1995 23.89 10.27 27.68 11.09
1996-2000 23.29 10.10 27.44 13.47
2001-2005 22.90 9.49 30.38 14.77
2006-2010 22.38 8.73 30.67 14.85
2011 21.10 8.20 29.66 13.84
2012 20.55 14.09
Source: ADB Statistics
Manufacturing Average Growth
Period Philippines Thailand
1982-1985 -4.2 4.7
1986-1990 5.1 15.10
1991-1995 2.1 12.14
1996-2000 3.2 3.02
2001-2005 4.3 6.52
2006-2010 3.9 4.74
Source: ADB Statistics
Appendix 3: Identifying Constraints to Industry Upgrading
ADB (2007). Country Diagnostics Study. Manila Philippines.

80
Based on the above framework, private investment will be weak if social returns to investments
are too low, private appropriability of the social returns is too poor, and/or the cost of financing
is too high. Low social returns to investment could be due to insufficient levels of
complementary factors of production (human capital, technical know-how, and/or
infrastructure). Poor private appropriability could be caused by government failures (like
macroeconomic instability, excessive taxation, and poor property rights and contract
enforcement) or market failures (information externalities and coordination externalities18).
High cost of finance could result from low domestic savings, poor intermediation in the
domestic markets, or poor integration with external financial markets.
18 An externality occurs when the activity of one person or firm affects the welfare of another person or
firm in a way that is not transmitted by market prices. An externality may be negative (it imposes a cost
on the other party that is not paid by the producer) or positive (it benefits or spills over to the other party).
When private parties cannot solve an externality problem, then in principle, government intervention can
enhance efficiency. In the presence of an externality, the market fails to produce the socially desired
quantity of the good. In the real world, competition may not hold and not all markets may exist. Hence,
the market-determined allocation of resources is not likely to be efficient. There are, then, opportunities
for government to intervene and enhance economic efficiency. But while efficiency problems provide
opportunities for government intervention in the economy, they do not require it. That the market-
generated allocation of resources is imperfect does not mean that the government can do better.


