
NILE BASIN INITIATIVE
THE NILE BASIN DECISION SUPPORT SYSTEMBEST NATIONAL APPLICATION CASES 2015

THE NILE BASIN COUNTRIES
!.
!.
!.
!.
!.
!.
!.
!.
!.
!.
!.
!.
!.
!.
!.
!.
!.
!.
!.
!.
!.
!.
!.
!.
!.
!.
!.
!.
!.
!.
!.
!.
!.
!.
!.
!.
!.
!.
!.
EGYPT
KENYA
DR CONGO
SUDAN
ETHIOPIA
ERITREA
UGANDA
TANZANIA
RWANDA
BURUNDI
SOUTHSUDAN
Suez
Aswan
Cairo
Luanda
Asmara
Kigoma
Murzuq
Mtwara
Dodoma
Huambo
Matadi
Kigali
Bangui
Nairobi
Mombasa
Kampala
El-Giza
Kahemba
Kananga
OmdurmanKhartoum
Djibouti
Banghazi
Mbandaka
El Obeid
Kinshasa
Benguela
Maiduguri N'Djamena
Kisangani
Bur Sudan
Lumumbashi
Adis Abeba
Alexandria
Wadi Halfa
Brazzaville
Dar es Salaam
0 290 580145
Kilometers
Nile Basin InitiativeNile Sec- GIS UnitPlot 12 Mpigi RoadP.O Box 192, EntebbeEmail: [email protected]:www.nilebasin.org
¯
THE NILE BASIN COUNTRIES

ABBREVIATIONS AND ACRONYMSNB-DSS Nile Basin Decision Support system
MCA Multi criteria analysis
NBI Nile Basin Initiative
RNRA Natural resources Authority
GERD Ethiopian Grand Renaissance Dam
IDB Internal Drainage Basin
IDBWB Internal Drainage Basin Water Board
LIST OF FIGURESFigure 1 Tana Sub Basin administrative and geographical location 7
Figure 2 Tana Beles Hydropower Production 9
Figure 3 Lake Tana Surface area 9
Figure 4 Lake Tana Water Level fluctuation 9
Figure 5 Nyando River Basin Area. 10
Figure 6 Data input for rice 12
Figure 7 Schematization of the Mike Hydro Model 12
Figure 8 Hydrological network of Sebeya catchment 13
Figure 9 The NB-DSS Sebeya workspace Model 14
Figure 10 Daily Discharge for each scenario 15
Figure11 Study Area. 16
Figure 12 Reduction in Peak Flows 18
Figure 13 Percentage increase in minimum inflows to Roseires reservoir 18
Figure 14 Map of the study area describing salient features 19
Figure 15 Schematization of IDB DSS in Bubu Sub Basin 20
Figure 16 Pyramidal shape of scenario scores based om MCDM analysis 21
LIST OF FIGURESTable 1 Daily inflow and outflow of each dam 15
Table 2 Criteria calculated values 17
Table 3 Final Ranking of the scenarios 18
Table 4 Final Scores of scenarios based on MCDM analysis using expert choice 21

TABLE OF CONTENTS
INTRODUCTION 5
ABOUT NILE BASIN DECISION SUPPORT SYSTEM 6
ETHIOPIA 7
KENYA 10
SUDAN 13
RWANDA 16
TANZANIA 19

5NB-DSS APPLICATION CASES2015
Introduction
This booklet showcases winning NB-DSS National Application Cases for the year 2015.
In order to acknowledge, grant and support users of the NB-DSS for growing applications,
informative case studies and profound contribution to the sustainable management of the
Nile Basin Water resources, the NBI Secretariat organized the first ever NB-DSS Application
Awards . The objective of the annual Award is also to document and promote the use and
applicability of the NB-DSS as well as to strengthen its user community.
Habtam Achenef of Abby Basin Authority in Ethiopia won the top prize for his application of
NB-DSS to support development of the Lake Tana Basin Integrated Water Resources Plan.
The 1st runner-up prize went to both Omar Munyaneza from Rwanda and George Owiti from
Kenya. Munyaneza used the tool to model the Sebeya dam for flood control in the Sebeya River
Catchment, Rwanda while Owiti applied the tool to address water management issues in the
Nyando catchment, Kenya. Bugingo Davis won the 2nd runner-up prize in recognition of his
application of the NB-DSS for supporting water permit system in the Mukungwa catchment,
Rwanda.
Members from the countries that participated in the user community workshop.

About Nile Basin Decision Support System
The NB-DSS was designed to meet the requirements of complex water resources planning. It
provides diverse toolsets for data processing, modeling, scenario management, optimization
and multi-criteria decision making.
If offers tools for integrating environmental, social and economic objectives thus greatly
facilitating multi-sector water resources planning at river basin level.
The DSS is a generic system that can be applied at different scales both national and
Transboundary levels. It can be installed both within an institutional setup, thereby allowing
multiple access to its central database and toolset and also as a stand alone solution.
NBI has enhanced the DSS tool with additional features, acquired other 300 licenses, offered
user training manuals and standardized training modules for the countries. The countries
have used the tool to answer questions about expected benefits and potential impacts of the
planned development interventions.
It provides diverse toolsets for data processing,
modeling, scenario management, optimization
and multi-criteria decision making.
7NB-DSS APPLICATION CASES2015
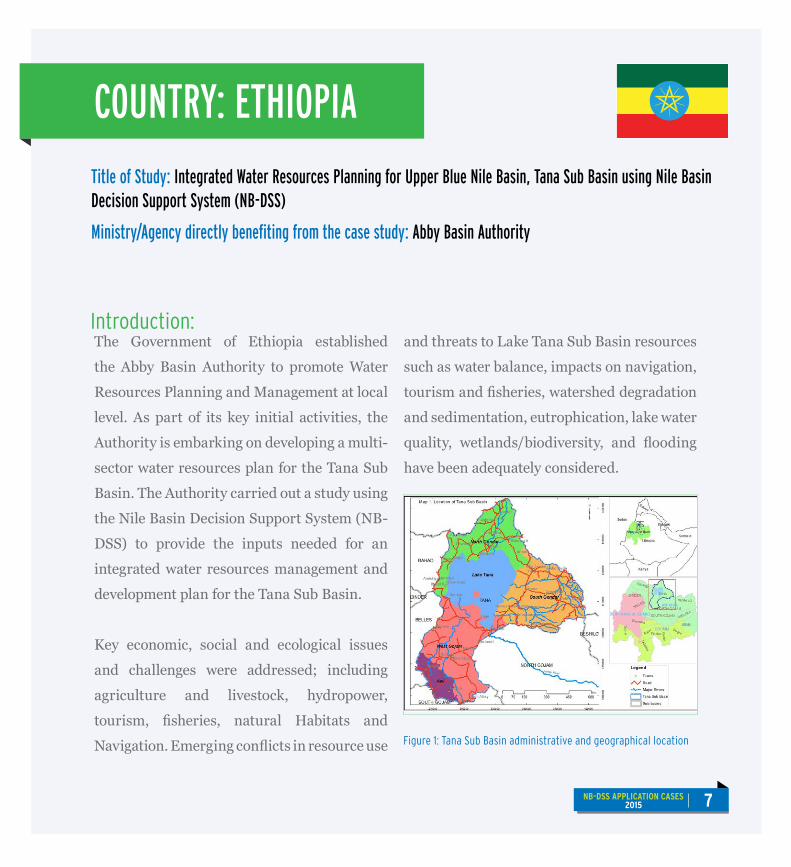
The Government of Ethiopia established
the Abby Basin Authority to promote Water
Resources Planning and Management at local
level. As part of its key initial activities, the
Authority is embarking on developing a multi-
sector water resources plan for the Tana Sub
Basin. The Authority carried out a study using
the Nile Basin Decision Support System (NB-
DSS) to provide the inputs needed for an
integrated water resources management and
development plan for the Tana Sub Basin.
Key economic, social and ecological issues
and challenges were addressed; including
agriculture and livestock, hydropower,
tourism, fisheries, natural Habitats and
Navigation. Emerging conflicts in resource use
and threats to Lake Tana Sub Basin resources
such as water balance, impacts on navigation,
tourism and fisheries, watershed degradation
and sedimentation, eutrophication, lake water
quality, wetlands/biodiversity, and flooding
have been adequately considered.
Title of Study: Integrated Water Resources Planning for Upper Blue Nile Basin, Tana Sub Basin using Nile Basin Decision Support System (NB-DSS)
Ministry/Agency directly benefiting from the case study: Abby Basin Authority
COUNTRY: ETHIOPIA
Member states
Burundi DR Congo RwandaEgypt South SudanEthiopia SudanKenya Tanzania Uganda
Introduction:
Figure 1: Tana Sub Basin administrative and geographical location
Objective of the study:
The objective of the study was to evaluate
the impact of irrigation developments of
Tana Sub Basin on Tana Beles Hydropower
Production, Lake Tana Navigation,
Lake Tana Fish Production and System
Evaporation. Intensive trainings and multi-
level stakeholder consultations were under
taken in a participatory manner involving all
stakeholders in the whole process.
NB-DSS Applications:
The modeling system of the DSS hydrology
of the Sub Basin tool was used to collect data
from 1960 to 2005 and future scenarios were
set based on the Government development
interventions plan. Considering the large
number of potential development projects,
a different combination of scenarios could
be developed in order to assess the impact
of individual projects on the downstream
projects. NB-DSS Multi-Criteria analysis
(MCA) tolls were used to evaluate and
thus compare the set of scenarios based
on defined economic, environmental and
social evaluation indicators. Comparative
evaluations were made regarding economic,
social and environmental aspects of the Sub
Basin. Analysis as well as setting weight/ranks
were done together with the stakeholders in
line with the government policy and strategy
frame work.
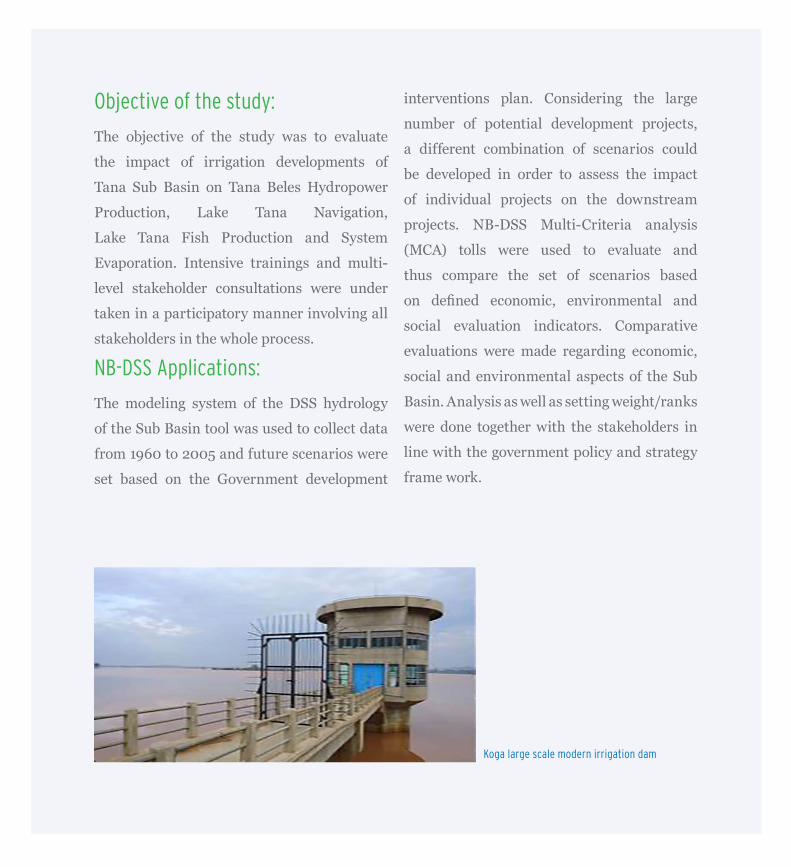
Koga large scale modern irrigation dam

9NB-DSS APPLICATION CASES2015
Conclusion:
Comparing the best case and the
worst case scenarios the Tana Beles
hydropower product decreases by 16%
annually. There is an insignificant loss
in the fish production sector because it
is declining annually by 1% only. The
pump irrigation development in the
future will have a greater influence on
the Lake navigation. This is shown by an
increase in the number of days per year
where the lake level decreases below
1785 (MSL), when navigation will not
be possible for a duration of 35 to 141
days/year. Evaporation is increasing in
all scenarios. It was therefore concluded
that in the context of water resource
planning and management, application
at Basin and Sub Basin level is very
useful and informative.
The pump irrigation
development in the
future will have a
greater influence on the
Lake navigation
Figure 2: Tana Beles Hydropower Production
Figure 3: Lake Tana Surface area
Figure 4: Lake Tana Water Level fluctuation

Objective of the study:
The main objective of this study was to
investigate the impacts of floods downstream
and what other uses can be invented as the
government struggles with containing the
negative effects of floods downstream.
The NB-DSS was therefore used to answer key
questions such as:
■ How can the negative impacts of floods
downstream be contained?
■ Rather than leaving this water to go to the
lake, what other uses can it be subjected
to in improving the economic status of the
residents and the county?
COUNTRY: KENYA
Title of Study: NBI-DSS Case Study On the highly populated and complex Nyando River Basin
Ministry/Agency directly benefiting from the case study: Ministry of Water, Environment & Natural Resources
Introduction:
The Nyando River Basin is highly populated
and complex river system that involves many
competing users/stakeholders. It joins the
stream flows from the Nandi escarpment,
the two regional Counties and the City of
Kisumu; it floods during rainy season hence
creating a disaster throughout Kano planes.
Member states
Burundi DR Congo RwandaEgypt South SudanEthiopia SudanKenya Tanzania Uganda
Figure 5: Nyando River Basin Area.

11NB-DSS APPLICATION CASES2015
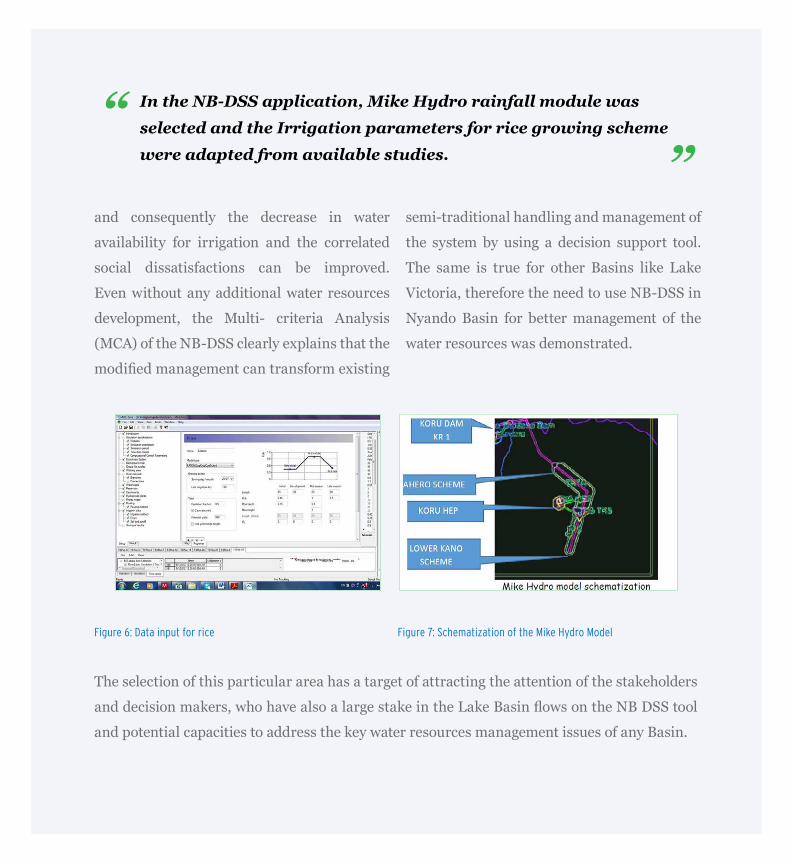
In the NB-DSS application, Mike Hydro
rainfall module was selected and the Irrigation
parameters for rice growing scheme were
adapted from available studies. The impact of
a wide range of possible interventions on the
flow of Nyando River at Ahero station was
analyzed using the following Indicators; Flow
Variability, Dry Low Flow, and Wet Low Flow.
The model was further tested to examine the
possibility of having sufficient water for both
hydropower generation and irrigation of the
two Schemes.
The results of the scenarios and the analyses
by the NB-DSS showed that it is possible to
improve the interventions of the calamity
in the Nyando Sub Basin due to shortage
and inefficient use can be avoided. The
management scenario formulated using the
NB-DSS for the case study indicated how the
deficit and the downstream flow decreases,
NB-DSS Applications:
Effects of floods downstream for residents here, life must continue
The selection of this particular area has a target of attracting the attention of the stakeholders
and decision makers, who have also a large stake in the Lake Basin flows on the NB DSS tool
and potential capacities to address the key water resources management issues of any Basin.
and consequently the decrease in water
availability for irrigation and the correlated
social dissatisfactions can be improved.
Even without any additional water resources
development, the Multi- criteria Analysis
(MCA) of the NB-DSS clearly explains that the
modified management can transform existing
semi-traditional handling and management of
the system by using a decision support tool.
The same is true for other Basins like Lake
Victoria, therefore the need to use NB-DSS in
Nyando Basin for better management of the
water resources was demonstrated.
In the NB-DSS application, Mike Hydro rainfall module was
selected and the Irrigation parameters for rice growing scheme
were adapted from available studies.
Figure 6: Data input for rice Figure 7: Schematization of the Mike Hydro Model

13NB-DSS APPLICATION CASES2015
COUNTRY: RWANDA
Introduction:
Since 2010, Sebeya River with catchment
area of 365 km2 is causing frequent
and serious destructive floods that are
affecting mainly its downstream part
causing severe damages. With the changes
of occupation and utilization of land use
in the Basin between 1988 and 2009, the
Sebeya regime has been changed and
the minimum rates dropped in favor of
the maximum flow. This is remarkable
from floods observed more frequent in
surrounding villages of Mahoko center,
heading towards the upstream of the
river with negative impact to the life and
properties of surrounding people.
Title of Study: Modeling the Sebeya dam using Nile Basin DSS for Flood control in the Sebeya River catchment
Ministry/Agency directly benefiting from the case study: Ministry of Natural Resources (MINIRENA)/ Natural Resources Authority (RNRA).
Study Objectives:
■ To determine the main morphological and
hydrological characteristics of the catchment
area. (Field characteristics, area, rainfall
runoff, precipitation rate, runoff coefficient)
Figure 8. Hydrological network of Sebeya catchment

■ To delay flow in dams and release it once flood events finish
■ To determine the annual input of the retaining basin, accounting for evaporation; Helping
to understand the 3 Design retentions ponds for controlling Floods at Sebeya River network
through the calculation and description of different catchments parameters for all Sebeya
river branches existing upstream Mahoko Center.
The results show that the 3
small dams upstream have
greater impact because the
initial peak discharge was
16.73m3/s and the inflow to
Sebeya main dam is
14.55 m3/s which
corresponds to the
reduction of 2.19m3/s. This
implies that the outflow
of Sebeya main dam is
8.66m3/s.
The NB-DSS enabled the following;
■ The ND-DSS tool helped to address the problem of flooding that was affecting the livelihoods
of people downstream.
■ To assess the impact of dam constructions on flood control along the catchment areas.
■ The outcomes of this study has helped other organizations in Rwanda (RNRA and REMA)
appreciate the ND-DSS tool and will soon be using it in addressing key concerns in water
resources management.
Figure 9: The NB-DSS Sebeya workspace Model

15NB-DSS APPLICATION CASES2015
Based on the above results, the study suggests an additional Sebeya storage pond at the outlet
of the catchment and also another at the outlet of each of the tributaries, with special focus on
delaying flows in dams and releasing it once flood events finish for avoiding negative impact to
the life and properties of surrounding people (releases will have a max of 8m3/s).
DAM PEAKS FLOW (M3/S)PEAK FLOW REDUCED BY EACHDAM(M3/S)
TOTAL FLOW REDUCED BY ALL DAMS (M3/S)
Sebeya Inflow 14.55 5.88
8.07
Main dam Outflow 8.66
Karambo Inflow 3.42 0.60
Outflow 2.82
Bihongora Inflow 2.50 0.44
Outflow 2.06
Gatare Inflow 6.52 1.15
Outflow 5.38Table 1: Daily inflow and outflow of each dam
Figure 10: Daily Discharge for each scenario

Introduction
Using the Nile Basin Decision Support System
(NB-DSS), the study investigated the impacts
of Ethiopian Grand Renaissance Dam (GERD)
and other planned dams across the Blue Nile,
on the existing Blue Nile reservoir systems in
Sudan.
COUNTRY: SUDAN
Title of Study: The Impacts of the Ethiopian Renaissance dam on the Blue Nile reservoir system in Sudan
Ministry/Agency directly benefiting from the case study: Ministry of Water Resources, Irrigation and Electricity
Member states
Burundi DR Congo RwandaEgypt South SudanEthiopia SudanKenya Tanzania Uganda
NB-DSS was used to answer critical questions such as:
■ What are the impacts on the power generated in both countries (Ethiopia and Sudan)?
■ What will be the possible increase in the irrigated area in Ethiopia?
■ To what extent the recurrent floods will be alleviated?
■ To what extent the low flows will be augmented in Sudan?
Figure 11: Study Area.

17NB-DSS APPLICATION CASES2015
Study Objective:
The main objective of the study
was to investigate the impacts
of upstream Ethiopian dams
including the Renaissance
dam on the existing Blue Nile
reservoir systems in Sudan.
Criteria used in scenario comparison
The table below shows the values of the criteria adopted to compare the scenarios in this study
and the final ranking of the studies.
Results of the NB-DSS:
The main results of the study showed the percentage reduction
in peak flood values and the augmentation in low flow with
respect to the baseline scenario (current state). The total
reduction in the annual Blue Nile flows at Khartoum-Soba was
estimated. It should be noted that the peaks and minimum
flows depend largely on the operation policies of the different
reservoirs along the Blue Nile.
Table 2: Criteria calculated values

The social and environmental impacts of the GERD are not fully studied yet. Therefore, this
study may contribute to that on-going debate by shading the light on some hydrological and
economic impacts on the Sudanese side.
Currently 80% of the Blue Nile
flow comes during the three
months of the flood. The two
Ethiopian storage facilities
will redistribute the flood
water over the months of the
year, thus availing water for
the relatively small reservoirs
in Sudan that are mainly used
for irrigation purposes.Table 3: Final Ranking of the scenarios
Figure 12: Reduction in Peak Flows Figure 13: Percentage increase in minimum inflows to Roseires reservoir

19NB-DSS APPLICATION CASES2015
Introduction:
Internal Drainage Basin (IDB) comprises
of nine main Sub Basins and encompasses
a large number of segregated river
networks with several separate aquifers.
This Basin faces a number of water related
challenges including; Increasing water
scarcity and competition for water between
different water users; On the other hand,
some areas are often perceived as having
annually ‘surplus’ water and encounter
recurrent floods during wet seasons. The
combination of this widespread water
resources system with scattered water
demands, accompanied by several water
resources development plans has provided
a very complex and complicated Basin to
be analyzed.
Title of Study: Integrated Water Resources Management and Development Plan using Nile Basin Decision Support System
Ministry/Agency directly benefiting from the case study: Ministry of Water and Irrigation
COUNTRY: TANZANIA
Compiled by Milly Mbuliro, GIS/Remote Sensing Specialist (Nile – SEC, Entebbe)*Source: UN Population Division World Population Prospects 2012
Facts about the Nile Basin
What’s on? January - March 2013
Quiz
Basin Area 3,176 X 103 Km2
Location -4 0S to 310N and 24 0E to 40 0E
Main Tributaries Victoria Nile/Albert Nile, Bahr El Jabel, White Nile, Baro Pibor-Sobat, Blue Nile, Atbara, Bahr El Ghazal
River Length 6,695 Km (one of the world’s longest River)
Estimated Navigable Length 4,149 Km
Countries
Burundi DR Congo
Rwanda
Egypt
South Sudan
Ethiopia
The Sudan
Kenya
Tanzania Uganda Eritrea
Major Lakes within the Basin Lake Victoria, Lake Tana, Lake Kyoga, Lake Albert
Population (Total in all the Nile Countries)* 437 Million
% Population within the Nile Basin* 54% (238 Million)
Temperature Night Minimum -100c and daily Maximum in June 470c
Precipitation Max Annual 2,098 mm/yr in Ethiopia Min Annual 0 mm/yr in Egypt
Mean Annual �ow (Discharge) (m 3/yr) at Aswan 84 X 10 9 m3/yr
Discharge/Unit area 28 X 10 3 m3/Km 2
Main Consumptive Water use Agriculture
Date Activity Venue
Jan NCoRe Project E�ectiveness All Centers
Jan NELTAC/NELCOM Meeting Kigali
11 – 12th Feb Regional Meeting for National NBI Desk O�cers Entebbe
22nd Feb Nile Day celebrations (Regional and National) Bahr Dar, Ethiopia (for regional celebrations)
April 38th Nile-TAC Meeting Entebbe
Compiled by Tom Waako, Projects O�cer, Nile-SEC -Entebbe
Member states
What is the major determinant of population distribution in the Nile Basin?Send your answer to: [email protected]
Answer to the previous quiz question The single most important intra basin agricultural trade commodity by volume among the Nile Basin riparian states is maize.
Burundi DR Congo RwandaEgypt South SudanEthiopia The SudanKenya Tanzania Uganda
Disclaimer: The views expressed in this newsletter do not necessarily represent those of NBI, its Member States or Partners
Editorial CommitteeChair Dorothy KaggwaEditor Jane K. BaitwaMembers Tom Waako John Ogwang
Send us your comments and views
Nile Basin Initiative SecretariatP.O. Box 192 Entebbe – UgandaTel +256 414 321 424 +256 414 321 329 +256 417 705 000Fax +256 414 320 971Email [email protected] http://www.nilebasin.org
Figure 14: Map of the study area describing salient features

Study Objectives:
The Internal Drainage Basin Decision
support system was developed to provide a
comprehensive decision making platform for
major decision makers of IDB with the aim of
evaluation, analysis, and contrast the whole
social, economic, and environmental impacts
of their possible decisions in the Basin. The
objectives of this study were;
■ To allow for planning of the allocation of
water resources over the Basin
■ To monitor current conditions and alert
decision makers what are the main water
related insufficiencies of the Basin
■ To provide water related data bank of the
Basin
■ To find tout he best economically,
socially, and environmentally sustainable
solutions of water conflicts
■ To enhance water resources management
capacities of IDBWB.
The NB-DSS enabled the following;
■ Sound planning of the allocation of water
resources over the Basin;
■ Monitoring current conditions and
alerting the decision makers what are the
main water related insufficiencies of the
Basin;
■ Providing a water related data bank of the
Basin;
■ Identifying the best economically,
socially, and environmentally sustainable
solutions of water conflicts; and enhancing
water resources management capacities of
IDBWB
Figure 15: Schematization of IDB DSS in Bubu Sub Basin

21NB-DSS APPLICATION CASES2015
SCENARIOS SOC. ENV. ECO.
SC0 - Baseline 0.079 0.153 0.490
SC1 - District Plans 0.119 0.148 0.103
SC2 - Fully Structural Development 0.164 0.113 0.173
SC3 - Fully Structural Development and Environmental Conservation 0.162 0.147 0.173
SC4 - Wise Structural Development and Demand Management 0.167 0.147 0.175
SC5 - Impacts of Climate Change 0.157 0.146 0.164
SC6 - Climate Change Adaptation Measures and Practices 0.152 0.145 0.164
The NB-DSS application tool was much appreciated because it led to a common understanding
of the implications, complexities and the best alternatives with their advantages and
disadvantages in water allocation among competing water uses in the Basin.
Below are the results of the different scenarios that were run using Multi Criteria
Decision Making analysis;
Table 4: Final Scores of scenarios based on MCDM analysis using expert choice
Figure 16: Pyramidal shape of scenario scores based om MCDM analysis

nbI DeVeloPMent PaRtneRs36
July 2011 – June 2012
our DevelopMeNt partNers“I thank the Development Partners for the moral, technical and financial support extended to NBI to-date”.
Hon. Alemayehu Tegenu, Ethiopia’s Minister of Water and Energy, speaking as Nile-COM chair during the 19th
Nile-COM meeting on 28th July, 2012 in Nairobi, Kenya
Development Partners

23NB-DSS APPLICATION CASES2015

Find us on
#NileCooperation; #OneNile; #NileBasin
For more information:Nile Basin Initiative SecretariatP.O. Box 192Entebbe – UgandaTel: +256 414 321 424 +256 414 321 329 +256 417 705 000Fax: +256 414 320 971Email: [email protected]: http://www.nilebasin.orgFacebook: /Nile Basin InitiativeTwitter: @nbiwebWebsite QR code
Eastern Nile Technical Regional OfficeDessie RoadP.O. Box 27173-1000Addis Ababa – EthiopiaTel: +251 116 461 130/32Fax: +251 116 459 407Email: [email protected]: http://ensap.nilebasin.org
Nile Equatorial Lakes Subsidiary Action Program Coordination UnitKigali City Tower KCT, KN 2 St, KigaliP.O. Box 6759, Kigali RwandaTel: +250 788 307 334Fax: +250 252 580 100Email: [email protected]: http://nelsap.nilebasin.org


