
404
The morphology of silver nanoparticles prepared byenzyme-induced reduction
Henrik Schneidewind*1, Thomas Schüler2, Katharina K. Strelau2,Karina Weber1, Dana Cialla2, Marco Diegel1, Roland Mattheis1,
Andreas Berger3, Robert Möller2 and Jürgen Popp1,2
Full Research Paper Open Access
Address:1IPHT – Institute for Photonic Technology, Albert-Einstein-Strasse 9,D-07745 Jena, Germany, 2Institute of Physical Chemistry, FriedrichSchiller University Jena, Helmholtzweg 4, D-07743 Jena, Germanyand 3Max Planck Institute of Microstructure Physics, Weinberg 2,D-06120 Halle, Germany
Email:Henrik Schneidewind* - [email protected]
* Corresponding author
Keywords:EGNP; enzymatically grown silver nanoparticles; enzyme-induceddeposition; nanoflower; SERS
Beilstein J. Nanotechnol. 2012, 3, 404–414.doi:10.3762/bjnano.3.47
Received: 23 December 2011Accepted: 24 April 2012Published: 18 May 2012
Associate Editor: J. J. Schneider
© 2012 Schneidewind et al; licensee Beilstein-Institut.License and terms: see end of document.
AbstractSilver nanoparticles were synthesized by an enzyme-induced growth process on solid substrates. In order to customize the enzymat-
ically grown nanoparticles (EGNP) for analytical applications in biomolecular research, a detailed study was carried out concerning
the time evolution of the formation of the silver nanoparticles, their morphology, and their chemical composition. Therefore, silver-
nanoparticle films of different densities were investigated by using scanning as well as transmission electron microscopy to
examine their structure. Cross sections of silver nanoparticles, prepared for analysis by transmission electron microscopy were add-
itionally studied by energy-dispersive X-ray spectroscopy in order to probe their chemical composition. The surface coverage of
substrates with silver nanoparticles and the maximum particle height were determined by Rutherford backscattering spectroscopy.
Variations in the silver-nanoparticle films depending on the conditions during synthesis were observed. After an initial growth state
the silver nanoparticles exhibit the so-called desert-rose or nanoflower-like structure. This complex nanoparticle structure is in clear
contrast to the auto-catalytically grown spherical particles, which maintain their overall geometrical appearance while increasing
their diameter. It is shown, that the desert-rose-like silver nanoparticles consist of single-crystalline plates of pure silver. The
surface-enhanced Raman spectroscopic (SERS) activity of the EGNP structures is promising due to the exceptionally rough surface
structure of the silver nanoparticles. SERS measurements of the vitamin riboflavin incubated on the silver nanoparticles are shown
as an exemplary application for quantitative analysis.
404
IntroductionThe application of metal nanoparticles in the field of bioana-
lytics extends the possibilities of biomolecular detection signifi-
cantly and may satisfy the ever-growing interest in ultrasens-
itive detection methods for different applications [1]. Due to
their interesting and unique properties, metal nanoparticles have
the potential to meet the requirements for different biomolecular
Beilstein J. Nanotechnol. 2012, 3, 404–414.
405
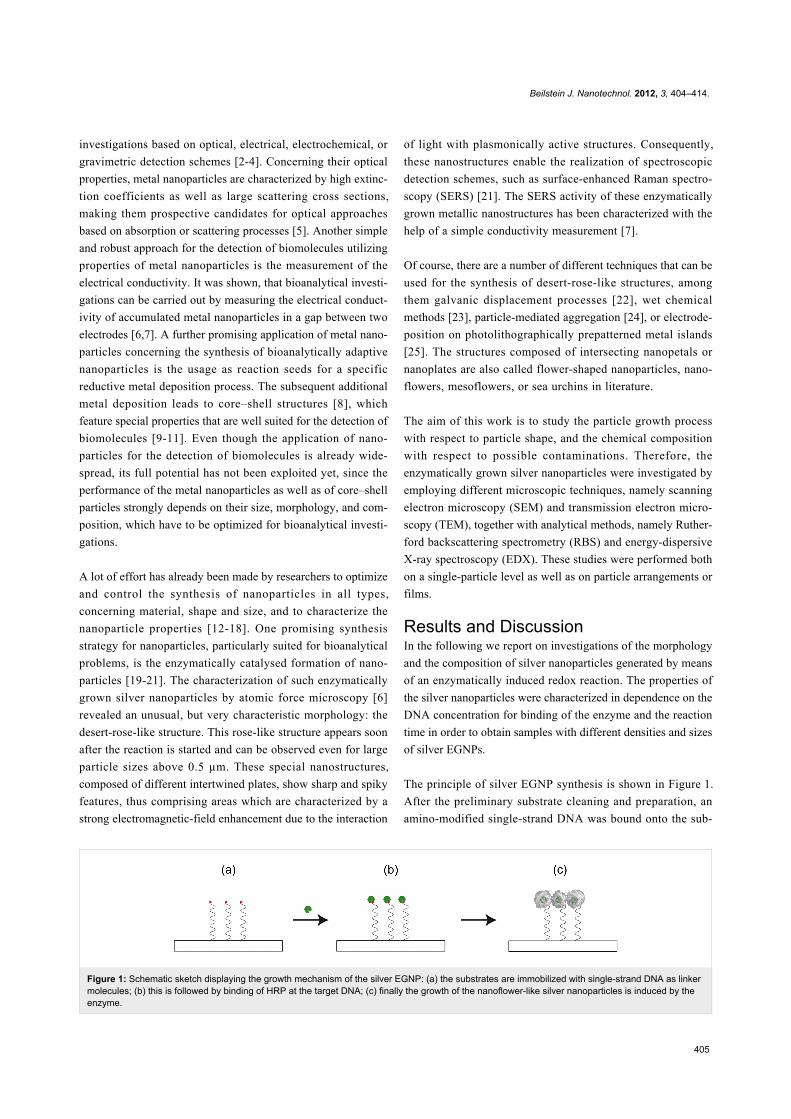
Figure 1: Schematic sketch displaying the growth mechanism of the silver EGNP: (a) the substrates are immobilized with single-strand DNA as linkermolecules; (b) this is followed by binding of HRP at the target DNA; (c) finally the growth of the nanoflower-like silver nanoparticles is induced by theenzyme.
investigations based on optical, electrical, electrochemical, or
gravimetric detection schemes [2-4]. Concerning their optical
properties, metal nanoparticles are characterized by high extinc-
tion coefficients as well as large scattering cross sections,
making them prospective candidates for optical approaches
based on absorption or scattering processes [5]. Another simple
and robust approach for the detection of biomolecules utilizing
properties of metal nanoparticles is the measurement of the
electrical conductivity. It was shown, that bioanalytical investi-
gations can be carried out by measuring the electrical conduct-
ivity of accumulated metal nanoparticles in a gap between two
electrodes [6,7]. A further promising application of metal nano-
particles concerning the synthesis of bioanalytically adaptive
nanoparticles is the usage as reaction seeds for a specific
reductive metal deposition process. The subsequent additional
metal deposition leads to core–shell structures [8], which
feature special properties that are well suited for the detection of
biomolecules [9-11]. Even though the application of nano-
particles for the detection of biomolecules is already wide-
spread, its full potential has not been exploited yet, since the
performance of the metal nanoparticles as well as of core–shell
particles strongly depends on their size, morphology, and com-
position, which have to be optimized for bioanalytical investi-
gations.
A lot of effort has already been made by researchers to optimize
and control the synthesis of nanoparticles in all types,
concerning material, shape and size, and to characterize the
nanoparticle properties [12-18]. One promising synthesis
strategy for nanoparticles, particularly suited for bioanalytical
problems, is the enzymatically catalysed formation of nano-
particles [19-21]. The characterization of such enzymatically
grown silver nanoparticles by atomic force microscopy [6]
revealed an unusual, but very characteristic morphology: the
desert-rose-like structure. This rose-like structure appears soon
after the reaction is started and can be observed even for large
particle sizes above 0.5 µm. These special nanostructures,
composed of different intertwined plates, show sharp and spiky
features, thus comprising areas which are characterized by a
strong electromagnetic-field enhancement due to the interaction
of light with plasmonically active structures. Consequently,
these nanostructures enable the realization of spectroscopic
detection schemes, such as surface-enhanced Raman spectro-
scopy (SERS) [21]. The SERS activity of these enzymatically
grown metallic nanostructures has been characterized with the
help of a simple conductivity measurement [7].
Of course, there are a number of different techniques that can be
used for the synthesis of desert-rose-like structures, among
them galvanic displacement processes [22], wet chemical
methods [23], particle-mediated aggregation [24], or electrode-
position on photolithographically prepatterned metal islands
[25]. The structures composed of intersecting nanopetals or
nanoplates are also called flower-shaped nanoparticles, nano-
flowers, mesoflowers, or sea urchins in literature.
The aim of this work is to study the particle growth process
with respect to particle shape, and the chemical composition
with respect to possible contaminations. Therefore, the
enzymatically grown silver nanoparticles were investigated by
employing different microscopic techniques, namely scanning
electron microscopy (SEM) and transmission electron micro-
scopy (TEM), together with analytical methods, namely Ruther-
ford backscattering spectrometry (RBS) and energy-dispersive
X-ray spectroscopy (EDX). These studies were performed both
on a single-particle level as well as on particle arrangements or
films.
Results and DiscussionIn the following we report on investigations of the morphology
and the composition of silver nanoparticles generated by means
of an enzymatically induced redox reaction. The properties of
the silver nanoparticles were characterized in dependence on the
DNA concentration for binding of the enzyme and the reaction
time in order to obtain samples with different densities and sizes
of silver EGNPs.
The principle of silver EGNP synthesis is shown in Figure 1.
After the preliminary substrate cleaning and preparation, an
amino-modified single-strand DNA was bound onto the sub-
Beilstein J. Nanotechnol. 2012, 3, 404–414.
406
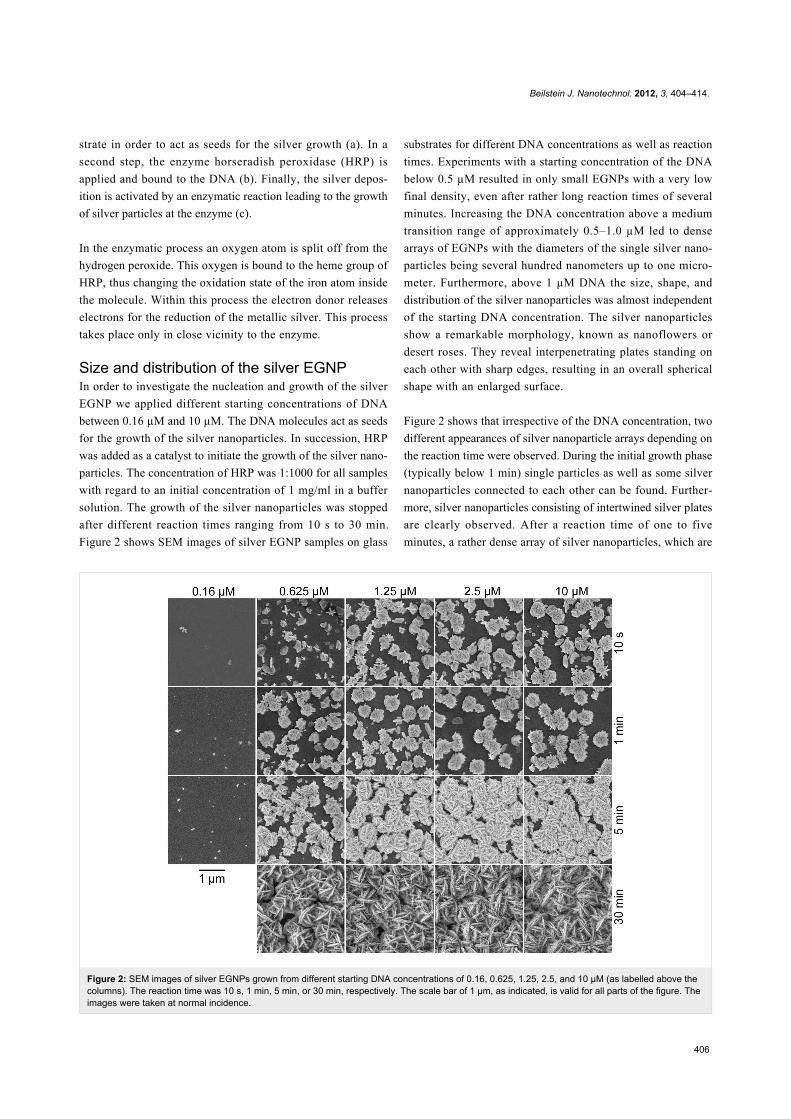
Figure 2: SEM images of silver EGNPs grown from different starting DNA concentrations of 0.16, 0.625, 1.25, 2.5, and 10 µM (as labelled above thecolumns). The reaction time was 10 s, 1 min, 5 min, or 30 min, respectively. The scale bar of 1 µm, as indicated, is valid for all parts of the figure. Theimages were taken at normal incidence.
strate in order to act as seeds for the silver growth (a). In a
second step, the enzyme horseradish peroxidase (HRP) is
applied and bound to the DNA (b). Finally, the silver depos-
ition is activated by an enzymatic reaction leading to the growth
of silver particles at the enzyme (c).
In the enzymatic process an oxygen atom is split off from the
hydrogen peroxide. This oxygen is bound to the heme group of
HRP, thus changing the oxidation state of the iron atom inside
the molecule. Within this process the electron donor releases
electrons for the reduction of the metallic silver. This process
takes place only in close vicinity to the enzyme.
Size and distribution of the silver EGNPIn order to investigate the nucleation and growth of the silver
EGNP we applied different starting concentrations of DNA
between 0.16 µM and 10 µM. The DNA molecules act as seeds
for the growth of the silver nanoparticles. In succession, HRP
was added as a catalyst to initiate the growth of the silver nano-
particles. The concentration of HRP was 1:1000 for all samples
with regard to an initial concentration of 1 mg/ml in a buffer
solution. The growth of the silver nanoparticles was stopped
after different reaction times ranging from 10 s to 30 min.
Figure 2 shows SEM images of silver EGNP samples on glass
substrates for different DNA concentrations as well as reaction
times. Experiments with a starting concentration of the DNA
below 0.5 µM resulted in only small EGNPs with a very low
final density, even after rather long reaction times of several
minutes. Increasing the DNA concentration above a medium
transition range of approximately 0.5–1.0 µM led to dense
arrays of EGNPs with the diameters of the single silver nano-
particles being several hundred nanometers up to one micro-
meter. Furthermore, above 1 µM DNA the size, shape, and
distribution of the silver nanoparticles was almost independent
of the starting DNA concentration. The silver nanoparticles
show a remarkable morphology, known as nanoflowers or
desert roses. They reveal interpenetrating plates standing on
each other with sharp edges, resulting in an overall spherical
shape with an enlarged surface.
Figure 2 shows that irrespective of the DNA concentration, two
different appearances of silver nanoparticle arrays depending on
the reaction time were observed. During the initial growth phase
(typically below 1 min) single particles as well as some silver
nanoparticles connected to each other can be found. Further-
more, silver nanoparticles consisting of intertwined silver plates
are clearly observed. After a reaction time of one to five
minutes, a rather dense array of silver nanoparticles, which are
Beilstein J. Nanotechnol. 2012, 3, 404–414.
407
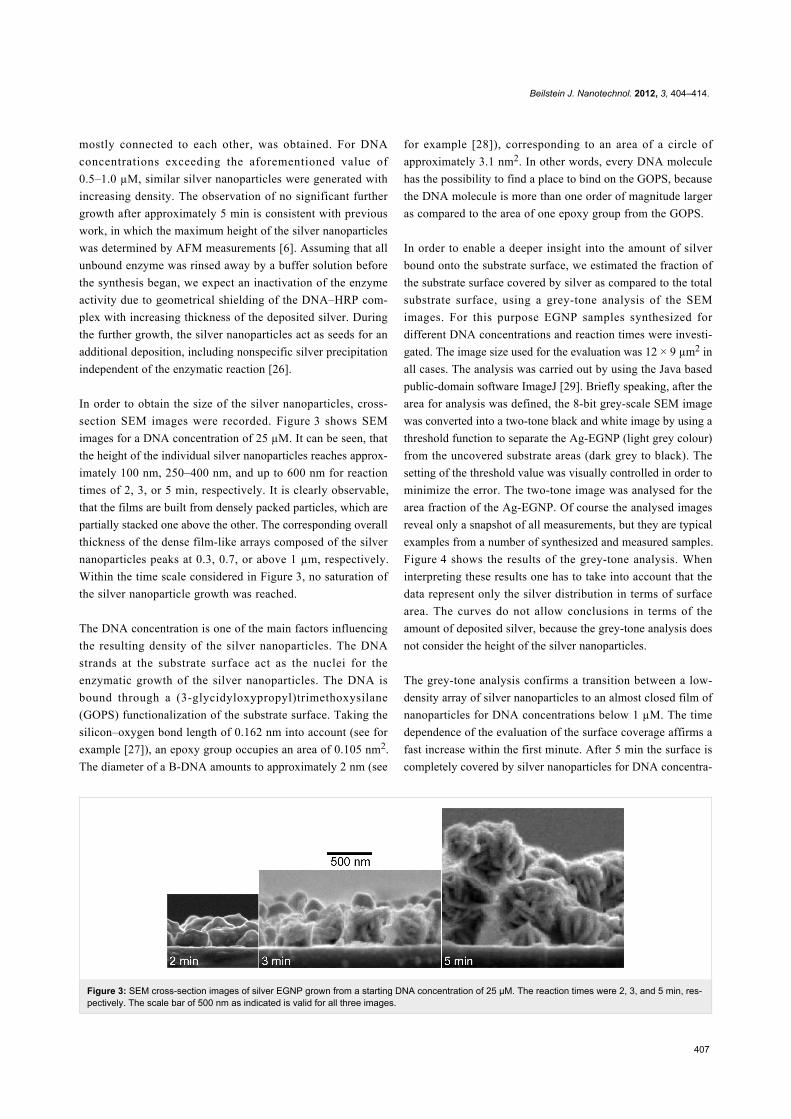
Figure 3: SEM cross-section images of silver EGNP grown from a starting DNA concentration of 25 µM. The reaction times were 2, 3, and 5 min, res-pectively. The scale bar of 500 nm as indicated is valid for all three images.
mostly connected to each other, was obtained. For DNA
concentrations exceeding the aforementioned value of
0.5–1.0 µM, similar silver nanoparticles were generated with
increasing density. The observation of no significant further
growth after approximately 5 min is consistent with previous
work, in which the maximum height of the silver nanoparticles
was determined by AFM measurements [6]. Assuming that all
unbound enzyme was rinsed away by a buffer solution before
the synthesis began, we expect an inactivation of the enzyme
activity due to geometrical shielding of the DNA–HRP com-
plex with increasing thickness of the deposited silver. During
the further growth, the silver nanoparticles act as seeds for an
additional deposition, including nonspecific silver precipitation
independent of the enzymatic reaction [26].
In order to obtain the size of the silver nanoparticles, cross-
section SEM images were recorded. Figure 3 shows SEM
images for a DNA concentration of 25 µM. It can be seen, that
the height of the individual silver nanoparticles reaches approx-
imately 100 nm, 250–400 nm, and up to 600 nm for reaction
times of 2, 3, or 5 min, respectively. It is clearly observable,
that the films are built from densely packed particles, which are
partially stacked one above the other. The corresponding overall
thickness of the dense film-like arrays composed of the silver
nanoparticles peaks at 0.3, 0.7, or above 1 µm, respectively.
Within the time scale considered in Figure 3, no saturation of
the silver nanoparticle growth was reached.
The DNA concentration is one of the main factors influencing
the resulting density of the silver nanoparticles. The DNA
strands at the substrate surface act as the nuclei for the
enzymatic growth of the silver nanoparticles. The DNA is
bound through a (3-glycidyloxypropyl)trimethoxysilane
(GOPS) functionalization of the substrate surface. Taking the
silicon–oxygen bond length of 0.162 nm into account (see for
example [27]), an epoxy group occupies an area of 0.105 nm2.
The diameter of a B-DNA amounts to approximately 2 nm (see
for example [28]), corresponding to an area of a circle of
approximately 3.1 nm2. In other words, every DNA molecule
has the possibility to find a place to bind on the GOPS, because
the DNA molecule is more than one order of magnitude larger
as compared to the area of one epoxy group from the GOPS.
In order to enable a deeper insight into the amount of silver
bound onto the substrate surface, we estimated the fraction of
the substrate surface covered by silver as compared to the total
substrate surface, using a grey-tone analysis of the SEM
images. For this purpose EGNP samples synthesized for
different DNA concentrations and reaction times were investi-
gated. The image size used for the evaluation was 12 × 9 µm2 in
all cases. The analysis was carried out by using the Java based
public-domain software ImageJ [29]. Briefly speaking, after the
area for analysis was defined, the 8-bit grey-scale SEM image
was converted into a two-tone black and white image by using a
threshold function to separate the Ag-EGNP (light grey colour)
from the uncovered substrate areas (dark grey to black). The
setting of the threshold value was visually controlled in order to
minimize the error. The two-tone image was analysed for the
area fraction of the Ag-EGNP. Of course the analysed images
reveal only a snapshot of all measurements, but they are typical
examples from a number of synthesized and measured samples.
Figure 4 shows the results of the grey-tone analysis. When
interpreting these results one has to take into account that the
data represent only the silver distribution in terms of surface
area. The curves do not allow conclusions in terms of the
amount of deposited silver, because the grey-tone analysis does
not consider the height of the silver nanoparticles.
The grey-tone analysis confirms a transition between a low-
density array of silver nanoparticles to an almost closed film of
nanoparticles for DNA concentrations below 1 µM. The time
dependence of the evaluation of the surface coverage affirms a
fast increase within the first minute. After 5 min the surface is
completely covered by silver nanoparticles for DNA concentra-
Beilstein J. Nanotechnol. 2012, 3, 404–414.
408
Figure 4: Fraction of the substrate surface covered by silver nanoparticles obtained by grey-tone analysis of SEM images (analysed field size:12 × 9 µm2) in dependence on (a) the initial concentration of DNA with the time of synthesis as a parameter and (b) time of particle growth with theDNA concentration as a parameter. Hidden error bars are too small to be displayed on the chosen axis scale. The curves are only a guide for the eye.Please note the differently scaled ordinates.
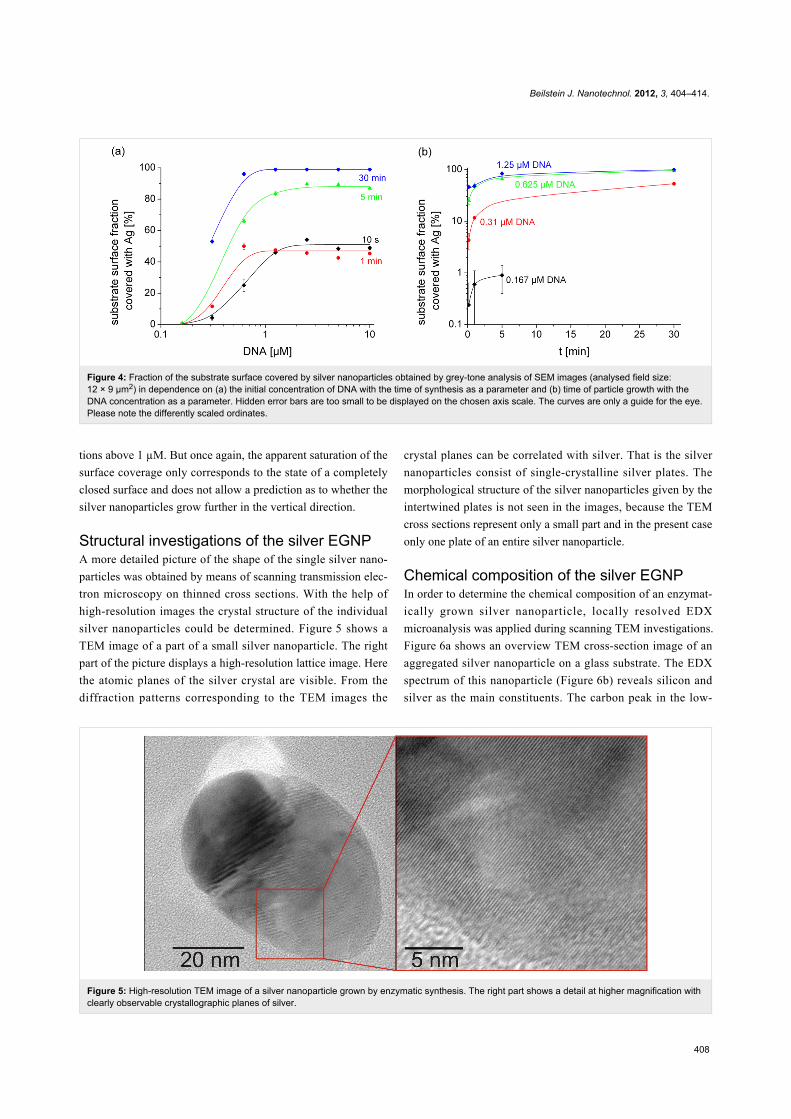
Figure 5: High-resolution TEM image of a silver nanoparticle grown by enzymatic synthesis. The right part shows a detail at higher magnification withclearly observable crystallographic planes of silver.
tions above 1 µM. But once again, the apparent saturation of the
surface coverage only corresponds to the state of a completely
closed surface and does not allow a prediction as to whether the
silver nanoparticles grow further in the vertical direction.
Structural investigations of the silver EGNPA more detailed picture of the shape of the single silver nano-
particles was obtained by means of scanning transmission elec-
tron microscopy on thinned cross sections. With the help of
high-resolution images the crystal structure of the individual
silver nanoparticles could be determined. Figure 5 shows a
TEM image of a part of a small silver nanoparticle. The right
part of the picture displays a high-resolution lattice image. Here
the atomic planes of the silver crystal are visible. From the
diffraction patterns corresponding to the TEM images the
crystal planes can be correlated with silver. That is the silver
nanoparticles consist of single-crystalline silver plates. The
morphological structure of the silver nanoparticles given by the
intertwined plates is not seen in the images, because the TEM
cross sections represent only a small part and in the present case
only one plate of an entire silver nanoparticle.
Chemical composition of the silver EGNPIn order to determine the chemical composition of an enzymat-
ically grown silver nanoparticle, locally resolved EDX
microanalysis was applied during scanning TEM investigations.
Figure 6a shows an overview TEM cross-section image of an
aggregated silver nanoparticle on a glass substrate. The EDX
spectrum of this nanoparticle (Figure 6b) reveals silicon and
silver as the main constituents. The carbon peak in the low-

Beilstein J. Nanotechnol. 2012, 3, 404–414.
409
Figure 6: TEM cross section image of a silver nanoparticle on a glass substrate (a), an EDX spectrum recorded across the cross section (b), andmappings of the elements silicon (c), silver (d), or carbon (e), respectively.
energy part of the spectrum results from unavoidable carbon
contamination, and the copper signal originates from the TEM
grid. Furthermore, an oxygen peak is detected in the low-energy
part of the EDX spectrum. The oxygen is due to the SiO2 from
the glass substrate. Figure 6c–e represent the local distribution
of the chemical elements silicon (green), silver (purple), and
carbon (blue), respectively. The data are recorded with EDX
exactly at the particle shown in Figure 6a. The black colouring
in the Figure 6c–e depicts the absence of the dedicated material.
In Figure 6c we see that the silicon (green) occurs only in the
substrate, taking up the same area as the light grey lower area of
Figure 6a, which depicts the glass substrate. Silver appears only
in the nanoparticle itself (Figure 6d). The distribution map of
carbon (Figure 6e) shows only a small concentration around the
nanoparticle and an even lower amount at the cross section of
the nanoparticle itself. Thus, the EDX spectrum provides evi-
dence that the nanoparticle consists of silver only.
Beyond the SEM pictures, the TEM cross section images
(Figure 5 and Figure 6a) show the real structure and shape of
the silver nanoparticles composed of intertwined silver plates.
The EDX spectra of these plates show silver Lα and Lβ lines
only. Hence, the enzymatically grown silver nanoparticles
consist of pure silver. Furthermore, TEM diffraction patterns
show the silver plates of the EGNP to be single crystalline.
RBS analysis for the density of silver in theEGNPIn order to study the integral coverage of the silver nano-
particles on the substrate surface the Rutherford backscattering
spectrometry (RBS) technique was applied. RBS is able to
deliver significant data about the averaged three-dimensional
distribution of chemical elements, which is a clear advantage
compared to the aforementioned grey-scale analysis of SEM
images or the analysis of AFM data. Firstly, the lateral dimen-
sion of the analysed area in RBS measurement is approxim-
ately 1 mm2 due to the diameter of the 4He+ ion beam
compared to areas on the order of 1 or 100 µm2 in the case of
AFM or SEM imaging, respectively. Thus, the results derived
from RBS data are averaged over areas that are significantly
larger, by orders of magnitude, than the silver nanoparticles, in
order to avoid errors due to the analysis of small, statistically
deviating regions. Secondly, the penetration depth of the
1.4 MeV 4He+ ions reaches some micrometers due to the rela-

Beilstein J. Nanotechnol. 2012, 3, 404–414.
410
Figure 7: Experimentally recorded RBS spectrum for silver nano-particles synthesized on a silicon substrate (red squares) together witha RBS simulation of a homogeneous silver film (blue triangles). Theleft shoulder below 750 keV corresponds with the silicon substrate andthe right peaks correspond to the silver thin film or the silver nano-particles, as appropriate.
tively low energy loss of the highly energetic ions in solids.
Consequently, the whole silver thickness is recorded, if one
takes the height of the silver nanoparticles into account, which
was derived from the SEM cross-section images (see Figure 3).
Thirdly, RBS is able to deliver the absolute number of silver
atoms, instead of the percentage of surface that is covered by
silver or the maximum height of silver only, as in the case of
AFM or SEM data analysis.
In order to explain the RBS measurement, Figure 7 shows a
typical RBS spectrum measured for silver nanoparticles depos-
ited on a silicon substrate (red squares) in comparison to a
simulated spectrum of a homogeneous silver film (blue
triangles). The thickness of the simulated film was adjusted in
such a manner that the yield of the simulated film at the low-
energy end of the film shoulder is equal to 5% of the maximum
yield of the measured film (denoted by 5% yieldsample). With a
maximum yield of the measured film of 8340 counts at
1157 keV the 5%-yield criterion corresponds to 417 counts at
1068 keV. The high-energy part of the spectrum is caused by
backscattering of 4He+ ions by silver atoms at the upper surface
of the silver. This is the surface of the simulated homogeneous
silver film (denoted by Agfilmtop) or the top of the silver nano-
particles (AgNPstop), as appropriate. The steep slope of the
simulated silver film curve at Agfilmbottom is due to the inter-
face between the simulated homogeneous silver film and the
substrate. Thus, the difference between Agfilmtop and
Agfilmbottom corresponds to the energy loss of the 4He+ ions
within the thickness of the silver film. The width ΔE* for the
silver nanoparticles is caused by the energy loss of the 4He+
ions within the highest silver nanoparticles. For silver nano-
particles of lower height the maximum energy loss is smaller
resulting in a triangular peak.
Figure 8: Surface coverage of silver (blue triangles) and absolutenumber of silver atoms (green circles), both belonging to the leftordinate, as well as the maximum height of the silver nanoparticlesassuming the silver bulk density for the nanoparticles (red squares;belonging to right ordinate) of EGNP films on silicon in dependence onthe DNA concentration, determined by means of RBS measurements.The reaction time was always 5 min. The lines are only a guide for theeye.
Three main features could be derived from the RBS spectra
shown in Figure 7: (1) the integral amount of silver (which is
contained in the synthesized silver nanoparticles) by determ-
ining the effective area under the silver peak; (2) the percentage
of the substrate surface that is covered with the three-dimen-
sional silver nanoparticles independent of their shape, by
comparing the yield for the upper surface of the silver nano-
particles (this is the highest peak of the nanoparticles spectrum
at approx. 1160 keV) with the high-energy yield for the simu-
lated film curve; and (3) the maximum height hmax of the silver
nanoparticles by comparing the low-energy tail of silver with
that of the homogenous silver film.
In order to study the surface density and the total particle
number (i.e., the dosage) of silver in the nanoparticle films,
samples were synthesized with DNA concentrations in the
range of 0.05–40 µM. Although we already observed a concen-
tration-independent level of silver coverage for DNA concentra-
tions above 1 µM in the SEM images (Figure 2 and Figure 4),
we performed the RBS experiments in dependence on DNA
concentration too in order to study the growth of the silver
nanoparticles in the z-direction normal to the substrate, by
determining the maximum height of the nanoparticles and the
total amount of silver. The reaction time for the silver nano-
particle growth was set to 5 min for all cases. Figure 8 presents
the results of the analysis of the RBS data in terms of the silver-
covered surface fraction (blue triangles) in dependence on the
DNA concentration. For the investigated reaction time of 5 min
the silver surface coverage reaches a stable value of approxim-
ately 80–85% for DNA concentrations of 1 µM, which is in
accordance with the data derived from the SEM images. Even
for high DNA concentrations up to 40 µM the surface coverage
Beilstein J. Nanotechnol. 2012, 3, 404–414.
411
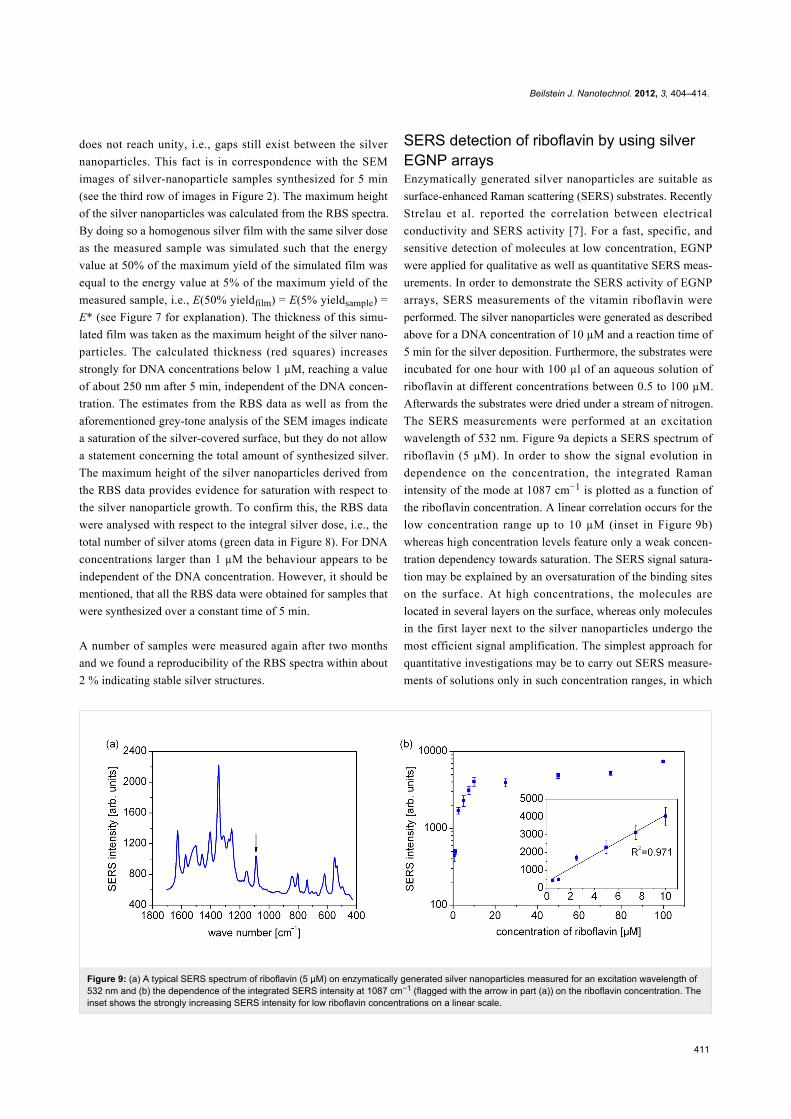
Figure 9: (a) A typical SERS spectrum of riboflavin (5 µM) on enzymatically generated silver nanoparticles measured for an excitation wavelength of532 nm and (b) the dependence of the integrated SERS intensity at 1087 cm−1 (flagged with the arrow in part (a)) on the riboflavin concentration. Theinset shows the strongly increasing SERS intensity for low riboflavin concentrations on a linear scale.
does not reach unity, i.e., gaps still exist between the silver
nanoparticles. This fact is in correspondence with the SEM
images of silver-nanoparticle samples synthesized for 5 min
(see the third row of images in Figure 2). The maximum height
of the silver nanoparticles was calculated from the RBS spectra.
By doing so a homogenous silver film with the same silver dose
as the measured sample was simulated such that the energy
value at 50% of the maximum yield of the simulated film was
equal to the energy value at 5% of the maximum yield of the
measured sample, i.e., E(50% yieldfilm) = E(5% yieldsample) =
E* (see Figure 7 for explanation). The thickness of this simu-
lated film was taken as the maximum height of the silver nano-
particles. The calculated thickness (red squares) increases
strongly for DNA concentrations below 1 µM, reaching a value
of about 250 nm after 5 min, independent of the DNA concen-
tration. The estimates from the RBS data as well as from the
aforementioned grey-tone analysis of the SEM images indicate
a saturation of the silver-covered surface, but they do not allow
a statement concerning the total amount of synthesized silver.
The maximum height of the silver nanoparticles derived from
the RBS data provides evidence for saturation with respect to
the silver nanoparticle growth. To confirm this, the RBS data
were analysed with respect to the integral silver dose, i.e., the
total number of silver atoms (green data in Figure 8). For DNA
concentrations larger than 1 µM the behaviour appears to be
independent of the DNA concentration. However, it should be
mentioned, that all the RBS data were obtained for samples that
were synthesized over a constant time of 5 min.
A number of samples were measured again after two months
and we found a reproducibility of the RBS spectra within about
2 % indicating stable silver structures.
SERS detection of riboflavin by using silverEGNP arraysEnzymatically generated silver nanoparticles are suitable as
surface-enhanced Raman scattering (SERS) substrates. Recently
Strelau et al. reported the correlation between electrical
conductivity and SERS activity [7]. For a fast, specific, and
sensitive detection of molecules at low concentration, EGNP
were applied for qualitative as well as quantitative SERS meas-
urements. In order to demonstrate the SERS activity of EGNP
arrays, SERS measurements of the vitamin riboflavin were
performed. The silver nanoparticles were generated as described
above for a DNA concentration of 10 µM and a reaction time of
5 min for the silver deposition. Furthermore, the substrates were
incubated for one hour with 100 µl of an aqueous solution of
riboflavin at different concentrations between 0.5 to 100 µM.
Afterwards the substrates were dried under a stream of nitrogen.
The SERS measurements were performed at an excitation
wavelength of 532 nm. Figure 9a depicts a SERS spectrum of
riboflavin (5 µM). In order to show the signal evolution in
dependence on the concentration, the integrated Raman
intensity of the mode at 1087 cm−1 is plotted as a function of
the riboflavin concentration. A linear correlation occurs for the
low concentration range up to 10 µM (inset in Figure 9b)
whereas high concentration levels feature only a weak concen-
tration dependency towards saturation. The SERS signal satura-
tion may be explained by an oversaturation of the binding sites
on the surface. At high concentrations, the molecules are
located in several layers on the surface, whereas only molecules
in the first layer next to the silver nanoparticles undergo the
most efficient signal amplification. The simplest approach for
quantitative investigations may be to carry out SERS measure-
ments of solutions only in such concentration ranges, in which

Beilstein J. Nanotechnol. 2012, 3, 404–414.
412
all binding sites of the SERS substrate are saturated and where
no oversaturation can occur. Thus, EGNP arrays can be applied
for quantitative SERS measurements at low concentrations.
ConclusionThe enzymatically grown silver nanoparticles were shown to
consist of pure silver. This is an important result for further
applications of the silver nanoparticles for bio-analytics since
the nanoparticles are free from contaminations. The building
blocks of the individual nanoparticles are single-crystalline
silver plates, which are intertwined to form nanoflower or
desert-rose-like nanoparticles up to a size of some hundred
nanometers depending on the conditions of the synthesis.
Within the applied preparation conditions DNA concentrations
of 1 µM and reaction times below 5 min are sufficient to obtain
films of densely packed silver nanoparticles.
The enzyme-induced growth of metal nanoparticles may lead to
building blocks for spectroscopic applications that give stable
signals that do not fade or bleach. One field of application of
the silver nanoparticles, grown in an enzyme-induced process,
is in the preparation of SERS active substrates, for example. An
advantage of the illustrated method to synthesize the silver
nanoparticles on a surface by enzymatic growth, is the simple
preparation from a wet solution instead of by using vacuum
deposition techniques, such as evaporation to fabricate rough
metal films, or complicated top-down methods of micro- or
nanopatterning of previously deposited thin metal films. This
simplicity can help to extend the range of applications of
enzymes in bioanalytics due to the generation of insoluble,
stable products. Successful concentration-dependent SERS
measurements on the vitamin riboflavin have been shown on
such SERS-active substrates.
ExperimentalSubstrate preparationThe silver EGNP were synthesized on glass or silicon
substrates. The silicon substrates, which were used for the RBS
investigations in order to avoid any electrical charging during
analysis, were covered by a natural oxide layer. The coarse
cleaning of the substrates was performed in an ultrasonic bath in
acetone, ethanol, and water (for 10 min each) followed by
drying under nitrogen. Next, the surface was activated in an
oxygen plasma etching step. In order to bind linker molecules
(amino modified DNA) onto the surface, the substrates were
chemical ly modif ied with 10 mM (3-glycidyloxy-
propyl)trimethoxysilane (GOPS) in dried toluene for 3 h at
70 °C, followed by three washing steps in toluene. As a result,
the surface was saturated with epoxy groups. Afterwards, linker
molecules (here: DNA with a 5-end amino and a 3-end biotin
modification) were deposited on the surface as 4 nl droplets in
5× phosphate-buffered saline (PBS) by using a Nano-Plotter NP
2.0 (GeSiM mbH, Großerkmannsdorf, Germany). The droplets
dried under normal atmosphere within 10 min. The linker binds
covalently via the amino modification towards the epoxy modi-
fied surface, assisted by an UV linking process [26]. Due to the
interaction of biotin and streptavidin, a streptavidin horseradish
peroxidase conjugate complex is bound via the linker molecule
to the surface. In order to remove the remaining unbound per-
oxidase complex, the samples were washed six times in PBST
buffer for 2 min each after 1 h incubation of the surface with the
peroxidase complex. Finally, the substrates were rinsed with
distilled water. The concentration of the linker was varied
throughout the experiments, whereas the concentration of the
peroxidase complex was kept constant at 10−3 mg/ml. All
preparation steps were performed at room temperature.
Synthesis of the enzymatically grown nanoparticles(EGNP)The silver nanoparticles were prepared subsequently to the per-
oxidase coupling. Silver nanoparticles were generated by using
the silver enhancement kit (EnzMetTM) from Nanoprobes
(Nanoprobes Inc., Yaphank, NY, USA). Here, the horseradish
peroxidase catalyzed the silver reduction. Thus, the addition of
the EnzMetTM enhancement kit immediately led to the forma-
tion of silver nanoparticles by the enzymatic activity. Within
these studies, different growth times were used for the silver
nanoparticles. In order to stop the silver deposition process, the
substrates were rinsed with water. Finally, the substrates were
dried under nitrogen. The preparation was previously described
in other publications [6,7].
Scanning and transmission electron microscopyThe scanning electron microscopy (SEM) images were recorded
by means of a JEOL JSM-6300F using a 5 kV electron beam.
Transmission electron microscopy (TEM) cross-section images
were recorded with a Philips CM 20 FEG. The TEM with a
field emission gun was operated at an acceleration voltage of
200 kV. During the TEM analysis local energy dispersive X-ray
(EDX) spectra were taken at different points in the TEM
lamellas. For the TEM investigations thin cross sections were
prepared by means of the focused-ion-beam etching technique.
For the cross-section images, samples were prepared on glass
substrates with DNA concentrations of 10 µM. The silver reac-
tion time was 5 min.
Rutherford backscattering spectrometry (RBS)RBS is based on the scattering of high-energy ions in solids. For
this purpose a beam of high energy 4He+ ions is directed onto
the target, i.e., the sample of interest, at a well-controlled angle
of incidence. The 4He+ ions are scattered by the nuclei within
the target. The recoil energy of the 4He+ ions is a unique func-

Beilstein J. Nanotechnol. 2012, 3, 404–414.
413
tion of scattering angle, initial kinetic energy, and target nucleus
mass. The energy and quantity of backscattered ions are
detected in a certain solid angle in the backward direction
almost antiparallel to the incident beam. The determination of
the atomic mass of the scattering centres, and hence the chem-
ical element, is possible, since the energy of the elastically
scattered ions increases with the mass of the scattering centres.
Depth resolution can be achieved due to the additional energy
loss of the ions based on inelastic scattering. The depth resolu-
tion depends on the energy resolution of the detector (in our
case FWHM = 12 keV) and on the material being measured,
and is typically on the order of several nanometers for silver
particles. For measurement and analysis of the measured data
the software RUBSODY was used [30]. The ion energy of the4He+ beam was 1.4 MeV; the angle between the incident beam
and the detected backscattered ions was 168°. The area of meas-
urement was approximately 1 mm in diameter, corresponding to
the spot of the incident 4He+ ion beam.
Surface-enhanced Raman spectroscopy (SERS)The SERS spectra were recorded with a microRaman setup (HR
LabRam invers, Jobin-Yvon–Horiba) by using a frequency-
doubled Nd:YAG laser (λ = 532.11 nm) as excitation source.
The spectrometer is equipped with an entrance slit of 100 µm, a
focal length of 800 mm and a 300 lines/mm grating. SERS
measurements were carried out by focusing the laser light onto
the samples (approx. 0.7 µm focus diameter) with a Leica
PLFluoar H100 objective with a laser power of 25 µW and an
integration time of 1 s. A total of 250 spectra per sample were
recorded in the line-scanning mode (five line scans with 50
spectra per line). A CCD camera operating at 220 K was used to
detect the Raman scattered light.
AcknowledgementsBettina Rudolph and Anne März from the Institute of Physical
Chemistry, Friedrich Schiller University of Jena are gratefully
acknowledged for the EGNP preparation and critical remarks on
the manuscript, respectively. Credit is also given to Ulrich
Barth from the Institute of Solid State Physics at the Friedrich
Schiller University of Jena for support during performance of
the RBS investigations. Funding of the research project
“Photonische Nanomaterialien (PhoNa)” within the framework
“Spitzenforschung und Innovation in den Neuen Ländern” from
the Federal Ministry of Education and Research, Germany
(BMBF) is gratefully acknowledged.
References1. Vo-Dinh, T.; Wang, H.-N.; Scaffidi, J. J. Biophotonics 2010, 3, 89–102.
doi:10.1002/jbio.2009100152. Chang, T.-L.; Lee, Y.-W.; Chen, C.-C.; Ko, F.-H. Microelectron. Eng.
2007, 84, 1698–1701. doi:10.1016/j.mee.2007.01.266
3. Fritzsche, W.; Taton, T. A. Nanotechnology 2003, 14, R63–R73.doi:10.1088/0957-4484/14/12/R01
4. Willner, I.; Willner, B. Nano Lett. 2010, 10, 3805–3815.doi:10.1021/nl102083j
5. Khlebtsov, N. G.; Dykman, L. A. J. Quant. Spectrosc. Radiat. Transfer2010, 111, 1–35. doi:10.1016/j.jqsrt.2009.07.012
6. Schüler, T.; Steinbrück, A.; Festag, G.; Möller, R.; Fritzsche, W.J. Nanopart. Res. 2009, 11, 939–946. doi:10.1007/s11051-008-9496-7
7. Strelau, K. K.; Schüler, T.; Möller, R.; Fritzsche, W.; Popp, J.ChemPhysChem 2010, 11, 394–398. doi:10.1002/cphc.200900867
8. Steinbrück, A.; Csaki, A.; Ritter, K.; Leich, M.; Köhler, J. M.;Fritzsche, W. J. Nanopart. Res. 2009, 11, 623–633.doi:10.1007/s11051-008-9401-4
9. Han, B.; Choi, N.; Kim, K. H.; Lim, D. W.; Choo, J. J. Phys. Chem. C2011, 115, 6290–6296. doi:10.1021/jp112265e
10. Latham, A. H.; Williams, M. E. Acc. Chem. Res. 2008, 41, 411–420.doi:10.1021/ar700183b
11. Tian, Z.-Q.; Ren, B.; Li, J.-F.; Yang, Z.-H. Chem. Commun. 2007,3514–3534. doi:10.1039/b616986d
12. Kottmann, J. P.; Martin, O. J. F.; Smith, D. R.; Schultz, S. Opt. Express2000, 6, 213–219. doi:10.1364/OE.6.000213
13. Leopold, N.; Lendl, B. J. Phys. Chem. B 2003, 107, 5723–5727.doi:10.1021/jp027460u
14. Hao, E.; Schatz, G. C.; Hupp, J. T. J. Fluoresc. 2004, 14, 331–341.doi:10.1023/B:JOFL.0000031815.71450.74
15. Mock, J. J.; Barbic, M.; Smith, D. R.; Schultz, D. A.; Schultz, S.J. Chem. Phys. 2002, 116, 6755–6759. doi:10.1063/1.1462610
16. Nehl, C. L.; Liao, H.; Hafner, J. H. Nano Lett. 2006, 6, 683–688.doi:10.1021/nl052409y
17. Kharisov, B. I. Recent Pat. Nanotechnol. 2008, 2, 190–200.doi:10.2174/187221008786369651
18. Yang, Z.; Chiu, T.-C.; Chang, H.-T. Open Nanosci. J. 2007, 1, 5–12.doi:10.2174/1874140100701010005
19. Hainfeld, J. F.; Powell, R. D.; Hacker, G. W. Nanoparticle MolecularLabels. In Nanobiotechnology; Mirkin, C. A.; Niemeyer, C. M., Eds.;Wiley-VCH: Weinheim, Germany, 2004; pp 353–386.
20. Möller, R.; Powell, R. D.; Hainfeld, J. F.; Fritzsche, W. Nano Lett. 2005,5, 1475–1482. doi:10.1021/nl050824k
21. Hering, K. K.; Möller, R.; Fritzsche, W.; Popp, J. ChemPhysChem2008, 9, 867–872. doi:10.1002/cphc.200700591
22. Gutes, A.; Carraro, C.; Maboudian, R. ACS Appl. Mater. Interfaces2009, 1, 2551–2555. doi:10.1021/am9004754
23. Wang, L.; Wang, L.; Tan, E.; Li, L.; Guo, L.; Han, X. J. Mater. Chem.2011, 21, 2369–2373. doi:10.1039/c0jm02610g
24. Fang, J.; Du, S.; Lebedkin, S.; Li, Z.; Kruk, R.; Kappes, M.; Hahn, H.Nano Lett. 2010, 10, 5006–5013. doi:10.1021/nl103161q
25. Kim, J.-H.; Kang, T.; Yoo, S. M.; Lee, S. Y.; Kim, B.; Choi, Y.-K.Nanotechnology 2009, 20, 235302.doi:10.1088/0957-4484/20/23/235302
26. Schüler, T.; Nykytenko, A.; Csaki, A.; Möller, R.; Fritzsche, W.; Popp, J.Anal. Bioanal. Chem. 2009, 395, 1097–1105.doi:10.1007/s00216-009-3045-9
27. Temkin, R. J. J. Non-Cryst. Solids 1975, 17, 215–230.28. Wing, R.; Drew, H.; Takano, T.; Broka, C.; Tanaka, S.; Itakura, K.;
Dickerson, R. E. Nature 1980, 287, 755–758. doi:10.1038/287755a029. Rasband, W. ImageJ – Image processing and analysis in Java;
National Institute of Health, USA; http://imagej.nih.gov/ij, 2011.30. Witzmann, A.; Barth, U. RUBSODY – An interactive program for RBS
measurement and analysis; Institute of Solid State Physics, FriedrichSchiller University of Jena: Jena, 1999.

Beilstein J. Nanotechnol. 2012, 3, 404–414.
414
License and TermsThis is an Open Access article under the terms of the
Creative Commons Attribution License
(http://creativecommons.org/licenses/by/2.0), which
permits unrestricted use, distribution, and reproduction in
any medium, provided the original work is properly cited.
The license is subject to the Beilstein Journal of
Nanotechnology terms and conditions:
(http://www.beilstein-journals.org/bjnano)
The definitive version of this article is the electronic one
which can be found at:
doi:10.3762/bjnano.3.47


