
THE IMPACT OF THE ACTING POLICY ON EMPLOYEE MOTIVATION
AND PERFORMANCE IN TRANSNET
Nhluvuko Baloyi
Student number: 550212
School of Mechanical, Industrial and Aeronautical Engineering
University of the Witwatersrand
Johannesburg, South Africa.
Supervisor: Mrs Lorrainne Doherty
A research report submitted to the Faculty of Engineering and the Built
Environment, University of the Witwatersrand, Johannesburg, in partial fulfilment of
the requirements for the degree of Master of Science in Engineering Management.
08 September 2020
i
ABSTRACT
This research was aimed at identifying and discerning how intrinsic and extrinsic
motivational factors, as well as inherent traits of an acting policy affects employee
motivation and performance at Transnet.
This qualitative study adopted a descriptive research design. A non-probability
sampling technique and consecutive sampling were selected to identify study
participants. A sample from Transnet Engineering (TE) provided data via a
questionnaire using a Likert Scale. Results analysis was conducted through; SPSS
and Excel.
Data obtained from this research, concluded that intrinsic factors associated with
Transnet’s acting policy, have a positive influence on employee motivation and
performance, contrary to extrinsic factors and inherent traits of the acting policy.
This research recommends that Transnet should exploit intrinsic factors such as
growth, career progression, and responsibility as an approach for developing
positive employee motivation. Extrinsic factors such as compensation,
communication and leadership should not be withheld from employees as their
absence has a tendency to leave employees frustrated and demotivated.
KEY WORDS: Job motivation, intrinsic motivational factors, extrinsic
motivational factors, acting policy.

ii
ACKNOWLEDGEMENTS
Firstly, I would like to acknowledge the Almighty God for His overflowing grace
that enabled me to complete this research project. His grace has been truly sufficient
throughout the course of my studies and my life. I want to thank my wonderful
supervisor, Mrs Lorrainne Doherty whose wealthy intellectual support, guidance
and encouragement has been a pillar through the course of this research and my
personal life. She has been instrumental in my life.
To my husband, I want to express the outmost appreciation for always being my
cheer leader and driving me back and forth to school. My mother, Hilda Nhuvunga
and in-laws for always keeping me in their prayers.
This study would not have been possible if it was not for the Transnet employees
who took their time to participate in this study, I truly appreciate. To my manager,
colleagues and my friend Mhlangabezi, whom have been nothing short of
exceptional, I thank them.
Lastly, I would like to thank Transnet for allowing me to conduct this research.

iii
DECLARATION
I declare that this research report is my own unaided work. It is submitted in partial
fulfilment of the requirements for the Master’s degree in Engineering Management
at the University of the Witwatersrand. This research report has not been submitted
before for any degree or examination to any other University. I further declare that
I have obtained the necessary authorisation and consent to carry out this research.
………………………………… ………………………….
(Name ) (Signature)
………………. day of …………………, …………………………….
(day) (month) (year)
NHLUVUKO BALOYI
08 SEPTEMBER 2020

iv
TABLE OF CONTENTS
ABSTRACT ......................................................................................................................... i
ACKNOWLEDGEMENTS ................................................................................................ ii
DECLARATION ............................................................................................................... iii
LIST OF FIGURES ......................................................................................................... viii
LIST OF TABLES .............................................................................................................. x
1 CHAPTER 1: INTRODUCTION ............................................................................... 1
1.1. RESEARCH TITLE ............................................................................................ 1
1.2. RESEARCH BACKGROUND ........................................................................... 1
1.3. PROBLEM STATEMENT ................................................................................. 2
1.4. RESEARCH QUESTIONS................................................................................. 4
1.5. RESEARCH OBJECTIVES ............................................................................... 4
1.6. SUMMARY OF RESEARCH METHOD .......................................................... 5
1.6. SCOPE /LIMITATIONS OF RESEARCH ............................................................. 6
1.7. OUTLINE OF CHAPTERS ................................................................................ 7
2 CHAPTER 2: LITERATURE REVIEW .................................................................... 9
2.1. INTRODUCTION .............................................................................................. 9
2.2. DEFINING TERMS ........................................................................................... 9
2.3. ACTING POLICY ............................................................................................ 10
2.3.1. ACTING APPOINTMENT PROCESS .................................................... 10
2.3.2. ACTING APPOINTMENT PERIOD ....................................................... 11
2.3.3. ACTING ALLOWANCE ......................................................................... 11
2.4. CONCEPT OF MOTIVATION ........................................................................ 12
2.4.1. INTRINSIC MOTIVATION .................................................................... 12
2.4.2. EXTRINSIC MOTIVATION ................................................................... 15
2.5. THEORIES OF MOTIVATION ....................................................................... 17
2.5.1. MASLOW’S THEORY: HIERARCHY OF HUMAN NEEDS. .............. 17
v
2.5.2. FREDERICK HERZBERG – TWO FACTOR THEORY OF
MOTIVATION ......................................................................................................... 18
2.5.3. MCCLELLAND’S THEORY OF NEEDS ............................................... 19
2.5.4. EXPECTANCY THEORY ....................................................................... 20
2.5.5. SELF-DETERMINATION THEORY…………………………………...21
2.5.6. INTEGRATION OF MOTIVATION THEORIES WITH THIS
RESEARCH .............................................................................................................. 21
2.6. EMPLOYEE PERFORMANCE ....................................................................... 23
2.6.1. LEVEL OF COMMITMENT ................................................................... 23
2.6.2. WORK ATTENDANCE ........................................................................... 24
2.6.3. QUALITY OF WORK .............................................................................. 24
2.6.4. ACCOUNTABILITY ............................................................................... 25
2.6.5. EMPLOYEE INITIATIVE ....................................................................... 25
2.6.6. WORKER EFFICIENCY ......................................................................... 25
3 CHAPTER 3: RESEARCH METHODS ............................................ 26
3.1. INTRODUCTION ............................................................................................ 26
3.2. RESEARCH DESIGN ...................................................................................... 26
3.3. SAMPLING ...................................................................................................... 27
3.3.1. POPULATION ......................................................................................... 27
3.3.2. SAMPLING TECHNIQUE ...................................................................... 27
3.3.3. SAMPLE SIZE ......................................................................................... 28
3.4. INSTRUMENTATION .................................................................................... 28
3.5. DATA COLLECTION AND ANALYSIS PROCEDURE .............................. 30
3.5.1. DATA COLLECTION ............................................................................. 30
3.5.2. DATA ANALYSIS ................................................................................... 30
3.6. RELIABILITY AND VALIDITY .................................................................... 30
3.7. ETHICAL ISSUES/CLEARANCE .................................................................. 31
4 CHAPTER 4: DATA ANALYSIS AND RESULTS ...................... 33

vi
4.1. INTRODUCTION ............................................................................................ 33
4.2. RELIABILITY TEST: CRONBACH’S ALPHA TEST ................................... 33
4.2.1. CRONBACH’S ALPHA COEFFICIENTS OBTAINED FROM SPSS
SOFTWARE ............................................................................................................. 34
4.2.2. CRONBACH’S ALPHA COEFFICIENTS OBTAINED FROM
MICROSOFT EXCEL .............................................................................................. 35
4.2.3. SKEWNESS AND KURTOSIS ............................................................... 36
4.3. RESULTS: DATA ANALYSIS AND INTERPRETATION ........................... 38
4.3.1. RESPONSE RATE ................................................................................... 38
4.3.2. SECTION A: PARTICIPANTS PROFILE .............................................. 39
4.3.3. SECTION B: ACTING POLICY AFFECT ON MOTIVATION AND
PERFORMANCE ..................................................................................................... 43
5 CHAPTER 5: DISCUSSION ................................................................. 52
5.1. INTRODUCTION ............................................................................................ 52
5.2. SECTION A: PARTICIPANTS PROFILE DISCUSSION .............................. 52
5.2.1. GENDER AND AGE................................................................................ 52
5.2.2. PAY GRADE ............................................................................................ 53
5.2.3. WORK EXPERIENCE ............................................................................. 53
5.2.4. AFFECTED OCCURANCE ..................................................................... 53
5.2.5. IMPRESSION OF ACTING POLICY ..................................................... 54
5.2.6. IMPRESSION OF THE ACTING POLICY AND AFFECTED
OCCURANCE .......................................................................................................... 54
5.3. SECTION B: ACTING POLICY AFFECT ON MOTIVATION AND
PERFORMANCE DISCUSSION ................................................................................ 55
5.3.1. AWARENESS .......................................................................................... 55
5.3.2. CAREER PROGRESSION ....................................................................... 55
5.3.3. PERFORMANCE ..................................................................................... 56
5.3.4. GROWTH ................................................................................................. 56
5.3.5. ACTING LEADERSHIP .......................................................................... 57

vii
5.3.6. IMPLEMENTATION ............................................................................... 57
5.3.7. ORGANISATION .................................................................................... 58
5.3.8. COMPENSATION ................................................................................... 58
5.3.9. WORK DUTIES ....................................................................................... 59
5.4. WHAT EFFECT DOES INTRINSIC MOTIVATION FACTORS
PRESENTED BY THE ACTING POLICY HAVE ON EMPLOYEE MOTIVATION
AND PERFORMANCE? .............................................................................................. 60
5.5. WHAT EFFECT DOES EXTRINSIC MOTIVATION FACTORS
PRESENTED BY THE ACTING POLICY HAVE ON EMPLOYEE MOTIVATION
AND PERFORMANCE? .............................................................................................. 61
5.6. HOW DOES THE INHERENT TRAITS OF THE ACTING POLICY AFFECT
EMPLOYEE MOTIVATION AND PERFORMANCE AT TRANSNET? ................. 62
6 CHAPTER 6: CONCLUSIONS AND RECOMMENDATIONS 63
6.1. INTRODUCTION ............................................................................................ 63
6.2. CONCLUSIONS ............................................................................................... 63
6.2.1. CONCLUSIONS ON INSTRINSIC FACTORS PRESENTED BY THE
ACTING POLICY EFFECT ON EMPLOYEE MOTIVATION AND
PERFORMANCE AT TRANSNET. ........................................................................ 63
6.2.2. CONCLUSIONS ON EXTRINSIC MOTIVATION FACTORS
PRESENTED BY THE ACTING POLICY EFFECT ON EMPLOYEE
MOTIVATION AND PERFORMANCE AT TRANSNET. .................................... 64
6.2.3. CONCLUSIONS ON INHERENT TRAITS OF THE ACTING POLICY
AND ITS EFFECT ON EMPLOYEE MOTIVATION AND PERFORMANCE AT
TRANSNET .............................................................................................................. 65
6.3. RECOMMENDATIONS .................................................................................. 65
6.3.1. RECOMMENDATIONS FOR INTRINSIC FACTORS THAT
INFLUENCE EMPLOYEE MOTIVATION AND PERFORMANCE .................... 65
6.3.2. RECOMMENDATIONS FOR EXTRINSIC FACTORS THAT
INFLUENCE EMPLOYEE MOTIVATION AND PERFORMANCE .................... 65
6.3.3. RECOMMENDATIONS TO TRANSNET MANAGEMENT ................ 66

viii
6.3.4. RECOMMENDATIONS TO ACADEMIA FOR FUTURE RESEARCH
66
6.4. LIMITATIONS OF THE RESEARCH ...................................................... 67
6.5. FINAL REMARKS .......................................................................................... 67
7 REFERENCES ............................................................................. 69
8 APPENDICES .............................................................................. 74
APPENDIX A: PARTICIPATION INFORMATION SHEET .................................... 74
APPENDIX B: CONSENT LETTER ........................................................................... 75
APPENDIX C: PERMISSION TO CONDUCT RESEARCH ..................................... 76
APPENDIX D: ETHICAL CLEARANCE ................................................................... 79
APPENDIX E: SURVEY QUESTIONNAIRE ............................................................ 80
APPENDIX F: QUESTIONNAIRE RESPONSES ...................................................... 83
APPENDIX G-CRONBACH ALPHA CALCULATIONS FROM SPSS ................... 85
APPENDIX H- CRONBACH ALPHA CALCULATIONS FROM EXCEL .............. 91
APPENDIX I- SKEWNESS AND KURTOSIS CALCULATIONS AND GRAPHS
FOR EACH SECTION ................................................................................................. 94
FREQUENCY TABLES FOR ALL QUESTIONS IN SECTION B OF
QUESTIONNAIRE .................................................................................................. 96
SKEWNESS AND KURTOSIS CHARTS FOR ALL QUESTIONS IN SECTION B
OF QUESTIONNAIRE .......................................................................................... 104

ix
LIST OF FIGURES
Figure 1.1: Research process .................................................................................. 5
Figure 2.1: Maslow hierarchy of needs ................................................................. 17
Figure 2.2: Expectancy theory .............................................................................. 20
Figure 2.3: Self-Determination Theory ................................................................. 22
Figure 0.4: Relationship between performance, commitment and learning goal.24
Figure 4.1 : Awareness- Question 1 skewness and kurtosis chart. ....................... 37
Figure 4.2: Awareness-Question 2 skewness and kurtosis chart. ......................... 37
Figure 4.3: Awareness- Question 3 skewness and kurtosis chart. ........................ 38
Figure 4.4: Gender chart ....................................................................................... 39
Figure 4.5: Age group representation ................................................................... 39
Figure 4.6: Pay grade chart ................................................................................... 40
Figure 4.7: Work experience ................................................................................. 41
Figure 4.8: Affected occurrence ............................................................................ 41
Figure 4.9: Employee impression of the acting policy ......................................... 42
Figure 4.10: Impression and affected occurrence chart ........................................ 43
Figure 4.11: Employee awareness results ............................................................. 44
Figure 4.12: Career progression of roles acted in ................................................. 45
Figure 4.13: Performance results .......................................................................... 46
Figure 4.14: Employee’s perceptions of growth ................................................... 47
Figure 4.15: Acting leadership results .................................................................. 48
Figure 4.16: Implementation results ..................................................................... 48
Figure 4.17: Organisation results .......................................................................... 49
Figure 4.18: Compensation results charts ............................................................. 50
Figure 4.19: Work duties results ........................................................................... 51

x
LIST OF TABLES
Table 4.1: Cronbach Alpha Coefficients………………………………………..34
Table 4.2: Calculation of mean, median, mode, skewness and kurtosis for
awareness questions………….…………………………………………....……..36
Table F1: Tabulated questionnaire responses……………………………...….…78
Table G1: Item statistics from SPSS……...…………………………………..… 81
Table G2: Inter-item correlation matrix from SPSS………..……….………….. 82
Table H1: Tabulated Cronbach Alpha calculations from Excel…………………86
Table I1: Statistics tables for questionnaire………………………….…………. 89

1
1. CHAPTER 1: INTRODUCTION
1.1. RESEARCH TITLE
The impact of the acting policy on employee motivation and performance in
Transnet.
1.2. RESEARCH BACKGROUND
South Africa is said to have the best rail infrastructure in the whole of the African
continent. However, the freight and passenger rail transport is faced with challenges
of shortages in the local trade, thus the government has since announced a R900 billion
investment in the transport infrastructure (Export.gov, Accessed on: 07/03/2019).
Transnet is the main player in freight railway transport in Africa. It is owned by the
government and operates as an integrated freight transport company, formed around
five operating divisions that complement each other. Transnet Engineering (TE) is a
division of Transnet, which is an advanced manufacturing business that has foundries
and forge shops that manufacture rail components from steel scrap, along with their
maintenance, research and engineering. TE operates in six factories in Bloemfontein
(BFX), Durban (DBN), Salt River (SLR), Uitenhage (UTH), Germiston (GMX) and
Koedoespoort (KDS). TE is further broken down into nine business units namely;
Rolling Stock Equipment (RSE), Wheels, Wagons, Coaches, Locomotives, Rotating
Machines, Foundry, Auxiliary Equipment and Port Business. In 2019, TE is recorded
to have a workforce of 14 500 qualified personnel (Transnet.net, Accessed on:
26/02/2019). TE is the only manufacturing business at Transnet, hence it is important
to understand its employees and what motivates their performance in order to improve
efficiency.
An important element of an organisation’s economic success can be attributed to its
motivated and hardworking employees. However, the organisation’s ability to
understand its competitive advantage and product development is also crucial for
organisational growth (Robbins, Judge, Odendaal & Roodt 2014). It has been argued
that the most valuable asset in a company is the people, especially in relatively low-

2
tech labour intensive industries such as manufacturing, construction, and mining. Lai
(2011) argues that organisations (in whatever industry), should understand the
fundamental principle that an organisation is only as ‘great’ as its employees, as they
embody the mission and have to perform efficiently for the organisation to meet its
targets. Organisations, therefore, continuously seek ways to achieve sustained high
levels of performance through its employees, in order to accomplish the organisational
goals. Latham (1994), proposes that, whatever the work environment, motivation has
an effect on productivity and job satisfaction; workers who are satisfied, strive to
achieve the company’s goals and objectives.
According to the South African Qualifications Authority (SAQA) (2005), the acting
policy is a document that outlines the rules and regulations related to employees who
perform the duties of another employee who is temporarily absent due to vacation
leave, sick leave, maternity leave, family responsibility leave or a secondment to any
other position within the organisation. The acting employee in a lower position
occupies a higher position on a temporary basis and assumes full duties of the higher
position and is compensated to carry out the work (Transnet.net, Accessed on:
26/02/2019). Every employee is unique. Their goals in life create a distinctive source
of motivation. Some employees may view the acting policy in terms of the monetary
value that it provides, whilst others may be motivated by psychological rewards such
as the opportunity to use one’s ability, a sense of challenge and achievement presented
by the acting role (Brooks, 2009).
Employees’ contribute to the organisational life through their values, attitudes and
their own outlook on life and work in terms of their goals and beliefs. The effective
management of these contributions can significantly benefit the organisation.
However, if managed poorly, the organisation may be severely limited in terms of
growth and viability (Mullins, 1999).
1.3. PROBLEM STATEMENT
The ability of an organisation to effectively motivate its employees is imperative to
the efforts of achieving determined organisational goals (Latham, 1994). Sound
policies are imperative in the work place, as is their correct implementation. It has
been observed since 2017 that the existing acting policy at Transnet poses challenges
that are linked to the motivation and performance of employees.
3
According to the TE acting policy, the fact that an employee has been appointed in an
acting capacity does not give the employee the ‘right’ or an ‘entitlement’ to be
appointed to that position. The employee is permitted to apply for the vacant position
should the post be advertised. However, they are not guaranteed the position. The
candidate appointed for the permanent position is chosen according to the company’s
recruitment procedures, in line with Human Resources (HR) regulations (REF NO:
TG/GHC/3/8/3P). As a result, employee motivation can be affected, both that of the
acting candidate and employees throughout the organisation, especially if it is
perceived that employees are merely appointed in an acting capacity but do not get
permanently appointed to the position.
The acting employee is required to carry the full workload of the position, without the
full compensation for the position. SAQA (2005) states that employees should regard
the opportunities to act in a superior position as an important development
opportunity. The opportunity presented by the acting opportunity may have different
effects on employees, depending on whether their source of motivation is intrinsic or
extrinsic (Brooks, 2009).
Frequent changes to the acting position such as the continuous change of acting
supervisors before expiry of acting periods, raises questions of change and leadership
(Mullins & Christy, 2011). When change occurs in the organisation, employees are
expected to be committed to the new temporary leader and his/her style of leadership
without reducing their day-to-day productivity (Taylor-Bianco&Schermerhorn,
2006). Employee motivation demands organisations to thoroughly research and
address the organisational needs of their employees and in return organisations receive
productivity, quality, and service from their employees (Robbins, Judge, Odendaal &
Roodt 2014).
This research explored the effect of the acting policy on employee motivation and
performance at Transnet. This research also provided an opportunity to assess the
extent to which the monetary incentives (such as salary and benefits) and non-
monetary incentives (such as achievement, recognition, job enrichment,
responsibility) provided by the acting policy can motivate and increase employee
performance thus benefiting the organisation. The inherent characteristics of the acting
policy such as leadership changes and the effect on employee motivation were also

4
explored. It was aimed that the results of this research will assist with the overall
understanding of the positive and the negative effect of the acting policy, as a possible
tool to build business success and sustained growth.
Exploring how the acting policy affects employee motivation and performance at
Transnet gives the organisation a learning opportunity and the ability to embrace
change and encourage improved results.
1.4. RESEARCH QUESTIONS
The critical research question (CRQ) can be stated as;
What are the effects of the acting policy on employee motivation and
performance at Transnet?
The research sub-questions can be expressed as;
What effect does intrinsic motivation factors (non-monetary factors) presented
by the acting policy have on employee motivation and performance?
What effect does extrinsic motivation factors (monetary factors) presented by
the acting policy have on employee motivation and performance?
How do the inherent traits of the acting policy affect employee motivation and
performance?
1.5. RESEARCH OBJECTIVES
The objective of this study was to investigate the impact of acting policy on employee
motivation and performance at Transnet. This research was focused on both
employees in the acting capacity and the employees throughout the organisation. The
research was aimed at achieving the following objectives:
Establish how intrinsic motivation factors presented by the acting policy
influence employee motivation and performance at Transnet?
Establish how extrinsic motivation factors presented by the acting policy
influence employee motivation and performance at Transnet
Determine how inherent traits of the acting policy affect employee motivation
and performance at Transnet
5
Recommend strategies to Transnet that can assist with employee motivation
and performance when implementing the acting policy.
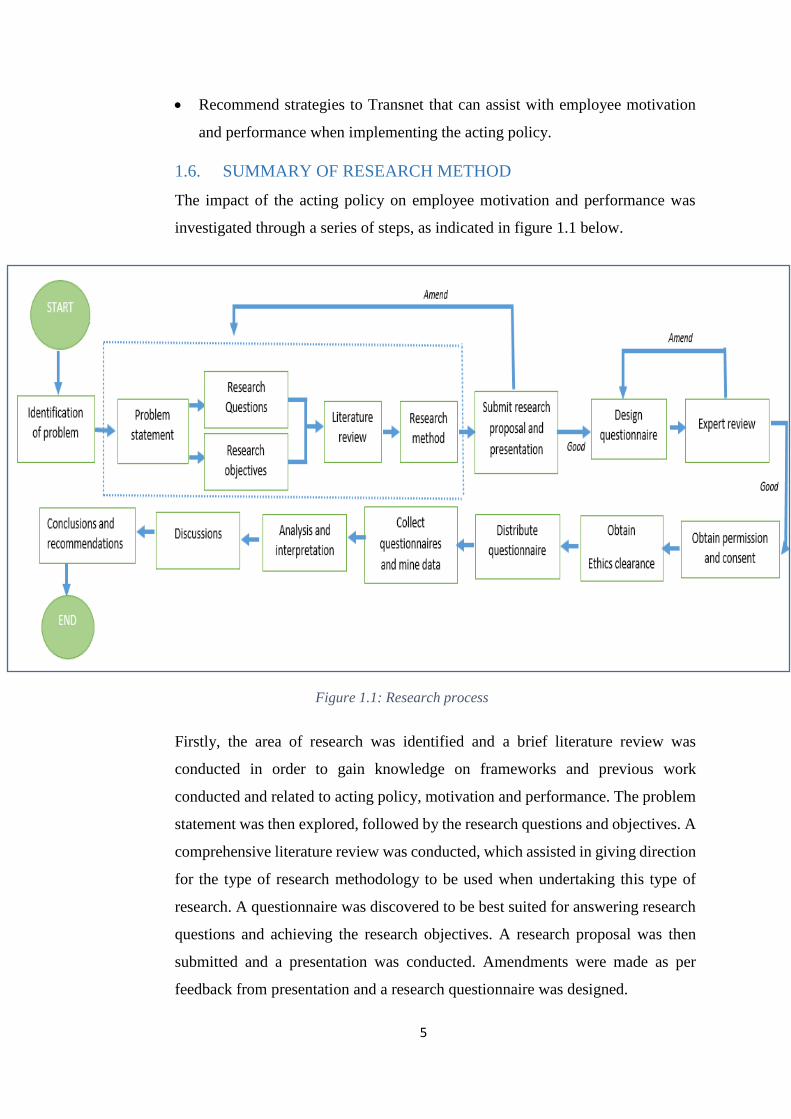
1.6. SUMMARY OF RESEARCH METHOD
The impact of the acting policy on employee motivation and performance was
investigated through a series of steps, as indicated in figure 1.1 below.
Firstly, the area of research was identified and a brief literature review was
conducted in order to gain knowledge on frameworks and previous work
conducted and related to acting policy, motivation and performance. The problem
statement was then explored, followed by the research questions and objectives. A
comprehensive literature review was conducted, which assisted in giving direction
for the type of research methodology to be used when undertaking this type of
research. A questionnaire was discovered to be best suited for answering research
questions and achieving the research objectives. A research proposal was then
submitted and a presentation was conducted. Amendments were made as per
feedback from presentation and a research questionnaire was designed.
Figure 1.1: Research process

6
The questionnaire was designed through highlighting the research objectives
flowing from the critical research question, focusing on the dependant and
independent factors that the researcher aimed to investigate. Building upon the
insights of the literature reviewed, the researcher developed preliminary questions
for the investigation. A five point Likert-scale was employed as it was judged to
be the most effective research tool for this qualitative research, which aimed to
uncover certain beliefs and opinions held by participants. The questionnaire was
then sent to an expert for review.
The review process involved sending the questionnaire to a content expert, with a
view to establishing answers to the questions; “Did I miss any important questions
in the questionnaire?”, and “Should I include/exclude this particular question?”
This ensured the researcher covered all the relevant variables and all the irrelevant
variables were excluded. The content expert then gave feedback on uncertainties
and areas that needed to be clarified and the appropriate amendments were made.
Permission and consent was obtained from Transnet and ethics clearance was
obtained from the University Ethics Committee. The survey, consent form and
information sheets were distributed to the participants using hard copies, due to
participants’ lack of access to computers. Data was collected, analysed and
interpreted using SPSS software and Microsoft Excel. The results were discussed,
followed by conclusions and recommendations.
Each step was undertaken under the guidance and supervision of the assigned
supervisor.
1.6. SCOPE /LIMITATIONS OF RESEARCH
The scope of the research was limited to Transnet Engineering in
Koedoespoort, in two businesses; RSE and Foundry. The research
excluded other Transnet Engineering depots as well as other Transnet
operational divisions.
The research focused on motivation and performance as the only variables
that can be affected by the acting policy.
All variables are measured according to employee’s perceptions.
The research also excluded senior managers, even if they were directly

7
affected by the acting policy due to the lack of subjects to create a good
representative sample.
1.7. OUTLINE OF CHAPTERS
The research report consists of 8 chapters, references and appendices. A brief
overview of each chapters is as follows;
Chapter one introduces the research title and background, along with the
problem statement, research questions and objectives. A summary of
research methods and scope of the research are also explored.
Chapter two is a literature review that seeks to explore terms and concepts
linked to acting policy, motivation and performance. Factors of motivation
and performance, as well as motivational theories are discussed.
Chapter three outlines the research methods by exploring the research
design (qualitative study), sampling technique i.e. non-probability
sampling technique, a questionnaire as an instrument of research, data
analysis, interpretation procedure as well as ensuring reliability and
validity of the study through Cronbach Alpha. Ethical issues are
highlighted.
Chapter four highlights Cronbach’s Alpha reliability test results from
SPSS and Excel. Further illustrates skewness and kurtosis of each
question, followed by graphical representation of the results from the
survey questionnaire.
Chapter five discusses the results obtained from the survey.
Chapter six highlights the conclusions and recommendations from the
study.
References used in the research are shown.
Appendices
Appendix A: Participation information sheet
Appendix B: Consent letter

8
Appendix C: Permission to conduct research
Appendix D: Ethical clearance
Appendix E: Survey questionnaire
Appendix F: Questionnaire responses
Appendix G-Cronbach’s alpha calculations from SPSS
Appendix H- Cronbach alpha calculations from Excel
Appendix I- Skewness and kurtosis calculations and graphs for each section

9
2. CHAPTER 2: LITERATURE REVIEW
2.1. INTRODUCTION
This section presents a thematic literature review of the relevant theoretical literature
in relation to the impact of acting policy on employee motivation and performance. It
relates literature to the research questions that analyses the intrinsic and extrinsic
motivation factors, as well as the inherent characteristics of the acting policy and the
extent to which these factors affect both employee on the acting capacity and
employees throughout the organisation, in terms of motivation and performance. The
literature also reviews different motivational theories and their impact of this research.
The reviewed literature first sought to explore and highlight the Transnet acting policy
for both managers and general workers. Followed by exploring the concept of
motivation and types of motivation. Then the relevant theories and factors of
motivation are reviewed and linked the research. Lastly, factors that indicate employee
performance are reviewed.
2.2. DEFINING TERMS
For clarity, the concepts of employees, employee motivation and performance will be
described separately to ensure common understanding.
Employees
Shumen (2009), described employees as individuals who are hired under a permanent
or temporary employment contract (written or oral). The contract stipulates a
remuneration package and the duties and the responsibilities of the employee in a
certain time frame.
Employee motivation
Ran (2009) defined employee motivation as the individual’s efforts, passion and
determination towards achieving a certain goal in the work place.
Employee Performance
Performance is the term used to describe activities that individuals undertake in order
to meet the set goals (Cardy & Selvarajan, 2004). Employee performance explains the

10
observable activities that show how the work is done to achieve targets (McNamara,
2005).
2.3. ACTING POLICY
An acting policy is a framework that ensures fairness and consistency for employees
who are temporarily performing duties beyond their normal scope of employment, in
a higher graded position. The policy regulates the acting appointment process, in line
with Human Resources (HR), the acting period and acting allowance. Acting policies
are accompanied by procedure manuals that outline the process for acting application
and the control measures. Company policies are available to every employee to ensure
they are aware and understand the procedures and their entitlement (SAQA, 2005).
Employees at Transnet can be classified according to their paygrades. Employees with
a higher paygrade, ranging from B (being the highest pay) to F (lowest in the range)
are classified as managers. Managers include engineers, officers and executives.
Employees with a lower salary range from G (being the highest in the range) to L
(being the lowest) are classified as bargaining unit employees, also known as general
workers or floor workers.
Winkler, et al. (2014) describe general workers as employees who lack an extensive
level of educational training and perform manual labour. The acting policy for
managers and general workers are similar and only differ in terms of monetary acting
allowance(s).
The following processes are per Transnet acting policy for management employees
(REF NO; /TG/GHC 3/2/2/3P) and acting policy for bargaining unit employees (REF
NO: TG/GHC/3/8/3P );
2.3.1. ACTING APPOINTMENT PROCESS
The need for an acting candidate may be due to vacant positions or the current
incumbent going on leave (REF NO; /TG/GHC 3/2/2/3P) and (REF NO:
TG/GHC/3/8/3P).
For the appointment of a general worker in an acting role, a line manager in whose
department an acting opportunity arises, first discusses the issue with their
management team, then they are able to select a candidate whom they wish to appoint
for the acting position. The appointment of an acting manager is facilitated by a senior

11
manager by choosing a candidate whom they wish to appoint (REF NO; /TG/GHC
3/2/2/3P).
The selection process of identifying and hiring a suitable candidate for both general
worker and managers must be directed by operational and developmental objectives
of the department. All acting appointments need to have final approval from the Chief
Executive Office, in consensus with the HR Director (REF NO: TG/GHC/3/8/3P).
2.3.2. ACTING APPOINTMENT PERIOD
An acting appointment is only appropriate when the position is temporarily available
for a continuous time frame that exceeds 30 days. However, acting periods should be
kept under 6 months, for both general workers and managers (REF NO; /TG/GHC
3/2/2/3P).
Individuals acting for periods of less than 30 days are not eligible for acting allowance
(REF NO: TG/GHC/3/8/3P).
2.3.3. ACTING ALLOWANCE
An employee in an acting capacity is eligible to receive an acting allowance if they
have been acting in the position for more than 30 days. The acting candidate is
expected to assume full responsibility in the vacant position, otherwise they do not
qualify for the acting allowance.
The acting allowance for general workers is 5% of the employee’s basic salary or 5%
of the minimum of the position they are acting for; whichever is the greater amount
(REF NO; /TG/GHC 3/2/2/3P).
The acting allowance for managers is calculated at 5% of the acting employee’s
current total package, not that of the position they are acting within (REF NO:
TG/GHC/3/8/3P).
None of the acting allowance is pensionable. The acting employee may only receive
the allowance for the period in which they are acting.
The acting policy emphasizes the experience presented by the policy should exceed
the financial gain for employees (REF NO: TG/GHC/3/8/3P).
12
2.4. CONCEPT OF MOTIVATION
The Cambridge dictionary (2017), defines motivation as the willingness and
enthusiasm to do something. The concept of motivation has been defined by many
scholars from different fields and eras. Likert (1961) describes motivation as a reason
for action towards a certain goal. Luthans (1998) says motivation is a force that fuels
an individual to perform, continue or stop a behaviour. For the basis of this research,
motivation is defined as a driving force for employees to achieve the organisation’s
goals.
According to Shadare et al. (2009), managers can use employee motivation as a
policy to increase affectual job management within the organisation. Motivated
employees are responsive to the organisational goals they must achieve and exert
efforts in that direction. Rutherford (1990), says motivated employees positively
influence organisational success since they are provoked to constantly look for
improved practices to carry out daily tasks.
However, every employee is unique, thus even the type of motivators they will
embrace will be unique. These differences between employees, force organisations
through their mangers to know and understand what motivates their employee’s
performance. Researchers suggest two types of motivation; intrinsic and extrinsic.
2.4.1. INTRINSIC MOTIVATION
Intrinsic motivation; the employee’s motivation to perform a task comes from personal
attachment or for personal satisfaction. Intrinsic motivation is not related to monetary
rewards but rather non-monetary rewards such as; recognition, status, acceptance etc.
(Mullins, 2005).
More recent scholars, Ryan and Deci (2000, p.70) refer to intrinsic motivation as a
natural inclination ‘‘to seek out novelty and challenges, to extend and exercise one’s
capacity, to explore, and to learn’’. When individuals are intrinsically motivated, they
take part in activities because they find them stimulating and thus are inherently
satisfied.

13
2.4.1.1. INTRINSIC FACTORS AFFECTING EMPLOYEE MOTIVATION
2.4.1.1.1. RECOGNITION
Von Bonsdorff (2011) describes employee recognition as the appreciation or
acknowledgement of an individual / team’s positive efforts. Acknowledgement may
be in terms of gestures that employees perceive to be important.
Employee recognition and appreciation boosts employee morale and allows
employees to extend their efforts (Daniels, 1999). Employee recognition has also been
found to lead to improved communications and decrease levels of absenteeism and
turnover (Robbins & Judge, 1999). Regularly recognizing employees is the easiest
way to motivate employees (Daniels, 1999).
Employees have a need for status (Maslow, 1964). Recognition allows for employees
to have status, as they feel appreciated by management and co-workers (Von
Bonsdorff, 2011).
2.4.1.1.2. DELEGATION OF AUTHORITY
According to Al-Jammal, Al-Khasawneh (2015) delegation of authority is a
contemporary method that managers use to motivate their employers. Koontz &
Weihrich (2003) describe delegation of authority as a procedure of transferring
power and responsibilities from superiors to the subordinates. Subordinates are
empowered to use their own intuition, decision making skills and demonstrate their
capabilities. Ortiz, Gorita, Vislykh, (2004) argue the main aim of an organisation to
use delegation authority is to adopt best usage of resources to permit and ease the
rise and appearance of agility of employees, and therefore to improve overall
performance of the organisation.
2.4.1.1.3. JOB ENRICHMENT
Job enrichment is a motivational technique used by organisations which enables
employees to have self-governance over their work tasks (Herzberg, 1965). It allows
employees to have more responsibility and power over their tasks. Whittaker (2008)
suggests job enrichment yields increased motivation and efficient performance since
employees can take shortcuts, eliminate unnecessary steps and thereby increase their
overall performance. Job enrichment also eliminates micro-management which can
demotivate capable employees.

14
However, job enrichment can sometimes lead to employee demoralisation. This may
be the case when employees are given extra responsibilities and autonomy, and they
expect increased pay or some other kind of compensation and their expectations are
not met. This may leave employees frustrated and demotivated.
Whittaker (2008), suggests that some employees do not desire job enrichment and
being in a job enriched environment may leave them feeling dissatisfied.
2.4.1.1.4. RESPONSIBILITY AND EMPOWERMENT
Lai (2011) proposed that giving employees the opportunity to participate in
managerial decisions through power sharing and increasing their level of
responsibility leads to increased motivation and performance. This also leads to
employee empowerment, which aids in employee self-sustenance.
Giving employees more responsibility and empowering them, allows for employees
to be self-reliant thereby increasing their performance and their confidence upon
embarking on work tasks.
Responsibility assignment is another factor. It can be characterized as an
arrangement of tasks, occupations and capacities that are official or business or
relating to any other form of responsibility an individual can genuinely request
(Koontz & Weihrich. 2003). Requests in general are consummately being given
reasonably and effectively to transfer obligation and duties to energize and motivate
employees.
This allows employees to be more convinced to do a particular task, likewise making
them assigned on a task which is vital. Employees may demonstrate accountability.
Responsibility and empowerment can easily be related to the Hertzberg two factor
theory, as motivation factors that are intrinsic to the job and can lead to direct
employee motivation. Lai (2011) argues that employee empowerment not only
increases employee motivation but the overall workforce energy enabling employees
to work efficiently and effectively.
2.4.1.1.5. MEANINGFUL WORK & TASK SIGNIFICANCE
Meaningful work and task significance are considered to be very important intrinsic
motivation factors. Employees want to be involved in work that is qualitative and
significant to them, the organisation and people outside of the organisation. Significant

15
tasks and meaningful work enables employees to have a sense of achievement after
completing tasks.
Employees who have the desire to achieve, should be given meaningful work.
Employees who perceive their work is not meaningful, will tend to feel demotivated
and have low performance (Yaseen, 2013).
2.4.1.1.6. TRAINING AND DEVELOPMENT PLATFORMS
Providing employees with training and development platforms encourages growth and
improves employee’s knowledge and skills necessary for development. Development
opportunities increase employee’s capabilities and competencies. Kabir (2011) says
organisations that develop their employee’s give them a sense of career security and
encourages them to have a positive attitude towards the organisation.
An organisation with limited training and development opportunities may leave
employees feeling demotivated.
2.4.2. EXTRINSIC MOTIVATION
Extrinsic motivation; the employee’s motivation to perform task depends on tangible
rewards. Extrinsically motivated individuals/ employees partake in activities in order
to obtain a certain reward or achieve some valued outcome (Mullins, 2005). Extrinsic
rewards for employees include monetary compensation e.g. salary and bonuses; job
security and promotion opportunities.
A study conducted by Von Bonsdorff (2011) indicates that intrinsic motivation
decreases as the employee ages, however extrinsic motivation remains unchanged.
Chintaloo and Mahadeo (2013), described extrinsic factors as factors that are beyond
the employee’s control such as compensation, communication, leadership etc.
2.4.2.1. EXTRINSIC FACTORS AFFECTING EMPLOYEE MOTIVATION
2.4.2.1.1. MONETARY COMPENSATION
Organisations use salaries, bonuses and other fringe benefits to motivate their
employees towards higher levels of performance. Researchers such as the classic
theorist, Frederick Taylor propose that monetary rewards are the most significant
when motivating workers to achieve more efficient performance.
According to Ruiz-Palomino et.al. (2013), employees are never content with their
level of pay and always seek elevated pay. They further argue that organisations

16
should seek to improve employee’s pay in order to improve employee productivity
and commitment. However, Fakhfakh and FitzRoy (2004) argued that increasing
employee pay is disadvantageous to the company profits.
Brown (2001) stated that management should take note of the importance of pay
structures when making pay policy for employees. The pay structure includes elements
of the salary, bonuses and allowances. Employees may feel demotivated if they believe
the pay structure is not apportioned fairly among the employees and thus question their
organisational status and value.
2.4.2.1.2. LEADERSHIP
Yuki (1994) refers to leadership as a process of inspiring or influencing subordinates
to focus their energy and skills towards achieving a certain target. The leader
maintains integrity and co-operation within the team in order to reach the final
destination and target efficiently. Likewise, Rukhman (2010), described leadership
as an input or primary action into the team to enrich the process and performance of
team members.
A leader motivates other employees to perform towards certain goals. The leader
inspires employees and assist in maintaining organisational morale. Leadership and
motivation are active processes in management (Rukhman. 2010). The leader does
work to show commitment to the mission and willingness to do “dirty work” when
necessary.
2.4.2.1.3. PROMOTION OPPORTUNITIES
Promotions are mostly desirable among employees as they involve a positive change
in pay, responsibility, status etc. McClelland (1961) states employees have the need to
achieve, to be successful in their career. Some employees view promotion as a career
achievement and may feel satisfied once promoted.
Brown (2001) says promotion and job satisfaction are directly related thus
organisations must provide employees with the necessary tools and platforms for
promotion, then employees will be motivated. Naveed and Bushra (2011) state that
according to Maslows’s (1964) theory of needs, once an employee’s esteem needs
(competence and status) are met, they will feel satisfied with their job.

17
2.5. THEORIES OF MOTIVATION
Motivation theories provide a sound theoretical background for this research regarding
the effect of the acting policy on employee motivation and performance. An
employee’s performance has the potential to make or break an organisation, hence it
is crucial to explore various theories and methods of motivating employees (Maslow,
1964). For the purpose of this research, the following motivational theories have been
selected in terms of their relevancy.
2.5.1. MASLOW’S THEORY: HIERARCHY OF HUMAN NEEDS.
Maslow’s hierarchy of human needs theory is one of the most popular theories of work
motivation in our time. Maslow’s theory consists of a five-tier model of different
human needs which are organised in hierarchical levels of a pyramid, (see figure 2.1)
(Maslow, 1964). Maslow further divided the hierarchy into two groups; deficiency
needs consisting of the first four lower tiers and the top tier known as growth needs.
Each level of needs requires attainment before progressing to the next (Maslow, 1964).
Figure 2.1: Maslow hierarchy of needs
Source: Maslow, 1964
The needs at the bottom of the pyramid are physiological needs, consisting of the
basic human needs such as air, water, food and shelter and other biological human
needs. These needs need to be met for the human body to function optimally (Robins
& Judge, 2013). Maslow, (1964) considered these needs as the most important. The
second tier consist of safety needs which are an individual’s need for a secure

18
environment that has law, order and freedom. Love and belongingness needs include
need for interpersonal relationships, acceptance, affection and trust. Esteem needs
are categorised into two. The first esteem need is for the individual’s independence
and confidence and the second the desire for respect from others e.g. status and
recognition. The highest need identified by Maslow is self-actualisation, wherein
individuals are seeking personal growth (Robins & Judge, 2013).
Maslow (2000) stated the first four needs (deficiency needs) for employees are met in
their workplace. An employee’s primary need that must be satisfied in the workplace
is pay, there after the need for safe working conditions. Once the first two needs have
been satisfied, employees will seek to fulfil their social needs through building
relationships with colleagues and supervisors, to feel socially included and gain a
sense of belonging (Benson & Dundis, 2003). An employee’s self-esteem needs are
met when they receive recognition and performance appraisal or reward (Maslow,
2000).
Maslow’s theory has been criticised because it assumes homogeneity of individual’s
needs and satisfaction levels (Robins&Judge, 2013). Robins and Judge (2013) argue
that no need is ever fully satisfied and the satisfaction of needs does not motivate
employees.
2.5.2. FREDERICK HERZBERG – TWO FACTOR THEORY OF
MOTIVATION
Herzberg (1965) proposed two factors of motivation in the workplace; motivation
factors (motivators) and hygiene factors.
Herzberg (1965) argued that motivational factors directly motivate employees towards
working efficiently. However, there are certain factors that when absent can de-
motivate employees, though their presence does not necessarily motivate employees
to work more efficiently, these factors are known as hygiene factors.
Hygiene factors are concerned with factors that surround the job and not the job itself.
Factors such as; good supervision, company laws and regulations and safe working
conditions. Motivation factors on the other hand are concerned with the actual job
itself; factors include level of difficulty of the work, the degree of responsibility and
promotion. Motivators are intrinsic to the job and lead to job satisfaction while hygiene

19
factors are extrinsic to the job and prevent job dissatisfaction but cannot cause
satisfaction.
Herzberg (1965) believed that organisations should seek to motivate employees
through a democratic approach to management and by enhancing the essence and
content of the work through the following methods;
Job enlargement - work is made to seem more interesting by giving employees a
bigger scope and assortment of tasks for them to perform.
Job enrichment - giving workers a greater sense of achievement through giving
employees difficult and interesting tasks and allowing self-governance.
Empowerment – allowing employees to have more decision making powers
concerning decisions in the work life.
2.5.3. MCCLELLAND’S THEORY OF NEEDS
In 1961, David McClelland suggested three needs that he believed every individual
has; the need to achieve, need for affiliation and need for power. The need for
achievement is an individual’s need to be successful; to be able to overcome difficult
tasks. The need for affiliation is an individual’s need to be in a group and feel loved.
The need for power is an individual’s need to have authority, their desire for status
and to make decisions (McClelland, 1961).
McClelland’s theory argues that regardless of different backgrounds, gender or age,
everyone is driven by these three needs. However only the dominant motivator makes
an individual’s character. The dominant motivator is based on the individual’s
background, beliefs, gender, age, experiences etc.
According to McClelland (1961), the employee’s need to achieve (which may be to
exceed the targets and expectation) is subconscious. Thus an employee’s motivation
for achievement may be hidden from the employer, making measurement a difficult
task (Robin & Judge, 2013). This theory is limited because it’s not realistic for
employers to try to understand the individual employee’s need to achieve (Royle &
Hall, 2012).
20
2.5.4. EXPECTANCY THEORY
Theories of human needs by Maslow, Herzberg, and McClelland explain what
motivates employees in the work environment. Expectancy theory rather deals with
the precursors that precede motivation and their relationship. Victor Vroom (1964)
was the first to develop the expectancy theory with direct application to the workplace,
which was later refined by Porter and Lawler in 1968 (Lunenburg, 2011).
Vroom‘s theory of expectancy states that employees will put in an amount of effort
and the performance they achieve from the effort will yield rewards (Vroom, 1964).
People will work efficiently if they believe that high effort will yield a performance
that will give them certain rewards (Boachie-Mensah & Dogbe, 2011). The
expectancy theory is built on the following four assumptions (Vroom, 1964:3)
Individuals enter an organisation with certain expectations for their needs,
which affects how they react in the organisation.
Individual’s consciously choose how to behave according to their own
expectations
Employees have unique desires from the organisation for example; salary,
promotion, security.
Individuals will choose an option that suits their personal needs better.
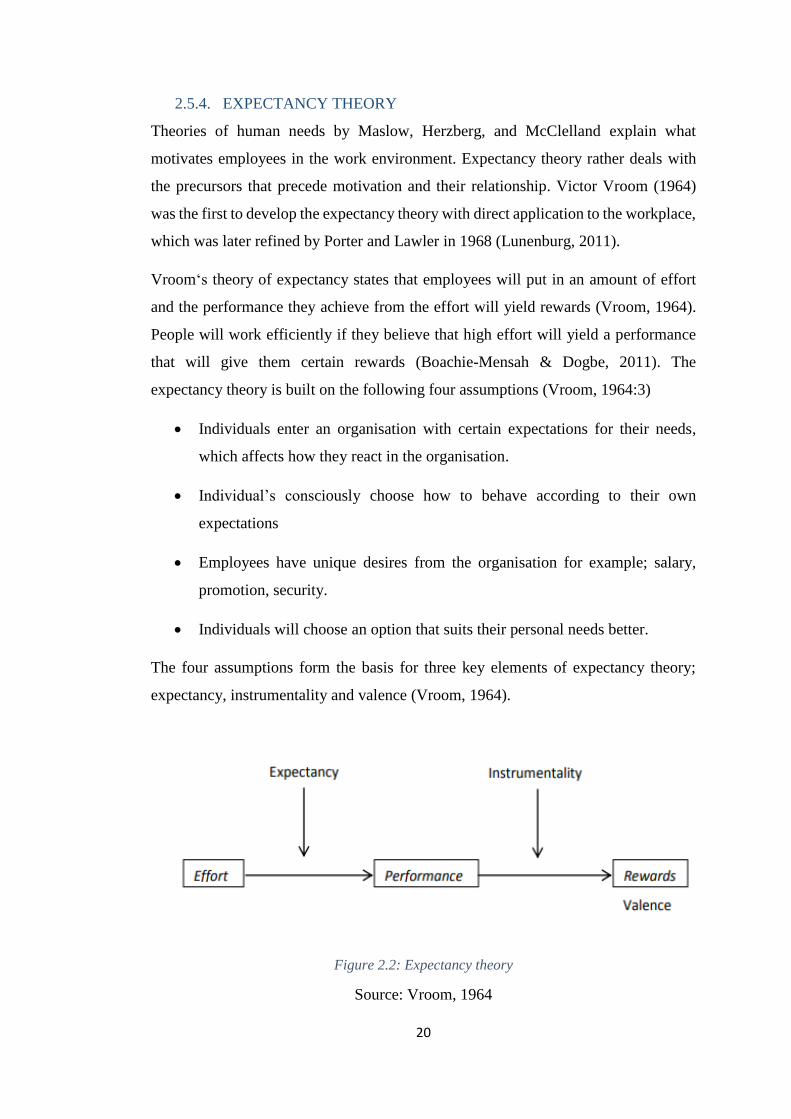
The four assumptions form the basis for three key elements of expectancy theory;
expectancy, instrumentality and valence (Vroom, 1964).
Figure 2.2: Expectancy theory
Source: Vroom, 1964

21
An employee is motivated to a level they perceive that (i) effort yields performance
(expectancy), (ii) performance will have rewards (instrumentality) and (iii) the
rewards are highly valuable to the employee (valence)
Expectancy is an employee’s evaluation of the probability that their effort will yield
rewards. According to (Lunenburg, 2011) supervisors should always encourage their
subordinates to believe they are capable of doing the job, through providing training
and sufficient resources.
Instrumentality exhibits the link between performance and results. Employees
perceive a certain level of performance leads to work rewards, for example; if an
employee does not meet the work targets, they obtain no incentives and vice versa.
Boachie-Mensah& Dogbe (2011) concurred with the theory and further suggested that
employees will work more efficiently if they perceive their pay to be equivalent to the
amount of effort they exerted.
Leaders should measure job performance as a way to motivate employees (Lunenburg,
2011).
Valence is an employee’s preference for a specific reward. Rewards such as
recognition, salary increase may have different levels of desirability for different
employees. According to Nasri and Charfeddine (2012) employees will be more
motivated if they value the reward they will receive for their efforts. Leaders can add
value to the rewards by individualising the rewards (Lunenburg, 2011).
2.5.5. SELF-DETERMINATION THEORY
Self-Determination Theory (SDT) grew from work by researchers Edward L. Deci and
Richard M. Ryan from the 1970s and 1980s from their book; Self-Determination and
Intrinsic Motivation in Human Behavior. Ryan and Deci (2000)‘s theory has
developed into the principle framework for the study of intrinsic motivation. Recently,
Ryan and Di Domenico (2016), started using neuroscience methods to examine
intrinsic motivation, with the hope of linking experimental/ empirical data to
neurobiological information. Though interesting, it is beyond the scope of this
research.
Self-Determination Theory suggests that individuals are motivated to develop and
change by three essential and universal psychological needs; competence, connection

22
and autonomy. People are able to become self-determined once these needs are
fulfilled.
Figure 2.3: Self-Determination Theory
Source: Deci & Ryan (2008)
According to SDT, psychological growth will occur once individuals feel the
following (Deci & Ryan, 2008) ;
Competence-individuals need to master their skills, thus use those skills to
take action towards success / achieving their dreams.
Connection (also known as relatedness) - individuals need to have a sense of
belonging or affection towards others.
Autonomy- individuals need to feel in charge of their actions, behaviour and
goals.
This theory is based on two assumptions;
Individuals are enthusiastically directed toward growth.
It is mainly focused on intrinsic motivation / internal sources of motivation
such as a need to gain knowledge or independence rather than extrinsic
motivation (external rewards, e.g. money, prizes).
Deci and Ryan (2008) say that employees that feel they have a positive effect on their
work and at work, tend to be more engaged and motivated. They further explain that

23
managers can nurture self-determination in employees through allowing them to take
an active role in projects. Managers can also offer constructive criticism and advice.
2.5.6. INTEGRATION OF MOTIVATION THEORIES WITH THIS
RESEARCH
The conceptual framework of Maslow’s hierarchy of human needs, Frederick
Herzberg – two factor theory, McClelland’s theory of needs and the expectancy theory
underpin the thrust and detail of the research. All presented theories propose that
employees will be motivated once their needs are met by the organisation. These
theories are relevant to this research as they assist in the examination of the impact of
acting policy on employee motivation and performance.
2.6. EMPLOYEE PERFORMANCE
Performance is the term used to describe activities that individuals undertake in order
to meet the set goals (Cardy & Selvarajan, 2004). Employee performance explains the
observable activities that show how the work is done to achieve targets (McNamara,
2005).
An employee’s performance can be raised by motivation and coercion and they can
put in more time and effort to exert more deliverables which may lead to an excellent
performance owing to their efficiencies.
The following factors are good indicators of employee performance:
2.6.1. LEVEL OF COMMITMENT
According to Porter (1974), employee commitment to the organisation is the extent to
which they admit and accept the aims, values and morals of organisation and are keen
to continue and remain in the organisation. The association of employees within the
organisation is regarded as their commitment to the organisation. Employees who have
an increased level of commitment to the organisation are motivated and comply with
organisational requirements.
Meyer & Allen (1997), say commitment to the organisation has three dimensions
namely; continuous commitment, normative commitment, affective commitment.
These commitment levels are totally independent and can be exhibited by different
people at different levels of management within the organisation. Employees that are
committed to the organisation will tend to perform better at their jobs.

24
Figure 2.4: Relationship between performance, commitment and learning goal.
Source: Latham (2011)
Latham (2011), conducted a study whereby employees had to acquire specific
knowledge in order to perform their work tasks more efficiently. Figure 2.4 above
shows that those with high commitment to the organisation performed better than
those with low organisational commitment, despite their educational goals.
2.6.2. WORK ATTENDANCE
Organisations track employee attendance as it can affect performance and
productivity. Frequent absence of employees may cause a burden on other employees
and thus prevent the team from being productive. The absent employee’s work
becomes extra work for another employee. Work attendance is very important to
ensure sustainable work performance via task completion as a means of avoiding
diminished work performance (Root, 2016).
2.6.3. QUALITY OF WORK
Scott (2016) says the quality of work (the way it is done and accomplished) can be
considered as a reflection of how employees are committed and have passion for what
they do. Quality can be a very particular characteristic of employee performance.
Employees who are engaged and genuinely care about what they do, will perform
better with fewer quality issues.
25
2.6.4. ACCOUNTABILITY
The lack of accountability in an organisation can lead to demotivation of employees,
which will reflect negatively on performance and outcome (Haneberg, 2012). When a
concerted effort is made by senior management or associates, to be accountable and
excel, there is a corresponding will to work and perform alongside inherited
responsibility (Artley, 2001). Employees may also inherent the culture of
accountability, if the organisation itself is accountable.
2.6.5. EMPLOYEE INITIATIVE
Studies show that one of the most unique aspects and characteristic that many
employees may pursue is initiative (Root, 2016). Employees who take initiative, will
participate in the assistance of identifying best practices to ensure the company
remains in a competition position without missing its target (Fan, Yen and Volz,
2005).Members of a team or individuals who are considered to take initiatives have a
positive impact on overall team performance and that of the organisation.
2.6.6. WORKER EFFICIENCY
Low (2003) defines efficiency as how successfully inputs are transformed into outputs.
Efficiency is the ultimate outcome in the eyes of managers, customers, employers and
colleagues (Campion, Medsker & Higgs, 1993). Efficiency can be three dimensional:
Output that meets the standards of quality
The ability of the group to interdependently work in advance or the future
The potential growth and the well-being of members of the team
Efficiency is a good indicator of performance.

26
3. CHAPTER 3: RESEARCH METHODS
3.1. INTRODUCTION
This research was aimed at exploring how the acting policy at Transnet affects
employee motivation and performance. This research was a qualitative study that
aimed to obtain in-depth understanding of the employee’s state of mind or perceptions
about the acting policy. Literature review conducted gave a good indication in terms
of research methodology that would be best suitable for this research.
This section explores the research design, sampling method and instrumentation that
was used, as well as data collecting and analysis procedures for this research. Ethical
considerations, limitations, validity and reliability of the research are also highlighted
in this section.
3.2. RESEARCH DESIGN
According to Leedy & Ormrod (2010) research design is a series of steps that outlines
how the research will unfold, describing the procedures for data collecting and
analysis.
The research objectives of this study can be best achieved through a qualitative study
that will be aimed at exploring the impact of acting policy on employee motivation
and performance. Qualitative research methods are exploratory in design and give
greater insights and understanding to a research area (Leedy & Ormrod, 2010). The
purpose of this research was not to measure or quantify any factor, rather its aim was
to gain understanding of factors that affect employee motivation and performance. To
this end, this research was aimed at exploring the lived experiences of employees and
to provide valuable insight into this research.
McLeod (2011) says “it is impossible to achieve complete ‘scientific’ understanding
of the human world. The best we can do is to arrive at a truth that makes a difference
that opens up to new possibilities for understanding” (2011:4).

27
3.3. SAMPLING
A sample is a small quantity meant to represent the whole quantity (Saunders & Lewis,
2012). Due to the large population at Transnet, a smaller sample was used for research
purposes. The research was focused on TE employees based in KDS, working in
various bays. KDS depot was chosen due to its accessibility to the researcher and the
depot will yield the most comprehensive results due to its diversity and large number
of employees, as compared to the other TE depots.
3.3.1. POPULATION
Saunders & Lewis (2012) state, the population under study must answer the research
questions of the research. The population for the research included employees, from
managers to general workers, from higher pay scales to the lower spectrum at TE KDS.
General workers job description included; artisans, millwrights, fork lift drivers,
foreman, operations manager. Managers’ work is mostly office based, however both
general workers and managers’ jobs are motivation and performance driven. Both
categories of employees are directly affected by the acting policy and can be able to
answer research questions.
The majority of the general workers have basic education and cannot use computers.
The common spoken languages are English, SePedi and Afrikaans, even though there
are other tribes such as Tsonga, Venda and Tswana.
Temporary and contract employees, as well as students were excluded from the study.
3.3.2. SAMPLING TECHNIQUE
A non-probability sampling technique was chosen due to time and money constraints.
A non-probability sampling technique is a technique whereby subjects are chosen by
the researcher on the basis of accessibility or purposive personal judgement of the
researcher (Dolores & Tongco, 2007). Transnet is a large organisation operating in
all 9 provinces in South Africa, thus reaching all employees especially general workers
would prove difficult due to their lack of access to computers. In order to have a good
representative sample, a consecutive sampling technique was chosen. Consecutive
sampling includes all accessible subjects as part of the research sample. Merriam

28
(2002) say that consecutive sampling is the best non-probability sampling technique
as it includes all available subjects, thus making the sample more representative.
Non-probability sampling technique offers the advantage of simplicity and low costs.
This technique however has the disadvantage that a section of the population is not
sampled, thus the results may or may not be an accurate representation of the entire
population. As such, results cannot be used in generalizations for the whole
population. Merriam (2002) argued that consecutive sampling gives accurate results.
3.3.3. SAMPLE SIZE
The research was aimed at approximately 75 general workers and 25 managers
employed by TE at KDS. This serves the purpose of stratification of the sample
population. According to www.surveygizmo.com (accessed 13/06/2019), a 40%
response for an internal questionnaire can be considered a success. Therefore, an
expected response of 30 general workers and 10 managers will be considered a
success.
This research aimed at both male and female, from ages 25 to 60, representing the
younger and older generation. All races were targeted.
Various data concerning employee characteristics was collected; gender, age group,
pay grade and years of experience etc.
3.4. INSTRUMENTATION
A qualitative instrument was paramount to give details that are imperative to the
understanding of employees’ perceptions and the reality of the impact of the acting
policy on employee motivation and performance. Thus, quantitative data was collected
through a structured questionnaire.
Merriam (2002) states in a qualitative study, the principal instrument in data collecting
and analysis is the researcher. However, the main concern for the researcher
undertaking qualitative studies should be their objectivity. Researchers must be
objective/fair when analysing data for qualitative purposes.

29
A survey was undertaken via the research tool of a questionnaire. A questionnaire
allows for participants to answer the questions with less interference from the
researcher. The questionnaire used a five-point Likert scale, combined with a
yes/no/maybe kind of questions. According to Leedy & Ormrod (2010), the
questionnaire method offers benefits as it is easily distributed to far away locations,
offer participants anonymity and the researcher is able to distribute to a large number
of participants.
According to Leedy & Ormrod (2010) and www.fao.org (accessed on 13/06/2019),
the design of a questionnaire has no theoretical base to guide the researcher into
designing a perfect questionnaire. The survey questions were derived or formulated
through brainstorming and reviewing literature, followed by outlining the information
the researcher had to gather from the respondents in order to meet the survey
objectives and the answer the critical research question. The questionnaire was
designed to be succinct, thus any questions that were not aimed at addressing the
research objectives and critical research question were excluded. Target information
was then used to develop question content, wording, meaningfulness and length of the
questionnaire (Crawford, 1990).Literature was also used as a guide to avoid
questionnaire errors such as duplicate questions, ambiguous questions and lengthy
questions. The questionnaire was then sent to an expert for review.
According to Boynton and Greenhalgh (2004), it is advisable to have an expert review
the contents of the questionnaire. The review process involved sending the
questionnaire to a content expert, with questions such as;
“Did I miss any important questions in the questionnaire?”
“Should I include/exclude this particular question?”
“ Did I phrase the questions correctly?”
“ Is the order easy to follow?”
This ensured the researcher covered all the relevant variables and all the irrelevant
variables were excluded. The content expert then gave feedback on uncertainties and
areas that needed to be clarified so the questions meet the research objectives and

30
participants were not confused. Amendments were then made as per
recommendations.
The questionnaire was conducted in English due to the presence of many different
languages and mainly because English is the main medium of communication at TE
KDS. The questionnaire did not comprise any open ended questions. The
questionnaire had clear instructions and the questions for the research participants
followed a logical order.
3.5. DATA COLLECTION AND ANALYSIS PROCEDURE
3.5.1. DATA COLLECTION
Data was collected from general workers and managers through employees
anonymously completing the questionnaires. Hard copy questionnaires were handed
out at to employees and a brief description was given about what the research entails,
along with the participation information sheet and consent form (see appendices A, B
and E). Employees were given the opportunity to ask questions, should any of the
survey questions require clarification.
Each employee was handed a questionnaire and requested to complete as honestly as
possible. Employee participation was voluntarily. No employee was forced or paid to
complete the questionnaire.
3.5.2. DATA ANALYSIS
The data collected from the questionnaires responses was analysed using statistical
software tools SPPS and Excel. Data can be inputted and transferred to the software
tools which compute and automatically setup and input variables, tables, graphs, titles
and label, for easier analysis and interpretation. The data will be analysed and
interpreted to provide results leading to the conclusion on the relationship between
acting policy, motivation and performance.
3.6. RELIABILITY AND VALIDITY
The researcher ensured the research findings are reliable and valid. Reliability refers
to the consistency and repeatability of the findings of the study (Merriam, 1995).

31
Winter (2000) argues that a qualitative study is about human behaviour and
interactions are ever changing, and findings can be repeated incorrectly.
Cronbach’s alpha is referred to as one of the most commonly used measures of internal
consistency ("reliability"). It is found to be most useful when using a multiple Likert
scale in a questionnaire, in order to determine if the scale is reliable
(Statistics.laerd.com, 2019).
The researcher used the Cronbach’s alpha to determine if all the questions in the
questionnaire reliably measured the impact of the acting policy on employee
motivation and performance. A Cronbach’s Alpha was run on all worker’s responses
to the questionnaire.
Validity of a qualitative study is concerned with the accuracy or correctness of the
findings (Merriam, 1995). Merriam further argues that a valid study should reflect a
phenomenon that actually exists and a valid instrument should measure what it is
supposed to measure.
3.7. ETHICAL ISSUES/CLEARANCE
This research involved a critical review of company policy and Transnet employees
as the source of information. Thus, the researcher took into consideration the
following ethical principles;
Permission
Permission was requested from Transnet to allow employees to participate in
the research study. Permission was granted (see appendix C).
Ethics clearance
Ethics clearance was obtained through the School of Ethics Committee (see
appendix D).
Ethics clearance number: MIAEC 242/19.
Confidentiality, privacy and participation

32
Participants were guaranteed confidentiality as the information gathered would
only be used for the purpose of the researcher’s academic requirements.
Transnet company information is confidential and will be used only for the
purpose of this research.
Participants in the study were not forced or paid to participate.
Legality
Research obeys all Transnet governance policies.
Plagiarism
All sources consulted for the research were acknowledged and referenced.
Falsification and fabrication
All information provided in the research study was true and not fabricated.
The following chapter will present the results and data analysis obtained from the
administered questionnaire.

33
4. CHAPTER 4: DATA ANALYSIS AND RESULTS
4.1. INTRODUCTION
This chapter outlines the research results collected through a qualitative method via
questionnaire. Findings from the data collected and analysis using statistical tools;
SPSS software and Excel are presented.
The questionnaire was deployed using hard copies to Transnet employees at KDS.
Before commencement, the researcher introduced herself and explained the research
topic and objectives. Each participant was given the participant information sheet and
further enlightened on the research area.
Ethical apprehensions were clarified for the participants, including the assurance that
all information was confidential and only to be used for academic purposes. It was
also highlighted that participants can withdraw from the study at any time, without
any repercussions.
4.2. RELIABILITY TEST: CRONBACH’S ALPHA TEST
The questionnaire followed a Five-point Likert scale whereby;
1-Strongly Disagree
2 –Disagree
3-Neutral
4-Agree
5-Strongly Agree
The responses from the questionnaire (see appendix F) were used to evaluate
Cronbach‘s alpha. Cronbach‘s alpha is a reliability test used to evaluate internal
consistency, associated with a score that can be derived from a scale (Pallant, 2010).
Cronbach‘s alpha coefficient (also known as Alpha coefficient) was assessed using
two statistical analysis tools, namely; SPSS software and Microsoft Excel. This was
done in order to ensure the accuracy of the Cronbach’s alpha coefficient obtained from
the respective analysis tools. Each section of questions in the questionnaire was
examined to obtain the overall Alpha coefficient.

34
The Cronbach’s alpha coefficient can range from -1 to 1. Negative values are a red
flag as they indicate the scale items might be reverse ordered. However, this is not
likely to occur. An Alpha coefficient of 1 indicates a high internal consistency for the
scale. According to Pallant (2010), Alpha coefficient values greater than 0.7 indicate
the scale is reliable.
4.2.1. CRONBACH’S ALPHA COEFFICIENTS OBTAINED FROM SPSS
SOFTWARE
Data obtained from the questionnaire was populated on SPSS software and the
Alpha coefficient was computed as shown below;
Table 4.1: Cronbach’s alpha coefficients from SPSS
SPSS estimated the Alpha coefficient at .859, meaning approximately 85% of the
variability in the composite questions (through combining the 27 questions, since 27
items or questions were submitted), 85% of the variance in the questions would be
considered internally consistent. Thus this Cronbach’s Alpha coefficient is acceptable,
as it indicates high internal consistency and is within the range -1 to 1, as earlier
indicated.
SPSS also computed the Cronbach’s Alpha Based on Standardized Items which
calculates the Alpha coefficient on the understanding that all items have the same
variance. According to Wilhem (2014), the variance is not always the same and usually
differs by a small margin. Wilhem (2014) further explained that Cronbach’s Alpha
and Cronbach’s Alpha Based on Standardized Items do not differ by large margins
because the items being combined usually have the same standard deviation. However,

35
when combining dichotomous items with ordinal scaled items, one may obtain very
different Alpha coefficients. Since there is marginal variance between the questions,
the obtained Cronbach’s Alpha and Cronbach’s Alpha Based on Standardized Items
are very similar, with a difference of only 0.002.
4.2.2. CRONBACH’S ALPHA COEFFICIENTS OBTAINED FROM
MICROSOFT EXCEL
Cronbach’s Alpha coefficients obtained from Excel were calculated using the
following formula;
𝛼 =𝑘
𝑘−1(1 −
∑ 𝜎𝑌𝑖2𝑘
𝑖=1
𝜎𝑋2 )………………………………………………………… (1)
Whereby one measures a quantity that is a sum of K components or questions:
X= Y1+Y2+…. +YK
𝜎𝑥2 is the variance of the total questions
𝜎𝑌𝑖2 is the question i for the participant .
𝛼 =𝑘
𝑘 − 1(1 −
∑ 𝜎𝑌𝑖2𝑘
𝑖=1
𝜎𝑋2 )
𝛼 =27
27 − 1(1 −
37.9
248.8)
𝛼 = 0.88
This Cronbach’s Alpha coefficient is acceptable and indicates internal consistency.
The Alpha coefficients obtained from SPSS is similar to the coefficient that was
obtained from Excel. This verifies the respective statistical tools were used correctly
and the data is valid. See appendices G and H for both SPSS and Excel workbook
calculations.
Validity of a qualitative study is concerned with the accuracy or correctness of the
findings (Merriam, 1995). These findings were recorded as obtained.
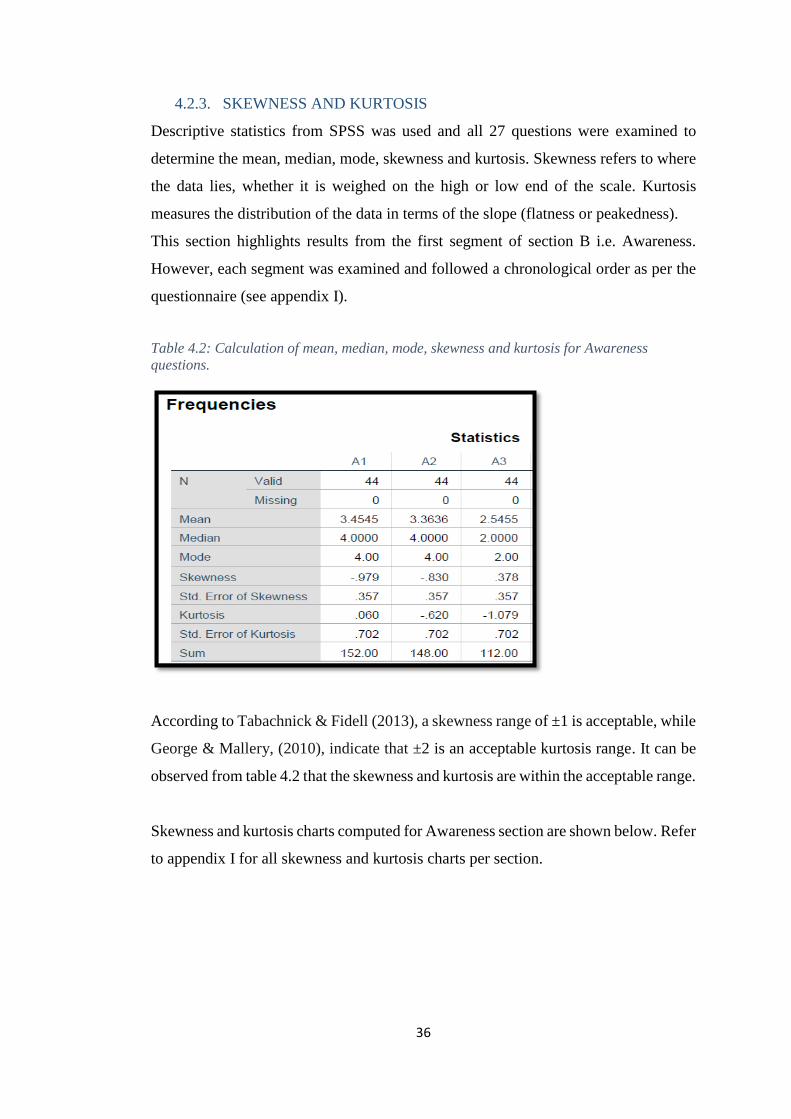
36
4.2.3. SKEWNESS AND KURTOSIS
Descriptive statistics from SPSS was used and all 27 questions were examined to
determine the mean, median, mode, skewness and kurtosis. Skewness refers to where
the data lies, whether it is weighed on the high or low end of the scale. Kurtosis
measures the distribution of the data in terms of the slope (flatness or peakedness).
This section highlights results from the first segment of section B i.e. Awareness.
However, each segment was examined and followed a chronological order as per the
questionnaire (see appendix I).
Table 4.2: Calculation of mean, median, mode, skewness and kurtosis for Awareness
questions.
According to Tabachnick & Fidell (2013), a skewness range of ±1 is acceptable, while
George & Mallery, (2010), indicate that ±2 is an acceptable kurtosis range. It can be
observed from table 4.2 that the skewness and kurtosis are within the acceptable range.
Skewness and kurtosis charts computed for Awareness section are shown below. Refer
to appendix I for all skewness and kurtosis charts per section.
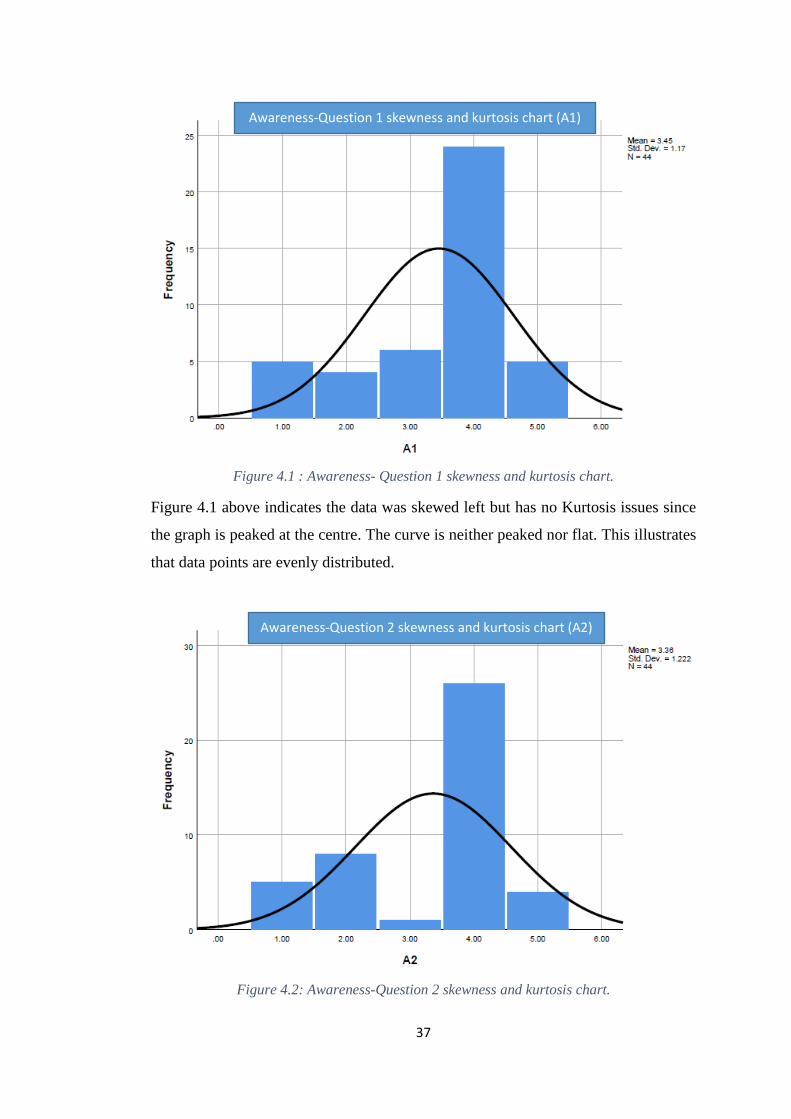
37
Figure 4.1 : Awareness- Question 1 skewness and kurtosis chart.
Figure 4.1 above indicates the data was skewed left but has no Kurtosis issues since
the graph is peaked at the centre. The curve is neither peaked nor flat. This illustrates
that data points are evenly distributed.
Figure 4.2: Awareness-Question 2 skewness and kurtosis chart.
Awareness-Question 2 skewness and kurtosis chart (A2)
Awareness-Question 1 skewness and kurtosis chart (A1)
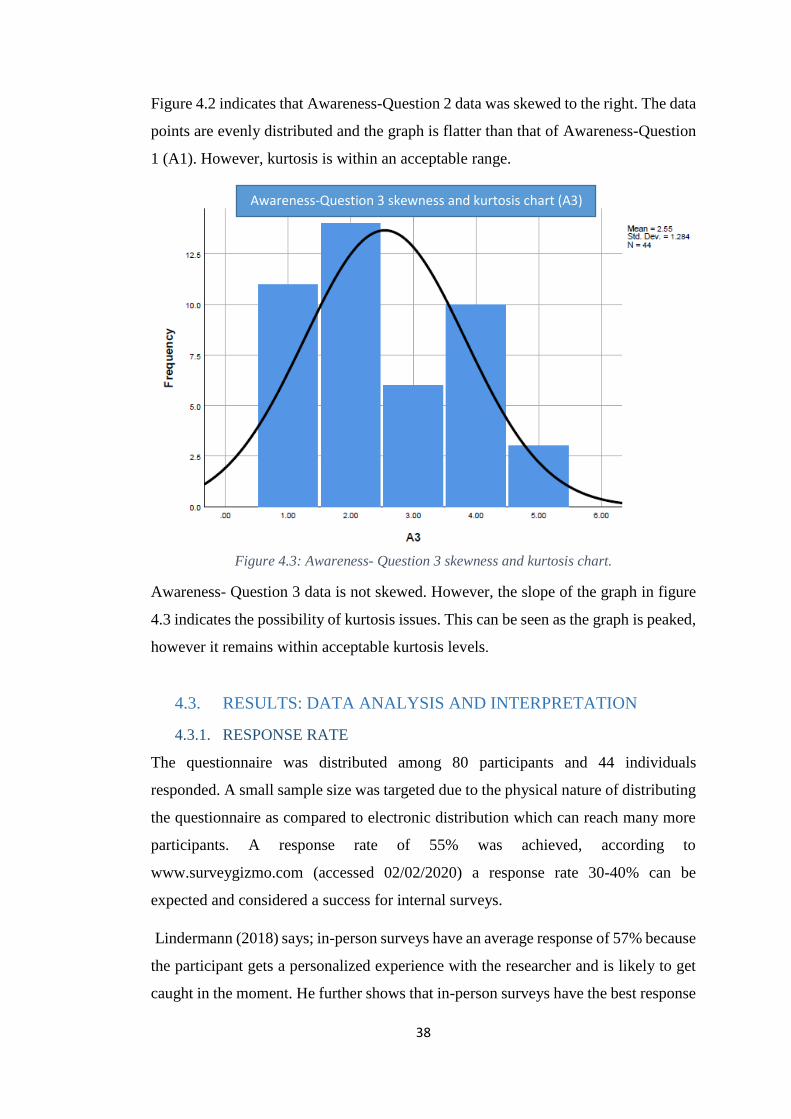
38
Figure 4.2 indicates that Awareness-Question 2 data was skewed to the right. The data
points are evenly distributed and the graph is flatter than that of Awareness-Question
1 (A1). However, kurtosis is within an acceptable range.
Figure 4.3: Awareness- Question 3 skewness and kurtosis chart.
Awareness- Question 3 data is not skewed. However, the slope of the graph in figure
4.3 indicates the possibility of kurtosis issues. This can be seen as the graph is peaked,
however it remains within acceptable kurtosis levels.
4.3. RESULTS: DATA ANALYSIS AND INTERPRETATION
4.3.1. RESPONSE RATE
The questionnaire was distributed among 80 participants and 44 individuals
responded. A small sample size was targeted due to the physical nature of distributing
the questionnaire as compared to electronic distribution which can reach many more
participants. A response rate of 55% was achieved, according to
www.surveygizmo.com (accessed 02/02/2020) a response rate 30-40% can be
expected and considered a success for internal surveys.
Lindermann (2018) says; in-person surveys have an average response of 57% because
the participant gets a personalized experience with the researcher and is likely to get
caught in the moment. He further shows that in-person surveys have the best response
Awareness-Question 3 skewness and kurtosis chart (A3)

39
rate of all survey methods (Lindermann, 2018). Thus, the disadvantage of the inability
to electronically distribute the questionnaire, provided an advantage of achieving
higher response rate since the survey was for internal and in-person.
4.3.2. SECTION A: PARTICIPANTS PROFILE
The 44 participants that responded to the survey represent a diverse group of
employees with different genders, age groups, work experience, pay grades etc. The
survey questions sought to establish the participant’s profile and characteristics, as
shown below:
4.3.2.1. GENDER AND AGE GROUP
Figure 4.5: Age group
representation
Figure 4.4 above indicates that 32 of the participants were male and 12 participants
were female.
It can be seen from figure 4.5 that majority of the participants were young people
between the ages of 20-35 and followed by the older generation of participants
between the ages of 40 and 50 years. Participants over 50 were at 14% and those
between 35 and 40 were at 17%.
36%
17%
33%
14%
AGE GROUPS
20-35
35-40
40-50 years
Over 50
27%
73%
GENDER CHART
Female Male
Figure 4.4: Gender chart

40
4.3.2.2. PAY GROUP
Participants varied in pay grades. Thus five paygrades were highlighted with pay
grades ‘Below G’ being the lowest, followed by G, F, E, then finally above E. The
majority of the participants as seen on figure 4.6 were earning below the G scale,
which is the pay grade mostly associated with general worker. E and F, and G scales
can be considered as managers.
Figure 4.6: Pay grade chart
4.3.2.3. WORK EXPERIENCE
Participants were asked how long they had been working for TE. The responses from
figure 4.7 below show that 57% of the participants had worked for 6 to 8 years. The
longest service employees, (who have worked for Transnet more than eight years)
made up 26% of the participants. 14% were employees who have worked for less
than three years, while those who have worked under a year made up 3% of the
respondents.
Below G65%
G17%
F15%
E3%
PAY GRADE DISTRIBUTION

41
Figure 4.7: Work experience
4.3.2.4. AFFECTED OCCURRENCE
The questionnaire asked if the participants had ever been directly affected by the
acting policy. Figure 4.8 below indicates an even percentage of people who have
been affected more than twice and those who have never been affected. 17% of the
participants said they were affected twice, 14 % affected once and 12% don’t know.
Figure 4.8: Affected occurrence
14%3%
57%
26%
WORK EXPERIENCE
Under 1 year
1-3 years
3-6 years
6-8years
More than 8 years
29%
14%
17%
29%
12%
0% 5% 10% 15% 20% 25% 30%
Never
Once
Twice
More than twice
Don’t know
AFFECTED OCCURRENCE

42
4.3.2.5. IMPRESSION OF THE ACTING POLICY
Participants were asked of their impression of the acting policy, ranging from very
negative to very positive. Figure 4.9 shows that 32% of the participants had a very
negative impression of the acting policy and another 32% were neutral. Those with a
negative impression made up 7%. Participants with a positive impression were 27%
and 2% very positive.
Figure 4.9: Employee impression of the acting policy
4.3.2.6. IMPRESSION OF THE ACTING POLICY AND AFFECTED
OCCURRENCE
Data was mined in order to link employee’s impression of the acting policy and
affected occurrence. Figure 4.10 below shows the relationship between employee’s
impressions of the acting policy in relation to how often employees have been directly
affected by the policy itself.
It can be seen that employees who have never been affected have a positive view,
whilst those who were directly affected once were neutral. Those who were affected
twice, some have a positive view and others a negative view of the policy. However,
for those directly affected more than twice, it was observed the majority had a very
negative view of the policy.
32%
7%
32%
27%
2%
0% 5% 10% 15% 20% 25% 30% 35%
VERY NEGATIVE
NEGATIVE
NEUTRAL
POSITIVE
VERY POSITIVE
IMPRESSION OF ACTING POLICY

43
Figure 4.10: Impression and affected occurrence chart
4.3.3. SECTION B: ACTING POLICY AFFECT ON MOTIVATION AND
PERFORMANCE
Section B of the questionnaire was divided into nine sections, with each having three
questions. Each question was to be answered according to the designed five-point
Likert scale.
4.3.3.1. AWARENESS
This section sought to find out participant’s awareness about the acting policy. It can
be seen from figure 4.11 below, that question 1 and 2 saw the majority of the
employees agreeing they were aware of the rules and regulations of the acting policy
and they had read and understood the document. Question 3, revealed 33% of
respondents disagreed and 24% strongly disagreed that management was doing
enough to educate acting and non-acting employees about the acting policy.
0
1
2
3
4
5
6
Never Once Twice More than twice
AFFECTED OCCURANCE AND PERCEPTIONS
Very Negative Negative Neutral Positive Very positive

44
Figure 4.11: Employee awareness results
4.3.3.2. CAREER PROGRESSION
Participants were asked questions pertaining to career progression in roles and
positions acted on. A total of 50 % of the participants (38% agree and 12% strongly
agree) said the acting policy is essential for career progression, while 21% and 12%
disagreed and strongly disagreed respectively.
33% disagreed and 19% strongly disagreed that one is likely to get appointed in a
position they have acted in, while 21% agreed that one is likely to get appointed in a
position they acted on. The responses to Question 2, indicates that participants tended
to disagree with the statement.
It can be seen from Question 3 in figure 4.12, that majority of the participants (31%
and 36%) agreed and strongly agreed that management uses acting policy to avoid
permanent appointments.
10% 12%24%10%
19%
33%
14%2%
14%57% 60%
21%
10% 7% 7%
0%
20%
40%
60%
80%
100%
120%
1. I am fully aware of the rules andregulations of the acting policy.
2. I have read and understood theacting policy document.
3. Management is doing enough toeducate acting and non-acting
employees?
EMPLOYEE AWARENESS
Strongly Disagree(%) Disagree (%) Neutral (%) Agree (%) Strongly Agree(%)

45
Figure 4.12: Career progression of roles acted in
4.3.3.3. PERFORMANCE
This section was aimed at examining how the acting policy affects the performance of
acting and non-acting employees. Participants were asked if they were motivated to
perform efficiently on acting policy and results are depicted in Figure 4.13 below. Data
obtained from the responses to Question 1 showed that 31% agreed and 24%
disagreed. However, overall a recorded response of 38% of participants disagreed and
agreed respectively that they were motivated to perform efficiently on acting policy.
Figure 4.13 also shows that 40% of the participants say that the acting policy does not
affect their performance. 32% of the participants feel that their level of motivation
affects their performance, while 29% were neutral.
12
%
19
%
10
%
21
%
33
%
12
%
17
%
17
%
12
%
38
%
21
%
31
%
12
%
10
%
36
%
1 . A C T I N G P O L I C Y I S E S S E N T I A L F O R C A R E E R
P R O G R E S S I O N .
2 . O N E I S L I K E L Y T O G E T A P P O I N T E D I N A P O S I T I O N
T H A T T H E Y H A V E A C T E D O N .
3 . M A N A G E M E N T U S E S A C T I N G P O L I C Y T O A V O I D
P E R M A N E N T A P P O I N T M E N T S ?
CAREER PROGRESSION
Strongly Disagree(%) Disagree (%) Neutral (%) Agree (%) Strongly Agree(%)

46
Figure 4.13: Performance results
4.3.3.4. GROWTH
The radar chart below represents how the participants perceived the effect of the acting
policy on their personal and organisational growth. It can clearly be seen the majority
of the participants tended to agree that it has an overall positive effect on growth.
Question 1: 39% of participants agreed the acting positions encourage growth
opportunities.
Question 2: 49% of participants agreed the acting policy allows for recognition of
skills
Question 3: 48% participants agreed the acting policy provides good learning
opportunities through working in senior positions.
5%
10%
14%
17%
5%
24%
29%
36%
24%
32%
40%
31%
17%
10%
7%
0% 10% 20% 30% 40% 50% 60% 70% 80% 90% 100%
Q3: My level of motivation affects my performance.
Q2: My performance is not affected by the acting policy.
Q1: I am motivated to perform more efficiently on theacting position?
PERFORMANCEStrongly Disagree(%) Disagree (%) Neutral (%) Agree (%) Strongly Agree(%)

47
Figure 4.14: Employee’s perceptions of growth
4.3.3.5. ACTING LEADERSHIP
Figure 4.15 below highlights how employees are affected by the acting leadership. It
can be seen from Question 1 there is almost an even spread between those who
disagreed and those who agreed they were satisfied with the acting leadership. 38% of
participants said that acting leaders take responsibility for acting roles and duties.
Responses to Question 3, showed a spread of attitudes, whereby 27% disagreed, 22%
were neutral, 29% agreed and 20% strongly agreed. Only 2% strongly disagreed that
acting leadership affects their level of motivation and performance. However, the
agreed and strongly agreed data made a greater consensus of people who generally
agreed.
0%
10%
20%
30%
40%
50%Strongly Disagree(%)
Disagree (%)
Neutral (%)Agree (%)
Strongly Agree(%)
GROWTH
Q1:Acting positions encourages growth opportunities.
Q2: Acting policy allows for recognition of skills
Q3:Acting policy provides good opportunity to learn through working on higher positions?

48
Figure 4.15: Acting leadership results
4.3.3.6. IMPLEMENTATION
Participants were asked about the implementation of the acting policy in Transnet.
Majority of respondents to Question 1 felt neutral. 33% of the participants said their
views and opinions are not taken into consideration in Question 2. For Question 3,
54% (half of the participants) respectively disagreed and strongly disagreed that
management was really interested in ensuring that acting policy works efficiently and
motivates employees.
Figure 4.16: Implementation results
Q 3 : C H A N G E I N A C T I N G L E A D E R S A F F E C T S M Y L E V E L O F M O T I V A T I O N A N D P E R F O R M A N C E
Q 2 : A C T I N G L E A D E R S T A K E F U L L R E S P O N S I B I L I T Y F O R A C T I N G R O L E A N D D U T I E S ?
Q 1 : I A M S A T I S F I E D W I T H T H E S U P P O R T F R O M A C T I N G L E A D E R S ?
2%
5%
7%
27%
17%
32%
22%
26%
20%
29%
38%
29%
20%
14%
12%
ACTING LEADERSHIP
Strongly Disagree(%) Disagree (%) Neutral (%) Agree (%) Strongly Agree(%)
12
% 14
%
33
%
20
%
33
%
21
%
34
%
26
%
14
%
29
%
21
%
26
%
5%
5%
5%
Q 1 : T H E O R G A N I Z A T I O N E F F E C T I V E L Y A N D F A I R L Y
I M P L E M E N T S T H E A C T I N G P O L I C Y W I T H I N T R A N S N E T E N G I N E E R I N G .
Q 2 : M Y V I E W S A N D O P I N I O N S ( I N T E R M S O F T H E A C T I N G P O L I C Y )
A R E T A K E N I N T O C O N S I D E R A T I O N .
Q 3 : M A N A G E M E N T I S R E A L L Y I N T E R E S T E D I N E N S U R I N G T H A T
A C T I N G P O L I C Y W O R K S E F F I C I E N T L Y A N D M O T I V A T E S
E M P L O Y E E S .
IMPLEMENTATION
Strongly Disagree(%) Disagree (%) Neutral (%) Agree (%) Strongly Agree(%)

49
4.3.3.7. ORGANISATION
Figure 4.17 shows employee’s perceptions of the impact of acting policy on the
organisation. 29% of the participants respectively agreed and strongly agreed that
acting roles negatively affect departmental structure. It can also be seen that 38% of
participants who answered Question 2 agreed they were motivated to achieve
company aims and objectives.
39% agreed while 37% were neutral that current implementation of the acting policy
at Transnet is detrimental to the organisation as a whole.
Figure 4.17: Organisation results
4.3.3.8. COMPENSATION
Participants were asked questions related to the acting policy compensation. It can be
seen from Figure 4.18 below, that 39% of the participants strongly felt that acting
compensation was not fair.
Question 2 sought to examine if the acting employee’s level of compensation affects
employee’s performance. 29% agreed and 19% strongly agreed that their performance
is affected by compensation.
Participants were further asked if acting compensation motivates them to take up an
acting role. Results indicate that 31% of the participants were neutral, while 24%
10
% 12
%
7%
21
%
7%
12
%
12
%
29
%
37
%
29
%
38
%
39
%
29
%
14
%
5%
Q 1 : A C T I N G R O L E S N E G A T I V E L Y A F F E C T S D E P A R T M E N T A L
S T R U C T U R E ?
Q 2 : A C T I N G P O S I T I O N S M O T I V A T E S M E T O A C H I E V E
C O M P A N Y A I M S A N D O B J E C T I V E S .
Q 3 : T H E C U R R E N T I M P L E M E N T A T I O N O F A C T I N G
P O L I C Y I S D E T R I M E N T A L T O T H E O R G A N I Z A T I O N A S A W H O L E .
ORGANISATION
Strongly Disagree(%) Disagree (%) Neutral (%) Agree (%) Strongly Agree(%)

50
disagreed and 21% strongly disagreed to being motivated by acting policy
compensation.
Figure 4.18: Compensation results charts
4.3.3.9. WORK DUTIES
The last section of the questionnaire investigated the work duties or work load
accompanied by the acting policy. Figure 4.19 Question 1, indicates that 36% of the
participants strongly disagreed and 29% disagreed that acting position has a fair work
load for the amount compensated. Under Question 2, it can be seen that an aggregate
of 41% of the participants said that acting position responsibility and recognition does
not motivates them to take up an acting position, while 39% said it does motivate them.
Lastly, participants were asked if acting appointment periods were reasonable. It can
be seen under Question 3 that 31% said periods are reasonable. However, an aggregate
of 45% whereby 26% strongly disagreed and 19% disagreed with the statement.
39
%
7%
21
%
17
% 19
%
24
%
20
%
26
%
31
%
22
%
29
%
21
%
2%
19
%
2%
Q 1 : A C T I N G P O S I T I O N H A S F A I R / R E A S O N A B L E C O M P E N S A T I O N .
Q 2 : T H E L E V E L O F C O M P E N S A T I O N A F F E C T S M Y
P E R F O R M A N C E O N T H E A C T I N G R O L E .
Q 3 : A C T I N G C O M P E N S A T I O N M O T I V A T E S M E T A K E U P A C T I N G
R O L E ?
COMPENSATION
Strongly Disagree(%) Disagree (%) Neutral (%) Agree (%) Strongly Agree(%)

51
Figure 4.19: Work duties results
36%
17%26%
29%
24%19%
10%
21% 17%
24%
29% 31%
2%10% 7%
0%
20%
40%
60%
80%
100%
120%
Q1:Acting position has fair work loadfor the amounted compensated.
Q2:Acting position responsibility andrecognition motivates me to take up
acting position?
Q3. Acting appointment periods arereasonable.
WORK DUTIES
Strongly Disagree(%) Disagree (%) Neutral (%) Agree (%) Strongly Agree(%)

52
5. CHAPTER 5: DISCUSSION
5.1. INTRODUCTION
Chapter Five is aimed at discussing the results that were presented in Chapter Four, in
order to address the research questions and satisfy the objectives of the study. The
discussion and interpretation of the results is guided by the literature reviewed in
Chapter Two. This chapter will highlight noteworthy findings that emerged from the
questionnaire survey and will enable the researcher to obtain vital information about
the effect of the acting policy of employee motivation and performance at Transnet.
In order to ensure consistency, the structure of this chapter is similar to that of Chapter
Four, chronologically discussing the results from each section of the questionnaire.
Finally, the research questions and objectives identified in Chapter Two will be
highlighted and will form the foundation for concluding the research discussion.
5.2. SECTION A: PARTICIPANTS PROFILE DISCUSSION
5.2.1. GENDER AND AGE
The questionnaire survey was aimed at both male and females however, male
participants were significantly higher than females. This can be expected as TE KDS
is a manufacturing environment, which tends to be male dominated. StatsSA (2018)
reported an average of 70% males versus 30% females in manufacturing industries in
South Africa.
The number of individuals between the ages of 20-35 and those between the ages 40-
50 was comparable and obtained as the highest number of responses. The age of the
participants is important because, Inceoglu, Segers& Bartman, (2011) say that
employee’s level of motivation and zeal can be directly linked to their age. Older
employees have less zeal towards meeting organisational goals, while younger
employees are still excited about their growth in the organisation. Also, Helson &
Soto (2005) have identified that as employees become older; positive emotionality
increases while negative emotionality decreases. There are many factors that are
linked to age-related differences in work motivation that have been researched,
however they will not be further explored in this study.

53
5.2.2. PAY GRADE
Findings indicate that 65% of the participants were earning below G pay scale,
meaning majority of participants were general workers, whose duties involve manual
labour. Supervisors and management are above grade G, made up the 35% and their
duties are mostly office based.
5.2.3. WORK EXPERIENCE
57% of the participants had worked between 6 and 8 years and 26% more than 8 years.
A small margin of 3% had worked for Transnet less than 1 year, while 14% had
worked between 1-3 years.
Employees who have been working for longer periods, may be exposed to the culture
and can give a more accurate reflection of what is happening in the organisation.
Newer employees might not have had enough experience with the acting policy, thus
their view may be hypothetical or based on perceptions. The obtained results gave the
researcher confidence that different results that were obtained from the questionnaire
were all from employees who had a significant amount of time in Transnet, and thus
were reflective of employee views and reality.
5.2.4. AFFECTED OCCURANCE
The researcher sought to find participants who could add value to the research through
sharing how often individuals had been directly affected by the acting policy.
Individuals who have been affected by a particular situation more than once, will tend
to have a good understanding of that particular situation. Similar to the age of
participants and work experience.
29% of the participants respectively said they were affected more than twice by, while
the other 29% of individuals have never been affected by the acting policy. 17% of
individuals were affected twice while 14% were affected only once by the acting
policy. The results showed a good distribution of participants, thus ensuring the
sample was well mixed and could yield a representative conclusion to the study.

54
5.2.5. IMPRESSION OF ACTING POLICY
Historical events, whether good or bad can largely affect employee’s perceptions. 32%
of the employees had a very negative impression of the acting policy. Another 32%
remained neutral. 27% of the employees had a positive impression of the acting policy.
Perceptions are important as they allow the researcher to understand employee’s
behaviour. Wilhem (2014) says perceptions can be built from an individual’s
environment through hearing, observing, touching and smelling, followed by the
individual organising and interpreting data to give meaningful information about that
environment.
However, perceptions are subjective too, thus it is important to note that perceptions
could be vastly different from the reality.
5.2.6. IMPRESSION OF THE ACTING POLICY AND AFFECTED
OCCURANCE
The relationship between the employees’ historic experience and perception was also
investigated. It was observed that participants who have never been affected by acting
policy had a very positive view of it, while those who were affected more than twice
have a very negative view.
The 32% of the participants with a negative impression, comprise the majority of the
participants who were affected more than twice. When employees have had
continuous negative experience with the acting policy (or any situation), they can
frame their minds to create a negative view of the acting policy. Those who have never
‘acted’ have a longing to ‘act’ or have not been personally affected, thus have a
positive outlook on the acting policy.
Those who ‘acted’ once or twice, have an equal chance of positive or negative
experience thus perceptions are as per employee’s experience.
These findings are crucial because employees may behave on the basis of their
perceptions, thus researchers can forecast their behaviour in a changed environment,
if their current perceptions are understood (Wilhem, 2014).
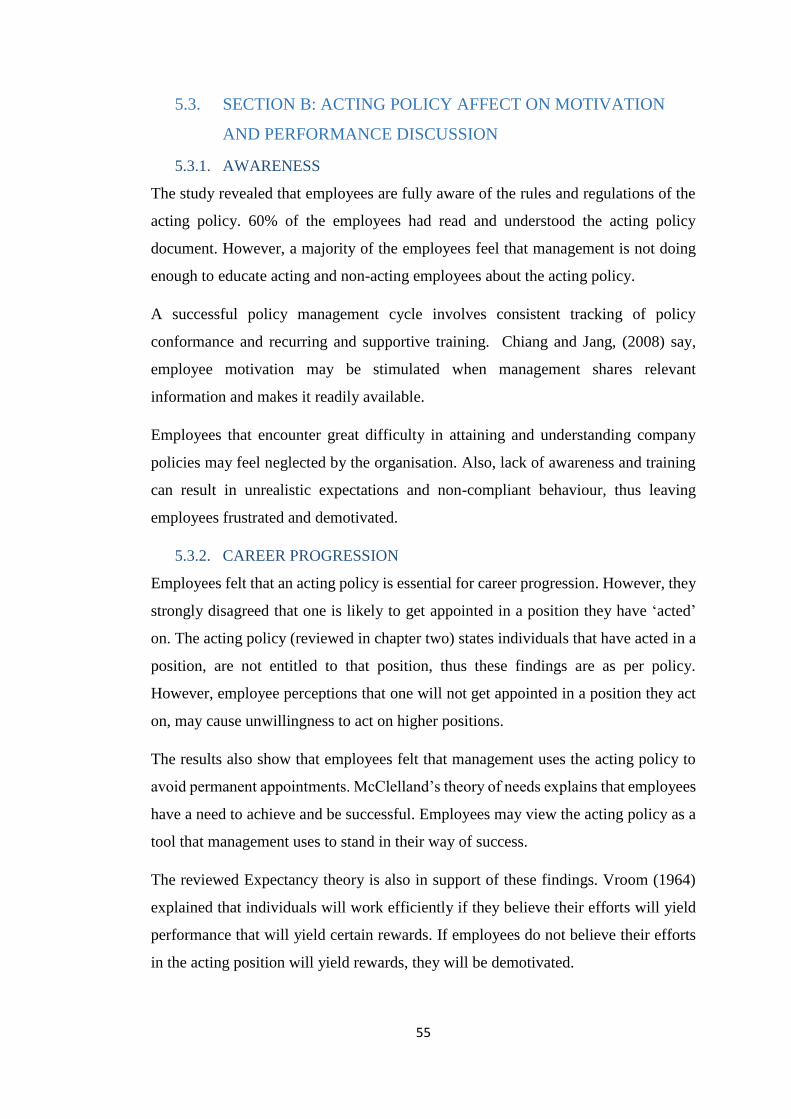
55
5.3. SECTION B: ACTING POLICY AFFECT ON MOTIVATION
AND PERFORMANCE DISCUSSION
5.3.1. AWARENESS
The study revealed that employees are fully aware of the rules and regulations of the
acting policy. 60% of the employees had read and understood the acting policy
document. However, a majority of the employees feel that management is not doing
enough to educate acting and non-acting employees about the acting policy.
A successful policy management cycle involves consistent tracking of policy
conformance and recurring and supportive training. Chiang and Jang, (2008) say,
employee motivation may be stimulated when management shares relevant
information and makes it readily available.
Employees that encounter great difficulty in attaining and understanding company
policies may feel neglected by the organisation. Also, lack of awareness and training
can result in unrealistic expectations and non-compliant behaviour, thus leaving
employees frustrated and demotivated.
5.3.2. CAREER PROGRESSION
Employees felt that an acting policy is essential for career progression. However, they
strongly disagreed that one is likely to get appointed in a position they have ‘acted’
on. The acting policy (reviewed in chapter two) states individuals that have acted in a
position, are not entitled to that position, thus these findings are as per policy.
However, employee perceptions that one will not get appointed in a position they act
on, may cause unwillingness to act on higher positions.
The results also show that employees felt that management uses the acting policy to
avoid permanent appointments. McClelland’s theory of needs explains that employees
have a need to achieve and be successful. Employees may view the acting policy as a
tool that management uses to stand in their way of success.
The reviewed Expectancy theory is also in support of these findings. Vroom (1964)
explained that individuals will work efficiently if they believe their efforts will yield
performance that will yield certain rewards. If employees do not believe their efforts
in the acting position will yield rewards, they will be demotivated.
56
Employees who have acted for longer periods, or more than twice, may even feel
exploited. Exploitation (in this context) can be defined as situation or a perception that
the organisation has purposefully taken advantage of the employee in order to benefit
itself. Employees who perceive they have been exploited feel angry, may sabotage
the company, are less committed to organisational goals, withhold information, don’t
take initiative, perform less efficiently and are demotivated.
5.3.3. PERFORMANCE
The first question in this section was aimed at finding out when employees are in the
acting position, if they perform efficiently? There was an equal split between those
that agreed and disagreed. From the previous questions it was discovered that some
individuals have never been in an acting position, thus the results of this question may
be based on an individual’s personal experience or their perceptions. Those who are
neutral will perform the job to the best of their abilities while those with negative
perceptions might not be efficient. Efficiency is an important factor of performance.
Low efficiency results in poor performance, poor quality of work, and vice versa.
40% of participants said the acting policy does not affect their performance, whether
acting or non-acting. 32% of the participants felt their level of motivation affects their
performance. This supports literature reviewed.
5.3.4. GROWTH
All responses to the three questions about growth were towards agree and strongly
agree. Participants agreed the acting policy is a good tool to promote employee
development and presents good opportunities for employees to increase their
capabilities and competencies. Kabir (2011) states, training and development
opportunities allow employees to be assured of their career advancement and have a
positive attitude towards the organisation.
Employees also agreed that acting policy allows for recognition of skills. Daniels
(1999) states that recognition makes employees feel appreciated and have a positive
attitude towards themselves and their ability to contribute to the organisation.
Recognition thus boosts employee morale and allows employees to extend their
efforts.
48% of participants say an acting policy provides good opportunities to learn through
working in higher positions. According to the literature reviewed, increasing

57
employee’s level of responsibility or enabling them to make managerial decisions,
leads to increased motivation and performance (Lia, 2011).
According to Deci & Ryan (2017), psychological growth and the motivation to
develop occurs in individuals once individuals need for competence, connection and
autonomy are fulfilled. These findings are supported by the Self-Determination
Theory (SDT), because employees of Transnet were found to be directed towards
growth since they believe the acting policy offers them a chance to master their skills
(thus show competence). To this end, employees of Transnet felt recognized thus have
a sense of connection with other employees and also have a sense of autonomy, in the
acting position.
5.3.5. ACTING LEADERSHIP
32% of the employees indicated that acting leadership does not offer support to
employees. Without support from leadership, employees may go astray, feel
demotivated or be much less productive.
Participants agreed that acting leaders take full responsibility and duties of the role, as
per acting policy. Individuals in the acting role may feel the need to prove themselves
in the higher position, may feel their job is meaningful and significant and feel
motivated to perform.
Participants also agreed that changes in leaders affects their level of performance and
motivation. Every leader has their unique leadership style and work process, thus
continuously changing leaders may leave employees demotivated, frustrated and
unsure of their organisational value due to changes in leadership styles.
5.3.6. IMPLEMENTATION
Participants were asked if the organisation was effectively and fairly implementing
the acting policy. The response was 34% of participants were neutral, 32% were
negative and 34% were positive. This is an almost equal spread of opinion among
participants.
Participants indicated their views and opinions about the acting policy were not taken
into consideration by the organisation. When employees feel they have vital
information to share with the organisation and there is no one to listen, such a situation
leads employees to feel frustrated and not valued.
58
33% strongly disagreed, while 21% disagreed that management is interested in
ensuring the policy works efficiently and motivates employees. Employees may feel
frustrated with the organisation if they perceive the organisation not to have their best
interests at heart.
5.3.7. ORGANISATION
Finding from the study indicate that participants agree that acting roles negatively
affects the departmental structure. A departmental structure is able to explain the
hierarchy between management and employees. Employees are able to have a clear
line of authority or supervision. Without a strong departmental structure, employees
don’t have direct supervision and employees may feel lost, lose motivation and
direction. Employee’s performance, in terms of attendance, quality and accountability
will reduce when the organisational structure is not strong.
Individuals indicated that when one is acting, they are motivated to achieve company
goals. This can be associated with meaningful work and task significance, which are
important motivation factors. Employees view the acting position as an important
position with high significance and are motivated to perform and meet company aims
and objectives.
Participants are of the view that the current implementation of the acting policy is
detrimental to the organisation. Thus employees may not desire to be associated with
the acting policy .
5.3.8. COMPENSATION
Participants felt the amount compensated for an acting position is not adequate.
Employees desire a reasonable salary from their employers. Pay/salary/ money is
viewed as a motivational technique which many organisations use to retain and
motivate their employees to attain greater productivity. Employees who feel they are
not fairly compensated may feel angry towards the employer/ organisation and
become demotivated and perform poorly.
The relationship between compensation, motivation and performance highlighted in
Question 1 is further supported by results from Question 2, wherein employees agree
and strongly agree respectively, that the level of compensation directly affects their
performance in the acting role.

59
Since participants indicate that acting compensation is not fair, it is not a surprise that
results from Question 3 indicate that 45% of participants strongly disagree and
disagree that acting compensation motivates them to take up the acting role. Academic
research has shown compensation to be one of the most powerful tools motivators.
However, this might not be the case with the acting policy compensation, due to the
perceived insufficiency of the salary, indicated by participants in Question 1.
5.3.9. WORK DUTIES
The results from the study indicate the acting position has an imbalanced work load
for the amount compensated, with 36% of the participants strongly disagree and 29%
disagree that acting position has fair work load for the amount compensated.
Employees want their efforts to be adequately compensated, otherwise employees may
feel exploited and demotivated. However in 1999, Deci showed that individuals show
a reduced amount of interest and spontaneous engagement in activities for which they
were initially intrinsically motivated after receiving tangible rewards for performing
the activities. This might be the case at Transnet, as employee perceive they should
be compensated more for doing “someone else’s” work, which they could have done
without payment in order to gain experience.
Participants were asked if the acting position responsibility and recognition motivates
them to take up an acting position. There is an almost equal split (41% respectively)
between the total of those who generally agree and those who generally disagree, the
balance being those who are neutral.
The behaviour of these employees is in line with Maslow’s theory. Those that disagree
may rather be encouraged to take up an acting position based on compensation or other
factors, indicating the need to fulfil the lower tier needs of the hierarchy. This is
supported by the findings from the participant’s profile which indicated a high number
of participants who earn a low salary (below G). Maslow’s theory says that once
deficiency needs (physiological, safety, social belonging and esteem needs) have been
satisfied, then individuals will pursue growth needs.
There were employees that agreed they are motivated by responsibility and
recognition. These employees who are in pursuit of esteem needs may include status
and recognition from other employees; then employees seek to achieve self-

60
actualization; which involves reaching one’s full potential. So it can be deduced that
employees seek personal growth within the organisation.
Lastly, the results indicate that participants were unhappy with the acting appointment
periods. Longer acting periods may deny other employees the opportunity to act and
gain experience, while shorter acting periods may not present enough time for
employees to exhibit their skills. Either way, if acting periods are not kept within
reasonable time-frames or as stipulated in the policy, employees may be left feeling
disgruntled.
5.4. WHAT EFFECT DOES INTRINSIC MOTIVATION FACTORS
PRESENTED BY THE ACTING POLICY HAVE ON
EMPLOYEE MOTIVATION AND PERFORMANCE?
The literature review identified recognition, responsibility, skills development, growth
and perception of contributing to overall organisational efficiency, as intrinsic factors
that influence employee motivation and performance. Chintaloo and Mahadeo (2013)
describe intrinsic factors as factors or behaviors that people participate in, that are
affecting employee motivation attached to personal satisfaction.
Employee recognition is a strong motivational tool that enhances job satisfaction and
improves performance. When employees are recognized for certain tasks, they feel
they have made a positive contribution to the organisational achievements.
Recognition was seen to have a positive influence on the motivation and performance
of employees.
The opportunity to learn through working in higher positions in the organisation had
a positive effect on motivation. Working in higher positions means that employees are
able to show a higher degree of skill. These findings are in agreement with Jackson
(2011), who established that tasks which require a higher degree of skills, may
emanate feelings of motivation, in terms of meaningful work for the employee.
Employees may experience a sense of competency through being given the
opportunity to work in a position that requires a higher skill diversity. Such
opportunities help make employees feel relevant, recognized and trusted by the
organisation.

61
Skills development is another intrinsic factor that was highlighted from the
questionnaire. It confirmed the majority of participants in the study are below G level
i.e. general workers. Employees may work to earn a living, to provide for their families
or to satisfy other needs that come with the job. Such an opportunity may bring
feelings of “wanting more from life”, thus the need to feel valued by the organisation
and motivated. The research discovered that growth opportunities positively influence
employee motivation. This is supported by literature as growth opportunities improve
employee knowledge and skills.
5.5. WHAT EFFECT DOES EXTRINSIC MOTIVATION FACTORS
PRESENTED BY THE ACTING POLICY HAVE ON
EMPLOYEE MOTIVATION AND PERFORMANCE?
Findings indicate that organisational information management and effective
dissemination of information, compensation, management efficiency and
implementation of the policy, were extrinsic factors discovered to have a direct effect
on employee motivation and performance. Chintaloo and Mahadeo (2013), described
extrinsic factors as factors that originate outside of the workplace and are outside the
employee’s obligations.
From the questionnaire section B of awareness and implementation, it was confirmed
that organisational information management and effective dissemination of
information were an issue. Participants indicated they find it difficult to access policy
information and feel that management is not doing enough to educate the employees.
According to Chiang and Jang (2008), when employee access organisational
information with ease, they have a sense of belonging in the organisation, thus
increasing their trust and overall contribution to the organisation.
Compensation is an extrinsic factor of motivation. Employees perceive the amount
compensated in an acting position is inadequate .Neilson and Smith (2014), said
organisations should always strive to increase employee compensations as it can
improve performance efficiency and commitment to the organisation. However,
scholars argue that employees are never satisfied with their pay and always urge
employers for higher levels. Regardless, the amounted compensated to employees has
a major impact on their productivity, efficiency and performance. Inadequate
compensation can leave employees demotivated and performing poorly.

62
The researchers of SDT have conducted different studies to show that certain types of
extrinsic factors( rewards, feedback, communication styles) facilitate a means of
undermining intrinsic motivation (Ryan and Deci, 2007). Deci and Ryan (2008) warn
that mangers should not overuse extrinsic rewards as they can undermine intrinsic
motivation, yet too few may leave employees feeling unappreciated, thus finding the
balance is of outmost importance.
5.6. HOW DOES THE INHERENT TRAITS OF THE ACTING
POLICY AFFECT EMPLOYEE MOTIVATION AND
PERFORMANCE AT TRANSNET?
The acting policy has several inherent traits or characteristics. Inherent traits can be
described as characteristic attributes of the current acting policy. No guarantee of
appointment, work load, acting periods and continuous change of leadership are
inherent traits of the acting policy.
Employees indicated dissatisfaction in the lack of permanent appointments for acting
positions. The policy states that no one is entitled to the position they have acted in.
However, may employees perceive the organisation uses this clause in the policy to
exploit them by always having acting employees and rarely converting to a permanent
appointment. The organisation has much to gain since acting employees have no
benefits nor do they receive full pay. The results also indicate that employees strongly
agreed that the lack of permanent positions is detrimental to the organisational
structure, as employees have no stable supervisor or leader.
Participants felt the work load that comes with the acting position was imbalanced. An
acting employee carries the full work load of the position but only gets compensated
a small fraction of the salary. Employees carry two roles in the organisation with a
marginal increase in their salaries. Neilson and Smith (2014), say a reasonable rewards
system increases employee motivation, efficiency and performance.
The time-span of acting periods were also perceived as one-sided. Employees may
feel exploited or denied the opportunity to act by the organisation. Strong control
should be implemented around the acting period. Participants indicate their efficiency
when acting is unaltered by the acting policy. Their performance is normalised, if not
improved since employees appreciate the opportunity and may want to prove
themselves.

63
6. CHAPTER 6: CONCLUSIONS AND
RECOMMENDATIONS
6.1. INTRODUCTION
The conclusions in this chapter are drawn from findings and discussions from the
previous chapters, based on the responses from the research questionnaire.
This chapter will conclude how this study has met the objectives, followed by the
recommendations to Transnet and future researchers.
The main objectives of the research were to;
Establish how intrinsic motivation factors presented by the acting policy
influence employee motivation and performance at Transnet?
Establish how extrinsic motivation factors presented by the acting policy
influence employee motivation and performance at Transnet
Determine how inherent traits of the acting policy affect employee motivation
and performance at Transnet
Recommend strategies to Transnet that can assist with employee motivation
and performance when implementing the acting policy.
6.2. CONCLUSIONS
To address the research objectives, content analysis was conducted in order to obtain
the following outcomes;
6.2.1. CONCLUSIONS ON INSTRINSIC FACTORS PRESENTED BY THE
ACTING POLICY EFFECT ON EMPLOYEE MOTIVATION AND
PERFORMANCE AT TRANSNET.
Intrinsic factors presented by the acting policy were discovered to have a positive
influence on motivation and performance. Employees felt that the acting policy had
positively motivated them through providing employees with opportunities to work
on senior positions with concomitant recognition, growth and training opportunities.
Intrinsic motivation factors are crucial because they go to the very core of the
employee’s feelings, observations and needs from the job. When employees have a

64
positive perception of these factors, employees feel valued by the organisation, feel
motivated and perform tasks, functions and roles efficiently. Intrinsic motivation was
seen as supplementary to enhanced learning, performance and growth.
To this end, intrinsic factors presented by that acting policy are key motivators for
employees.
6.2.2. CONCLUSIONS ON EXTRINSIC MOTIVATION FACTORS
PRESENTED BY THE ACTING POLICY EFFECT ON EMPLOYEE
MOTIVATION AND PERFORMANCE AT TRANSNET.
Extrinsic motivation factors presented by the acting policy were observed to have a
negative influence on employee motivation, performance and efficiency. It was
observed that extrinsic factors such as compensation, management efficiency,
implementation of the policy, organisational information management and ineffective
dissemination of information caused acting and non-acting employees to be
demotivated and perform poorly.
Compensation was identified as the biggest extrinsic factors that cause demotivation
for the success of an acting policy. Pay is one of the biggest extrinsic motivators.
However, in the acting policy it is not structured to exploit its value as a motivator,
thus causes employee demotivation.
Though extrinsic factors played a major role in employee motivation and performance,
results indicated that employees were more concerned about the intrinsic factors.
Participants said they will still adopt an acting position, even when the compensation
and work load is imbalanced, due to the inherent opportunities of growth and
recognition. Intrinsic factors presented by the acting policy seem to overturn the
extrinsic factors.
Extrinsic factors are within the control of the organisational management and as such
can be explored by management in order to improve employee levels of motivation
and performance. The means which the organisational management manages these
extrinsic factors is imperative in boosting employee motivation and performance.

65
6.2.3. CONCLUSIONS ON INHERENT TRAITS OF THE ACTING POLICY
AND ITS EFFECT ON EMPLOYEE MOTIVATION AND
PERFORMANCE AT TRANSNET
The inherent traits of the acting policy such as continuous changes in leadership, no
guarantee of positions, high work load and lengthy acting periods were discovered to
have negative effects on employees’ motivation and performance.
All inherent traits of the acting policy are within the control of management and policy
writers. It is therefore important for management to understand how the policy itself
affects employees, so that it can be amended accordingly. The organisation will thus
benefit positively in making informed decisions and boosting employee performance
and motivation.
6.3. RECOMMENDATIONS
6.3.1. RECOMMENDATIONS FOR INTRINSIC FACTORS THAT
INFLUENCE EMPLOYEE MOTIVATION AND PERFORMANCE
This research confirms that intrinsic factors have a positive influence on motivational
levels. Transnet and other organisations should exploit intrinsic factors as an approach
for developing positive employee motivation. The organisation can include intrinsic
factors such as recognition, encouragement, innovation, and decision making among
others, as a means to positively influence levels of motivation and performance.
6.3.2. RECOMMENDATIONS FOR EXTRINSIC FACTORS THAT
INFLUENCE EMPLOYEE MOTIVATION AND PERFORMANCE
Organisations and Transnet in particular should take note of the significance of
extrinsic factors affecting employee motivation and performance. Extrinsic factors
such as compensation and communication should not be withheld from employees as
these factors have the tendency to leave employees feeling frustrated and demotivated.
Organisations should approach with caution when addressing extrinsic factors as it
may be costly and may not automatically yield increased levels of employee
motivation and performance.
Transnet should acknowledge the direct importance of extrinsic factors in their HR
management practices, to ensure employees are well motivated to perform their tasks.

66
6.3.3. RECOMMENDATIONS TO TRANSNET MANAGEMENT
The research revealed numerous significant implications for Transnet management.
Management should strive to implement the acting policy in a way that positively
affects employee motivation and performance. Growth opportunities, recognition,
listening to employees, are vital for increasing employee motivation and as well as
encouraging trust, communication and employee involvement. Transnet should strive
to involve employees in acting positions without employees feeling exploited or
positions being withheld from them in the future. Thus management should adhere to
the strict acting policy laws and implement with caution.
Awareness campaigns and educational inductions of company policies should be
regularly undertaken, to ensure Transnet can recognise employee suggestions and
coincidentally employees can have opportunities to enquire about uncertainties.
Management should consider revising the acting salary compensation. This research
suggests that if salaries were significantly higher (even half of the position salary), the
employer (Transnet) would be incentivised to appoint rather than have continuous
acting employees. Also employees, would be motivated to carry the acting position
work load.
Transnet management should also realise the implication of the relationship between
employees in acting leadership positions and subordinates. Organisational
management should ensure that acting leaders understand and are aware of their
impact on employee motivation and thus equip acting leaders with the tools and savoir-
faire of building good relationships.
The strategy of increasing employee motivation should form a key role in the
organisation’s long-term and short-term goals and objectives.
6.3.4. RECOMMENDATIONS TO ACADEMIA FOR FUTURE RESEARCH
Little research has been conducted with regards to acting policies or the effect of
temporary vacancies on employee motivation and performance. Future research
should comprise of investigating the impact of acting policy on employee motivation
and performance across a much bigger sample in order to gain a broader
understanding of the concept. To this end, future study (-ies) could be conducted in
both public and private sectors across a range of employees.

67
Researchers can use the current study and literature review to gain an understanding
of the issues experienced by employees due to an acting policy.
6.4. LIMITATIONS OF THE RESEARCH
The scope of the research was limited to Transnet Engineering in
Koedoespoort, in two businesses; RSE and Foundry. The research
excluded other Transnet Engineering depots as well as other Transnet
operational divisions.
The study focused on motivation and performance as the only variables
that can be affected by the acting policy.
All variables are measured according to employee’s perceptions
(qualitative)
The research also excluded senior managers, even if they were directly
affected by the acting policy due to the constraints of the sample.
6.5. FINAL REMARKS
Employee motivation and performance are a very complex concept affected by a
multiplicity of factors. However, it is crucial for organisational management to know
which of these factors affect employees, in order to exert control. Transnet and other
organisations will benefit from gaining an understanding of the motivational factors
arising from the acting policy that directly affects employee motivation and
performance. Policy writers and reviewers as well as the implementers will then be in
a position to make informed decisions about which areas to focus on in order to
increase employee motivation and performance.
Participants indicated that opportunities to act in a senior position and receive
empowerment, job enrichment and recognition that comes with the position and
overall growth is very important and motivational.
Extrinsic factors such as lack of adequate compensation and lack of communication
caused demotivation and poor performance for both acting and non-acting employees.
The inherent traits of the acting policy, such as lack of permanent appointments, high
work load, and continuous change in leadership caused demotivation leading to
employee frustration and poor performance.

68
The intrinsic factors surpassed extrinsic factors and inherent traits of the acting policy
in terms of positive influence of motivation and performance. Transnet should be
mindful of extrinsic and inherent factors as they have a tendency to lead to employee
demotivation and poor performance, while the ultimate goal of any organisation is to
maximise efficiency.
The acting policy is good for staffing purposes, however for managerial purposes, the
acting policy should be tightened. Transnet should consider revising the policy such
that it can be better suited to meet the needs of employees while improving employee
motivation, performance and efficiency.
This research supports the view that a strategy of increasing employee motivation via
intrinsic factors should form part of Transnet’s medium term goals and objectives of
employee progression and growth.

69
7. REFERENCES
Bens, S.G., & Dundis, S.P.(2003). Understanding and motivating health care
employees: integration Maslow’s hierarchy of needs, training and technology.
Journal of nursing management, 11(5), 315-320.
Boachie-Mensah, F.,& Dogbe, O.D.(2011). Performance based pay as a motivational
tool for achieving organisational performance: An exploratory case study.
International Journal of Business and Management, 6 (12) , p270.
Boynton PM, & Greenhalgh T. Selecting, designing, and developing your
questionnaire. BMJ. 2004 May 29;328((7451)):1312–5. [PMC free
article] [PubMed] [Google Scholar]
Brooks. I., (2009) Organisational behaviour. Individuals, Groups and Organisations.
4th Edition. U.K. Prentice Hall.
Cardy, R.L. and Selvarajan T.T. (2004). Assessing ethical behavior. Development of
behaviorally anchored rating scale, Proceeding of Southern Academy
Management Meeting
Cambridge Dictionary, 2017.
Chintaloo, J. & Mahadeo D. (2013) Effect of Motivation on Employees‟ Work
Performance at Ireland Blyth Limited. Proceedings of 8th Annual London
Busin8ess Research Conference Imperial College, London, UK, 8 - 9 July
ISBN: 978-1-922069-28-3
Crawford, I. M. (1990) Marketing Research Centre for Agricultural Marketing
Training in Eastern and Southern Africa. Harare Zimbabwe.
Deci, E. L., and Ryan, R. M. (1985). Intrinsic Motivation and Self-determination in
Human Behavior. New York, NY: Plenum Press
Deci, E. L., Koestner, R., and Ryan, R. M. (1999). A meta-analytic review of
experiments examining the effects of extrinsic rewards on intrinsic motivation.
Psychol. Bull. 125, 627–668. doi: 10.1037/0033-2909.125.6.627

70
Deci, E. L., and Ryan, R. M. (2000). The ‘‘what’’ and ‘‘why’’ of goal pursuits: human
needs and the self-determination of behavior. Psychol. Inquiry 11, 227–268.
doi: 10.1207/S15327965PLI1104_01
Deci, E. L., & Ryan, R. M. (2008). Self-determination theory: A macrotheory of
human motivation, development, and health. Canadian
Psychology/Psychologie canadienne, 49(3), 182–
185. https://doi.org/10.1037/a0012801
Dolores, MA C. Tongco, C(2007). Department of Botany, University of Hawai`i at
Manoa, 3190 Maile Way, Honolulu, HI, 96822 U.S.A. and Institute of
Biology, University of the Philippines, Diliman, Quezon City, 1101,
PHILIPPINES [email protected]
Export.gov. Site: https://www.export.gov/article?id=South-Africa-rail-infrastructure
Accessed: 07/03/2019.
George, D., & Mallery, M. (2010). SPSS for Windows Step by Step: A Simple Guide
and Reference, 17.0 update (10a ed.) Boston: Pearson.
Helson, R., & Soto, C. J. (2005). Up and down in middle age: Monotonic and
nonmonotonic changes in roles, status, and personality. Journal of Personality
and Social Psychology, 89, 194-204.
Herzberg,F. (1965).The motivation to work among Finnish supervisors. Personnel
Psychology, 18 (4), 393-402.
Inceoglu.,I.Segers,J.&,Bartram,D.,(2011) Age‐related differences in work motivation.
Lai, H-H (2011), 'The influence of compensation system design on employee
satisfaction', African Journal of Business Management, vol 5, no. 26, pp. 1078-
10723.
Laerd Statistics. https://statistics.laerd.com/spss-tutorials/cronbachs-alpha-using-
spss-statistics.php [Accessed on 18/06/2019]
Latham, M. (1994). Constructing the Team, Joint Review of Procurement and
Contractual Arrangements in the United Kingdom Construction Industry:
Final Report. London: HMSO.

71
Leedy, P.D.,& Ormrod, J.E. (2010).Planning and design. New York, NY: Pearson.
Likert, R. (1961). New Patterns of Management. New York, NY: McGraw-Hill.
Lindermann,N. 2018. https://surveyanyplace.com/average-survey-response-rate/
Lunenburg, F.C (2011) INTERNATIONAL JOURNAL OF MANAGEMENT,
BUSINESS.
Luthans, F. (1998). Organisational Behavior. 8th ed. Boston: Irwin McGraw-Hill.
Maslow, A.H. ( 1964). A theory of human motivation. Psychological review, 50 (4),
370.
Maslow, A.H. (2000).The Maslow Business Reader (D.C Stephens ed.), New York,
John Wiley & Sons.
McLeod, J. (2011).Qualitative research in counselling and psychotherapy (2nd
ed.)London: Sage Publications.
McNamara, C. (2005). Human Resource Management and Talent Management.
Authenticity Consulting LLC
Merriam S. (1995).What can you tell from an N of 1? Issues
of validity and reliability in qualitative research. PAACE J Lifelong Learn.
4:51–60.
Mullins, A. K. (1999). Management and Organisational behaviour. Prentice Hall: New
York.
Mullins, L. J & Christy, G. (2011) Essentials of Organisational Behaviour. U.K.
Prentice Hall.(pg. 450)
Nasri,W.,& Charfeddine,L. (2012). Motivating salespeople to contribute to marketing
intelligence activities: An expectancy theory approach. International Journal
of Marketing Studies, 4(1),p168.
Ran, B. (2009). Motivation. In C. Wankel (Ed.), Encyclopedia of business in today‟s
Research in Personality, 42(4), 1109-1115.
72
Ryan, R. M., & Deci, E. L. (2000). Self-determination theory and the facilitation of
intrinsic motivation, social development, and well-being. Am. Psychol. 55,
68–78. doi: 10.1037/0003-066x.55.1.68
Ryan, R. M., & Deci, E. L. (2007). Active human nature: Self-determination theory
and the promotion and maintenance of sport, exercise, and health. In M. S.
Hagger & N. L. D. Chatzisarantis (Eds.), Intrinsic motivation and self-
determination in exercise and sport (pp. 1-19). Champaign, IL: Human
Kinetics
Ryan, R. M., & Deci, E. L. (2012). ‘‘Multiple identities within a single self: a self-
determination theory perspective on internalization within contexts and
cultures,’’ in Handbook of Self and Identity, 2nd Edn. eds M. R. Leary and J.
P. Tangney (New York: Guilford Press), 225–246.
Ryan, R. M., & Di Domenico, S. I. (2016). ‘‘Distinct motivations and their
differentiated mechanisms: reflections on the emerging neuroscience of human
motivation,’’ in Advances in Motivation and Achievement: Recent
Developments in Neuroscience Research on Human Motivation, eds S. Kim,
J. Reeve and M. Bong (Bingley: Emerald Group Publishing), 349–369.
Ryan, R. M., & Deci, E. L. (2017). Self-determination theory: Basic psychological
needs in motivation, development, and wellness. Guilford Press.
Robbins,S.,& Judge,T. (Eds.).(2013) Organisational behavior (5th ed.).England:
Pearson.
Robbins,S.P.,Judge, T.A, Odendaal,A., & Roodt G. (2014) Organisational Behaviour
2nd Edition. S.A. Pearson.pg (195).
Royle, M.T., & Hall, A.T. (2012). The relationship between McClelland’s theory of
needs, feeling individually accountable, and informal accountability of others.
Internal Journal of Management and Marketing Research,5 (1),21-42.
Shumen, J. (2009). Is Organisational Culture Similar with HRM. Nigeria: Northern
Press
Tabachnick,B.G, & Fidell,L.S, (2013). Using Multivariate Statistics, 6th Edition.
California State University – Northridge.Pearson.

73
Taylor-Bianco, A., & Schermerhorn,J. Jr.(2006). Self-Regulation, Strategic
Leadership and Paradox in Organisational Change. Journal of Organisational
Change Management. Vol.19, Iss.4, pp.457-470.
Transnet.net Site: https://www.transnet.net/Divisions/Pages/RailEng.aspx Accessed:
26/02/2019.
SAQA,(2005). Acting allowance Policy. Site:
http://www.saqa.org.za/docs/pol/2014/PNF%2007%20Acting%20Allowance
.pdf date accessed: 05/03/2019
StatsSa (2018) http://www.statssa.gov.za/publications/Report-03-10-05/Report-03-
10-052011.pdf.
Vroom, V. H. (1964). Work and motivation. Wiley: New York.
Wilhem,J. (2014).Research Gate. Justus-Lieb-ig-Universität Gießen |
JLU · Deutsches Zentrum für Lungenforschung (DZL).
Winter G. A (2000) comparative discussion of the notion of validity in qualitative and
quantitative research. The Qualitative Report.
Winkler,E.,Busch,C.,Clasen,J.,& Vowinkel,J. (2014).Leadership behavior as a health
promoting resource for workers in low skilled jobs and the moderating role of
power distance orientation. Zeitschrift Fuur Personalforschung, 28(1/2), 96-
116.
Whittaker, C. (2008). Hotel operator motives in UK sale and leaseback/management-
back transactions. International Journal of Hospitality Management, 27 (4):
641-648.
Yaseen. A. (2013) Effect of compensation factors on employee satisfaction:
International Journal of Human Resource Stusies. ISSN 2162-3058 2013, Vol.
3, No.1 http://www.fao.org/3/w3241e/w3241e05.htm (accessed 13/06/2019).

74
8. APPENDICES
APPENDIX A: PARTICIPATION INFORMATION SHEET
27/08/2019
Dear Participant
Participation in Research in Msc Engineering Management
I am a part-time MSc student in the School of Mechanical, Industrial and Aeronautical
Engineering at the University of the Witwatersrand, under the supervision and direction of
Mrs. Lorraine Doherty. My MSc dissertation is titled “The impact of the acting policy on
employee motivation and performance in Transnet”.
I would like to formally invite you to participate in this study. As an employee of the well-
established Transnet logistics and manufacturing company in South Africa, your knowledge
and experience would contribute significantly.
Your involvement in the study would entail completing a questionnaire, which seeks to
understand your view and the impact of the acting policy. The survey will last only 10-15
minutes and will only be arranged at a time convenient for you, such as tea or lunch break.
Participation in the study is voluntary, and you may withdraw at any time. Anonymity
(regarding company name and any owner/manager/employee names) and confidentiality of
information provided will be assured and respected.
All the information gathered from the survey will form part of my MSc dissertation report,
and may only be used for academic purposes. A summary of the results of the research will
be made available to you on request.
Please contact me if you have any questions regarding the research and participation in the
study.
Yours faithfully ………………………………… University of the Witwatersrand
Private Bag 3, WITS 2050, South Africa
Student Tel: 012 842 6211 Email:[email protected]
Supervisor Cell: 082 897 8213 Email: [email protected]
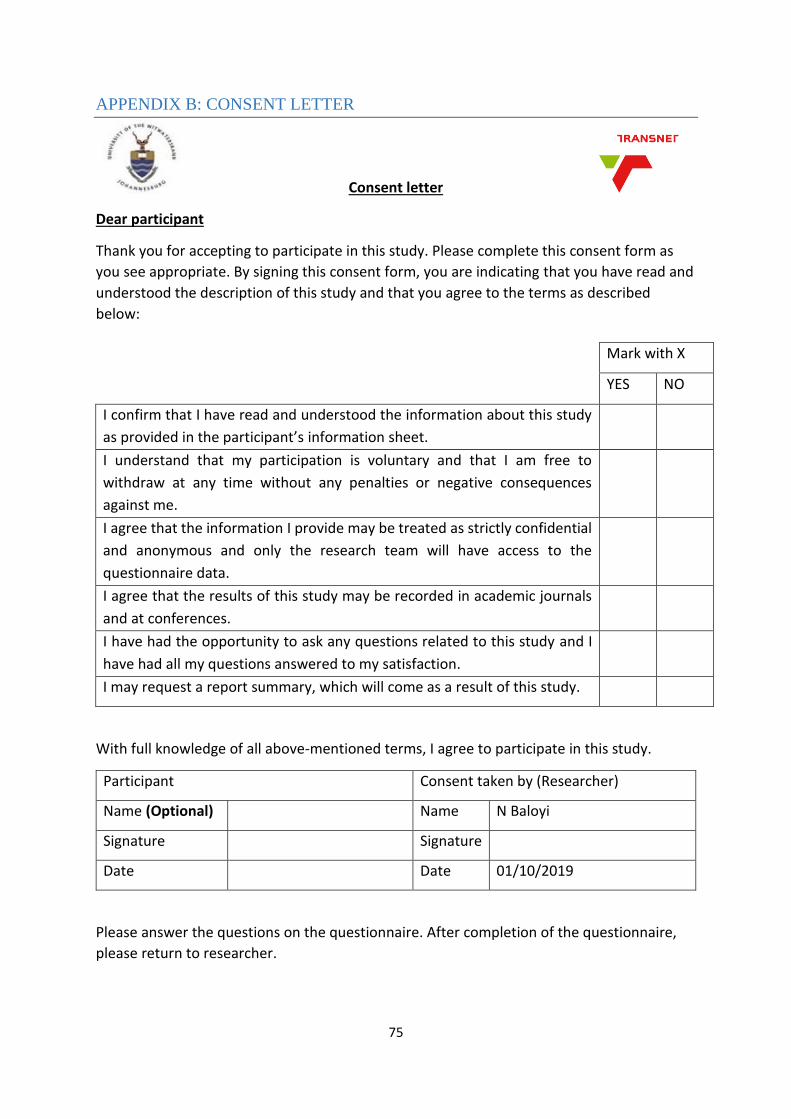
75
APPENDIX B: CONSENT LETTER
Consent letter
Dear participant
Thank you for accepting to participate in this study. Please complete this consent form as
you see appropriate. By signing this consent form, you are indicating that you have read and
understood the description of this study and that you agree to the terms as described
below:
With full knowledge of all above-mentioned terms, I agree to participate in this study.
Participant Consent taken by (Researcher)
Name (Optional) Name N Baloyi
Signature Signature
Date Date 01/10/2019
Please answer the questions on the questionnaire. After completion of the questionnaire,
please return to researcher.
Mark with X
YES NO
I confirm that I have read and understood the information about this study
as provided in the participant’s information sheet.
I understand that my participation is voluntary and that I am free to
withdraw at any time without any penalties or negative consequences
against me.
I agree that the information I provide may be treated as strictly confidential
and anonymous and only the research team will have access to the
questionnaire data.
I agree that the results of this study may be recorded in academic journals
and at conferences.
I have had the opportunity to ask any questions related to this study and I
have had all my questions answered to my satisfaction.
I may request a report summary, which will come as a result of this study.

76
APPENDIX C: PERMISSION TO CONDUCT RESEARCH

77

78

79
APPENDIX D: ETHICAL CLEARANCE
Dear Nhluvuko,
I am pleased to inform you that the School Ethics Committee has completed assessing your
ethics application for your MSc 50/50 research and clearance has been provided.
The ethics clearance number for your research report is MIAEC 242/19
Please use your ethics clearance number as a reference for all future correspondence on
this matter.
By copy of this email, your supervisor is also informed.
Regards,
Dr. Emwanu

80
APPENDIX E: SURVEY QUESTIONNAIRE
Survey: The impact of the acting policy on employee motivation and performance in Transnet.
Mark appropriate answer with an “x”
SECTION A 1 2 3 4 5
Employee profile
What is your gender?
Female Male
What is your age group?
Younger than
20
20-35
years
35-40
years
40-50
years
Over 50
years
What is your pay grade? Below G G F E Above E
How long have you been working for TE?
Under 1 year 1-3 years 3-6 years 6-8years More than
8 years
Acting policy
Have you been directly affected by the acting policy?
Never Once Twice More than
twice
Don’t
know
What is your impression of the acting policy? Very Negative Negative Neutral Positive Very
Positive
SECTION B 1 2 3 4 5
Strongly
Disagree
Disagree Neutral Agree Strongly
Agree
Awareness
1. I am fully aware of the rules and regulations of the acting
policy.
2. I have read and understood the acting policy document.

81
3. Management is doing enough to educate acting and non-
acting employees about the acting policy.
Career progression
1. Acting policy is essential for career progression.
2. One is likely to get appointed in a position that they have
acted on.
3. Management uses acting policy to avoid permanent
appointments.
Performance
1. I am motivated to perform more efficiently on the acting
position?
2. My performance is not affected by the acting policy.
3. My level of motivation affects my performance.
Growth
1. Acting positions encourages growth opportunities.
2. Acting policy allows for recognition of skills
3. Acting policy provides good opportunity to learn through
working on higher positions.
Acting Leadership
1. I am satisfied with the support from acting leaders.
2. Acting leaders take full responsibility for acting role and
duties.
3. Change in acting leaders affects my level of motivation and
performance
Implementation
1. The organisation effectively and fairly implements the acting
policy within Transnet Engineering.
2. My views and opinions (in terms of the acting policy) are
taken into consideration.
3. Management is really interested in ensuring that acting policy
works efficiently and motivates employees.
Organisation
1. Acting roles negatively affects departmental structure.
2. Acting positions motivates me to achieve company aims and
objectives.
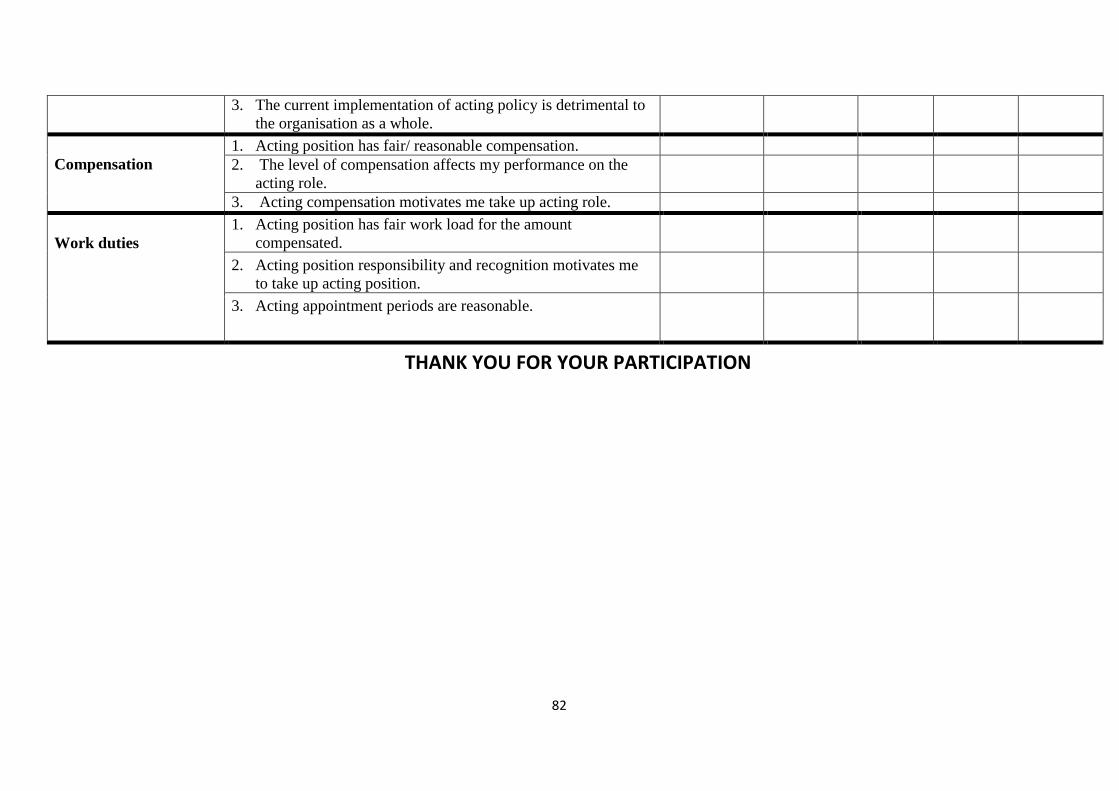
82
3. The current implementation of acting policy is detrimental to
the organisation as a whole.
Compensation
1. Acting position has fair/ reasonable compensation.
2. The level of compensation affects my performance on the
acting role.
3. Acting compensation motivates me take up acting role.
Work duties
1. Acting position has fair work load for the amount
compensated.
2. Acting position responsibility and recognition motivates me
to take up acting position.
3. Acting appointment periods are reasonable.
THANK YOU FOR YOUR PARTICIPATION

83
APPENDIX F: QUESTIONNAIRE RESPONSES
Table F1: Tabulated questionnaire responses
respondent Q1 Q2 Q3 Q1 Q2 Q3 Q1 Q2 Q3 Q1 Q2 Q3 Q1 Q2 Q3 Q1 Q2 Q3 Q1 Q2 Q3 Q1 Q2 Q3 Q1 Q2 Q3
1 Agree Agree Strongly Disagree Neutral Disagree Strongly Disagree Disagree Agree Neutral Neutral Disagree Neutral Disagree Neutral Agree Neutral Neutral Strongly Disagree Agree Agree Neutral Disagree Neutral Disagree Disagree Disagree Disagree
2 Disagree Strongly DisagreeStrongly Disagree Disagree Agree Strongly Agree Strongly DisagreeDisagree Disagree Strongly DisagreeNeutral Neutral Disagree Disagree Strongly AgreeDisagree Disagree Disagree Agree Neutral Strongly DisagreeStrongly AgreeStrongly DisagreeStrongly DisagreeStrongly DisagreeNeutral
3 Agree Agree Strongly Disagree Neutral Disagree Strongly Disagree Disagree Agree Neutral Neutral Disagree Neutral Disagree Neutral Agree Neutral Neutral Strongly Disagree Agree Agree Neutral Strongly DisagreeDisagree Strongly DisagreeStrongly DisagreeStrongly DisagreeStrongly Disagree
4 Strongly AgreeStrongly AgreeDisagree Strongly AgreeStrongly AgreeStrongly Agree Strongly AgreeStrongly AgreeStrongly AgreeStrongly Agree Strongly AgreeStrongly AgreeStrongly AgreeStrongly DisagreeStrongly AgreeStrongly AgreeStrongly Agree Strongly DisagreeStrongly AgreeStrongly AgreeStrongly AgreeStrongly AgreeStrongly AgreeStrongly AgreeStrongly AgreeStrongly Agree
5 Agree Agree Neutral Neutral Disagree Agree Neutral Neutral Neutral Neutral Neutral Neutral Disagree Disagree Agree Neutral Disagree Neutral Neutral Neutral Neutral Disagree Agree Disagree Disagree Neutral Agree
6 Agree Agree Disagree Disagree Disagree Neutral Neutral Agree Neutral Disagree Strongly DisagreeAgree Disagree Agree Agree Agree Neutral Disagree Neutral Agree Agree Strongly DisagreeNeutral Agree Strongly DisagreeAgree Agree
7 Agree Agree Strongly Disagree Agree Strongly DisagreeStrongly Agree Disagree Neutral Disagree Neutral Strongly DisagreeNeutral Disagree Agree Strongly AgreeNeutral Disagree Disagree Strongly DisagreeNeutral Neutral Stronlgy DisagreeNeutral Disagree Disagree Disagree Disagree
8 Agree Agree Neutral Neutral Disagree Agree Disagree Agree Disagree Agree Neutral Agree Neutral Neutral Disagree Neutral Neutral Neutral Agree Neutral Neutral Neutral Disagree Neutral Agree Neutral Neutral
9 Neutral Disagree Neutral Neutral Neutral Neutral Agree Agree Neutral Neutral Neutral Agree Agree Agree Neutral Neutral Neutral Neutral Disagree Agree Disagree Neutral Neutral Neutral Neutral Neutral Neutral
10 Agree Agree Agree Agree Strongly AgreeNeutral Agree Agree Disagree Strongly AgreeStrongly AgreeStrongly AgreeAgree Agree Disagree Agree Agree Agree Disagree Agree Disagree Agree Agree Agree Agree Agree Agree
11 Agree Disagree Strongly Disagree Strongly AgreeStrongly DisagreeStrongly Disagree Disagree Strongly AgreeStrongly DisagreeAgree Agree Strongly AgreeDisagree Agree Disagree Disagree Disagree Strongly Disagree Strongly AgreeStrongly AgreeAgree Strongly DisagreeStrongly DisagreeStrongly DisagreeStrongly DisagreeStrongly DisagreeAgree
12 Agree Agree Strongly Agree Strongly AgreeAgree Neutral Strongly AgreeStrongly AgreeStrongly AgreeStrongly AgreeStrongly AgreeStrongly AgreeStrongly AgreeStrongly AgreeStrongly AgreeStrongly AgreeStrongly AgreeStrongly Agree Strongly AgreeStrongly AgreeStrongly AgreeNeutral Neutral Neutral Neutral Strongly AgreeNeutral
13 Neutral Disagree Disagree Neutral Neutral Strongly Agree Neutral Neutral Neutral Disagree Agree Agree Neutral Neutral Disagree Strongly DisagreeNeutral Strongly Disagree Strongly AgreeStrongly DisagreeNeutral Strongly DisagreeNeutral Strongly DisagreeStrongly DisagreeDisagree Strongly Disagree
14 Agree Agree Disagree Agree Neutral Strongly Agree Disagree Neutral Agree Neutral Agree Agree Disagree Disagree Neutral Strongly DisagreeDisagree Strongly Disagree Agree Neutral Agree Neutral Neutral Neutral Strongly DisagreeDisagree Disagree
15 Agree Agree Disagree Disagree Disagree Agree Disagree Disagree Disagree Disagree Neutral Disagree Disagree Agree Disagree Disagree Disagree Disagree Disagree Neutral Disagree Disagree Disagree Disagree Disagree Agree
16 Neutral Strongly DisagreeStrongly Agree Disagree Strongly DisagreeStrongly Agree Neutral Strongly DisagreeAgree Strongly DisagreeStrongly DisagreeAgree Strongly DisagreeStrongly AgreeDisagree Disagree Strongly DisagreeAgree Strongly AgreeStrongly AgreeNeutral Strongly DisagreeStrongly AgreeStrongly DisagreeStrongly DisagreeStrongly AgreeNeutral
17 Disagree Disagree Disagree Strongly AgreeNeutral Neutral Neutral Neutral Agree Agree Agree Strongly AgreeNeutral Neutral Neutral Disagree Disagree Agree Agree Agree Disagree Agree Disagree Disagree Neutral Disagree
18 Agree Disagree Disagree Agree Agree Agree Agree Agree Disagree Agree Agree Agree Agree Agree Disagree Agree Agree Disagree Agree Agree Agree Agree Disagree Agree Agree Agree Agree
19 Strongly DisagreeStrongly DisagreeStrongly Disagree Strongly DisagreeDisagree Strongly Agree Strongly DisagreeAgree Strongly AgreeStrongly DisagreeStrongly DisagreeStrongly DisagreeStrongly DisagreeStrongly DisagreeStrongly AgreeStrongly DisagreeStrongly DisagreeStrongly Disagree Strongly DisagreeStrongly DisagreeStrongly DisagreeStrongly DisagreeStrongly DisagreeStrongly DisagreeStrongly DisagreeStrongly DisagreeStrongly Disagree
Organisation Compensation Work dutiesAwareness Career progression Performance Growth Acting leadership Implementation

84
20 Agree Agree Disagree Agree Agree Agree Agree Agree Agree Agree Agree Strongly AgreeAgree Neutral Agree Agree Neutral Agree Agree Agree Agree Agree Agree Agree Neutral Strongly AgreeStrongly Agree
21 Strongly DisagreeStrongly DisagreeStrongly Disagree Agree disagree Strongly Agree Disagree Agree Agree Agree Agree Agree Agree Neutral Disagree Strongly DisagreeStrongly DisagreeStrongly Disagree Disagree Neutral Strongly DisagreeAgree Disagree Agree Disagree Disagree Disagree
22 Disagree Strongly DisagreeNeutral Strongly DisagreeAgree Agree Neutral Neutral Disagree Strongly AgreeAgree Agree Agree Agree Disagree Agree Neutral Agree Disagree Agree Neutral Strongly DisagreeNeutral Neutral Strongly DisagreeAgree Agree
23 Strongly AgreeAgree Disagree Disagree Neutral Disagree Strongly DisagreeAgree Strongly AgreeNeutral Agree Agree Strongly AgreeStrongly AgreeAgree Agree Neutral Strongly Disagree Disagree Neutral Disagree Strongly DisagreeAgree Neutral Disagree Neutral Agree
24 Strongly AgreeStrongly AgreeStrongly Agree Strongly AgreeStrongly AgreeAgree Agree Neutral Agree Agree Agree Strongly Agree Agree Neutral Neutral Disagree Strongly Disagree Agree Agree Agree Agree Agree Neutral Agree Agree Strongly Disagree
25 Strongly DisagreeAgree Strongly Disagree Strongly DisagreeStrongly DisagreeStrongly Agree Strongly DisagreeStrongly DisagreeStrongly AgreeStrongly AgreeStrongly AgreeNeutral Neutral Neutral Neutral Neutral Strongly DisagreeStrongly Disagree Strongly AgreeStrongly AgreeNeutral Strongly DisagreeStrongly AgreeStrongly DisagreeStrongly DisagreeStrongly DisagreeStrongly Agree
26 Agree Agree Agree Agree Neutral Agree Agree Neutral Neutral Agree Agree Agree Agree Agree Strongly AgreeAgree Agree Agree Strongly AgreeAgree Agree Agree Agree Agree Agree Agree Agree
27 Agree Agree Neutral Neutral Disagree Strongly Agree Neutral Neutral Neutral Neutral Neutral Neutral Neutral Disagree Neutral Neutral Disagree Disagree Neutral Neutral Neutral Disagree Strongly AgreeDisagree Disagree Disagree Disagree
28 Agree Disagree Agree Agree Agree Disagree Strongly AgreeNeutral Strongly AgreeAgree Neutral Agree Agree Agree Disagree Disagree Agree Agree Disagree Agree Disagree Strongly DisagreeStrongly DisagreeStrongly DisagreeDisagree Agree Strongly Disagree
29 Agree Neutral Agree Agree Agree Disagree Agree Agree Neutral Agree Agree Agree Neutral Agree Neutral Neutral Agree Agree Strongly AgreeAgree Neutral Neutral Neutral Agree Agree Agree Neutral
30 Neutral Agree Disagree Disagree Strongly DisagreeStrongly Agree Disagree Neutral Agree Agree Agree Strongly AgreeStrongly AgreeStrongly AgreeAgree Neutral Disagree Strongly Disagree Agree Agree Agree Neutral Agree Disagree Agree Agree Strongly Disagree
31 Agree Agree Agree Agree Agree Disagree Agree Neutral Strongly DisagreeStrongly DisagreeStrongly DisagreeStrongly DisagreeStrongly DisagreeNeutral Agree Agree Neutral Neutral Neutral Strongly DisagreeNeutral Neutral Strongly AgreeNeutral Strongly DisagreeNeutral Neutral
32 Strongly DisagreeAgree Strongly Disagree Strongly DisagreeStrongly DisagreeStrongly Disagree Strongly DisagreeStrongly DisagreeAgree Strongly DisagreeStrongly DisagreeAgree Agree Agree Agree Strongly DisagreeStrongly Disagree Strongly AgreeStrongly AgreeNeutral Strongly DisagreeStrongly AgreeDisagree Strongly DisagreeStrongly DisagreeAgree
33 Agree Agree Disagree Agree Agree Agree Agree Agree Disagree Agree Agree Agree Agree Agree Strongly AgreeAgree Agree Agree Agree Agree Agree Agree Agree Agree Agree Agree Agree
34 Strongly AgreeAgree Agree Disagree Disagree Strongly Agree Agree Strongly AgreeAgree Agree Agree Agree Disagree Strongly AgreeAgree Strongly DisagreeAgree Agree Strongly AgreeAgree Agree Disagree Agree Neutral Disagree Agree Strongly Disagree
35 Agree Strongly AgreeAgree Disagree Neutral Agree Agree Agree Agree Agree Agree Agree Agree Disagree Strongly AgreeAgree Agree Neutral Strongly AgreeNeutral Agree Neutral Neutral Neutral Neutral Neutral Strongly Disagree
36 Agree Agree Agree Agree Strongly DisagreeStrongly Agree Strongly DisagreeNeutral Neutral Neutral Neutral Neutral Neutral Neutral Neutral Neutral Strongly DisagreeStrongly Disagree Strongly AgreeStrongly DisagreeAgree Strongly DisagreeAgree Strongly DisagreeStrongly DisagreeStrongly DisagreeStrongly Disagree
37 Neutral Agree Disagree Strongly DisagreeDisagree Agree Neutral Strongly DisagreeNeutral Neutral Agree Agree Neutral Neutral Agree Disagree Disagree Neutral Agree Neutral Agree Disagree Agree Neutral Disagree Neutral Strongly Disagree
38 Agree Agree Disagree Agree Strongly AgreeStrongly Agree Disagree Agree Strongly AgreeAgree Agree Agree Disagree Strongly DisagreeStrongly AgreeDisagree Disagree Disagree Strongly AgreeDisagree Agree Strongly DisagreeStrongly AgreeAgree Strongly DisagreeDisagree Strongly Disagree
39 Neutral Disagree Disagree Agree Disagree Agree Neutral Neutral Neutral Agree Agree Strongly AgreeStrongly AgreeAgree Neutral Neutral Neutral Agree Disagree Neutral Neutral Agree Disagree Neutral Agree Neutral Agree
40 Agree Agree Agree Disagree Disagree Disagree Agree Agree Agree Strongly AgreeStrongly AgreeStrongly AgreeAgree Agree Disagree Agree Agree Agree Disagree Disagree Disagree Agree Disagree Disagree Agree Agree Agree
41 Disagree Disagree Strongly Disagree Agree Disagree Agree Agree Agree Agree Strongly AgreeStrongly AgreeStrongly AgreeDisagree Agree Agree Neutral Disagree Strongly Disagree Strongly DisagreeStrongly DisagreeStrongly DisagreeStrongly DisagreeNeutral Neutral Strongly DisagreeDisagree Disagree
42 Agree Agree Neutral Agree Strongly DisagreeStrongly Agree Neutral Neutral Agree Disagree Agree Agree Disagree Disagree Disagree Disagree Disagree Disagree Neutral Neutral Agree Strongly DisagreeDisagree Disagree Disagree Disagree Disagree
43 Disagree Disagree Strongly Disagree Agree Disagree Agree Agree Agree Agree Strongly AgreeStrongly AgreeStrongly AgreeDisagree Agree Agree Neutral Disagree Strongly Disagree Neutral Disagree Neutral Disagree Strongly DisagreeStrongly DisagreeStrongly DisagreeStrongly DisagreeStrongly Disagree
44 Agree Agree Neutral Agree Strongly DisagreeStrongly Agree Neutral Neutral Agree Disagree Agree Agree Disagree Disagree Disagree Disagree Disagree Disagree Disagree Disagree Disagree Disagree Disagree Neutral Neutral Agree Strongly Disagree
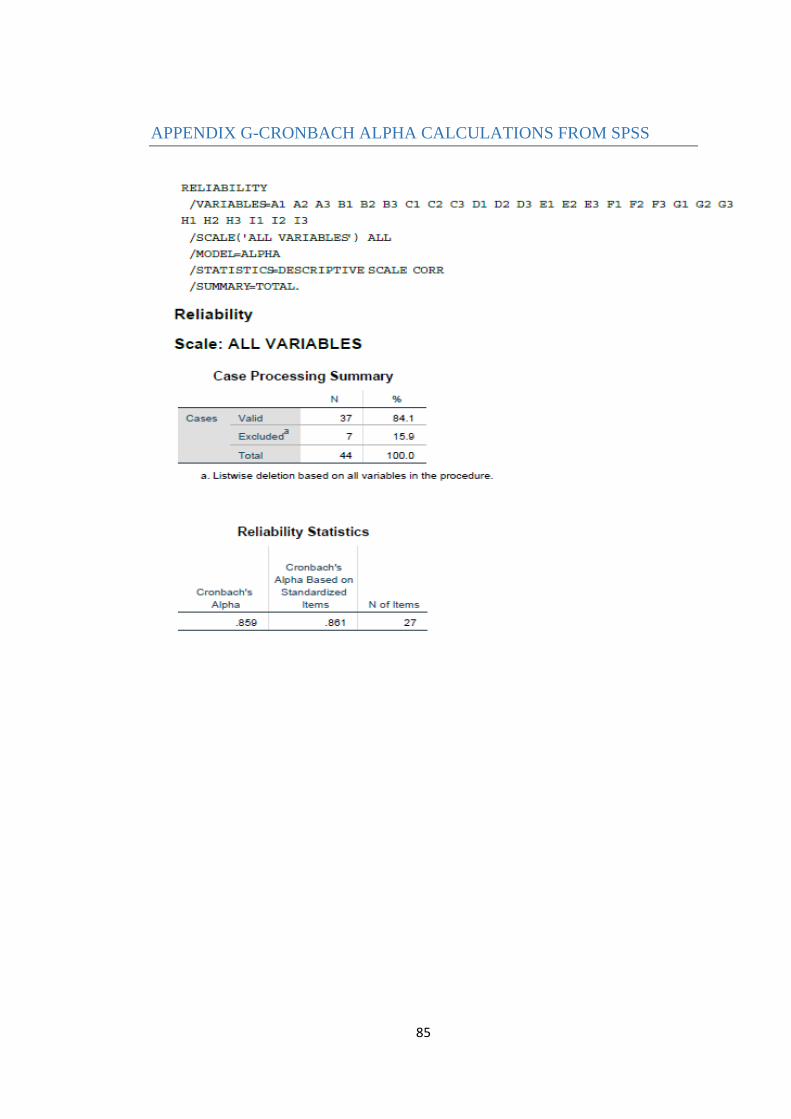
85
APPENDIX G-CRONBACH ALPHA CALCULATIONS FROM SPSS

86
Table G1: Item statistics from SPSS

87
Table G2: Inter-item correlation matrix from SPSS

88

89

90

91
APPENDIX H- CRONBACH ALPHA CALCULATIONS FROM EXCEL
Table H1: Tabulated Cronbach Alpha calculations from Excel
total
respondent Q1 Q2 Q3 Q1 Q2 Q3 Q1 Q2 Q3 Q1 Q2 Q3 Q1 Q2 Q3 Q1 Q2 Q3 Q1 Q2 Q3 Q1 Q2 Q3 Q1 Q2 Q3
1 4 4 1 3 2 1 2 4 3 3 2 3 2 3 4 3 3 1 4 4 3 2 3 2 2 2 2 72
2 2 1 1 2 4 5 1 2 2 1 3 3 2 2 5 2 2 2 4 3 1 5 1 1 1 3 61
3 4 4 1 3 2 1 2 4 3 3 2 3 2 3 4 3 3 1 4 4 3 1 2 1 1 1 1 66
4 5 5 2 5 5 5 5 5 5 5 5 5 5 1 5 5 5 1 5 5 5 5 5 5 5 5 119
5 4 4 3 3 2 4 3 3 3 3 3 3 2 2 4 3 2 3 3 3 3 2 4 2 2 3 4 80
6 4 4 2 2 2 3 3 4 3 2 1 4 2 4 4 4 3 2 3 4 4 1 3 4 1 4 4 81
7 4 4 1 4 1 5 2 3 2 3 1 3 2 4 5 3 2 2 1 3 3 1 3 2 2 2 2 70
8 4 4 3 3 2 4 2 4 2 4 3 4 3 3 2 3 3 3 4 3 3 3 2 3 4 3 3 84
9 3 2 3 3 3 3 4 4 3 3 3 4 4 4 3 3 3 3 2 4 2 3 3 3 3 3 3 84
10 4 4 4 4 5 3 4 4 2 5 5 5 4 4 2 4 4 4 2 4 2 4 4 4 4 4 4 103
11 4 2 1 5 1 1 2 5 1 4 4 5 2 4 2 2 2 1 5 5 4 1 1 1 1 1 4 71
12 4 4 5 5 4 3 5 5 5 5 5 5 5 5 5 5 5 5 5 5 5 3 3 3 3 5 3 120
13 3 2 2 3 3 5 3 3 3 2 4 4 3 3 2 1 3 1 5 1 3 1 3 1 1 2 1 68
14 4 4 2 2 3 5 2 3 4 3 4 4 2 2 3 1 2 1 4 3 4 3 3 3 1 2 2 76
15 4 4 2 2 2 4 2 2 2 2 3 2 2 4 2 2 2 2 2 3 2 2 2 2 2 4 64
16 3 1 5 2 1 5 3 1 4 1 1 4 1 5 2 2 1 4 5 5 3 1 5 1 1 5 3 75
17 2 2 2 5 3 3 3 3 4 4 4 5 3 3 3 2 2 4 4 4 2 4 2 2 3 2 80
18 4 2 2 4 4 4 4 4 2 4 4 4 4 4 2 4 4 2 4 4 4 4 2 4 4 4 4 96
19 1 1 1 1 2 5 1 4 5 1 1 1 1 1 5 1 1 1 1 1 1 1 1 1 1 1 1 43
20 4 4 2 4 4 4 4 4 4 4 4 5 4 3 4 4 3 4 4 4 4 4 4 4 3 5 5 106
21 1 1 1 4 2 5 2 4 4 4 4 4 4 3 2 1 1 1 2 3 1 4 2 4 2 2 2 70
22 2 1 3 1 4 4 3 3 2 5 4 4 4 4 2 4 3 4 2 4 3 1 3 3 1 4 4 82
23 5 4 2 2 3 2 1 4 5 3 4 4 5 5 4 4 3 1 2 3 2 1 4 3 2 3 4 85
24 5 5 5 5 5 4 4 3 4 4 4 5 4 3 3 2 1 4 4 4 4 4 3 4 4 1 98
25 1 4 1 1 1 5 1 1 5 5 5 3 3 3 3 3 1 1 5 5 3 1 5 1 1 1 5 74
Organisation Compensation Work dutiesAwareness Career progression Performance Growth Acting leadership Implementation

92
26 4 4 4 4 3 4 4 3 3 4 4 4 4 4 5 4 4 4 5 4 4 4 4 4 4 4 4 107
27 4 4 3 3 2 5 3 3 3 3 3 3 3 2 3 3 2 2 3 3 3 2 5 2 2 2 2 78
28 4 2 4 4 4 2 5 3 5 4 3 4 4 4 2 2 4 4 2 4 2 1 1 1 2 4 1 82
29 4 3 4 4 4 2 4 4 3 4 4 4 3 4 3 3 4 4 5 4 3 3 3 4 4 4 3 98
30 3 4 2 2 1 5 2 3 4 4 4 5 5 5 4 3 2 1 4 4 4 3 4 2 4 4 1 89
31 4 4 4 4 4 2 4 3 1 1 1 1 1 3 4 4 3 3 3 1 3 3 5 3 1 3 3 76
32 1 4 1 1 1 1 1 1 4 1 1 4 4 4 4 1 1 5 5 3 1 5 2 1 1 4 62
33 4 4 2 4 4 4 4 4 2 4 4 4 4 4 5 4 4 4 4 4 4 4 4 4 4 4 4 105
34 5 4 4 2 2 5 4 5 4 4 4 4 2 5 4 1 4 4 5 4 4 2 4 3 2 4 1 96
35 4 5 4 2 3 4 4 4 4 4 4 4 4 2 5 4 4 3 5 3 4 3 3 3 3 3 1 96
36 4 4 4 4 1 5 1 3 3 3 3 3 3 3 3 3 1 1 5 1 4 1 4 1 1 1 1 71
37 3 4 2 1 2 4 3 1 3 3 4 4 3 3 4 2 4 3 4 3 4 2 4 3 2 3 1 79
38 4 4 2 4 5 5 2 4 5 4 4 4 2 1 5 2 4 2 5 2 4 1 5 4 1 2 1 88
39 3 2 2 4 2 4 3 3 3 4 4 5 5 4 3 3 3 4 2 3 3 4 2 3 4 3 4 89
40 4 4 4 2 2 4 4 4 4 5 5 5 4 4 2 4 4 4 2 2 2 4 2 2 4 4 4 95
41 2 2 1 4 2 4 4 4 4 5 5 5 2 4 4 3 2 1 1 1 1 1 3 3 1 2 2 73
42 4 4 3 4 1 4 3 3 4 2 4 4 2 2 2 2 2 2 3 3 4 1 2 2 2 2 2 73
variances 1.20181 1.45181 1.58107 1.53345 1.59467 1.62188 1.39966 1.08673 1.21356 1.47392 1.50030 0.89569 1.38489 1.14569 1.30518 1.16835 1.26361 1.72562 1.81916 1.37245 0.95181 1.58503 1.41270 1.24093 1.53741 1.56236 1.76474

93
Cronbach Calculation
number of Qs 27
sum of item variance 37.79450
variance of tot Qs 250.308957
cronbach alpha 0.88

94
APPENDIX I- SKEWNESS AND KURTOSIS CALCULATIONS AND
GRAPHS FOR EACH SECTION
Table I1: Statistics tables for questionnaire

95

96
FREQUENCY TABLES FOR ALL QUESTIONS IN SECTION B OF QUESTIONNAIRE

97

98

99

100

101

102

103
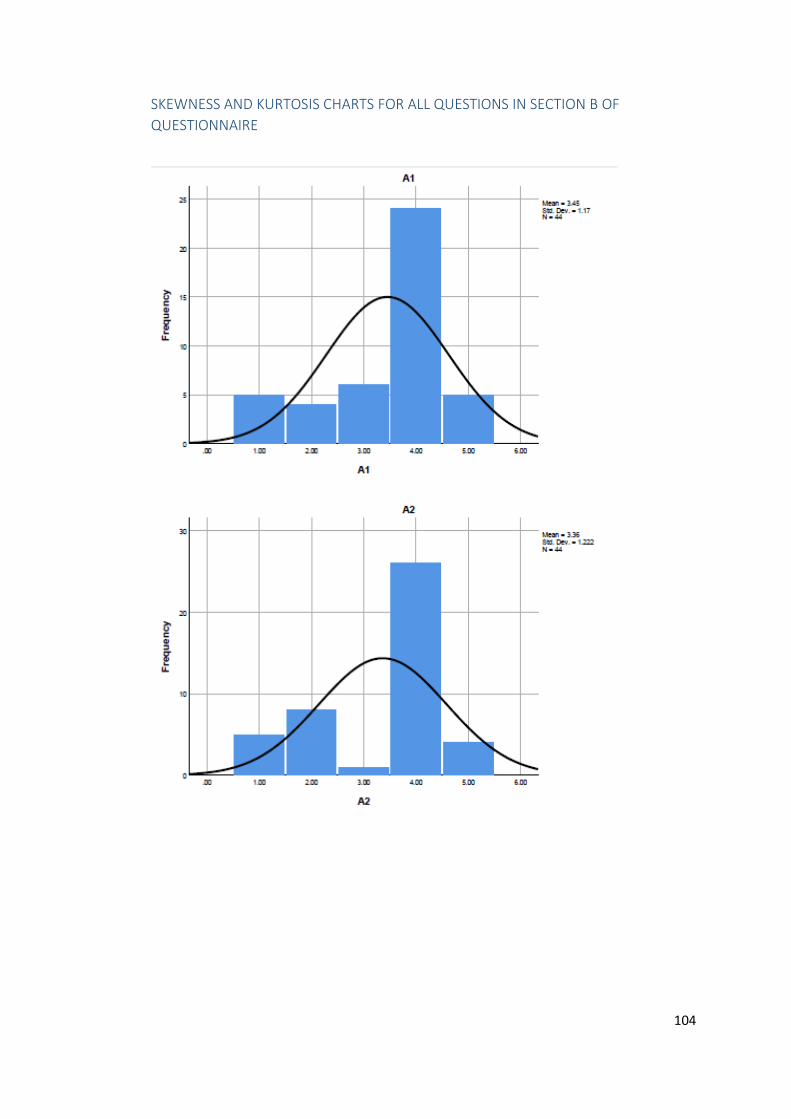
104
SKEWNESS AND KURTOSIS CHARTS FOR ALL QUESTIONS IN SECTION B OF
QUESTIONNAIRE

105

106

107

108

109

110
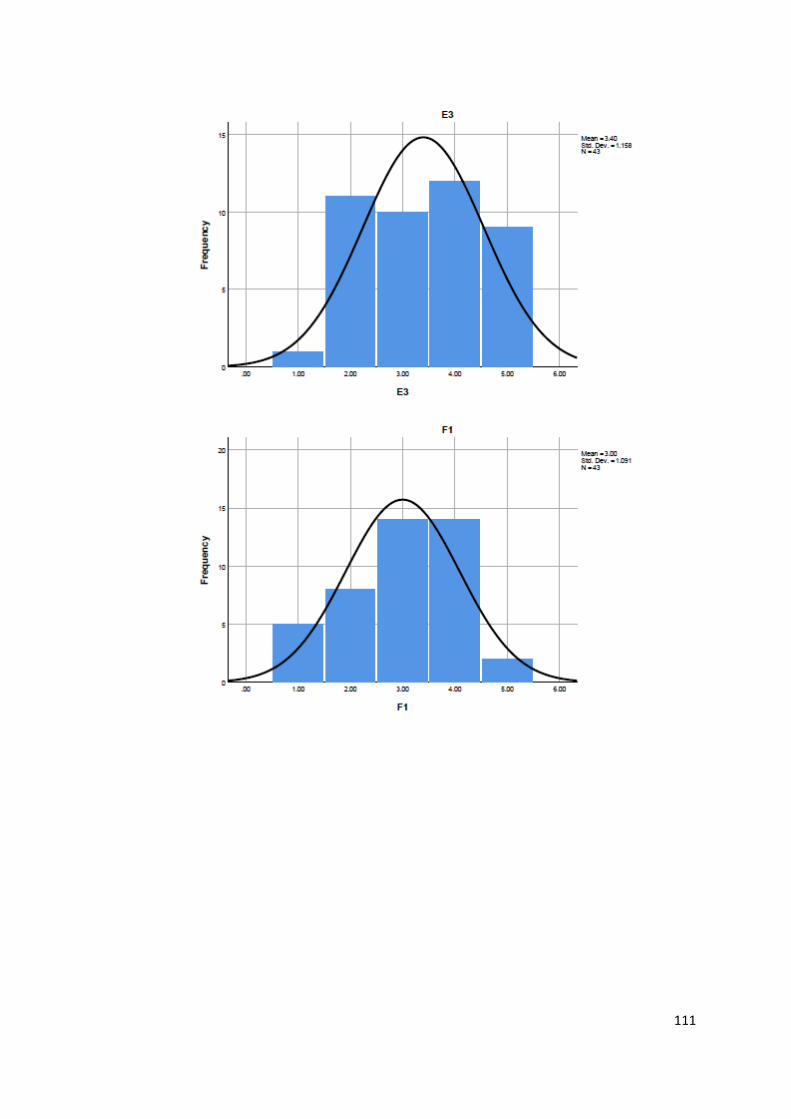
111

112

113

114

115

116

117

118


