
THE IMPACT OF MUSIC EDUCATION ON ACADEMIC ACHIEVEMENT,
ATTENDANCE RATE, AND STUDENT CONDUCT ON THE 2006 SENIOR CLASS IN
ONE SOUTHEAST VIRGINIA PUBLIC SCHOOL DIVISION
George Darryl Waller
Dissertation submitted to the faculty at the Virginia Polytechnic Institute and State University
in partial fulfillment of the requirements for the degree of
Doctor of Philosophy in
Educational Leadership and Policy Studies
Travis W. Twiford, Chairperson
James R. Craig Christine Hill Rosalie Martin
March 29, 2007 Blacksburg, Virginia
Keywords: Music Education, Academic Achievement, Attendance Rate, Student Conduct, Secondary Education, Brain Research (The Mozart Effect)
Copyright 2007, George Darryl Waller

THE IMPACT OF MUSIC EDUCATION ON ACADEMIC ACHIEVEMENT,
ATTENDANCE RATE, AND STUDENT CONDUCT ON THE 2006 SENIOR CLASS IN
ONE SOUTHEAST VIRGINIA PUBLIC SCHOOL DIVISION
George Darryl Waller
Chairperson: Travis W. Twiford, Ed. D
(ABSTRACT)
For several decades music educators have proposed that the study of music has a
significant impact on student academic achievement, attendance rates, and student conduct. In an
era of higher student and teacher accountability, increasing budget cuts, the federal No Child
Left Behind Act (NCLB), and stringent state standards of learning, a number of educators have
argued that education in music can boost test scores, attendance, attitudes toward school, reduce
discipline referrals, and increase overall academic achievement.
The purpose of this study was to quantify general education claims by examining high
school academic achievement data, attendance rates, and student conduct of the 2006 graduating
class in one Southeast Virginia school division.
In addition, this study briefly explores the impact that music education has on the human
brain and on academic achievement at the elementary school and secondary school levels.
Moreover, influences that integrating music has on academic achievement in general education
courses, arts integration programs, and elements of an effective music education program are
explored. Specific research studies provide evidence to support key concepts and the need for
additional research.
The research design includes the independent variables: subject and number of years
enrolled in formal music courses or no formal music courses, gender, ethnicity, and enrollment

iii
in formal music courses or no formal music courses in high school, grades nine through twelve.
The dependent variables include: academic achievement as measured by grade twelve weighted
cumulative grade point average (GPA), attendance rate as measured by the number of absences
in grade twelve, and student conduct as measured by the number of discipline referrals in grade
nine through grade twelve.
Four research questions were used to explore academic achievement, attendance rate, and
student conduct with regard to music or no music courses taken in grades nine through twelve.
Ethnicity and gender were reported using the common dependent variables among participants in
three populations – entire study population, music population, and non music population.
Conclusions were based upon sophisticated statistical tests including descriptive and
inferential statistics, correlations, analysis of variance (ANOVA), and regression statistics. These
tests confirmed the four research questions and null hypotheses that music students out perform
their non music counterparts in academic achievement, attendance rate, and student conduct.
Although the studied school division does not distinguish between excused and unexcused
absences, music students had fewer days absent than non music students.

iv
DEDICATION
This dissertation is dedicated to the memory of my father, George Alexander Waller, who
died July 11, 2004 after a long and courageous battle against Amyotrophic Lateral Sclerosis
(ALS) or Lou Gehrig’s disease. It was through my father’s example of unending strength and
love that a promise to see this project to completion was ever possible.
Second, to my mother, Jean Faye Brickhouse Waller, who has provided me with
countless examples of how to be the primary caregiver through good and tough times; and for the
guidance, assurance, and words of wisdom that all things are possible.
Third, to my two younger brothers, Brian and Stephen, and the members of my extended
family, I dedicate this work to you. Knowing that you all believed in me has made this journey
all the more worthwhile.
Most importantly, I dedicate this dissertation to the glory of God who has opened and
will continue to open many doors for growth and opportunity throughout my education and
professional career.
Finally, I dedicate this dissertation to the individuals and families that have or are
experiencing the devastation of ALS. We must search for strength within one another to sustain
the ideals on which our afflicted loved ones stood so that the lessons they taught us will remain
constant in our daily lives. Reach for the cure!

v
ACKNOWLEDGEMENT
When a person begins the arduous task of taking on a study of this magnitude, it is
difficult to project the number of people that influence the journey. So many people shape your
person and your work. Therefore, let me mention only a few.
First, let me thank my chairperson Dr. Travis W. Twiford and his secretary Linda Jones
for your undying partnership in this endeavor. Many times the journey seemed rocky but you
both were always there to help smooth the pathway. Dr. Twiford, you are an incredible man and
educator! Thank you!
To the members of my committee: Dr. James Craig, Dr. Christine Hill, and Dr. Rosalie
Martin, words could never express the warmth and friendship you all have shared in making this
study stronger, meaningful, and approachable. I agree, the study is long and takes more than just
a few hours to read and comprehend, but I believe we have offered valuable information
regarding the state of music education in the United States.
Second, I would like to thank the members of my 2003 Hampton Roads cohort for your
encouragement, motivation, and constant perseverance during our four years together. You all
are some of the most dedicated and talented individuals I have met along the journey.
Third, my highest gratitude is extended to the members of Hilton Christian Church. Your
words of encouragement, prayers, and frequent banter were enough to sustain anyone
undertaking this monumental task.
Finally, my heartfelt appreciation is given to my secretary, Shirley Barrow; my co-
worker, Patricia Franklin, Supervisor of Art; and all my colleagues and teachers for vacations,
shared presentations and more in order to complete this journey.
Thanks to you all!

vi
TABLE OF CONTENTS
ABSTRACT....................................................................................................................................ii
DEDICATION................................................................................................................................iv
ACKNOWLEDGEMENT...............................................................................................................v
TABLE OF CONTENTS................................................................................................................vi
LIST OF TABLES.........................................................................................................................xii
LIST OF FIGURES......................................................................................................................xxi
CHAPTER 1....…………………………………………………………………………………....1
INTRODUCTION TO THE STUDY
Introduction of the Study…………………….....................................................................1
Context for Inquiry..................................................................................................1
Music Education in the United States....……………………................................10
Statement of the Problem.......................................................................................14
Conceptual Model..................................................................................................15
Significance of the Study.......................................................................................19
Purpose of the Study..............................................................................................22
Research Questions................................................................................................22
Definition of Terms................................................................................................23
Limitations and Delimitations of the Study...........................................................27
Organization of the Study......................................................................................29
CHAPTER 2...………………………………………………………………………….…………………………31
REVIEW OF RELATED LITERATURE
Review of the Literature...………………….....................................................................31

vii
The Impact of Music on the Brain – The Mozart Effect..............................................................32
Historical Perspective...............................................................................................32
Promoting Music and the Mozart Effect.……………………………………….34
The Controversy Begins.……………………………………………………..…….36
Using Mozart or Not Using Mozart.……………………………………………..41
The Mozart Effect and Preschool Children..…………………….……………...42
The Mozart Effect and Background Music in Public Schools.…………......45
Expanding the Mozart Effect – A Summary.…………………………….…….48
Music Education and Elementary School Academic Achievement………..……….52
Using Piano Instruction for Increased Academic Achievement……..…….53
Music Instruction and At-Risk Preschool Children………………………......60
Elementary School Instrumental Music Instruction and
Academic Achievement.…………………………………...…………......68
Music, Academic Achievement, and Gender Control.……………….……....73
Background Music and Academic Achievement in Writing.……………....74
Summary.....……………………………………………………..…………………….79
Music Education and Secondary School Academic Achievement.…………...…….80
Participation in Music and Athletic Activities.…………………………..........80
Instrumental Music and Academic Achievement.…………………….………82
Music Participation and Grade 12 Core Academic Subjects.…………........83
Music Participation, Acquisition of Complex Academic and
Social Skills, and Academic Transfer.……………………………..…..93
Summary.………………………………………………….…………………………..95

viii
Integrating Music Education in Core Subjects and Academic Achievement.……96
Start With Arts Program (SWAP.)……………………………………………….97
Artful Learning: A School Reform Model.………………………….…………99
Integrating Music into Social Studies.…………………………………………104
The Impact of Music on Social, Cognitive, and Academic Skills
of Disabled Students..…………………………………...……………….105
Summary.…………………………………………………………………….………106
Elements of an Effective Music Education Program that Impact
Academic Achievement.………………………………………………...110
Parental Involvement.………………………………………………....………......110
Barriers to Family Involvement.………………………….….………….………119
Peer Influence and Success in Life.………………………………………...…..122
Summary.…………………………………………………………………………….124
Chapter Summary.…………………………………………………………………………...125
CHAPTER THREE.……………………………………………………………………………………………127
METHODOLOGY
Methodology.…………………………………………………………………...……………………...127
Setting.........................................................................................................................................128
Population……………………………………………………………………………..………130
Research Design……………………………………………………………………………..133
Data Collection Procedures.……………………………………………………………….137
ix
Instrumentation..…………………………………..…………………………………………139
Grade Twelve Weighted Cumulative Grade Point Average.……..……….139
Number of Absences in Grade Twelve.…………………………..…………...141
Number of Discipline Referrals in Grade Nine through Grade Twelve...142
Threats to Internal and External Validity.…………………………….……..………….142
Data Analysis.……………………………………………………..…………..……….…......144
Chapter Summary.………………………………………..…………………………….……146
CHAPTER FOUR.…………………………………………………..………………………………………….148
FINDINGS AND RESULTS
Introduction...………………………………………………………………………..………...148
Background Information.………………………………………………….………..…………….....148
Research Questions…………………………....…………………………………...…………………149
Data Collection Procedures……………………………………………….……….…….……..…...150
Instrumentation……………………………..………………….…………..…….………………….....151
Data Analysis Techniques………………………………………………………….………………..151
Descriptive Statistics, Correlations, Analysis of Variance (ANOVA), and Regression...152
Grade Twelve Weighted Cumulative Grade Point Average………………………..156
Entire Study Population…………………………………………………………..157
Music Population…………………………………………………………………..175
Non Music Population……………………………………………………….……187
Number of Absences in Grade Twelve………………………………………...………..196
Entire Study Population………………………………………………….……….198
Music Population…………………………………………………………………..215

x
Non Music Population…………………………………………………….………228
Number of Discipline Referrals in Grade Nine through Grade Twelve……….....237
Entire Study Population……………………………………………………….….238
Music Population…………………………………………………………………..255
Non Music Population…………………………………………………………….269
Data Tables for Each Research Question………………………………………………………...280
Chapter Summary……………………………………………………………………………………..287
CHAPTER FIVE……………………………………………………………………..…………………………288
SUMMARY, CONCLUSIONS, DISCUSSION, AND RECOMMENDATIONS
Introduction and Summary…………………………………………………………………………….…….288
Limitations and Delimitations………………………………………………………………………290
Discussion of Findings……………………………………………………………….…………….………….292
Summary………………………………………………………………………………………307
Conclusions and Implications for Practice…………………….…………………………………309
Recommendations for Practice…………………………………………………………312
Recommendations for Future Study……………………………………………...………………..313
Research Reflections………………………………………………………………….………...………………315
REFERENCES....………………………………………………………………………………………………..316
APPENDIX……………………………………………………………………………………...329
Institutional Review Board Documents
Certificate of Completion – Training in Human Subjects Protection….……….329
Initial Review Application……………………………………………………...330
Request for Exempt Status…………………………………………………..….340

xi
Approval for Exempt Status……………….…………………………………....343
Sampled School Division Documents
Application for Research Authorization…………………...…………………………....344
Research Authorization Approval………………………………………………………..346
eSIS Report Request Form…………………………………...……………………………347
Scatter Plots…………………………………………………………………………….348
Grade Twelve Weighted Cumulative Grade Point Average
Entire Study Population………………………………………………...348
Music Population……………………………………………………….351
Non Music Population………………………………………………….354
Number of Absences in Grade Twelve
Entire Study Population………………………………………………...357
Music Population……………………………………………………….360
Non Music Population………………………………………………….363
Number of Discipline Referrals in Grade Nine through Grade Twelve
Entire Study Population………………………………………………...366
Music Population……………………………………………………….369
Non Music Population………………………………………………….372
Resume………………………………………………………………………………….375

xii
LIST OF TABLES
Table Page
1 Mean Scores of Males by Condition………………………………………………..........44
2 Mean Task Scores and Standard Deviations for Keyboard (N = 34) and
No Music (N = 28) Groups………………………………………………………..……..56
3 Two-Factor (Group, Time) Analyses of Variance for Puzzle Solving,
Block Building, and Pictorial Tasks…………………………………………………......58
4 Mean Gain Scores (Pretest – 8 Months) for Keyboard (N = 34) and
No Music (N = 28) Groups……………………………………………………...……….59
5 Mean Ohio Proficiency Test Scores for String and Non-String Students………….........69
6 Music Subjects as Predictors of Achievement in Grade 12 Mathematics……….….…...86
7 Music Subjects as Predictors of Achievement in Grade 12 English……….………….…86
8 Music Subjects as Predictors of Achievement in Grade 12 Biology…………………….87
9 Mean Percentage Scores of Achievement in Grade 12 Mathematics, English, and
Biology, for the 2001 Cohort, for Four Groups: All Students; Participants of Band
Grade 11; Participants of String Grade 11; Participants of Choir Grade 11;
Participants of Composition Grade 11…………………………………………..……….89
10 Effect Sizes in Comparison to “All Students” Mean Scores Using Cohen’s d
(Group Mean Differences in Standard Deviations) and as Correlation Coefficients r.
All Group Comparisons are with the “All Students” Means Scores……………….........89

xiii
11 Mean Percentage Scores of Achievement in Grade 12 Mathematics, English, and
Biology, for the 2002 Cohort, for Four Groups: All Students; Participants of Band
Grade 11; Participants of String Grade 11; Participants of Choir Grade 11;
Participants of Composition Grade 11…………………………………………………...90
12 Effect Sizes in Cohen’s d (Group Mean Differences Divided by Standard
Deviation) and as Correlation Coefficients r. All Group Comparisons are with
The All Students Mean Scores………………………………………………...…………91
13 Mean Percentage Scores of Achievement in Grade 12 Mathematics, English, and
Biology, for the 2003 Cohort, for Four Groups: All Students; Participants of Band
Grade 11; Participants of String Grade 11; Participants of Choir Grade 11;
Participants of Composition of Grade 11……………………………………...…………91
14 Effect Sizes in Cohen’s d (Group Mean Differences in Standard Deviations) and
as Correlation Coefficients r: All Group Comparisons are with the All Students
Mean Scores………………………………………………………………………...……92
15 Results of Four Research Studies Relating to Emotionally Disturbed Students,
Juvenile Delinquents and Disadvantaged Students, English Language Learners,
and the Effects of Music as Reinforcement for Education/Therapy Objectives
as Featured in Deasy (2000) Critical Links: Learning in the Arts and Student
Academic and Social Development……………………………………………………107
16 Student Enrollment by Ethnicity for Sampled School Division ...……………………..129
17 Ethnicity and Gender for the 2006 Senior Class in the Sampled School Division…….130
18 Ethnic Structure for the Sampled School Division (in Grade Nine through
Grade Twelve) ……………………………….……………………………………………….131

xiv
19 Four Population Sets and the Possible Years Students Enrolled in Vocal Music,
Instrumental Music, No Music Instruction or a Combination of Vocal and
Instrumental Music within the Same School District….…………….…..…….…………..132
20 Scale for Determining Grade Point Average……………...……….……..…………...........140
21 Frequencies (N) and Percentages for Each Study Population……………...……………..152
22 Gender Structure for All Populations………………………….……………………………153
23 Frequency (N) and Percentage (%) for the Ethnic Structure Among
All Study Populations………………………………….…………………….………...……..155
24 Frequency (N), Mean (M), and Standard Deviation (SD) for Each Dependent
Variable for All Populations…………………………………………………………………156
Dependent Variable - Grade Twelve Weighted Cumulative Grade Point Average
Entire Study Population
25 Mean, Standard Deviation, and Frequency (N) by Subject and Number of Years
Enrolled in Formal Music Courses or No Formal Music Courses for the Entire
Study Population…………………….……………...………………………………………..159
26 Mean, Standard Deviation, and Frequency (N) by Gender for the Entire
Study Population………………………………………………………………………162
27 Mean, Standard Deviation, and Frequency (N) by Ethnicity for the Entire
Study Population…………………………………………..…………………………..164
28 Mean, Standard Deviation, and Frequency (N) by Formal Music Courses or
No Formal Music Courses for the Entire Study Population…………………...………...166
29 Correlations for the Entire Study Population.....................................................................168
30 Univariate Analysis of Variance Tests of Between-Subjects Effects …………………169

xv
31 Model Summary for the Entire Study Population………………………………..……….170
32 Analysis of Variance (ANOVA) for the Entire Study Population………………..……..171
33 Coefficients for the Entire Study Population……………………………...…………..…..173
34 Excluded Variables………………………………………………….……………………….174
35 Residual Statistics for the Entire Study Population………………………………..……..174
Music Population
36 Mean, Standard Deviation, and Frequency (N) by Subject and Number of Years
Enrolled in Formal Music Courses or No Formal Music Courses……………………..176
37 Mean, Standard Deviation, and Frequency (N) by Gender ..…………………………...180
38 Mean, Standard Deviation, and Frequency (N) by Ethnicity ….……………...…….....181
39 Grade Twelve Weighted Cumulative Grade Point Average Correlations………...…..184
40 Model Summary for Subject and Number of Years Enrolled in Formal
Music Courses or No Formal Music Courses, Gender, and Ethnicity ………………..185
41 Analysis of Variance (ANOVA) for Subject and Number of Years Enrolled in
Formal Music Courses or No Formal Music Courses, Gender, and Ethnicity.….….…185
42 Coefficients for Subject and Number of Years Enrolled in Formal Music Courses
or No Formal Music Courses, Gender, and Ethnicity …………….….………………...186
43 Residual Statistics for the Music Population………………………………..…………...187
Non Music Population
44 Frequency (N), Mean, and Standard Deviation by Subject and Number of Years
Enrolled in Formal Music Courses or No Formal Music Courses ……….….…....….188
45 Mean, Standard Deviation, and Frequency (N) by Gender …………..…….…..…….189
xvi
46 Mean, Standard Deviation, and Frequency (N) by Ethnicity.……………..……...…..…...191
47 Grade Twelve Weighted Cumulative Grade Point Average Correlations ……………....193
48 Model Summary for Gender and Ethnicity ……………………….………………....……..194
49 Analysis of Variance (ANOVA) for Gender and Ethnicity ……………...………….……195
50 Coefficients for Gender and Ethnicity…………………………..………………...………...196
51 Residual Statistics for the Non Music Population…………………….…...........................197
Dependent Variable – Number of Absences in Grade Twelve
52 Frequency (N), Mean, and Standard Deviations for All Populations…….….………..….197
Entire Study Population
53 Mean, Standard Deviation, and Frequency (N) by Subject and Number of
Years Enrolled in Formal Music Courses or No Formal Music Courses……..…………200
54 Mean, Standard Deviation, and Frequency (N) by Gender ………………………………203
55 Mean, Standard Deviation, and Frequency (N) by Ethnicity ………….…………………204
56 Mean, Standard Deviation, and Frequency (N) by Formal Music Courses
or No Formal Music Courses ………………………………………………………….…….206
57 Number of Absences in Grade Twelve Correlations…………………………………...208
58 Univariate Analysis of Variance Tests of Between-Subjects Effects…………..………...210
59 Model Summary for the Entire Study Population……………………….…………..……..211
60 Analysis of Variance (ANOVA) for the Entire Study Population………………………..212
61 Coefficients for the Entire Study Population…………………………………………….....213
62 Excluded Variables……………………………………………………………………………214
63 Residual Statistics for the Entire Study Population………………...…………….……......214

xvii
Music Population
64 Mean, Standard Deviation, and Frequency (N) by Subject and Number of
Years Enrolled in Formal Music Courses or No Formal Music Courses..….……...........216
65 Mean, Standard Deviation, and Frequency (N) by Gender ……………….…………..…..219
66 Mean, Standard Deviation, and Frequency (N) by Ethnicity …………………...……..….221
67 Mean, Standard Deviation, and Frequency (N) by Formal Music Courses……….……223
68 Correlations for the Music Population……………………………………..….…......…..….224
69 Model Summary for the Music Population…………………………..…………….….…....225
70 Analysis of Variance (ANOVA) for the Music Population…………………..…..….……226
71 Coefficients for the Music Population…………………………….…………….…..………226
72 Residual Statistics for the Music Population……………………………….……………....227
Non Music Population
73 Frequency (N), Mean, and Standard Deviation by Subject and Number of Years
Enrolled in Formal Music Courses or No Formal Music Courses ………….……..……..229
74 Mean, Standard Deviation, and Frequency (N) by Gender …………………..………...230
75 Mean, Standard Deviation, and Frequency (N) by Ethnicity …………..………..……..231
76 Mean, Standard Deviation, and Frequency (N) by Formal Music Courses
or No Formal Music Courses ……………………………………….………..………...233
77 Number of Absences in Grade Twelve Correlations ………………….……..……………234
78 Model Summary for the Non Music Population……………………………………...……235
79 Analysis of Variance (ANOVA) for the Non Music Population………….……..……….236
80 Coefficients for the Non Music Population…………………………...……….………....…237
81 Residual Statistics for the Non Music Population………………………………….………238

xviii
Dependent Variable – Number of Discipline Referrals in Grade Nine through Grade Twelve
82 Frequency (N), Mean, and Standard Deviation for All Populations……………………...239
Entire Study Population
83 Mean, Standard Deviation, and Frequency (N) by Subject and Number of Years
Enrolled in Formal Music Courses or No Formal Music Courses ………...….……...…..241
84 Mean, Standard Deviation, and Frequency (N) by Gender……………….….……....……244
85 Mean, Standard Deviation, and Frequency (N) by Ethnicity………………………..…….246
86 Mean, Standard Deviation, and Frequency (N) by Formal Music Courses
or No Formal Music Courses ………………………………………..…….…………...……248
87 Number of Discipline Referrals in Grade Nine through Grade Twelve
Correlations…………………………………………………..…………………………..……250
88 Univariate Analysis of Variance Tests of Between-Subjects Effects……….….……...251
89 Model Summary for the Entire Study Population…………………………………….……252
90 Analysis of Variance (ANOVA) for the Entire Study Population…………….....….……253
91 Coefficients for the Entire Study Population……………………………..………….....…...…..254
92 Excluded Variables………………………………………………………...………………….255
93 Residual Statistics for the Entire Study Population…………………...……………….…..256
Music Population
94 Mean, Standard Deviation, and Frequency (N) by Subject and Number of Years
Enrolled in Music or No Music …………………………………………………..…….…..257
95 Mean, Standard Deviation, and Frequency (N) by Gender ……………………..………..261
96 Mean, Standard Deviation, and Frequency (N) by Ethnicity……………………………..262

xix
97 Mean, Standard Deviation, and Frequency (N) by Formal Music Courses
or No Formal Music Courses……………………………………………………….………..264
98 Correlations for the Music Population……………………………...……………………….265
99 Model Summary for the Music Population……………………………….…..…………….266
100 Analysis of Variance (ANOVA) for the Music Population…………….……….……..….267
101 Coefficients for the for the Music Population………………………….…………………..268
102 Residual Statistics for the for the Music Population……………………………………….269
Non Music Population
103 Mean, Standard Deviation, and Frequency (N) by Subject and Number of Years
Enrolled in Formal Music Courses or No Formal Music Courses.……………………....270
104 Mean, Standard Deviation, and Frequency (N) by Gender ……………………………….271
105 Mean, Standard Deviation, and Frequency (N) by Ethnicity………………….…..………273
106 Mean, Standard Deviation, and Frequency (N) by Formal Music Courses
or No Formal Music Courses………………………………………………………………...275
107 Correlations for the Non Music Population……………………..………………………….276
108 Model Summary for the Non Music Population…………………….……………………..277
109 Analysis of Variance (ANOVA) for the Non Music Population…………...…………….278
110 Coefficients for the Non Music Population……………………………….………………..279
111 Residual Statistics for the Non Music Population…………….…..……………………….280
Data Tables of Each Research Question
112 Frequency (N) and Mean of All Dependent Variables by Subject and Number of
Years Enrolled in Formal Music Courses or No Formal Music Courses for the
Entire Study Population………………………………………………………………………281

xx
113 Frequency (N) and Mean of All Dependent Variables by Gender for All Study
Populations…………………………………….........................................................................283
114 Frequency (N) and Mean of All Dependent Variables by Ethnicity for All
Study Populations……………………………………………………………………………..284
115 Frequency (N) and Mean of All Dependent Variables by Formal Music Courses
or No Formal Music Courses for the Study Population..……………………..…………...286

xxi
LIST OF FIGURES
Figure Page
1 National Verbal Mean Score Test-Testing Trends for Twelfth Grade
College-Bound Music and Non-Music Students………………………………………….7
2 National Math Mean Score Test-Taking Trends for Twelfth Grade
College-Bound Music and Non-Music Students………………………………………….8
3 Virginia Verbal Mean Score Test-Taking Trends for Twelfth Grade
College-Bound Music and Non-Music Students………………………………….............9
4 Virginia Math Mean Score Test-Taking Trends for Twelfth Grade
College-Bound Music and Non-Music Students………………...………………………10
5 Conceptual Model of Music and Non-Music Students Using Designated Academic
Achievement, Attendance Rate, and Student Conduct Measures……………………..…18
6 Easy and Difficult Paper Folding and Cutting Items……………...………………….…..40
7 Grade 4 Reading and Language Arts Criterion-Based Assessments.
Percent of Students Meeting or Exceeding Standards………………………......………102
8 Grade 5 Statewide Reading Assessment.
Percent of Student Meeting or Exceeding Standards………………………….………...103
9 Grade 8 Writing Assessment.
Percent of Students Meeting or Exceeding Standards…………………….………...…..104

xxii
Grade Twelve Weighted Cumulative Grade Point Average
Entire Study Population
10 Line Graph…………………………………………………..……………………...158
Estimated Marginal Mean Grade Twelve Cumulative Weighted Grade Point
Average by Number of Years Enrolled in Formal Music Courses or No
Formal Music Courses
11 Line Graph………………………………………………………………………….167
Estimated Marginal Mean Grade Twelve Cumulative Weighted Grade Point
Average by Formal Music Courses or No Formal Music Courses
12 Line Graph…………………………………………………………………….……199
Estimated Marginal Mean Number of Absences in Grade Twelve by Number
of Years Enrolled in Formal Music Courses or No Formal Music Courses
13 Line Graph………………………………………………………………………….207
Estimated Marginal Mean Number of Absences in Grade Twelve by Formal
Music Courses or No Formal Music Courses
14 Line Graph………………………………………………………………………….240
Estimated Marginal Mean Number of Discipline Referrals in Grade Nine
through Grade Twelve by Number of Years Enrolled in Formal Music
Courses or No Formal Music Courses
15 Line Graph………………………………………………………………………….249
Estimated Marginal Mean Number of Discipline Referrals in Grade Nine
through Grade Twelve by Formal Music Courses or No Formal Music Courses

xxiii
16 Scatter Plot………………………………………………………………………….348
Regression Standardized Predicted Value (x axis)
Dependent Variable: Grade Twelve Grape Point Average (y axis)
17 Scatter Plot………………………………………………………………………….348
Regression Standardized Residual (x axis).
Dependent Variable: Grade 12 Weighted Cumulative Grade Point Average (y axis).
18 Scatter Plot………………………………………………………………………….349
Regression Deleted (Press) Residual (x axis).
Dependent Variable: Grade 12 Weighted Cumulative Grade Point Average (y axis).
19 Scatter Plot………………………………………………………………………….349
Regression Adjusted (Press) Predicted Value (x axis).
Dependent Variable: Grade 12 Weighted Cumulative Grade Point Average (y axis).
20 Scatter Plot………………………………………………………………………….350
Regression Studentized Residual (x axis).
Dependent Variable: Grade 12 Weighted Cumulative Grade Point Average (y axis).
21 Scatter Plot………………………………………………………………………….350
Regression Studentized Deleted (Press) Residual (x axis).
Dependent Variable: Grade 12 Weighted Cumulative Grade Point Average (y axis).
Music Population
22 Scatter Plot………………………………………………………………………….351
Regression Standardized Predicted Value (x axis).
Dependent Variable: Grade 12 Weighted Cumulative Grade Point Average (y axis).

xxiv
23 Scatter Plot………………………………………………………………………….351
Regression Standardized Residual (x axis).
Dependent Variable: Grade 12 Weighted Cumulative Grade Point Average (y axis).
24 Scatter Plot………………………………………………………………………….352
Regression Deleted (Press) Residual (x axis).
Dependent Variable: Grade 12 Weighted Cumulative Grade Point Average (y axis).
25 Scatter Plot………………………………………………………………………….352
Regression Adjusted (Press) Predicted Value (x axis).
Dependent Variable: Grade 12 Weighted Cumulative Grade Point Average (y axis).
26 Scatter Plot………………………………………………………………………….353
Regression Studentized Residual (x axis).
Dependent Variable: Grade 12 Weighted Cumulative Grade Point Average (y axis).
27 Scatter Plot………………………………………………………………………….353
Regression Studentized Deleted (Press) Residual (x axis).
Dependent Variable: Grade 12 Weighted Cumulative Grade Point Average (y axis).
Non Music Population
28 Scatter Plot………………………………………………………………………….354
Regression Standardized Predicted Value (x axis).
Dependent Variable: Grade 12 Weighted Cumulative Grade Point Average (y axis).
29 Scatter Plot………………………………………………………………………….354
Regression Standardized Residual (x axis).
Dependent Variable: Grade 12 Weighted Cumulative Grade Point Average (y axis).

xxv
30 Scatter Plot………………………………………………………………………….355
Regression Deleted (Press) Residual (x axis).
Dependent Variable: Grade 12 Weighted Cumulative Grade Point Average (y axis).
31 Scatter Plot………………………………………………………………………….355
Regression Adjusted (Press) Predicted Value (x axis).
Dependent Variable: Grade 12 Weighted Cumulative Grade Point Average (y axis).
32 Scatter Plot………………………………………………………………………….356
Regression Studentized Residual (x axis).
Dependent Variable: Grade 12 Weighted Cumulative Grade Point Average (y axis).
33 Scatter Plot………………………………………………………………………….356
Regression Studentized Deleted (Press) Residual (x axis).
Dependent Variable: Grade 12 Weighted Cumulative Grade Point Average (y axis).
Number of Absences in Grade Twelve
Entire Study Population
34 Scatter Plot………………………………………………………………………….357
Regression Standardized Predicted Value (x axis).
Dependent Variable: Number of Absences in Grade Twelve (y axis).
35 Scatter Plot………………………………………………………………………….357
Regression Standardized Residual (x axis).
Dependent Variable: Number of Absences in Grade Twelve (y axis).
36 Scatter Plot………………………………………………………………………….358
Regression Deleted (Press) Residual (x axis).
Dependent Variable: Number of Absences in Grade Twelve (y axis).

xxvi
37 Scatter Plot………………………………………………………………………….358
Regression Adjusted (Press) Predicted Value (x axis).
Dependent Variable: Number of Absences in Grade Twelve (y axis).
38 Scatter Plot………………………………………………………………………….359
Regression Studentized Residual (x axis).
Dependent Variable: Number of Absences in Grade Twelve (y axis).
39 Scatter Plot………………………………………………………………………….359
Regression Studentized Deleted (Press) Residual (x axis).
Dependent Variable: Number of Absences in Grade Twelve (y axis).
Music Population
40 Scatter Plot………………………………………………………………………….360
Regression Standardized Predicted Value (x axis).
Dependent Variable: Number of Absences in Grade Twelve (y axis).
41 Scatter Plot………………………………………………………………………….360
Regression Standardized Residual (x axis).
Dependent Variable: Number of Absences in Grade Twelve (y axis).
42 Scatter Plot………………………………………………………………………….361
Regression Deleted (Press) Residual (x axis).
Dependent Variable: Number of Absences in Grade Twelve (y axis).
43 Scatter Plot………………………………………………………………………….361
Regression Adjusted (Press) Predicted Value (x axis).
Dependent Variable: Number of Absences in Grade Twelve (y axis).

xxvii
44 Scatter Plot………………………………………………………………………….362
Regression Studentized Residual (x axis).
Dependent Variable: Number of Absences in Grade Twelve (y axis).
45 Scatter Plot………………………………………………………………………….362
Regression Studentized Deleted (Press) Residual (x axis).
Dependent Variable: Number of Absences in Grade Twelve (y axis).
Non Music Population
46 Scatter Plot………………………………………………………………………….363
Regression Standardized Predicted Value (x axis).
Dependent Variable: Number of Absences in Grade Twelve (y axis).
47 Scatter Plot………………………………………………………………………….363
Regression Standardized Residual (x axis).
Dependent Variable: Grade 12 Number of Absences (y axis).
48 Scatter Plot………………………………………………………………………….364
Regression Deleted (Press) Residual (x axis).
Dependent Variable: Number of Absences in Grade Twelve (y axis).
49 Scatter Plot………………………………………………………………………….364
Regression Adjusted (Press) Predicted Value (x axis).
Dependent Variable: Number of Absences in Grade Twelve (y axis).
50 Scatter Plot………………………………………………………………………….365
Regression Studentized Residual (x axis).
Dependent Variable: Number of Absences in Grade Twelve (y axis).
xxviii
51 Scatter Plot………………………………………………………………………….365
Regression Studentized Deleted (Press) Residual (x axis).
Dependent Variable: Number of Absences in Grade Twelve (y axis).
Number of Discipline Referrals in Grade Nine through Grade Twelve
Entire Study Population
52 Scatter Plot………………………………………………………………………….366
Regression Standardized Predicted Value (x axis).
Dependent Variable: Number of Discipline Referrals in Grades 9 – 12 (y axis).
53 Scatter Plot………………………………………………………………………….366
Regression Standardized Residual (x axis).
Dependent Variable: Number of Discipline Referrals in Grades 9 – 12 (y axis).
54 Scatter Plot………………………………………………………………………….367
Regression Deleted (Press) Residual (x axis).
Dependent Variable: Number of Discipline Referrals in Grades 9-12 (y axis).
55 Scatter Plot………………………………………………………………………….367
Regression Adjusted (Press) Predicted Value (x axis).
Dependent Variable: Number of Discipline Referrals in Grades 9-12 (y axis).
56 Scatter Plot………………………………………………………………………….368
Regression Studentized Residual (x axis).
Dependent Variable: Number of Discipline Referrals in Grades 9-12 (y axis).
57 Scatter Plot………………………………………………………………………….368
Regression Studentized Deleted (Press) Residual (x axis).
Dependent Variable: Number of Discipline Referrals in Grades 9-12 (y axis).

xxix
Music Population Only
58 Scatter Plot………………………………………………………………………….369
Regression Standardized Predicted Value (x axis).
Dependent Variable: Number of Discipline Referrals in Grades 9 – 12 (y axis).
59 Scatter Plot………………………………………………………………………….369
Regression Standardized Residual (x axis).
Dependent Variable: Number of Discipline Referrals in Grades 9-12 (y axis).
60 Scatter Plot………………………………………………………………………….370
Regression Deleted (Press) Residual (x axis).
Dependent Variable: Number of Discipline Referrals in Grades 9-12 (y axis).
61 Scatter Plot………………………………………………………………………….370
Regression Adjusted (Press) Predicted Value (x axis).
Dependent Variable: Number of Discipline Referrals in Grades 9-12 (y axis).
62 Scatter Plot………………………………………………………………………….371
Regression Studentized Residual (x axis).
Dependent Variable: Number of Discipline Referrals in Grades 9-12 (y axis).
63 Scatter Plot………………………………………………………………………….371
Regression Studentized Deleted (Press) Residual (x axis).
Dependent Variable: Number of Discipline Referrals in Grades 9-12 (y axis).
Non Music Population Only
64 Scatter Plot………………………………………………………………………….372
Regression Standardized Predicted Value (x axis).
Dependent Variable: Number of Discipline Referrals in Grades 9 – 12 (y axis).

xxx
65 Scatter Plot………………………………………………………………………….372
Regression Standardized Residual (x axis).
Dependent Variable: Number of Discipline Referrals in Grades 9-12 (y axis).
66 Scatter Plot………………………………………………………………………….373
Regression Deleted (Press) Residual (x axis).
Dependent Variable: Number of Discipline Referrals in Grades 9-12 (y axis).
67 Scatter Plot………………………………………………………………………….373
Regression Adjusted (Press) Predicted Value (x axis).
Dependent Variable: Number of Discipline Referrals in Grades 9-12 (y axis).
68 Scatter Plot………………………………………………………………………….374
Regression Studentized Residual (x axis).
Dependent Variable: Number of Discipline Referrals in Grades 9-12 (y axis).
69 Scatter Plot………………………………………………………………………….374
Regression Studentized Deleted (Press) Residual (x axis).
Dependent Variable: Number of Discipline Referrals in Grades 9-12 (y axis).

1
CHAPTER 1
INTRODUCTION TO THE STUDY
Context for Inquiry
For several decades music educators have proposed that the study of music has a
significant impact on student academic achievement in core subjects (Virginia Commission for
the Arts, 1994; Music Educators National Conference, 1994a). In an era of higher student and
teacher accountability, increasing budget cuts, the federal No Child Left Behind Act (NCLB),
and stringent state standards of learning, a number of educators have argued that education in
music can boost test scores, attendance, attitudes toward school, and overall academic
achievement (Eisner, 1998; Virginia Commission for the Arts, 1994).
Moreover, educators contend music education is a means for self expression that allows
students to connect with themselves and others, transform the environment of learning through
arts integration products, provide learning opportunities for the adults in the lives of students,
provide new challenges for students already considered successful, and connect learning
experiences to the world of real work. Most importantly, educators maintain that music
education can reach a number of students who are not being reached and in ways that students
are not otherwise being reached (Fiske, 2002).
The Virginia Commission for the Arts (VCA) and the Music Educators National
Conference (MENC) are a few state and national organizations that have presented literature in
support of music’s impact on academic achievement with claims that music students demonstrate
performance skills in academic subject areas that are 30 percent higher than performance skills
of students who did not study music. Morrison (1994) reported that high school sophomores who
participated in music reported higher grades in English, math, history, and science than those
2
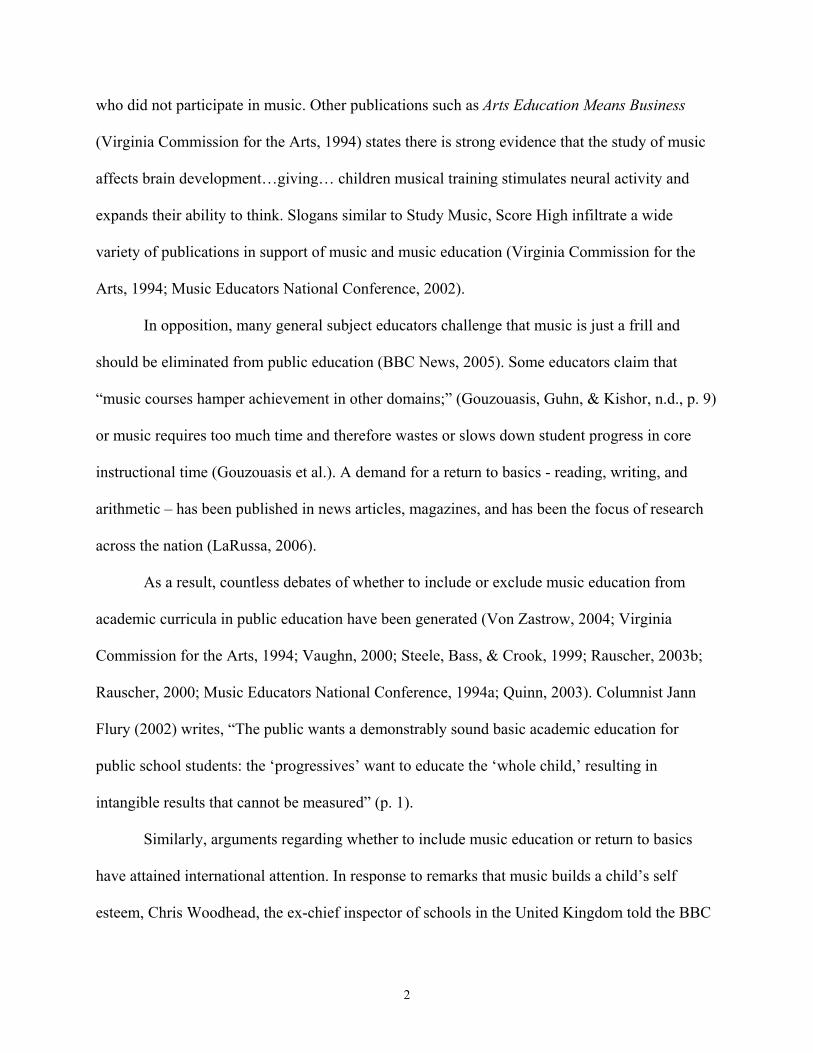
who did not participate in music. Other publications such as Arts Education Means Business
(Virginia Commission for the Arts, 1994) states there is strong evidence that the study of music
affects brain development…giving… children musical training stimulates neural activity and
expands their ability to think. Slogans similar to Study Music, Score High infiltrate a wide
variety of publications in support of music and music education (Virginia Commission for the
Arts, 1994; Music Educators National Conference, 2002).
In opposition, many general subject educators challenge that music is just a frill and
should be eliminated from public education (BBC News, 2005). Some educators claim that
“music courses hamper achievement in other domains;” (Gouzouasis, Guhn, & Kishor, n.d., p. 9)
or music requires too much time and therefore wastes or slows down student progress in core
instructional time (Gouzouasis et al.). A demand for a return to basics - reading, writing, and
arithmetic – has been published in news articles, magazines, and has been the focus of research
across the nation (LaRussa, 2006).
As a result, countless debates of whether to include or exclude music education from
academic curricula in public education have been generated (Von Zastrow, 2004; Virginia
Commission for the Arts, 1994; Vaughn, 2000; Steele, Bass, & Crook, 1999; Rauscher, 2003b;
Rauscher, 2000; Music Educators National Conference, 1994a; Quinn, 2003). Columnist Jann
Flury (2002) writes, “The public wants a demonstrably sound basic academic education for
public school students: the ‘progressives’ want to educate the ‘whole child,’ resulting in
intangible results that cannot be measured” (p. 1).
Similarly, arguments regarding whether to include music education or return to basics
have attained international attention. In response to remarks that music builds a child’s self
esteem, Chris Woodhead, the ex-chief inspector of schools in the United Kingdom told the BBC

3
Radio Today program, “The best way to develop self esteem is to teach children to read and
write, to add up and to know something about the world” (BBC News, 2005, p. 1). In addition,
under the guise of educational reform, Canada and the United States have run a parallel course.
Flury (2002) writes, “History clearly indicates that there is an undeclared war in progress
between the demigods of education and the unassuming taxpaying public. What is less clear, to
the uninitiated, is why the modern ’progressive’ educators’ aims are so different from that of
society” (p. 1).
As a means to comply with pleas for increased rigor, strict budget constraints, a return to
basics, and the music is a frill mentality, school divisions across the nation have severely cut or
eliminated music and other programs. A case in point occurred during the mid 1980s in
Oklahoma’s Empire School District where the school board’s decisions about the budget
weakened the community’s confidence. In December 1985, the board decided to eliminate a
significant number of positions and programs, among them, the music/band program. Other
school districts, such as Portland, Oregon, have been forced to consider layoffs, increased class
sizes, a shortened school year, and school closings. Many school divisions, similar to
Oklahoma’s Empire School District, have led to litigation and community outcry against school
boards (Quinn, 2003).
Nonetheless, it is difficult to determine the state of music education in the United States
given that obtaining reliable data regarding music courses is limited. According to Robert B.
Morrison, Chairman and C.E.O. for the Music for All Foundation, in many larger school
districts, there is a lack of an agreed upon definition for calculating and reporting music
education data. Therefore, it is challenging to determine basic information regarding student
enrollment in music courses and music offerings on a school-to-school basis or any comparable

4
data. However, the Board of Trustees of the organization has embarked on a multi-year effort to
find quantifiable data regarding access and participation in music education programs in public
schools (Music for All Foundation, 2004).
In a 2004 report entitled The Sound of Silence – The unprecedented decline of music
education in California public schools: A statistical review, published by the Music for All
Foundation, data were collected during the 1999–2000 academic year through the 2003–2004
academic year. Key findings include that during the period when the total California public
schools student population increased by 5.8%, the percentage of all California public school
students involved in music education courses declined by 50%. This decline is the largest of any
academic subject area (Music for All Foundation, 2004, p. 4).
Additional data indicate that actual student participation in music declined by 46.5%
representing a loss of 512,366 students. This decline is the largest of any academic subject area
by a factor of four. (Physical Education is second with a decline of 125,000 students representing
a drop of 5.2% of the total PE enrollment). The number of music teachers declined by 26.7%.
This represents an actual loss of 1,053 teachers (Music for All Foundation, 2004, p. 4).
Further key findings reveal that participation in general music courses (those courses
designed to bring basic music knowledge and skills to young students) declined by 85.8% with
the loss of 264,821 students. This represents over half of the total decline of participation in all
music courses. This is followed by declines in other music courses (- 48.5%, -103,783 students),
chorus (- 36.1%, - 57,905 students), band (- 20.5%, - 44,509 students), and instrumental lessons
(- 41.4%, - 39,792 students) (Music for All Foundation, 2004, p. 5).
Finally, data indicate when student participation declines are compared to other academic
subjects, music tops the list. The list in music participation (- 46.5%, -512,388 students) leads all
5
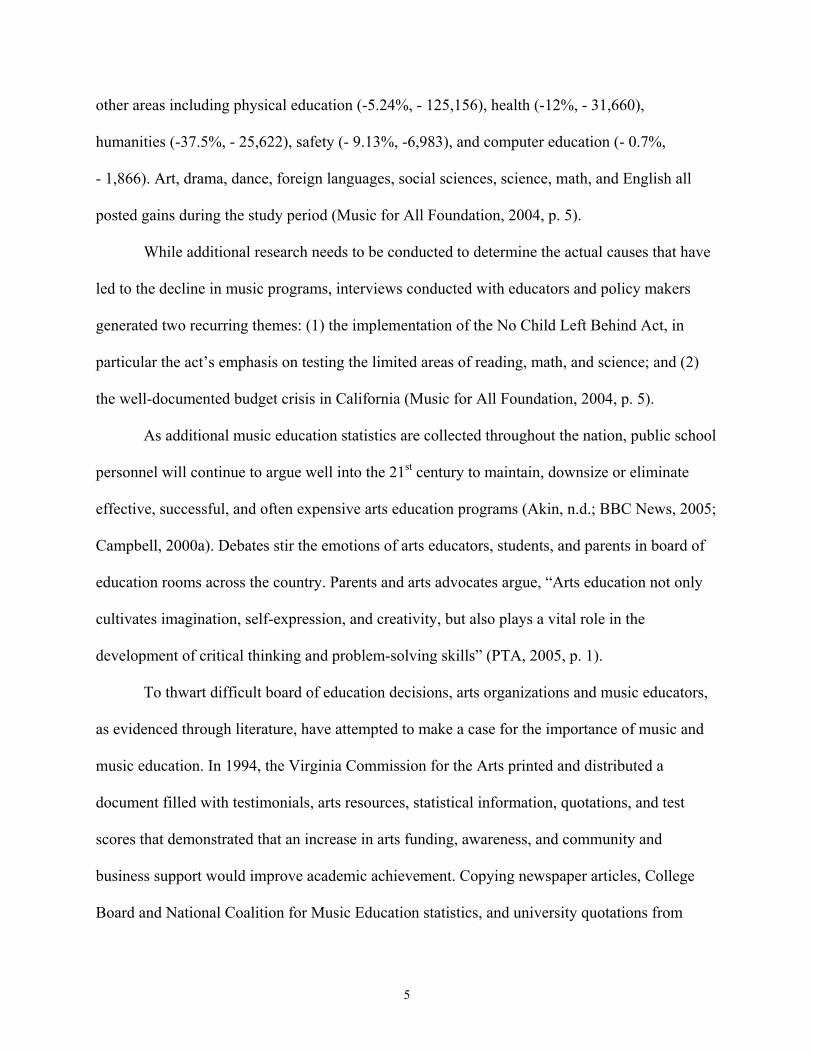
other areas including physical education (-5.24%, - 125,156), health (-12%, - 31,660),
humanities (-37.5%, - 25,622), safety (- 9.13%, -6,983), and computer education (- 0.7%,
- 1,866). Art, drama, dance, foreign languages, social sciences, science, math, and English all
posted gains during the study period (Music for All Foundation, 2004, p. 5).
While additional research needs to be conducted to determine the actual causes that have
led to the decline in music programs, interviews conducted with educators and policy makers
generated two recurring themes: (1) the implementation of the No Child Left Behind Act, in
particular the act’s emphasis on testing the limited areas of reading, math, and science; and (2)
the well-documented budget crisis in California (Music for All Foundation, 2004, p. 5).
As additional music education statistics are collected throughout the nation, public school
personnel will continue to argue well into the 21st century to maintain, downsize or eliminate
effective, successful, and often expensive arts education programs (Akin, n.d.; BBC News, 2005;
Campbell, 2000a). Debates stir the emotions of arts educators, students, and parents in board of
education rooms across the country. Parents and arts advocates argue, “Arts education not only
cultivates imagination, self-expression, and creativity, but also plays a vital role in the
development of critical thinking and problem-solving skills” (PTA, 2005, p. 1).
To thwart difficult board of education decisions, arts organizations and music educators,
as evidenced through literature, have attempted to make a case for the importance of music and
music education. In 1994, the Virginia Commission for the Arts printed and distributed a
document filled with testimonials, arts resources, statistical information, quotations, and test
scores that demonstrated that an increase in arts funding, awareness, and community and
business support would improve academic achievement. Copying newspaper articles, College
Board and National Coalition for Music Education statistics, and university quotations from

6
across the nation, Arts Education Means Business attempts to provide evidence in support of
music education (Virginia Commission for the Arts, 1994).
In one reported statistic, the Virginia document (1994) states from the California School
Boards (1990, September), “Students who [studied] the arts demonstrate performance skills in
academic subject areas that [were] 30 percent higher than the performance skills of students who
[did] not study the arts” (Virginia Commission for the Arts, p. 2). Furthermore, it asserts, “Test
scores in reading, vocabulary and writing doubled at Anza High School in Los Angeles,
California, following the school’s three-year participation in The Getty Center’s Discipline-
Based Arts Education Pilot Program. The school now has the highest scores in the district”
(Virginia Commission for the Arts, p. 2).
Are these claims simply a defense by music educators to maintain job security or does the
study of music significantly impact student achievement? If the study of music does increase
academic achievement in core subjects, is there a causal or correlational relationship between
music education and academic success? Does music education have extensive possibilities that
reach deep within the soul of public education?
According to statistical information reported by The College Board, music instruction has
a significant impact on academic achievement. National reports on test-taking trends for college-
bound seniors taking the Scholastic Achievement Tests I (SAT) have consistently shown that
twelfth grade college-bound music students out perform non-music students on the verbal and
math sections of the examination.
Likewise, state reports reveal similar results for music and non-music college-bound
seniors throughout the country (The College Board, 1998a; The College Board, 2000b; and The
College Board, 2005a).
7
440460
480500
520540560
Verbal Mean Scores
1998 2000 2005
Academic Year
Music: Study or Appreciation
Music Performance
No Music Course Work
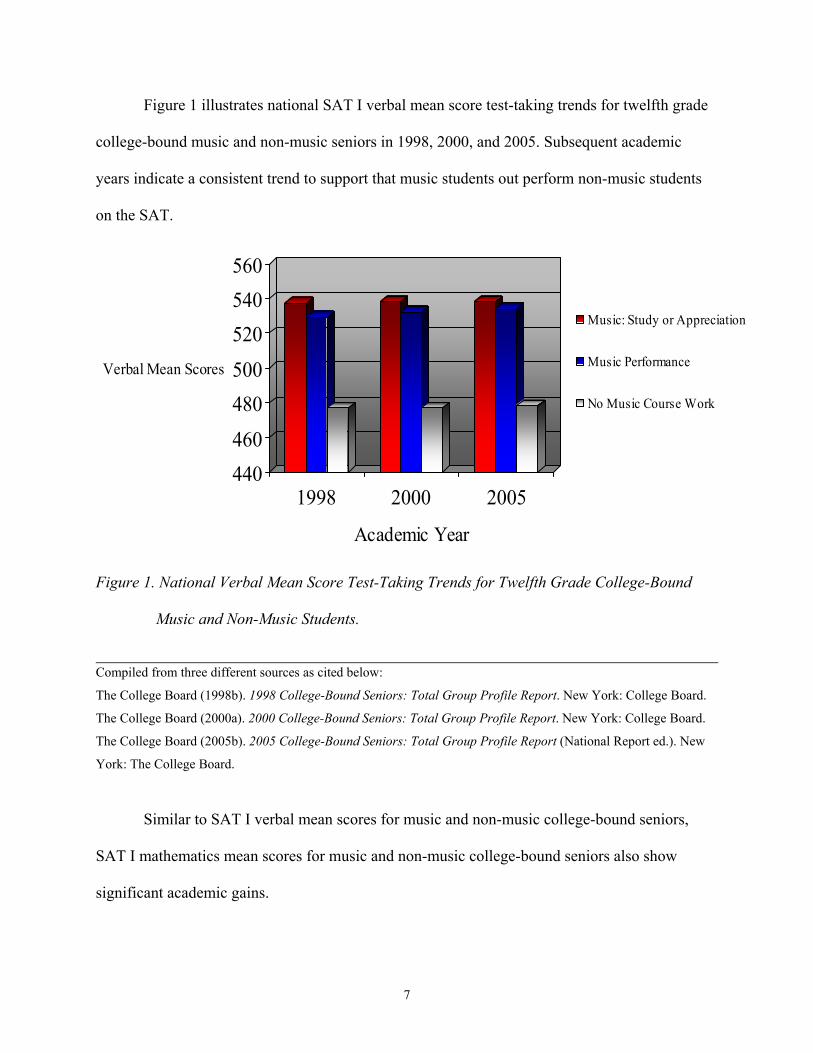
Figure 1 illustrates national SAT I verbal mean score test-taking trends for twelfth grade
college-bound music and non-music seniors in 1998, 2000, and 2005. Subsequent academic
years indicate a consistent trend to support that music students out perform non-music students
on the SAT.
Figure 1. National Verbal Mean Score Test-Taking Trends for Twelfth Grade College-Bound
Music and Non-Music Students.
Compiled from three different sources as cited below:
The College Board (1998b). 1998 College-Bound Seniors: Total Group Profile Report. New York: College Board.
The College Board (2000a). 2000 College-Bound Seniors: Total Group Profile Report. New York: College Board.
The College Board (2005b). 2005 College-Bound Seniors: Total Group Profile Report (National Report ed.). New
York: The College Board.
Similar to SAT I verbal mean scores for music and non-music college-bound seniors,
SAT I mathematics mean scores for music and non-music college-bound seniors also show
significant academic gains.
8
440
460
480
500
520
540
560
Math Mean Score
1998 2000 2005
Academic Year
Music: Study or Appreciation
Music Performance
No Music Course Work
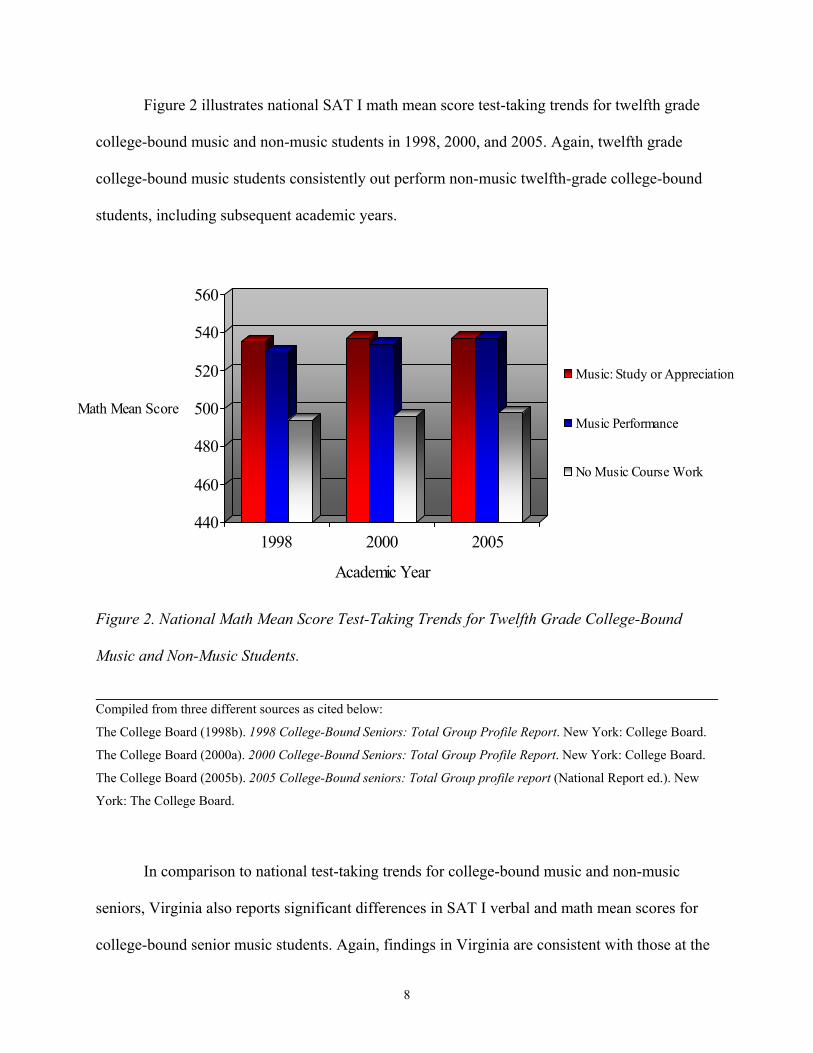
Figure 2 illustrates national SAT I math mean score test-taking trends for twelfth grade
college-bound music and non-music students in 1998, 2000, and 2005. Again, twelfth grade
college-bound music students consistently out perform non-music twelfth-grade college-bound
students, including subsequent academic years.
Figure 2. National Math Mean Score Test-Taking Trends for Twelfth Grade College-Bound
Music and Non-Music Students.
Compiled from three different sources as cited below:
The College Board (1998b). 1998 College-Bound Seniors: Total Group Profile Report. New York: College Board.
The College Board (2000a). 2000 College-Bound Seniors: Total Group Profile Report. New York: College Board.
The College Board (2005b). 2005 College-Bound seniors: Total Group profile report (National Report ed.). New
York: The College Board.
In comparison to national test-taking trends for college-bound music and non-music
seniors, Virginia also reports significant differences in SAT I verbal and math mean scores for
college-bound senior music students. Again, findings in Virginia are consistent with those at the

9
440
460
480
500
520
540
560
Verbal Mean Scores
1998 2000 2005
Academic Year
Music: Study or Appreciation
Music Performance
No Music Course Work
national level in the selected sample academic years and in subsequent academic years (The
College Board, 1998a; The College Board, 2000b; and The College Board, 2005a). Figure 3
illustrates Virginia SAT I test-taking trends using verbal mean scores in 1998, 2000, and 2005
for college-bound twelfth grade music and non-music students.
Figure 3. Virginia Verbal Mean Score Test-Taking Trends for Twelfth Grade College-Bound
Music and Non-Music Students.
Compiled from three different sources as cited below:
The College Board (1998a). 1998 College-Bound seniors: State profile report (Virginia ed.). New York: College Board SAT.
The College Board (2000b). 2000 College-Bound seniors: State profile report (Virginia ed.). New York: College Board SAT.
The College Board (2005a). 2005 College-Bound seniors: State profile report (Virginia ed.). New York: College Board SAT.
Consistent to national and Virginia verbal mean score test-taking trends for twelfth grade
music and non-music college-bound seniors, Figure 4 illustrates Virginia SAT I test-taking
trends using math mean scores in 1998, 2000, and 2005 for twelfth grade college-bound music
and non-music students. Again, twelfth grade college-bound music students consistently out

10
470
480
490
500
510
520
530
540
Math Mean Score
1998 2000 2005
Academic Year
Music: Study or Appreciation
Music Performance
No Music Course Work
perform non-music twelfth-grade college-bound students. This trend is consistent in subsequent
academic years in addition to the selected sample academic years.
Figure 4. Virginia Math Mean Score Test-Taking Trends for Twelfth Grade College-Bound
Music and Non-Music Students
Compiled from three different sources as cited below:
The College Board (1998b). 1998 College-Bound Seniors: Total Group Profile Report. New York: College Board.
The College Board (2000a). 2000 College-Bound Seniors: Total Group Profile Report. New York: College Board.
The College Board (2005b). 2005 College-Bound seniors: Total Group profile report (National Report ed.). New
York: The College Board.
Music Education in the United States
Music education in North America can be traced to the colonies of the seventeenth
century. In the South, however, there existed no organized music education program. This
tradition played a major role in the transmission of music. In other parts of the new world, music
was already an important activity in the lives of the Northern colonists, namely the pilgrims. The
Bay Psalm Book provided methods for using syllables to denote tones of the musical scale along

11
with performance instruction. Thus Northern colonists could succeed in teaching themselves
rudimentary music skills, as related to psalm singing (Wikipedia, n.d.).
According to the Music Educators National Conference (MENC), there are many
personal benefits to participating in music education including confidence, self-esteem, and a
sense of accomplishment (Music Educators National Conference, 2002). It shapes and molds
character with self-assurance and stability; and has the added bonus of public performance which
helps to conquer the fear of getting up in front of people. Furthermore, learning a musical
instrument fosters good habits such as focus, mental discipline, staying with a task until its
completion and it allows for the expression of emotions (Music Educators National Conference,
1994a).
Music instruction comprises the application of educational methods in teaching music.
Specifically, the inclusion of music education encompasses many areas of instruction, including
music history, music theory, and proficiency in a musical instrument, singing skills, and general
music skills.
From preschool to postsecondary education, music education is common in North
America and Europe. Distinctively, involvement in music is thought to teach basic skills such as
concentration, counting, listening, self-discipline and cooperation. In addition, music education
is thought to promote understanding of language, improve the ability to recall information, foster
creativity, and create an environment more conducive to learning in other areas (Music
Educators National Conference, 1994b).
For much of its existence, standards for teaching music in the United States were
determined locally or by individual teachers. In the late 20th century, there was a significant
move toward regional and national standards. The Music Educators National Conference

12
(MENC), the national association for music education, created nine content standards called the
National Standards for Music Education. This document, adopted in 1994, includes the
following music standards:
1. Singing: alone and with others, a varied repertoire of music.
2. Performing on instruments, alone and with others, a varied repertoire of music.
3. Improvising melodies, variations, and accompaniments.
4. Composing and arranging music within specified guidelines.
5. Reading and notating music.
6. Listening to, analyzing, and describing music.
7. Evaluating music and music performances.
8. Understanding relationships between music, the other arts, and disciplines
outside the arts.
9. Understanding music in relation to history and culture.
(Music Educators National Conference, 1994a)
Many states and school districts have adopted their own standards for music education.
Frequently, local standards are developed in some form from the National Standards. For
instance, the state of Florida has adapted the National Standards to form the Sunshine State
Standards. In either case, the document sets grade-level expectations for music students from
pre-kindergarten through twelfth grade (Music Educators National Conference, 1994a).
In elementary schools, children often learn to play instruments such as the recorder, sing
in small choirs, and learn about the history of Western art and music. In primary and secondary
schools, students may have the opportunity to perform in some type of musical ensemble,

13
including choir, concert band, marching band, jazz band, or orchestra (Music Educators National
Conference, 1994b).
At the university level, students in most arts and humanities courses can receive credit for
enrolling in music classes. Typically, these courses take the form of a historical overview of
music or a music appreciation course that focuses on listening to and learning about different
musical styles. Most North American and European universities have some type of music
ensemble in which non-music students are able to participate. Performance based courses
including choir, concert band, marching band, or orchestra serve not only an instructional
purpose, but as a positive community and public relations tool for sponsoring organizations
(Music Educators National Conference, 1994a).
The study of Western music is increasingly common in music education outside the
United States and Europe. The Asian nations of South Korea, Japan, and China are consistently
breaching the history of Western civilization to expand existing music programs. At the same
time, Western universities and colleges are widening their curricula to include music of non-
Western cultures, including the music of Africa, Eastern Asia, and countries in the Southern
hemisphere (Music Educators National Conference, 1994b).
Some schools and organizations encourage the integration of arts classes such as music
with other content areas. Using music as a prism for increased learning, students discover and
explore other subjects such as English, mathematics, social studies, and science. It is thought that
by combining different curricula, students are able to connect content areas and important
concepts, thus, enhancing the quality of education (Music Educators National Conference,
1994a).
14
Some examples of arts integration programs are the Kennedy Center’s Changing
Education Through the Arts program (CETA), The GRAMMY Foundation’s Leonard Bernstein
Center for Learning – Artful Learning: A School Reform Model, the Children's Music Workshop
Swap With Arts Program, and others. CETA defines arts integration as finding a natural
connection between one or more art forms. Therefore, infusing dance, theatre arts, music, visual
arts, storytelling, puppetry, or creative writing with other curricular areas is a means to teach and
assess objectives in both the art form and other subject areas. This allows a simultaneous focus
on creating, performing, and responding to the arts while addressing content in other subject
areas (Music Educators National Conference, 1994a).
Statement of the Problem
In 1971, the average elementary school student received two hours of music instruction a
week. However, over the last several decades governmental agencies, through No Child Left
Behind (NCLB) and stringent local and state standards in addition to limited budgets, have
demanded increased standardized test scores, stricter student and teacher accountability, greater
academic rigor, improved literacy, an increase in teacher quality, and better math and science
instruction in public education. As a result, thirty-one years later, the average elementary school
student in Chicago received 45 minutes of weekly instruction in music (Rabkin & Redmond,
2004).
As boards of education across the United States struggle to abide by mandated guidelines
or risk the loss of appropriated funding, music education programs continue to be closely
monitored for their role, effectiveness, and monetary value in public schools (NCLB n.d.;
LaRussa, 2006; Music Educators National Conference, 1994; and National Arts Education
Consortium, n.d.). Consequently, music education has been comprehensively eroded in low-

15
income districts, but is better established in affluent districts. Rabkin and Redmond (2004)
suggest this notion is an “enormous ‘arts gap’ in American education” (p. 12). Although the
1990s saw vigorous efforts to reverse the long-term decline of music education, some of those
efforts were quite ambitious and sensitive to the broad currents of school reform (Rabkin &
Redmond, 2004).
Music advocates are convinced that instruction in music can help children learn in school.
Moreover, music advocates believe that music has increased value for academic achievement for
all students. In order to bring about a statewide and national implementation of music education
in the general curriculum, legislatures and other school policy makers must also be convinced of
its value (Akin, n.d.).
Educational research demonstrates the positive effect of music curriculum in developing
academic achievement skills (Akin, n.d.). Thus, music advocates, building on actual practices of
contemporary music projects, are hopeful that music education can become available to more
students, more schools, more districts, and more communities, even in the current climate of high
stakes testing and accountability (Rabkin & Redmond, 2004). Consequently, the purpose of this
study is to provide both music and non-music educators additional information regarding the
impact of music education on academic achievement in public education.
Conceptual Model
In the Commonwealth of Virginia, comprehensive public school students are mandated
by the Department of Education to enroll in and successfully complete subjects in certain courses
including English, mathematics, science, and social studies. At the secondary school level, a
variety of elective courses are available from which students may choose based upon individual
interests. For instance, in the Commonwealth of Virginia, students may enroll in elective courses

16
beginning at the sixth grade level. Students may continue the elective courses in one subject area
through their secondary education or they may vary the focus of elective selections.
In music education, instrumental students in the sample school district may elect to enroll
in band or orchestra beginning in grade six and continue participation through grade twelve.
Vocal music students may enroll in a nine-week exploratory music program in grade six and start
vocal music instruction in grade seven. Other students may elect to enroll in a sixth grade
exploratory music program and start vocal or instrumental music in grade seven.
Still others may elect to enroll in vocal music or in instrumental music instruction in
grade nine, although unlikely depending on past musical experience and instrumental music
course objectives. Regardless of the individual student’s interests, initial enrollment date, and the
prescribed music course timeline, all music courses are academically sequential in which one
concept builds upon another in consecutive years and culminate at the highest level of instruction
in grade twelve (Virginia Department of Education, 2006a).
Band music consists of instruments in the brass, percussion, and woodwind families.
Stringed instruments (violin, viola, cello, and string bass) are included in the orchestra. Other
instruments such as guitar and piano are offered at a number of high schools across the
Commonwealth (Virginia Department of Education, 2000). For the purpose of this study, all high
school (grades nine through twelve) performance based and academic music courses such as
music composition will be included in regards to their impact on academic achievement as
measured by grade twelve weighted cumulative grade point average.
As students enter the high school setting, they bring with them variables related to their
background. Background variables include gender, ethnicity, and middle school vocal music or
instrumental music instruction, or no middle school music instruction. As students progress

17
through four years of the high school curriculum toward graduation, all students are required to
take four years of English in addition to Department of Education prescribed courses in
mathematics, science, social studies, foreign language (optional), fine or practical arts, and a
variety of electives (Virginia Department of Education, 2000). These background variables may
impact academic achievement at varying levels of secondary school instruction.
In the Commonwealth of Virginia, grade 11 public high school students must take two
semesters of course work and successfully pass end-of-course Standards of Learning (SOL) tests
to include English: Reading/Literature and Research and English: Writing. In addition, in order
to receive a high school diploma, end-of-course SOL tests in science, social studies, and
mathematics must be successfully completed before the intended graduation date. In some cases,
mathematics courses are available for students at the middle school level. These courses carry a
high school credit and count toward academic units needed for graduation (Virginia Department
of Education, 2000).
A conceptual model of a comprehensive high school student who elects to take vocal music,
instrumental music, a combination of vocal and instrumental music, or no music instruction is
presented in Figure 5. Music and non-music students are classified as follows: vocal music students
with four or more years of vocal music instruction = VMusic-4; vocal music students with three to
three and one-half years of vocal music instruction = VMusic-3; vocal music students with two to
two and one-half years of vocal music instruction = VMusic-2; vocal music students with one to one
and one-half years of vocal music instruction = VMusic-1; and students with one-half (one semester)
or no vocal music instruction = VMusic-0.

18
Comprehensive High School4 Years (Grades 9-12)
Vocal Music VMusic-4, VMusic-3,
VMusic-2 or VMusic-1
Instrumental Music IMusic-4, IMusic-3,
IMusic-2 or IMusic-1
No Music VMusic-0, IMusic-0 or
[VIMusic-0]
Band • Brass • Percussion • Woodwinds
Orchestra • Violin • Viola • Cello • String Bass
Background Variables • Gender • Ethnicity
Combination Vocal and Instrumental VIMusic-4, VIMusic-3, VImusic-2 or VIMusic-1
• Grade Twelve Weighted Cumulative Grade Point Average • Number of Absences in Grade Twelve • Number of Discipline Referrals in Grade Nine through Grade Twelve
Other • Composition • Guitar • Piano
Figure 5. Conceptual Model of Music and Non-Music Students Using Designated Academic
Achievement Measures, Number of Absences, and Number of Discipline Referrals.

19
Similarly, instrumental students are classified as follows: instrumental music students
with four or more years of instrumental music instruction = IMusic-4; instrumental music
students with three to three and one-half years of instrumental music instruction = IMusic-3;
instrumental music students with two to two and one-half years of instrumental music instruction
= IMusic-2; instrumental music students with one to one-half years of instrumental music
instruction = IMusic-1; and instrumental music students with one-half year or no instrumental
music instruction = IMusic-0. Students who may have taken a combination of vocal music and
instrumental music in high school are represented by VIMusic-4, VIMusic-3, VIMusic-2, and
VIMusic-1.
The model reflects the final element from which academic achievement is measured -
weighted cumulative grade point average (GPA) at the end of grade twelve. Weighted
cumulative grade point average (GPA) will be used to measure academic achievement regardless
of a student’s elective course choices (music or no music).
Significance of the Study
The impact of participation in music education on academic achievement has been the
central focus of research for many years as evidenced in the review of literature. On the other
hand, Hodges and O’Connell (n.d.) state that few studies have attempted to argue that education
in music can boost test scores, attendance, attitudes toward school, and overall academic
achievement and only five experimental studies have been identified that tested the effects of
music instruction on academic achievement. Three of the five obtained results indicating that
music instruction did have a positive effect on academic achievement (p. 2.5). However, a small
number of studies have included variables such as gender or race, most have not.
20
Research literature is nearly evenly divided between studies in which a high degree of
relationship was reported and those in which a low or negligent relationship was found (Hodges
& O'Connell, n.d.).
Most recently, music education impact studies have been conducted due, in part, to
higher student and teacher accountability, increasing budget cuts, the federal No Child Left
Behind Act (NCLB), and stringent state standards of learning (Music for All Foundation, 2004).
These studies have attracted considerable interest to many in both the music education
community and the general education community (Music for All Foundation).
There is increasing interest in determining whether music instruction would impact
reading skills as evidence in research by Rabkin and Redmond (2004), Mavrogenes & Bezrucko
(1994), Koppelman & Imig (1995), Jensen (2001), Ingram & Reidel (2003), and Hood-Mincey
(2005). However, most literature has focused on elementary school children (Hodges &
O'Connell, n.d.). Additionally, it is possible that participating in music education can improve
students’ understanding of mathematics which, in turn, results in improved mathematics
achievement scores (Hodges & O'Connell, n.d.).
Hodges and O’Connell (n.d.) report the subject of mathematics is generally taught in
isolation from other subjects and often lacks any creative or artistic flair (p. 2.11). Students often
become bored and do not pay attention in class, resulting in lower test scores. However, there is a
connection between music and mathematics; both subject areas use numbers, repeating patterns
and ratios (Vaughn, 2000). However, as in reading, most research literature has focused on
elementary school students.
Data have indicated that students who had studied an instrument prior to fourth grade had
higher scores in mathematics achievement than did students in other groups (Hodges &

21
O'Connell, n.d.; Rauscher, 1999). More importantly, a review of the literature will reveal
significance in the integration of the arts, specifically music.
Eisner (1998) states what is needed more than correlations or statistically significant
differences between groups are a theory that links experience in the arts with academic
achievement (p. 56). Integration is felt to be critical for the development of a whole person.
Eisner has outlined a number of ways this can be done, including:
1. Students should acquire a feel of what it means to transform their idea, images,
and feelings into an art form.
2. Arts education should refine the student’s awareness of the aesthetic qualities in
art and life.
3. Arts education should enable students to understand that there is a connection
between the content and form that the arts display and the culture and time in
which the work was created (p. 57 - 59).
Finally, Eisner (1998) identifies a particularly important set of outcomes for arts
education. “This one pertains to dispositions that are difficult to assess, let alone measure,
but they are dispositional that appear to be cultivated through programs that engage
students in the process of artistic creation” (p. 58). Eisner speaks of dispositional
outcomes such as the following:
1. A willingness to imagine possibilities that are not now, but which might become.
2. A desire to explore ambiguity, to be willing to forestall premature closure in
pursuing resolutions.
3. The ability to recognize and accept the multiple perspectives and resolutions that
work in the arts celebrate (p. 58 – 59).

22
Purpose of the Study
The purpose of this study is to investigate the impact of music participation on academic
achievement, specifically on grade twelve weighted cumulative grade point average. This
investigation includes students with 4 or more years, 3 to 3.5 years, 2 to 2.5 years, and 1 to 1.5
years of vocal or instrumental music instruction; students not participating in instrumental or
vocal music instruction; and students that may have been enrolled in a combination of vocal and
instrumental music courses in grades nine through twelve. In addition, this study examines the
impact of participation in music on the number of absences in grade twelve and the number of
discipline referrals in grades nine through twelve.
Conclusions were drawn based on the analysis of data to determine the long-term impact
that music, specifically the number of years enrolled in music instruction, has on grade twelve
attendance rates as determined by the number of absences in grade twelve; on student conduct as
determined by the number of discipline referrals in grade nine through grade twelve; and on
academic achievement as determined by grade twelve weighted cumulative grade point average.
Research Questions
The research questions for this study are:
1. Is there a statistically significant difference in academic achievement as measured
by grade twelve weighted cumulative grade point average, attendance rate as
measured by the number of absences in grade twelve, and student conduct as
measured by the number of discipline referrals in grade nine through grade twelve
among the population with respect to subject and number of years in which a
student participates in formal music courses or in no formal music courses?

23
2. Is there a statistically significant difference in academic achievement as measured
by grade twelve weighted cumulative grade point average, attendance rate as
measured by the number of absences in grade twelve, and student conduct as
measured by the number of discipline referrals in grade nine through grade twelve
among the population with respect to gender and participation in formal music
courses or in no formal music courses?
3. Is there a statistically significant difference in academic achievement as measured
by grade twelve weighted cumulative grade point average, attendance rate as
measured by the number of absences in grade twelve, and student conduct as
measured by the number of discipline referrals in grade nine through grade twelve
among the population with respect to ethnicity and participation in formal music
courses or in no formal music courses?
4. Is there a statistically significant difference in academic achievement as measured
by grade twelve weighted cumulative grade point average, attendance rate as
measured by the number of absences in grade twelve, and student conduct as
measured by the number of discipline referrals in grade nine through grade twelve
among the population with respect participation in formal music courses or in no
formal music courses?
Definition of Terms
An understanding of the following terminology is essential to readers of this study. The
terms are defined as they relate to the topic of this paper.
1. Formal music education: the practice of teaching music in public school using
established criteria and curricula; usually teacher directed (Jaffers, 2006).

24
2. Mozart Effect: A challenged set of research results that indicate that listening to
certain kinds of complex music may induce a short-lived (fifteen minutes)
improvement on the performance of certain kinds of mental tasks known as
spatial-temporal reasoning. Popularized versions of the theory, which suggest that
listening to Mozart makes you smarter, or that early childhood exposure to
classical music has a beneficial effect on mental development (Rauscher & Shaw,
1998).
3. Core Subjects: English/language arts, mathematics, science, and social
studies/history courses taught in K – 12 public schools (NCLB, n.d.).
4. Cumulative Grade Point Average: A weighted numerical average (on a 4-point
scale) of grades students receive from all high school credit bearing courses. The
cumulative grade point average is computed by dividing the aggregate total of
quality points by the total number of courses attempted (Sampled School District,
2001a).
5. Number of Absences: The total number of days a student is absent from school in
grade twelve including excused, unexcused absences, and field trips (Sampled
School District, 2001b).
6. Number of Discipline Referrals: The total number of times a student is sent to an
administrator by the classroom teacher or designated school personnel due to an
infringement of school rules or regulations in grade nine through grade twelve
(Sampled School District, 2001c).
7. Standards of Learning – SOL Tests: Statewide tests administered to students in
Virginia upon completion of designated course work. Students are required to
25
take End-of-course English: Reading/Literature and Research and End-of-course
English: Writing SOL tests; and Mathematics: End-of-course Algebra I at the
conclusion of the designated course (Virginia Department of Education, n.d.b).
8. Secondary School: A school classified as secondary by state practice and
composed of any span of Grades 7-12. Junior high schools, middle schools and
senior high schools are included. Generally refers to the years of formal education
preceding entry into a college or University. A school for students intermediate
between elementary school and college; usually grades 9 to12 (Virginia
Department of Education, n.d.a).
9. Music Education: comprises the application of education methods in teaching
music (Virginia Department of Education, n.d.b).
10. Instrumental Music: comprised of music composed for or performed on a musical
instrument. Instrumental music is intended to be performed by a musical
instrument or group of instruments. Instrumental music is music produced by
playing a musical instrument (Virginia Department of Education, n.d.b).
11. Vocal Music: comprised of music composed or arranged for or sung by the
human voice. Vocal music is intended to be performed by one or more singers,
usually with instrumental accompaniment. A vocal selection is a music selection
that is vocalized (as contrasted with instrumental music). A vocal selection is
music intended for performance mainly by singers or other vocalists. Other
musical instruments may be involved, but the choir is the main focus of the piece.
Examples of vocal music include choral music, yodeling, Sacred Harp, and
Barbershop (Virginia Department of Education, n.d.b).

26
12. IMusic-4: Students enrolled in instrumental music (band, guitar, piano, orchestra
or composition) for four or more years and in the same school district from grade
9 through grade 12.
13. IMusic-3: Students enrolled in instrumental (band, guitar, piano, orchestra or
composition) for three to three and one-half years and in the same school district
from grade 9 through grade 12.
14. IMusic-2: Students enrolled in instrumental music (band, guitar, piano, orchestra
or composition) for two to two and one-half years and in the same school district
from grade 9 through grade 12.
15. IMusic-1: Students enrolled in instrumental music (band, guitar, piano, orchestra
or composition) for one to one and one-half years and in the same school district
from grade 9 through grade 12.
16. IMusic-0: Students enrolled in instrumental music one-half year or are non-music
participants in the same school district from grade 9 through grade 12. These
students graduated from high school in 2006.
17. VMusic-4: Students enrolled in vocal music for four or more years and in the
same school district from grade 9 through grade 12.
18. VMusic-3: Students enrolled in vocal music for three to three and one-half years
and in the same school district from grade 9 through grade 12.
19. VMusic-2: Students enrolled in vocal music for two to two and one-half years and
in the same school district from grade 9 through grade 12.
20. VMusic-1: Students enrolled in vocal music for one to one and one-half years and
in the same school district in grade 9 through grade 12.
27
21. VMusic-0: Students enrolled in vocal music for one-half year or are non-music
participants in the same school district from grade 9 through grade 12. These
students graduated from high school in 2006.
22. VIMusic-4: Students enrolled in a combination of vocal and instrumental music
for four or more years and in the same school district in grade 9 through grade 12.
23. VIMusic-3: Students enrolled in a combination of vocal and instrumental music
for three years and in the same school district in grade 9 through grade 12.
24. VIMusic-2: Students enrolled in a combination of vocal and instrumental music
for two years and in the same school district in grade 9 through grade 12.
25. VIMusic-1: Students enrolled in a combination of vocal and instrumental music
for one year and in the same school district in grade 9 through grade 12.
Limitations and Delimitations of the Study
This study is limited to high school music students in one urban school district in
Southeastern Virginia. Several limitations within the research design reduce the ability to
generalize the results to a population other than the one studied.
First, it is important to note that music students are self selected. Although research
variables are confined to instrumental music (band, guitar, piano, orchestra, and composition)
and vocal music, the researcher has no control over which music course or instrument the subject
may choose. However, other instruments other than those listed are not included in this study.
Similarly, the researcher has no control over student course selection (music or core
areas) other than the state prescribed courses or over content teacher assignments. Further
research is required to determine the individual affects a particular teacher may have on the
academic success of a given student.

28
Second, the studied school district has an open access policy for all its courses. If a
student has an interest in a course, enrollment in that course is not denied. Since there are
minimal costs for participation in music courses such as instrument and uniform rental fees, no
student is refused membership due to financial hardship. Therefore, poverty is not an issue.
Third, the impact of music on academic achievement are restricted to present day
available data such as grade twelve weighted cumulative Grade Point Average, regardless of
whether it is specifically music instruction, music integrated in the curriculum or the use of
background music in general education classrooms.
Most importantly, the impact of individual music teachers has been completely neglected.
Hodges and O’Connell (n.d.) state that simply testing the affects of a given form of music
instruction without taking into account the characteristics of the teacher is short sighted. There is
the possibility that excellent teachers who are enthusiastic and who relate well to students may
make a greater difference in educational outcomes than the particular methodology used (p.
2.21). However, the reverse is also true.
Furthermore, the researcher acknowledges the influence of outside sources such as
private music lessons, church affiliations, and other variables. These variables may be prevalent
in determining academic achievement in core subjects. However, for the purpose of this study,
literature was contained to the impact of music education on academic achievement in core
subjects as it relates to public schools.
Fourth, although weighted courses (i.e. Honors, International Baccalaureate) are
accounted for in the study, cumulative grade point averages may affect outcomes. However,
differences in weighted courses or non-weighted courses and participation or non-participation in
music courses is not the focus of this study.
29
Finally, the researcher’s past experiences as a high school choral director and music
administrator are prevalent. To control for bias, the researcher purposefully chose a quantitative
study to gather existing data for analysis. Reported data are a result of sophisticated statistical
equations and analysis.
Organization of the Study
A five-chapter dissertation format is used to organize the study. Chapter One establishes
the context for the study. In addition, the chapter includes a brief history of music education in
the United States; the statement of the problem; the conceptual model; the significance of the
study; the research questions, and definitions for terms used in the study.
Chapter Two contains an extensive review of literature that is relevant to the study.
Chapter Two is divided into five domains: The Impact of Music on the Brain – The Mozart
Effect; Music Education and Elementary School Academic Achievement; Music Education and
Secondary School Academic Achievement; Integrating Music Education in Core Subjects and
Academic Achievement; and Elements of an Effective Music Education Program that Impact
Academic Achievement.
Chapter Three outlines the methodology applied in the investigation including
population, instrumentation issues, and procedures used to collect and analyze data.
Chapter Four reports the results of the study. The first section includes: background
information related to the study; the four research questions and null hypotheses; information on
data collection procedures; a review of utilized instrumentation; and techniques employed in data
analysis. The second section includes descriptive statistics, correlations, analysis of variance
(ANOVA), and regression for the entire study population, the music population, and the non
music population using the three dependent variables: (1) grade twelve weighted cumulative

30
grade point average; (2) number of absences in grade twelve; and (3) number of discipline
referrals in grade nine through grade twelve. Utilizing the four independent variables: (1) number
of years enrolled in formal music or no formal music courses; (2) gender; (3) ethnicity; and (4)
formal music courses or no formal music courses, the three dependent variables are presented to
address the research questions and null hypotheses. Data tables are presented.
The final section of Chapter Four includes data tables for each research question and null
hypotheses. For the reason that there is a significant amount of data, each research question and
corresponding data tables are presented.
In conclusion, Chapter Five consists of a discussion of Chapter Four results and their
implication for future practice and research. In addition, recommendations for practice and future
studies are presented.
31
CHAPTER TWO
REVIEW OF RELATED LITERATURE
Review of the Literature
The review of literature in this chapter contains information regarding the impact of
music education on academic achievement in core subjects and related topics which resulted in
the selected domains. A number of databases, including Wilson Web, ERIC, and Electronic
Thesis and Dissertations were utilized to collect information for the analysis of literature.
Studies, articles, and other publications were limited to significant and relevant material that
started with the Rauscher, Shaw, and Ky experiment which resulted in The Mozart Effect.
The review of literature revealed five self-selected domains: (1) The Impact of Music on
the Brain – The Mozart Effect; (2) Music Education and Elementary School Academic
Achievement; (3) Music Education and Secondary School Academic Achievement; (4)
Integrating Music Education in Core Subjects and Academic Achievement; and (5) Elements of
an Effective Music Education Program that Impact Academic Achievement.
For the purpose of this review, the first domain will consist of literature relating to music
education and brain research. The second domain will reveal studies from preschool through
grade five. Studies related to grades six through twelve and post high school education frame the
third domain. The final two domains will encompass a wide range of grade levels and related
materials.
Please note that the researcher in the current study acknowledges the influence of outside
sources such as private music lessons, church affiliations, and other variables. These variables
may be prevalent in determining academic achievement in core subjects. However, for the
32
purpose of this study, literature will be contained to the impact of music education on academic
achievement in core subjects as it relates to public schools.
The Impact of Music on the Brain – The Mozart Effect
Historical Perspective
A number of studies have been completed regarding the brain and the effects of music on
brain stimulation and brain development. However, the impact and importance of music
education contention was fueled in 1991 when the concept Mozart Effect was described by Dr.
Alfred Tomatis, a French physician who has devoted his life over the past fifty years to the
physiological effects of sound (Campbell, 2000b), in his book Pourquoi Mozart? Dr. Tomatis
explored the “broad applicability of Mozart in particular in achieving results” (Wikipedia.org.
n.d., p. 1) during his work with primarily learning disabled children.
The phrase, Mozart Effect, came to the United States in 1993 and gained wide media
attention when a paper entitled Music and spatial task performance by researchers Frances
Rauscher, Gordon Shaw, and Katherine Ky at the University of California at Irvine was
published in Nature, Volume 365 (Rauscher, Shaw, & Ky, 1993). In 1992, Dr. Rauscher and her
fellow researchers began experimentation on the effect of music on the brain.
Rauscher et al. found in simulations that the way nerve cells were connected to one
another predisposed groups of cells to adopt certain specific firing patterns and rhythms. They
hypothesized: “If brain activity can sound like music, might it be possible to begin to understand
the neural activity by working in reverse and observing how the brain responds to music? Might
patterns in music somehow stimulate the brain by activating similar firing patterns of nerve
clusters?” (Anderson, 2000, p. 3; Rauscher & Shaw, 1998).

33
Rauscher, Shaw, and Ky turned the output of their investigations into sounds instead of a
conventional printout. To their astonishment, the rhythmic patterns sounded somewhat familiar,
with some of the same characteristics found in baroque, new age, or Eastern music (Anderson,
2000; Rauscher & Shaw, 1998). As they continued their investigation, Rauscher et al. assigned
36 college students to one of three groups and offered the same pretest to each of the students.
One group listened to the Mozart Sonata in D Major for Two Pianos, K488; a second group
listened to what was called a relaxation tape; and the third group was subjected to ten minutes of
silence (Rauscher et al., 1993; Rauscher & Shaw).
Immediately after receiving all three forms of treatment, the 36 students were
administered the same Stanford-Binet intelligence scale which was designed to measure spatial
reasoning. The music condition yielded a mean standard age score (SAS) of 57.56; the mean
SAS for the relaxation condition was 54.61; and the mean score for the silent condition was
54.00 (Rauscher et al., 1993). To assess the impact of these scores, “we ‘translated’ them to
spatial IQ scores of 119, 111, and 110, respectively” (Rauscher et al., p. 611). Therefore,
students who listened to the Mozart sonata averaged an eight to nine point increase in their IQ
score as compared to the average score received by students who had listened to the relaxation
tape or who had experienced silence (Rauscher et al.).
Although the increase in IQ of the Mozart group was brief - it lasted only about the time
it took to take the test (from ten to fifteen minutes) – Tomatis’ term “Mozart Effect” was adopted
(Anderson, 2000, p. 3-4). In his work, the French physician concludes, “of all types and
composers of music, Mozart created the greatest healing effect on the human body” (Campbell,
2000b, p. 1). This healing effect has been attributed to “the rhythms, melodies, symmetry and
high frequencies of Mozart’s music, its purity and simplicity” (Campbell, p. 1).

34
Nevertheless, through a series of events, the term Mozart Effect became generalized and
popularized to refer to the beneficial effects of any type of music (Campbell), including music of
Wolfgang Amadeus Mozart (1756–1791). However, will any style of music produce the Mozart
Effect? “Understanding how it does so and determining which among different types of music
will also produce the Mozart effect are of great general and scientific interest in helping us
understand the brain” (Shaw, 2004, p. xxi).
Promoting Music and the Mozart Effect
Since the results of the 1993 Rauscher, Shaw, and Ky research, mainstream media has
exaggerated the Mozart Effect. Claims that music can make children smarter have spawned a
Mozart Effect industry that include books, CDs, and internet sites (Coff, 1998–2002; Rauscher,
2003b). As a result, “many people read about this experiment in popular magazines and
newspapers and thought that listening to classical music would be a good way to improve
memory and increase intelligence” (University of Washington, n.d., p. 3).
Almost immediately, music educators and entrepreneurs seized an opportunity to justify
music in public schools along with the prospects of earning a quick dollar. Educational
documents including Transforming Education Through the Arts Challenge: Final Project
Report, (National Arts Education Consortium, n.d.), Arts Education Means Business (Virginia
Commission for the Arts, 1994), Profiles of SAT and Achievement Test Taken, and How Music
Can Dramatically Affect Your Child’s Development and Life-Time Success: A Summary of the
Current Scientific Literature Concerning Music and the Mind (Foundation for Music Literacy,
2003) were readily available across the nation.
Don Campbell, author, musician, and capitalist, describes himself simply as a man who
has "listened to the world" (Campbell, 2005, p. 1). He has “produced numerous sets of

35
recordings of Mozart’s music to help parents interested in taking advantage of the Mozart Effect
in their homes” (Campbell, p. 274). His compiled works target audiences from pregnancy to
adulthood including volumes that claim to: Strengthen the Mind: Music for Intelligence and
Learning; Heal the Body: Music for Rest and Relaxation; Unlock the Creative Spirit: Music for
Creativity and Imagination; Music for Stress Reduction, and Music for Study (Campbell,
2000a).
Campbell prefaces his recorded literature as follows:
All music has an effect on us. But, somehow, almost indescribably, Mozart has a simple and remarkable way of speaking to us. He is clear, organized, efficient, and not overly emotional. His music goes into our psyche in ways that are subtle and powerful. Even if Mozart is not your favorite composer from an aesthetic perspective, his music provides a positive environment where you can learn, relax, and create at your best. And that, quite simply, is The Mozart Effect.
(Campbell, 1997).
Mainstream media and music educators jumped on the Mozart Effect notion. With
assistance from the entertainment industry, music educators from across the nation created a
firestorm of arts advocacy materials that showed the importance of music education in public
schools (Foundation for Music Literacy, 2003; Music Educators National Conference, 2002; and
Virginia Commission for the Arts, 1994).
Even politicians joined the fight. William J. Bennett, former Secretary of Education
during the Reagan administration, supported music education’s fundamental effect as:
All creative souls do not express themselves in the written word; some paint, some sculpt, some build, and some challenge the depths of human understanding through the sounds of music. No education is complete without awareness of music; music is an essential expression of the character of a society.
(Potosky & Gridley, 1986, p. 15)

36
As a psychological tool, Don Campbell characterized music:
1. as a carrier: using the melody or beat to help encode the content. 2. for arousal: using music to manage states, to calm down or to energize. 3. as a primer: using music (e.g. Mozart) to prime/prepare (excite and arouse)
specific neural pathways for learning content or processing. (Campbell, 2000b, p. 1)
On the other hand, a number of educational investigative attempts have tried to use
Mozart’s music to improve memory but have failed (University of Washington, n.d.).
The Controversy Begins
As the Mozart Effect swept the country, one group of scientists investigated its premise
by having students listen to Mozart, a list of numbers, and then repeat the numbers backwards
(this is called a backwards digit span test). Results indicated no effect. Investigators concluded,
“apparently the Mozart Effect depends on what kind of test is used” (University of Washington,
p. 3). Steele, Bass, and Crook (1999) at Appalachian State University, who meticulously
replicated the original Rauscher et al. experiment also concluded “there is little evidence to
support basing intellectual enhancement programs on the existence of the causal relationship
termed the Mozart Effect” (Steele et al., p. 368).
Similar to the Rauscher et al. (1993) investigation, the Appalachian State University
experiment involved 125 college student-participants (42 male and 83 female) that came from
introductory psychology courses and received credit for participation. Participants were
distributed among the three conditions (Steele et al.). However, results established in Rauscher et
al. (1993) were unfounded.
In the years after the initial experiment, Rauscher and Shaw themselves admit that other
investigators have had difficulties in producing a Mozart Effect because “the investigators have
not distinguished between spatial-temporal tasks (like the PF&C task) and spatial pattern-

37
recognition tasks (like the Raven Progressive Matrices task)” (Steele et al., p. 368; Rauscher &
Shaw, 1998; and Rauscher, 2000). The letters PF&C task refer to the Stanford-Binet paper
folding and cutting test that measures spatial-reasoning scores.
Scientifically, the Rauscher neuroscience/music studies have “caused quite an impact on
related fields and some controversy” (Coff, 1998-2002, p. 1), as evidenced in the University of
Washington (n.d.) and Appalachian State University (Steele et al.) studies. Yet other researchers,
including further Rauscher studies, continue to attest to the power of music and the Mozart Effect
in improving intelligence (Hetland, 2000; Rauscher et al. (1994); and Rauscher, 2003b).
Rauscher and Shaw claim that their work has been misrepresented. As a result, Rauscher
has counteracted with a number of additional studies, articles, and conference speeches
(Rauscher, 2000; Rauscher, 2003b; Rauscher & Shaw, 1998; & Rauscher et al., 1994).
One notable declaration entitled, Is the Mozart Effect “debunked”? (Rauscher, 2000) was
presented at the bi-annual meeting of the International Conference on Music Perception and
Cognition at Keele University in Keele, United Kingdom. In this presentation, Rauscher admits,
“unfortunately, affirmations of scientific discoveries are not as newsworthy as their purported
refutations” (Rauscher, p. 1). Additionally, she testifies that “two independent meta-analyses
report that the Mozart effect has been replicated 29 times in 13 independent laboratories”
(Rauscher, p. 1). “It is a moderate effect, and it is robust” (Rauscher, p. 1).
Much later, Rauscher acknowledges the excitement that has been generated by media
claims that “Mozart makes you smarter” (Rauscher, 2000, p. 1) and that attempts to replicate the
effect have been inconsistent. Moreover, she admits that additional research is needed and
suggests that “the presence of five experimental factors may have contributed to negative

38
findings” (Rauscher, p. 1). Experimental factors include Task Validity, Expectancy Effects,
Instructions to Participants, Item Difficulty, and Practice Effects (Rauscher).
In regards to Task Validity, Rauscher illustrates the importance of task choice.
Researchers using other types of visuospatial tasks report failure to replicate (Steele et al., 1999).
She stresses the importance of using the “animated spatial-temporal task only” (Rauscher, 2000,
p. 2). When Rauscher et al. repeated the experiment using only the animated spatial-temporal
task, results “revealed a ‘Mozart effect’…an effect that was not substantially weakened by the
pretest” (Rauscher, p. 2).
The second experimental factor that may have contributed to negative findings is
Expectancy Effects. This term refers to the outcome of a study that can affect its actual outcome
(Rauscher, 2000). “Researchers exploiting the Mozart effect have rarely employed designs in
which the experimenter is blind to the study’s hypothesis and condition assignment” (Rauscher,
2000, p. 2). However, studies that controlled for the expectancy factor all found a Mozart effect
(Nantais & Schellenberg, 1999; Rauscher et al., 1993; Rauscher, 2000).
Rauscher used an expectancy control design to directly test the contribution of
experimenter expectancies to the Mozart Effect (Rauscher, 2000). Manipulating the beliefs of 79
undergraduate freshman subjects that served as both experimenters and participants, she assigned
them to one of three expectancy conditions: High Expectancy, Low Expectancy, and Blind
(Rauscher, 2000).
Under the pretext of informed consent, experimenter-subjects in High Expectancy
conditions were asked to read a newspaper article supporting the Mozart Effect. Subjects were
told that their partners were expected to perform better after listening to music than following
silence. Participants in Low Expectancy conditions read an article regarding findings relating to
39
the poor exposure of the Mozart Effect. They were told that researchers expected “to find no
difference between their partners’ scores in the two listening conditions” (Rauscher, 2000, p. 2).
Subjects in Blind conditions read an article concerning research methods and were told nothing
pertaining to possible outcomes of the study. Experimental-subjects were provided identical
instructions and scripts (Rauscher).
Two listening conditions, Mozart and silence, were administered to each participant.
After each condition, subjects answered 16 Paper Folding and Cutting items. All groups
evidenced a Mozart Effect. However, the scores of participants tested by the high expectancy and
blind experimenter-subjects were “significantly higher than the scores of participants tested by
the low-expectancy experimenters” (Rauscher, 2000, p. 2). Further findings revealed participants
in high-expectancy groups scored significantly higher than those in low-expectancy groups.
Therefore, data indicate that “experimenter expectancies probably contribute to the outcome of
Mozart Effect experiments, even when experimenters are provided with identical instructions
and scripts” (Rauscher, p. 2).
A third factor that may have contributed to negative findings may exist in the Instructions to
Participants (Rauscher, 2000). In meta-analysis, researchers who instruct participants to listen
carefully to the auditory selections (instead of playing them without instructing subjects) find larger
effects, perhaps due to attention or lack thereof (Hetland, 2000; Rauscher, 2000). Rauscher cautions
that “attention may either permit a more complete neural activation of the networks involved in
processing musical and spatial information, or it may increase arousal” (Rauscher, p. 3).
She speculates, in either case, “it seems unlikely that a Mozart effect would be found for
participants who did not actively process the music” (Rauscher, p. 3). Moreover, Rauscher
acknowledges that research directly assessing the effects of informing subjects to listen to the

40
music is needed. However, she suggests that researchers must consider the instructions to
participants in future research (Rauscher, 2000).
The fourth element Rauscher suggests may be a factor in negative findings is Item
Difficulty. She explains if the spatial-temporal measure is too easy, participants may depend on
comparatively automatic processes that are not made possible by listening to music (Rauscher,
2000). For example, the easy Paper Folding and Cutting item depicted in Figure 6 can be solved
without mentally unfolding the object, whereas the more difficult item requires processes of
imagery and rotation (Rauscher, 2000). Researchers “found a positive relationship between
effect size and item difficulty. The size of the Mozart effect was larger in experiments that used
more difficult tasks” (Rauscher, p. 3).
Easy Difficult
A B C D E A B C D E
Figure 6. Easy and Difficult Paper Folding and Cutting Items. Note: From Rauscher, F. H. (2000, August). Is the Mozart effect "debunked"? Poster presented at the bi-annual
meeting of the International Conference on Music Perception and Cognition, Keele University, Keele, UK. (p. 3).
41
The final factor Rauscher points out that may have contributed to negative findings is
Practice Effects. “In studies using pretest posttest design, it is important to control for practice
effects. Some tasks, such as the Paper Folding and Cutting task, are highly susceptible to practice
effects” (Rauscher, 2000, p. 3). Rauscher explains there can be a ceiling effect which may make
it difficult to observe any posttest differences that could be present when subjects are pretested
and then posttested (Rauscher). A meta-analysis by Block and Grosfield (Rauscher, 2000)
supports this concept. “Stronger Mozart effects were found in studies in which task performance
was furthest from the ceiling” (Rauscher, p. 3).
Using Mozart or Not Using Mozart
In comments, Rauscher admits that since the original article, “our understanding of the
Mozart effect has evolved” (Rauscher, 2000, p. 3). At first, the term Mozart Effect referred to the
transitory increase of certain visuospatial task scores following listening to a particular Mozart
sonata. However, the phrase has been generalized to include the effects of music instruction on
spatial-temporal task performance (Rauscher).
In spite of Rauscher’ remarks, controversies regarding the Mozart Effect and the use of
various music styles or conditions continue. At the University of Windsor and University of
Toronto, both in Canada, two experiments replicated and extended the Mozart Effect. Recruited
participants included 84 undergraduates: 56 for Experiment 1 and 28 for Experiment 2 (Nantais
& Schellenberg, 1999). In Experiment 1: “Performance on a spatial-temporal task was better
after participants listened to a piece composed by Mozart or by Schubert than after they sat in
silence” (Nantais & Schellenberg, p. 370). In Experiment 2, “the advantage for the music
condition disappeared when the control condition consisted of a narrated story instead of silence”
(Nantais & Schellenberg, p. 370).

42
Nantais and Schellenberg found “although both pieces of music are relatively ‘easy
listening’ examples from the common-practice period, our finding makes it clear that the Mozart
effect has nothing to do with Mozart in particular” (Nantais & Schellenberg, p. 372). In fact, they
generalize the effect to a wide variety of enjoyable pieces of music composed in the classical or
romantic styles (Nantais & Schellenberg).
Another self-described skeptic and psychologist, Eric Seigel at Elmhurst College in
Illinois, set out to invalidate the Mozart Effect. He chose a different spatial reasoning test (a
factor that Rauscher warns against) (Rauscher, 2000); one that involves the participant’s ability
to differentiate between shifted positions of the letter E as various rotations were given. The brief
time that it takes to judge whether the letter is the same or different competently measures spatial
reasoning. In this experiment, Seigel found that subjects in the Mozart listening group did
significantly better (Anderson, 2000). He remarks, “it was as though they had practiced the
test…we have another way to measure the Mozart Effect” (Anderson, p. 6).
The Mozart Effect and Preschool Children
Previous investigations have attempted to replicate the Rauscher et al. 1988 and Rauscher
et al. 1994 experiments involving the Mozart Effect (Davidson & Powell, 1986; and Dryden,
1992). In November 2004, Ken Hui, a researcher at Yale University, challenged the Rauscher et
al. results. Knowing that experiments, up until that time, had been completed only on college age
students, Hui wanted to examine the relationship of the Mozart Effect on preschool children
(Hui, 2004). Parental consent for all volunteer participants was obtained at the beginning of the
study which included 41 preschool children (16 females and 25 males) at a childcare center in a
large Midwestern city (Hui). “The center had no special provisions for either gifted learning or
special education, and it was a fully private institution with no form of financial aid” (Hui, p.

43
413). The ages of children ranged from three years, two months to six years, three months with a
mean of 4.69 years and one missing observation (Hui).
The conditions for music were created and consisted of two audiotapes of approximately
8 minutes, 20 seconds. One tape included the first movement of Mozart’s Piano Concerto in A
Major (K488), the selection used in the original Rauscher et al. experiment. The second tape
contained three pieces of typical popular children’s music excerpted from Songs for the Road
(Hui, 2004). To encourage the participant’s active listening, they were told that a brief discussion
of the music would be held at the conclusion of the test (Hui).
Hui conquered potential internal and external experimental design flaws such as
behavioral characteristics of the participants, balances in learning effects, and variance by
controlling for each condition. After random assignments were made, each student was given a
pen and portable lap desk that had a hard flat surface and a cushioned underside.
At the end of the listening condition, tests were distributed to each subject. Test materials
consisted of a series of pencil-and-paper mazes, which were based upon a recently expired
version of the Wechsler Preschool and Primary Scale of Intelligence – Revised (WPPSI-R). The
test was chosen because it comprised both the necessary spatial and temporal components, as
specified in the original Rauscher and Shaw experiment, in addition to its practical use in
administering the test in a group setting (Hui, 2004). Each test contained a series of eleven
unique mazes, as prescribed by Rauscher and Shaw, and were presented in booklet form, in
increasing order of difficulty. The tests took place over a period of three days. Each child was
compensated with Oreo cookies for their participation after each session (Hui).
To ensure anonymity, Ken Hui, the investigator, graded each performed test. The
participant and condition received was unknown to Hui. Grading took place over a one-week

44
period following the conclusion of data collection. Mazes were scored according to guidelines of
the WPPSI-R. Completed mazes were assigned point values based on difficulty and points were
deducted for wrong turns and U-turns. The maximum score was 26 and the minimum was zero
(Hui, 2004).
The results of the experiment revealed 41 children and 17 missing observations. Missing
observations were due to absenteeism or the participant did not wish to participate on a given
day. Thirty-nine children participated on at least two of the three days and could be included in
the analysis of individual score differences. The mean score and standard deviation of these
children in each condition are presented in Table 1 (Hui, 2004).
Table 1
Mean Scores of Males by Condition.
Condition Mozart Popular music Silence
Mean 14.50 14.35 15.32
Standard deviation 4.64 4.73 5.24
N 36 34 34
Note: From Hui, 2004, p. 415.
The mean scores were tested using a repeated-measures analysis of variance. This found
no significant effect of the conditions on the test scores (F2, 63 = 1.51, p > .05) (Hui, 2004, p.
414). Hui controlled for children’s age which had a significant positive effect on score. However,
it did not change the conclusion that there was no overall difference across conditions (Hui).
Paired t-tests were conducted on score difference between conditions within individual
participants. This analysis indicated a significant decrease in scores in the classical music
condition compared to the silence control (t = - 2.21, p = .035, n = 31). The average loss was

45
1.13 points. Differences between popular music and silence (t = -1.06, p > .05) and between the
two music conditions (t = 0.06, p > .05) were not significant (Hui, 2004, p. 415).
Hui discovered “there was no improvement in the spatial-temporal ability of preschool
children after listening to Mozart’s or popular music compared with after silence” (Hui, 2004, p.
415). His hypothesis that listening to music increases spatial temporal ability in children was not
supported by data. Hui acknowledges previous studies have suggested a stronger Mozart Effect
for women (Gilleta, Vrbancic, Elias, & Saucier, 2003; Hui). However, “no such correlation
between gender and spatiotemporal enhancement was detected in this study” (Hui, p. 415).
The Mozart Effect and Background Music in Public Schools
A study involving fifth grade students examines the effects of easy-listening background
music on the on-task-performance (OTP) of children. An experiment conducted by Charles W.
Davidson and Lou Anne Powell investigated 26 fifth grade science students. The students were
observed for 42 class sessions with data recorded every three minutes (10 times) per session over
a four-month period (Davidson & Powell, 1986).
The treatment, in the form of easy-listening music, was “delivered in between two control
observations (i.e. 15 sessions without background music, 15 with, and 12 without, in that order)”
(Levy, n.d., p. 4). Davidson and Powell discovered a significant increase in OTP for males in the
classroom and for the class as a whole. However, there was also an increase in OTP for females,
although this effect “was inhibited by the ceiling effect (the mean pretreatment OTP for females
was 99%)” (Davidson & Powell, 1986, p. 29).
Davidson and Powell admit concerns about their data gathering and statistical methods.
They note, “It was not feasible to randomly assign the students to an experimental group and a
control group” (Davidson & Powell, 1986, p. 30). They also state, “there were no anticipated
46
external events that would coincide with the treatment” (Davidson & Powell, p. 30). This last
statement is a critical element, “since external events, anticipated or not, can certainly influence
the results of a study conducted outside the laboratory” (Levy, n.d., p. 4). Yiftach Levy, in the
Department of Educational Technology at San Diego State University, gives an unfortunate
illustration of such an external occurrence when she cites the results of a 1995 study by
Koppelman and Imig on the effects of music on children’s writing where “the unexpected death
of the student’s teacher” occurred (Levy, p. 4; Koppelman & Imig, 1995, p. 21).
In spite of the experiment’s no anticipated external events and the lack of random
assignment, Davidson and Powell indicate, “The use of easy-listening background music was
effective in increasing on-task-performance of children in an elementary science classroom…
[and may be generalized to] other subjects in the middle grades” (Davidson & Powell, 1986, p.
32). Therefore, replications of the Davidson and Powell study may be viable for further research
at the middle school and high school levels.
During an informal study completed in 27 public school classrooms, over two-thirds of
teachers found students to be more on-task when classroom environments were structured around
background classical music (Patten, 1999). However, Christopher Chabris, a graduate student at
Harvard University, questioned a number of studies that played different styles of background
music, in particular, classical music in classrooms.
He examined 16 studies and analyzed their conclusions (Cromie, 1999; Cromie, 2000;
Anderson, 2000). Chabris maintains:
The results do not show any real change in IQ or reasoning ability. There’s a very small enhancement in learning a specific task, such as visualizing the result of folding and cutting paper, but even that is not statistically significant. The improvement is smaller than the average variation of a single person’s IQ test performance. (Cromie, 1999; Anderson, 2000, p. 5)

47
Chabris further concludes, “there’s nothing wrong with having young people listen to
classical music, but it’s not going to make them smarter” (Cromie, 1999; Anderson, 2000, p. 5).
Even music education cynics have thwarted the Mozart Effect. Michael Linton, head of
the Division of Music Theory and Composition at Middle Tennessee State University, writes,
“the very best thing that could be said of their [Rauscher and Shaw] experiment — were it
completely uncontested — would be that listening to bad Mozart enhances short–term IQ”
(Linton, 1999, p. 12). Still other educational skeptics have been swayed to accept the Mozart
Effect does exist (Cromie; Anderson).
A case in point is Lois Hetland’s work at the Harvard Graduate School of Education.
Hetland attempted to replicate earlier Mozart Effect studies in broader depth, including a total of
1,014 participants (Hetland, 2000; Anderson, 2000). Dr. Hetland presents the results from two
meta-analyses of Mozart Effect studies. She examined the 16 Christopher Chabris studies with
subjects N = 714 and 12 studies with subjects N = 522 in addition to her own meta-analyses of 36
studies with subjects N = 2,465 and 31 studies with subjects N = 2,089 (Hetland, 2000).
The Hetland (2000) meta-analyses revealed that the Mozart listening group outperformed
other groups by a higher margin than could be explained by chance, although “factors such as the
subject’s gender, musical tastes and training, innate spatial ability, and cultural background made
a difference in the degree to which the Mozart would increase test scores” (Anderson, 2000, p. 6;
Hetland, 2000; Cromie, 2000).
In contrast, Hetland did not find the Mozart Effect to be as strong as the Rauscher et al.
(1993) experiment. Then again, she believes “that even these small effects are impressive
because so many other factors could obscure them” (Anderson, p. 6).

48
Hetland (2000) explains, “in the early stages of research in a field, we would expect the
measured effect to be small until we learn to separate the signal from the noise in the research
method” (Anderson, 2000, p. 6). She observed that Chabris “had only studied the experiments
that compared listening to Mozart to silence, and which had not included listening to other
compositions” (Anderson, p. 6).
Comparable to Rauscher et al. (1993), studies that resulted in the Mozart Effect have
examined the effect of background music on mathematics test anxiety of college algebra
students. Haynes (2003) at West Virginia University proposed two research questions: (1) Does
the use of background music played while students studied for 10 minutes prior to an exam
reduce the level of mathematics test anxiety as opposed to students who had no background
music while studying?; and (2) Is there a significant difference in the achievement scores of
students exposed to background music while studying as opposed to students who had no
background music while studying (Haynes, 2003).
All subject-participants, 160 West Virginia University students, completed a revised
version of the Mathematics Assessment Resource Service (MARS) test and the first college
algebra exam for the semester in the course. Data analysis indicates that studying to background
music reduced math anxiety levels of participants. However, the second hypothesis was not
supported. Researchers found that achievement scores were not affected by background music
for either high anxiety students or low anxiety students (Haynes, 2003). This set of results is
contrary to results in other studies involving music and the mind.
Expanding the Mozart Effect – A Summary
What is so special about Mozart’s music? Why are his tunes hailed as possibly making
children smarter? How can listening to Mozart increase academic achievement for students?

49
According to Associate Professor Sukree Charoensuk, Dean of the College of Music at Mahidol
University in Thailand, “Mozart’s works are not too complicated. In fact, they were considered a
kind of pop music in his time” (Siribhakdi, 2006, p. 1). It is with this quality that Mozart’s music
along with its quick tempo is believed to stimulate the brain (Siribhakdi). Sukree Charoensuk
goes on to state, “a tempo that is faster than the rate of the heartbeat naturally excites listeners”
(Siribhakdi, p. 1).
Can music other than compositions by Mozart stimulate the brain? Several investigators
have attempted to prove this theory. In 1999, Bodner, Muftuler, Nalcioglu, and Shaw report
results of Mozart’s music during a functional MRI (fMRI) significantly increased active brain
areas of Alzheimer’s patients as compared to a Beethoven composition or popular 1930s music
(Rauscher, 2000). Beethoven compositions “differently activated the prefrontal, occipital, and
cerebellar regions – all regions associated with spatial-temporal reasoning (Rauscher, pp. 3 - 4).
Similarly, Dr. Lawrence Parsons at the University of Sheffield in the United Kingdom
has found that it was Mozart’s energetic rhythms rather than its melodies or harmonies that
created the performance enhancing effect (Lichtenstein Creative Media, 2002). Dr. William
Thompson of York University has found comparable results. “Energetic music by Schubert
produces the same effect; a slower, sadder piece by Albioni does not” (Lichtenstein Creative
Media, p. 1).
In spite of evidenced research, limitations to Rauscher et al. (1993) did occur,
specifically, a small sample size. Moreover, little or no demographic information is provided
other than participants are college students.
Unlike the Rauscher et al. (1993) study, the sample size in Haynes (2003) is significant
and can be generalized to a larger population. Dependent variables, test anxiety and academic
50
achievement, appear to be easily observable by examining MARS achievement data.
Independent variables, listening to background music for 10 minutes as opposed to 10 minutes of
silence, are easily controlled to provide adequate and measurable outcomes, similar to those in
the initial experiment. However, in comparing the two studies, Rauscher et al. (1993) to Haynes
(2003), the level of confidence that like results would be attained should the experiment be
repeated is quite low, as evidenced in the second hypothesis and data collection in Haynes
(2003). Why is this so? Several recurring questions come to mind.
If the study of music does increase academic achievement, is there a causal or correlational
relationship between music education and academic success? Is a participant’s age a factor in brain
development in regards to music education and academic achievement? Both Rauscher et al.
(1993) and Haynes (2003) include only college students. How would the results differ if the age of
participants were changed? Will different types of music, i.e. relaxation, classical, heavy metal,
hip-hop, or even silence, affect academic outcomes? How or does educational background and
instrument choice have an impact on academic success? Each of these questions is worthy of
further investigation.
Frances Rauscher and Gordon Shaw as well as other researchers have ventured to answer
these questions. Shaw comments that the human brain is one of the most complicated entities in
our solar system. In his quest to understand how we think, reason, and create, Shaw and his fellow
researchers found that they could use “music as a window into high brain function” (Shaw, 2004,
p. xxi) through the Mozart Effect. Is this a means to establish higher standards for public
education?
According to Eric Jensen (2001), “flying in the face of these hopes is an educational
juggernaut unlike any we’ve seen in recent history” (p. v). Jensen suggests that there is no
51
evidence that higher standards “actually produce better human beings – unless accompanied by
better quality teaching, more targeted resources, greater opportunities for underserved populations,
stronger role models, high expectations, and a dozen other key variables” (Jensen, p. vi).
Perhaps the answer in attaining consistent high standards is contained, as predicted by
researchers, in music listening and training of infants and young children (when their brains are
developing the most) (Shaw, 2004).This would enhance their ability to do spatial-temporal
reasoning, which is important in doing math and science.
Consequently, “an increasing amount of research supports the theory that the brain is
specialized for the building blocks of music, and that these building blocks include separate spatial
(melodic) and temporal (rhythmic) components” (Rauscher, 1997, p. 34). Understanding how it
does so and determining which types of music will also create the Mozart Effect are of immense
general and scientific interest in helping us know the brain (Shaw).
As evidenced in cited studies by a number of researchers, including Frances Rauscher,
Gordon Shaw, Lois Hetland, those in the business and education communities, the public, and yes,
even skeptics, have a clearer understanding how music can impact the brain.
As future researchers uncover data that making music helps young people develop mental
capacity, perform better in a variety of academic areas, and promotes wellness in older people
(Christensen, 2005), music educators should be “aware of the controversy, and neither focus
music curricula around certain types of music for maximum intelligence building” (Anderson,
2000, p. 11). On the other hand, with a clear and thorough understanding of the brain and the
impact that music has upon it, educators, regardless of content specialty, cannot exclude the
possibility that there may be a link between listening to music, instruction in music, and
increased academic achievement (Jensen, 2001).

52
Music Education and Elementary School Academic Achievement
After findings of the Mozart Effect and the initial outcry for educational reform had
waned, additional research, some replicating the original study, others of a more conventional
nature, have taken place to challenge the Rauscher, Shaw, and Ky findings. As in all good
research, Rauscher attempts to prove her own theories through a variety of additional studies
(Rauscher, 1997; Rauscher, 1999; Rauscher, 2003a; Rauscher, 2003b; Rauscher & Shaw, 1998;
and Rauscher & Zupan, 2000).
Many Rauscher studies involve public school preschool, kindergarten, and second-grade
subjects who receive music instruction. Studies, especially those regarding piano instruction,
have revealed higher results on spatial-temporal tasks than control groups who received other
types of instruction (i.e. computers) or no training (Rauscher, 1999; Hetland, 2000; Rauscher &
Zupan, 2000; Rauscher, 2003b). “These effects appear to last only if the instruction begins
before age seven, and if it continues for two or more years. The effect of music instruction has
been replicated in several laboratories and may last at least three years” (Rauscher, p. 3).
Classroom keyboard instruction improves kindergarten children’s spatial-temporal
performance: A field experiment (Rauscher & Zupan, 2000); Effects of piano, singing, and
rhythm instruction on the spatial reasoning of at-risk children (Rauscher, 2003a); Music
exposure and the spatial intelligence in children (Rauscher, 1999); and Can music instruction
affect children’s cognitive development? (Rauscher, 2003b) reveal significant results in regard to
music education and academic achievement in elementary school. Elements of their research
design and analysis will be revealed in this domain.

53
Using Piano Instruction for Increased Academic Achievement
Rauscher (2003a) notes that research studies have found musicians who begin piano
instruction before age 7 have larger cross-sections of the anterior corpus callosum. A follow-up
MEG study found auditory cortex dipole moments for piano tones that were enlarged by about
25% in musicians relative to non-musicians (Rauscher, 2003a). Rauscher reminds future
investigators, “there was a positive correlation between effect size and when participants
initiated instruction: musicians who began instruction before age 9 showed the largest effects”
(Rauscher, 2003a, p. 1).
Rauscher and Zupan (2000) hypothesize the impact of piano instruction and elementary
school academic achievement. Classroom keyboard instruction improves kindergarten
children’s spatial-temporal performance: A field experiment (Rauscher & Zupan, 2000) is
perhaps a precursor to Rauscher’s future and more extensive work Effects of piano, singing, and
rhythm instruction on the spatial reasoning of at-risk children (Rauscher, 2003a).
In Rauscher and Zupan (2000) participants include 62 middle-income kindergarten
children (36 boys and 26 girls) of mixed ethnicity attending four kindergarten classes at two
Midwestern public elementary schools. Children range in age from 5 years, 1 month to 6 years, 1
month at the start of the study (Rauscher & Zupan, 2000).
Children were assigned to one of two groups, keyboard (N = 34) or no music (N = 28).
Random assignment was not possible due to logistics and school administrators’ need to keep
classes intact. A music specialist visited each classroom to administer 20 minute piano lessons to
the keyboard group two times per week. Ten Kawai XG130 keyboards (Rauscher & Zupan,
2000) were arranged in a row against one wall of the classroom. Children assigned to the no

54
music group were engaged in journaling by their kindergarten teacher in a separate area of the
classroom during lesson time (Rauscher & Zupan).
Children in the keyboard group participated in groups of approximately ten students. In
typical lessons, participants are seated in a semicircle, prompted by the music specialist, on the
floor away from the keyboards to sing and move to previously learned keyboard compositions.
Afterward, singing and movement to compositions of current and subsequent weeks ensued. A
brief discussion of keyboard hand position led by the music specialist followed (Rauscher &
Zupan, 2000).
Next, children were seated individually at keyboards to play the previous week’s
selection alone and in ensembles. This was followed by an introduction to a new composition
accompanied by rhythmic clapping and solfege (a way of assigning syllables to degrees or steps
of the diatonic scale. For example: Do, Re, Mi, Fa, So, La, Ti, and Do for the eight ascending
notes of a musical scale or octave). This activity culminated in keyboard performances (Rauscher
& Zupan, 2000).
Activities were interspersed with ear training, notation, rhythm, improvisation, interval,
and dynamic exercises. Lessons ended with a review of the day’s activities and repertoire.
Children assigned to the keyboard group were encouraged to play the keyboard throughout the
day and, if possible, at home. Children in the no music group were not permitted access to
keyboards in school (Rauscher & Zupan, 2000).
Prior to exposure to conditions, all children were pretested using a series of tasks. Each
task contains the elements required for spatial-temporal reasoning. Procedures for completing
each task were provided by test publishers.

55
The first task - Puzzle Solving and Pictorial Memory, taken from McCarthy Scales of
Children’s Abilities (Rauscher & Zupan, 2000), consists of four items of increasing difficulty. To
successfully complete each item, the child was required to arrange cardboard pieces of a puzzle
to create a familiar object (Rauscher & Zupan, 2000).
The second task - Block Building, taken from Learning Accomplishment Profile
Standardized Assessment test (LAP-D) (Rauscher & Zupan, 2000), an object assembly test, has
been used in previous studies (Rauscher et al., 1994; Rauscher & Zupan, 2000). The child’s task
in this test was to join puzzle pieces together in particular orders to match a mental image
(Rauscher & Zupan).
For the third task, the child was required to reproduce from memory a simple stair-step
structure previously created by the test administrator from ten one-inch blocks. The Pictorial
Memory task (a six item test of visual memory) required the child to recall and identify
previously viewed picture objects. However, this task requires neither mental image formation
nor temporal ordering (Rauscher & Zupan).
Tests were administered by M. A. Zupan and a colleague blind to the experimental
hypotheses and condition assignment. Specific tests were chosen to develop a baseline for each
participating child to measure academic improvement over time. Procedures specified by
McCarthy (1972) and the Learning Accomplishment Profile Standardized Assessment (1992)
(Rauscher and Zupan, 2000) test manuals were followed. Children were tested individually at
their regularly assigned schools (Rauscher & Zupan, 2000).
Testing sessions lasted approximately 15 minutes and were administered before lessons
and again at two subsequent 4-month intervals, totaling three testing sessions (Rauscher &

56
Zupan, 2000). Keyboard lessons began immediately following pretesting. Therefore, the final
testing session occurred 8 months after the keyboard group’s first lesson (Rauscher & Zupan).
Means and standard deviations for all variables are presented in Table 2. An alpha level
of .05 was used for all statistical tests.
Table 2
Mean Task Scores and Standard Deviations for Keyboard (N = 34) and No Music (N = 28) Groups.
Task
Puzzle Solving* Block Building** Pictorial Memory*
Group M SD M SD M SD
Keyboard
Pretest 4.52 3.05 77.68 48.76 3.32 1.09
4 months 9.17 4.97 39.74 38.46 4.26 0.86
8 months 11.97 6.02 27.72 29.67 4.82 1.24
No Music
Pretest 3.93 2.26 77.66 44.70 3.79 1.20
4 months 5.75 3.26 74.54 48.29 3.50 1.35
8 months 6.87 3.63 58.70 45.49 4.36 1.06 Notes: * The higher the score is, the better the performance. ** The lower the score is, the better the performance. From Rauscher, F. H., & Zupan, M. A. (2000). Classroom keyboard instruction improves kindergarten children's spatial-temporal performance: A field experiment. Early Childhood Research Quarterly, 15 (2), p. 221.
In an attempt to understand data collection, it is important to review three Rauscher and
Zupan scoring mechanisms:
Puzzle Solving – the number of correctly joined puzzle pieces was divided by the number of minutes taken to complete each puzzle within a specified time limit for a dependent measure of joins per minute.

57
Block Building – the total number of seconds taken to complete the structure was recorded. A maximum of 120 seconds was permitted. Children who did not complete the structure received a score of 120. Pictorial Memory – the total number of pictured items recalled out of a total of six items was recorded. (Rauscher & Zupan, 2000, p. 220)
The first set of analysis focused on group factors that may have predicted the skills
enhancement found (Rauscher & Zupan, 2000). Since the children’s scores on the Puzzle Solving
and Block Building tasks were significantly correlated (pretest: r = - 0.25, p < .015; 4 months:
r = - 0.54, p < .01; 8 months: r = - 0.49, p < .01), a multivariate analysis of variance (MANOVA)
with gender and group (keyboard, no music), between-subject factors and time (pretest, 4 months,
8 months), and within-subject factor was performed on the three dependent measures (Rauscher &
Zupan).
Results indicate significant multivariate main effects for group (η² (3,56) = 0.20, p < .005)
and time (η²(6,53) = 0.86, p < .001) and a significant interaction between group and time (η²(6,53) =
0.27, p < .009). There was no significant main effect for gender (η² (3,56) = 0.03, p < .05), and no
other significant interactions were found (Rauscher & Zupan, 2000).
The ANOVA performed on Puzzle Solving tasks showed significant main effects for both
group and time and a significant interaction between group and time. Similar effects were found
for Block Building tasks. The ANOVA performed on Pictorial Memory yielded a main effect for
time only and an interaction between group and time (Rauscher & Zupan, 2000).
Since random assignment was not possible, a two-factor (gender, group) MANOVA on
pretest scores for Puzzle Solving, Block Building, and Pictorial Memory tasks were conducted to
assure children’s scores prior to treatment were equivalent across group and gender. No
significant main effects for group (η² (3,56) = 0.01, p < .05) or gender (η² (3,56) = 0.01, p < .05)
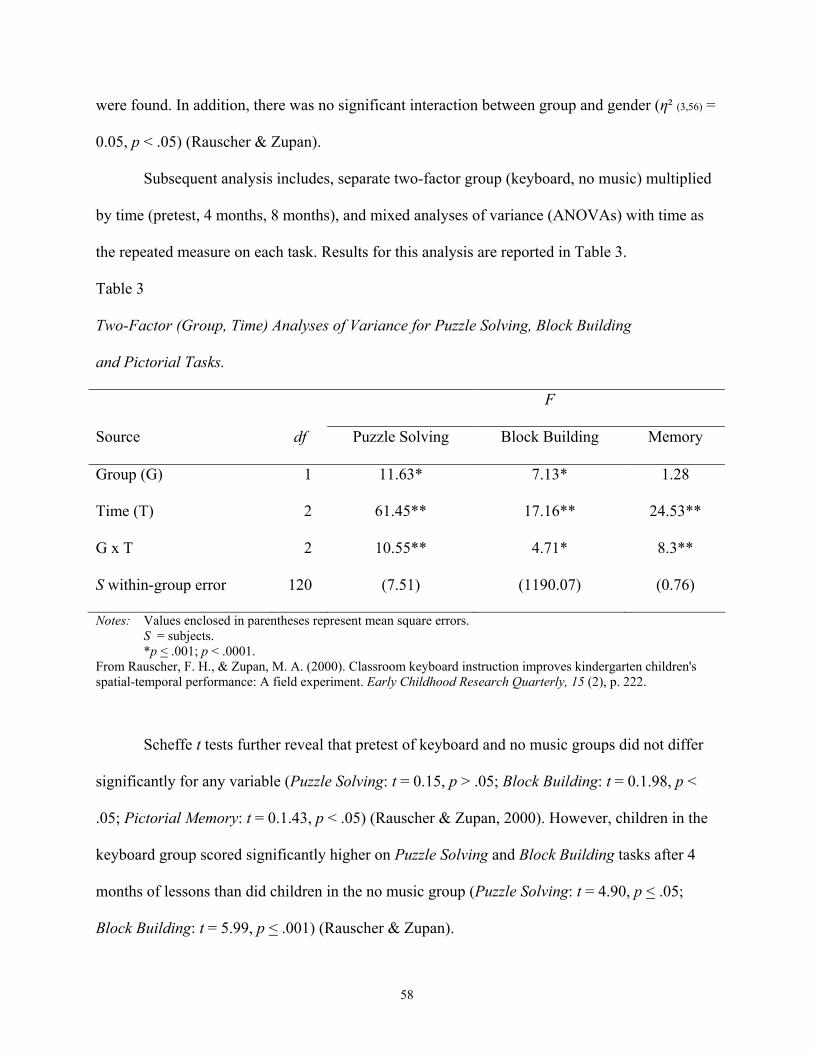
58
were found. In addition, there was no significant interaction between group and gender (η² (3,56) =
0.05, p < .05) (Rauscher & Zupan).
Subsequent analysis includes, separate two-factor group (keyboard, no music) multiplied
by time (pretest, 4 months, 8 months), and mixed analyses of variance (ANOVAs) with time as
the repeated measure on each task. Results for this analysis are reported in Table 3.
Table 3
Two-Factor (Group, Time) Analyses of Variance for Puzzle Solving, Block Building
and Pictorial Tasks.
F
Source df Puzzle Solving Block Building Memory
Group (G) 1 11.63* 7.13* 1.28
Time (T) 2 61.45** 17.16** 24.53**
G x T 2 10.55** 4.71* 8.3**
S within-group error 120 (7.51) (1190.07) (0.76)
Notes: Values enclosed in parentheses represent mean square errors. S = subjects. *p < .001; p < .0001. From Rauscher, F. H., & Zupan, M. A. (2000). Classroom keyboard instruction improves kindergarten children's spatial-temporal performance: A field experiment. Early Childhood Research Quarterly, 15 (2), p. 222.
Scheffe t tests further reveal that pretest of keyboard and no music groups did not differ
significantly for any variable (Puzzle Solving: t = 0.15, p > .05; Block Building: t = 0.1.98, p <
.05; Pictorial Memory: t = 0.1.43, p < .05) (Rauscher & Zupan, 2000). However, children in the
keyboard group scored significantly higher on Puzzle Solving and Block Building tasks after 4
months of lessons than did children in the no music group (Puzzle Solving: t = 4.90, p < .05;
Block Building: t = 5.99, p < .001) (Rauscher & Zupan).
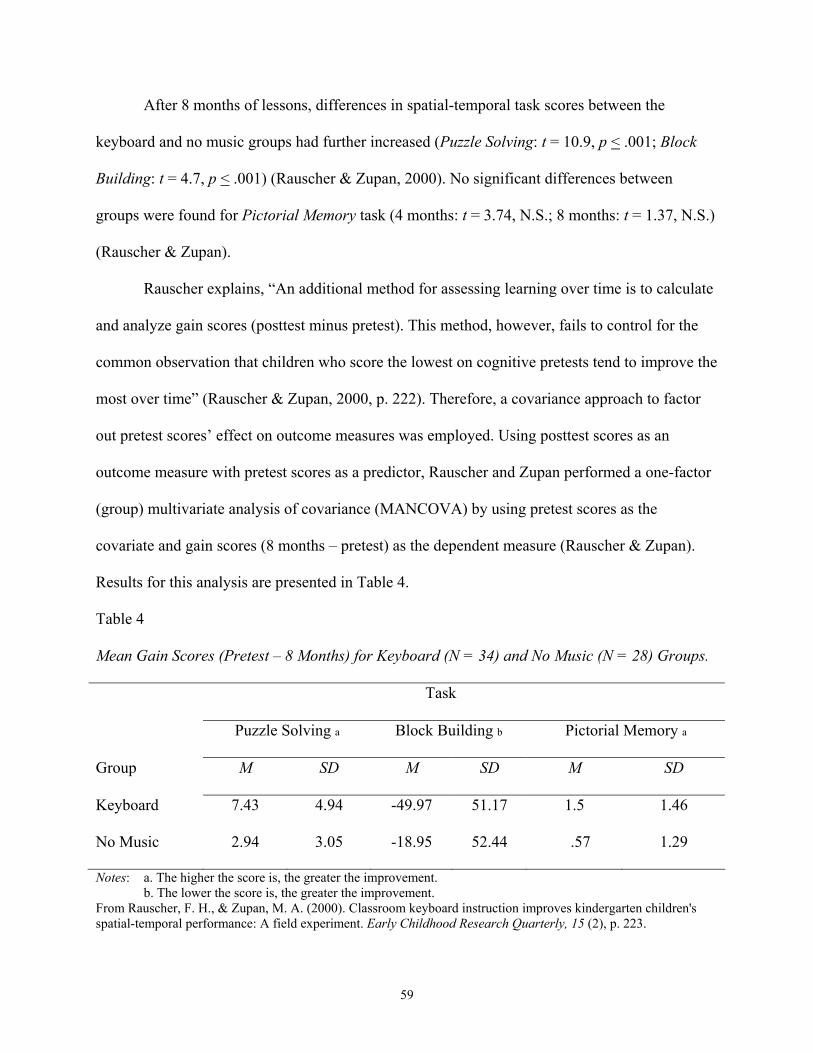
59
After 8 months of lessons, differences in spatial-temporal task scores between the
keyboard and no music groups had further increased (Puzzle Solving: t = 10.9, p < .001; Block
Building: t = 4.7, p < .001) (Rauscher & Zupan, 2000). No significant differences between
groups were found for Pictorial Memory task (4 months: t = 3.74, N.S.; 8 months: t = 1.37, N.S.)
(Rauscher & Zupan).
Rauscher explains, “An additional method for assessing learning over time is to calculate
and analyze gain scores (posttest minus pretest). This method, however, fails to control for the
common observation that children who score the lowest on cognitive pretests tend to improve the
most over time” (Rauscher & Zupan, 2000, p. 222). Therefore, a covariance approach to factor
out pretest scores’ effect on outcome measures was employed. Using posttest scores as an
outcome measure with pretest scores as a predictor, Rauscher and Zupan performed a one-factor
(group) multivariate analysis of covariance (MANCOVA) by using pretest scores as the
covariate and gain scores (8 months – pretest) as the dependent measure (Rauscher & Zupan).
Results for this analysis are presented in Table 4.
Table 4
Mean Gain Scores (Pretest – 8 Months) for Keyboard (N = 34) and No Music (N = 28) Groups.
Task
Puzzle Solving a Block Building b Pictorial Memory a
Group M SD M SD M SD
Keyboard 7.43 4.94 -49.97 51.17 1.5 1.46
No Music 2.94 3.05 -18.95 52.44 .57 1.29
Notes: a. The higher the score is, the greater the improvement. b. The lower the score is, the greater the improvement. From Rauscher, F. H., & Zupan, M. A. (2000). Classroom keyboard instruction improves kindergarten children's spatial-temporal performance: A field experiment. Early Childhood Research Quarterly, 15 (2), p. 223.

60
Rauscher and Zupan indicate, “This analysis yielded a significant main effect for group
(η² (3,53) = 0.35, p < .001), indicating that the effect for group revealed by the MANOVA
performed earlier was not an artifact of the children’s pretest scores” (Rauscher & Zupan, 2000,
p. 222). Furthermore, MANCOVA tests revealed the effect for gender (η² (3,56) = 0.04, p > .05)
were not significant (Rauscher & Zupan).
The primary purpose of this study was to demonstrate the effects of music instruction on
spatial-temporal reasoning of kindergarten children in the “chaotic setting of the public school
classroom” (Rauscher & Zupan, 2000, p. 223). Regardless of the hectic classroom environment,
results revealed that children exposed to keyboard instruction improved significantly on two
spatial-temporal tasks. Enhancements found were similar in magnitude to studies in other
research (Rauscher et al., 1994, 1997) in spite of vast differences in setting in which older
children received music instruction.
Although no differences in pretest scores were found between keyboard and no music
groups, keyboard participants scored significantly higher than no music groups after 4 months of
instruction. Moreover, this difference was greater in magnitude after 8 months. As hypothesized,
pictorial memory did not differ for the two groups following music instruction (Rauscher &
Zupan, 2000). However, the MANOVA revealed significant interaction between group and time
as a function of music instruction (Rauscher & Zupan).
Music Instruction and At-Risk Preschool Children
As an extension of previous research, Rauscher investigates the Effects of piano, singing,
and rhythm instruction on the spatial reasoning of at-risk children (Rauscher, 2003a). This study
reports the product of three closely related studies involving economically disadvantaged
preschool children. All children in this study were enrolled in Head Start, a federally funded
61
preschool program designed to prepare economically disadvantaged children for public school.
Household incomes ranged between $10,400 and $15,600 (Rauscher, 2003a).
Conducted over a period of two years, this extensive study attempted to replicate and
expand findings that piano instruction provided to preschool children improved spatial-temporal
scores compared to children who received computer instruction or no special training (Rauscher,
2003a).
The study’s design examines at-risk three- and four- year old children’s spatial and
temporal skills before (T1) and after (T2) two academic years of weekly individual piano
instruction. Two other groups were included in the design to control for the Hawthorne Effect -
an increase in subject productivity produced by the psychological stimulus of being singled out
and made to feel important. One group received computer instruction which matched in
frequency and duration to that of the piano instruction. The third group received no special
training (Rauscher).
Five standardized tests were administered to measure specific cognitive processes that
improve through exposure to music training. Specific predictions were made regarding the
children’s performance on each test. Rauscher predicted, “children who received the piano
instruction would improve more and score significantly higher than the children in the
comparison and control groups on tasks classified as having spatial and/or temporal content”
(Rauscher, 2003a, p. 2). Further predictions that tasks do not tap spatial or temporal abilities
would not be affected by music instruction were included (Rauscher).
Study 1 randomly assigned 87 children (mean age 3 years, 3 months at T1 - 45 girls, 42
boys) to three groups: Piano (N = 33), computer (N = 28), and control (N = 26) (Rauscher).
Students were pre- and post- tested using subtests of the Kaufman Assessment Battery for

62
Children (K-ABC), the Developmental Test of Visual Perception (DTVP-2), the Test of Auditory
Perceptual Skills – Revised (TAPS-R), and the Wechsler Preschool and Primary Scale of
Intelligence – Revised (WPSSI-R) (Rauscher). “These tests measure different aspects of spatial-
temporal, visual-spatial, and auditory skills” (Rauscher, p. 2). Overall, 26 subtests were
administered by research assistants blind to experimental conditions and hypotheses (Rauscher).
An alpha level of .05 was used for all statistical tests. As hypothesized, children who
received music instruction scored significantly higher than those who received computer or no
special instruction on tasks requiring spatial and temporal skills (Rauscher, 2003a).
Researchers ask that consideration be given to the WPPSI-R’s Object Assembly task:
A two-factor (condition, testing) mixed analysis of variance (ANOVA) found a main effect for condition (F (2,84) = 8.99, p < .000), a main effect for condition (F (1,84) = 97.58, p < .000), and an interaction between condition and testing (F (2,84) = 49.10, p < .000). Although the three groups’ scores did not differ in T1, the piano group scored significantly higher than computer or control groups (p < .000 both) in T2.
(Rauscher, 2003a, p. 3)
Following piano instruction, four tasks from the K-ABC improved significantly (Hand
Movements, Magic Window, Gestalt Closure, and Arithmetic); five tasks from the DTVP (Eye-
Hand Coordination, Spatial Relations, Form Constancy, Visual Closure, and Figure-Ground)
improved significantly; and two tasks from the TAPS [Auditory Sentence Memory (Sequencing)
and Auditory Processing (Thinking and Reasoning)] (Rauscher, 2003a). In précis, Rauscher
reveals, “that spatial and temporal tasks were improved following piano instruction, whereas
verbal tasks, matching tasks, copying tasks, and memory tasks were not significantly affected”
(Rauscher, p. 3). Nevertheless, none of these tasks were improved by computer instruction,
although children who received computer lessons did score significantly higher on the K-ABC’s
Expressive Vocabulary and Faces and Places tasks than children in the piano and control groups
(Rauscher).

63
The purpose of Study 2 was “to determine if the type of music instruction children
received had measurably different effects on cognition” (Rauscher, p. 2). Similar to Study 1,
Study 2 was a two-year study. Rauscher hypothesized Study 2 as “early music instruction
emphasizing different musical skills would produce correspondingly differential effects on
cognitive performance” (Rauscher, p. 2).
To support this concept, Rauscher proposes results of a recent study revealing “several
years of string and percussion instruction selectively improved auditory frequency and duration
discrimination thresholds compared to no instruction” (Rauscher, 2003a, p. 2). Therefore, Study
2 compared “the effects of three types of music training – piano, singing, and rhythm – each of
which highlights a partially non-overlapping set of musical properties” (Rauscher, p. 2).
Once again, at-risk preschool children received individual piano instruction for two years.
However, unlike Study 1, the elements of singing, rhythm, or no instruction conditions were
added. All children were pre- and post- tested using the same standardized tests as in Study 1.
For Study 2, Rauscher hypothesized “improvement in spatial-temporal tasks following all types
of music instruction, improvement in mental imagery tasks following singing instruction (due to
singing’s strong reliance on auditory imagery), and improvement in temporal tasks following
rhythm instruction (due to rhythm training’s emphasis on the temporal qualities of music)”
(Rauscher, 2003a, p. 3).
Participants included 123 male and female Head Start preschool children of mixed races
randomly assigned to four conditions: Piano (N = 34); singing (N = 28); rhythm (N = 35); and
control (N = 26) (Rauscher, 2003a).
Similar to Study 1, children in music groups received weekly individual instruction for a
period of 48 weeks over two years. Children in the control group received no special training. All

64
children were administered the same 26 subtests (pre- and post- tests) as in Study 1: K-ABC;
DTVP-2; TAPS-R; and WPSSI-R (Rauscher, 2003a).
Due to the large number of administered subtests, data from one spatial-temporal tasks
(Object Assembly – OA), one mental imagery task (Form Constancy – FC), and one temporal
task (Magic Window – MW) were presented to demonstrate the veracity of researcher
predictions (Rauscher, 2003a). Rauscher states, “data represent typical results for these task
categories” (Rauscher, p. 3).
An alpha level of .05 was used for all statistical tests. A two-factor (condition, testing)
mixed analysis of variance (ANOVA), with condition as the between-subjects factor and testing
as the within-subjects factor, was performed on the pre- and post- test scores of the OA (spatial-
temporal) task (Rauscher, 2003a).
Study 2 researchers found a main effect for testing (F (3,119) = 129.44, p < .001) and an
interaction between testing and condition (F (1,119) = 14.52, p < .001). The main effect for
condition was not significant (F (3,119) = 2.50, p = .06). Pretests scores for the four groups did not
differ. However, LSD tests revealed that posttest scores for piano, singing, and music groups
were significantly higher than those of the control group (p < .001, all). Standard scores of the
three music groups improved significantly from pretest to posttest (p < .001). Posttest scores for
music groups did not differ (Rauscher).
To illustrate effects of music instruction on mental imagery, researchers present data for
the Form Constancy (FC) task. Rauscher performed a two-factor (condition, testing) mixed
ANOVA on pre- and post- test raw scores. Standard scores rather than raw scores were used
since FC task is standardized for children 4 to 11 years of age. Main effects for condition
revealed (F (3,119) = 3.05, p < .04) and testing (F (1,119) = 175.56, p < .001). Interaction between

65
condition and testing did not reach significance (F (3,119) = 2.57, p = .06). Pretest scores of the
four groups did not differ from each other (Rauscher, 2003a).
Since raw scores were used rather than scaled scores, LSD tests found significant
differences between pre- and post- test scores for all groups (p < .001, all). Rauscher speculates,
“the improvement for the control group was presumably due to maturation” (Rauscher, 2003a, p.
4.). Nevertheless, posttest scores of three music groups were significantly different from posttest
scores of the control group (piano vs. control: p < .01). Posttest scores of the three music groups
did not differ significantly (Rauscher).
The final step in Study 2 included a two-factor (condition, timing) mixed ANOVA on
scaled pre- and post- test scores of the Magic Window (temporal, task). Analysis revealed main
effects for condition (F (3,119) = 6.63, p < .001) and testing (F (1,119) = 138.97, p < .001), and an
interaction between condition and testing (F (3,119) = 14.83, p < .001). Four groups’ pretest scores
did not differ. However, all music groups scored significantly higher in posttests than in pretests
(p < .001, all). Results of the control groups’ pre- and post- test scores did not differ significantly
(p < .15). Posttest scores of three music groups were significantly higher than those of the control
group (singing vs. control and rhythm vs. control: p < .001; piano vs. control: p < .03) (Rauscher,
2003a).
Although posttest scores of the piano and singing groups did not differ significantly (p <
.13), posttest scores of the rhythm group were higher than both the piano and singing groups (p <
.001, both). Rauscher compares this trend found in other temporal tasks administered – Number
Recall, Magic Window, and Arithmetic tasks of the K-ABC; Figure Ground task of the DTVP;
and Auditory Number Memory Forward, Auditory Number Memory Backward, and Auditory
Sentence Memory (Sequencing) tasks of the TAPS (Rauscher, 2003a).

66
Study 3 in Rauscher’s Effects of piano, singing, and rhythm instruction on the spatial
reasoning of at-risk children (2003a) was designed to investigate effects found in the first and
second studies. Specifically, Study 3 compared scores of children who received music lessons to
three groups of grade matched children: (1) Head Start children who did not receive music
instruction; (2) at-risk children who were not enrolled in Head Start; and (3) middle income
children (Rauscher, 2003a).
In addition, Rauscher’s query tests the sustention of effects well into elementary school.
Therefore, Study 3 is an extension of Study 1 and Study 2 to further examine previously-initiated
instruction and the affects on academic achievement that may extend further into elementary
school (Rauscher, 2003a).
Study 3 re-tested children who participated in the control (N = 24) and piano (N = 31)
groups in Study 1. At the time of Study 3, participating subjects, previously investigated in
preschool, were now in second grade. Music children who participated in Study 2 and currently
enrolled in kindergarten were also included. Rauscher was able to track 76 of the 97 music
students from Study 2 (piano, N = 27; singing, N = 20; and rhythm, N = 29). All children were
tested individually in their homes or schools (Rauscher, 2003a).
Children in Studies 1 and 2 received the K-ABC and Wechsler Individual Achievement
Test (WIAT), a test that measures basic reading, mathematics reasoning, spelling, reading
comprehension, numerical operations, listening comprehension, and oral expression. Tests were
administered to 27 at-risk kindergartners, 24 at-risk second-graders, 32 middle-income
kindergartners, and 28 middle-income second graders (Rauscher, 2003a).
Results of Study 3 indicate children who received music instruction in Study 1 (currently
second graders) continue to score higher on three of the four K-ABC tasks that were previously

67
enhanced by music instruction (Hand Movements, Gestalt Closure, and Arithmetic). The fourth
task, Magic Window (MW), was not standardized for children older than age 5. Therefore, MW
was not administered. Regardless, these children scored significantly higher on tasks compared
to second grade Head Start children who did not receive music instruction (Rauscher, 2003a).
When compared to grade-matched at-risk children not enrolled in Head Start, the music
group also scored significantly higher on Expressive Vocabulary and Faces and Places tasks.
Children enrolled in Head Start but did not receive music instruction scored significantly higher
than at-risk children who were not enrolled in Head Start programs on Arithmetic, Expressive
Vocabulary, and Faces and Places tasks. Rauscher suggests, “although Head Start has little effect
on spatial-temporal reasoning, it does influence children’s abilities on other non-spatial tasks
(and arithmetic)” (Rauscher, 2003a, p. 5).
As a final point, although no groups scored significantly higher than middle income
children on any of the administered tasks, scores for children in the music group were roughly
the same as those of middle-income children on spatial-temporal and arithmetic tasks. Other
groups scored significantly lower than middle-income children on all tasks (Rauscher, 2003a).
For WIAT, researchers found the music group scored significantly higher than Head Start
and at-risk children on reading, spelling, reading comprehension, mathematical reasoning,
numerical operations, and listening tasks. Head Start children scored higher than at-risk children
on reading, spelling, and reading comprehension tasks but not on mathematical reasoning or
numerical operations tasks (Rauscher, 2003a).
Children in Study 2 (currently enrolled in kindergarten) scored higher on the K-ABC’s
Arithmetic, Expressive Vocabulary, Faces and Places, Hand Movements, and Gestalt Closure
tasks than did Head Start and at-risk children. Study 2 group participants received singing, piano,
68
and rhythm instruction during the initial study as preschoolers. However, children in the rhythm
instruction group scored higher on arithmetic subtests than did singing and piano groups
(Rauscher, 2003a).
Rauscher suggests that “rhythm instruction has the strongest impact on mathematical
reasoning” (Rauscher, 2003a, p. 5). Similar to the second grade children in this study,
kindergarten Head Start children scored higher than at-risk children on Arithmetic, Expressive
Vocabulary, and Faces and Places tasks (Rauscher).
Researchers were astonished that although piano and singing groups scored equal to
middle-income children on spatial-temporal and arithmetic tasks, the rhythm group actually
scored significantly higher than middle-income children on arithmetic tests. Children in the
rhythm group also scored higher than middle-income children on mathematical reasoning and
numeracy tests of WIAT (Rauscher, 2003a).
What do the results of this study suggest? Rauscher claims, “learning music is an
important developmental activity that may help at-risk children compete academically on a more
equal basis with their middle-income peers” (Rauscher, 2003a, p. 5). Moreover, programs similar
to Head Start did improve performance on several tasks administered. However, improvement on
spatial-temporal tasks was confined to children who received music instruction. Presence of the
Hawthorne Effect was ruled out by control groups employed in Study 1. Effects of music
instruction were found to continue for at least two years after interventions concluded
(Rauscher).
Elementary School Instrumental Music Instruction and Academic Achievement
Many school instrumental music programs remove students from regular classrooms for
individual or small-group instrumental instruction. Often, “this practice causes tension among

69
teachers and administrators” (Children's Music Workshop, n.d.a, p.1). Many opposed to pull-out
lessons are concerned that students will fall behind in academic performance by missing
classroom instruction time.
A 1995 Ohio study reveals test scores of students who leave their classrooms for 30-
minute string lessons twice each week score significantly higher than students who remain in
traditional classroom settings (Children's Music Workshop, n.d.a). To make comparisons
between string and non-string students as fair as possible, researchers examine student scores on
previous standardized test – the Cognitive Abilities Test or COGAT.
Participants include 148 fourth-grade Hamilton, Ohio string students matched to a non-
string student who achieved the same verbal score on the COGAT. This revealed the analysis of
296 student scores on the Ohio Proficiency Test (OPT). The academic abilities of selected non-
string students matched the academic abilities of the string students as closely as possible
(Children's Music Workshop, n.d.a). Table 5 consists of mean Ohio Proficiency Test scores for
students in this study.
Table 5
Mean Ohio Proficiency Test Scores for String and Non-string Students.
Writing Reading Citizenship At Standard on All
Sections of the Test
Mean scores
String Students 5.05 229.5 93% 68%
Non-String Students 4.85 223.2 87% 58%
Note: Adapted from (Children's Music Workshop, n.d.a, pp. 1 - 2).
70
Researchers conclude that string students did not suffer negative effects when compared
to students of similar academic capability who remained in the classroom. In addition,
researchers conclude “the overall Ohio Proficiency Test performance of the students who
participate in string pull-out lessons was better than the performance of the students of similar
ability who did not participate in the string program” (Children's Music Workshop, n.d.a, p. 2).
Results indicate that students who study instruments in a small group or individual setting
actually improve their academic abilities, however, this study was not designed to document
improvement. Further study is needed before drawing such conclusions (Children's Music
Workshop).
The author of the Ohio report offers this analysis of what takes place during pull-out
string instruction:
When string students are excused from their classrooms for string class, they are not leaving instruction. They are moving to another classroom in a different area of the building. The concepts taught in string [lessons] go far beyond pitch and rhythm. For example, a student must understand fractions and their relationships to each other in order to manipulate rhythm. The student who has trouble understanding the abstract concept that a half is twice one quarter may comprehend the concrete example of his or her bow moving twice as far on half notes as quarter notes. The musician reads abstract concepts from the page and then translates them into concrete phenomena that involve time and space. (Children's Music Workshop, n.d.a, p. 2)
Another study investigating elementary school instrumental music was completed in
1992 by Susannah Dryden. This study linked instrumental music education and fifth grade
academic achievement. The study examined 270 fifth grade students (135 boys and 135 girls)
located in a southwestern Kansas school district with an enrollment of approximately 4,500
students. Located in a city of approximately 20,000 people, the school district consists of eight
elementary schools (Dryden, 1992).

71
The sample size incorporated 164 subjects that self-selected participation in instrumental
music instruction (band or orchestra) or nonparticipation in instrumental music instruction during
the 1991-92 school year. Those who chose instrumental music instruction included 69 males and
95 females for a total of 164 students. Demographic information was obtained from the school
district’s permanent records (Dryden, 1992).
A single factor pre- and post- test design was employed for the composite null
hypothesis. The following independent variables were investigated: participation status in
instrumental music, gender, race, socioeconomic status, family structure, mother’s level of
formal education, and length of time in the school system. The dependent variable includes The
Comprehensive Tests of Basic Skills (CTBS), Fourth Edition Levels 14 and 15. Subscale scores
for Reading Vocabulary, Reading Comprehension, Mathematics Computation, Mathematics
Concepts and Applications, Reading Total, Mathematics Total, and Total Test scores were used
for data collection. Seven composite null hypotheses were tested (Dryden, 1992).
Data collection procedures were simplified since the covariate measure had been
collected as part of the district’s annual standardized testing in April 1991. A year later, the
posttest was administered and demographic information gathered. During data analysis, Dryden
applied appropriate descriptive statistics, single-factor analysis of covariance, and least sum of
squares tests of means (Dryden, 1992).
Results of the study indicate significant findings that band participants had statistically
higher reading vocabulary and reading total achievement; males receiving instrumental
instruction scored higher statistically in reading vocabulary; and instrumental students whose
mothers had a post high school education showed statistically higher achievement in total score.
Of the 49 comparisons for main effects, 10 were significant at the .05 level (Dryden, 1992).

72
Further research regarding elementary school aged children was conducted in a 2005
causal-comparative study entitled The Impact of Instrumental Music on Student Academic
Achievement by Martha McLelland. It examines possible impacts that an instrumental music
program may have on student achievement in reading and mathematics in one school district in
the State of Delaware. Standardized testing data for 2001, 2002, 2003, and 2004 cohorts of fifth
grade students were analyzed to determine if a statistically significant difference exists in music
students as opposed to those who did not study music (McLelland, 2005).
The sample size includes 356 (N = 356) participants. The number of participants in music
education was 159 with 78 females and 81 males. Non-participants in music education include
197 (N = 197) with 82 females and 115 males (McLelland, 2005).
Third grade test scores in reading and mathematics from the fifth grade population were
used as a covariate to control for existing differences before enrollment in the music program.
Researchers also examine test scores in reading and mathematics from an eighth grade cohort
that began instrumental music in the fifth grade to provide a longitudinal assessment of
instrumental music on academic achievement (McLelland, 2005).
Results of t-tests for fifth grade scores in reading and mathematics between participants
and non-participants in an instrumental music program show a statistically significant difference
in mean values for participants in an instrumental music program in both reading and
mathematics achievement as measured by the Delaware Student Testing Program (DSTP)
scores. However, differences were mitigated by race and gender. Statistically significant
differences in academic achievement are found between gender and race but differences were not
related to participation in instrumental music (McLelland, 2005).

73
If music educators argue that students participating in instrumental music programs
achieve academically higher than those not involved in instrumental music programs, the
analysis conducted in this study neither substantiates nor disconfirms their claim. Findings,
however, do legitimize further research.
Music, Academic Achievement, and Gender Control
Studies have sought to determine interaction affects between gender and participation in
music classes and academic achievement. As extensions of a Gilleta, Vrbancic, Elias, and
Saucier (2003) study that explored the affects of Mozart’s music on women, further research has
examined the relationship between participation in music classes and academic achievement. An
analysis of the influence of music on academic achievement in urban education by Hollie Hood-
Mincey (2005), examines the effects between gender in addition to investigating the impact that
music has on reading and mathematics (Hood-Mincey, 2005).
This experiment utilized four research hypotheses that were formulated and tested at the
.05 alpha level. Two hypotheses specified that when third grade reading or mathematics
achievement is controlled, “the reading or mathematics achievement of fifth grade students who
participate in music classes is higher than that of students who do not participate in music
classes” (Hood-Mincey, 2005, p. 1). The second set of hypothesis concerned interaction
hypotheses. Hood-Mincey hypothesized that when third grade reading or mathematics
achievement is controlled, the effect of participation in music classes on fifth grade reading or
mathematics achievement is moderated by gender (Hood-Mincey).
The study population consisted of a random sample of 801 fifth grade students attending
112 schools in an urban school district in the state of Maryland. The sample was limited to those

74
students who had available third grade scores on the Comprehensive Test of Basic Skills (Hood-
Mincey, 2005).
Generated data was analyzed using the analysis of covariance (ANCOVA). Data for the
first two hypotheses were rejected (p < 0.05). However, in examining two interaction
hypotheses, each of the null hypotheses were sustained (p > 0.05). Therefore, it may be
concluded that participation in music classes has a positive affect on reading and mathematics
achievement for this research sample (Hood-Mincey, 2005). However, Hood-Mincey’s data
indicate that “gender does not moderate the effect of participation in music classes on the reading
and mathematics achievement of fifth grade students” (Hood-Mincey, p. 1).
In examining data in experiments concerning music education, gender, and academic
achievement in elementary school students, Hui (2004), Hood-Mincey (2005), and Gilleta et al.
(2003) surmise that successful academic achievement is not affected when controlling for gender
(Gilleta et al., 2003; Hui, 2004; Hood-Mincey, 2005).
Background Music and Academic Achievement in Writing
Researchers have attempted to examine the affects of background music or the actual
instruction in music and its impact on academic achievement. A study by David Koppelman and
Scott Imig at The University of Virginia examined The Effect of Music on Children’s Writing
Content. The study sample consists of 19 students from a second grade class in the
Charlottesville City School System and examines writing examples on ten separate occasions.
The students range in age from seven to nine years old. Eleven students are male; eight are
female (Koppelman & Imig, 1995).

75
The intellectual abilities of the students range from those who are on grade level to those
who are at the ability for a first grader. No student in the class is identified as gifted. One child
has been retained from the previous year (Koppelman & Imig, 1995).
All students in the class are from low socioeconomic backgrounds. Seventeen students
receive full aid from the school’s free lunch program. Two students receive partial aid
(Koppelman & Imig, 1995). Many students are domiciled in single parent families. However,
family structure cannot be definitively stated since “family situations are continually changing”
(Koppelman & Imig, p. 11).
The study consists of ten individual sessions spanning a five week period in which a
variety of background music is played during writing periods. Baseline conditions were
established using no music (pretest). Data collection sessions were held on the same two days
each week and at the same time during the day (Koppelman & Imig, 1995).
Writing sessions consists of two distinct components for each session, physical exercises
and writing. Physical exercise served two purposes: (1) as a buffer between routine class
activities and actual writing sessions; and (2) verified research has found that “moving or
exercising has a positive impact on mental functioning by sparking a feeling of excitement and
increases concept development” (Koppelman & Imig, p. 5). Writing sessions were mitigated by a
series of instructions:
1. Each student is expected to write for the entire 15 minute period. 2. No communication between students is permissible during the writing period. 3. Raise your hand if you need another sheet of paper. 4. All writing that is produced will be kept completely confidential and no one, except the researchers, will ever see the finished product. (Koppelman & Imig, 1995, pp. 12 -13). During each 15 minute writing session, students were exposed to one type of music
(classical, jazz, popular or country) or wrote in silence. The initial session was completed in
76
silence to determine a baseline for future writings. Sessions two through five involved classical,
popular, jazz, and country music, respectively. Sessions six through nine were repeated sessions
of background music played in experiments two through five, and session ten provided a second
baseline with no music being played. Volume intensities of background music for each session
involving music were kept at a constant level (Koppelman & Imig, 1995).
At the conclusion of each writing session, students were given a 5-minute opportunity to
participate in a quick draw activity to demonstrate their writings. Students who chose not to
participate were instructed to read silently for 5 minutes. Writing examples were collected and
filed after each session without scoring (Koppelman & Imig, 1995).
Since second graders “have a tendency to write ‘I love’ and ‘I like’ statements”
(Koppelman & Imig, p. 16), each writing example was examined for tone, consistency, and
number of words. Tone is defined on three levels: “positive, negative, or ambivalent” (Koppelman
& Imig, 1995, p. 13) - a self-created measure utilized during the data collection process. Negative
and ambivalent writings indicate “a trend away from these type statements” (Koppelman & Imig,
p. 16). Moreover, ambivalent writings indicate a wide range of topics used by second graders
which demonstrate “some variety in the children’s writings” (Koppelman & Imig, p. 16).
Consistency is defined as “of or pertaining to the same general theme or topic”
(Koppelman & Imig, pp. 13 -14) as defined by Donlan (1975) in analyzing student’s writing.
Writing examples had to contain three or more sentences on the same general topic to be
identified as consistent. If writing examples contained less than three sentences, all sentences had
to acquiesce to be considered as consistent. The more consistent students were in their writings,
the more they remained on task (Koppelman & Imig).

77
The number of words was analyzed using an assessment tool in a study by Mavrogenes
and Bezrucko (Mavrogenes & Bezrucko, 1994). Results were tabulated, recorded, and analyzed
for significant differences (Koppelman & Imig).
A one-tailed t-test was utilized for all statistical measures. Each measure was examined at
the .95 confidence interval. For all t-test, the degrees of freedom was 20 and the t-score at the .95
confidence interval for v = 29 is ± 1.699 (Koppelman & Imig, 1995). Results indicate areas of
statistical significance for each of the defined areas - tone, consistency, and number of words
(Koppelman & Imig).
Under the no music condition, a total of three student writings out of a sample of 31 were
considered as ambivalent for tone. Jazz proved to be statistically significant. The second graders
wrote a total of eight ambivalent writings under the jazz background music condition. The t-score
for jazz music is 2.193 which falls outside the .95 confidence interval t-score of ± 1.699
(Koppelman & Imig, 1995). There are no other statistically significant findings regarding
ambivalent stories for other music types (Koppelman & Imig).
Negative student writings were examined using investigator created tone assessment tools.
Under the no music condition, negative writings were greater in number for all music types
(Koppelman & Imig, 1995). This may be attributed to extraneous variables. However, differences
were not large enough to be statistically significant (Koppelman & Imig).
Under the no music condition, a total of 31 writings were received. Eight were defined as
inconsistent. A total of four writings proved to be statistically insignificant under the jazz music
condition. (Koppelman & Imig, 1995). However, once again, jazz in addition to top 40 (popular)
music proved to be the most statistically significant. The t-score for jazz music is -2.00 which is
outside the .95 confidence interval of ± 1.699. Of 32 collected writings, 12 were identified as

78
inconsistent under the top 40 music condition. The t-score for top 40 music is 2.00 which is
outside the .95 confidence interval. Country and classical music did not provide significant
findings in terms of consistency (Koppelman & Imig).
Students wrote a mean of 36.5 words when no music was played. However, a mean of
45.6 words were written when classical music played in the background. This score proved to be
statistically significant since the t-test score is 1.791, acceptably outside the .95 confidence
interval of ± 1.699. There are no other statistically significant findings for other types of music
(jazz, popular or country) regarding word count (Koppelman & Imig, 1995).
Of particular interest is an extraneous event that occurred during data collection. The
second grade subject’s teacher unexpectedly died. Although such occurrences are never planned,
the researchers indicate that the event “most likely affected the students’ writing selections”
(Koppelman & Imig, 1995, p. 20). However, five writing sessions were conducted prior to the
event. The final five writings, those that began with the second classical music session, were
conducted after the teacher’s death. Other than the student’s lack of motivation as “students were
experiencing a difficult time,” (Koppelman & Imig, p. 20) statistical differences were not large
enough to be statistically significant (Koppelman & Imig).
During the final writing set which included no background music, subjects called out,
“Where’s the music?” (Koppelman & Imig, 1995, p. 20). Investigators surmised not only did
“the children genuinely like listening to the music” (Koppelman & Imig, p. 20), students proved
to be more productive workers when classical and jazz music was played in the background
(Koppelman & Imig).

79
Additional research to validate this study is warranted. As evidenced, elementary teachers
may consider musical devices which children enjoy and prove to be productive for academic
achievement (Koppelman & Imig, 1995). Classical and jazz music prove to be those devices.
Summary
As research literature reveals, under the guise of domain two, Music Education and
Elementary School Academic Achievement, there are several inferences for further study. One
important aspect to consider must include age in regards to brain development and stimulation as
well as instrument choice (piano, violin, trumpet, etc.). Music instruction in early human
development and subsequent years may have an impact on academic achievement.
Possible limitations could include researcher bias. As a musician and researcher,
Rauscher and many musician-researchers have unique connections to selected subject matter
unlike traditional researchers. In replicating or developing similar research models, music
educators should use extreme caution to avoid this pitfall.
Additional limitations include subjects as volunteers and not random selection (Dryden,
1992). Moreover, in experimental studies, sample selection should include a variety of
participants. Subjects in the Dryden (1992) study are part of a single, yet small, school district.
Additionally, activities of the control groups, during times the experimental group received
instrumental instruction, were determined by individual classroom teachers. Finally, levels of
each independent variable were predetermined by available school district data (Dryden, 1992).
To validate the Dryden (1992) study, additional research and testing should have been
completed on the educational background and musical experiences of both parents and the
family/home structure (single parent home verses a two-parent home). The researcher attempted
to make correlations between the parent’s highest level of education and their child’s success in

80
instrumental music. Although findings related to the educational background of the participant’s
mother was found to be significant (Dryden, 1992), there was no mention of other family
member backgrounds.
The magnitude of the Dryden (1992) study clearly examines the impact of music
education on academic achievement for fifth grade students. Additionally, it provides
information that connects learning music to academic achievement and reveals variables not
found to be significant, such as socioeconomic status (Dryden, 1992). Dryden’s research
methodology, although not thorough, is precise, easy to understand, and replicable. Further
investigation is recommended.
In regards to McLelland (2005), there appears to be an ethical dilemma. Instead of
studying the same students over the course of time, McLelland studies different sets of students
with similar characteristics and makes comparisons. Internal validity is at stake. The research
design would have been more meaningful and accurate had McLelland followed the same group
of students from fifth grade to eighth grade or examined high school student’s middle school
academic records to make comparisons. This would have attempted to establish causal and
correlational effects in regards to music instruction and academic achievement.
As the development of additional research is considered, the elements and factors found
in research studies that are pertinent and applicable to the impact of music education on
elementary school academic achievement must be calculated.
Music Education and Secondary School Academic Achievement
Participation in Music and Athletic Activities
According to a report from the National Center for Education Statistics, 94% of public
secondary schools offer separate instruction in music (Music Educators National Conference, 1994).
81
However, what impact does music education play in regards to academic achievement in core
subjects?
A study completed by Timothy Schneider and Jack Klotz attempted to answer this
question. Schneider and Klotz (2000) investigated the impact of music education and athletic
participation on academic achievement. Expanding sample size and age of participants, this study
sought to determine if participation as a musician or an athlete had an affect on academic
achievement as measured by standardized test scores.
Similar to Rauscher and Zupan (2000) and Rauscher (2003a) preschool and elementary
studies, Schneider and Klotz hypothesized that secondary students who received training as
musicians would score higher on core battery composites of reading, language, and mathematics
sections of the California Achievement Test than their athletic and non-musician peers, and that the
amount of time spent (years of music study or athletic participation) would have a significant affect
on test scores (Schneider & Klotz, 2000).
Participants in this study include 346 students who perform in the band or choir, are
athletes, or are non-participants in either – music or athletics – in a large suburban/urban school
district in the southeast United States. The schools represented in this study reflect a cross
section of different types of music programs (Schneider & Klotz, 2000).
All data are collected from the core battery reading, language, and mathematics scores of
the California Achievement Test from 1991 through 1995 in grades 5 through 9. A multiple
analysis of variance is employed to test for significant relationships between the dependent
variables of reading, language, and mathematics and the independent variables of musician,
athlete, and non-musician/non-athlete for each year of the study. Pairwise comparisons are
accomplished using Tukey’s HSD post hoc tests (Schneider & Klotz, 2000).
82
Results of statistical procedures reveal that all groups are statistically equivalent in grades
5 and 6. In the seventh, eighth, and ninth grades, musicians achieve significantly higher
mathematics and language scores than athletes. Although musicians do not significantly
outperform non-musicians/non-athletes, by ninth grade, musicians’ standardized test scores tend
to stabilize while athletes and non-musician/non-athletes show a downward trend (Schneider &
Klotz, 2000).
Additional findings show that although mean scores for musicians are higher than non-
musicians/non-athletics, participation in music is not a conclusive factor in predicting
statistically higher academic scores than those of non-musicians and non-athletics. However,
musicians do score higher than athletes, and over time this gap widens. Findings indicate that
factors other than enrollment in a performing music class are affecting outcomes. Results also
indicate an overall drop in standardized test scores in ninth grade that is not seen for student
musicians (Schneider & Klotz, 2000).
Instrumental Music and Academic Achievement
Another study examined the impact that a formal public school instrumental music
instruction program has on middle school student's reading and mathematics achievement. The
purpose of the study, completed by Gerald Babo in 2001, set out to determine if participation in a
formal public school instrumental music program has a positive impact on grade eight middle
school student’s academic achievement and if a possible causal relationship exists. The
conceptual premise for this research is based on previous findings of Rauscher (1999) and others
who determine that instrumental and vocal music instruction with preschool students has a direct
impact on neural development in the area of the brain that controls spatial reasoning. Spatial
reasoning ability has been directly linked to success in mathematics (Babo, 2001).

83
The research design analyzes testing data from the California Achievement Test and the
New Jersey Grade Eight Proficiency Assessment in reading and language arts and mathematics
for 93 students enrolled in an instrumental music program and 85 students not enrolled in an
instrumental music program during the 1998 and 1999 academic years. The study is conducted to
determine if differences exists between the two groups and the impact, if any, participation in an
instrumental music program has on academic achievement. The studies of D. Zanutto and J.
Anello, both of whom look at significant differences in academic achievement between
instrumental music students and non-instrumental music students, led Babo (2001) to propose a
similar study of data using multiple regression analysis to determine the impact participation in
an instrumental music program has on academic achievement while controlling for variables of
intelligence quotient, socioeconomic status, and gender (Babo, 2001).
Twelve null hypotheses are examined with eight being rejected, two accepted, and two
demonstrating mixed results that determine participation in a formal instrumental music
instruction program does have an impact on reading and language arts achievement of an eighth
grade student, and that the effect is between 10% and 16% contributing the strongest impact on
reading and language arts achievement. Research also determines that intelligence quotient and
socioeconomic status has the greatest impact on reading and language arts and mathematics
achievement and the existence of a possible causal relationship between participation in
instrumental music and superior academics may be proposed (Babo, 2001).
Music Participation and Grade 12 Core Academic Subjects
An extensive study recently completed in Canada examines The Relationship Between
Achievement and Participation in Music and Achievement in Core Grade Twelve Academic
Subjects. This investigation by Peter Gouzouasis, Martin Guhn, and Nand Kishor at The

84
University of British Columbia in Vancouver examines the extent to which academic
achievement of Grade 12 students is related to achievement and participation in music courses
for three consecutive cohorts of different students (Gouzouasis, Guhn, & Kishor, n.d.).
The purpose of this study is to investigate the extent to which achievement in music
courses is predictive of academic achievement in three most commonly taken British Columbia
provincially examinable subjects (English, mathematics, and biology). In addition, it examines if
there are group mean differences in academic achievement between students participating in
music and students that are not participating in music (Gouzouasis et al., n.d.).
Participating subjects include grade 11 and 12 students for three consecutive cohorts in
the academic years 2000 - 2001 (N = 54, 348), 2001–2002 (N = 69, 475), and 2002–2003 (N =
60, 742). Examination data is pulled from student’s Ministry of Education’s annual Student
Level Data Collection (SLDC) (Gouzouasis et al., n.d.).
Additionally, student performance scores on provincial tests are collected from the
Transcript and Examination (TRAX) files and matched with the Personal Education Number
(PEN) which are codes that uniquely identify all K-12 students. Resulting data files are merged
with Ministry of Education data which contain academic marks for Grade 11 music courses.
Merged files are transposed to yield one row of data consisting of Grade 11 music scores and
provincial exam scores for each student (Gouzouasis et al., n.d.).
In British Columbia, provincial examinations may be taken up to three times. Since
students select the best score for university applications, for investigation purposes, the “best
examination percent score” (Gouzouasis et al., n.d., p. 2) is selected as the indicator of academic
achievement in the subject. Provincial examination scores only are used since they stem from
standardized tests and allow for comparisons across schools (Gouzouasis et al.).

85
In order to assess the validity of provincial examination scores, correlations between
provincial examination scores and school grades in the same subject are calculated. Results
indicate correlations consistently in the range from .90 to .97 (Gouzouasis et al., n.d.). These
high correlations justify the researchers approach to use standardized provincial examination
scores as “ecologically valid indictors of academic achievement” (Gouzouasis et al., p. 6).
Two types of analyses are conducted for the 2001, 2002, and 2003 cohorts. First, simple
linear regressions are utilized to examine the extent to which grades in Grade 11 music courses
predict academic achievement in Grade12. Researchers individually examine relationships
between (a) band, (b) strings, (c) choir, and (d) music composition as well as relationships
between (i) mathematics, (ii) English, and (iii) biology. Analysis is completed to examine “if
there was a relationship between music achievement and general academic achievement; in other
words, if the degree of musical training and excellence as assessed via the music course grades
was associated with the degree to which these students also excelled in other general academic
courses” (Gouzouasis et al., n.d., p. 6).
Analysis of data reports a consistent pattern of results across all three cohorts. All results
indicate a positive correlation between achievement in music courses and achievement in core
subjects. Table 6 presents data for Grade 12 music predictors in mathematics for the 2001, 2002,
and 2003 cohorts. Correlation coefficients are attained using simple regression in SPSS for each
core subject (Gouzouasis et al., n.d.).
Music subjects as predictors of achievement in Grade 12 English are presented in Table 7.
As in mathematics, analyses of data indicate a consistent pattern of results across all three cohorts.

86
Table 6
Music Subjects as Predictors of Achievement in Grade 12 Mathematics.
Mathematics
Correlation N (sample size) p-value
Year 2001 2002 2003 2001 2002 2003 2001 2002 2003
Band 11 0.18 0.16 0.15 316 426 380 <.001 <.001 .002
String 11 0.28 0.29 0.27 101 103 176 .003 .002 <.001
Choir 11 0.16 0.27 0.25 215 306 273 .010 <.001 <.001
Comp. 11 0.48 0.36 0.53 23 43 59 NA NA NA
Note: From Gouzouasis, P., Guhn, M., & Kishor, N. (n.d.). The relationship between achievement and participation in music and achievement in core grade twelve academic subjects. Retrieved July 3, 2006, from http://bcmusiccoalition.homestead.com/Predict_music_pg_mg_v_B40C7.pdf, p. 18.
Table 7
Music Subjects as Predictors of Achievement in Grade 12 English.
English
Correlation N (sample size) p-value
Year 2001 2002 2003 2001 2002 2003 2001 2002 2003
Band 11 0.21 0.12 0.26 132 161 155 .003 .065 <.001
String 11 0.24 0.08 0.08 138 187 244 .002 .138 .106
Choir 11 0.25 0.10 0.15 263 314 241 <.001 .038 .010
Comp. 11 0.47 0.23 -.17 32 65 59 NA NA NA
Note: From Gouzouasis, P., Guhn, M., & Kishor, N. (n.d.). The relationship between achievement and participation in music and achievement in core grade twelve academic subjects. Retrieved July 3, 2006, from http://bcmusiccoalition.homestead.com/Predict_music_pg_mg_v_B40C7.pdf, p. 19.

87
Average correlations between music course achievement and math and biology (r = .22 and
r = .26, respectively) are equal to medium effect sizes. In addition, correlations between music and
English are equal to a small effect size (r = .16) (Gouzouasis et al., n.d.). Fisher z-Transformation
as described in Bortz (Gouzouasis et. al.) is used to calculate average correlations.
Finally, Table 8 presents Grade 12 biology achievement using music courses as predictors.
As in mathematics and Grade 12 English, analysis of data shows a consistent pattern of results
across all three cohorts.
Table 8
Music Subjects as Predictors of Achievement in Grade 12 Biology.
Biology
Correlation N (sample size) p-value
Year 2001 2002 2003 2001 2002 2003 2001 2002 2003
Band 11 0.26 0.27 0.17 119 165 161 .002 <.001 .016
String 11 0.44 0.37 0.36 56 87 112 <.001 <.001 <.001
Choir 11 0.11 0.28 0.25 141 178 163 .097 <.001 <.001
Comp. 11 0.44 0.27 0.25 12 15 38 NA NA NA
Note: From Gouzouasis, P., Guhn, M., & Kishor, N. (n.d.). The relationship between achievement and participation in music and achievement in core grade twelve academic subjects. Retrieved July 3, 2006, from http://bcmusiccoalition.homestead.com/Predict_music_pg_mg_v_B40C7.pdf, p. 20.
In their second analysis, Gouzouasis et al. conduct t-tests for independent samples, as
measured by provincial exam scores, to examine group differences in mean academic achievement
between Grade 11 students who participate in music courses and those who did not. A consistent
pattern of differences in academic achievement is found between music students and the group that
do not. Moreover, group differences are consistent across cohorts (Gouzouasis et al., n.d.).
88
Most notably, eleventh grade band students have higher achievement in all three
examined core subjects. For math, the difference is consistently more than ten percentage points
with substantial effect sizes (d = .38 to .61). Biology group differences are equally large (11 to
13 percentage points) and even larger effect sizes (d = .53 to .65) due to smaller variation of
scores measured in standard deviation. Differences are less pronounced in English which range
from 2 to 9 percentage points and effect sizes from d = .10 to .75, respectively (Gouzouasis et al.,
n.d.).
Due to large sample sizes, all independent sample t-tests are significant (p < .0001)
except effect sizes close to zero (i.e., d < .02). Statistical power to detect small effect sizes (d =
.2) in all cases is greater than .99 (Gouzouasis et al., n.d.).
Similar to eleventh grade band students, students participating in eleventh grade string,
choir and music composition courses show consistently higher achievement in mathematics and
biology. Two t-tests are not conducted since “data contained fewer than 20 cases which had
participated in that Grade 11 course and had taken the provincial exam in Grade 12” (Gouzouasis
et al., n.d., p. 8). Effect sizes, however, are not as large as participants in eleventh grade band (d
= .06 to .53). Systematic relationships for English do not appear since effect sizes are zero or
nearly below or above zero (Gouzouasis et al.). Mean percentage scores of the 2001 cohort in
core subjects (mathematics, English, and Biology) in Grade 12 achievement, and effect sizes in
Cohen’s d (group mean differences in standard deviations), and r (correlation coefficients) for all
groups (all students, band, string, choir, and composition) are presented in Table 9.
Effect sizes in comparison to “all students” mean scores using Cohen’s d (group mean
differences in standard deviations) and as correlation coefficients r are presented in Table 10.

89
Table 9
Mean percentage scores of Achievement in Grade 12 Mathematics, English, and Biology, for the
2001 cohort, for four groups: All students; Participants of Band Grade 11; Participants of String
Grade 11; Participants of Choir Grade 11; Participants of Composition Grade11.
All students Band String Choir Composition
Mean Scores
Math 68.3 78.5 73.3 74.0 76.3
2001 Biology 64.6 75.5 68.1 68.3 NA
English 69.8 78.9 69.0 71.5 74.5
Note: From Gouzouasis, P., Guhn, M., & Kishor, N. (n.d.). The relationship between achievement and participation in music and achievement in core grade twelve academic subjects. Retrieved July 3, 2006, from http://bcmusiccoalition.homestead.com/Predict_music_pg_mg_v_B40C7.pdf, p. 21.
Table 10
Effect sizes in comparison to “all students” mean scores using Cohen’s d (group mean
differences in standard deviations) and as correlation coefficients r.
All group comparisons are with the “all students” mean scores.
Effect sizes in comparison to Band String Choir Composition
“All students” mean scores d r d r d r d r
Mathematics .61 .29 .29 .14 .33 .17 .48 .23
2001 Biology .62 .30 .20 .10 .21 .10 NA NA
English .75 .35 -.07 -.03 .14 .07 .37 .18
Note: From Gouzouasis, P., Guhn, M., & Kishor, N. (n.d.). The relationship between achievement and participation in music and achievement in core grade twelve academic subjects. Retrieved July 3, 2006, from http://bcmusiccoalition.homestead.com/Predict_music_pg_mg_v_B40C7.pdf, p. 21.

90
Data regarding the 2002 cohort mean percentage scores of achievement in Grade 12
mathematics, English, and biology for four groups: all students; Grade 11 band participants;
Grade 11 string participants; Grade 11 choir participants; and Grade 11 composition participants
is presented in Table 11.
Table 11
Mean percentage scores of Achievement in Grade 12 Mathematics, English, and Biology for the
2002 cohort, for four groups: All student; Participants of Band Grade 11; Participants of String
Grade 11; Participants of Choir Grade 11; Participants of Composition Grade 11.
All students Band String Choir Composition
Mean Scores
Math 68.6 77.2 71.4 72.7 75.6
2002 Biology 64.5 74.3 66.9 68.0 NA
English 64.8 66.8 63.0 64.7 62.5
Note: From Gouzouasis, P., Guhn, M., & Kishor, N. (n.d.). The relationship between achievement and participation in music and achievement in core grade twelve academic subjects. Retrieved July 3, 2006, from http://bcmusiccoalition.homestead.com/Predict_music_pg_mg_v_B40C7.pdf, p. 22.
Data regarding effect sizes in Cohen’s d (group mean differences divided by standard
deviation) and as correlation coefficients r are presented in Table 12. All group comparisons are
with the “all students” mean scores.
Mathematics, English, and biology mean percentage scores for all groups (all students,
Grade 11 band, Grade 11 string, Grade 11 choir, and Grade 11 composition) for the 2003 Grade
12 cohort are presented in Table 13.

91
Table 12
Effect sizes in Cohen’s d (group mean differences divided by standard deviation) and as
correlation coefficients r. All group comparisons are with the All students mean scores.
Effect sizes in comparison to Band String Choir Composition
Overall mean scores d r d r d r d r
Mathematics .38 .19 .12 .06 .19 .10 .31 .15
2002 Biology .53 .26 .12 .06 .17 .08 .13 .06
English .10 .05 -.09 -.05 .00 .00 -.12 -.06
Note: From Gouzouasis, P., Guhn, M., & Kishor, N. (n.d.). The relationship between achievement and participation in music and achievement in core grade twelve academic subjects. Retrieved July 3, 2006, from http://bcmusiccoalition.homestead.com/Predict_music_pg_mg_v_B40C7.pdf, p. 22.
Table 13
Mean percentage scores of Achievement in Grade 12 Mathematics, English, and Biology for the
2003 cohort, for four groups: All students, Participants of Band Grade11; Participants of String
Grade 11; Participants of Choir Grade 11; Participants of Composition Grade 11
All students Band String Choir Composition
Mean scores
Math 69.3 79.2 73.0 72.3 75.1
2003 Biology 63.4 77.2 64.7 67.6 67.5
English 64.6 68.0 64.8 65.0 59.1 Note: From Gouzouasis, P., Guhn, M., & Kishor, N. (n.d.). The relationship between achievement and participation in music and achievement in core grade twelve academic subjects. Retrieved July 3, 2006, from http://bcmusiccoalition.homestead.com/Predict_music_pg_mg_v_B40C7.pdf, p. 23.
Data for effect sizes in using Cohen’s d (group mean differences in standard deviations)
and as correlation coefficients r is presented in Table 14. All group comparisons are with the “all
students” mean scores.
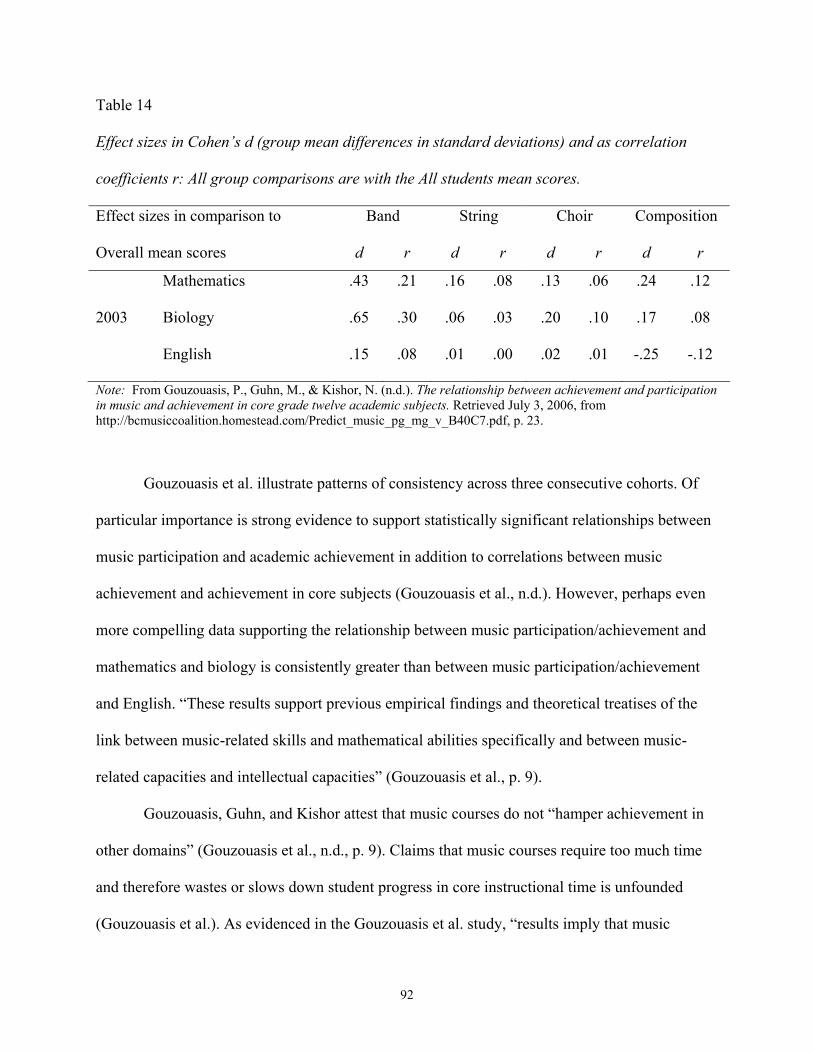
92
Table 14
Effect sizes in Cohen’s d (group mean differences in standard deviations) and as correlation
coefficients r: All group comparisons are with the All students mean scores.
Effect sizes in comparison to Band String Choir Composition
Overall mean scores d r d r d r d r
Mathematics .43 .21 .16 .08 .13 .06 .24 .12
2003 Biology .65 .30 .06 .03 .20 .10 .17 .08
English .15 .08 .01 .00 .02 .01 -.25 -.12
Note: From Gouzouasis, P., Guhn, M., & Kishor, N. (n.d.). The relationship between achievement and participation in music and achievement in core grade twelve academic subjects. Retrieved July 3, 2006, from http://bcmusiccoalition.homestead.com/Predict_music_pg_mg_v_B40C7.pdf, p. 23.
Gouzouasis et al. illustrate patterns of consistency across three consecutive cohorts. Of
particular importance is strong evidence to support statistically significant relationships between
music participation and academic achievement in addition to correlations between music
achievement and achievement in core subjects (Gouzouasis et al., n.d.). However, perhaps even
more compelling data supporting the relationship between music participation/achievement and
mathematics and biology is consistently greater than between music participation/achievement
and English. “These results support previous empirical findings and theoretical treatises of the
link between music-related skills and mathematical abilities specifically and between music-
related capacities and intellectual capacities” (Gouzouasis et al., p. 9).
Gouzouasis, Guhn, and Kishor attest that music courses do not “hamper achievement in
other domains” (Gouzouasis et al., n.d., p. 9). Claims that music courses require too much time
and therefore wastes or slows down student progress in core instructional time is unfounded
(Gouzouasis et al.). As evidenced in the Gouzouasis et al. study, “results imply that music

93
participation benefits students in ways that are directly or indirectly linked to higher academic
achievement…and specifically in regard to mathematics and biology” (Gouzouasis et al., p. 10).
However, based on current data analysis, Gouzouasis et al. caution that claims of
causality cannot be made since students have not been randomly assigned to music courses and
data collection regarding previous musical and academic histories has not been completed
(Gouzouasis et al., n.d.). On the other hand, Gouzouasis et al. argue a plausible explanation for
the strong relationship between music participation and academic achievement and it is “in line
with a number of emerging insights in music education research” (Gouzouasis et al., p. 10).
Music Participation, Acquisition of Complex Academic and Social Skills, and Academic Transfer
In British Columbia, band programs in schools have had a long tradition of excellence.
Thus, tradition implies that Grade 11 band students have learned to play a musical instrument
over the course of several years (Gouzouasis et al., n.d.). In other words, “students in Band 11
typically have acquired the complex skills that are required to play an instrument in a band, as
well as the social emotional skills that are necessary to be a contributing member of a band”
(Gouzouasis et al., p. 10).
Researchers infer that discipline, collaboration, patience, and motivation (Gouzouasis et
al., n.d.) contribute to lasting traditions and high academic achievement for music students.
The relationships that we found between music courses and academic achievement are similar to other empirical studies (Gouzouasis et al., n.d.) that found a correlation between music involvement and academic achievement. Our findings also support the conclusion of Catterall, Chapleau, and Iwanaga (1999) that students involved in music are “doing better than those who are not – for whatever constellation of reasons.”
(Gouzouasis et al., n.d., p. 11)
Skeptics argue that students who possess better academic skills have more time on their
hands to participate in music. Therefore, music attracts high achievers (Gouzouasis et al., n.d.).
94
In opposition, the attraction of non-musical, extra-curricular subjects, and activities is high for
every student. Gouzouasis et al. contend:
All students do spend much of their time on some extra-curricular activities…Our findings, other studies, and common sense clearly support the notion that the type of extra-curricular activities (e.g., playing an instrument versus playing video games) has differential effects on the person’s skill acquisition and personality development. (Gouzouasis et al., n.d., p. 11).
In a sense, “students who participate in music may gain a more positive attitude toward
school and toward learning (Gouzouasis et al., p. 11). In other words, as is reflected in provincial
examination scores, “students who feel they are achieving positively in music may have more
positive attitudes toward learning while their non-music participation peers are more negative
toward learning” (Gouzouasis et al., pp. 11 - 12).
A small number of randomized control group design studies have attempted to investigate
established causal relationships between music and general academic achievement and between
music and social skills or personal traits. For example, cited researchers have conjectured: Does
music instruction provided to experimental groups lead to academic gains in comparison to
control groups not receiving music instruction? (Gouzouasis et al., n.d.).
More recent studies (Rauscher, 2003b) conclude that, depending on the type of music
instruction, some skills learned in a music context are transferable to other contexts. For
instance, spatial-temporal skills acquired in music instruction apparently benefit spatial-temporal
tasks in mathematics (Babo, 2001; Eady & Wilson, 2004; Gouzouasis et al., n.d.; Haynes, 2003;
Hetland, 2000; and Hood-Mincey, 2005).
In regard to social skills and personality traits, longitudinal studies have found personal,
social, and motivational effects of involvement in music. Effects of three years of piano
instruction on children’s academic achievement, school performance and self-esteem (Costa-

95
Giomi, 2004) reveals evidence that involvement in musical competencies (piano instruction)
have specific benefits in the development of self-esteem including reduction in aggressive and
anti-social behaviors.
Further studies reveal an increase in pro-social behavior (Gouzouasis et al., n.d.).What is
significant in these studies is the use of multi-year longitudinal designs that find musical effects
steadily increase pro-social behavior and such effects persist over time (Gouzouasis et al.).
Summary
In comparing results of the Dryden (1992), Babo (2001), Schneider and Klotz (2000),
and Gouzouasis, Guhn, and Kishor (n.d.) studies, only Babo (2001) and Gouzouasis et al.(n.d.)
investigations reveal or attempt to reveal a more causal relationship between music instruction
and academic achievement. Babo examines factors (IQ and socioeconomic status) not considered
in earlier studies and Gouzouasis et al. expand upon those variables. There in of itself justifies
the need for further research if not for validation purposes.
Specifically, valid information revealing musical elements of a causal nature are needed.
Excluding the Babo (2001) and Gouzouasis et al. (n.d.) studies, there appears to be few examples
that investigate the impact of music education on academic achievement in core subjects in
regards to contributory relationships. However, a number of studies are correlational or
qualitative in design which limits their ability to establish causal relationships between the arts
and other areas of academic development (Horowitz, 2005).
Horowitz (2005) suggests that complexities in designing successful transfer studies in the
arts may be contingent upon traditional, linear ideas of transfer and cognitive development.
Contemporary theorists propose a dynamic interaction of learning with and across multiple
domains of learning and thinking (Horowitz, 2005).
96
As evidenced by research at the University of Washington and a number of Frances
Rauscher studies (University of Washington, n.d.; Rauscher et al., 1993; Rauscher, 1997;
Rauscher & Shaw, 1998; Rauscher, 1999; and Rauscher, 2003b), neuroscientists and educational
researchers recommend a variety of conceptual models that transfer hypotheses of multi-
dimensional designs and interactive learning that reach within and across subjects and
philosophical thought (Horowitz, 2005).
Furthermore, unlike Dryden (1992), additional research comparable to Schneider and
Klotz (2000) are needed to show both causal and correlational relationships between music
education and academic achievement in core subjects. Schneider and Klotz (2000) validate their
study by evaluating participants over the course of several years where as Dryden (1992)
evaluates subjects over a period of several months. Furthermore, Schneider and Klotz (2000)
include musicians and athletes in addition to a larger sample size. In contrast, the Dryden (1992)
study has fewer participants and focuses only on student musicians.
Integrating Music Education in Core Subjects and Academic Achievement
There is a growing body of evidence that music instruction can significantly strengthen
students’ academic performance (LaRussa, 2006). However, the integration of the arts,
specifically music into core subjects, has gained equal attention over the last several years
(Mason, Steedly, & Thormann, n.d.). As music education is weaved in core subjects lesson
plans, educators “enable students to be active, to experience things directly, and to express
themselves in ways best suited to the students” (Corbett, Wilson, & Morse, 2002, p. 17).
One goal of arts integration is to use music as a tool to allow students to have direct
experiences, be involved in making decisions about their learning, and be engaged in lessons that
are motivating (Mason et al.). Encouraging teachers to use a “project based” approach to

97
instruction provides students opportunities to use the arts to demonstrate their understanding of
specific content often with themes that span a number of academic disciplines.
With a project-based approach, students might “draw pictures, develop collages, or multi-
media productions, or even perform skits to demonstrate their knowledge of a particular theme in
science, math, social studies, or the language arts” (Mason et al., p. 3) – all the while
demonstrating a deeper understanding of the subject matter before them.
In direct contrast to the return to basics continuum, recent data indicate that the arts can
be instrumental in increasing literacy. Ingram and Reidel in 2003 found “for students in grades
three, four, and five, arts integration is significantly related to gain scores in reading” and that
“arts integration is more effective for third grade ELL [English Language Learners] students and
third grade students from low socioeconomic homes [than for students in general]” (Ingram &
Reidel, 2003, p. 26).
Start With Arts Program (SWAP)
The latest research involves a two year study in two phases of first and second graders at
two Pawtucket, Rhode Island elementary schools. The study reveals “strong evidence that
sequential, skill building, instruction in art and music, integrated with the rest of the curriculum,
can greatly improve children’s performance in reading and math” (Children's Music Workshop,
n.d.b, p. 2).
The study consists of a “test arts” program (called the “Start With Arts Program”)
developed by music teacher Donna Jeffreys and her colleagues. This collaborative project
includes The Music School (in Providence, Rhode Island), arts specialists in the Pawtucket
school division, and the Kodaly Center of America. The collaborative team believes that “the

98
keys to the improvements in math and reading are the sequential skill building arts curricula and
the integration with the rest of the curriculum” (Children's Music Workshop, n.d.b, p. 2).
The study was designed to integrate the areas of art and music with classroom subjects
such as reading and math, while maintaining the integrity of the arts curricula (Children's Music
Workshop, n.d.b). It included 96 students that range in age from 5 to 7 years of age in eight first-
grade classrooms (Children's Music Workshop, n.d.b).
Martin Gardiner, a biophysicist and research director at The Music School, and his
colleagues theorize that “learning arts skills forces mental ‘stretching’ useful to other areas of
learning” (Children's Music Workshop, n.d.b, p. 2). For example, the math’s learning advantage
(found in this study) could reflect the development of mental skills such as ordering and other
elements of thinking on which mathematical learning at this age also depends (Children's Music
Workshop).
For the first phase of this study, participating classes were divided into four “test arts”
groups (Children's Music Workshop, n.d.b). Two “test arts” groups were established in each of
the two schools. Students in these classrooms participated in music and visual arts programs that
emphasized sequential skill development and an integration of music and visual art with other
curricula (Children's Music Workshop, n.d.b). “Test arts” classrooms received one hour of music
and one hour of visual art per week. The four control classrooms (two in each school) received
the school system’s standard visual arts and music sessions (one hour of visual arts and forty-five
minutes of music in alternating weeks) (Children's Music Workshop).
After seven months, all students were administered standardized first-grade Metropolitan
Achievement Tests. Gardiner compared the results of this test with kindergarten achievement test
scores of 83% of students for whom kindergarten scores were available. Results indicate,

99
although students in the test arts classes had started behind the control students in regard to
percentage of students at or above the national average of other kindergarten students on
Metropolitan Achievement Test scores, they had caught up to statistical equality in reading, and
had pulled ahead in mathematics (Children's Music Workshop, n.d.b). Moreover, 77% of those
in “test arts” classes were now at or above grade level in mathematics as compared to 55% of
students in control groups (Children's Music Workshop).
The following year, the second phase of the experiment was continued in four “test arts”
and five control classrooms. Participating students had been promoted to second grade and were
attending the same schools as in the previous year. Achievement tests were again given at the
seven month interval. As in the first year, test and control groups were equal on reading and,
once again, “test arts” students were ahead in math. The percentage of students at or above grade
level in second-grade math was highest in students with two years of the “test arts” program,
lower in those with one year of the “test arts” program, and lowest in students who had no “test
arts” participation (Children's Music Workshop, n.d.b).
Artful Learning: A School Reform Model
Leonard Bernstein envisioned that “music and all the artistic disciplines could be used to
improve any student’s academic achievement by instilling a love of learning while engaging
them in the process” (The GRAMMY Foundation: Leonard Bernstein Center for Learning, 2004,
p. 8). The GRAMMY Foundation’s Leonard Bernstein Artful Learning: A School Reform Model
places the arts at the center of learning.
Artful Learning provides educators the needed structure to infuse their curriculum with
arts-based skills and strategies that have lasting and practical applications to academic rigor. The
Foundation assists schools and communities achieve educational excellence by allowing students
100
to make interdisciplinary connections through total engagement, thus, promoting “our rich
cultural legacy as a catalyst for lifelong learning” (The GRAMMY Foundation: Leonard
Bernstein Center for Learning, 2004, p. 7).
The Leonard Bernstein Center (LBC) firmly believes the “expert in the classroom is the
teacher” (The GRAMMY Foundation: Leonard Bernstein Center for Learning, 2004, p. 5).
Therefore, artful learning empowers educators with confidence to use the arts daily in their
classroom without supplanting the expertise and necessity of the resident arts specialists. This is
accomplished through professional development opportunities which empower educators to
design engaging, content-rich, interdisciplinary Bernstein Units of Study that will actively
engage students (The GRAMMY Foundation: Leonard Bernstein Center for Learning).
Teachers, administration, and support staff participate in 116 hours of professional
development for implementation of the Artful Learning model. In addition, the Principal
Leadership Institute: Artful Leadership is held annually to support the leadership component of
successfully managing a Bernstein School (The GRAMMY Foundation: Leonard Bernstein
Center for Learning, 2004).
Artful Learning professional development provides practical training to develop and
implement Bernstein Units of Study (BUS) that are grounded in academic standards and
evaluated with comprehensive and authentic assessment measures. Use of the intuitive and
groundbreaking BUS Authoring Tool will allow educators the ability to “write a Unit of Study
using the arts-infused Artful Learning School Reform methodology linking national, state, and
local standards into the document, automatically, without ever leaving artfullearning.com” (The
GRAMMY Foundation: Leonard Bernstein Center for Learning, 2004, p. 8). This BUS

101
document can be modified, printed, and then archived for other Bernstein teachers to browse,
adapt, or use.
The GRAMMY Foundation is dedicated to engaging students of all ages through music
and arts-based education programs. With initiatives that include mentoring, preservation
programs, and the Leonard Bernstein Center’s Artful Learning™ School Reform Model, the
Foundation strives to cultivate understanding, appreciation and advancement of the arts across
the country (The GRAMMY Foundation: Leonard Bernstein Center for Learning, 2004).
Many school districts utilize a variety of programs that target specific academic
deficiencies. While many of these mandated programs are beneficial, some can be restrictive to
the innovative educator. Artful Learning is flexible enough to recognize the value of these
initiatives and utilize them in unit development without sacrificing the integrity of the Bernstein
Model or the intent of the mandated programs (The GRAMMY Foundation: Leonard Bernstein
Center for Learning, 2004, p. 5).
With this positive reformation of thought toward teaching, educators nationwide have
come to realize that the Bernstein Model is their curriculum, not an “add-on” program. Guided
by content standards infused with arts-based skills and strategies, this revolutionary approach
provides the scaffolding to develop student and teacher growth and sustainability (The
GRAMMY Foundation: Leonard Bernstein Center for Learning, 2004, p. 5).
Why does Artful Learning work? The GRAMMY Foundation is committed to developing
each school in the Leonard Bernstein Center consortium with the capacity to use and understand
student achievement data. Initial data from early Bernstein schools report a trend towards
significant student achievement growth compared to the academic growth of other schools in the
district not implementing the Artful Learning methodology. (The GRAMMY Foundation:

102
Perc
ent
0102030405060708090
100
2000 2001 2000 2001
SchoolDistrict
Leonard Bernstein Center for Learning, 2004, p. 5) Exemplars of this trend are presented in
Figures 7, 8, and 9.
Figure 7 presents a 20% growth of LBC students meeting or exceeding Grade 4 reading
and language arts achievement on criterion-based assessments in 2000 to 2001 as compared to an
8% growth for schools as a whole in surrounding districts.
Reading Language Arts
Figure 7. Grade 4 Reading and Language Arts Criterion-Based Assessments.
Percent of Students Meeting or Exceeding Standards.
Note: From the GRAMMY Foundation: Leonard Bernstein Center for Learning (2004). Artful learning: A school Reform model. Retrieved May 27, 2006, from http://artfullearning.com/index.html, (p. 5).
Figure 8 shows the same trend for reading achievement in another Leonard Bernstein
Center for Learning school (LBC) with twice the growth in student achievement at the LBC
school compared to schools as a whole in the surrounding district.

103
Perc
ent
0102030405060708090
100
2000 2001
SchoolDistrict
Figure 8. Grade 5 Statewide Reading Assessment.
Percent of Students Meeting or Exceeding Standards. Note: From the GRAMMY Foundation: Leonard Bernstein Center for Learning (2004). Artful learning; A school reform model. Retrieved May 27, 2006, from http://artfullearning.com/index.html, (p. 6).
Figure 9 presents a similar example of student writing achievement with Leonard
Bernstein Center for Learning students exhibiting 20% growth in writing scores compared to less
than 10% of growth for schools in the surrounding district. Evidence of change are evident in
results of significant measurable gains in: visual transformation of the school-site through art
creations in all academic disciplines; reduced behavior problems; increased student enthusiasm
for learning through an arts-infused curriculum; teacher leadership; and collaborative team
building for differentiated instruction of various student populations eventually leading to a
culture of continuous learning through the arts and best school practices (The GRAMMY
Foundation: Leonard Bernstein Center for Learning, 2004, p. 9).

104
Figure 9. Grade 8 Writing Assessment.
Percent of Students Meeting or Exceeding Standards.
Note: From the GRAMMY Foundation: Leonard Bernstein Center for Learning (2004). Artful learning; A school reform model. Retrieved May 27, 2006, from http://artfullearning.com/index.html, (p. 6). Integrating Music into Social Studies
Integrating Music into Social Studies
As education reform moved into the 21st century, additional research studies are found to
support music education. In 2003, Cheryl Brogla-Krupke completed an inquiry entitled
Improving Student Achievement Through the Use of Music Strategies. This study investigates the
implementation of music strategies to improve student achievement. Participants include fifth
grade students in a small Midwestern community located in Iowa. The absence of music
integration in social studies curricula was observed through data, which indicated the lack of
motivation and in-depth learning experienced by students (Brogla-Krupke, 2003).
To validate the study, Brogla-Krupke utilizes three major categories of treatment:
(1) accommodate students with various styles of learning; (2) implement cross-curricular
thematic instruction; and (3) use of aesthetic education. Varied instruction is implemented to
0102030405060708090
100
2000 2001
SchoolDistrictPe
rcen
t

105
allow students to learn in different ways. Students experience music that encourages them to
become fully aware of characteristics of the historical period they study. The aesthetics of music
help make history become more personal and realistic than merely reading the chapter in the
social studies text (Brogla-Krupke, 2003).
At the conclusion of the experiment, data indicate an increase in student motivation, an
increase in understanding relationships between disciplines, and more in-depth learning. Students
show a greater understanding of the era of the time of slavery and the Civil War through the use
of African American Spirituals, Blues, and Jazz music. Furthermore, students’ reactions, their
test results, and the teachers’ comments regarding the study indicate that it is a positive
experience (Brogla-Krupke, 2003).
The Impact of Music on Social, Cognitive, and Academic Skills of Disabled Students
Understanding the role of music education in social, cognitive, and academic learning is a
means to improve academic achievement of disabled students. For those interested in the topic,
questions abound about whether time spent in music supports learning efficiencies and cognitive
development for students with and without disabilities (Mason et al., n.d.).
One research study that addresses this theme is a qualitative investigation entitled, Arts
integration: How do the arts impact social cognitive, and academic skills? (Mason et al.).
Researchers conducted 34 focus groups and interviews with teachers and resident artists in 16
states over a two year period.
According to research subjects, through music and arts activities, disabled students
gained and demonstrated additional skills in problem solving, sequencing, following directions,
teaming, communicating, planning and organizing, and self-assessment (Mason et al.). Across a

106
wide compilation of circumstances, teachers and artists alike depict the arts as giving students
“choices and opportunities to display both their talents and their knowledge” (Mason et al., p. 2).
In Critical links: Learning in the arts and student academic and social development
(2002), a meta-analysis of 64 studies published by the Arts Education Partnership, Deasy alleges
that the influence of the arts may be greater on the academic learning for students with
disabilities and special learning needs, students living in poverty, and students learning English
as a second language, than for the general population.
Deasy (2002) outlines two purposes for his compendium: (1) to recommend to
researchers and funders of research promising lines of inquiry and study suggested by recent,
strong studies of the academic and social effects of learning in the arts; and (2) to provide
designers of arts education curriculum and instruction with insights found in the research that
suggest strategies for deepening the arts learning experiences and are required to achieve the
academic and social effects (Deasy, 2002, p. 1).
Table 15 highlights four studies relating to the impact of music education on emotionally
disturbed students, juvenile delinquents and disadvantaged students, English language learners,
and the effects of music as reinforcement for education/therapy objectives as featured in Deasy’s
(2002) Critical links: Learning in the arts and student academic and social development.
Summary
An article recently printed in the Pittsburgh Tribune-Review recognized a national call
“to turn out better educated children” (LaRussa, 2006, p. 1). Specific documents have resulted in
significant curriculum changes in local school districts (LaRussa). One document to make
significant advancements in music education that impacts academic achievement is The
Influence of Music on Core Learning by Israel Eady and Janell Wilson (Eady & Wilson, 2004).

107
Table 15
Results of Four Research Studies Relating to Emotionally Disturbed Students, Juvenile
Delinquents and Disadvantaged Students, English Language Learners, and the Effects of Music
as Reinforcement for Education/Therapy Objectives as Featured in Deasy (2002) Critical Links:
Learning in the Arts and Student Academic and Social Development.
Researchers Title Results
Kariuki and
Honeycutt
(1998)
An Investigation of the Effects
of Music on Two Emotionally
Disturbed Students’ Writing
Motivations and Writing Skills
Both students improved their writing skill by
two letter grades, wrote more words, felt
more positive about writing, and were
observed to be more focused when listening
to music. Students reported that music made
writing exciting and helped them stay
focused.
Kennedy
(1998)
The Effects of Musical
Performance, Rational
Emotive Therapy and
Vicarious Experience on the
Self-Efficacy and Self-Esteem
of Juvenile Delinquents and
Disadvantaged Children
Scores in the Performance and
Performance/Cognitive groups improved
significantly, but scores in the other groups
did not improve.

108
Lowe (1995) The Effect of the Incorporation
of Music Learning Into the
Second-Language Classroom
on the Mutual Reinforcement
of Music and Language
Reliabilities of French tests were adequate as
were all but the tonal-rhythmic pattern
written test. Private piano lessons did
correlate with higher scores on tonal-rhythm
pattern reading. Academic achievement did
covary with all tests except tonal-rhythm.
Main analysis suggest this music program
enhanced general French and music skills
and, in particular, oral grammar, reading
comprehension, tonal-rhythmic
pattern/performance and form/described
(written) concepts.
Standley
(1996)
A Meta-Analysis on the Effects
of Music as Reinforcement for
Education/Therapy Objectives
The general result is that contingent music is
more effective in promoting education and
therapy objectives (all types combined) than
other reinforcement techniques.
Note: Compiled from Deasy, R. J. (2002). Critical links: Learning in the arts and student academic and social development. Washington, DC: Arts Education Partnership.
This paper presents a review of recent literature that reports the benefits of integrating
music across the curriculum (Eady & Wilson, 2004). Perhaps integration of the arts is the
catalyst for increased academic achievement. However, as stated by the Music Educators
National Conference, the integrity of each arts discipline must not be compromised (Music
Educators National Conference, 2002). Music standards, as with all standards, must be
109
continually reviewed and assessed for their significance in what some may describe as a dying
art form. Nevertheless, additional research must be completed to solidify the impact of music
education and the integration of music on academic achievement.
Specifically, arts integration programs that incorporate music into daily instruction may
have the greatest impact for increased achievement, as evidenced in the Brogla-Krupe (Brogla-
Krupe, 2003) study that takes theory and puts it into practice – application. If we know that
music education can have correlational affects on academic achievement, how are educators
going to apply the use of music to increase achievement? The Brogla-Krupke study demonstrates
such applications.
Students deserve choice in completing academic assignments. Music education can
facilitate that choice and meet different learning styles. Moreover, as the call for additional
research is mandated by legislatures and arts educators in a quest for educational reform, position
papers and additional research will be required.
Elements of an Effective Music Education Program that Impact Academic Achievement
Parental Involvement
A number of fundamental elements comprise effective music education programs. Many
have a significant impact on academic achievement. However, no element has the greatest
impact than parent involvement, as evidenced in a 1996 research study concerning parental
involvement, selected student attributes, and learning outcomes in instrumental music by
Stephen F. Zdzinski.
Educators have known that parental involvement is an important aspect of any child’s
education. Decades of research have demonstrated that “parent/family involvement significantly
110
contributes, in a variety of ways, to improved outcomes related to learning and school success”
(Carter, 2002, p. 1).
Zdzinski (1996) surveyed 406 volunteer instrumental music students from five intact public
school band programs in grades 4 – 12 in New York and Pennsylvania. He investigates if a
significant relationship between parental involvement and various outcomes of instrumental music
at different age levels exists. Of the 406 subjects, nine students do not provide demographic
information and are eliminated from analysis leaving 396 subjects completing the study.
Approximately 45% of the subjects are senior high students (N = 165); 31% (N = 124) from junior
high grades; and 27% (N = 171) from elementary grades. One-hundred and eight students were
not able to participate in the performance measurement portion of the data collection or data
analysis. Woodwind students (N = 166) account for 57% of the sample; brass (N = 88) account for
30%; and percussion (N = 35) 12% (Zdzinski, 1996).
Three dependent measures: affective outcomes, cognitive musical achievement, and
performance achievement; and two independent measures: parental involvement and music
aptitude and other variables, are examined. The first dependent measure, affective outcomes, is
measured using three instruments: The Zorn Music Attitude Inventory (MAI), the Asmus
Motivational Factors measure (AMF), and the Asmus Magnitude of Motivation (AMM)
measure. MAI are designed to measure attitudes toward music and musical participation. It
includes 35 items with a possible range of scores from 35 to 175 points. AMF assesses five
factors which students may attribute their degree of success in music, such as effort, background,
classroom environment, and affect for music. The scale contains 32 items and has a range of 32
to 160 points. AMM assesses the magnitude of student motivation on three areas: personal

111
commitment, school music, and music compared to other activities. The scale contains 23 items
and has a range of 23 to 92 possible points (Zdzinski, 1996).
The second dependent measure, cognitive musical achievement, is measured by selected
subtests of the Music Achievement Test (MAT) and the Iowa Test of Music Literacy (ITML).
MAT subtests were selected to measure pitch discrimination, interval discrimination, instrument
recognition, music reading, and choral recognition. In the ITML, subtests of pitch, rhythm
reading and recognition were selected (Zdzinski, 1996).
The third dependent measure, performance achievement, is measured using the Watkins-
Farnum Performance Scale (WFPS) and the Performance Rating Scale Supplement (PRSS). This
measure assesses aspects of performance on the WFPS not addressed by the published scoring
system (i.e. musicality, intonation/tone quality, and technique). Rating-scale items developed
using a facet-factorial approach to scale construction to evaluate brass and woodwind
performances was adapted to create the PRSS. Items in PRSS (N = 30) are paired with 5-point
Likert scales to evaluate musicality, tone quality and intonation, and technique (Zdzinski, 1996).
The independent measure of parental involvement is measured by the Parental
Involvement Measure (PIM) designed for use in a study of middle school instrumental students.
Five-point Likert-scale items (N =30) examine frequency (PI-F) with which parents are engaged
in selected parental involvement activities and the degree (PI-D) of parental involvement (father
only, mother only, or both parents) of those who are engaged in these activities. The composite
PIM has a total possible range of 15 to 105 points. Nine categorical items are contained in the
PIM to obtain additional parental involvement information about ownership of musical materials
and non-behavioral parental involvement activity (Zdzinski, 1996).

112
The second independent measure, music aptitude and other variables, is measured by The
Tonal Rhythmic subtests of the Musical Aptitude Profile (MAP). The composite score of the two
sections serve as the measure of music aptitude. The independent variable of grade level is
defined as elementary, junior high, or senior high. Gender also serves as an independent variable
(Zdzinski, 1996).
Procedures of the investigation include the WFPS administered to subjects by their band
directors at each school according to the directions used in a previous study. Performances are
tape-recorded and later scored by the researcher. The MAT and ITML subtests are administered
by the researcher, followed by administration of the MAP, the attitude measures and the PIM.
The administration takes place during four class periods (Zdzinski, 1996).
Descriptive statistics for affective, cognitive, and performance measures are gathered for
each subtests. Cronbach’s alpha reliability coefficients are obtained for the AMM, AMF, MAI,
and the PIM. All reliability coefficients are acceptable with coefficients varying from .82 (Music
Attitude Inventory) to .98 (Watkins-Farnum Performance Scale). For each of the domain areas,
subtests are combined using z-score transformations to create composite measures (Zdzinski,
1996).
Parental involvement is found to be significantly related to affective, cognitive, and
performance outcomes in music. The strongest items are concert attendance, taping
performances, providing materials, and parent group participation. The strongest parental
involvement correlation is obtained for the affective composite, followed by the cognitive
musical composite, and the musical performance composite. PIM accounts for over 8.6% of the
variance in the affective composite (Zdzinski, 1996).
113
Significant correlations are also found between the specific cognitive musical subtests.
Correlations are slightly lower in strength than are those for the affective measures. Weakest
relationships are found between PIM scores and the musical performance measures, accounting
for only 5% shared variance among the entire sample. Parental involvement is significantly
related to WFPS scores beyond the .01 level and composite music performance scores beyond
the .05 level. Overall, parental involvement is not found to be significantly related to the PRSS
(Zdzinski, 1996).
Significant relationships among individual PIM items and the independent variables of
cognitive musical achievement, the affective composite, and the performance achievement are
moderately low to low in all cases. Twenty-seven individual PIM items are significantly
correlated with cognitive musical composites, whereas the affective and performance composites
obtain 20 and 18 significant item correlations, respectively. All composite measures are
positively related to PIM items dealing with concert attendance, taping performances, providing
materials, and parent group participation. Cognitive and performance composites are
significantly related to PIM items concerning musical siblings and parental musical ensemble
participation. Two PIM items dealing with practicing are negatively related to cognitive and
performance scores. Significantly related PIM items common to both cognitive and affective
composites are in the areas of talking about and listening to music in addition to providing
transportation to musical activities (Zdzinski, 1996).
Although findings are statistically significant, overall relationships are moderately low
suggesting modest practical significance. According to the Zdzinski study, parental
involvement is related to musical learning outcomes and can benefit from increased parental
involvement activities that may prove valuable to increased student success. Grade-level
114
differences in parental involvement relationships are found among the various outcome
measures and the affective outcome relationships increased in strength as the subjects’ age
increased. Conversely, for affective outcomes, the only significant parental involvement
relationships are found at the secondary levels and are related most strongly at the senior high
level. (Zdzinski, 1996).
The Zdzinski (1996) findings correlate with his 1987 investigation in which parental
involvement accounts for approximately 4% shared variance with cognitive achievement. Earlier
research studies and investigations since the 1996 findings also support correlations between
parental involvement and academic success in music. However, further research is needed to
identify those areas that may interact with parental involvement. It is important to point out that
parental involvement relationships may obscure specific findings in future research. For instance,
variables such as socioeconomic status, race, and previous musical experience may impact
academic achievement. In addition, parental involvement research should be expanded to
include not only music instruction but other content areas.
For example, in examining parental involvement research with and in other disciplines, a
1996 study by Tillmann and Ford regarding African American family involvement in early
childhood special education programs emerges. The Tillmann and Ford research is significant
because there appears to be a number of similarities between level of parental involvement of
special education students and parental involvement of music students. As parents become
involved in music education programs, it will be important to investigate musical experiences,
educational background, level of involvement, and other elements that may impact academic
achievement.

115
Tillmann and Ford investigate the role of parents in their children’s education programs.
The following objectives guide the study: to gain a better understanding of African American
families’ perceptions of their child’s early childhood special education programs; to gain a better
understanding of the unique issues faced by African American families with children in early
childhood special education programs; and to better understand the role of African American
culture in family interpretations of their children’s education and the nature of their interactions
with school professionals (Tillmann & Ford, 1996). In future research, these same objectives will
provide insight into the role parental involvement plays in academic achievement.
Tillmann and Ford involve 12 families in focus groups composed of African American
family members with children in early childhood special education programs. Ten parents are
fulfilling the mother role for their children - two are fathers (1 biological, 1 foster father); nine
parents are married, three are single mothers. All children are currently enrolled in an early
intervention or preschool program with the exception of two. Ages range from 3 to 9 years. The
mean age of the children is 5.2 years. Focus groups consist of 1 to 4 family members with a
preschool child (3 to 5 years of age) with a disability. A moderator is responsible for facilitating
the discussion. Data is analyzed using the constant comparative method developed by Glaser and
Strauss in 1967 (Tillmann & Ford, 1996).
Parents report that they genuinely keep abreast of school activities through phone calls
and progress notes. Family involvement depends on the type and degree of communication and
contact with school personnel. A parent’s main source of communication is the classroom
teacher. It is important to note that meetings and home visits do exist. However, according to
Tillmann and Ford, home visits appear to be much less influential. Communication issues are
viewed very positively among most parents. Then again, when communication is lacking,

116
parents report that they would appreciate “more information on what things they could do at
home to better help their children” (Tillmann & Ford, 1996, p. 16).
Moreover, Tillmann and Ford report family involvement depends on the type and degree
of communication and contact with school personnel. The initial discovery and knowledge of a
child’s disability can be devastating for parents. Parents must work through the special education
system starting out with little information. Social support, collaboration with school personnel,
and availability of community agencies are necessary to help parents in order to enhance and
ease the difficulty of raising a child with special needs (Tillmann & Ford, 1996).
Five major themes evolve from the Tillmann and Ford focus groups. Parents begin with
processing variables. These variables include: (1) the discovery and knowledge that a problem
exists; (2) the child going through testing, getting diagnosed, reaction to this knowledge, quest
for a reason behind the disability, and how the family is affected; (3) placing the child in a
special needs program at a time when families are finding out about the special education
process and learning what things need to be done in order for their children to be successful in
school; (4) families must deal with the results of placement and the effect the placement has on
the child, the treatment of the child by others (other children, school, public), and learning to
cope with and modify for the child’s problem; and (5) families must define what expectations
they have for their child and what they can expect from others in the future (Tillmann & Ford,
1996, p. 13).
The majority of responses reveal positive effects of the placement and most report that
they saw progress in their children since attending a special education program. The second but
most frequently identified theme was type and degree of involvement. When communication is
lacking, parents report that they would appreciate more information on what things they could do

117
at home to better help their children. Home activities include what parents saw as their role in
their child’s education, what type of activities they participated in outside of school that relate to
their child’s education and how they and their children react to that involvement (Tillmann &
Ford, 1996).
At the preschool level, parents see as their primary role to provide their children with
knowledge and skills that would meet their basic needs so they will be able to function more
independently in the future. Preschool parents feel that they are advocates for their children and
it is their job to ensure that their children receive the best education possible (Tillmann & Ford,
1996).
Parents also report participation in activities at the school. Activities include Individual
Education Program (IEP) meetings, visiting the classroom, attending after school programs or
field days, and connecting with community resources. To be actively involved in the school
setting, parents need to volunteer their services. Parents are generally satisfied with their
involvement. However, they feel responsible for initiating involvement in many cases (Tillmann
& Ford, 1996).
In descriptions of home and school, themes revolve around basic descriptions of school
and family make up and a child’s behavior and characteristics. Three categories emerge: child
descriptions, family descriptions, and school descriptions (Tillmann & Ford, 1996).
The most frequently mentioned category includes child descriptions which consist of the
child’s behavior at school and at home, academic descriptions, and descriptions of the child’s
general characteristics and personality traits. The second most frequent subcategory includes
description of the subject’s family and fell under the category of family issues which include
describing members of the family and living situations. The final category includes descriptions

118
regarding the make up of various aspects at school consisting of what personnel work with the
child, make up of the IEP meetings, and classroom characteristics of the child’s education
program (Tillmann & Ford, 1996).
Individual perceptions of others are comprised of themes in three categories: parent’s
perceptions, child’s perceptions, and school’s perceptions. These themes focus on how the
parent, school, and child view the other aspects of the system in which they are working
(Tillmann & Ford, 1996).
Parents seem to have positive views of the school and its personnel. Much respect is
given to those teachers and schools which care about the children. It is extremely important to
parents for their child to get good teachers. Parents report that when their child has a good
teacher, positive results are seen throughout the year (Tillmann & Ford, 1996).
Children are perceived by their parents to enjoy the programs in which they are enrolled.
Parents understand what is going on around them and appreciate what other parents and teachers
do to help them and their children (Tillmann & Ford, 1996).
Schools are seen as wanting parents to volunteer their help in the classroom and
appreciate the close contact with the parents. However, low levels of trust and comfort are felt by
parents within the school (Tillmann & Ford, 1996).
Another theme brought forth in the Tillmann and Ford research is support. The content of
this theme deals with the help that parents and children receive from various agents. Support is
seen as a need which facilitates parents who are working through the special education process
and learning to cope. Then again, parents report a lack of availability of support for many
families (e.g. support groups). Families who do report receiving support seem to be getting this
from other family members and concerned personnel at school and other community agencies.

119
Finally, parents report that support from others help them in dealing with the many obstacles that
they face every day (Tillmann & Ford, 1996).
If parental involvement is an element that affects academic achievement, it will be
important to analyze issues of communication, level of involvement, and educational background
of parents in future studies, especially as it relates to music education and academic achievement.
The level parents choose to participate may be of particular interest.
In most effective school divisions it is expected that educators nurture the home-school
relationship. Research involving parental involvement, as evidenced in the Zdzinski study,
confirms that music education lends itself to foster this type of positive communication and
parental association.
Parents play a vital role in the survival of sufficient arts education in schools. Collaboration among parent, teacher, and arts leaders can create a powerful constituency advocating for arts programs in schools. Parent involvement is an integral part of not only influencing decision makers to include arts education as part of the basic curriculum, but also guaranteeing the best possible education for all students.
(PTA, 2005, p. 1)
The results of the Zdzinski study support his hypothesis that parental involvement is
related to instrumental music outcomes. Specifically, this research study demonstrates that an
effective public high school music program can boost family awareness, familial interaction, and
increased school attendance and academic success (Zdzinski, 1996).
Barriers to Family Involvement
According to Tillmann and Ford (1996), the level of parental involvement is a function of
lack of trust or comfort, lack of transportation, life situations, or financial difficulties. Parents,
who are dealing with children with challenging behaviors, especially for the first time, may need

120
suggestions on behavior intervention techniques and parenting skills. Moreover, Tillmann and
Ford stress that it is important to enhance involvement and effective communication.
The findings in the Tillmann and Ford study can be generalized to other populations,
including parents new to music education. Some parents may not have a musical background and
depend upon the assigned music teacher to make recommendations for instrument choice.
However, parental involvement in music education or lack thereof, as illustrated by Tillmann and
Ford, may be due to lack of trust or comfort, life situations, or financial difficulties in renting
uniforms, instruments, and other musical equipment. Similarly, since most high school music
programs are performance based, parents that have children without a driver’s license may have
difficulty in transporting their children to and from events.
As schools struggle to increase family involvement, it may serve them well to provide at
least general music instruction for all students (PTA, 2005).
The very students NCLB is most aimed at helping – those who are low-income, minority, and academically vulnerable – are the ones studies consistently show stand the most to gain from regular arts instruction.
(PTA, 2005, p. 2)
Raymond Bartlett, president of the Council on Basic Education, notes, “In our effort to
close the achievement gap in literacy and math, we risk substituting one form of educational
inequity for another, denying our most vulnerable students the kind of curriculum available to
the wealthy” (PTA, 2005, p. 2). In other words, parents play a vital role in the survival of
sufficient arts education in schools.
In a recent study of opportunities for and barriers to family involvement in education
sponsored by the Partnership for Family Involvement in Education, the U.S. Department of
Education, and the GTE Foundation, parents of elementary and middle school students are asked

121
about many aspects of their involvement in their children's education and about how their school
keeps parents involved. Key survey findings include:
Parents think schools see them as important partners in helping their children learn, and there is plenty of good news about family involvement. 88% of parents report that their children's schools treat them as important partners in encouraging their children to learn, 86% say teachers generally listen to what parents have to say, 66% say teachers give their child homework assignments that are designed for the family to do together at least once a month, 62% of parents say teachers regularly communicate them [sic] about their children's progress (The Partnership for Family Involvement in Education, the U.S. Department of Education, and the GTE Foundation, n.d., p. 2). Although the U.S. Department of Education’s figures may appear to be significant in that
88% of parents report that their children’s schools treat them as important partners in
encouraging their children to learn, what about parents on the opposite end of the spectrum?
How do educators attempt to reach those parents?
Carter (2002) reports research in music education that supports involving parents through
musical activities such as booster organizations, chaperoning trips, and attending concerts and
performances, students can improve academic success. Through the music education process,
parents often see their children mature and gain independence to perform in front of large
groups. Moreover, as evidenced through reviewed literature, partnerships between home and
school are strengthened.
Family/home and school relationship research literature also reveals three distinct
categories: communication issues, home activities, and school activities. Communication issues
emerge as the main focus area of involvement for families. Copious researchers have found that
family involvement increases when consistent communication lines remain open employing a
variety of means (personal contact, phone calls, newsletters, concerts, etc.). When
communication between the school and family increases, the child’s academic performance

122
improves. Evidence to support this statement is found in the Zdzinski (1996) study. Therefore,
the most frequently identified research themes consist of activities in which there was contact
between home and school and home, school, and community agencies.
Research has much to suggest in identifying parental involvement activities in addition to
barriers that families suggest may validate increased student success. Administrators and music
teachers need to enlighten parents about such parental involvement strategies. In this way, the
home and school can work together for maximum student benefit (Zdzinski, 1996).
Peer Influence and Success in Life
Although the Zdzinski (1996) research was thorough and examined many facets of
academic success in instrumental music, the study did not address specific variables in regards to
race, socioeconomic status, previous musical experience, and peer influence. Additional research
literature shows that students gain self-confidence and find a common niche among like peers
(Music Educators National Conference, 2002). Furthermore, peer influence among student
musicians has effects far beyond the academic realm. “The basic message is that music programs
in the schools help our kids and communities in real and substantial ways” (Music Educators
National Conference, p. 1).
Daniel A. Carp, the Chairman and CEO for the Eastman Kodak Company, states:
Music is one way for young people to connect with themselves, but it is also a bridge for connecting with others. Through music, we can introduce children to the richness and diversity of the human family and to the myriad rhythms of life. (Music Educators National Conference, 2002, p. 6)
Introducing children to a wide variety of diverse cultures is, perhaps, the basic reason that every
child must have an education in music.
“Music is a part of the fabric of our society” (Music Educators National Conference,
2002, p.1). Unfortunately, peer influences, both good and bad, are woven into that fabric. Every

123
day, on average, 11,318 American youth (12 to 20 years of age) try alcohol for the first time,
compare with 6,488 for marijuana; 2,786 for cocaine; and 386 for heroin (Schmidtlein, 1997).
However, according to the Texas Commission on Drug and Alcohol Abuse (1998), secondary
students who participated in band or orchestra reported the lowest lifetime and current use of all
substances (alcohol, tobacco, illicit drugs).
“Let’s not forget that the arts are a compelling solution to teen violence, certainly not the
cause of it!” says Michael Greene, Recording Academy President and CEO at the 42nd Annual
Grammy Awards in February 2000 (Music Educators National Conference, 2002). According to
statistics compiled by the National Data Resource Center, students who can be classified as
disruptive [italics added] (based on factors such as frequent skipping of classes, times in trouble,
in-school suspensions, disciplinary reasons given, arrests, and dropouts) total 12.14 percent of
the total school population. In contrast, only 8.08 percent of students involved in music classes
meet the same criteria as disruptive (National Data Resource Center, 1992).
Music education also has benefits that make children successful in life. Michael E.
DeBakey, M.D., a leading heart surgeon at Baylor College of Music says:
Studying music encourages self-discipline and diligence, traits that carry over into intellectual pursuits and that lead to effective study and work habits. An association of music and math has, in fact, long been noted. Creating and performing music promotes self-expression and provides self-gratification while giving pleasure to others. In medicine, increasing published reports demonstrate that music has a healing effect on patients. For all these reasons, it deserves strong support in our educational system, along with the other arts, the sciences, and athletics (Music Educators National Conference, 2002, p. 6). The nation’s top business executives agree that music education, in addition to the other
arts, can help repair weaknesses in American education and better prepare workers for the 21st
century (Business Week, 1996). Ted Turner, Turner Broadcasting System, says “Music has a

124
great power for bringing people together. With so many forces in this world acting to drive
wedges between people, it’s important to preserve those things that help us experience our
common humanity” (Music Educators National Conference, 2002, p. 6).
Finally, former United States presidents have commented on the power of music
education. President Gerald Ford said, “Music education opens doors that help children pass
from school into a world of work, culture, intellectual activity, and human involvement. The
future of our nation depends on providing our children with a complete education that includes
music” (Music Educators National Conference, 2002, p. 6-7). “Music is about communication,
creativity, and cooperation, and by studying music in school, students have the opportunity to
build on these skills, enrich their lives, and experience the world from a new perspective,”
former President Bill Clinton (Music Educators National Conference, p. 7).
Summary
There are many elements of an effective music education program that impact academic
achievement. Research literature, books, and news articles reveal only a few. Among them are
parental involvement, lack of parent involvement, peer influence, and music education’s impact
on being successful in life and work. The Tillmann and Ford (1996) study provides evidence into
a particular population – specifically the African American special education parent.
Nonetheless, the study provides insight into obstacles that influence the level of parental
involvement which in turn can affect academic achievement. The manner in which data is
collected was unique but yielded important facts. Further investigation into obstacles that
families face in music education is needed. In particular, the contributions of and at what level
fathers are involved may be of interest. It may be beneficial to investigate the impact of music

125
education on the academic success of special education students and how fathers view their
experiences as unique to the special education process at the early childhood level.
Moreover, the Tillmann and Ford study provides valuable information for music
educators and parents whose students may be learning music for the very first time.
Understanding the level of parental involvement and the reasons why a parent does or does not
become involved can be significant information for any educator, especially if the parent has no
musical experience. Aspects of the Tillmann and Ford study can be replicated so that additional
information is gained in regards to parental involvement, peer influence, and academic
achievement through the use of music education.
Chapter Summary
Research literature has shown that music and music education has an impact on many
aspects of human development. Beginning with experiments by Rauscher, Shaw, and Ky and the
Mozart Effect, music education has been shown to impact brain stimulation and brain
development. However, findings have not been without controversy. Some researchers have not
been able to replicate results of the initial experiment. Others have reached similar results but not
at a statistically significant level. Still others have shown that music does impact academic
achievement, however, significant results rely on the type of music utilized in the experiment.
Music has been shown to be effective at all levels of the educational system. From
preschool to high school and at the university level, investigations involving the study of music
or studying to music have been shown to impact academic achievement. The work of
Gouzouasis et al. , Dryden, and McLelland have divulged useful information for educators.
Some experiments have shown marginal results, others have shown significant findings.
126
Nonetheless, researchers have discovered that music education may impact the lives of children
not only academically, but through complex social infrastructures that have yet to be discovered.
When music is integrated into general education courses, dramatic results have been
shown. Brogla-Krupke has discovered this by integrating music into social studies. Through
music, elementary children have learned valuable lessons in our nation’s history that have long-
lasting effects. Arts integration programs like Start With Arts Program and Artful Learning
Centers are just beginning to appear and make an impact in public education. Perhaps the
greatest impact of music education has been seen in the social, cognitive, and academic skills of
disabled students.
Finally, there are many elements of a music education program that impact academic
achievement. Some of the elements revealed in this review of literature include parental
involvement, positive peer influences, and social conscientiousness. Music education has been
shown to bring communities together and has been described as the fabric of our society.
Researchers, medical professionals, and former United States Presidents have shown that music
is seen as a positive influence to academia, intellectual advancement, building human relations,
effective work environments, and overall human growth and development. As school divisions
investigate ways to slash budgets, increase academic performance, and build community
relations, the impact of music education must be taken into consideration.
127
CHAPTER THREE
METHODOLOGY
This study investigates the impact of music participation on grade twelve weighted
cumulative grade point average, attendance rate in grade twelve, and student conduct in grade
nine through grade twelve. The purpose of this study is to determine whether participation or
non-participation in music courses or the number of years a student participates in vocal or
instrumental music has an impact on academic achievement as measured by grade twelve
weighted cumulative grade point average; attendance rate as measured by the number of
absences in grade twelve; and on student conduct as measured by the number of discipline
referrals in grade nine through grade twelve. One Southeast Virginia school division’s 2006
graduating class serves as the sample population.
The investigation includes students with 4 or more years, 3 to 3.5 years, 2 to 2.5 years,
and 1 to 1.5 years of vocal or instrumental music instruction; students not participating in
instrumental or vocal music instruction; and students that may have been enrolled in a
combination of vocal and instrumental music courses in grades nine through twelve.
The investigation attempts to determine the long-term impact that music education,
specifically the number of years enrolled in music instruction or no music instruction, has on
academic achievement, using grade twelve weighted cumulative grade point average (GPA). In
addition, the study attempts to determine the affect that music education has on attendance rate in
grade twelve and on student conduct in grade nine through grade twelve. Data are analyzed for
highest GPA, the least number of absences, and the least number of discipline referrals among
subject and number of years enrolled in formal music courses or no formal music courses,
gender, ethnicity, and formal music courses or no formal music courses.

128
Setting
The study takes place in a large urban school district located in the Southeast section of
Virginia. During the 2005–2006 school year, the school district had 48 individual schools: 5
early childhood centers; 28 elementary schools; 8 middle schools; 2 alternative secondary
schools; and 5 high schools. Approximately 33,200 students in grades pre-kindergarten through
12 were enrolled in the school district. Fall membership 2005 data collection (September 30)
reports 7,281 middle school and 9,437 high school students comprising approximately 52% of
the total student population. The total number of elementary school students, as indicated on the
fall membership report, was 15,924 for pre-kindergarten through grade 5. Alternative programs
report 525 total student enrollment.
The 2005–2006 Virginia Department of Education free and reduced price lunch program
eligibility report presents that on October 31, 2005 this school division had a total of 15,828
students or 49.68% of the total membership on free and reduced lunch. Of that 49.68%, 12,721
or 39.92% receive free lunch services and 3,107 or 9.75% receive reduced priced lunches.
A diverse group of students were enrolled in the school district. Student nationalities
comprise the following cultural groups: Native American/Alaskan Native, Asian Pacific Islander,
African American, Hispanic, White, and unspecified. African American students represent the
largest group (57.4%) followed by White (32.8%), Hispanic (5.5%), Asian/Pacific Islander
(2.6%), unspecified (1%), and Native American/Alaskan Native (0.7%). Additional demographic
information includes 12.4% special education students, 4.5% talented and gifted students, 46.5%
economically disadvantaged students, and 1.48% English Speakers of Other Languages (ESOL).
Race/Ethnicity membership totals and percentages are presented in Table 16.

129
Table 16
Student Enrollment by Ethnicity for the Sampled School Division.
Race/Ethnicity
N
%
Native American/Alaskan Native 208 0.7%
Asian Pacific Islander 855 2.6%
African American 19,026 57.4%
Hispanic 1,825 5.5%
White 10,888 32.8%
Unspecified 337 1.0%
Total 33,139 100.0%
Note: Data collected from Virginia Department of Education (2006c, January 23). Virginia Department of Education September 30, 2005, Student Membership. Retrieved July 19, 2006, from http://www.pen.k12.va.us/VDOE/dbpubs/Fall_Membership/2005/fm_div_grade.xls
For the purpose of this study, it was important to examine demographic information in
regards to music education and academic achievement for the 2005-2006 twelfth grade class.
Research literature indicates gender does not indicate significant academic differences in music
instruction. However, gender totals are reported in this study to confirm or challenge previous
research. As a result, gender distributions for the investigative population (the sampled school
division’s 2006 graduating class) are as follows: 999 total males and 1,055 total females for a
grand total of 2,054 seniors.
Race/Ethnicity and gender distributions are as follows: 18 Native American/Alaskan
Native; 71 Asian Pacific Islander; 1,082 African American; 94 Hispanic; 785 White; and 4 did
not specify race/ethnicity. Table 17 presents race/ethnicity, gender, and total distributions for the
2006 graduating class in this school division as of September 30, 2005.

130
Table 17
Ethnicity and Gender for the 2006 Senior Class in the Sampled School Division.
Race/Ethnicity Male Female Percentage Totals
Native American/Alaskan Native 13 5 .8% 18
Asian Pacific Islander 37 34 3.7% 71
African American 509 573 52.9% 1,082
Hispanic 51 43 4.5% 94
White 386 399 37.8% 785
Unspecified 3 1 .3% 4
Totals 999 1,055 100.0% 2,054
Compiled from Virginia Department of Education (2006b, February 7). Virginia Department of Education September 30, 2005 Student Membership PK-12. Retrieved July 19, 2006, from http://www.doe.virginia.gov/VDOE/dbpubs/Fall_Membership/2005/fm_sch_sum.xls
Population
The ethnic structure in the studied school division is similar to that of the population
among the 2006 graduates in the investigation. Table 18 presents the ethnic composition, as
reported in May 2006, for all students in grade nine through grade twelve in the studied school
division.
For the purpose of this study, the sample population was divided into four sets. Set one
contains the following groups: VMusic-4, VMusic-3, VMusic-2, and VMusic-1, representing
music students enrolled in vocal music in the same school district for the number of years
indicated.

131
Table 18
Ethnic Structure for the Sampled School Division (Grade Nine through Grade Twelve).
Native American/Alaskan Native .6%
Asian/Pacific Islander 2.6%
African American 57.4%
Hispanic 5.5%
White 32.8%
Unspecified 1.0%
Collected from Sampled School District (2006). Demographics and student achievement profiles at a glance 2005-2006: Sampled School District.
Set two contains the following: IMusic-4, IMusic-3, IMusic-2, and IMusic-1 representing
music students enrolled in instrumental music (band, orchestra, guitar, piano, or composition) in
the same school district for the number of years indicated.
Set three contains the following groups: VMusic-0 and IMusic-0 representing students
enrolled in a music course (vocal or instrumental) for one-half year or no music courses in the
same school district.
The final group, VIMusic-4, VIMusic-3, VIMusic-2, and VIMusic-1, represents students
that may have been enrolled in a combination of high school vocal and instrumental music in the
same school district in grade nine through grade twelve.
Table 19 illustrates the four population sets and the years students could have been
enrolled in vocal or instrumental music instruction or no music instruction within the same
school district. However, music instruction could have occurred during grades nine through
twelve in a number of grade level combinations.

132
Table 19
Four Population Sets and the Possible Years Students Enrolled in Vocal Music, Instrumental
Music, No Music Instruction or a Combination of Vocal and Instrumental Music within the Same
School District.
Possible Grade Level Enrolled
9 10 11 12
Set 1 VMusic-4 X X X X
VMusic-3 X X X
VMusic-2 X X
VMusic-1 X
Set 2 IMusic-4 X X X X
IMusic-3 X X X
IMusic-2 X X
IMusic-1 X
Set 3 VMusic-0
IMusic-0
Set 4 VIMusic-4 X X X X
VIMusic-3 X X X
VIMusic-2 X X
VIMusic-1 X
Note: Music instruction could have occurred during grades nine through twelve in a number of grade level combinations.

133
In the fall of 1999, the study population’s sixth grade year, there were a total of 2,302
sixth grade students enrolled in the school division (Virginia Department of Education, 1999).
All sixth grade students are enrolled in some aspect of the music program including band,
orchestra or a nine-week exploratory music program encompassing the fundamentals of music
education. There are no requirements for initial participation in a music program other than
student interest.
According to the 2006 Virginia Department of Education Membership Report, on
September 30, 2005, the beginning of the study group’s twelfth grade year, student enrollment
had dropped to 2,054 from 2,302 as reported in the September 30, 1999 membership report in
which study participants were in the sixth grade. The enrollment drop is due to attrition in this
school division. Since specific data on music student enrollment is not collected, no further
information is presented.
Research Design
The research design used in this study includes the independent variable group
membership in fourteen levels: VMusic-4, VMusic-3, VMusic-2, VMusic-1, VMusic-0, IMusic-
4, IMusic-3, IMusic-2, IMusic-1, IMusic-0 and students with a combination of vocal music,
instrumental music or composition courses, VIMusic-4, VIMusic-3, VIMusic-2, and VIMusic-1.
The first dependent variable is grade twelve weighted cumulative grade point average.
Weighted cumulative grade point average is a numerical average based on the course taken, the
grade received, and the rigor or weight assigned to the course.
The second dependent variable is the number of absences in grade twelve. Attendance
rates are calculated based upon the number of days a student is absent from school. Absences
may be excused or unexcused. Excused absences occur on days in which the student is out of

134
school sick, has a medical appointment, a death in the family, is enrolled in school suspension
(ISS), etc. Similarly, field trips and other school related activities in which the student is not in
class are considered by the school division as excused absences. On the other hand, unexcused
absences occur when the student is truant, suspended, or has been expelled.
The third and final dependent variable is the number of discipline referrals in grade nine
through grade twelve. Discipline referrals occur when a student repeatedly does not follow
specific guidelines set forth by the school division or classroom teacher. Minor occurrences may
include infractions of the dress code, talking in class or a number of other student conduct
trepidations. These infractions may result in counseling, in school suspension, or out of school
suspension depending on the severity and number of referrals for the same offense.
Occurrences of a more serious nature include a violation of the honor code, fighting,
endangering the lives of others, threats to teachers and staff, striking teachers and staff, stealing,
etc. These infractions would result in out of school suspension from one to ten days or more,
expulsion, or a recommendation for placement at an alternative school.
Using the four independent variables and the three dependent variables, the following
research questions and null hypotheses are addressed in the study:
1. Is there a statistically significant difference in academic achievement as measured
by grade twelve weighted cumulative grade point average, attendance rate as
measured by the number of absences in grade twelve, and student conduct as
measured by the number of discipline referrals in grade nine through grade twelve
among the population with respect to subject and number of years in which a
student participates in formal music courses or in no formal music courses?
135
Null Hypothesis:
There is no statistically significant difference in academic achievement as
measured by grade twelve weighted cumulative grade point average, attendance
rate as measured by the number of absences in grade twelve, and student conduct
as measured by the number of discipline referrals in grade nine through grade
twelve among the population with respect to subject and number of years in
which a student participates in formal music courses or in no formal music
courses.
2. Is there a statistically significant difference in academic achievement as measured
by grade twelve weighted cumulative grade point average, attendance rate as
measured by the number of absences in grade twelve, and student conduct as
measured by the number of discipline referrals in grade nine through grade twelve
among the population with respect to gender and participation in formal music
courses or in no formal music courses?
Null Hypothesis:
There is no statistically significant difference in academic achievement as
measured by grade twelve weighted cumulative grade point average, attendance
rate as measured by the number of absences in grade twelve, and student conduct
as measured by the number of discipline referrals in grade nine through grade
twelve among the population with respect to gender and participation in formal
music courses or in no formal music courses.

136
3. Is there a statistically significant difference in academic achievement as measured
by grade twelve weighted cumulative grade point average, attendance rate as
measured by the number of absences in grade twelve, and student conduct as
measured by the number of discipline referrals in grade nine through grade twelve
among the population with respect to ethnicity and participation in formal music
courses or in no formal music courses?
Null Hypothesis:
There is no statistically significant difference in academic achievement as
measured by grade twelve weighted cumulative grade point average, attendance
rate as measured by the number of absences in grade twelve, and student conduct
as measured by the number of discipline referrals in grade nine through grade
twelve among the population with respect to ethnicity and participation in formal
music courses or in no formal music courses.
4. Is there a statistically significant difference in academic achievement as measured
by grade twelve weighted cumulative grade point average, attendance rate as
measured by the number of absences in grade twelve, and student conduct as
measured by the number of discipline referrals in grade nine through grade twelve
among the population with respect to participation in formal music courses or in
no formal music courses?
Null Hypothesis:
There is no statistically significant difference in academic achievement as
measured by grade twelve weighted cumulative grade point average, attendance
rate as measured by the number of absences in grade twelve, and student conduct

137
as measured by the number of discipline referrals in grade nine through grade
twelve among the population with respect to participation in formal music courses
or in no formal music courses.
The purpose of this study is to determine whether participation, non-participation, and
degree of participation in vocal or instrumental music or a combination of the two have an
impact on grade twelve weighted cumulative grade point average, the number of absences in
grade twelve, and the number of discipline referrals in grade nine through grade twelve. In this
study, it was necessary to distinguish which variable (subject and number of years enrolled in
formal music instruction or no formal music instruction, gender, ethnicity, and formal music
courses or no formal music courses) revealed the highest mean twelfth grade weighted
cumulative grade point average; the lowest number of days absent in grade twelve; and the
lowest number of discipline referrals in grade nine through grade twelve.
For each group in the study, scores were computed and statistical measures were used to
determine differences in the mean performance between and within the groups.
Data Collection Procedures
After completion of training in human subjects protection (see Appendix A), permission
was requested and approved from the Virginia Polytechnic Institute and State University’s
Institutional Review Board (see Appendixes B and C). Upon university approval (see Appendix
D), a request to conduct the study was submitted and approved by the Research Committee and
the Superintendent of the sampled school district (see Appendixes E and F). Essential to data
collection was the identification of music and non-music participants, demographic identifiers,
final grade point averages in grade twelve, the number of absences in grade twelve, and the
number of discipline referrals in grade nine through grade twelve for the 2006 graduation class in
138
the sampled school district. The school district’s student information database was used to collect
pertinent information.
To further delineate study groups, the school district’s electronic student information
system database was used to determine 2006 graduates enrolled in the sampled school district in
grades nine through twelve and met the study requirements. A request was made to the
technology services department of the sampled school district (see Appendix G). Further
differentiation distinguished between music students and non-music students and the type of
music course or courses enrolled. The entire population of grade twelve music students in the
sampled school division was utilized in data collection and analysis. Students who attended more
than one high school in the same school district and remained in the vocal or instrumental music
program were included in the study.
A similar process was employed to determine non-music participants. All non-music
participants were included in data collection and analysis. Students included in this group must
have been enrolled in the same school division for four years (grades 9 – 12) and not enrolled in
formal public school music education courses for more than one-half year (1 semester). Students
attending more than one high school in the same school district and not enrolled in formal public
school music education courses for more than one-half year (1 semester) were also included in
the study.
Finally, students not meeting requirements specified in this study were eliminated.
Names for selected students were coded to provide maximum anonymity. Coded information
was entered into a database using SPSS 13. At no time are students identified by name, school,
or by the school division’s student identification numbering system. Likewise, the school
division is not identified. There were no more than minimal risks involved for participation.
139
Instrumentation
The following instrumentation was employed in the research design: grade twelve
weighted cumulative grade point average to measure academic achievement; the number of
absences in grade twelve to measure attendance rate; and the number of discipline referrals in
grade nine through grade twelve to measure behavior. Critical to data collection was the total
number of years and type of formal music education courses or no formal music courses each
2006 graduate was enrolled over a four-year span in grade nine through grade twelve in the
sampled school division. In addition, demographic information was necessary to data collection.
These data were retrieved from the sampled school division’s electronic student information
system with assistance from the technology department.
Grade Twelve Weighted Cumulative Grade Point Average
A cumulative grade point average is an overall weighted average of the marks/grades
which a student earns to date at a particular institution. The school division in this study offers a
variety of courses for which students receive credit toward high school graduation. At the
completion of the first semester of the senior year, the grade point average is used to determine
honor graduates. A student with a 3.0 average or above is considered an honor graduate.
To determine honor graduate status, the school division offers courses with varying levels
of rigor and weighted credits. Additionally, course weighting is assigned upon recommendation
of the school district’s curriculum committee and the approval of the School Board. Courses
identified for advanced placement/standing contain a mandated external evaluation component.
Students who do not participate in external evaluations receive honors weighted credit.
International Baccalaureate courses and Advanced Placement courses are weighted with
advanced standing; Honors and Pre-International Baccalaureate courses receive honors weight.

140
Weighted cumulative grade point averages are computed at the end of each semester and
reported on the student’s report card (Whitaker, 2005). The final grade twelve weighted
cumulative grade point average at the end of the second semester was collected in this study.
Table 20 presents the scale used by this school division for determining grade point averages.
Weighting is adjusted to reflect the academic rigor of the course content.
Weighted cumulative grade point averages are provided to students in grades 9 through
12. This grade point average is based upon the grades individual students earn in courses for
which high school credit is awarded (including failing grades, repeated courses, summer school,
night school, and credit courses taken prior to grade nine) (Whitaker, 2005).
Table 20
Scale for Determining Grade Point Average.
Grade Advanced Standing Honors Standard
A 5 4.5 4
B 4 3.5 3
C 3 2.5 2
D 2 1.5 1
F 0 0 0
Note: Information taken from the Study Groups Policies and Procedures Manual 2005-2006.
The school district offers a wide variety of courses to middle school and high school
students. High school credit courses available to middle school students are foreign language
(Spanish, French, German, and Latin), Algebra I, Honors Geometry, and Summer Institute for
the Arts. Of these courses, only Honors Geometry and Summer Institute for the Arts are
weighted.

141
This school division includes 26 Advanced Placement courses and 22 honors courses
throughout the comprehensive high school curricula (Whitaker, 2005).
Students begin their high school planning in grade eight. Counselors meet with students
and parents individually and in groups to develop a program of study for grades 9 – 12. Students
and parents have opportunities to attend three district-wide meetings that focus on the academic
transition from middle school to high school. A course offerings booklet with descriptions of all
courses and district-wide programs is provided to all eighth grade families (Whitaker, 2005).
The school district offers open access to all courses at the high school level. Open access
allows students, with the permission of their parents, to enroll in any course offered in the high
school curriculum with the exception of courses that are sequential in nature. For example,
Algebra II is a sequential course to Algebra I and Geometry. Therefore students must
successfully complete Algebra I and Geometry before enrolling in Algebra II. Open access
enables students to take honors and Advanced Placement (AP) courses without prerequisites or
teacher approval (Whitaker, 2005).
Number of Absences in Grade Twelve
Attendance rates are calculated based upon the number of days a student is absent from
school. Absences may be excused or unexcused. Excused absences occur on days in which the
student is out of school sick, has a medical appointment, a death in the family, is enrolled in in-
school suspension (ISS), etc. Similarly, field trips and other school related activities in which the
student is not in class are considered by the studied school division as excused absences. On the
other hand, unexcused absences occur when the student is truant, suspended, has been expelled
or fails to provide a note from the parent or guardian excusing an absence.

142
The studied school division has not distinguished between excused and unexcused
absences in available data. Therefore, all absences in grade twelve have been included in data
collection (Sampled School District, 2001b).
Number of Discipline Referrals in Grade Nine through Grade Twelve
Discipline referrals occur when a student repeatedly and consciously does not follow
specific guidelines set forth by the school division or classroom teacher. Minor occurrences may
be infractions of the dress code, talking in class, smoking or a number of other student conduct
trepidations. These infractions may result in counseling, enrollment in the in-school suspension
program (ISS) or a student may be assigned out of school suspension for up to ten days
depending on the severity of the offense and the number of referrals. Occurrences of a more
serious nature include violation of the honor code, fighting, possession of a weapon, endangering
the lives of others, threats to teachers and staff, striking teachers and staff, etc. These infractions
would result in out of school suspension from one to ten days or more, expulsion, or
recommendation for placement at an alternative school (Sampled School District, 2001c).
Threats to Internal and External Validity
Internal validity, as defined by Campbell and Stanley (1963), refers specifically to
whether an experimental treatment or condition makes a difference or not, and whether there is
sufficient evidence to support the claim. External validity refers to the generalizibility of the
treatment or condition outcomes.
In this research design, there were several factors which jeopardized internal validity.
First, maturation or the processes within participants which act as a function of the passage of
time (i.e. if the project lasts a few years, most participants may improve their performance
regardless of treatment received). This study evaluates a participant’s academic performance

143
over a period of time (from one to four years). Therefore, maturation could threaten internal
validity.
A second factor to threaten internal validity is instrumentation. Instrumentation refers to
the changes in the instrument, observers, or scorers which may produce changes in outcomes. In
this study, there are three basic instrumentation issues that affect internal validity: 1) Teachers
are assigned to teach courses based on student enrollment and their particular
certification/licensure; 2) Study participants/students choose a variety of general education and
elective courses; and 3) Students are mandated by the Department of Education to take specific
courses and a specified number of those courses. Given this information, it is inevitable that the
dependent variable chosen to measure academic achievement (GPA) threatened internal validity.
The researcher has no control over grades that study participants may earn from any given
teacher, music or non-music.
The final factor threatening internal validity, selection-maturation interaction, refers to
the selection of comparison groups and maturation interacting which may lead to confounding
outcomes and erroneous interpretation that the treatment caused the effect. In opposition to
instrumentation, participants in comparison groups are randomly assigned to classes made during
their course choices. Consequently, students may have been assigned to the same general
education teacher or the same elective course teacher at different times of the academic day or
year. Moreover, there is a possibility that participants may have been randomly assigned to the
same teacher and class period over a four year period of high school. In the case of music
students, often the same music teacher will instruct all music courses within the same school
building (i.e. vocal director, band director, orchestra director, etc.). Therefore, selection-
maturation interaction may threaten internal validity.

144
One factor that may have jeopardized external validity is multiple treatment interference.
As multiple treatments are given to the same subjects, it is difficult to control for the affects of
prior treatments. This may occur as school personnel changes are made or subjects are assigned
to the same general education teacher or the same elective course teacher for multiple years as is
the case in most music education courses. Interaction affects of selection biases and the
experimental variable in addition to reactive affects of experimental arrangements will
jeopardize external validity. It is difficult to generalize to non-experimental settings if the affect
is attributable to the experimental arrangement of the research (Campbell & Stanley, 1963).
Data Analysis
In analyzing data for this quantitative study, several actions occurred. The first step
included the recoding of the variable subject and number of years enrolled in formal music
courses or no formal music courses. This was necessary to determine the fourth independent
variable formal music courses or no formal music courses. Students participating in formal
music courses were coded as one and students participating in no formal music courses were
coded as two.
The next stage of analysis included computing descriptive statistics (means and standard
deviations) for each of the independent variables. Likewise, demographic analysis was computed
to provide a clear understanding of the research participants. In addition, correlations were
conducted to determine the existence of any relationships between independent variables and
dependent variables.
After descriptive and demographic statistics were reported, inferential statistics were used
to test each null hypothesis. The overall null hypothesis states that there is no statistically
significant difference among group membership (music and non-music participants) with respect
145
to grade twelve weighted cumulative grade point average, the number of absences in grade
twelve, and the number of discipline referrals in grade nine through grade twelve. Because
subjects are randomly assigned to classes, the research design is Treatment-Control
Postmeasure. In the case of both groups (music and non-music), one group received the
treatment (music instruction), the other did not (non-music). Both groups received the same post
measures – grade twelve weighted cumulative grade point average, the number of absences in
grade twelve, and the number of discipline referrals in grade nine through grade twelve.
There are several inferential statistical procedures that were employed in this study. One
employed procedure was a factorial Analysis of Variance (ANOVA), sometimes called an F test.
Closely related to the t test where differences are measured between means of two groups, the
ANOVA (F test) tests the difference between the means of two or more groups. Therefore, a
factorial ANOVA examined data that was classified on multiple independent variables.
Furthermore, a factorial ANOVA will show whether there is a significant main effect of the
independent variables and whether there are significant interaction effects within and between
independent variables in a set of data. Interaction effects occur when the impact of one
independent variable depends on the level of the second independent variable (Creswell, 2003).
One potential drawback to an ANOVA is the loss of specificity. The F test will
distinguish that there is a significant difference between groups, not which groups are
significantly different from each other. To determine this statistical significance, if any, a post-
hoc comparison was conducted to reveal where specific differences occur. In other words, which
groups are significantly different from each other and which are not. Common post-hoc
comparisons include Scheffe and Tukey (Solso, Johnson, & Beal, 1998).

146
Finally, regression statistics were conducted. An extension of an ANOVA, regression is a
statistical technique used to predict the value of a dependent variable using one or more
independent variables (University of Newcastle upon Tyne, 2002). It is used to account for or
predict variance in an interval dependent, based on linear combinations of interval, dichotomous,
or dummy independent variables. Since there are a number of independent variables and one
dependent variable in this study, a multiple regression was employed. Multiple regression can
establish that a set of independent variables explains a proportion of the variance in a dependent
variable at a significant level (through a significance test of R²) and can establish the relative
predictive importance of the independent variables by comparing beta weights (Garson, 2006).
Chapter Summary
The purpose of this study was to determine the impact that participation in formal public
school music education (vocal and instrumental music) or non-participation in music education
has academic achievement as measured by grade twelve weighted cumulative grade point
average; on attendance rate as measured by the number of absences in grade twelve; and on
behavior as measured by the number of discipline referrals in grade nine through grade twelve.
Setting and population descriptives were established.
The research design included the identification of four independent and three dependent
variables. Data analysis resulted following descriptive statistics (mean and standard deviation),
correlations, and inferential statistical procedures to test hypotheses and null hypotheses using
analysis of variance (ANOVA). The research questions consist of four hypotheses and four null
hypotheses. Since F tests will not determine which groups are significantly different from each
other, Scheffe and Tukey post hoc comparisons were applied. In addition, multiple regression
147
procedures were employed to predict the value of the dependent variables using one or more of
the independent variables.
Included in the steps for data collection were procedures for training in human subjects
protection by Virginia Polytechnic Institute and State University; and requesting to conduct the
study that consisted of submitting to and approval of the school division’s Research Committee
and the division Superintendent as well as the Virginia Polytechnic Institute and State
University’s Institutional Review Board. A description of the dependent variables has been
revealed in addition to reliability and validity procedures. Furthermore, threats to internal and
external validity have also been explored.
Finally, data analysis has been explained. Descriptive, ANOVA, tests for homogeneity,
post-hoc inferential statistical procedures, and multiple regression were employed in various
combinations to determine the impact that formal public school music education or no music
education has on academic achievement, as measured by grade twelve weighted cumulative
grade point average; attendance rate, as measured by the number of absences in grade twelve;
and on behavior as measured by the number of discipline referrals in grade nine through grade
twelve.
148
CHAPTER FOUR
FINDINGS AND RESULTS
Introduction
In this chapter, the results of the study are presented. The first section includes:
background information related to the study; the four research questions and four null
hypotheses; information on data collection procedures; a review of utilized instrumentation; and
techniques employed in data analysis.
The second section includes descriptive statistics, correlations, and regression for the
three dependent variables: (1) grade twelve weighted cumulative grade point average;
(2) number of absences in grade twelve; and (3) number of discipline referrals in grade nine
through grade twelve for each of the study populations: (1) the entire study population; (2) the
music population; and (3) the non music population. Utilizing the four independent variables,
(1) subject and number of years enrolled in formal music or no formal music courses; (2) gender;
(3) ethnicity; and (4) formal music courses or no formal music courses, the three dependent
variables are presented to address the research questions and null hypotheses. Relevant data
tables are presented.
Finally, the last section includes data tables for each research question.
Background Information
The purpose of this study was to investigate the impact of music participation or non-
music participation on academic achievement, as measured by grade twelve weighted cumulative
grade point average; on attendance rate, as measured by the number of absences in grade twelve;
and on student conduct, as measured by the number of discipline referrals in grade nine through
grade twelve.

149
This investigation included students with 4 or more years, 3 to 3.5 years, 2 to 2.5 years,
and 1 to 1.5 years in vocal or instrumental music instruction; students not participating in
instrumental or vocal music instruction; and students that may have been enrolled in a
combination of vocal and instrumental music courses in grades nine through twelve in one
Southeast Virginia school division.
Research Questions
This study has been guided by four research questions. The research questions are:
1. Is there a statistically significant difference in academic achievement as measured
by grade twelve weighted cumulative grade point average, attendance rate as
measured by the number of absences in grade twelve, and student conduct as
measured by the number of discipline referrals in grade nine through grade twelve
among the population with respect to subject and number of years in which a
student participates in formal music courses or in no formal music courses?
2. Is there a statistically significant difference in academic achievement as measured
by grade twelve weighted cumulative grade point average, attendance rate as
measured by the number of absences in grade twelve, and student conduct as
measured by the number of discipline referrals in grade nine through grade twelve
among the population with respect to gender and participation in formal music
courses or in no formal music courses?
3. Is there a statistically significant difference in academic achievement as measured
by grade twelve weighted cumulative grade point average, attendance rate as
measured by the number of absences in grade twelve, and student conduct as
measured by the number of discipline referrals in grade nine through grade twelve

150
among the population with respect to ethnicity and participation in formal music
courses or in no formal music courses?
4. Is there a statistically significant difference in academic achievement as measured
by grade twelve weighted cumulative grade point average, attendance rate as
measured by the number of absences in grade twelve, and student conduct as
measured by the number of discipline referrals in grade nine through grade twelve
among the population with respect to participation in formal music courses or in
no formal music courses?
Data Collection Procedures
Using the school district database, the following demographic information was collected
for the 2006 graduation class:
1. identification of music and non-music participants
2. type of music enrollment (vocal or instrumental)
3. final grade twelve cumulative weighted grade point averages
4. number of absences in grade twelve
5. number of discipline referrals in grades nine through twelve.
The entire population of grade twelve music students in the sampled school division was
utilized in data collection and analysis. Students who attended more than one high school in the
same school district and remained in the vocal or instrumental music program were included in
the study.
A similar process was employed to determine non-music participants. All non-music
participants were included in data collection and analysis. Students included in this group must
have been enrolled in the same school division for four years (grades 9 – 12) and not enrolled in
151
formal public school music education courses for more than one-half year (1 semester). Students
attending more than one high school in the same school district and not enrolled in formal public
school music education courses for more than one-half year (1 semester) were also included in
the study.
Finally, students not meeting requirements specified in this study were eliminated.
Names for selected students were coded to provide maximum anonymity. Coded information
was entered into a database using SPSS 13. At no time were students identified by name, school,
or by the school division’s student identification numbering system. Likewise, the school
division was not identified. There were no more than minimal risks involved for participation.
Instrumentation
The following instrumentation was employed in the research design: grade twelve
weighted cumulative grade point average to measure academic achievement; the number of
absences in grade twelve to measure attendance rate; and the number of discipline referrals in
grade nine through grade twelve to measure student conduct. Critical to data collection was the
total number of years and type of formal music education courses or no formal music courses
each 2006 graduate was enrolled over a four-year span in grade nine through grade twelve in the
sampled school division. In addition, demographic information was necessary to data collection.
These data were retrieved from the sampled school division’s electronic student information
system with assistance from the technology department.
Data Analysis Techniques
Upon completion, using SPSS, descriptive and inferential statistics for the independent
variables and the dependent variables, correlation and regression analysis were conducted to
reveal significant correlations, analysis of variance (ANOVA) and residual statistics. A number

152
of charts and figures were requested through SPSS to indicate relevant information regarding
correlations and significance, if any.
Descriptive Statistics, Correlations, Analysis of Variance (ANOVA), and Regression
The total number of subjects for the study population, music and non music, is 1,741
(N = 1,741) or 100%. There are 454 (N = 454) music students or 27% of the total population. On
the other hand, there are 1,287 (N = 1,287) non music students or 73% of the total population.
Table 21 presents frequencies (N) and percentages for each study population.
Table 21
Frequencies (N) and Percentages for Each Study Population.
Population N Percentage
Music Population 454 27%
Non Music Population 1,287 73%
Total Population 1,741 100%
Among the 1,741 total subjects (N = 1,741), the largest group for the independent
variable subject and number of years enrolled in formal music courses or no formal music
courses is reported in the category no formal music courses (VMusic-0; IMusic-0) or no vocal or
instrumental music courses with 1,287 (N = 1,287) or 73.0% among the entire study population.
The smallest groups in the study are found in the music categories VMusic-4 (four years of vocal
music instruction) and VIMusic-1 (a combination of vocal and instrumental music instruction for
one year) with two (N = 2) subjects in each category or .1% of the entire study population.
Although these categories yielded a small number of participants, they were included in data
analysis for future reference and are indicated within the text.

153
Among the 1,741 total subjects (N = 1,741), there are 927 (N = 927) females or 53.2%
and 814 (N = 814) males or 46.8% of the entire study population. These numbers are a reflection
of the total sampled school division’s population in regard to gender.
In comparison to the total population (N = 1,741), the music population (N = 454)
consists of 275 (N = 275) females or 60.6% of the music population and 179 (N = 179) males or
39.4% of the music population. Therefore, more senior class females are enrolled in the sampled
school division’s music education program than are males. This data is not a reflection of the
total study population.
Among the non music population (N = 1,287), there are 652 (N = 652) females or 50.7%
of the non music population and 635 (N = 635) males or 49.3% of the non music population.
This data indicate a reflection of the total population of the sampled school division.
Table 22 presents the gender structure for all populations within the research study.
Table 22
Gender Structure for All Populations.
Entire Population Music Population Non Music Population
Gender N % N % N %
Female 927 53.2% 275 60.6% 652 50.7%
Male 814 46.8% 179 39.4% 635 49.3%
Total 1,741 100.0% 454 100.0% 1,287 100.0%
Among the total study population (N = 1,741), African Americans comprise the largest
ethnic group. There are 916 (N = 916) African Americans or 52.6% of the total study population.
The second largest ethnic group is White with 662 (N = 662) or 38.0% of the entire study

154
population. The unspecified category comprises the smallest ethnic group among the entire study
population with five (N = 5) participants or .3% of the entire study population. For the entire
study population, data indicate that ethnicity is a reflection of the total population of the sampled
school division.
Similar to the entire population, African Americans comprise the largest ethnic group
among the music population. For the music population, there are 213 (N = 213) African
Americans or 46.9% of the music population. Comparable to the entire study population, the
second largest ethnic group among the music population are Whites with 205 (N = 205)
participants or 45.2% of the music population. In the same way, the unspecified ethnic group is
the smallest ethnic group among the music population with one (N = 1) participant or .2% of the
music population.
The ethnic structure of the non music population yields similar data as the total study
population and the music population. The largest ethnic group among the non music population
is African Americans with 703 (N = 703) participants or 54.6% of the non music population. The
second largest ethnic group is Whites with 457 (N = 457) participants or 35.5% of the non music
population. Once again, the unspecified ethnic group comprises the smallest ethnic group with
four (N = 4) or .3% of the non music population.
Table 23 presents frequency (N) and percentage (%) for the ethnic structure of all study
populations.
For the entire study population, data indicate the mean for the dependent variable grade
twelve weighted cumulative grade point average is 2.6203 and the standard deviation is .72876;
the mean for the dependent variable number of absences in grade twelve is 16.17 and the

155
Table 23
Frequency (N) and Percentage (%) for the Ethnic Structure Among All Study Populations.
Entire Population
Music Population
Non Music
Population
Ethnicity N % N % N %
African American 916 52.6% 213 46.9% 703 54.6%
Asian/Pacific Islander 65 3.7% 16 3.5% 49 3.8%
Hispanic 79 4.5% 17 3.7% 62 4.8%
Native American/Alaskan Native 14 .8% 2 .4% 12 .9%
White 662 38.0% 205 45.2% 457 35.5%
Unspecified 5 .3% 1 .2% 4 .3%
Total 1,741 100.0% 454 100.0% 1,287 100.0%
standard deviation is 13.790; and the mean for the dependent variable number of discipline
referrals in grade nine through grade twelve is 3.46 and the standard deviation is 6.537.
In contrast, data indicate the mean grade twelve weighted cumulative grade point average
for the music population (N = 454) is 2.8181 and the standard deviation is .74536. Data indicate
the mean number of absences in grade twelve among the music population is 14.44 with a 12.511
standard deviation. Finally, data indicate the mean number of discipline referrals in grade nine
through grade twelve is 2.00 and a 4.143 standard deviation.
Divergent of the music population, data indicate the mean grade twelve weighted
cumulative grade point average for the non music population (N = 1,287) is 2.5505 with a .71007
standard deviation. The mean number of absences in grade twelve for the non music population

156
is 16.78 with a 14.168 standard deviation. Lastly, the mean number of discipline referrals in
grade nine through grade twelve for the non music population is 3.98 with a 7.124 standard
deviation.
Table 24 presents frequency (N), mean (M), and standard deviation (SD) for each of the
dependent variables, grade twelve weighted cumulative grade point average (GPA), number of
absences in grade twelve, and number of discipline referrals in grade nine through grade twelve
for all populations (entire study population, the music population, and the non music population).
Table 24
Frequency (N), Mean (M), and Standard Deviation (SD) for Each Dependent Variable for All
Populations.
Entire Study Population Music Population Non Music Population Research
Variable N M SD N M SD N M SD
GPA (9-12) 1,741 2.6203 .72876 454 2.8181 .74536 1,287 2.5505 .71007
Absences (12) 1,741 16.17 13.790 454 14.44 12.511 1,287 16.78 14.168
Discipline
Referrals (9-12)
1,741
3.46
6.537
454
2.00
4.143
1,287
3.98
7.124
Grade Twelve Weighted Cumulative Grade Point Average
As indicated, the mean grade twelve weighted cumulative grade point average for the
entire study population is 2.6203 and the standard deviation is .72876; the mean grade twelve
weighted cumulative grade point average for the music population is 2.8181 with a .74536
standard deviation; and the mean grade twelve weighted cumulative grade point average for the
non music population is 2.5505 with a .71007 standard deviation.
157
Entire Study Population
The highest mean grade twelve weighted cumulative grade point average among the
independent variable subject and number of years enrolled in formal music courses or no formal
music courses for the entire study population is reported in the category VIMusic-1 or a
combination of vocal and instrumental music for one year with a mean grade twelve weighted
cumulative grade point average of 3.31 and a .34648 standard deviation.
In opposition, the lowest mean grade twelve weighted cumulative grade point average
among the independent variable subject and number of years enrolled in formal music courses or
no formal music courses for the entire study population is reported in the category VMusic-4 or
four years of vocal music courses with a mean grade twelve weighted cumulative grade point
average of 2.46 and a .28284 standard deviation.
Figure 10 presents a line graph of the estimated marginal mean grade twelve weighted
cumulative grade point average for all study participants who have participated in formal music
courses from one to four years or no formal music courses.
Table 25 presents mean, standard deviation, and frequency (N ) for the dependent
variable grade twelve weighted cumulative grade point average among the independent variable
subject and number of years enrolled in formal music courses or no formal music courses in
grade nine through twelve for the entire study population.
The highest mean grade twelve weighted cumulative grade point average among the
independent variable gender for the entire study population is reported among females with a mean
grade twelve weighted cumulative grade point average of 2.7155 and a .72571 standard deviation.
Therefore, the lowest mean grade twelve weighted cumulative grade point average
among the independent variable gender for the entire study population is reported among males

158
Figure 10. Estimated Marginal Mean Grade Twelve Cumulative Weighted Grade Point Average
by Number of Years Enrolled in Formal Music Courses or No Formal Music Courses
for the Entire Study Population.
with a mean grade twelve weighted cumulative grade point average of 2.5120 and a .71745
standard deviation.
Table 26 presents mean, standard deviation, and frequency (N ) for the dependent
variable grade twelve weighted cumulative grade point average for the independent variable
gender among the entire study population.
Number of years in music4.003.002.001.00.00
Estim
ated
Mar
gina
l Mea
ns
2.90
2.80
2.70
2.60
2.50
, , ,

159
Table 25
Mean(a), Standard Deviation, and Frequency (N) by Subject and Number of Years Enrolled in Formal Music Courses or No Formal
Music Courses for the Entire Study Population.
Subject and Number of Years Enrolled
in Music or No Music
Grade Twelve Weighted Cumulative
Grade Point Average
VMusic-1 Mean 2.6227
Std. Deviation .73610
N 78
VMusic-2 Mean 2.6890
Std. Deviation .68095
N 30
VMusic-3 Mean 2.8910
Std. Deviation .76034
N 42
VMusic-4 Mean 2.4600
Std. Deviation .28284
N 2
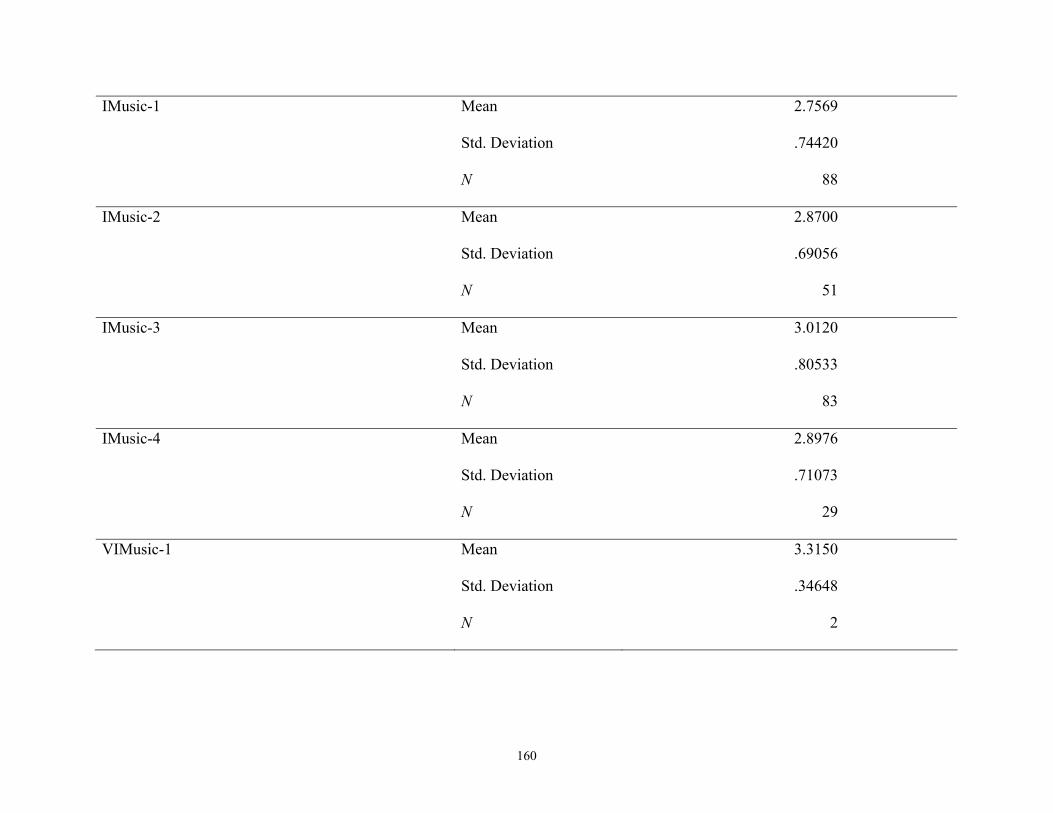
160
IMusic-1 Mean 2.7569
Std. Deviation .74420
N 88
IMusic-2 Mean 2.8700
Std. Deviation .69056
N 51
IMusic-3 Mean 3.0120
Std. Deviation .80533
N 83
IMusic-4 Mean 2.8976
Std. Deviation .71073
N 29
VIMusic-1 Mean 3.3150
Std. Deviation .34648
N 2

161
VIMusic-2 Mean 2.4850
Std. Deviation .65024
N 10
VIMusic-3 Mean 2.6727
Std. Deviation .74405
N 15
VIMusic-4 Mean 3.0533
Std. Deviation .68251
N 24
VMusic-0; IMusic-0 Mean 2.5505
Std. Deviation .71007
N 1,287
Total Mean 2.6203
Std. Deviation .72876
N 1,741
a. Grade Twelve Weighted Cumulative Grade Point Average

162
Table 26
Mean(a), Standard Deviation, and Frequency (N) by Gender for the Entire Study Population.
Gender
Grade Twelve Weighted Cumulative
Grade Point Average
Female Mean 2.7155
Std. Deviation .72571
N 927
Male Mean 2.5120
Std. Deviation .71745
N 814
Total Mean 2.6203
Std. Deviation .72876
N 1,741
a. Grade Twelve Weighted Cumulative Grade Point Average
The highest mean grade twelve weighted cumulative grade point average among the
independent variable ethnicity for the entire study population is reported among Asian/Pacific
Islanders with a mean grade twelve weighted cumulative grade point average of 2.9868 and a
.79171 standard deviation.
In opposition, the lowest mean grade twelve weighted cumulative grade point average
among the independent variable ethnicity for the entire study population is reported among
African Americans with a mean grade twelve weighted cumulative grade point average of 2.3673
and a .63150 standard deviation.

163
Table 27 presents mean, standard deviation, and frequency (N) for the dependent variable
grade twelve weighted cumulative grade point average and the independent variable ethnicity for
the entire study population.
The highest mean grade twelve weighted cumulative grade point average among the
independent variable formal music courses or no formal music courses for the entire study
population is reported in the independent variable formal music courses with a mean grade
twelve weighted cumulative grade point average of 2.82 and a standard deviation of .74536.
Therefore, the lowest mean grade twelve weighted cumulative grade point average
among the independent variable formal music courses or no formal music courses for the entire
study population is reported in the no formal music courses category with a mean grade twelve
weighted cumulative grade point average of 2.55 and a .71001 standard deviation
Table 28 presents mean, standard deviation, and frequency (N ) for the dependent
variable grade twelve weighted cumulative grade point average among the independent variable
formal music courses or no formal music courses for the entire study population.
Figure 11 presents a line graph of the estimated marginal mean grade twelve weighted
cumulative grade point average for all study participants who have participated in formal music
courses or no formal music courses.
There are several statistically significant correlations among the independent variables
subject and number of years enrolled in formal music courses or no formal music courses,
gender, ethnicity, and formal music courses or no formal music courses and the dependent
variable grade twelve weighted cumulative grade point average for the entire study population.

164
Table 27
Mean(a), Standard Deviation, and Frequency (N) by Ethnicity for the Entire Study Population.
Ethnicity Grade Twelve GPA
African American
Mean
Std. Deviation
N
2.3673
.63150
916
Asian/Pacific Islander Mean
Std. Deviation
N
2.9868
.79171
65
Hispanic Mean
Std. Deviation
N
2.6199
.66806
79
Native American/Alaskan Native Mean
Std. Deviation
N
2.4236
.60727
14
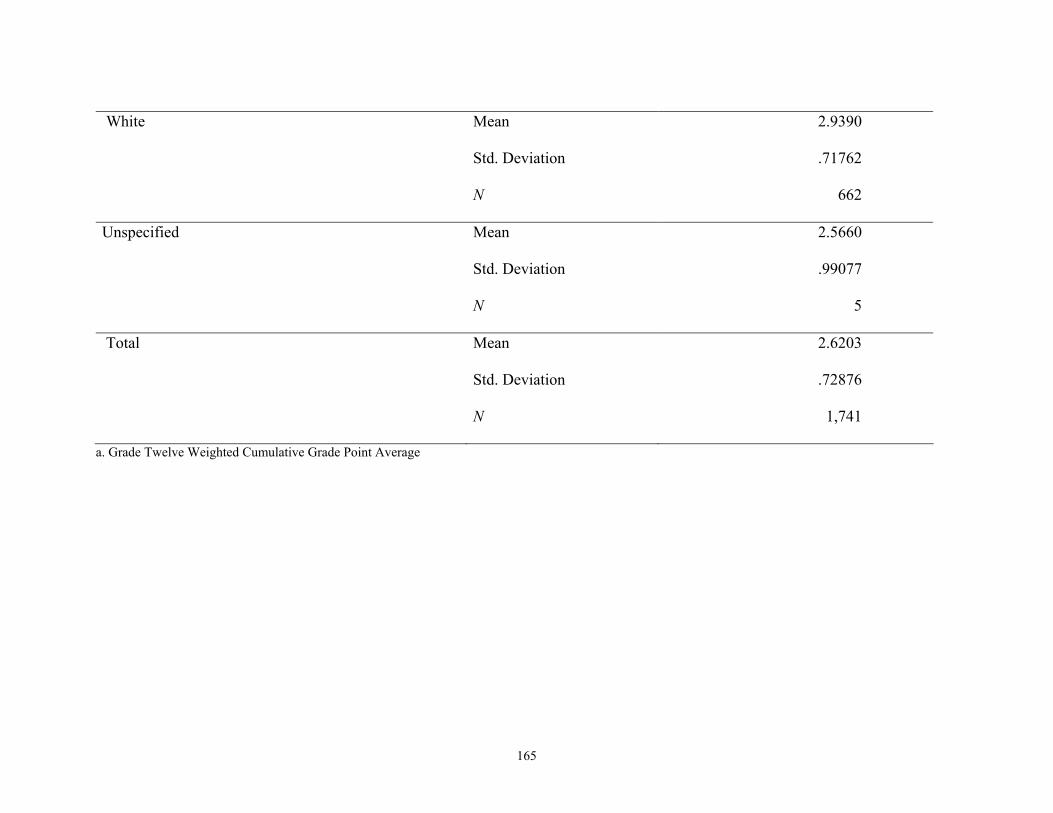
165
White Mean
Std. Deviation
N
2.9390
.71762
662
Unspecified Mean
Std. Deviation
N
2.5660
.99077
5
Total Mean
Std. Deviation
N
2.6203
.72876
1,741
a. Grade Twelve Weighted Cumulative Grade Point Average

166
Table 28
Mean(a), Standard Deviation, and Frequency (N) by Formal Music Courses or No Formal Music
Courses for the Entire Study Population.
Formal Music Courses or
No Formal Music Courses
Grade Twelve Weighted
Cumulative Grade Point Average
Formal Music Courses Mean 2.8181
Standard Deviation .74536
N 454
No Formal Music Courses Mean 2.5505
Standard Deviation .71007
N 1,287
Total Mean 2.6203
Standard Deviation .72876
N 1,741
a. Grade Twelve Weighted Cumulative Grade Point Average
Table 29 presents correlations for all independent variables and the dependent variable
grade twelve weighted cumulative grade point average for the entire study population. Statistical
significance at the 0.05 level is indicated with one asterisk (*) and statistical significance at the
0.01 level is indicated with two asterisks (**).
Table 30 presents univariate analysis of variance tests of between-subjects effects for the
dependent variable grade twelve weighted cumulative grade point average for the entire study
population.

167
Figure 11. Estimated Marginal Mean Grade Twelve Cumulative Weighted Grade Point Average
by Formal Music Courses or No Formal Music Courses for the Entire Study
Population.
Table 31 presents the model summary for all independent variables and the dependent
variable grade twelve weighted cumulative grade point average after controlling for gender and
ethnicity for the entire study population.
Table 32 presents the analysis of variance (ANOVA) for the independent variables and
the dependent variable grade twelve weighted cumulative grade point average after controlling
for gender and ethnicity for the entire study population.
Participated in music vs no participation in music10
Estim
ated
Mar
gina
l Mea
ns2.80
2.75
2.70
2.65
2.60
2.55

168
Table 29
Correlations(a) for the Entire Study Population.
Subject and
Number of Years
Gender
Ethnicity
Formal Music or
No Formal Music
Grade 12 GPA
Subject and
Number of
Years
Pearson Correlation
Sig. (2-tailed)
N
1
1,741
.108**
.000
1,741
-.056*
.019
1,741
907**
.000
1,741
-.120**
.000
1,741
Gender Pearson Correlation
Sig. (2-tailed)
N
108**
.000
1,741
1
1,741
.051*
.035
1,741
. 087**
.000
1,741
-.139**
.000
1,741
Ethnicity Pearson Correlation
Sig. (2-tailed)
N
-.056*
.019
1,741
.051*
.035
1,741
1
1,741
-.079**
.001
1,741
.357**
.000
1,741
Formal Music
or No Formal
Music
Pearson Correlation
Sig. (2-tailed)
N
.907**
.000
1,741
.087**
.000
1,741
-.079**
.001
1,741
1
1,741
-.161**
.000
1,741
Grade 12
GPA
Pearson Correlation
Sig. (2-tailed)
N
-.120**
.000
1,741
-.139**
.000
1,741
.357**
.000
1,741
-.161**
.000
1,741
1
1,741 *. Correlation is significant at the 0.05 level (2-tailed). **. Correlation is significant at the 0.01 level (2-tailed). a. Grade 12 Cumulative Weighted Grade Point Average.

169
Table 30
Univariate Analysis of Variance Tests of Between-Subjects Effects(b) for the Entire Study Population.
Source
Type III
Sum of Squares
df
Mean Square
F
Sig.
Corrected Model 167.953a 6 27.92 64.919 .000
Intercept 856.383 1 856.383 1963.839 .000
Gender 2 19.865 1 19.865 45.553 .000
Ethnicity 2 123.893 1 123.893 284.109 .000
Subject and Number of Years in Music 17.527 4 4.382 10.048 .000
Error 756.156 1,734 .436
Total 12878.037 1,741
Corrected Total 924.108 1,740
a. R Squared = .182 (Adjusted R Squared = .179) b. Grade 12 Weighted Cumulative Grade Point Average

170
Table 31
Model Summary(c) for the Entire Study Population.
Change Statistics
Model
R
R
Square
Adjusted
R Square
Std. Error of
the Estimate
R Square
Change
F Change
df1
df2
Sig. F
Change
1 .403a .163 .162 .66720 .163 168.958 2 1,738 .000
2 .426b .182 .179 .66036 .019 10.048 4 1,734 .000
a. Predictors: (Constant), Recoded Ethnicity. Recoded Gender b. Predictors: (Constant), Recoded Ethnicity, Recoded Gender, Recoded music versus no music2, Recoded music versus no music4, Recoded music versus no
music3, Recoded music versus no music1 c. Grade 12 Weighed Cumulative Grade Point Average.
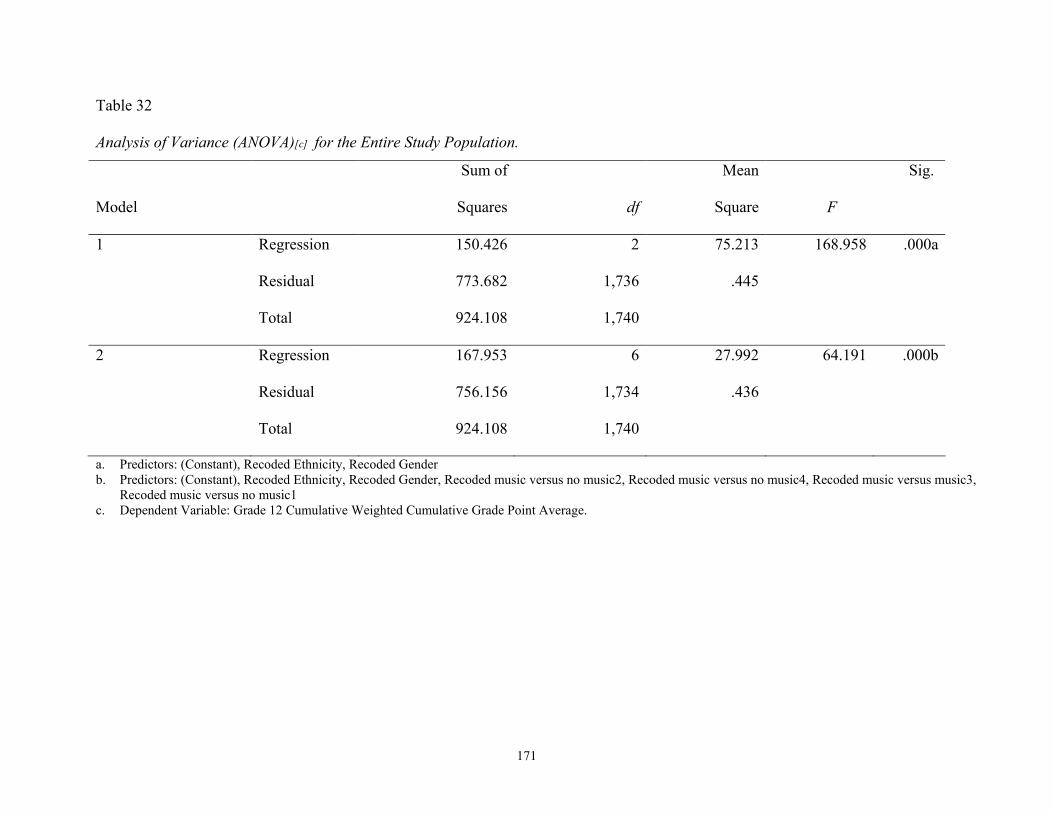
171
Table 32
Analysis of Variance (ANOVA)[c] for the Entire Study Population.
Model
Sum of
Squares
df
Mean
Square
F
Sig.
1 Regression 150.426 2 75.213 168.958 .000a
Residual 773.682 1,736 .445
Total 924.108 1,740
2 Regression 167.953 6 27.992 64.191 .000b
Residual 756.156 1,734 .436
Total 924.108 1,740
a. Predictors: (Constant), Recoded Ethnicity, Recoded Gender b. Predictors: (Constant), Recoded Ethnicity, Recoded Gender, Recoded music versus no music2, Recoded music versus no music4, Recoded music versus music3,
Recoded music versus no music1 c. Dependent Variable: Grade 12 Cumulative Weighted Cumulative Grade Point Average.
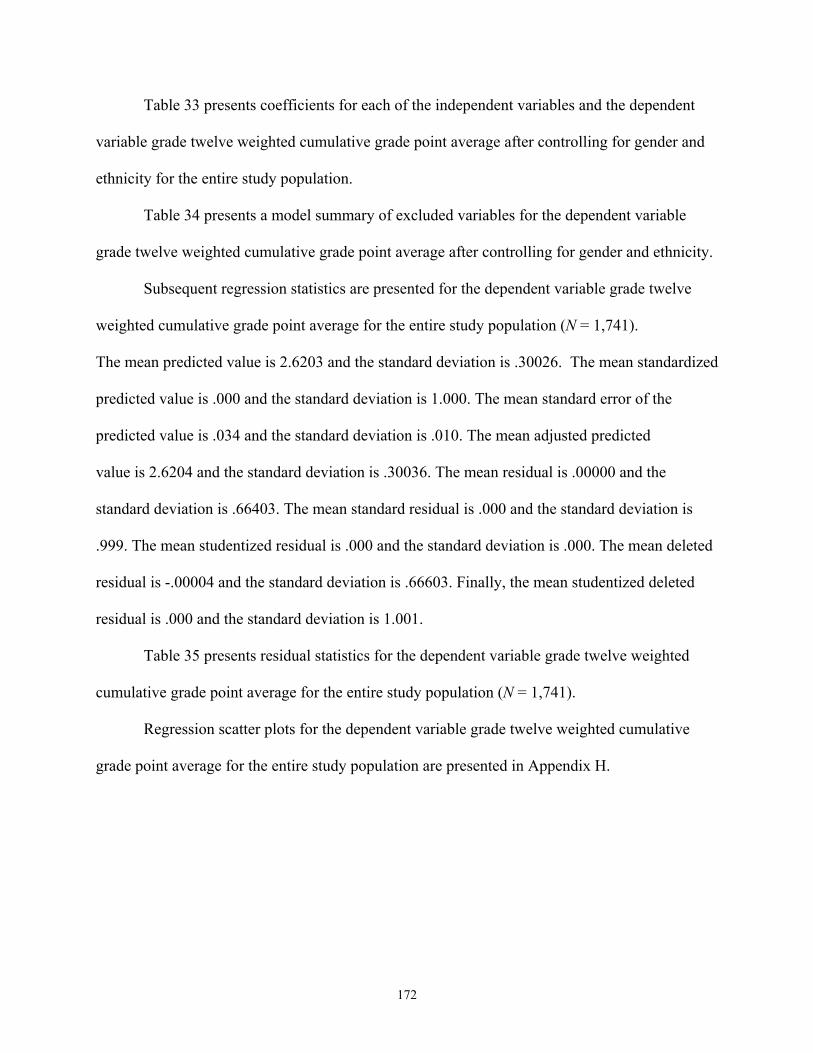
172
Table 33 presents coefficients for each of the independent variables and the dependent
variable grade twelve weighted cumulative grade point average after controlling for gender and
ethnicity for the entire study population.
Table 34 presents a model summary of excluded variables for the dependent variable
grade twelve weighted cumulative grade point average after controlling for gender and ethnicity.
Subsequent regression statistics are presented for the dependent variable grade twelve
weighted cumulative grade point average for the entire study population (N = 1,741).
The mean predicted value is 2.6203 and the standard deviation is .30026. The mean standardized
predicted value is .000 and the standard deviation is 1.000. The mean standard error of the
predicted value is .034 and the standard deviation is .010. The mean adjusted predicted
value is 2.6204 and the standard deviation is .30036. The mean residual is .00000 and the
standard deviation is .66403. The mean standard residual is .000 and the standard deviation is
.999. The mean studentized residual is .000 and the standard deviation is .000. The mean deleted
residual is -.00004 and the standard deviation is .66603. Finally, the mean studentized deleted
residual is .000 and the standard deviation is 1.001.
Table 35 presents residual statistics for the dependent variable grade twelve weighted
cumulative grade point average for the entire study population (N = 1,741).
Regression scatter plots for the dependent variable grade twelve weighted cumulative
grade point average for the entire study population are presented in Appendix H.
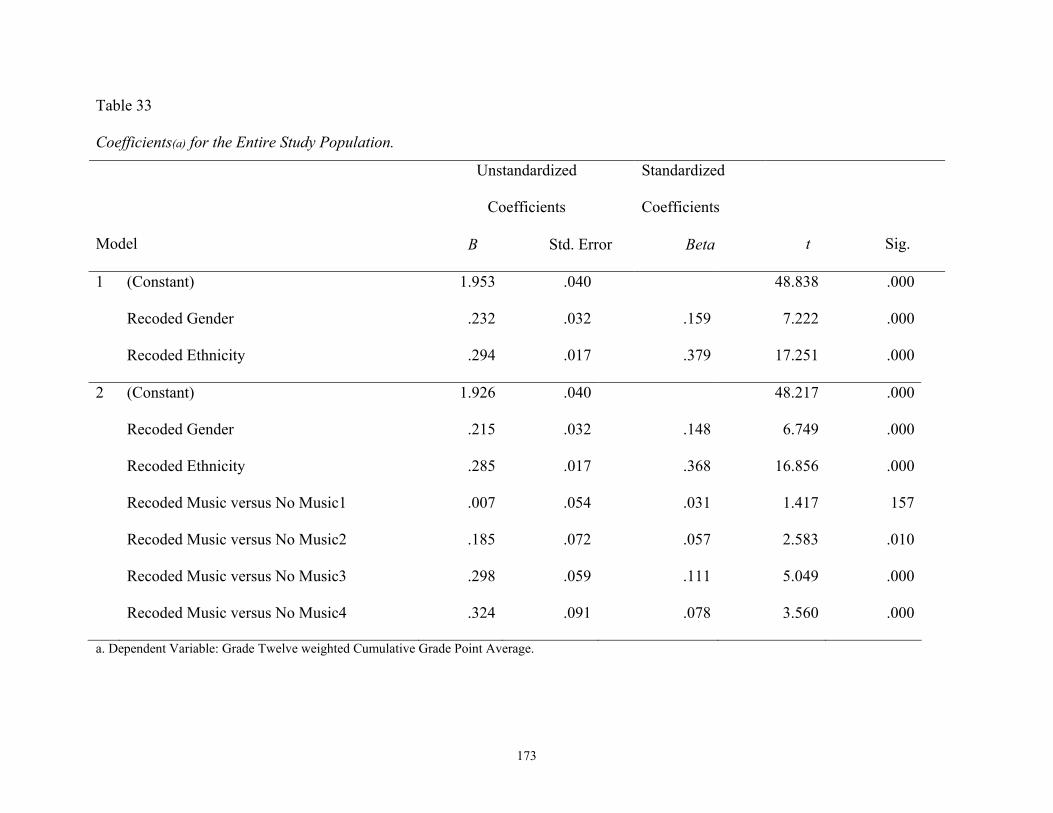
173
Table 33
Coefficients(a) for the Entire Study Population.
Unstandardized
Coefficients
Standardized
Coefficients
Model B Std. Error Beta
t
Sig.
1 (Constant) 1.953 .040 48.838 .000
Recoded Gender .232 .032 .159 7.222 .000
Recoded Ethnicity .294 .017 .379 17.251 .000
2 (Constant) 1.926 .040 48.217 .000
Recoded Gender .215 .032 .148 6.749 .000
Recoded Ethnicity .285 .017 .368 16.856 .000
Recoded Music versus No Music1 .007 .054 .031 1.417 157
Recoded Music versus No Music2 .185 .072 .057 2.583 .010
Recoded Music versus No Music3 .298 .059 .111 5.049 .000
Recoded Music versus No Music4 .324 .091 .078 3.560 .000
a. Dependent Variable: Grade Twelve weighted Cumulative Grade Point Average.

174
Table 34
Excluded Variables (b).
Collinearity
Statistics
Model
Beta
In
t
Sig.
Partial
Correlation Tolerance
1 Recoded music versus no music1 .010a .477 .634 .011 .995
Recoded music versus no music2 .043a 1.958 .050 .047 1.000
Recoded music versus no music3 .100a 4.547 .000 .108 .944
Recoded music versus no music4 .067a 3.061 .002 .073 .997
a. Predictors in the Model (Constant), Recoded Ethnicity, Recoded Gender Dependent Variable: Grade 12 Cumulative Weighted Grade Point Average
Table 35
Residual Statistics for the Entire Study Population.
Minimum
Maximum
Mean
Std.
Deviation
N
Predicted Value 2.2226 3.3681 2.6203 .30026 1,741
Std. Predicted Value -1.325 2.490 .000 1.000 1,741
Standard Error of Predicted Value .025 .079 .034 .010 1,741
Adjusted Predicted Value 2.2187 3.3839 2.6204 .30036 1,741
Residual -1.62340 2.09740 .00000 .66403 1,741
Std. Residual -2.442 3.155 .000 .999 1,741
Stud. Residual -2.449 3.158 .000 1.000 1,741
Deleted Residual -1.63287 2.10128 -.00004 .66603 1,741
Stud. Deleted Residual -2.453 3.166 .000 1.001 1,741a. Dependent Variable: Grade Twelve Weighted Cumulative Grade Point Average.

175
Music Population
In comparison to the entire study population of 1,741 (N = 1,741), the music population
consists of 454 (N = 454) students. As indicated, the mean grade twelve weighted cumulative
grade point average for the entire study population is 2.6203 with a .72876 standard deviation.
However, the mean grade twelve weighted cumulative grade point average for the music
population is 2.8181 with a .74536 standard deviation.
The highest mean grade twelve weighted cumulative grade point average among the
independent variable subject and number of years enrolled in formal music courses or no formal
music courses for the music population is reported in the category VIMusic-1 or a combination
of vocal and instrumental music for one year with a mean grade twelve weighted cumulative
grade point average of 3.31 and a .34648 standard deviation.
In opposition, the lowest mean grade twelve weighted cumulative grade point average
among the independent variable subject and number of years enrolled in formal music courses or
no formal music courses for music population is reported in the category VMusic-4 or four years
of vocal music courses with a mean grade twelve weighted cumulative grade point average of
2.46 and a .28284 standard deviation.
Table 36 presents mean, standard deviation, and frequency (N ) for the dependent
variable grade twelve weighted cumulative grade point average and the independent variable
subject and number of years enrolled in formal music courses or no formal music courses for the
music population.
The highest mean grade twelve weighted cumulative grade point average among the
independent variable gender for the music population is reported among females with a mean
grade twelve weighted cumulative grade point average of 2.9087 and a .73536 standard

176
Table 36
Mean(a), Standard Deviation, and Frequency (N) by Subject and Number of Years Enrolled in Formal Music Courses for the Music
Population.
Subject and Number of Years Enrolled
in Music or No Music
Mean Grade Twelve Weighted Cumulative
Grade Point Average
VMusic-1 Mean 2.6227
Std. Deviation .73610
N 78
VMusic-2 Mean 2.6890
Std. Deviation .68095
N 30
VMusic-3 Mean 2.8910
Std. Deviation .76034
N 42
VMusic-4 Mean 2.4600
Std. Deviation .28284
N 2
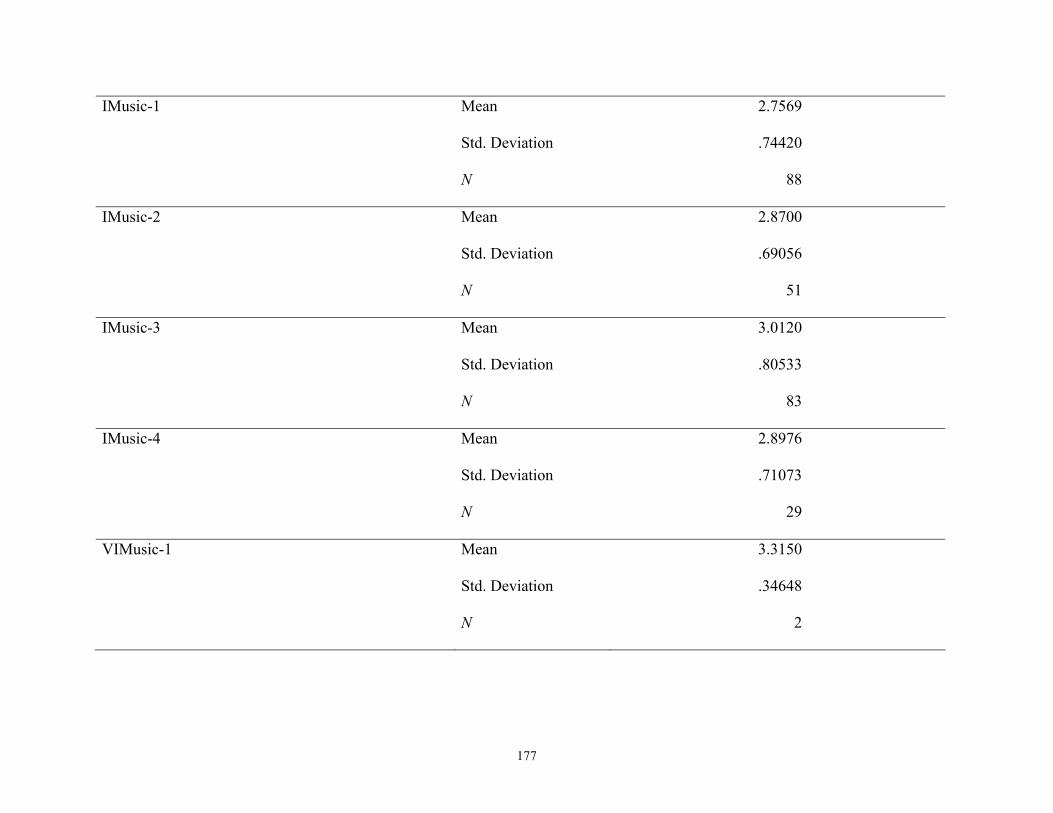
177
IMusic-1 Mean 2.7569
Std. Deviation .74420
N 88
IMusic-2 Mean 2.8700
Std. Deviation .69056
N 51
IMusic-3 Mean 3.0120
Std. Deviation .80533
N 83
IMusic-4 Mean 2.8976
Std. Deviation .71073
N 29
VIMusic-1 Mean 3.3150
Std. Deviation .34648
N 2

178
VIMusic-2 Mean 2.4850
Std. Deviation .65024
N 10
VIMusic-3 Mean 2.6727
Std. Deviation .74405
N 15
VIMusic-4 Mean 3.0533
Std. Deviation .68251
N 24
Total Mean 2.8181
Std. Deviation .74536
N 454
a. Grade Twelve Weighted Cumulative Grade Point Average.

179
deviation. Therefore, male music students have the lowest mean grade twelve weighted
cumulative grade point with a mean grade twelve weighted cumulative grade point average of
2.6791 and a .74120 standard deviation.
Table 37 presents mean, standard deviation, and frequency (N) for the dependent variable
grade twelve weighted cumulative grade point average and the independent variable gender for
the music population.
The highest mean grade twelve weighted cumulative grade point average among the
independent variable ethnicity for the music population is reported among Asian/Pacific
Islanders with a mean grade twelve weighted cumulative grade point average of 3.4119 and a
.74074 standard deviation.
In opposition, the lowest mean grade twelve weighted cumulative grade point average
among the independent variable ethnicity for the music population is reported among the
unspecified ethnic group with a mean grade twelve weighted cumulative grade point average of
1.7600. Since there is only one student in this ethnic group, the standard deviation is not
reported.
Table 38 presents mean, standard deviation, and frequency (N ) for the dependent
variable grade twelve weighted cumulative grade point average and the independent variable
ethnicity for the music population.
There are several statistically significant correlations among the independent variables
and the dependent variable grade twelve weighted cumulative grade point average at the 0.05
(2-tailed) and 0.01 (2-tailed) levels for the music population.
Table 39 presents correlations for all independent variables and the dependent variable
grade twelve weighted cumulative grade point average for the music population. Statistical

180
Table 37
Mean(a), Standard Deviation, and Frequency (N) by Gender for the Music Population.
Gender
Grade Twelve Weighted Cumulative
Grade Point Average
Female Mean 2.9087
Std. Deviation .73536
N 275
Male Mean 2.6791
Std. Deviation .74120
N 179
Total Mean 2.8181
Std. Deviation .74536
N 454
a. Grade Twelve Weighted Cumulative Grade Point Average
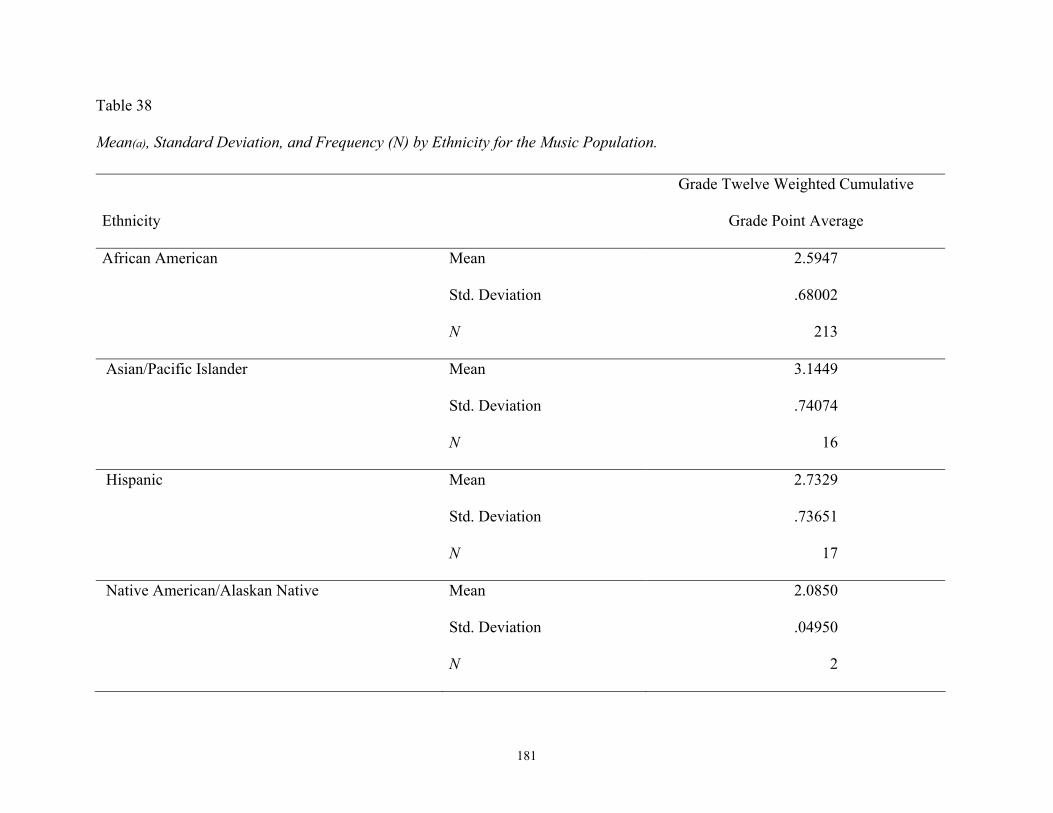
181
Table 38
Mean(a), Standard Deviation, and Frequency (N) by Ethnicity for the Music Population.
Ethnicity
Grade Twelve Weighted Cumulative
Grade Point Average
African American
Mean
Std. Deviation
N
2.5947
.68002
213
Asian/Pacific Islander Mean
Std. Deviation
N
3.1449
.74074
16
Hispanic Mean
Std. Deviation
N
2.7329
.73651
17
Native American/Alaskan Native Mean
Std. Deviation
N
2.0850
.04950
2

182
White Mean
Std. Deviation
N
3.0233
.73267
205
Unspecified Mean
Std. Deviation
N
1.7600
-
1
Total Mean
Std. Deviation
N
2.8181
.74536
454
a. Grade Twelve Weighted Cumulative Grade Point Average

183
significance at the 0.05 level is indicated with one asterisk (*) and statistical significance at the
0.01 level is indicated with two asterisks (**).
Table 40 presents the model summary for the independent variables subject and number
of years enrolled in formal music courses or no formal music courses, gender, and ethnicity and
the dependent variable grade twelve weighted cumulative grade point average for the music
population. Since the independent variable formal music courses or no formal music courses has
missing correlations, it has been deleted from the analysis.
Table 41 presents the analysis of variance (ANOVA) for the independent variables
subject and number of years enrolled in formal music courses or no formal music courses,
gender, and ethnicity and the dependent variable grade twelve weighted cumulative grade point
average among the music population. Again, since the independent variable formal music
courses or no formal music courses has missing correlations, it has been deleted from the
analysis.
Table 42 presents coefficients for each of the independent variables subject and number
of years enrolled in formal music courses or no formal music courses, gender, and ethnicity and
the dependent variable grade twelve weighted cumulative grade point average for the music
population. Once again, since the independent variable formal music courses or no formal music
courses has missing correlations, it has been deleted from the analysis.
Subsequent regression statistics are presented for the dependent variable grade twelve
weighted cumulative grade point average for the music population (N = 454).

184
Table 39
Grade Twelve Weighted Cumulative Grade Point Average Correlations for the Music Population.
Subject and Number
of Years
Gender
Ethnicity
Formal Music or
No Formal Music
GPA
Subject and Number
of Years
Pearson Correlation
Sig. (2-tailed)
N
1
454
.139**
.003
454
.070
.135
454
.a
-
454
.118*
.012
454
Gender Pearson Correlation
Sig. (2-tailed)
N
.139**
.003
454
1
-
454
.067
.155
454
.a
-
454
-.151**
.001
454
Ethnicity Pearson Correlation
Sig. (2-tailed)
N
.070
.135
454
.067
.155
454
1
454
.a
-
454
.253**
.000
454
Formal Music or
No Formal Music
Pearson Correlation
Sig. (2-tailed)
N
.a
-
454
.a
-
454
.a
-
454
.a
-
454
.a
-
454
GPA Pearson Correlation
Sig. (2-tailed)
N
.118*
.012
454
-.151**
.001
454
.253**
.000
454
.a
-
454
1
-
454 *. Correlation is significant at the 0.05 level (2-tailed). **. Correlation is significant at the 0.01 level (2-tailed). a. Cannot be computed because at least one of the variables is constant.

185
Table 40
Model Summary(b) for Subject and Number of Years Enrolled in Formal Music Courses or No
Formal Music Courses, Gender, and Ethnicity for the Music Population.
Change Statistics
R
R
Square
Adjusted
R
Square
Std. Error
of the
Estimate
R Square
Change
F Change
df1
df2
Sig. F
Change
.328a .108 .102 .70650 .108 18.069 3 450 .000
a. Predictors: (Constant), Subject and Number of Years Enrolled in Music or No Music (Grades 9-12), Gender, and Ethnicity.
b. Dependent Variable: Grade Twelve Weighted Cumulative Grade Point Average.
Table 41
Analysis of Variance (ANOVA)[b] for Subject and Number of Years Enrolled in Formal Music
Courses or No Formal Music Courses, Gender, and Ethnicity for the Music Population.
Sum of
Squares
df
Mean
Square
F
Sig.
Regression 27.056 3 9.019 18.069 .000a
Residual 224.615 450 .499
Total 251.671 453
a. Predictors: (Constant), Subject and Number of Years Enrolled in Music or No Music (Grades 9-12), Gender, and Ethnicity.
b. Dependent Variable: Grade Twelve Weighted Cumulative Grade Point Average.

186
Table 42
Coefficients for Subject and Number of Years Enrolled in Formal Music Courses or No Formal Music Courses, Gender, and Ethnicity
for the Music Population.
Unstandardized
Coefficients
Standardized
Coefficients
95% Confidence
Interval for B
B
Std. Error
Beta
t
Sig.
Lower
Bound
Upper
Bound
(Constant) 2.760 .117 23.550 .000 2.530 2.991
Subject and Number of Years Enrolled
in Music or No Music .030
.011
.126 2.792
.005 .009 .052
Gender -.282 .069 -.185 -4.113 .000 -.417 -.147
Ethnicity .099 .017 .256 5.729 .000 .065 .132
a. Dependent Variable: Grade Twelve Weighted Cumulative Grade Point Average.

187
Table 43 presents residual statistics for the dependent variable grade twelve weighted
cumulative grade point average for the music population (N = 454).
Table 43
Residual Statistics for the Music Population.
Minimum
Maximum
Mean
Std.
Deviation
N
Predicted Value 2.3250 3.3370 2.8181 .24439 454
Std. Predicted Value -2.018 2.123 .000 1.000 454
Standard Error of Predicted Value .043 .095 .066 .010 454
Adjusted Predicted Value 2.3220 3.3565 2.8184 .24451 454
Residual -1.57780 1.81314 .00000 .70416 454
Std. Residual -2.233 2.566 .000 .997 454
Stud. Residual -2.243 2.577 .000 1.001 454
Deleted Residual -1.59157 1.82829 -.0024 .71032 454
Stud. Deleted Residual -2.253 2.593 .000 1.003 454
a. Dependent Variable: Grade Twelve Cumulative Grade Point Average.
Regression scatter plots for the dependent variable grade twelve weighted cumulative
grade point average for the music population are presented in Appendix I.
Non Music Population
In comparison to the entire study population of 1,741 (N = 1,741) and the music
population of 454 (N = 454), there are 1,287 non music students or 73.9% of the total population.
As indicated, the mean grade twelve weighted cumulative grade point average for the entire
study population is 2.6203 and the standard deviation is .72876. However, the mean grade twelve
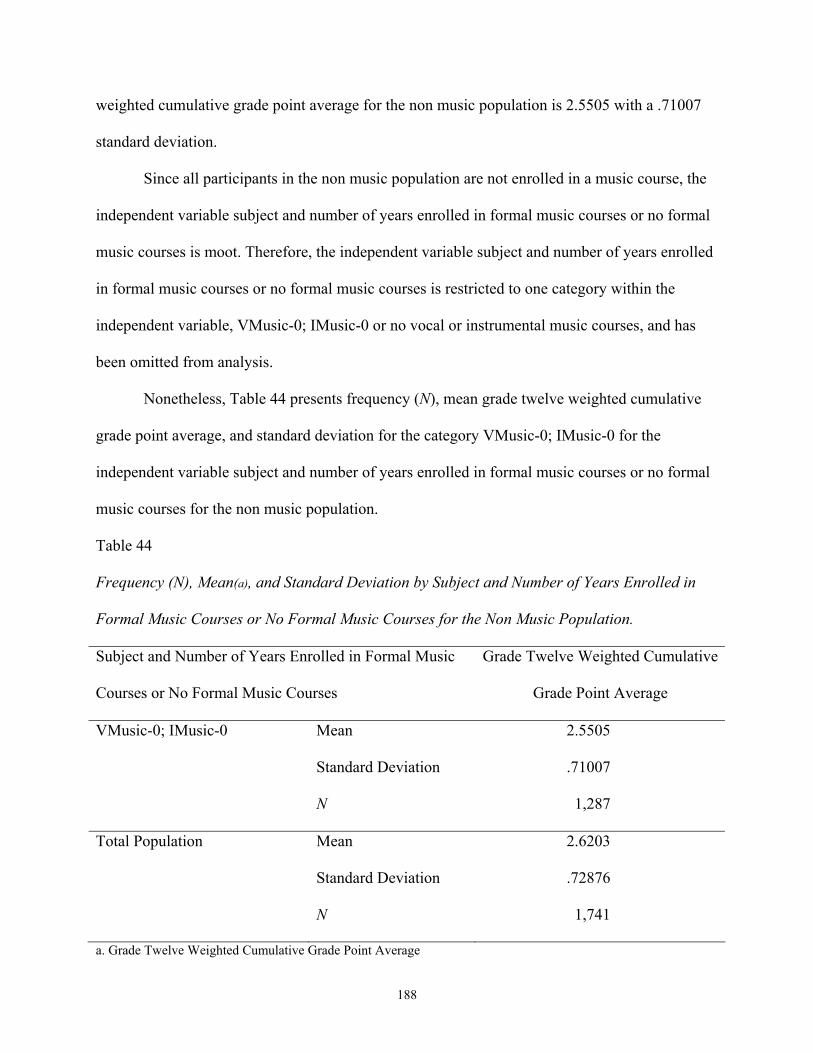
188
weighted cumulative grade point average for the non music population is 2.5505 with a .71007
standard deviation.
Since all participants in the non music population are not enrolled in a music course, the
independent variable subject and number of years enrolled in formal music courses or no formal
music courses is moot. Therefore, the independent variable subject and number of years enrolled
in formal music courses or no formal music courses is restricted to one category within the
independent variable, VMusic-0; IMusic-0 or no vocal or instrumental music courses, and has
been omitted from analysis.
Nonetheless, Table 44 presents frequency (N), mean grade twelve weighted cumulative
grade point average, and standard deviation for the category VMusic-0; IMusic-0 for the
independent variable subject and number of years enrolled in formal music courses or no formal
music courses for the non music population.
Table 44
Frequency (N), Mean(a), and Standard Deviation by Subject and Number of Years Enrolled in
Formal Music Courses or No Formal Music Courses for the Non Music Population.
Subject and Number of Years Enrolled in Formal Music
Courses or No Formal Music Courses
Grade Twelve Weighted Cumulative
Grade Point Average
VMusic-0; IMusic-0 Mean
Standard Deviation
N
2.5505
.71007
1,287
Total Population Mean
Standard Deviation
N
2.6203
.72876
1,741
a. Grade Twelve Weighted Cumulative Grade Point Average

189
Similar to the total study population and the music population, the highest mean grade
twelve weighted cumulative grade point average among the independent variable gender for the
non music population is reported among females with a mean grade twelve weighted cumulative
grade point average of 2.6340 and a .70648 standard deviation. Therefore, male music students
have the lowest mean grade twelve weighted cumulative grade point with a mean grade twelve
weighted cumulative grade point average of 2.4649 and a .70407 standard deviation.
Table 45 presents mean, standard deviation, and frequency (N) for the dependent variable
grade twelve weighted cumulative grade point average and the independent variable gender for
the non music population.
Table 45
Mean(a), Standard Deviation, and Frequency (N) for by Gender for the Non Music Population.
Gender
Grade 12 Weighted Cumulative
Grade Point Average
Female Mean 2.6340
Std. Deviation .70648
N 652
Male Mean 2.4649
Std. Deviation .70407
N 635
Total Mean 2.5505
Std. Deviation .71007
N 1,287
a. Grade Twelve Weighted Cumulative Grade Point Average

190
The highest mean grade twelve weighted cumulative grade point average among the
independent variable ethnicity for the non music population is reported among Whites with a
mean grade twelve weighted cumulative grade point average of 2.9012 and a .70832 standard
deviation. In opposition, the lowest mean grade twelve weighted cumulative grade point average
among the independent variable ethnicity for the non music population is reported among
African Americans with a mean grade twelve weighted cumulative grade point average of 2.2984
and a .59975 standard deviation.
Table 46 presents mean, standard deviation, and frequency (N ) for the dependent
variable grade twelve weighted cumulative grade point average and the independent variable
ethnicity for the non music population. In view of the fact that all participants in the non music
population are not enrolled in a music course, the independent variable formal music courses or
no formal music courses is moot and has been omitted from analysis.
There are several statistically significant correlations among the independent variables
and the dependent variable grade twelve weighed cumulative grade point average at the 0.05
(2-tailed) and the 0.01 (2-tailed) levels for the non music population. Table 47 presents
correlations for all independent variables and the dependent variable grade twelve weighted
cumulative grade point average for the non music population. Statistical significance at the 0.05
level is indicated with one asterisk (*) and statistical significance at the 0.01 level is indicated
with two asterisks (**).
Since all students in this population are not enrolled in a music course, the independent
variable subject and number of years enrolled in a formal music course or no formal music
course and the independent variable formal music courses or no formal music courses are
constant. Therefore, several correlations cannot be computed and are indicated accordingly.

191
Table 46
Mean(a), Standard Deviation, and Frequency (N) by Ethnicity for the Non Music Population.
Ethnicity
Grade 12 Weighted Cumulative
Grade Point Average
African American
Mean
Std. Deviation
N
2.2984
.59975
703
Asian/Pacific Islander Mean
Std. Deviation
N
2.8480
.76444
49
Hispanic Mean
Std. Deviation
N
2.5889
.65105
65
Native American/Alaskan Native Mean
Std. Deviation
N
2.4800
.64132
12

192
White Mean
Std. Deviation
N
2.9012
.70832
457
Unspecified Mean
Std. Deviation
N
2.7675
1.01890
4
Total Mean
Std. Deviation
N
2.5505
.71007
1,287
a. Grade Twelve Weighted Cumulative Grade Point Average
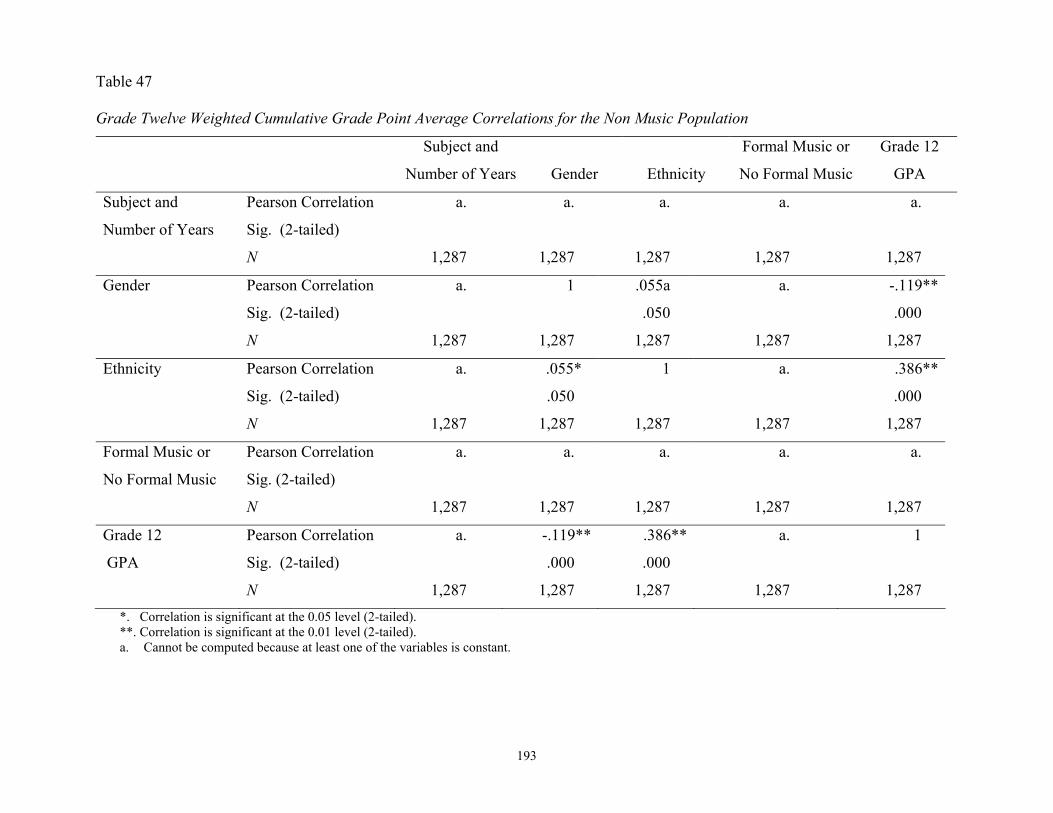
193
Table 47
Grade Twelve Weighted Cumulative Grade Point Average Correlations for the Non Music Population
Subject and
Number of Years
Gender
Ethnicity
Formal Music or
No Formal Music
Grade 12
GPA
Subject and
Number of Years
Pearson Correlation
Sig. (2-tailed)
N
a.
1,287
a.
1,287
a.
1,287
a.
1,287
a.
1,287
Gender Pearson Correlation
Sig. (2-tailed)
N
a.
1,287
1
1,287
.055a
.050
1,287
a.
1,287
-.119**
.000
1,287
Ethnicity Pearson Correlation
Sig. (2-tailed)
N
a.
1,287
.055*
.050
1,287
1
1,287
a.
1,287
.386**
.000
1,287
Formal Music or
No Formal Music
Pearson Correlation
Sig. (2-tailed)
N
a.
1,287
a.
1,287
a.
1,287
a.
1,287
a.
1,287
Grade 12
GPA
Pearson Correlation
Sig. (2-tailed)
N
a.
1,287
-.119**
.000
1,287
.386**
.000
1,287
a.
1,287
1
1,287 *. Correlation is significant at the 0.05 level (2-tailed). **. Correlation is significant at the 0.01 level (2-tailed). a. Cannot be computed because at least one of the variables is constant.

194
Table 48 presents the model summary for the independent variables gender and ethnicity
and the dependent variable grade twelve weighted cumulative grade point average for the non
music population. The independent variable subject and number of years enrolled in formal
music courses or no formal music courses and the independent variable formal music courses or
no formal music courses are constants or have missing correlations. Therefore, they have been
deleted from analysis.
Table 48
Model Summary (b) for Gender and Ethnicity for the Non Music Population.
Change Statistics
R
R
Square
Adjusted
R
Square
Std. Error
of the
Estimate
R Square
Change
F
Change
df1
df2
Sig. F
Change
.411a .169 .168 .64778 .169 130.608 2 1,284 .000
a. Predictors: (Constant), Gender and Ethnicity b. Dependent Variable: Grade Twelve Weighted Cumulative Grade Point Average
Table 49 presents the analysis of variance (ANOVA) for the independent variables
gender and ethnicity and the dependent variable grade twelve weighted cumulative grade point
average for the non music population. Again, since the independent variable subject and number
of years enrolled in formal music courses or no formal music courses and the independent
variable formal music courses or no formal music courses are constants or have missing
correlations, they are deleted from analysis.

195
Table 49
Analysis of Variance (ANOVA)[b] for Gender and Ethnicity for the Non Music Population.
Sum of
Squares
df
Mean
Square
F
Sig.
Regression 109.612 2 54.806 130.608 .000a
Residual 538.792 1,284 .420
Total 648.403 1,286
a. Predictors: (Constant), Gender and Ethnicity. b. Dependent Variable: Grade Twelve Weighted Cumulative Grade Point Average.
Table 50 presents coefficients for the independent variables gender and ethnicity and the
dependent variable grade twelve weighted cumulative grade point average for the non music
population. Once again, since the independent variable subject and number of years enrolled in
formal music courses or no formal music courses and the independent variable formal music
courses or no formal music courses are constants or have missing correlations, they are deleted
from analysis.
For the non music population’s independent variables and the dependent variable grade
twelve weighted cumulative grade point average, the mean predicted value is 2.5505 and the
standard deviation is .29195. The mean standardized predicted value is .000 and the standard
deviation is 1.000. The mean standard error of the predicted value is .031 and the standard
deviation is .003. The mean adjusted predicted value is 2.5506 and the standard deviation is
.29196. The mean residual is .00000 and the standard deviation is .64728. The mean standard
residual is .000 and the standard deviation is .999. The mean studentized residual is .000 and the
standard deviation is .000. The mean deleted residual is -.00001 and the standard deviation is
.64882. Finally, the mean studentized deleted residual is .000 and the standard deviation is 1.001.
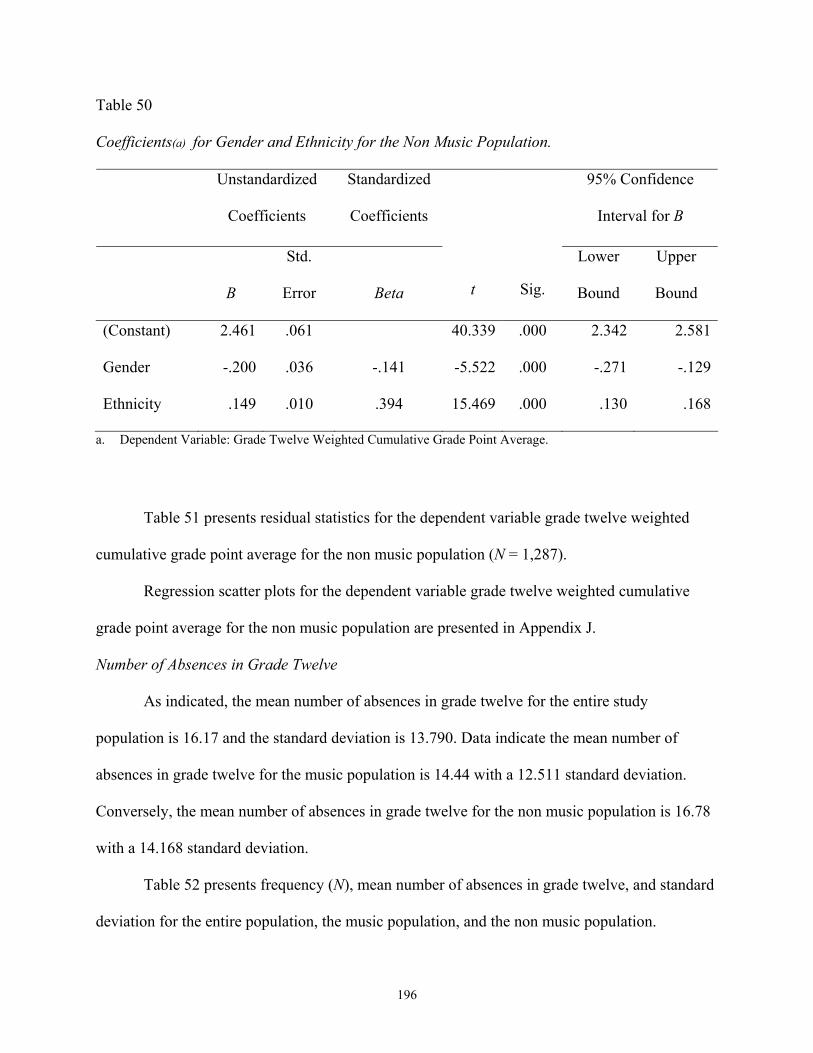
196
Table 50
Coefficients(a) for Gender and Ethnicity for the Non Music Population.
Unstandardized
Coefficients
Standardized
Coefficients
95% Confidence
Interval for B
B
Std.
Error
Beta t
Sig.
Lower
Bound
Upper
Bound
(Constant) 2.461 .061 40.339 .000 2.342 2.581
Gender -.200 .036 -.141 -5.522 .000 -.271 -.129
Ethnicity .149 .010 .394 15.469 .000 .130 .168
a. Dependent Variable: Grade Twelve Weighted Cumulative Grade Point Average.
Table 51 presents residual statistics for the dependent variable grade twelve weighted
cumulative grade point average for the non music population (N = 1,287).
Regression scatter plots for the dependent variable grade twelve weighted cumulative
grade point average for the non music population are presented in Appendix J.
Number of Absences in Grade Twelve
As indicated, the mean number of absences in grade twelve for the entire study
population is 16.17 and the standard deviation is 13.790. Data indicate the mean number of
absences in grade twelve for the music population is 14.44 with a 12.511 standard deviation.
Conversely, the mean number of absences in grade twelve for the non music population is 16.78
with a 14.168 standard deviation.
Table 52 presents frequency (N), mean number of absences in grade twelve, and standard
deviation for the entire population, the music population, and the non music population.

197
Table 51
Residual Statistics(a) for the Non Music Population.
Minimum Maximum Mean SD N
Predicted Value 2.2110 3.1564 2.5505 .29195 1,287
Std. Predicted Value -1.163 2.075 .000 1.000 1,287
Standard Error of Predicted Value .026 .042 .031 .003 1,287
Adjusted Predicted Value 2.2063 3.1616 2.5506 .29196 1,287
Residual -1.52750 2.10897 .00000 .64728 1,287
Std. Residual -2.358 3.256 .000 .999 1,287
Stud. Residual -2.361 3.259 .000 1.000 1,287
Deleted Residual -1.53170 2.11366 -.00001 .64882 1,287
Stud. Deleted Residual -2.366 3.272 .000 1.001 1,287
a. Dependent Variable: Grade Twelve Cumulative Grade Point Average.
Table 52
Frequency (N), Mean(a), and Standard Deviation for All Populations.
Population
Frequency
(N)
Mean Number of Absences
in Grade 12
Standard
Deviation
Music Population 454 14.44 12.511
Non Music Population 1,287 16.78 14.168
Total Population 1,741 16.17 13.790
a. Number of Absences in Grade Twelve
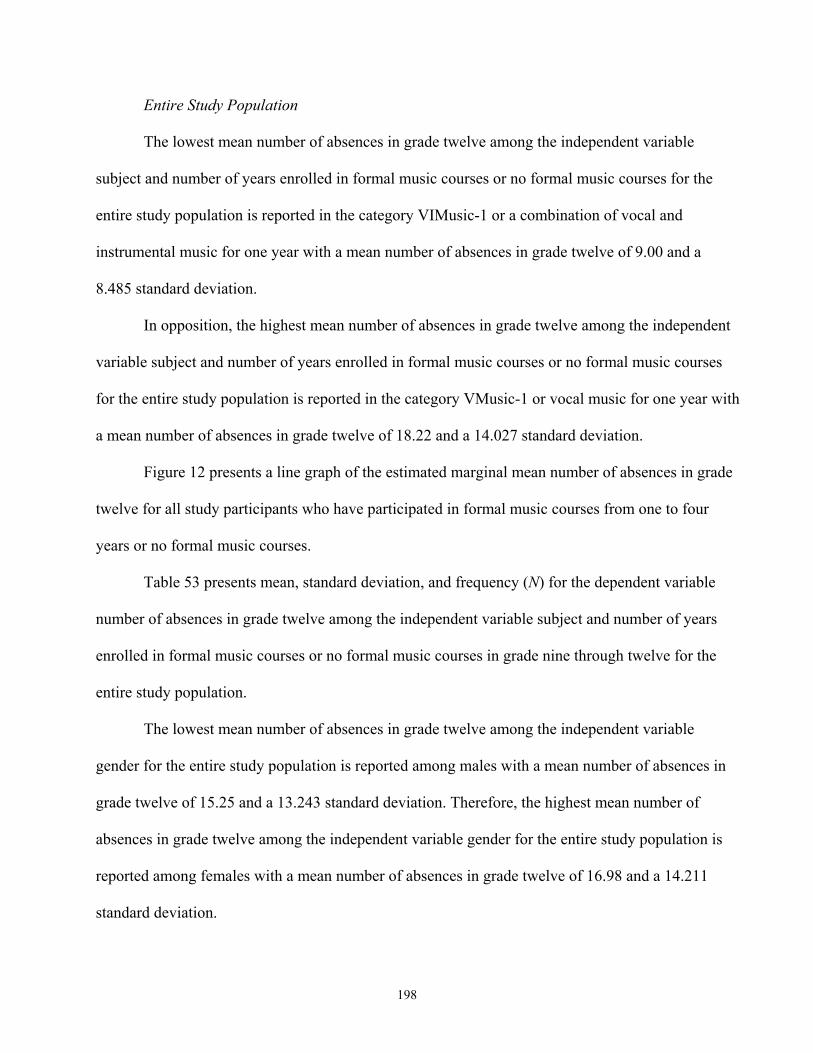
198
Entire Study Population
The lowest mean number of absences in grade twelve among the independent variable
subject and number of years enrolled in formal music courses or no formal music courses for the
entire study population is reported in the category VIMusic-1 or a combination of vocal and
instrumental music for one year with a mean number of absences in grade twelve of 9.00 and a
8.485 standard deviation.
In opposition, the highest mean number of absences in grade twelve among the independent
variable subject and number of years enrolled in formal music courses or no formal music courses
for the entire study population is reported in the category VMusic-1 or vocal music for one year with
a mean number of absences in grade twelve of 18.22 and a 14.027 standard deviation.
Figure 12 presents a line graph of the estimated marginal mean number of absences in grade
twelve for all study participants who have participated in formal music courses from one to four
years or no formal music courses.
Table 53 presents mean, standard deviation, and frequency (N) for the dependent variable
number of absences in grade twelve among the independent variable subject and number of years
enrolled in formal music courses or no formal music courses in grade nine through twelve for the
entire study population.
The lowest mean number of absences in grade twelve among the independent variable
gender for the entire study population is reported among males with a mean number of absences in
grade twelve of 15.25 and a 13.243 standard deviation. Therefore, the highest mean number of
absences in grade twelve among the independent variable gender for the entire study population is
reported among females with a mean number of absences in grade twelve of 16.98 and a 14.211
standard deviation.

199
Figure 12. Estimated Marginal Mean Number of Absences in Grade Twelve by Number of Years
Enrolled in Formal Music Courses or No Formal Music Courses for the Entire Study
Population.
Table 54 presents mean, standard deviation, and frequency (N ) for the dependent variable
number of absences in grade twelve for the independent variable gender among the entire study
population.
The lowest mean number of absences in grade twelve among the independent variable
ethnicity for the entire study population is reported among Whites with a mean number of absences
in grade twelve of 16.14 and a 13.439 standard deviation.
In opposition, the highest mean number of absences in grade twelve among the independent
variable ethnicity for the entire study population is reported in the unspecified ethnic group with a
mean number of absences in grade twelve of 26.40 and a 20.756 standard deviation.
Number of years in music4.003.002.001.00.00
Estim
ated
Mar
gina
l Mea
ns
17
16
15
14
13
12

200
Table 53
Mean(a), Standard Deviation, and Frequency (N) by Subject and Number of Years Enrolled in Formal Music Courses or No Formal
Music Courses for the Entire Study Population.
Subject and Number of Years Enrolled
in Music or No Music
Number of Absences
in Grade 12
VMusic-1 Mean 18.22
Std. Deviation 14.027
N 78
VMusic-2 Mean 16.23
Std. Deviation 11.437
N 30
VMusic-3 Mean 15.29
Std. Deviation 14.118
N 42
VMusic-4 Mean 14.00
Std. Deviation 1.414
N 2

201
IMusic-1 Mean 13.42
Std. Deviation 10.573
N 88
IMusic-2 Mean 12.33
Std. Deviation 9.995
N 51
IMusic-3 Mean 12.81
Std. Deviation 13.720
N 83
IMusic-4 Mean 16.03
Std. Deviation 15.098
N 29
VIMusic-1 Mean 9.00
Std. Deviation 8.485
N 2

202
VIMusic-2 Mean 17.60
Std. Deviation 10.690
N 10
VIMusic-3 Mean 14.20
Std. Deviation 13.001
N 15
VIMusic-4 Mean 9.79
Std. Deviation 7.390
N 24
VMusic-0; IMusic-0 Mean 16.78
Std. Deviation 14.168
N 1,287
Total Mean 16.17
Std. Deviation 13.790
N 1,741
a. Number of Absences in Grade Twelve
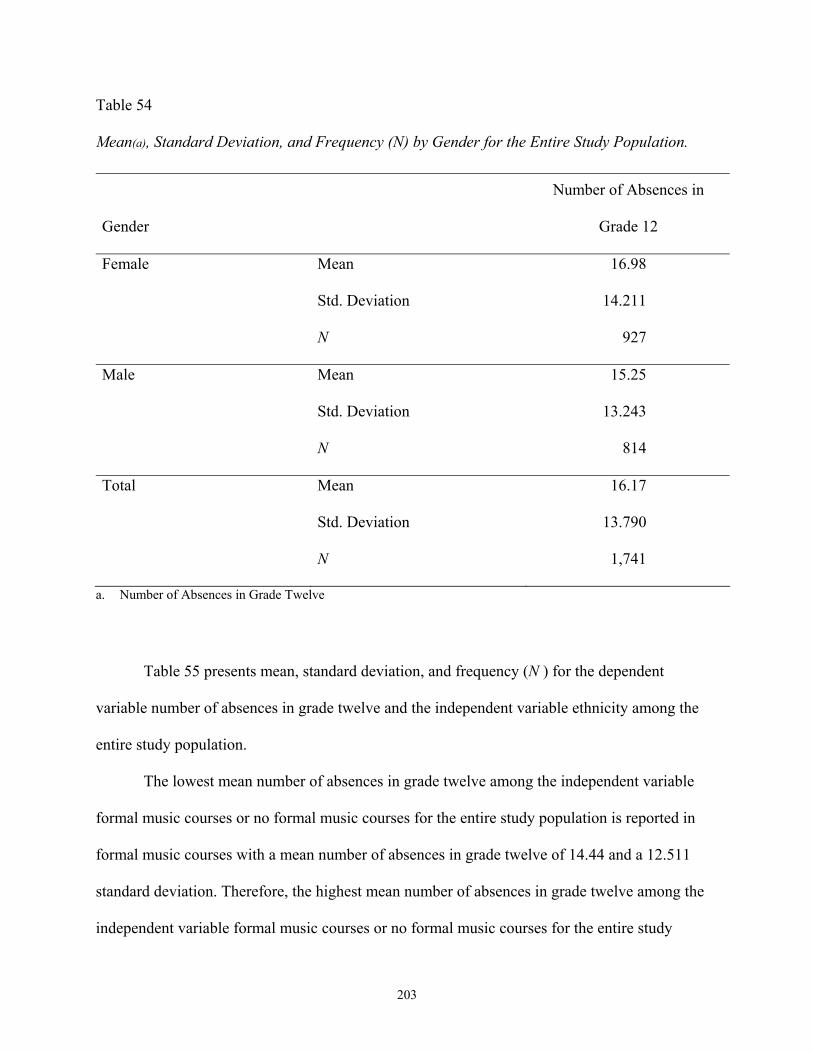
203
Table 54
Mean(a), Standard Deviation, and Frequency (N) by Gender for the Entire Study Population.
Gender
Number of Absences in
Grade 12
Female Mean 16.98
Std. Deviation 14.211
N 927
Male Mean 15.25
Std. Deviation 13.243
N 814
Total Mean 16.17
Std. Deviation 13.790
N 1,741
a. Number of Absences in Grade Twelve
Table 55 presents mean, standard deviation, and frequency (N ) for the dependent
variable number of absences in grade twelve and the independent variable ethnicity among the
entire study population.
The lowest mean number of absences in grade twelve among the independent variable
formal music courses or no formal music courses for the entire study population is reported in
formal music courses with a mean number of absences in grade twelve of 14.44 and a 12.511
standard deviation. Therefore, the highest mean number of absences in grade twelve among the
independent variable formal music courses or no formal music courses for the entire study

204
Table 55
Mean(a), Standard Deviation, and Frequency (N) by Ethnicity for the Entire Study Population.
Ethnicity
Number of Absences
in Grade 12
African American
Mean
Std. Deviation
N
16.03
13.925
916
Asian/Pacific Islander Mean
Std. Deviation
N
15.91
15.535
65
Hispanic Mean
Std. Deviation
N
16.44
12.293
79
Native American/Alaskan Native Mean
Std. Deviation
N
22.79
17.485
14
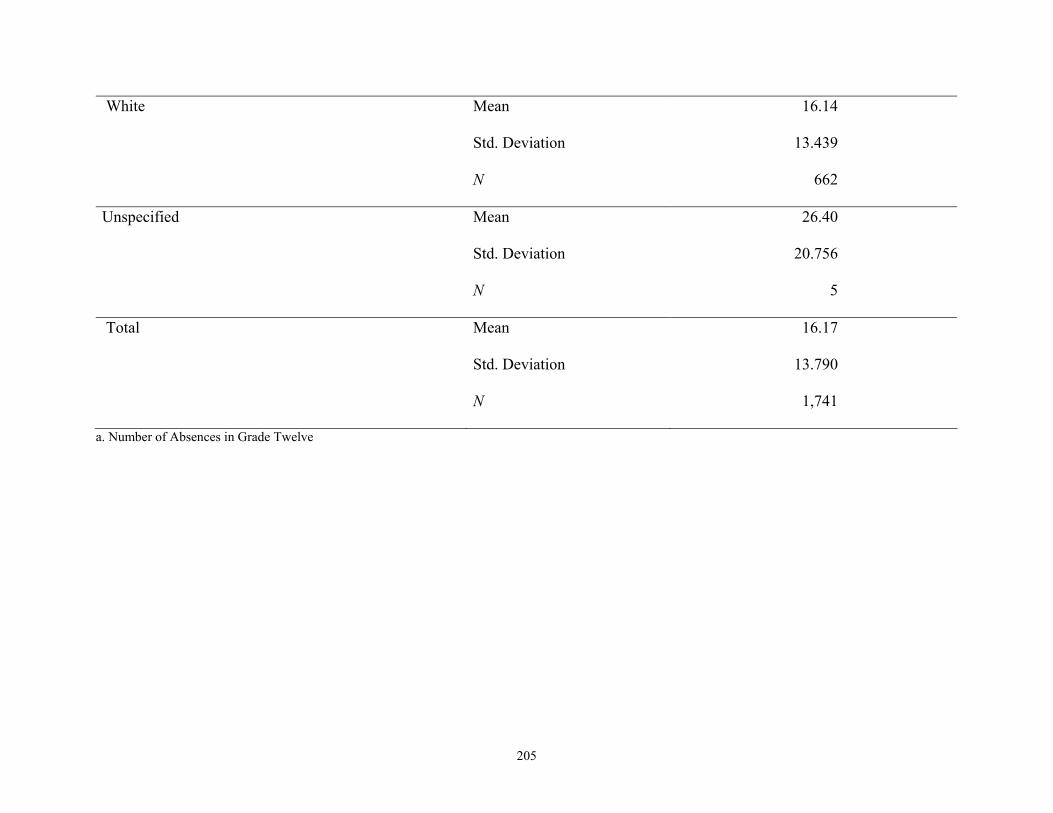
205
White Mean
Std. Deviation
N
16.14
13.439
662
Unspecified Mean
Std. Deviation
N
26.40
20.756
5
Total Mean
Std. Deviation
N
16.17
13.790
1,741
a. Number of Absences in Grade Twelve

206
population is reported in the independent variable no formal music courses with a mean number
of absences in grade twelve of 16.78 and a standard deviation of 14.168.
Table 56 presents mean, standard deviation, and frequency (N ) for the dependent
variable number of absences in grade twelve among the independent variable formal music
courses or no formal music courses for the entire study population.
Table 56
Mean(a), Standard Deviation, and Frequency (N) by Formal Music Courses or No Formal Music
Courses for the Entire Study Population.
Formal Music Courses or
No Formal Music Courses
Number of Absences
in Grade 12
Formal Music Courses Mean 14.44
Standard Deviation 12.511
N 454
No Formal Music Courses Mean 16.78
Standard Deviation 14.168
N 1,287
Total Mean 16.17
Standard Deviation 13.790
N 1,741
a. Number of Absences in Grade Twelve
Figure 13 presents a line graph of the estimated mean number of absences in grade
twelve by formal music courses or no formal music courses for the entire study population.
207
Figure 13. Estimated Marginal Mean Number of Absences in Grade Twelve by Formal Music
Courses or No Formal Music Courses for the Entire Study Population.
There are several statistically significant correlations among the independent variables
and the dependent variable number of absences in grade twelve at the 0.05 (2-tailed) and the 0.01
(2-tailed) levels for the entire study population.
Table 57 presents correlations for all independent variables and the dependent variable
number of absences in grade twelve for the entire study population. Statistical significance at the
0.05 level is indicated with one asterisk (*) and statistical significance at the 0.01 level is
indicated with two asterisks (**).
Participated in music vs no participation in music10
Estim
ated
Mar
gina
l Mea
ns17
16.5
16
15.5
15
14.5
14

208
Table 57
Number of Absences in Grade Twelve Correlations for the Entire Study Population.
Subject and
Number of
Years
Gender
Ethnicity
Formal Music
or No Formal
Music
Number of
Absences in
Grade 12
Subject and Number
of Years
Pearson Correlation
Sig. (2-tailed)
N
1
1,741
.108**
.000
1,741
-.056*
.019
1,741
.907**
.000
1,741
.041
.085
1,741
Gender Pearson Correlation
Sig. (2-tailed)
N
.108**
.000
1,741
1
1,741
.051*
.035
1,741
.087**
.000
1,741
-.062**
.009
1,741
Ethnicity Pearson Correlation
Sig. (2-tailed)
N
-.056*
.019
1,741
.051*
.035
1,741
1
1,741
-.079**
.001
1,741
.010
.663
1,741
Formal Music or
No Formal Music
Pearson Correlation
Sig. (2-tailed)
N
.907**
.000
1,741
.087**
.000
1,741
-.079**
.001
1,741
1
1,741
.074**
.002
1,741
Number of Absences
in Grade 12
Pearson Correlation
Sig. (2-tailed)
N
.041
.085
1,741
-.062**
.009
1,741
.010
.663
1,741
.074**
.002
1,741
1
1,741 *. Correlation is significant at the 0.05 level (2-tailed). **. Correlation is significant at the 0.01 level (2-tailed).

209
Table 58 presents the results of univariate analysis of variance tests of between-subjects
effects for the dependent variable number of absences in grade twelve for the entire study
population.
Table 59 presents the model summary for all independent variables and the dependent
variable number of absences in grade twelve after controlling for gender and ethnicity for the
entire study population.
Table 60 presents the analysis of variance (ANOVA) for the independent variables and
the dependent variable number of absences in grade twelve after controlling for gender and
ethnicity for the entire study population.
Table 61 presents coefficients for each of the independent variables and the dependent
variable number of absences in grade twelve after controlling for gender and ethnicity for the
entire study population.
Table 62 presents a model summary of excluded variables for the dependent variable
number of absences in grade twelve after controlling for gender and ethnicity.
Subsequent regression statistics are presented for the dependent variable number of
absences in grade twelve for the entire study population (N = 1,741).
The mean predicted value is 16.17 and the standard deviation is 1.638. The mean
standardized predicted value is .000 and the standard deviation is 1.000. The mean standard error
of the predicted value is .703 and the standard deviation is .212. The mean adjusted predicted
value is 16.17 and the standard deviation is 1.639. The mean residual is .000 and the standard
deviation is 13.692. The mean standardized residual is .000 and the standard deviation is .999.
The mean studentized residual is .000 and the standard deviation is 1.000. The mean deleted
residual is .000 and the standard deviation is 13.729. Finally, the mean studentized deleted
residual is .000 and the standard deviation is 1.002.

210
Table 58
Univariate Analysis of Variance Tests of Between-Subjects Effects for Number of Absences in Grade Twelve for the Entire Study
Population.
Source
Type III
Sum of Squares
df
Mean Square
F
Sig.
Corrected Model 3876.058a 6 646.010 3.426 .002
Intercept 33373.390 1 33373.390 176.969 .000
Gender 2 1621.856 1 1621.856 8.600 .003
Ethnicity 2 74.731 1 74.731 .396 .529
Subject and Number of Years in Music 2564.917 4 641.229 3.400 .009
Error 327004.276 1,734 188.584
Total 786131.000 1,741
Corrected Total 330880.334 1,740
a. R Squared = .012 (Adjusted R Squared = .008)
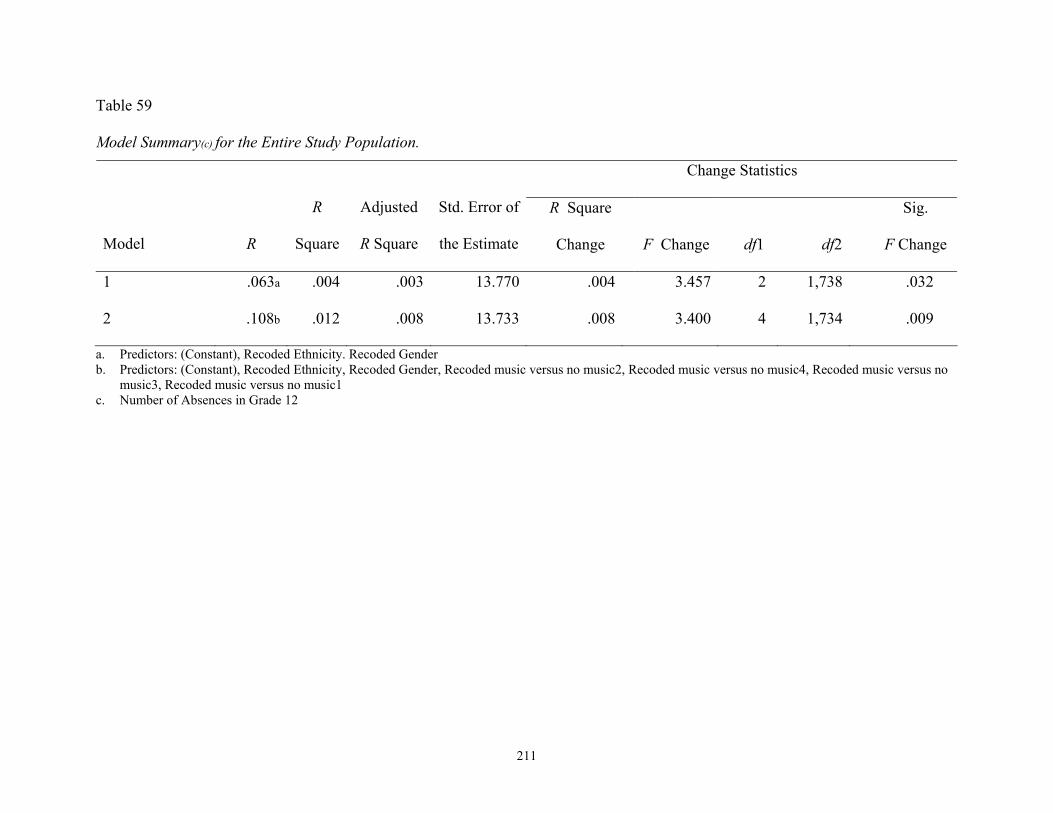
211
Table 59
Model Summary(c) for the Entire Study Population.
Change Statistics
Model
R
R
Square
Adjusted
R Square
Std. Error of
the Estimate
R Square
Change
F Change
df1
df2
Sig.
F Change
1 .063a .004 .003 13.770 .004 3.457 2 1,738 .032
2 .108b .012 .008 13.733 .008 3.400 4 1,734 .009
a. Predictors: (Constant), Recoded Ethnicity. Recoded Gender b. Predictors: (Constant), Recoded Ethnicity, Recoded Gender, Recoded music versus no music2, Recoded music versus no music4, Recoded music versus no
music3, Recoded music versus no music1 c. Number of Absences in Grade 12

212
Table 60
Analysis of Variance (ANOVA)[c] for the Entire Study Population.
Model
Sum of
Squares
df
Mean
Square
F
Sig.
1 Regression 1311.142 2 855.571 3.457 .032a
Residual 329569.19 1,738 189.626
Total 330880.33 1,740
2 Regression 3876.058 5 646.010 3.426 .002b
Residual 327004328 1,734 188.584
Total 330880.33 1,740
a. Predictors: (Constant), Recoded Ethnicity, Recoded Gender b. Predictors: (Constant), Recoded Ethnicity, Recoded Gender, Recoded music versus no music2, Recoded music
versus no music4, Recoded music versus music3, Recoded music versus no music1 c. Dependent Variable: Number of Absences in Grade 12
Table 63 presents residual statistics for the dependent variable number of absences in
grade twelve among the entire study population (N = 1,741).
Regression scatter plots for the dependent variable number of absences in grade twelve
for the entire study population are presented in Appendix K.

213
Table 61
Coefficients for the Entire Study Population.
Unstandardized
Coefficients
Standardized
Coefficients
Model B Std. Error Beta
t
Sig.
1 (Constant) 15.031 .825 18.215 .000
Recoded Gender 1.737 .662 .063 2.622 .009
Recoded Ethnicity .116 .351 .008 .330 .741
2 (Constant) 15.393 .831 18.534 .000
Recoded Gender 1.947 .664 .070 2.933 .003
Recoded Ethnicity .221 .352 .015 .630 .529
Recoded Music versus No Music1 -1.441 1.131 -.031 -1.275 .203
Recoded Music versus No Music2 -2.683 1.490 -.043 -1.800 .072
Recoded Music versus No Music3 -3.316 1.227 -.065 -2.702 .007
Recoded Music versus No Music4 -3.897 1.895 -.049 -2.056 .040
a. Dependent Variable: Number of Absences in Grade 12.

214
Table 62
Excluded Variables(b).
Collinearity
Statistics
Model
Beta
In
t
Sig.
Partial
Correlation Tolerance
1 Recoded music versus no music1 -.018a -.735 .462 -.018 .995
Recoded music versus no music2 -.034a -1.428 .153 -.034 1.000
Recoded music versus no music3 -.056a -2.350 .019 -.053 .994
Recoded music versus no music4 -.042a -1.749 .081 -.042 .997
a. Predictors in the Model (Constant), Recoded Ethnicity, Recoded Gender b. Dependent Variable: Number of Absences in Grade 12
Table 63
Residual Statistics for the Entire Study Population.
Minimum
Maximum
Mean
Std.
Deviation
N
Predicted Value 9.58 18.24 16.17 1.638 1,741
Std. Predicted Value -4.023 1.265 .000 1.000 1,741
Standard Error of Predicted Value .510 1.628 .703 .212 1,741
Adjusted Predicted Value 9.43 18.17 16.17 1.639 1,741
Residual -18.080 72.415 .000 13.692 1,741
Std. Residual -1.319 5.283 .000 .999 1,741
Stud. Residual -1.320 5.288 .000 1.000 1,741
Deleted Residual -18.123 72.549 .000 13.729 1,741
Stud. Deleted Residual -1.321 5.329 .000 1.002 1,741
a. Dependent Variable: Number of Absences in Grade Twelve.

215
Music Population
In comparison to the entire study population’s (N = 1,741) mean number of absences in
grade twelve of 16.17 and 13.790 standard deviation, the music population’s (N = 454) mean
number of absences in grade twelve is 14.44 with a 12.511 standard deviation.
The lowest mean number of absences in grade twelve among the independent variable
subject and number of years enrolled in formal music courses or no formal music courses for the
music population is reported in the category VIMusic-4 or a combination of vocal and
instrumental music courses for four years with a mean number of absences in grade twelve of
9.79 and a 7.390 standard deviation.
In opposition, the highest mean number of absences in grade twelve among the
independent variable subject and number of years enrolled in formal music courses or no formal
music courses for the music population is reported in the category VMusic-1 or one year of vocal
music with a mean number of absences in grade twelve of 18.22 and a 14.027 standard deviation.
Table 64 presents mean, standard deviation, and frequency (N ) for the dependent
variable number of absences in grade twelve and the independent variable subject and number of
years enrolled in formal music courses or no formal music courses for the music population.
The lowest number of absences in grade twelve among the independent variable gender for
the music population is reported among males with a mean number of absences in grade twelve of
14.22 and a 12.911 standard deviation. Therefore, female music students have the highest mean
number of absences in grade twelve with a mean number of absences in grade twelve of 14.59 and
a 12.266 standard deviation.
Table 65 presents mean, standard deviation, and frequency (N) for the dependent variable
number of absences in grade twelve and the independent gender for the music population.

216
Table 64
Mean(a), Standard Deviation, and Frequency (N) for by Subject and Number of Years Enrolled in Formal Music Courses or No
Formal Music Courses for the Music Population.
Subject and Number of Years Enrolled
in Music or No Music
Mean Number of Absences
in Grade 12
VMusic-1 Mean 18.22
Std. Deviation 14.027
N 78
VMusic-2 Mean 16.23
Std. Deviation 11.437
N 30
VMusic-3 Mean 15.29
Std. Deviation 14.118
N 42

217
VMusic-4 Mean 14.00
Std. Deviation 1.414
N 2
IMusic-1 Mean 13.42
Std. Deviation 10.573
N 88
IMusic-2 Mean 12.33
Std. Deviation 9.995
N 51
IMusic-3 Mean 12.81
Std. Deviation 13.720
N 83
IMusic-4 Mean 16.03
Std. Deviation 15.098
N 29

218
VIMusic-1 Mean 9.00
Std. Deviation 8.485
N 2
VIMusic-2 Mean 17.60
Std. Deviation 10.690
N 10
VIMusic-3 Mean 14.20
Std. Deviation 13.001
N 15
VIMusic-4 Mean 9.79
Std. Deviation 7.390
N 24
Total Mean 14.44
Std. Deviation 12.511
N 454
a. Number of Absences in Grade 12

219
Table 65
Mean(a), Standard Deviation, and Frequency (N) by Gender for the Music Population.
Gender
Number of Absences in
Grade 12
Female Mean 14.59
Std. Deviation 12.266
N 275
Male Mean 14.22
Std. Deviation 12.911
N 179
Total Mean 14.44
Std. Deviation 12.511
N 454
a. Number of Absences in Grade 12
The lowest mean number of absences in grade twelve among the independent variable
ethnicity for the music population is reported among Asian/Pacific Islanders with a mean number
of absences in grade twelve of 10.69 and a 19.527 standard deviation.
In opposition, the highest mean number of absences in grade twelve among the
independent variable ethnicity for the music population is reported among the unspecified ethnic
group with a mean number of absences in grade twelve of 38.00. Once again, since there is only
one student in this ethnic group, the standard deviation is not reported.

220
Table 66 presents mean, standard deviation, and frequency (N ) for the dependent
variable number of absences in grade twelve and the independent variable ethnicity among the
music population.
In view of the fact that all participants in the music population are enrolled in a music
course, the independent variable formal music courses or no formal music courses is moot and
has been omitted from analysis. Nonetheless, Table 67 presents mean, standard deviation, and
frequency (N) for the dependent variable number of absences in grade twelve and the
independent variable formal music courses for the music population and the entire study
population.
There are several statistically significant correlations among the independent variables
and the dependent variable number of absences in grade twelve at the 0.05 (2-tailed) and 0.01
(2-tailed) levels for the non music population.
Table 68 presents correlations for all independent variables and the dependent variable
number of absences in grade twelve for the music population. Statistical significance at the 0.05
level is indicated with one asterisk (*) and statistical significance at the 0.01 level is indicated
with two asterisks (**).
All students are enrolled in a music course. Therefore, the independent variable formal
music courses or no formal music courses is moot and analysis is omitted.
Table 69 presents the model summary for the independent variables subject and number
of years enrolled in formal music courses or no formal music courses, gender, and ethnicity and
the dependent variable number of absences in grade twelve for the music population. Again,
since the independent variable formal music courses or no formal music courses has missing
correlations, it has been deleted from the analysis.
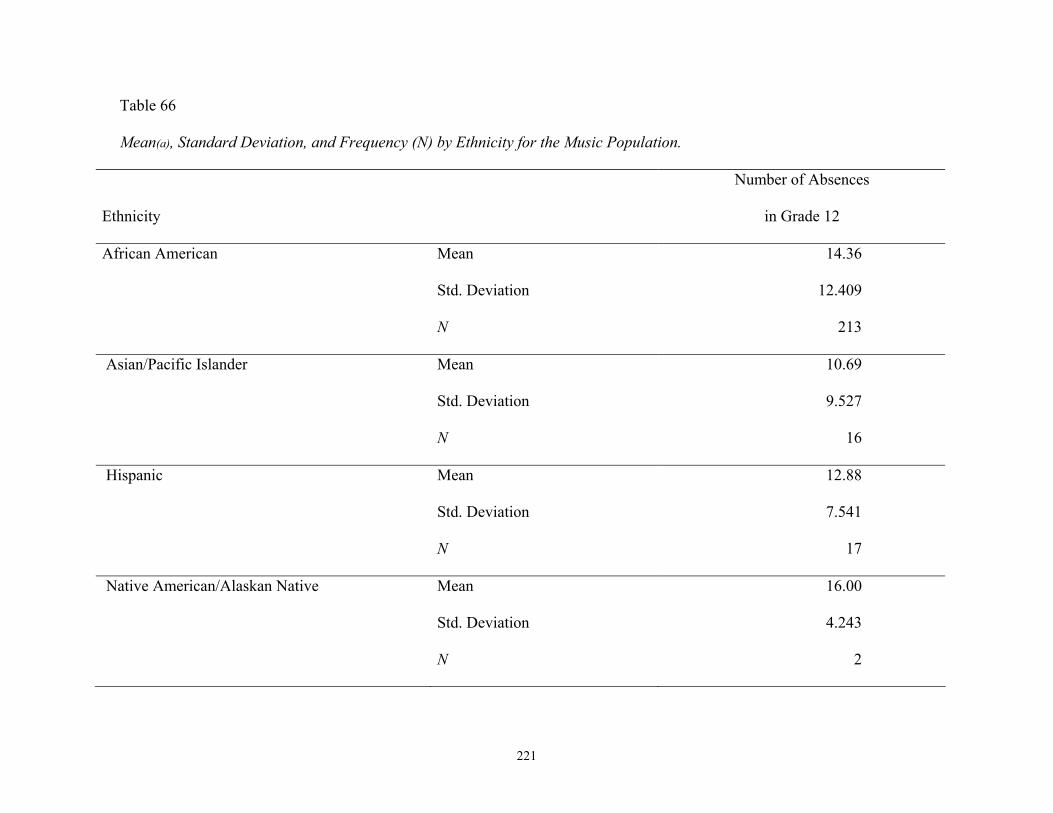
221
Table 66
Mean(a), Standard Deviation, and Frequency (N) by Ethnicity for the Music Population.
Ethnicity
Number of Absences
in Grade 12
African American
Mean
Std. Deviation
N
14.36
12.409
213
Asian/Pacific Islander Mean
Std. Deviation
N
10.69
9.527
16
Hispanic Mean
Std. Deviation
N
12.88
7.541
17
Native American/Alaskan Native Mean
Std. Deviation
N
16.00
4.243
2

222
White Mean
Std. Deviation
N
14.82
13.121
205
Unspecified Mean
Std. Deviation
N
38.00
-
1
Total Mean
Std. Deviation
N
14.44
12.511
454
a. Number of Absences in Grade 12
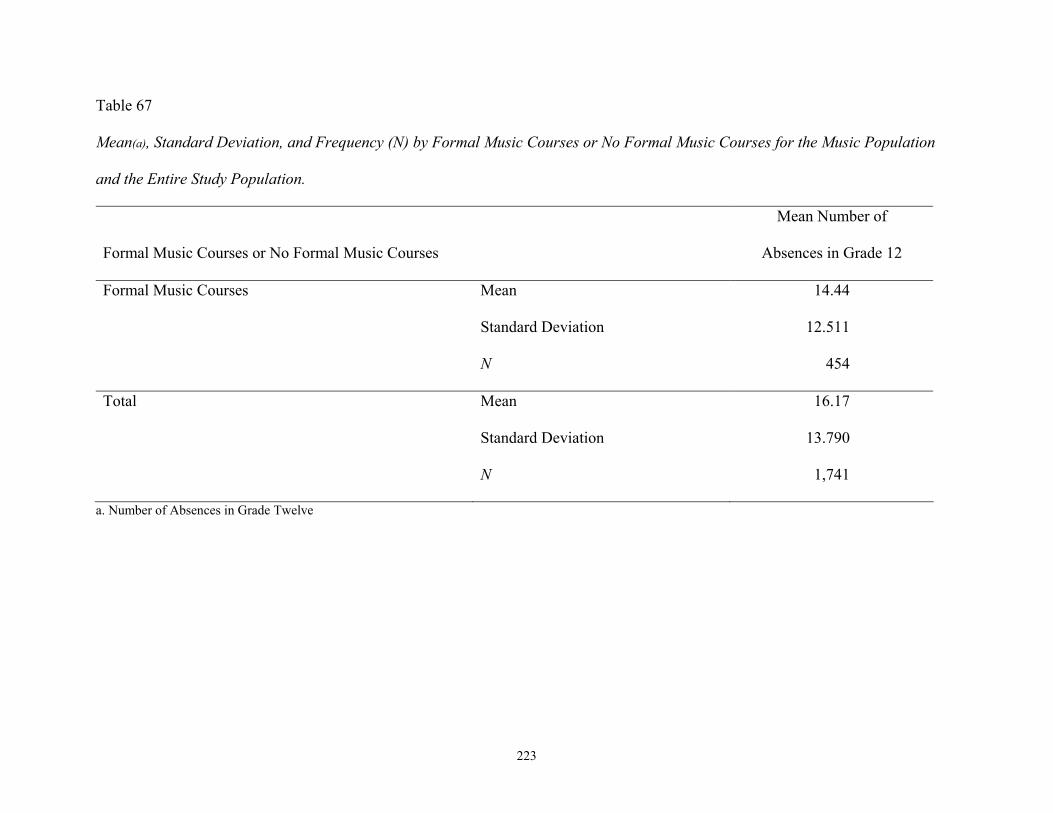
223
Table 67
Mean(a), Standard Deviation, and Frequency (N) by Formal Music Courses or No Formal Music Courses for the Music Population
and the Entire Study Population.
Formal Music Courses or No Formal Music Courses
Mean Number of
Absences in Grade 12
Formal Music Courses Mean 14.44
Standard Deviation 12.511
N 454
Total Mean 16.17
Standard Deviation 13.790
N 1,741
a. Number of Absences in Grade Twelve

224
Table 68
Number of Absences in Grade Twelve Correlations for the Music Population.
Subject and
Number of
Years
Gender
Ethnicity
Formal Music
or No Formal
Music
Number of
Absences in
Grade 12
Subject and Number of Years Pearson Correlation
Sig. (2-tailed)
N
1
454
.139**
.003
454
.070
.135
454
.a
-
454
-.134**
.004
454
Gender Pearson Correlation
Sig. (2-tailed)
N
.139**
.003
454
1
454
.067
.155
454
.a
-
454
-.015
.755
454
Ethnicity Pearson Correlation
Sig. (2-tailed)
N
.070
.135
454
.067
.155
454
1
454
.a
-
454
.030
.529
454
Formal Music or No Formal
Music
Pearson Correlation
Sig. (2-tailed)
N
.a
-
454
.a
-
454
.a
-
454
.a
-
454
.a
-
454
Number of Absences in
Grade 12
Pearson Correlation
Sig. (2-tailed)
N
-.134**
.004
454
-.015
.755
454
.030
.529
454
.a
-
454
1
454 *. Correlation is significant at the 0.05 level (2-tailed). **. Correlation is significant at the 0.01 level (2-tailed). a. Cannot be computed because at least one of the variables is constant.

225
Table 69
Model Summary(b) for the Music Population.
Change Statistics
R
R
Square
Adjusted
R
Square
Std. Error
of the
Estimate
R Square
Change
F
Change
df1
df2
Sig. F
Change
.104a .020 .013 12.430 .020 2.985 3 450 .031
a. Predictors: (Constant), Subject and Number of Years Enrolled in Music or No Music (Grades 9-12), Gender, and Ethnicity.
b. Dependent Variable: Number of Absences in Grade Twelve.
Table 70 presents the analysis of variance (ANOVA) for the independent variables
subject and number of years enrolled in formal music courses or no formal music courses,
gender, and ethnicity and the dependent variable number of absences in grade twelve for the
music population. Once more, since the independent variable formal music courses or no formal
music courses has missing correlations, it has been deleted from the analysis.
Table 71 presents coefficients for the independent variables subject and number of years
enrolled in formal music courses or no formal music courses, gender, and ethnicity and the
dependent variable number of absences in grade twelve for the music population. Since the
independent variable formal music courses or no formal music courses has missing correlations,
it has been deleted from the analysis.
Subsequent regression statistics are presented for the dependent variable number of
absences in grade twelve for the music population (N = 454).

226
Table 70
Analysis of Variance (ANOVA)[b] for the Music Population.
Sum of Squares df Mean Square F Sig.
Regression 1383.422 3 461.141 2.985 .031a
Residual 69526.701 450 154.504
Total 70910.123 453
a. Predictors: (Constant), Subject and Number of Years Enrolled in Music or No Music (Grades 9-12), Gender, and Ethnicity. b. Dependent Variable: Number of Absences in Grade Twelve.
Table 71
Coefficients for the Music Population.
Unstandardized
Coefficients
Standardized
Coefficients
95% Confidence Interval for B
B Std. Error Beta t
Sig. Lower Bound Upper Bound
(Constant) 16.584 2.062 8.042 .000 12.531 20.637
Subject and Number of Years
Enrolled in Music or No Music -.557 .192 -.137
-2.902 .004 -.934 -.180
Gender .046 1.207 .002 .038 .969 -2.327 2.419
Ethnicity .253 .303 .039 .835 .404 -.342 .848
a. Dependent Variable: Number of Absences in Grade Twelve.

227
The mean predicted value is 14.44 and the standard deviation is 1.748. The mean
standardized predicted value is .000 and the standard deviation is 1.000. The mean standard error
of the predicted value is 1.153 and the standard deviation is .177. The mean adjusted predicted
value is 14.44 and the standard deviation is 1.751. The mean residual is .000 and the standard
deviation is 12.389. The mean standardized residual is .000 and the standard deviation is .997.
The mean studentized residual is .000 and the standard deviation is 1.001. The mean deleted
residual is .002 and the standard deviation is 12.497. Finally, the mean studentized deleted
residual is .002 and the standard deviation is 1.007.
Table 72 presents residual statistics for the dependent variable number of absences in
grade twelve for the music population (N = 454).
Table 72
Residual Statistics for the Music Population.
Minimum Maximum Mean Std. Deviation N
Predicted Value 10.20 17.64 14.44 1.748 454
Std. Predicted Value -2.431 1.827 .000 1.000 454
Standard Error of Predicted Value .751 1.673 1.153 .177 454
Adjusted Predicted Value 10.07 17.50 14.44 1.751 454
Residual -16.270 69.958 .000 12.389 454
Std. Residual -1.309 5.628 .000 .997 454
Stud. Residual -1.315 5.651 .000 1.001 454
Deleted Residual -16.433 70.519 .002 12.497 454
Stud. Deleted Residual -1.317 5.856 .002 1.007 454
a. Dependent Variable: Number of Absences in Grade Twelve.

228
Regression scatter plots for the dependent variable number of absences in grade twelve
for the music population are presented in Appendix L.
Non Music Population
In comparison to the entire study population of 1,741 (N = 1,741) and the music
population of 454 (N = 454), there are 1,287 non music students or 73.9% of the total population.
As indicated, the mean number of absences in grade twelve for the entire study population is
16.17 with a 13.790 standard deviation. However, the mean number of absences in grade twelve
for the non music population (N = 1,287) is 16.78 with a 14.168 standard deviation.
Since all participants in the non music population are not enrolled in a music course, the
independent variable subject and number of years enrolled in formal music courses or no formal
music courses is moot. Therefore, the categories within the independent variable subject and
number of years enrolled in formal music courses or no formal music courses are restricted to the
category VMusic-0; IMusic-0 or no vocal or instrumental music courses and have been omitted
from analysis.
Nonetheless, Table 73 presents frequency (N), mean number of absences in grade twelve,
and standard deviation for the category VMusic-0; IMusic-0 for the independent variable subject
and number of years enrolled in formal music courses or no formal music courses for the non
music population.
In contrast to the total study population and the music population, the lowest number of
absences in grade twelve among the independent variable gender for the non music population is
reported among males with a mean number of absences in grade twelve of 15.54 and a 13.331
standard deviation. Therefore, female music students have the highest mean number of absences
in grade twelve with a mean number of absences in grade twelve of 17.98 and a 14.850 standard
deviation.

229
Table 73
Frequency (N), Mean(a) and Standard Deviation by Subject and Number of Years Enrolled in
Formal Music Courses or No Formal Music Courses for the Non Music Population.
Subject and Number of Years Enrolled in
Formal Music Courses or No Formal Music Courses
Number of Absences
in Grade 12
VMusic-0; IMusic-0 Mean
Standard Deviation
N
16.78
14.168
1,287
Total Population Mean
Standard Deviation
N
16.17
13.790
1,741
a. Number of Absences in Grade 12
Table 74 presents mean, standard deviation, and frequency (N) for the dependent variable
number of absences in grade twelve and the independent variable gender for the non music
population.
The lowest mean number of absences in grade twelve among the independent variable
ethnicity for the non music population is reported among African Americans with a mean
number of absences in grade twelve of 16.54 and a 14.322 standard deviation.
In opposition, the highest mean number of absences in grade twelve among the
independent variable ethnicity for the non music population is reported among Native
Americans/Alaskan Natives with a mean number of absences in grade twelve of 23.92 and a
13.551 standard deviation.

230
Table 74
Mean(a), Standard Deviation, and Frequency (N) by Gender for the Non Music Population.
Gender Number of Absences in Grade 12
Female Mean 17.98
Std. Deviation 14.850
N 652
Male Mean 15.54
Std. Deviation 13.331
N 635
Total Mean 16.78
Std. Deviation 14.168
N 1,287
a. Number of Absences in Grade 12
Table 75 presents mean, standard deviation, and frequency (N ) for the dependent
variable number of absences in grade twelve and the independent variable ethnicity for the non
music population.
In view of the fact that all participants in the non music population are not enrolled in a
music course, the independent variable formal music courses or no formal music courses is moot
and has been omitted from analysis.
Nonetheless, Table 76 presents mean, standard deviation, and frequency (N ) for the
dependent variable number of absences in grade twelve and the independent variable formal
music courses or no formal music courses for the non music population and the entire study
population.

231
Table 75
Mean(a), Standard Deviation, and Frequency (N) by Ethnicity for the Non Music Population.
Ethnicity Number of Absences in Grade 12
African American
Mean
Std. Deviation
N
16.54
14.322
703
Asian/Pacific Islander Mean
Std. Deviation
N
17.61
16.774
49
Hispanic Mean
Std. Deviation
N
17.42
13.184
65
Native American/Alaskan Native Mean
Std. Deviation
N
23.92
18.706
12

232
White Mean
Std. Deviation
N
16.73
13.51
457
Unspecified Mean
Std. Deviation
N
23.50
22.767
4
Total Mean
Std. Deviation
N
16.78
14.168
1,287
a. Number of Absences in Grade 12

233
Table 76
Mean(a), Standard Deviation, and Frequency (N) by Formal Music Courses or No Formal Music
Courses for the Non Music Population and the Entire Study Population.
Formal Music Courses or
No Formal Music Courses
Number of Absences in
Grade 12
No Formal Music Courses Mean 16.78
Standard Deviation 14.168
N 1,287
Total Population Mean 16.17
Standard Deviation 13.790
N 1,741
a. Number of Absences in Grade 12
There are several statistically significant correlations among the independent variables
and the dependent variable number of absences in grade twelve at the 0.05 (2-tailed) and the 0.01
(2-tailed) levels for the non music population.
Table 77 presents correlations for all independent variables and the dependent variable
number of absences in grade twelve for the non music population. Statistical significance at the
0.05 level is indicated with one asterisk (*) and statistical significance at the 0.01 level is
indicated with two asterisks (**).
Since all students in this population are not enrolled in a music course, the independent
variable subject and number of years enrolled in formal music courses or no formal music
courses and the independent variable formal music courses or no formal music courses are
constant. Therefore, several correlations cannot be computed and are indicated accordingly.
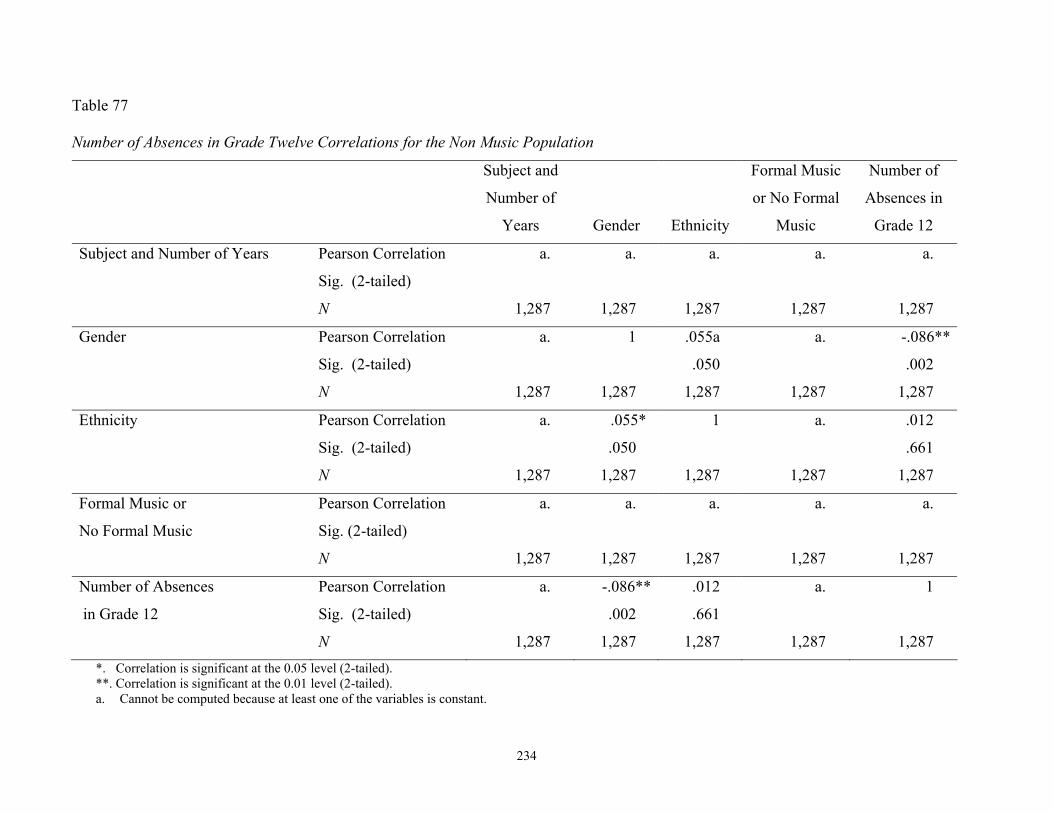
234
Table 77
Number of Absences in Grade Twelve Correlations for the Non Music Population
Subject and
Number of
Years
Gender
Ethnicity
Formal Music
or No Formal
Music
Number of
Absences in
Grade 12
Subject and Number of Years Pearson Correlation
Sig. (2-tailed)
N
a.
1,287
a.
1,287
a.
1,287
a.
1,287
a.
1,287
Gender Pearson Correlation
Sig. (2-tailed)
N
a.
1,287
1
1,287
.055a
.050
1,287
a.
1,287
-.086**
.002
1,287
Ethnicity Pearson Correlation
Sig. (2-tailed)
N
a.
1,287
.055*
.050
1,287
1
1,287
a.
1,287
.012
.661
1,287
Formal Music or
No Formal Music
Pearson Correlation
Sig. (2-tailed)
N
a.
1,287
a.
1,287
a.
1,287
a.
1,287
a.
1,287
Number of Absences
in Grade 12
Pearson Correlation
Sig. (2-tailed)
N
a.
1,287
-.086**
.002
1,287
.012
.661
1,287
a.
1,287
1
1,287 *. Correlation is significant at the 0.05 level (2-tailed). **. Correlation is significant at the 0.01 level (2-tailed). a. Cannot be computed because at least one of the variables is constant.

235
Table 78 presents the model summary for the independent variables gender and ethnicity
and the dependent variable grade twelve weighted cumulative grade point average for the non
music population. The independent variable subject and number of years enrolled in formal
music courses or no formal music courses and the independent variable formal music courses or
no formal music courses are constants or have missing correlations. Therefore, they have been
deleted from analysis.
Table 78
Model Summary (b) for the Non Music Population.
Change Statistics
R
R
Square
Adjusted
R
Square
Std. Error
of the
Estimate
R Square
Change
F
Change
df1
df2
Sig.
F Change
.088a .008 .006 14.124 .008 4.986 2 1,284 .007
a. Predictors: (Constant), Gender and Ethnicity. b. Dependent Variable: Number of Absences in Grade Twelve.
Table 79 presents the analysis of variance (ANOVA) for the independent variables
gender and ethnicity and the dependent variable number of absences in grade twelve for the non
music population. Again, since the independent variable subject and number of years enrolled in
formal music courses or no formal music courses and the independent variable formal music
courses or no formal music courses are constants or have missing correlations, they are deleted
from analysis.

236
Table 79
Analysis of Variance (ANOVA)[b] for the Non Music Population.
Sum of Squares df Mean Square F Sig.
Regression 1989.491 2 994.745 4.986 .007a
Residual 256151.84 1,284 199.495
Total 258141.33 1,286
a. Predictors: (Constant), Gender and Ethnicity. b. Dependent Variable: Number of Absences in Grade Twelve.
Table 80 presents coefficients for the independent variables gender and ethnicity and the
dependent variable number of absences in grade twelve for the non music population. Once
again, since the independent variable subject and number of years enrolled in formal music
courses or no formal music courses and the independent variable formal music courses or no
formal music courses are constants or have missing correlations, they are deleted from analysis.
For the non music population’s independent variables and the dependent variable number
of absences in grade twelve, the mean predicted value is 16.78 and the standard deviation is
1.244. The mean standardized predicted value is .000 and the standard deviation is 1.000. The
mean standard error of the predicted value is .679 and the standard deviation is .061. The mean
adjusted predicted value is 16.78 and the standard deviation is 1.244. The mean residual is
.00000 and the standard deviation is .64728. The mean standard residual is .000 and the standard
deviation is 14.113. The mean studentized residual is .000 and the standard deviation is .999. The
mean deleted residual is .000 and the standard deviation is 1.000. Finally, the mean studentized
deleted residual is .000 and the standard deviation is 14.146.

237
Table 80
Coefficients for the Non Music Population.
Unstandardized
Coefficients
Standardized
Coefficients
95% Confidence
Interval for B
B
Std.
Error
Beta t
Sig.
Lower
Bound
Upper
Bound
(Constant) 20.129 1.330 15.129 .000 17.519 22.739
Gender -2.466 .789 -.087 -3.127 .002 -4.013 -.919
Ethnicity .128 .210 .017 .611 .541 -.284 .541
a. Dependent Variable: Number of Absences in Grade Twelve.
Table 81 presents residual statistics for the dependent variable number of absences in
grade twelve for the non music population (N = 1,287).
Regression scatter plots for the dependent variable number of absences in grade twelve
for the non music population are presented in Appendix M.
Number of Discipline Referrals in Grade Nine through Grade Twelve
As indicated, the mean number of discipline referrals in grade nine through grade twelve
for the entire study population is 3.46 and the standard deviation is 6.537. Data indicate the mean
number of discipline referrals in grade nine through grade twelve for the music population is
2.00 with a 4.143 standard deviation. Conversely, the mean number of discipline referrals in
grade nine through grade twelve for the non music population is 3.98 with a 7.124 standard
deviation.

238
Table 81
Residual Statistics(a) for the Non Music Population.
Minimum
Maximum
Mean
Std.
Deviation
N
Predicted Value 15.32 18.43 16.78 1.244 1,287
Std. Predicted Value -1.170 1.330 .000 1.000 1,287
Standard Error of Predicted Value .563 .921 .679 .061 1,287
Adjusted Predicted Value 15.16 18.36 16.78 1.244 1,287
Residual -18.305 72.675 .000 14.113 1,287
Std. Residual -1.296 5.145 .000 .999 1,287
Stud. Residual -1.298 5.151 .000 1.000 1,287
Deleted Residual -18.358 72.837 .000 14.146 1,287
Stud. Deleted Residual -1.298 5.203 .001 1.002 1,287
a. Dependent Variable: Number of Absences in Grade Twelve.
Table 82 presents frequency (N), mean number of discipline referrals in grade nine
through grade twelve, and standard deviation for the entire population, the music population, and
the non music population.
Entire Study Population
As indicated, the mean number of discipline referrals in grade nine through grade twelve
for the entire population is 3.46 and the standard deviation is 6.537. However, the lowest mean
number of discipline referrals in grade nine through grade twelve among the entire study
population for the independent variable subject and number of years enrolled in formal music

239
Table 82
Frequency (N), Mean(a) and Standard Deviation for All Populations.
Population
Frequency
(N)
Mean
Standard
Deviation
Music Population 454 2.00 4.143
Non Music Population 1,287 3.98 7.124
Total Population 1,741 3.46 6.537
a. Number of Discipline Referrals in Grade 9 – 12.
courses or no formal music courses is reported in the category VIMusic-4 or a combination of
vocal and instrumental music for four years with a mean number of discipline referrals in grade
nine through grade twelve of .71 and the standard deviation is 1.160.
In opposition, the highest mean number of discipline referrals in grade nine through grade
twelve among the entire study population for the independent variable subject and number of
years enrolled in formal music courses or no formal music courses is reported in the category
VIMusic-2 or a combination of vocal and instrumental music for two years with a mean number
of discipline referrals in grade nine through grade twelve of 4.90 and a 9.362 standard deviation.
Figure 14 presents a line graph of the estimated marginal mean number of discipline
referrals in grade nine through grade twelve for all study participants who have participated in
formal music courses from one to four years or no formal music courses.
Table 83 presents mean, standard deviation, and frequency (N ) for the dependent
variable number of discipline referrals in grade nine through grade twelve among the

240
Figure 14. Estimated Marginal Mean Number of Discipline Referrals in Grade Nine through
Grade Twelve by Number of Years Enrolled in Formal Music Courses or No Formal
Music Courses for the Entire Study Population.
independent variable subject and number of years enrolled in formal music courses or no formal
music courses in grade nine through grade twelve for the entire study population.
Among both males and females in the entire study population, the mean number of
discipline referrals is 3.46 and the standard deviation is 6.537. However, the lowest mean
number of discipline referrals in grade nine through grade twelve among the independent
variable gender for the entire study population is reported among females with a mean number of
discipline referrals in grade nine through grade twelve of 3.06 and a 6.097 standard deviation.
Therefore, the highest mean number of discipline referrals in grade nine through grade twelve
Number of years in music4.003.002.001.00.00
Estim
ated
Mar
gina
l Mea
ns4
3.5
3
2.5
2
1.5
1

241
Table 83
Mean(a), Standard Deviation, and Frequency (N) by Subject and Number of Years Enrolled in Formal Music Courses or No Formal
Music Courses for the Entire Study Population.
Subject and Number of Years Enrolled
in Music or No Music
Discipline Referrals in
Grade 9 through Grade 12
VMusic-1 Mean 2.19
Std. Deviation 4.896
N 78
VMusic-2 Mean 2.03
Std. Deviation 3.908
N 30
VMusic-3 Mean 2.86
Std. Deviation 4.872
N 42
VMusic-4 Mean 1.50
Std. Deviation .707
N 2

242
IMusic-1 Mean 2.50
Std. Deviation 4.705
N 88
IMusic-2 Mean 1.69
Std. Deviation 3.766
N 51
IMusic-3 Mean 1.13
Std. Deviation 1.879
N 83
IMusic-4 Mean 1.17
Std. Deviation 1.965
N 29
VIMusic-1 Mean 1.00
Std. Deviation 1.414
N 2

243
VIMusic-2 Mean 4.90
Std. Deviation 9.362
N 10
VIMusic-3 Mean 3.40
Std. Deviation 5.068
N 15
VIMusic-4 Mean .71
Std. Deviation 1.160
N 24
VMusic-0; IMusic-0 Mean 3.98
Std. Deviation 7.124
N 1,287
Total Mean 3.46
Std. Deviation 6.537
N 1,741
a. Number of Discipline Referrals in Grade 9 - 12

244
among the independent variable gender for the entire study population is reported among males
with a mean number of discipline referrals in grade nine through grade twelve of 3.93 and a
6.980 standard deviation.
Table 84 presents mean, standard deviation, and frequency (N ) for the dependent
variable number of discipline referrals in grade nine through grade twelve for the independent
variable gender among the entire study population.
Table 84
Mean(a), Standard Deviation, and Frequency (N) by Gender for the Entire Study Population.
Gender
Discipline Referrals in
Grade 9 through Grade 12
Female Mean 3.06
Std. Deviation 6.097
N 927
Male Mean 3.93
Std. Deviation 6.980
N 814
Total Mean 3.46
Std. Deviation 6.537
N 1,741
a. Number of Discipline Referrals in Grade 9 - 12
The lowest mean number of discipline referrals in grade nine through grade twelve
among the independent variable ethnicity for the entire study population is reported among the

245
unspecified ethnic group with a mean number of discipline referrals in grade nine through grade
twelve of 1.40 and a 1.673 standard deviation.
In opposition, the highest mean number of discipline referrals in grade nine through grade
twelve among the independent variable ethnicity for the entire study population is reported
among African Americans with a mean number of discipline referrals in grade nine through
grade twelve of 4.94 and a 7.970 standard deviation.
Table 85 presents mean, standard deviation, and frequency (N ) for the dependent
variable number of discipline referrals in grade nine through grade twelve and the independent
variable ethnicity for the entire study population.
The lowest mean number of discipline referrals in grade nine through grade twelve for
the independent variable formal music courses or no formal music courses for the entire study
population is reported among students in formal music courses with a mean number of discipline
referrals in grade nine through grade twelve of 2.00 and a 4.143 standard deviation.
Therefore, the highest mean number of discipline referrals in grade nine through grade
twelve among the independent variable formal music courses or no formal music courses for the
entire study population is reported among students in no formal music courses with a mean
number of discipline referrals in grade nine through grade twelve with a mean number of
discipline referrals in grade nine through grade twelve of 3.98 and a 7.124 standard deviation.
Table 86 presents mean, standard deviation, and frequency (N ) for the dependent
variable number of discipline referrals in grade nine through grade twelve among the
independent variable formal music courses or no formal music courses for the entire study
population.

246
Table 85
Mean(a), Standard Deviation, and Frequency (N) by Ethnicity for the Entire Study Population.
Ethnicity
Number of Discipline Referrals
in Grade 9 through Grade 12
African American
Mean
Std. Deviation
N
4.94
7.970
916
Asian/Pacific Islander Mean
Std. Deviation
N
2.32
5.475
65
Hispanic Mean
Std. Deviation
N
3.68
5.790
79
Native American/Alaskan Native Mean
Std. Deviation
N
4.07
6.006
14
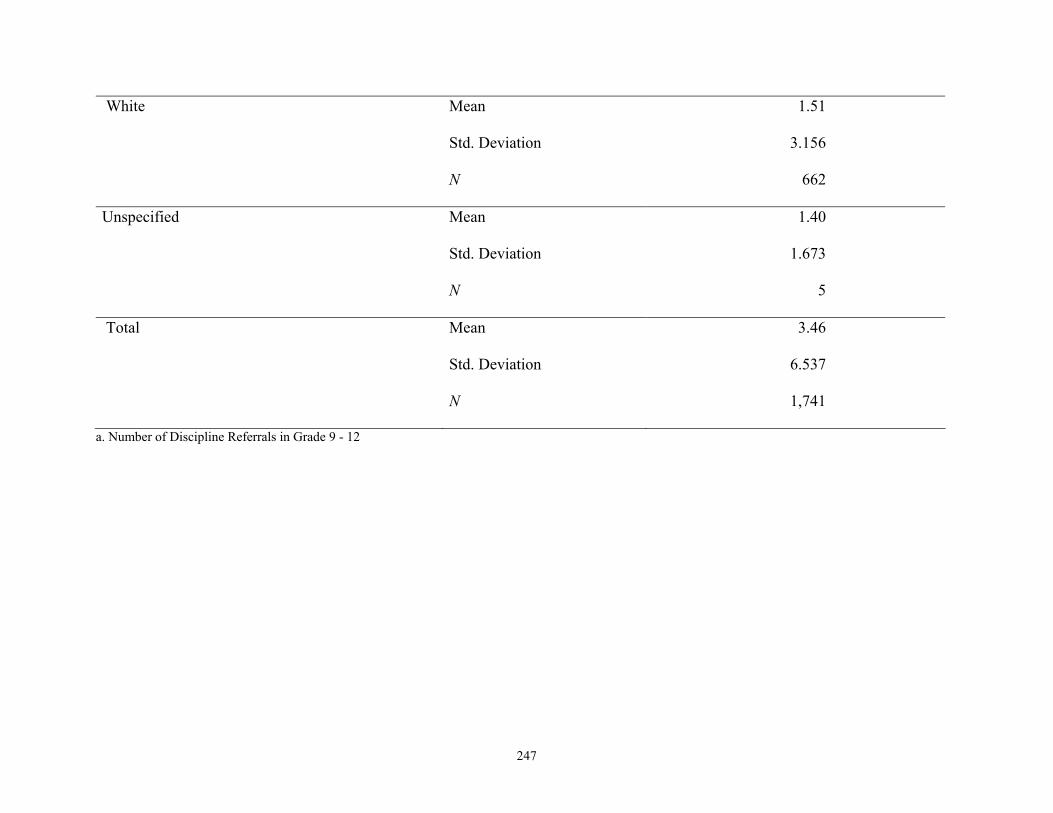
247
White Mean
Std. Deviation
N
1.51
3.156
662
Unspecified Mean
Std. Deviation
N
1.40
1.673
5
Total Mean
Std. Deviation
N
3.46
6.537
1,741
a. Number of Discipline Referrals in Grade 9 - 12

248
Table 86
Mean(a), Standard Deviation, and Frequency (N) by Formal Music Courses or No Formal Music
Courses for the Entire Study Population.
Formal Music Courses or
No Formal Music Courses
Discipline Referrals
in Grade 9 through Grade 12
Formal Music Courses Mean 2.00
Standard Deviation 4.143
N 454
No Formal Music Courses Mean 3.98
Standard Deviation 7.124
N 1,287
Total Mean 3.46
Standard Deviation 6.537
N 1,741
a. Number of Discipline Referrals in Grade 9 - 12
Figure 15 presents a line graph of the estimated marginal mean number of discipline
referrals in grade nine through grade twelve for all study participants by formal music courses or
no formal music courses.
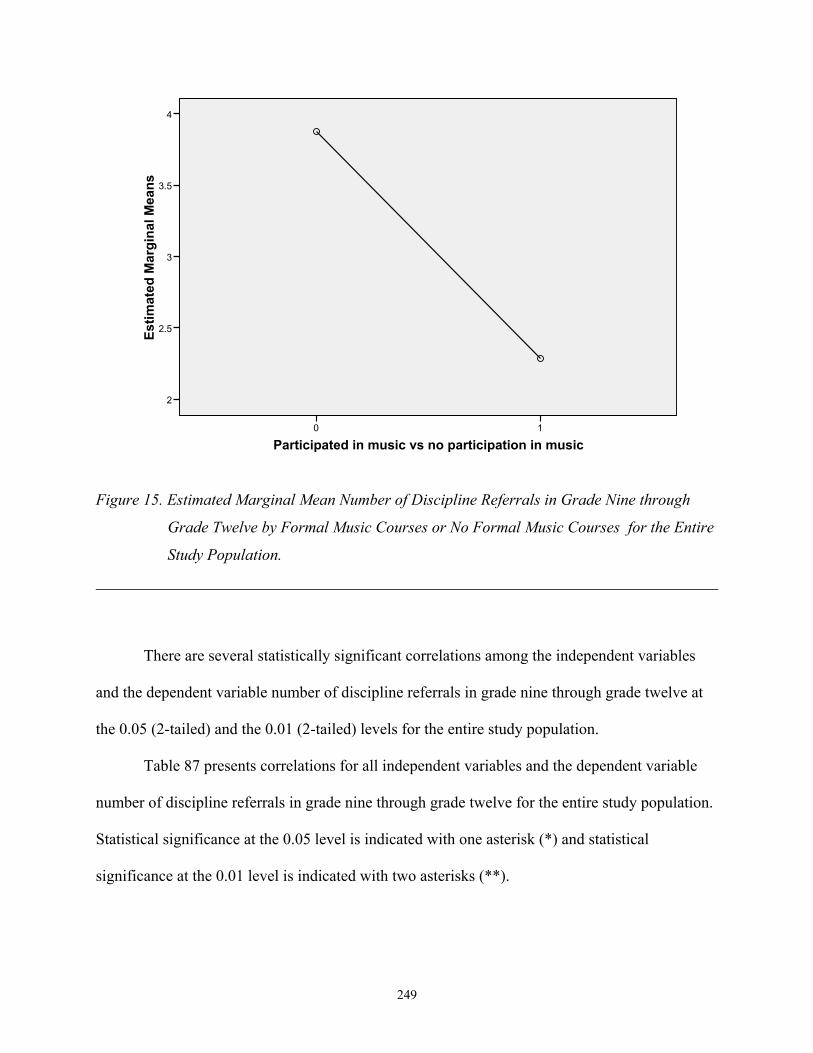
249
Figure 15. Estimated Marginal Mean Number of Discipline Referrals in Grade Nine through
Grade Twelve by Formal Music Courses or No Formal Music Courses for the Entire
Study Population.
There are several statistically significant correlations among the independent variables
and the dependent variable number of discipline referrals in grade nine through grade twelve at
the 0.05 (2-tailed) and the 0.01 (2-tailed) levels for the entire study population.
Table 87 presents correlations for all independent variables and the dependent variable
number of discipline referrals in grade nine through grade twelve for the entire study population.
Statistical significance at the 0.05 level is indicated with one asterisk (*) and statistical
significance at the 0.01 level is indicated with two asterisks (**).
Participated in music vs no participation in music10
Estim
ated
Mar
gina
l Mea
ns
4
3.5
3
2.5
2
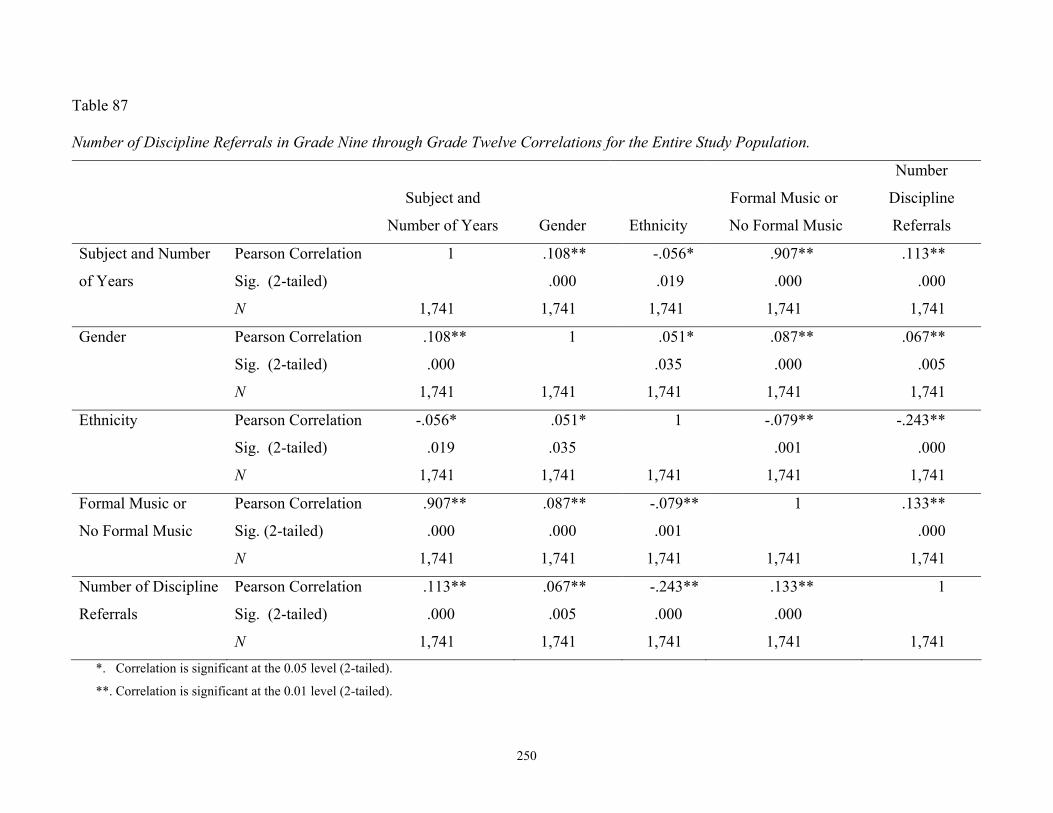
250
Table 87
Number of Discipline Referrals in Grade Nine through Grade Twelve Correlations for the Entire Study Population.
Subject and
Number of Years
Gender
Ethnicity
Formal Music or
No Formal Music
Number
Discipline
Referrals
Subject and Number
of Years
Pearson Correlation
Sig. (2-tailed)
N
1
1,741
.108**
.000
1,741
-.056*
.019
1,741
.907**
.000
1,741
.113**
.000
1,741
Gender Pearson Correlation
Sig. (2-tailed)
N
.108**
.000
1,741
1
1,741
.051*
.035
1,741
.087**
.000
1,741
.067**
.005
1,741
Ethnicity Pearson Correlation
Sig. (2-tailed)
N
-.056*
.019
1,741
.051*
.035
1,741
1
1,741
-.079**
.001
1,741
-.243**
.000
1,741
Formal Music or
No Formal Music
Pearson Correlation
Sig. (2-tailed)
N
.907**
.000
1,741
.087**
.000
1,741
-.079**
.001
1,741
1
1,741
.133**
.000
1,741
Number of Discipline
Referrals
Pearson Correlation
Sig. (2-tailed)
N
.113**
.000
1,741
.067**
.005
1,741
-.243**
.000
1,741
.133**
.000
1,741
1
1,741 *. Correlation is significant at the 0.05 level (2-tailed).
**. Correlation is significant at the 0.01 level (2-tailed).

251
Table 88 presents the results of univariate analysis of variance tests of between-subjects
effects for the dependent variable number of discipline referrals in grade nine through grade
twelve for the entire study population.
Table 88
Univariate Analysis of Variance Tests of Between-Subjects Effects for Number of Discipline
Referrals in Grade Nine through Grade Twelve for the Entire Study Population.
Source
Type III
Sum of Squares
df
Mean Square
F
Sig.
Corrected Model 5932.890a 6 988.815 25.057 .000
Intercept 7120.942 1 7120.942 180.449 .000
Gender 2 350.323 1 350.323 8.877 .003
Ethnicity 2 4318.359 1 4318.359 109.430 .000
Subject and Number of
Years in Music 920.383 4 230.096
5.831 .000
Error 68427.895 1,734 39.462
Total 95232.000 1,741
Corrected Total 74360.786 1,740
a. R Squared = .080 (Adjusted R Squared = .077)
Table 89 presents the model summary for all independent variables and the dependent
variable number of discipline referrals in grade nine through twelve after controlling for gender
and ethnicity for the entire study population.
Table 90 presents the analysis of variance (ANOVA) for the independent variables and
the dependent variable number of discipline referrals in grade nine through twelve after
controlling for gender and ethnicity for the entire study population.

252
Table 89
Model Summary(c) for the Entire Study Population.
Change Statistics
Model
R
R
Square
Adjusted
R Square
Std. Error of
the Estimate
R Square
Change
F Change
df1
df2
Sig.
F Change
1 .260a .067 .066 6.317 .067 62.811 2 1,738 .000
2 .282b .080 .077 6.282 .012 5.831 4 1,734 .000
a. Predictors: (Constant), Recoded Ethnicity. Recoded Gender b. Predictors: (Constant), Recoded Ethnicity, Recoded Gender, Recoded music versus no music2, Recoded music versus no music4, Recoded music versus no
music3, Recoded music versus no music1 c. Number of Discipline Referrals in Grade 9 through Grade 12

253
Table 90
Analysis of Variance (ANOVA)[c] for the Entire Study Population.
Model
Sum of
Squares
df
Mean
Square
F
Sig.
1 Regression 5012.508 2 2506.254 62.811 .000a
Residual 69348.278 1,738 39.901
Total 74360.786 1,740
2 Regression 5932.890 6 988.815 25.057 .000b
Residual 68427.895 1,734 39.462
Total 74360.786 1,740
a. Predictors: (Constant), Recoded Ethnicity, Recoded Gender b. Predictors: (Constant), Recoded Ethnicity, Recoded Gender, Recoded music versus no music2, Recoded music
versus no music4, Recoded music versus music3, Recoded music versus no music1 c. Dependent Variable: Number of Discipline Referrals in Grade 9 – 12.
Table 91 presents coefficients for each of the independent variables and the dependent
variable number of discipline referrals in grade nine through twelve after controlling for gender
and ethnicity for the entire study population.
Table 92 presents a model summary of excluded variables for the dependent variable
number of discipline referrals in grade nine through grade twelve after controlling for gender and
ethnicity.
Subsequent regression statistics are presented for the dependent variable number of
discipline referrals in grade nine through grade twelve for the entire study population
(N = 1,741).

254
Table 91
Coefficients for the Entire Study Population.
Unstandardized
Coefficients
Standardized
Coefficients
Model B Std. Error Beta
t
Sig.
1 (Constant) 7.252 .379 19.160 .000
Recoded Gender -1.039 .304 -.079 -3.421 .001
Recoded Ethnicity -1.746 .161 -.251 -10.834 .000
2 (Constant) 7.482 .380 19.693 .000
Recoded Gender -.905 .304 -.069 -2.979 .003
Recoded Ethnicity -1.683 .161 -.242 -10.461 .000
Recoded Music versus No Music1 -1.246 .517 -.056 -2.408 .016
Recoded Music versus No Music2 -1.649 .682 -.056 -2.419 .016
Recoded Music versus No Music3 -1.583 .561 -.056 -2.820 .005
Recoded Music versus No Music4 -2.616 .867 -.070 -3.018 .003
a. Dependent Variable: Number of Discipline Referrals in Grade 9 – 12.
The mean predicted value is 3.46 and the standard deviation is 1.813. The mean
standardized predicted value is .000 and the standard deviation is 1.000. The mean standard error
of the predicted value is .323 and the standard deviation is .097. The mean adjusted predicted
value is 3.46 and the deviation is 6.295. Finally, the mean studentized deleted residual is .001
and the standard deviation is 1.005.

255
Table 92
Excluded Variables(b).
Collinearity
Statistics
Model
Beta
In
t
Sig.
Partial
Correlation Tolerance
1 Recoded music versus no music1 -.041a -1.753 .080 -.042 .995
Recoded music versus no music2 -.044a -1.907 .057 -.046 1.000
Recoded music versus no music3 -.052a -2.246 .025 -.054 .994
Recoded music versus no music4 -.060a -2.603 .009 -.062 .997
a. Predictors in the Model (Constant), Recoded Ethnicity, Recoded Gender b. Dependent Variable: Number of Discipline Referrals in Grade 9 – 12.
Table 93 presents residual statistics for the dependent variable number of discipline
referrals in grade nine through grade twelve for the entire study population (N = 1,741).
Regression scatter plots for the dependent variable number of discipline referrals in grade
nine through grade twelve for the entire study population are presented in Appendix N.
Music Population
As indicated, the mean number of discipline referrals in grade nine through grade twelve
for the music population is 2.00 and the standard deviation is 4.143. However, the lowest mean
number of discipline referrals in grade nine through grade twelve among the music population
for the independent variable subject and number of years enrolled in formal music courses or no
formal music courses is reported in the category VIMusic-4 or a combination of vocal and
instrumental music for four years with a mean number of discipline referrals in grade nine
through grade twelve of .71 and a 1.160 standard deviation.

256
Table 93
Residual Statistics for the Entire Study Population.
Minimum Maximum Mean Std. Deviation N
Predicted Value -.44 5.75 3.46 1.813 1,741
Std. Predicted Value -2.152 1.262 .000 1.000 1,741
Standard Error of Predicted Value .234 .747 .323 .097 1,741
Adjusted Predicted Value -.49 5.76 3.46 1.813 1,741
Residual -5.750 58.250 .000 6.281 1,741
Std. Residual -.914 9.263 .000 .999 1,741
Stud. Residual -.915 9.272 .000 1.000 1,741
Deleted Residual -5.760 58.358 .000 6.295 1,741
Stud. Deleted Residual -.915 9.508 .001 1.005 1,741
a. Dependent Variable: Number of Discipline Referrals in Grade Nine through Grade Twelve.
In opposition, the highest mean number of discipline referrals in grade nine through grade
twelve among the music population for the independent variable subject and number of years
enrolled in formal music courses or no formal music courses is reported in the category
VIMusic-2 or a combination of vocal and instrumental music for two years with a mean number
of discipline referrals in grade nine through grade twelve of 4.90 and a 9.362 standard deviation.
Table 94 presents mean, standard deviation, and frequency (N ) for the dependent
variable number of discipline referrals in grade nine through grade twelve among the categories
of the independent variable subject and number of years enrolled in formal music courses or no
formal music courses in grade nine through twelve for the music population.
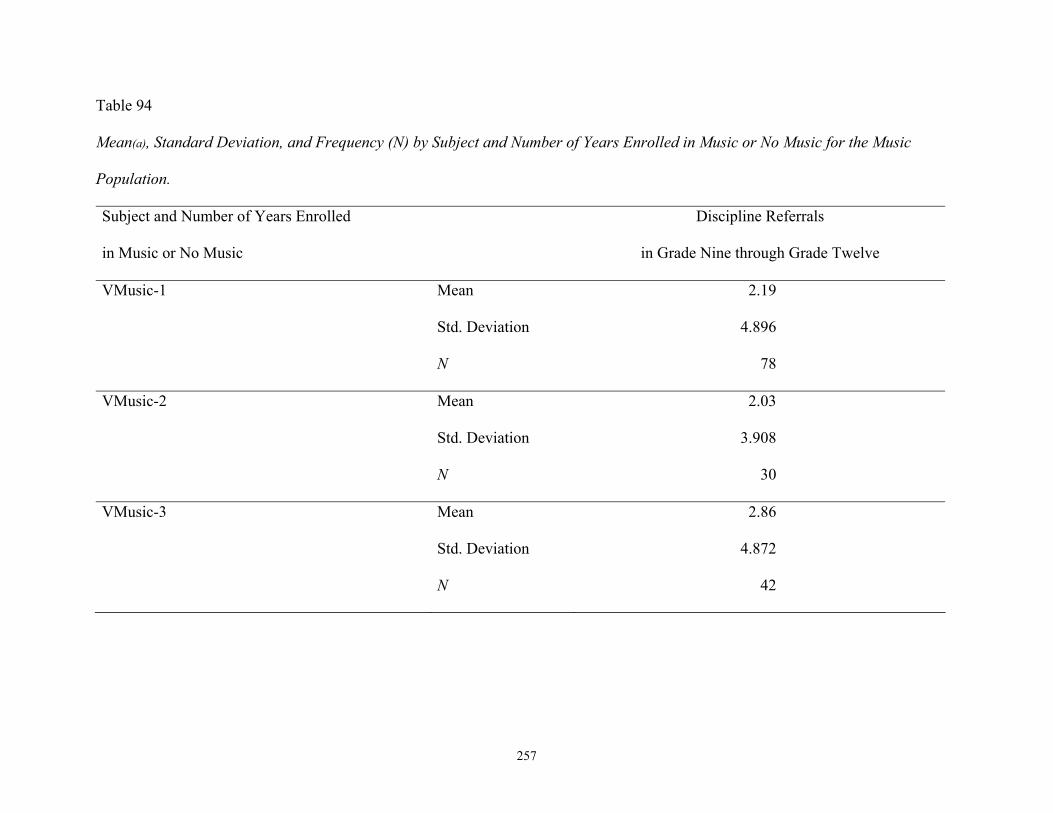
257
Table 94
Mean(a), Standard Deviation, and Frequency (N) by Subject and Number of Years Enrolled in Music or No Music for the Music
Population.
Subject and Number of Years Enrolled
in Music or No Music
Discipline Referrals
in Grade Nine through Grade Twelve
VMusic-1 Mean 2.19
Std. Deviation 4.896
N 78
VMusic-2 Mean 2.03
Std. Deviation 3.908
N 30
VMusic-3 Mean 2.86
Std. Deviation 4.872
N 42

258
VMusic-4 Mean 1.50
Std. Deviation .707
N 2
IMusic-1 Mean 2.50
Std. Deviation 4.705
N 88
IMusic-2 Mean 1.69
Std. Deviation 3.766
N 51
IMusic-3 Mean 1.13
Std. Deviation 1.879
N 83
IMusic-4 Mean 1.17
Std. Deviation 1.965
N 29

259
VIMusic-1 Mean 1.00
Std. Deviation 1.414
N 2
VIMusic-2 Mean 4.90
Std. Deviation 9.362
N 10
VIMusic-3 Mean 3.40
Std. Deviation 5.068
N 15
VIMusic-4 Mean .71
Std. Deviation 1.160
N 24
Total Mean 2.00
Std. Deviation 4.143
N 454
a. Number of Discipline Referrals in Grade 9 - 12
260
Among both males and females in the music population, the mean number of discipline
referrals is 2.00 and the standard deviation is 4.143. However, the lowest mean number of
discipline referrals in grade nine through grade twelve among the independent variable gender
for the music population is reported among females with a mean number of discipline referrals in
grade nine through grade twelve of 1.50 and a 3.113 standard deviation.
Therefore, the highest mean number of discipline referrals in grade nine through grade
twelve among the independent variable gender for the music population is reported among males
with a mean number of discipline referrals in grade nine through grade twelve of 2.77 and a
5.272 standard deviation.
Table 95 presents mean, standard deviation, and frequency (N ) for the dependent
variable number of discipline referrals in grade nine through grade twelve for the independent
variable gender among the music population.
The lowest mean number of discipline referrals in grade nine through grade twelve
among the independent variable ethnicity for the music population is reported among
Asian/Pacific Islanders with a mean number of discipline referrals in grade nine through grade
twelve of .63 and a 1.147 standard deviation.
In opposition, the highest mean number of discipline referrals in grade nine through grade
twelve among the independent variable ethnicity for the music population is reported among two
ethnic groups. Hispanics and Native Americans/Alaskan Natives share the highest mean number
of discipline referrals in grade nine through grade twelve among the music population with a
3.00 mean number of discipline referrals in grade nine through grade twelve for each ethnic
group. The standard deviation for the Hispanic population is 4.623 and the standard deviation for
the Native American/Alaskan Native population is 4.243.

261
Table 95
Mean(a), Standard Deviation, and Frequency (N) by Gender for the Music Population.
Gender
Discipline Referrals
in Grade Nine through Grade Twelve
Female Mean 1.50
Std. Deviation 3.113
N 275
Male Mean 2.77
Std. Deviation 5.272
N 179
Total Mean 2.00
Std. Deviation 4.143
N 454
a. Number of Discipline Referrals in Grade 9 - 12
Table 96 presents mean, standard deviation, and frequency (N ) for the dependent
variable number of discipline referrals in grade nine through grade twelve and the independent
variable ethnicity for the music population.
Since all participants in the music population are enrolled in a music course, the
independent variable formal music courses or no formal music courses is moot and has been
omitted from analysis.
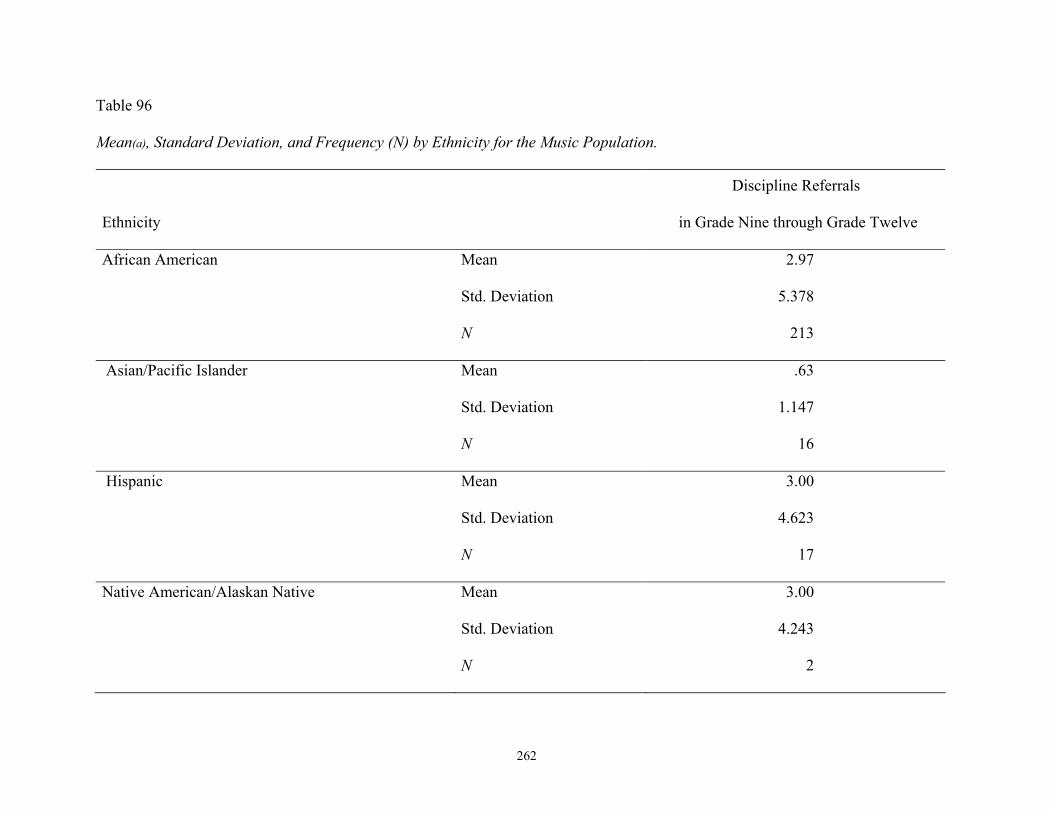
262
Table 96
Mean(a), Standard Deviation, and Frequency (N) by Ethnicity for the Music Population.
Ethnicity
Discipline Referrals
in Grade Nine through Grade Twelve
African American
Mean
Std. Deviation
N
2.97
5.378
213
Asian/Pacific Islander Mean
Std. Deviation
N
.63
1.147
16
Hispanic Mean
Std. Deviation
N
3.00
4.623
17
Native American/Alaskan Native Mean
Std. Deviation
N
3.00
4.243
2

263
White Mean
Std. Deviation
N
1.00
1.990
205
Unspecified Mean
Std. Deviation
N
4.00
-
1
Total Mean
Std. Deviation
N
2.00
4.143
454
a. Number of Discipline Referrals in Grade 9 - 12

264
Nonetheless, Table 97 presents mean, standard deviation, and frequency (N ) for the
dependent variable number of discipline referrals in grade nine through grade twelve and the
independent variable formal music courses or no formal music courses for the music population
and the entire study population.
Table 97
Mean(a), Standard Deviation, and Frequency (N) by Formal Music Courses or No Formal Music
Courses for the Music Population and the Entire Study Population.
Formal Music Courses or
No Formal Music Courses
Discipline Referrals
Formal Music Courses Mean 2.00
Standard Deviation 4.143
N 454
Total Population Mean 3.46
Standard Deviation 6.537
N 1,741
a. Number of Discipline Referrals in Grade 9 - 12
There are many statistically significant correlations among the independent variables and
the dependent variable number of discipline referrals in grade nine through grade twelve at the
0.05 (2-tailed) and 0.01 (2-tailed) levels for the music population.
Table 98 presents correlations for all independent variables and the dependent variable
number of discipline referrals in grade nine through grade twelve for the music population.
Statistical significance at the 0.05 level is indicated with one asterisk (*) and statistical
significance at the 0.01 level is indicated with two asterisks (**).

265
Table 98
Correlations(b) for the Music Population
Subject and
Number of Years
Gender
Ethnicity
Formal Music or
No Formal Music
Discipline
Referrals
Subject and Number
of Years
Pearson Correlation
Sig. (2-tailed)
N
1
454
.139**
.003
454
.070
.135
454
.a
-
454
-.055
.239
454
Gender Pearson Correlation
Sig. (2-tailed)
N
.139**
.003
454
1
454
.067
.155
454
.a
-
454
.149**
.001
454
Ethnicity Pearson Correlation
Sig. (2-tailed)
N
.070
.135
454
.067
.155
454
1
454
.a
-
454
-.218**
.000
454
Formal Music or
No Formal Music
Pearson Correlation
Sig. (2-tailed)
N
.a
-
454
.a
-
454
.a
-
454
.a
-
454
.a
-
454
Number of Discipline
Referrals
Pearson Correlation
Sig. (2-tailed)
N
-.055
.239
454
.149**
.001
454
-.218**
.000
454
.a
-
454
1
454 *. Correlation is significant at the 0.05 level (2-tailed). **. Correlation is significant at the 0.01 level (2-tailed). a. Cannot be computed because at least one of the variables is constant. b. Number of Discipline Referrals in Grade 9 - 12

266
Since all students in the music population are enrolled in a music course, the independent
variable formal music courses or no formal music courses has missing correlations. Therefore, it
has been deleted from analysis.
Table 99 presents the model summary for the independent variables subject and number
of years enrolled in formal music courses or no formal music courses, gender, and ethnicity and
the dependent variable number of discipline referrals in grade nine through grade twelve for the
music population. Once again, since the independent variable formal music courses or no formal
music courses is missing correlations, it has been deleted from analysis.
Table 99
Model Summary(b) for Subject and Number of Years Enrolled in Formal Music Courses or No
Formal Music Courses, Gender, and Ethnicity for the Music Population.
Change Statistics
R
R
Square
Adjusted
R
Square
Std. Error
of the
Estimate
R Square
Change
F
Change
df1
df2
Sig. F
Change
.280a .078 .072 3.991 .078 12.764 3 450 .000
a. Predictors: (Constant), Subject and Number of Years Enrolled in Music or No Music (Grades 9-12), Gender, and Ethnicity.
b. Dependent Variable: Number of Discipline Referrals in Grade Nine through Grade Twelve.
Table 100 presents the analysis of variance (ANOVA) for the independent variables
subject and number of years enrolled in formal music or no formal music, gender, and ethnicity
and the dependent variable number of discipline referrals in grade nine through grade twelve for
the music population. As presented in previous data, the independent variable formal music
courses or no formal music has been deleted from analysis.

267
Table 100
Analysis of Variance (ANOVA)[b] for Subject and Number of Years Enrolled in Formal Music
Courses or No Formal Music Courses, Gender, and Ethnicity for the Music Population.
Sum of
Squares
df
Mean
Square
F
Sig.
Regression 609.790 3 203.263 12.764 .000a
Residual 7166.210 450 15.925
Total 7776.000 453
a. Predictors: (Constant), Subject and Number of Years Enrolled in Music or No Music (Grades 9-12), Gender, and Ethnicity.
b. Dependent Variable: Number of Discipline Referrals in Grade Nine through Grade Twelve.
Table 101 presents coefficients for each of the independent variables subject and number
of years enrolled in formal music courses or no formal music courses, gender, and ethnicity and
the dependent variable number of discipline referrals in grade nine through grade twelve for the
music population.
Subsequent regression statistics are presented for the dependent variable number of
discipline referrals in grade nine through grade twelve for the music population (N = 454 ).
The mean predicted value is 2.00 and the standard deviation is 1.160. The mean
standardized predicted value is .000 and the standard deviation is 1.000. The mean standard error
of the predicted value is .370 and the standard deviation is .057. The mean adjusted predicted
value is 2.00 and the standard deviation is 1.161. The mean residual is .000 and the standard
deviation is 3.977. The mean standardized residual is .000 and the standard deviation is .997. The
mean studentized residual is .000 and the standard deviation is 1.002. The mean deleted residual
is .001 and the standard deviation is 4.016. Finally, the mean studentized deleted residual is .004
and the standard deviation is 1.024.
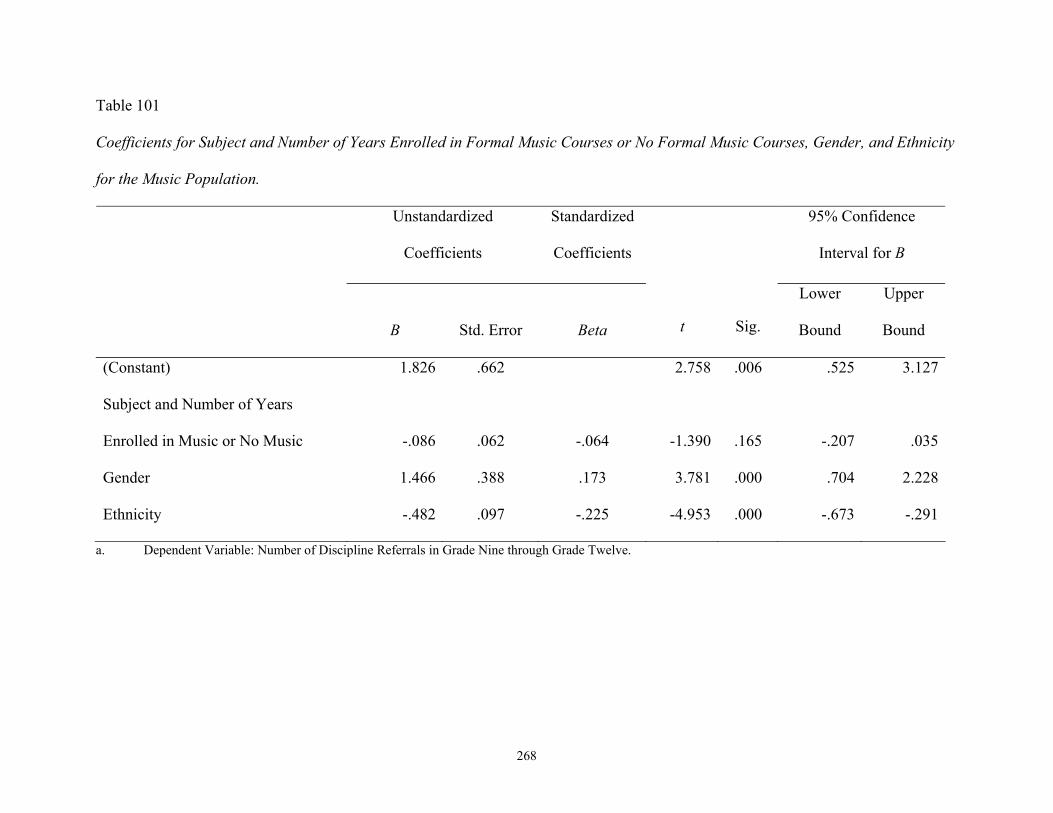
268
Table 101
Coefficients for Subject and Number of Years Enrolled in Formal Music Courses or No Formal Music Courses, Gender, and Ethnicity
for the Music Population.
Unstandardized
Coefficients
Standardized
Coefficients
95% Confidence
Interval for B
B
Std. Error
Beta
t
Sig.
Lower
Bound
Upper
Bound
(Constant) 1.826 .662 2.758 .006 .525 3.127
Subject and Number of Years
Enrolled in Music or No Music -.086
.062
-.064 -1.390
.165 -.207 .035
Gender 1.466 .388 .173 3.781 .000 .704 2.228
Ethnicity -.482 .097 -.225 -4.953 .000 -.673 -.291
a. Dependent Variable: Number of Discipline Referrals in Grade Nine through Grade Twelve.

269
Table 102 presents residual statistics for the dependent variable number of discipline referrals
in grade nine through grade twelve for the music population (N = 454).
Table 102
Residual Statistics for the Music Population.
Minimum
Maximum
Mean
Std.
Deviation
N
Predicted Value -.14 4.19 2.00 1.160 454
Std. Predicted Value -1.849 1.888 .000 1.000 454
Standard Error of Predicted Value .241 .537 .370 .057 454
Adjusted Predicted Value -.20 4.25 2.00 1.161 454
Residual -4.190 27.581 .000 3.977 454
Std. Residual -1.050 6.911 .000 .997 454
Stud. Residual -1.057 6.956 .000 1.002 454
Deleted Residual -4.247 27.938 .001 4.016 454
Stud. Deleted Residual -1.057 7.355 .004 1.024 454
a. Dependent Variable: Number of Discipline Referrals in Grade Nine through Grade Twelve.
Regression scatter plots for the dependent variable number of discipline referrals in grade nine
through grade twelve for the music population are presented in Appendix O.
Non Music Population
As indicated, the mean number of discipline referrals in grade nine through grade twelve for
the entire study population is 3.46 and the standard deviation is 6.537. However, the mean number of
discipline referrals in grade nine through grade twelve for the non music population is 3.98 and the
standard deviation is 7.124.

270
Again, since all participants in the non music population are not enrolled in a music course,
the independent variable subject and number of years enrolled in formal music courses or no formal
music courses is moot. Therefore, the categories within the independent variable subject and number
of years enrolled in formal music courses or no formal music courses are restricted to the category
VMusic-0; IMusic-0 or no vocal or instrumental music courses and have been omitted from analysis.
Nonetheless, Table 103 presents mean number of discipline referrals in grade nine through
grade twelve, standard deviation, and frequency (N) for the category VMusic-0; IMusic-0 for the
independent variable subject and number of years enrolled in formal music courses or no formal
music courses for the non music population.
Table 103
Mean(a), Standard Deviation, and Frequency (N) for the Non Music Population and the Entire Study
Population.
Subject and Number of Years Enrolled
in Music or No Music
Discipline Referrals
VMusic-0; IMusic-0 Mean 3.98
Std. Deviation 7.124
N 1,287
Total Population Mean 3.46
Std. Deviation 6.537
N 1,741
a. Number of Discipline Referrals in Grade 9 - 12
For both males and females in the non music population, the mean number of discipline
referrals is 3.98 and the standard deviation is 7.124. However, similar to the music population, the

271
lowest mean number of discipline referrals in grade nine through grade twelve among the
independent variable gender for the non music population is reported among females with a mean
number of discipline referrals in grade nine through grade twelve of 3.71 and a 6.881 standard
deviation.
Therefore, males have the highest mean number of discipline referrals in grade nine through
grade twelve with a mean number of discipline referrals in grade nine through grade twelve of 4.25
and a 7.361 standard deviation.
Table 104 presents mean, standard deviation, and frequency (N ) for the dependent variable
number of discipline referrals in grade nine through grade twelve for the independent variable gender
among the non music population.
Table 104
Mean(a), Standard Deviation, and Frequency (N) by Gender for the Non Music Population.
Gender Discipline Referrals
Female Mean 3.71
Std. Deviation 6.881
N 652
Male Mean 4.25
Std. Deviation 7.361
N 635
Total Mean 3.98
Std. Deviation 7.124
N 1,287
a. Number of Discipline Referrals in Grade 9 - 12

272
The lowest mean number of discipline referrals in grade nine through grade twelve among the
independent variable ethnicity for the non music population is reported among the unspecified ethnic
group with a mean number of discipline referrals in grade nine through grade twelve of .75 and a .957
standard deviation.
In opposition, the highest mean number of discipline referrals in grade nine through grade
twelve among the independent variable ethnicity for the non music population is reported among
African Americans with mean number of discipline referrals in grade nine through grade twelve of
5.54 and a 8.516 standard deviation.
Table 105 presents mean, standard deviation, and frequency (N) for the dependent variable
number of discipline referrals in grade nine through grade twelve and the independent variable
ethnicity for the non music population.
In view of the fact that all participants in the non music population are not enrolled in a music
course, the independent variable formal music courses or no formal music courses is moot. Therefore
it has been omitted from analysis.
Nonetheless, Table 106 presents mean, standard deviation, and frequency (N ) for the
dependent variable number of discipline referrals in grade nine through grade twelve and the
independent variable formal music courses or no formal music courses for the non music population
and the entire study population.
There are several statistically significant correlations among the independent variables and the
dependent variable mean number of discipline referrals in grade nine through grade twelve at the 0.05
(2-tailed) and the 0.01 (2-tailed) levels for the non music population.

273
Table 105
Mean(a), Standard Deviation, and Frequency (N) by Ethnicity for the Non Music Population.
Ethnicity Discipline Referrals
African American
Mean
Std. Deviation
N
5.54
8.516
703
Asian/Pacific Islander Mean
Std. Deviation
N
2.88
6.187
49
Hispanic Mean
Std. Deviation
N
3.87
6.091
62
Native American/Alaskan Native Mean
Std. Deviation
N
4.25
6.384
12
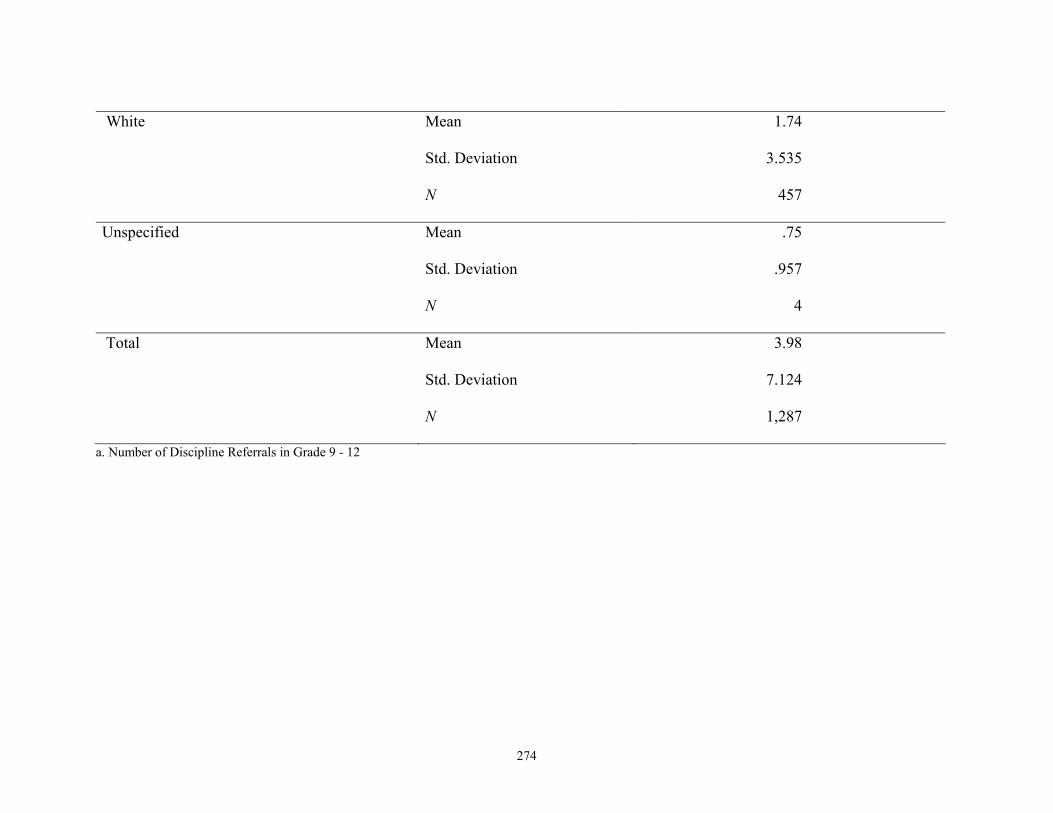
274
White Mean
Std. Deviation
N
1.74
3.535
457
Unspecified Mean
Std. Deviation
N
.75
.957
4
Total Mean
Std. Deviation
N
3.98
7.124
1,287
a. Number of Discipline Referrals in Grade 9 - 12

275
Table 106
Mean(a), Standard Deviation, and Frequency (N) by Formal Music Courses or No Formal Music
Courses for the Non Music Population and the Entire Study Population.
Formal Music Courses or
No Formal Music Courses
Discipline Referrals
No Formal Music Courses Mean
Standard Deviation
N
3.98
7.124
1,287
Total Population Mean 3.46
Standard Deviation 6.537
N 1,741
a. Number of Discipline Referrals in Grade 9 - 12
Table 107 presents correlations for the independent variables and the dependent variable
for the non music population. Statistical significance at the 0.05 level is indicated with one
asterisk (*) and statistical significance at the 0.01 level is indicated with two asterisks (**).
Since all students in the non music population are not enrolled in a music course, the
independent variable subject and number of years enrolled in formal music courses or no formal
music courses is restricted to the category VMusic-0; IMusic-0 within the independent variable.
Similarly, the independent variable formal music courses or no formal music courses has missing
correlations. Therefore, both variables have been deleted from analysis and are indicated
accordingly.

276
Table 107
Correlations(b) for the Non Music Population.
Subject and
Number of Years
Gender
Ethnicity
Formal Music or
No Formal Music
Discipline
Referrals
Subject and
Number of Years
Pearson Correlation
Sig. (2-tailed)
N
a.
1,287
a.
1,287
a.
1,287
a.
1,287
a.
1,287
Gender Pearson Correlation
Sig. (2-tailed)
N
a.
1,287
1
1,287
.055a
.050
1,287
a.
1,287
.038
.171
1,287
Ethnicity Pearson Correlation
Sig. (2-tailed)
N
a.
1,287
.055*
.050
1,287
1
1,287
a.
1,287
-.246**
.000
1,287
Formal Music or
No Formal Music
Pearson Correlation
Sig. (2-tailed)
N
a.
1,287
a.
1,287
a.
1,287
a.
1,287
a.
1,287
Number of
Discipline Referrals
Pearson Correlation
Sig. (2-tailed)
N
a.
1,287
.038
.171
1,287
-.246**
.000
1,287
a.
1,287
1
1,287 *. Correlation is significant at the 0.05 level (2-tailed). **. Correlation is significant at the 0.01 level (2-tailed). a. Cannot be computed because at least one of the variables is constant. b. Number of Discipline Referrals in Grade 9 – 12.

277
Table 108 presents the model summary for the independent variables gender and
ethnicity and the dependent variable number of discipline referrals in grade nine through grade
twelve for the non music population.
Table 108
Model Summary (b) for Gender and Ethnicity for the Non Music Population.
Change Statistics
R
R
Square
Adjusted
R
Square
Std. Error
of the
Estimate
R Square
Change
F
Change
df1
df2
Sig. F
Change
.251a .063 .062 6.902 .063 43.145 2 1,284 .000
a. Predictors: (Constant), Gender and Ethnicity. b. Dependent Variable: Number of Discipline Referrals in Grade Nine through Grade Twelve.
Once again, since the independent variable subject and number of years enrolled in
formal music courses or no formal music courses and the independent variable formal music
courses or no formal music courses have missing correlations, they have been deleted from
analysis.
Table 109 presents the analysis of variance (ANOVA) for the independent variables
subject and number of years enrolled in formal music or no formal music, gender, and ethnicity
and the dependent variable number of discipline referrals in grade nine through grade twelve for
the non music population. As indicated, the independent variable subject and number of years
enrolled in formal music courses or no formal music courses and the independent variable formal
music courses or no formal music have been deleted from analysis.
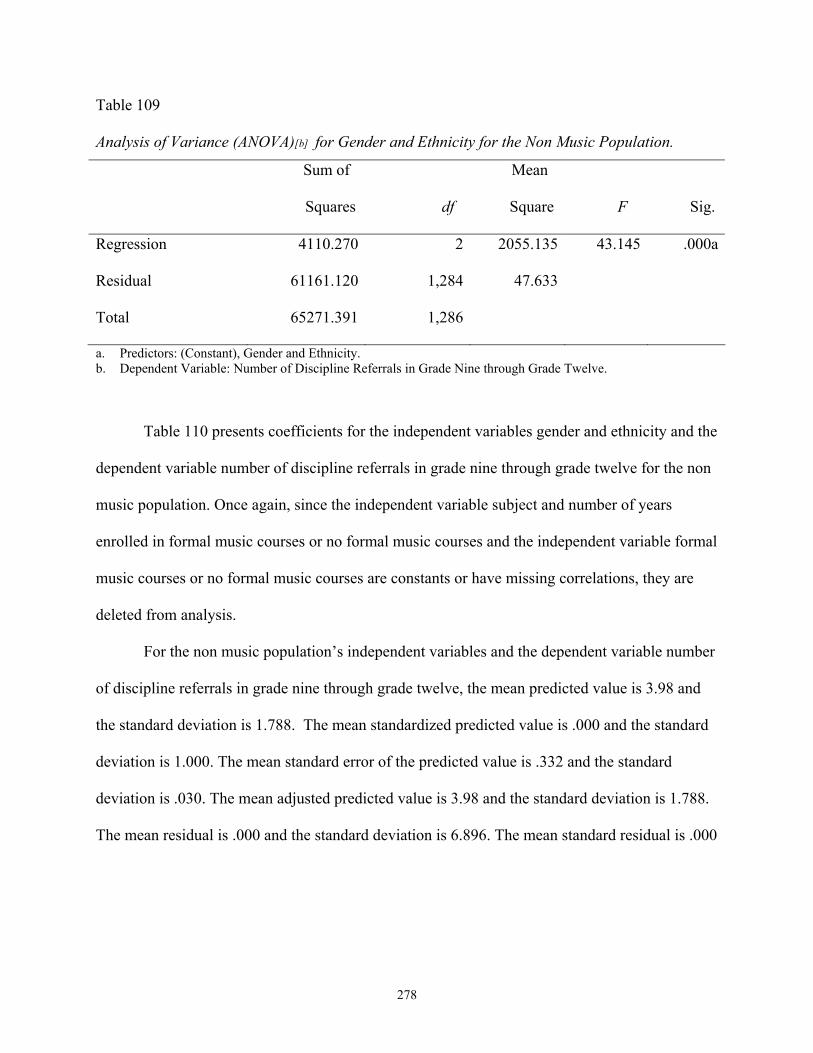
278
Table 109
Analysis of Variance (ANOVA)[b] for Gender and Ethnicity for the Non Music Population.
Sum of
Squares
df
Mean
Square
F
Sig.
Regression 4110.270 2 2055.135 43.145 .000a
Residual 61161.120 1,284 47.633
Total 65271.391 1,286
a. Predictors: (Constant), Gender and Ethnicity. b. Dependent Variable: Number of Discipline Referrals in Grade Nine through Grade Twelve.
Table 110 presents coefficients for the independent variables gender and ethnicity and the
dependent variable number of discipline referrals in grade nine through grade twelve for the non
music population. Once again, since the independent variable subject and number of years
enrolled in formal music courses or no formal music courses and the independent variable formal
music courses or no formal music courses are constants or have missing correlations, they are
deleted from analysis.
For the non music population’s independent variables and the dependent variable number
of discipline referrals in grade nine through grade twelve, the mean predicted value is 3.98 and
the standard deviation is 1.788. The mean standardized predicted value is .000 and the standard
deviation is 1.000. The mean standard error of the predicted value is .332 and the standard
deviation is .030. The mean adjusted predicted value is 3.98 and the standard deviation is 1.788.
The mean residual is .000 and the standard deviation is 6.896. The mean standard residual is .000

279
Table 110
Coefficients(a) for Gender and Ethnicity for the Non Music Population.
Unstandardized
Coefficients
Standardized
Coefficients
95% Confidence
Interval for B
B
Std.
Error
Beta
t
Sig.
Lower
Bound
Upper
Bound
(Constant) 5.327 .650 8.195 .000 4.052 6.603
Gender .737 .385 .052 1.913 .056 -.019 1.493
Ethnicity -.943 .103 -.248 -9.181 .000 -1.144 -.741
a. Dependent Variable: Number of Discipline Referrals in Grade Nine through Grade Twelve.
and the standard deviation is .999. The mean studentized residual is .000 and the standard
deviation is .999.
The mean deleted residual is .000 and the standard deviation is 1.000. Finally, the mean
studentized deleted residual is .000 and the standard deviation is 6.911.
Table 111 presents residual statistics for the dependent variable number of discipline
referrals in grade nine through grade twelve for the non music population (N = 1,287).
Regression scatter plots for the dependent variable number of discipline referrals in grade
nine through grade twelve for the non music population are presented in Appendix P.

280
Table 111
Residual Statistics for the Non Music Population.
Minimum
Maximum
Mean
Std.
Deviation
N
Predicted Value .41 5.86 3.98 1.788 1,287
Std. Predicted Value -1.998 1.052 .000 1.000 1,287
Standard Error of Predicted Value .275 .450 .332 .030 1,287
Adjusted Predicted Value .40 5.87 3.98 1.788 1,287
Residual -5.859 58.141 .000 6.896 1,287
Std. Residual -.849 8.424 .000 .999 1,287
Stud. Residual -.850 6.434 .000 1.000 1,287
Deleted Residual -5.872 58.270 .000 6.911 1,287
Stud. Deleted Residual -.850 8.674 .001 1.006 1,287
a. Dependent Variable: Number of Discipline Referrals in Grade Nine through Grade Twelve.
Data Tables for Each Research Question
In this section, each research question is presented in conjunction with relative data
tables.
1. Is there a statistically significant difference in academic achievement as measured
by grade twelve weighted cumulative grade point average, attendance rate as
measured by the number of absences in grade twelve, and student conduct as
measured by the number of discipline referrals in grade nine through grade twelve
among the population with respect to subject and number of years in which a
student participates in formal music courses or in no formal music courses?

281
Table 112 presents frequencies (N) and mean scores for the dependent variables grade
twelve weighted cumulative grade point average, number of absences in grade twelve, and
number of discipline referrals in grade nine through grade twelve for the independent variable
subject and number of years enrolled in formal music courses or no formal music courses for the
entire study population.
Table 112
Frequency (N) and Mean(a, b, and c) of Dependent Variables by Subject and Number of Years
Enrolled in Formal Music Courses or No Formal Music Courses for the Entire Study Population.
Subject and Number of Years Frequency GPA Absences Discipline Referrals
VMusic-1 78 2.62 18.22 2.19
VMusic-2 30 2.69 16.23 2.03
VMusic-3 42 2.89 15.29 2.86
VMusic-4 2 2.46 14.00 1.50
IMusic-1 88 2.76 13.42 2.50
IMusic-2 51 2.87 12.33 1.69
IMusic-3 83 3.01 12.81 1.13
IMusic-4 29 2.90 16.03 1.17
VIMusic-1 2 3.32 9.00 1.00
VIMusic-2 10 2.49 17.60 4.90
VIMusic-3 15 2.67 14.20 3.40
VIMusic-4 24 3.05 9.79 .71
VMusic-0; IMusic-0 1,287 2.55 16.78 3.98
Total 1,741 2.62 16.17 3.46
a. Grade 12 Weighted Cumulative Grade Point Average b. Number of Absences in Grade 12 c. Number of Discipline Referrals in Grade 9 - 12

282
2. Is there a statistically significant difference in academic achievement as measured
by grade twelve weighted cumulative grade point average, attendance rate as
measured by the number of absences in grade twelve, and student conduct as
measured by the number of discipline referrals in grade nine through grade twelve
among the population with respect to gender and participation in formal music
courses or in no formal music courses?
Table 113 presents frequencies (N) and mean scores for the dependent variables grade
twelve weighted cumulative grade point average, number of absences in grade twelve, and
number of discipline referrals in grade nine through grade twelve for the independent variable
gender for all study populations.
3. Is there a statistically significant difference in academic achievement as measured
by grade twelve weighted cumulative grade point average, attendance rate as
measured by the number of absences in grade twelve, and student conduct as
measured by the number of discipline referrals in grade nine through grade twelve
among the population with respect to ethnicity and participation in formal music
courses or in no formal music courses?
Table 114 presents frequencies (N) and mean scores for the dependent variables grade
twelve weighted cumulative grade point average, number of absences in grade twelve, and
number of discipline referrals in grade nine through grade twelve for the independent variable
ethnicity for all study populations.

283
Table 113
Frequency (N) and Mean(a, b, and c) of All Dependent Variables by Gender for All Study Populations.
Gender
Population
N
GPA
Absences
Discipline
Referrals
Entire Study Population 927 2.7155 16.98 3.06
Music Population 275 2.9087 14.59 1.50
Female
Non Music Population 652 2.6340 17.98 3.71
Entire Study Population 814 2.5120 15.25 3.93
Music Population 179 2.6791 14.22 2.77
Male
Non Music Population 635 2.4649 15.54 4.25
Entire Study Population 1,741 2.6203 16.17 3.46
Music Population 454 2.8181 14.44 2.00
Totals
Non Music Population 1,287 2.5505 16.78 3.98
a. Grade 12 Weighted Cumulative Grade Point Average b. Number of Absences in Grade 12 c. Number of Discipline Referrals in Grade 9 – 12

284
Table 114
Frequency (N) and Mean (a, b, and c) of All Dependent Variables by Ethnicity for All Study Populations.
Ethnicity Population N GPA Absences Discipline Referrals
Entire Study Population 916 2.3673 16.03 4.94
Music Population 213 2.5947 14.36 2.97
African American
Non Music Population 703 2.2984 16.54 5.54
Entire Study Population 65 2.9868 15.91 2.32
Music Population 16 3.1449 10.69 .63
Asian/Pacific Islander
Non Music Population 49 2.8480 17.61 2.88
Entire Study Population 79 2.6199 16.44 3.68
Music Population 17 2.7329 12.88 3.00
Hispanic
Non Music Population 65 2.5889 17.42 3.87
Entire Study Population 14 2.4236 22.79 4.07
Music Population 2 2.0850 16.00 3.00
Native American/Alaskan Native
Non Music Population 12 2.4800 23.92 4.25

285
Entire Study Population 662 2.9390 16.14 1.51
Music Population 205 3.0233 14.82 1.00
White
Non Music Population 457 2.9012 16.73 1.74
Entire Study Population 5 2.5660 26.40 1.40
Music Population 1 1.7600 38.00 4.00
Unspecified
Non Music Population 4 2.7675 23.50 .75
Entire Study Population 1,741 2.6203 16.17 3.46
Music Population 454 2.8181 14.44 2.00
Totals
Non Music Population 1,287 2.5505 16.78 3.98
a. Grade 12 Weighted Cumulative Grade Point Average b. Number of Absences in Grade 12 c. Number of Discipline Referrals in Grade 9 - 12
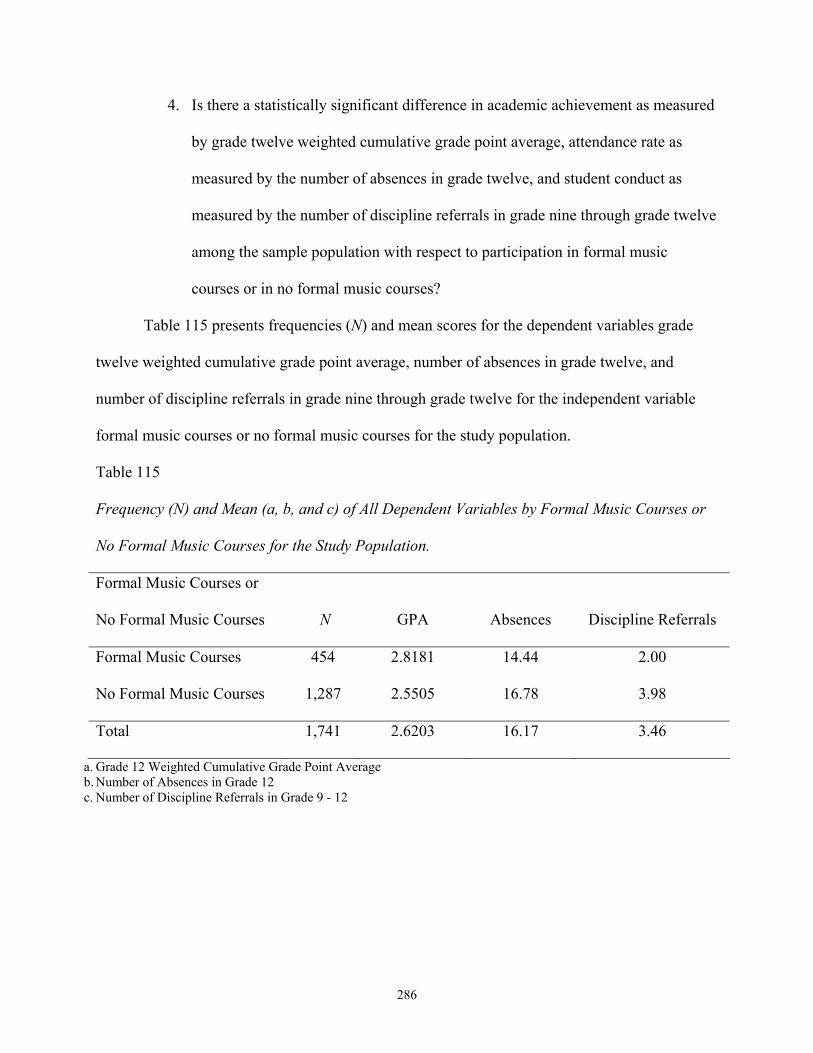
286
4. Is there a statistically significant difference in academic achievement as measured
by grade twelve weighted cumulative grade point average, attendance rate as
measured by the number of absences in grade twelve, and student conduct as
measured by the number of discipline referrals in grade nine through grade twelve
among the sample population with respect to participation in formal music
courses or in no formal music courses?
Table 115 presents frequencies (N) and mean scores for the dependent variables grade
twelve weighted cumulative grade point average, number of absences in grade twelve, and
number of discipline referrals in grade nine through grade twelve for the independent variable
formal music courses or no formal music courses for the study population.
Table 115
Frequency (N) and Mean (a, b, and c) of All Dependent Variables by Formal Music Courses or
No Formal Music Courses for the Study Population.
Formal Music Courses or
No Formal Music Courses
N
GPA
Absences
Discipline Referrals
Formal Music Courses 454 2.8181 14.44 2.00
No Formal Music Courses 1,287 2.5505 16.78 3.98
Total 1,741 2.6203 16.17 3.46
a. Grade 12 Weighted Cumulative Grade Point Average b. Number of Absences in Grade 12 c. Number of Discipline Referrals in Grade 9 - 12

287
Chapter Summary
Chapter Four has presented the results of the study in three sections. Section one has
presented background information for the study, research questions and null hypotheses, data
collection procedures, utilized instrumentation - grade twelve weighted cumulative grade point
average, number of absences in grade twelve, and number of discipline referrals in grade nine
through grade twelve, and data analysis techniques.
Section two has presented descriptive statistics, analysis of variance (ANOVA),
correlations, and regression data for the three populations – the entire study population, the
music population, and the non music population.
In addition, Section two has presented scatter plots for each of the dependent variables by
the three distinct populations – the entire study population, the music population, and the non
music population.
Finally, Section three has presented data tables for each research question for all
dependent variables - grade twelve weighted cumulative grade point average, number of
absences in grade twelve, and number of discipline referrals in grade nine through grade twelve.
Pertinent information regarding background information for the study, research questions
and null hypotheses, data collection procedures, and instrumentation devices has been specified.
Furthermore, relevant data regarding descriptive statistics, analysis of variance (ANOVA),
correlations, and regression for the dependent variables among three distinct populations have
been presented.
In conclusion, due to the substantial amount of collected and analyzed data, data tables
representing each of the study populations have been presented for all research questions.

288
CHAPTER FIVE
SUMMARY, CONCLUSIONS, DISCUSSION, AND RECOMMENDATIONS
Introduction and Summary
For several decades music educators have proposed that the study of music has a
significant impact on student academic achievement in core subjects, increases attendance rates,
and decreases the number of discipline referrals in public education (Virginia Commission for
the Arts, 1994; Music Educators National Conference, 1994a). In an era of higher student and
teacher accountability, increasing budget cuts, the federal No Child Left Behind Act (NCLB),
and stringent state standards of learning, a number of educators have argued that education in
music can boost test scores, attendance, attitudes toward school, and overall academic
achievement (Eisner, 1998; Virginia Commission for the Arts, 1994).
On the other hand, many general subject educators challenge that music is just a frill and
should be eliminated from public education (BBC News, 2005). Some educators claim that
“music courses hamper achievement in other domains;” (Gouzouasis, Guhn, & Kishor, n.d., p. 9)
or music requires too much time and therefore wastes or slows down student progress in core
instructional time (Gouzouasis et al.).
As a result, countless debates of whether to include or exclude music education from
academic curricula in public education have been generated throughout the United States (Von
Zastrow, 2004; Virginia Commission for the Arts, 1994; Vaughn, 2000; Steele, Bass, & Crook,
1999; Rauscher, 2003b; Rauscher, 2000; Music Educators National Conference, 1994a; Quinn,
2003). Similarly, arguments regarding whether to include music education or return to basics
have attained international attention. Under the guise of educational reform, Canada and the

289
United States have run a parallel course in the fight to include or exclude music education in
public schools.
In an effort to comply with pleas for increased rigor, strict budget constraints, a return to
basics, and the music is a frill mentality, school divisions across the nation have severely cut or
eliminated music and other arts programs. Nonetheless, it is difficult to determine the state of
music education in the United States given that obtaining reliable data regarding music courses is
limited. There is a lack of an agreed upon definition for calculating and reporting music
education data therefore making it difficult to determine basic information regarding student
enrollment in music courses and music offerings on a school-to-school basis or any comparable
data (Music for All Foundation, 2004).
For these reasons, the purpose of this study was to confirm or dispel educational claims
that instruction in music impacts academic achievement, attendance rates, and the number of
discipline referrals at the secondary level. Specifically, this study set out to quantify both general
and music education claims in examining high school academic achievement, attendance
records, and discipline data for the 2006 graduating class in one Southeast Virginia school
division.
Furthermore, this study is intended to be a catalyst to provide significant quantifiable data
to public school divisions at critical decision making times such as budget development and
program evaluation. Finally, this study should challenge general educators, music educators, and
elected officials to develop and incorporate an approved and unified data collection procedure
for all music programs across the country bringing the myth of such claims on both sides of the
issue to a close.

290
In spite of the fact that participation in music education courses may be a significant
factor in successfully increasing academic achievement as measured by grade twelve weighted
cumulative grade point average; increasing attendance rates as measured by the number of days
absent in grade twelve; or decreasing behavior problems as measured by the number of
discipline referrals in grade nine through grade twelve, professional educators deserve a
workable definition for calculating and reporting music education data to determine basic
information regarding student enrollment in music courses and music offerings, if not on a
school-to-school basis, then on a district-to-district and state-to-state basis. Consequently, a five-
chapter dissertation was used to organize this study providing a channel for such data collection
procedures.
Limitations and Delimitations
This study was limited to high school music and non music students in one urban school
district in Southeastern Virginia. Several limitations within the research design reduce the ability
to generalize the results to a population other than the one studied.
First, it is important to note that music students are self selected. Although research
variables are confined to instrumental music (band, guitar, piano, orchestra, and composition)
and vocal music, the researcher has no control over which music course or instrument the subject
may choose. However, other instruments other than those listed were not included in this study.
Similarly, the researcher has no control over student course selection (music or core
areas) other than the state prescribed courses or over content teacher assignments. Further
research is required to determine the individual affects a particular teacher or teaching style may
have on the academic success of a given student.

291
Second, the sampled school district has an open access policy for all its courses. If a
student has an interest in a course, enrollment in that course is not denied, including to the
special education population. However, there is no distinction between the general education and
special education populations in this study. The impact that music education may have on
academic achievement, attendance rate, and student conduct for the special education population
is not the focus of this study. Furthermore, since there are minimal costs for participation in
music courses such as instrument and uniform rental fees, no student is refused membership due
to financial hardship. Therefore, poverty is not an issue.
Third, the impact of music on academic achievement are restricted to present day
available data such as grade twelve weighted cumulative grade point average regardless of
whether it is specifically music instruction, music integrated in the curriculum or the use of
background music in general education classrooms; the number of days absent in grade twelve
(excused and unexcused without any distinction between the two); and the number of discipline
referrals in grade nine through grade twelve (including both severe and moderate student conduct
and the consequences thereof). Equally important, the researcher has no control over individual
administrators that handle discipline or the process in which discipline referrals are handled on a
daily basis.
Fourth, several categories in the independent variable subject and number of years
enrolled in formal music courses or no formal music courses and the independent variable
ethnicity have ten participants or fewer. Therefore, the validity of collected data is cautiously
reviewed when comparing like variables and making conclusions based on available data.
Fifth, the impact individual music teachers have on students has been completely
neglected. Hodges and O’Connell (n.d.) state that simply testing the affects of a given form of

292
music instruction without taking into account the characteristics of the teacher is short sighted.
There is the possibility that excellent teachers who are enthusiastic and who relate well to
students may make a greater difference in educational outcomes than the particular methodology
used. However, the reverse is also true.
Furthermore, the researcher acknowledges the influence of outside sources such as
private music lessons, church affiliations, and other variables that involve music. These variables
may be prevalent in determining academic achievement in core subjects, attendance rates, and
student conduct. However, for the purpose of this study, literature was contained to the impact of
music education on academic achievement, attendance rate, and the number of discipline
referrals in core subjects as it relates to public schools.
Although weighted courses (i.e. Honors, International Baccalaureate) are accounted for in
the study, cumulative grade point averages may affect outcomes. However, differences in
weighted courses or non-weighted courses and participation or non-participation in music
courses is not the focus of this study.
Finally, the researcher’s past experiences as a high school choral director and music
administrator are prevalent. To control for bias, the researcher purposefully chose a quantitative
study to gather existing data for analysis. Reported data are a result of sophisticated statistical
equations and analysis.
Discussion of Findings
Conclusions were drawn based on the analysis of available data to determine the long-
term impact that music, specifically the number of years enrolled in music instruction, has on
academic achievement as determined by grade twelve weighted cumulative grade point average;

293
attendance rates as determined by the number of absences in grade twelve; and on student
conduct as determined by the number of discipline referrals in grade nine through grade twelve.
The results of the research study are:
1. There are fewer students enrolled in formal music courses than there are in no formal
music courses among the study population.
The music enrollment numbers among the senior class are disconcerting since one would
reason that more students would remain in music courses throughout high school once they had
enrolled in a music course in the lower grades. Among the study population, only 27% of the
entire study population is enrolled in a formal music course.
Since students gain upper level musicianship skills as well as additional performance
abilities and opportunities in the eleventh and twelfth grade years, the researcher would deem
that after investing several semesters at a basic level of music instruction, students would remain
in the music program during the upper grades. Furthermore, students would have invested a
considerable amount of time and financial resources in their music courses and perhaps
purchased their own instrument in previous academic years.
On the other hand, although it is encouraging to see a large number of students enrolled
in a formal music course, it is discouraging that the largest numbers of participants in this study
are seniors that have only one year of a musical experience. One would expect the total number
of participants to increase in upper level music courses or the number of years enrolled in a
music course to be larger for the twelfth grade year.
For example, the largest group among the categories in the independent variable subject
and number of years enrolled in formal music courses or no formal music courses was VMusic-
0; IMusic-0 or no vocal or instrumental music courses with 1,287 (N = 1,287) participants or

294
73% of the entire study population. Among the music population, the largest number of students
was enrolled in the category IMusic-1 or one year of instrumental music with 88 (N = 88) or
5.1% of the entire study population. Data indicate a total of 454 (N = 454) twelfth grade music
students and 1,287 (N = 1,287) twelfth grade non music students. These numbers equate to 27%
and 73% of the entire study population, respectively.
2. Among the study population, there are more females enrolled in a formal music
course than there are males enrolled in a formal music course.
Data indicate 275 (N = 275) or 60.6% of the music population are females and 179
(N = 179) or 39.4% of the music population are males. These numbers are disproportionate to the
entire study population and the non music population. Data indicate that the entire study
population is comprised of 927 (N = 927) or 53.2% females and 814 (N = 814) or 46.8% males.
In comparison, data indicate that the non music population is comprised of 652 (N = 652) or
50.7% females and 635 (N = 635) or 49.3% males.
3. Among the study population, Asian/Pacific Islanders, Hispanics, Native
Americans/Alaskan Natives, and the unspecified ethnic group are under represented
among the formal music population.
Although data indicate ethnic groups are similar in structure across all populations, the
aforementioned ethnic groups represent the smallest groups among the formal music population
and should be encouraged to enroll in formal music education courses.
4. There is a statistically significant difference in academic achievement as measured by
grade twelve weighted cumulative grade point average among the study population
with respect to subject and number of years enrolled in formal music courses or no

295
formal music courses and participation in formal music courses and in no formal
music courses.
Data indicate music students earn a mean grade twelve weighted cumulative grade point
average .27 points higher than non music students among the study population. The mean grade
twelve weighted cumulative grade point average for the independent variable subject and number
of years enrolled in formal music courses or no formal music courses for the entire study
population (N = 1,741) was 2.62. However, only three out of the thirteen categories for the
independent variable have a mean grade twelve weighted cumulative grade point average below
that of the entire population’s mean.
The categories are: (1) VMusic-4 or four years of vocal music courses (N = 2) with a
mean grade twelve weighted cumulative grade point average of 2.46; (2) VIMusic-2 or a
combination of vocal and instrumental music courses for two years (N = 10) with a mean grade
twelve weighted cumulative grade point average of 2.49; and most importantly, the no music
courses category VMusic-0; IMusic-0 (N = 1,287) with a mean grade twelve weighted
cumulative grade point average of 2.55.
For most public school officials, the academic difference between these two populations
is a significant factor in determining achievement. In any event, since the populations of the two
music categories, VMusic-4 and VIMusic-2, have only two and ten participants, respectively, the
validity of the study is questioned making the difference in academic achievement between the
music population and the non music population all the more significant.
Nevertheless, as in the findings of The GRAMMY Foundation/The Leonard Bernstein
Center for Learning, Artful Learning: A School Reform Model (2004) and those of Cheryl
Brogla-Krupke (2003), this study confirms that at least ten of the thirteen categories for the
296
independent variable subject and number of years enrolled in formal music courses or no formal
music courses impact the academic success of the surveyed population as evidenced by higher
grade twelve weighted cumulative grade point averages of music participants. With the
exception of the categories VMusic-4 and VIMusic-2, due to low numbers of enrolled pupils,
students that participated in a music course for at least one year earned a higher mean grade
twelve weighted cumulative grade point average than those that did not.
In any case, the first research question is confirmed. There is a statistically significant
difference in academic achievement as measured by mean grade twelve weighted cumulative
grade point average among the study population with respect to subject and number of years
enrolled in formal music courses or no formal music courses.
5. There is a statistically significant difference in academic achievement as measured by
grade twelve weighted cumulative grade point average among the study population
with respect to gender and participation in formal music courses or in no formal
music courses.
Data indicate that both female music students (N = 275) and male music students
(N = 179) earned a mean grade twelve weighted cumulative grade point average higher than that
of non music males (N = 635) and non music females (N = 652). Female music students earned a
mean grade twelve weighted cumulative grade point average of 2.91 as compared to non music
females with a mean grade twelve weighted cumulative grade point average of 2.63 - a
difference of .28.
In comparison, male non music students earned a mean grade twelve weighted cumulative
grade point average of 2.46 while male music students earned a mean grade twelve weighted
297
cumulative grade point average of 2.68. Therefore, male music students earned a mean grade
twelve weighted cumulative grade point average .22 points higher than did non music males.
Therefore, the second research question is confirmed. There is a statistically significant
difference in academic achievement as measured by grade twelve weighted cumulative grade
point average with respect to gender and participation in formal music courses or in no formal
music courses.
6. There is a statistically significant difference in academic achievement as measured by
grade twelve weighted cumulative grade point average among the study population
with respect to ethnicity and participation in formal music courses or in no formal
music courses.
Music students in all ethnic groups, with the exception of the unspecified ethnic group
and Native Americans/Alaskan Natives, earned a higher mean grade twelve weighted cumulative
grade point average than did non music ethnic groups.
Like the two previous independent variables - subject and number of years enrolled in
formal music courses or no formal music courses and gender - data indicate music students
earned a higher mean grade twelve weighted cumulative grade point average than non music
students with respect to ethnicity and participation in formal music courses or in no formal music
courses.
However, it is important to note that data indicate only one student in the music
unspecified ethnic group (N = 1). Similarly, data indicate single digit numbers among the other
populations for the unspecified ethnic group as well as small numbers for the ethnic group
Native American/Alaskan Native. Therefore, the population for the unspecified ethnic group and
Native American/Alaskan Native are not valid and were disregarded in analysis.

298
Conversely, data indicate other ethnic groups had larger populations and were utilized in
analysis. For instance, there are 213 (N = 213) African American music students and 703
(N = 703) African American non music students. The mean grade twelve weighted cumulative
grade point average among African American music students was 2.59 as compared to 2.30
among African American non music students.
Similarly, Asian/Pacific Islander music students (N = 16) earned a mean grade twelve
weighted cumulative grade point average of 3.14 as compared to 49 (N = 49) Asian/Pacific
Islander non music students who earned a mean grade twelve weighted cumulative grade point
average of 2.85. This represents a .29 increase in academic achievement for African American
music students and Asian/Pacific Islander music students as compared to non music students in
the same ethnic groups.
Likewise, Hispanic music students earned a mean grade twelve weighted cumulative
grade point average .14 higher than non music Hispanic students. White music students earned a
mean grade twelve weighted cumulative grade point average .12 higher than non music White
students. Therefore, the third research question is confirmed. There is a statistically significant
difference in academic achievement as measured by grade twelve weighted cumulative grade
point average among the population with respect to ethnicity and participation in formal music
courses or in no formal music courses.
As school divisions struggle to close the achievement gap between ethnic groups across
the country, it would behoove educators to take into consideration the impact that music
education may have on academic achievement, at least for the sampled school division and
school divisions with similar ethnic structures. Nevertheless, the researcher is not suggesting that
music education is the cause and affect to increase academic achievement. In fact, this may be

299
the case. However, the statistics of this research study cannot confirm or dispel this statement.
Additional research studies with a variety of statistical procedures are required to determine the
notion that enrollment in a music education course causes increase academic achievement.
7. There is a statistically significant difference in academic achievement as measured by
grade twelve weighted cumulative grade point average among the population with
respect to participation in formal music courses or in no formal music courses.
Students enrolled in formal music courses earned a mean grade twelve weighted
cumulative grade point average .27 higher than did students enrolled in no formal music courses.
Students enrolled in formal music courses (N = 454) earned a mean grade twelve
weighted cumulative grade point average of 2.82 as compared to students enrolled in no formal
music courses (N = 1,287) who earned a mean grade twelve weighted cumulative grade point
average of 2.55. Therefore, students enrolled in formal music courses earned a mean grade
twelve weighted cumulative grade point average .27 points higher than students enrolled in no
formal music courses.
The fourth research question is confirmed. There is a statistically significant difference in
academic achievement as measured by grade twelve weighted cumulative grade point average
among the population with respect to participation in formal music courses or no formal music
courses.
8. There is a statistically significant difference in attendance rate as measured by the
number of absences in grade twelve among the population with respect to subject and
number of years and participation in formal music courses or in no formal music
courses.

300
Analysis of data has determined that music students have fewer days absent than do non
music students. However, for the independent variable subject and number of years enrolled in
formal music courses or no formal music courses, data indicate that ten categories out of thirteen
have a mean number of absences in grade twelve below that of the mean for the entire study
population and the non music population. Most importantly, all ten categories are categories in
which a music course was a factor.
The ten categories among the independent variable subject and number of years enrolled
in formal music courses or no formal music courses that have a mean number of absences in
grade twelve below the entire population and the non music population are: VMusic-2, VMusic-
3, VMusic-4, IMusic-1, IMusic-2, IMusic-3, IMusic-4, VIMusic-1, VIMusic-3, and VIMusic-4.
Therefore, VMusic-1, VIMusic-2, and, most significantly, VMusic-0; IMusic-0 have a mean
number of absences in grade twelve above the mean of the music population.
Overall, music students had 2.34 fewer days absent than did non music students.
However, the number of days absent in grade twelve may have been more significant for music
students if the theory that music students participate in more outside classroom performances or
field trips during the school day than do non music students.
Be that as it may, the difference in days absent between populations might have been
greater had the sampled school division distinguished between excused and unexcused absences.
It is difficult to determine relationships and make comparisons for the number of absences that a
music student and a non music student earned based upon available data.
For example, since field trips are considered excused absences by the sampled school
division, statistical significance and validity are difficult to determine from collected data.
Perhaps music students are involved in more field trips for performance purposes in addition to

301
district and state music competitions which require them to be out of school. On the other hand,
perhaps non music students participated in more extended classroom experiences through their
general education courses. Then again, music students would have participated in general
education field trips as well as field trips through their music courses. Therefore, music students
would have participated in more field trips which would have lead to more days absent than non
music students.
In any case, an attempt was made to corroborate statistical significance for each of the
independent variables and the dependent variable number of absences in grade twelve among the
various populations. Since available data from the sampled school division does not distinguish
between excused and unexcused absences, it is difficult, if not impossible, to determine if the
suggested theory is justified. Nevertheless, the number of field trips in which music and non
music students participate is not the focus of this study.
9. There is a statistically significant difference in attendance rate as measured by the
number of absences in grade twelve among the population with respect to gender and
participation in formal music courses or in no formal music courses.
Participation in a music course is a factor in decreasing the number of days absent among
gender for the studied population. Data indicate that female music students earned a mean
number of absences in grade twelve below that of female non music students (N = 652).
Specifically, non music females were absent approximately three and one-half days more than
female music students.
Similarly, male music students (N = 173) earned a lower mean number of absences in
grade twelve than non music males (N = 635) - a difference of one and one quarter days to be

302
exact. Although the difference is not as significant as that of female music students and non
music students, male music students were present more often than non music male students.
Thus, it is determined that participation in a music course is a factor in decreasing the
number of days absent among gender for the studied population. The second research question is
confirmed. There is a statistically significant difference in attendance rate as measured by the
number of absences in grade twelve among the population with respect to gender and
participation in formal music courses or no formal music courses.
10. There is a statistically significant difference in the attendance rate as measured by the
number of absences in grade twelve with respect to ethnicity and participation in
formal music courses or in no formal music courses.
Data indicate that music students were consistently absent fewer days than were non
music students. However, the ethnic group with the highest mean number of absences in grade
twelve is the music population’s unspecified ethnic group (N = 1) with a mean number of
absences in grade twelve of 38.00. Similarly, data indicate the unspecified ethnic group for both
the entire study population (N = 5) and the non music population (N = 4) have a high mean
number of absences in grade twelve with 26.40 and 23.50, respectively. On the other hand, since
the size of the unspecified group across all populations is small, the validity of that population is
questioned.
Nevertheless, among remaining ethnic groups, music students were consistently absent
fewer days than were non music students. In one instance, Asian/Pacific Islander music students
were absent seven fewer days than their Asian/Pacific Islander non music classmates. Other
music student ethnic groups yield similar results, although not as significant as the
aforementioned ethnic group.
303
Therefore, it is inferred that participation in a music course is a factor in determining the
mean number of absences in grade twelve among ethnic groups for the studied population. The
third research question is confirmed. There is a statistically significant difference in attendance
rate as measured by the number of absences in grade twelve with respect to ethnicity and
participation in formal music courses or in no formal music courses.
11. There is a statistically significant difference in attendance rate as measured by the
number of absences in grade twelve among the population with respect to
participation in formal music courses or no formal music courses.
The fourth independent variable, formal music courses or no formal music courses, yields
similar results as the three previous independent variables. Data indicate students enrolled in
formal music courses (N = 454) earned at mean number of absences in grade twelve of 14.44 as
compared to a mean number of absences in grade twelve of 16.78 among students enrolled in no
formal music courses (N = 1,287). Therefore, data indicate that music students had almost 2.5
fewer days absent than did non music students.
The fourth research question is confirmed. There is a statistically significant difference in
attendance rate as measured by the number of absences in grade twelve among the population
with respect to participation in formal music courses or no formal music courses.
12. There is a statistically significant difference in student conduct as measured by the
number of discipline referrals in grade nine through grade twelve among the
population with respect to subject and number of years and participation in formal
music courses or in no formal music courses.
Similar to the findings of the two previous dependent variables, data for the independent
variable subject and number of years enrolled in formal music courses or no music courses

304
indicate that ten out of the thirteen categories have a mean number of discipline referrals in grade
nine through grade twelve lower than the mean of the entire population and the mean of the non
music population.
The categories with a mean number of discipline referrals in grade nine through grade
twelve lower than the mean of the entire population and the non music population include:
VMusic-1, VMusic-2, VMusic-3, VMusic-4, IMusic-1, IMusic-2, IMusic-3, IMusic-4, VIMusic-
1, and VIMusic-4. This leaves only the categories VIMusic-2, VIMusic-3, and most importantly,
VMusic-0; IMusic-0 with a mean number of discipline referrals in grade nine through grade
twelve higher than the mean of the music population. However, the categories VMusic-4 and
VIMusic-1 have very small population sizes. In fact, only two (N = 2) participants. Therefore,
the validity of the population is questioned in regard to these two categories.
In any case, similar to the research questions utilizing the previous dependent variables,
data for the dependent variable number of discipline referrals in grade nine through grade twelve
confirm that music courses, specifically subject and number of years enrolled in formal music
courses or no formal music courses, are a factor in decreasing the number of discipline referrals
in grade nine through grade twelve among the studied population. There is a statistically
significant difference in student conduct as measured by the number of discipline referrals in
grade nine through grade twelve among the population with respect to subject and number of
years and participation in formal music courses or no formal music courses.
13. There is a statistically significant difference in student conduct as measured by the
number of discipline referrals in grade nine through grade twelve among the
population with respect to gender and participation in formal music courses or in no
formal music courses.

305
As indicated, the mean number of discipline referrals in grade nine through grade twelve
is 3.46 for the entire study population. Among the music population, the mean number of
discipline referrals in grade nine through grade twelve per student is 2.00 as compared to the
mean number of discipline referrals in grade nine through grade twelve per student of 3.98
among the non music population. Male non music students earned a mean number of discipline
referrals in grade nine through grade twelve per student of 4.25, the highest among all study
populations, as compared to the mean number of discipline referrals in grade nine through grade
twelve per student of 2.77 among male music students.
On the other hand, female music students earned a mean number of discipline referrals in
grade nine through grade twelve of 1.50. Female non music students earned a mean number of
discipline referrals in grade nine through grade twelve of 3.71. This represents a difference of
two discipline referrals between female music students and non music female students.
To summarize, for all cases, male and female music students earned fewer discipline
referrals in grade nine through grade twelve than non music male and female students among the
population.
Since previously collected data regarding gender studies and attendance rates for music
and non music students at the secondary level is minimal, it is difficult to determine statistical
significance beyond that of the study population. However, similar to the two previous
dependent variables, data indicate that the second research question is again confirmed. There is
a statistically significant difference in student conduct as measured by the number of discipline
referrals in grade nine through grade twelve among the study population with respect to gender
and participation in formal music courses or in no formal music courses.
306
14. There is a statistically significant difference in student conduct as measured by the
number of discipline referrals in grade nine through grade twelve with respect to
ethnicity and participation in formal music courses or in no formal music courses.
The ethnic group with the highest number of discipline referrals in grade nine through
grade twelve among all populations is African American non music students (N = 703) with a
mean number of discipline referrals in grade nine through grade twelve of 5.54. Conversely, the
ethnic group with the lowest mean number of discipline referrals in grade nine through grade
twelve among all populations is Asian/Pacific Islander music students (N = 16) with a mean
number of discipline referrals in grade nine through grade twelve of .63.
Although the number of participants in this ethnic group is small, data indicate music
students consistently have the lowest mean number of discipline referrals in grade nine through
grade twelve among all ethnic groups for all populations. The only exception is the unspecified
non music ethnic group (N = 4) with a mean number of discipline referrals in grade nine through
grade twelve of .75. However, since the number of participants in this ethnic group is so small,
the validity of the population is questioned.
Nonetheless, music students had fewer discipline referrals in grade nine through grade
twelve than non music students among all ethnic groups with the exception of the
aforementioned unspecified ethnic group. Therefore, the third research question is confirmed.
There is a statistically significant difference in student conduct as measured by the number of
discipline referrals in grade nine through grade twelve among the study population with respect
to ethnicity and participation in formal music courses or no formal music courses.

307
15. There is a statistically significant difference in student conduct as measured by the
number of discipline referrals in grade nine through grade twelve among the
population with respect to participation in formal music courses or no formal music
courses.
Finally, the fourth independent variable – formal music courses or no formal music
courses - yields similar results as the three previous independent variables with regard to student
conduct. Students enrolled in formal music courses (N = 454) earned a mean number of
discipline referrals in grade nine through grade twelve of 2.00 as compared to a mean number of
discipline referrals in grade nine through grade twelve of 3.98 among students enrolled in no
formal music courses (N = 1,287). Therefore, data indicate that music students had 2.5 fewer
discipline referrals than did non music students.
The fourth research question is confirmed. There is a statistically significant difference in
student conduct as measured by the number of discipline referrals in grade nine through grade
twelve among the population with respect to participation in formal music courses or no formal
music courses.
Summary
As this study has determined, it is evident that music education has an impact on
academic achievement, attendance rate, and on student conduct. The influence of music
education is notated in the independent variables subject and number of years enrolled in formal
music courses or no formal music courses, gender, ethnicity, and formal music courses or no
formal music courses as measured by the dependent variables grade twelve weighted cumulative
grade point average, the number of absences in grade twelve, and the number of discipline
referrals in grade nine through grade twelve.

308
Sophisticated statistical tests have confirmed that music education courses impact
academic achievement for each of the study populations. Moreover, for the studied population,
the findings of The GRAMMY Foundation/The Leonard Bernstein Center for Learning, Artful
Learning: A School Reform Model (2004) and the findings of Cheryl Brogla-Krupke (2003) are
confirmed that when a student is enrolled in formal music courses, academic achievement will
increase. In the case of the study population, the mean grade twelve cumulative grade point
average per student increased as much as .29 points.
Furthermore, similar to the academic findings of Anderson (2000), Hetland (2000),
Cromie (2000), and McLelland (2005), this study confirms that gender is a factor in determining
academic success of the surveyed population as evidenced by higher grade twelve weighted
cumulative grade point averages among music participants as compared to non music
participants.
In opposition, the findings of this study dispel the conclusions of Gilleta et al. (2003),
Hood-Mincey (2005), Hui (2004), and Rauscher and Zupan (2000) in which gender could not be
confirmed or dismissed as a factor in determining academic success. For the study population, as
concluded in this research study, gender and participation in formal music courses or no formal
music courses is an indicator in determining academic success.
Equally important, in spite of the fact that comparable research studies provide little data
at the secondary level, it is difficult to conclude that music education courses are definite
indicators of academic achievement as measured by grade twelve weighted cumulative grade
point average for a variety of ethnic groups beyond that of the studied population. At any rate, it
is surmised, for the studied population, that participation in formal music courses or in no formal

309
music courses is a factor that increases academic achievement as measured by grade twelve
weighted cumulative grade point average with respect to ethnicity.
However, the researcher cautions that found relationships are not cause and effect.
Further music education research is required to determine if specific independent variables or
other factors are predictors of academic achievement as measured by grade twelve weighted
cumulative grade point average, attendance rate as measured by the number of absences in grade
twelve, and student conduct as measured by the number of discipline referrals in grade nine
through grade twelve. In addition, should this study be replicated, the conditions of this study
should be carefully adhered to and monitored.
In any case, this study extends the research recommendations made in the 2004 report
entitled The Sound of Silence – The unprecedented decline of music education in California
public schools: A statistical review, published by the Music for All Foundation. A unified means
to collect data regarding music students and non music students is needed across the United
States to validate past and present research findings.
Finally, if this phenomenon can be generalized to other populations, shouldn’t educators
insist on enrolling more non music students, at risk students, and students in danger of academic
failure into music courses? The data from this study would indicate that the answer is yes!
Furthermore, legislatures must heed the impact of music education with regard to the No Child
Left Behind Act and persevere that every child in public school be enrolled in music education.
Conclusions and Implications for Practice
The results of this study indicate that music education impacts academic achievement,
attendance rate, and student conduct in a variety of facets. School divisions that are grappling
with the notion of diminishing or cutting music programs should carefully consider the

310
conclusions of this study before making decisions that positively affect the student population.
Therefore, as a means to close the disparity gap in academic achievement, attendance rate, and
student conduct, educators should adhere to the following recommendations:
1. Enroll more ninth grade students in a music course and encourage them to continue
music study through tenth, eleventh, and twelfth grades to increase academic
performance, decrease the number of absences, and decrease the number of discipline
referrals in grade nine through grade twelve.
2. Increase the number of males in all music courses, particularly in vocal music courses
to increase academic performance, decrease the number of absences, and decrease the
number of discipline referrals in grade nine through grade twelve.
3. Increase the number of all ethnic groups in music courses to increase academic
performance, decrease the number of absences, and decrease the number of discipline
referrals in grade nine through grade twelve. For the study population, Asian/Pacific
Islanders, Hispanics, and Native Americans/Alaskan Natives have the lowest number of
participating students and should be encouraged and enrolled in formal music courses.
Among the study population, data indicate that music courses begin to close, if not
completely close, the disparity gap between ethnic groups.
4. Increase the number of non music students in music courses especially in grades nine
through twelve to induce lasting positive academic achievement throughout secondary
school.
5. Increase the number of males in all music courses, particularly in vocal music courses,
in grades nine through twelve to increase academic achievement.

311
6. Increase the number of all ethnic groups in all music courses in grades nine through
twelve to increase academic achievement.
7. Increase the number of non music students in music courses in grades nine through
twelve to encourage higher academic achievement and induce lasting positive academic
performance throughout secondary school.
8. Increase the number of non music students in music courses especially in grades nine
through twelve to decrease the number of absences throughout secondary school.
9. Increase the number of males in all music courses in grades nine through twelve to
decrease the number of absences throughout secondary school.
10. Increase the number of all ethnic groups in music courses in grades nine through twelve
to decrease the number of absences across all ethnic groups.
11. Increase the number of non music students in music courses in grades nine through
twelve to decrease the number of absences and induce lasting attendance rates
throughout secondary school.
12. Increase the number of non music students in music courses in grades nine through
twelve to induce lasting positive student conduct throughout secondary school.
13. Increase the number of males in all music courses, particularly in vocal music courses,
in grades nine through twelve to decrease the number of discipline referrals and
increase positive student conduct.
14. Increase the number of all ethnic groups in music courses in grades nine through twelve
to decrease the number of discipline referrals and increase positive student conduct.

312
15. Increase the number of non music students in music courses in grades nine through
twelve to decrease the number of discipline referrals and increase positive student
conduct throughout secondary school.
16. Insist and encourage the adoption of a unified data collection process for all music and
non music related agencies across the nation so that the impact of music education can
be understood worldwide.
Recommendations for Practice
As determined in this research study, it can be surmised that enrollment in some type of
music education course can impact academic achievement, attendance rate, and student conduct
as evidenced by the grade twelve weighted cumulative grade point average, the number of
absences in grade twelve, and the number of discipline referrals in grade nine through grade
twelve for the study population. As boards of education, school administrators, and public
officials contemplate the elimination or diminution of their school division’s public school music
programs, the researcher recommends that the findings of this study as well as future studies
assist in determining if such drastic measures are beneficial to all students and the school
division.
It is also recommended that music educators as well as general classroom teachers heed
the findings of this study to speak with authority, confidence, and substance about the impact
that music education can have on students. So many times, educators speak without statistical
backing. Thus, this study provides support for educators to voice their protests with statistical
data.
313
Recommendations for Future Study
Eisner (1998) states, “what is needed more than correlations or statistically significant
differences between groups are a theory that links experience in the arts with academic
achievement” (p. 56). Therefore, the researcher recommends a variety of qualitative studies be
conducted to determine the impact of teaching styles and student learning styles on music and
non music students that increase academic achievement, decrease absenteeism, and decrease
poor student conduct.
Moreover, it is recommended that a qualitative study be conducted to determine what
impact individual teachers may possess that increase success for music and non music students.
Additionally, it would be constructive to investigate what factors parents and students believe
make excellent music programs that lead to academic success. As students struggle with negative
influences in their daily lives, one particular question should be explored to discover the impact
of music education - What changes, if any, have been observed at home or at school in regard to
academic achievement, attitude toward school, school attendance, and behavior?
Beneficial to the field of knowledge would be a study to determine whether music
education empowers students to be successful in and out of the classroom or are music students
naturally driven to do well academically. Research of this type would put to rest the myth of
cause and effect for music education in public schools.
Additionally, it is recommended that this study be expanded to include elementary
school, middle school, and higher education. Correlations and additional findings may be
significant in longitudinal studies, studies across several academic levels or any number of public
education settings.

314
Another recommendation for future research would be to determine if specific
instruments, including vocal music instruction, has the greatest impact on particular variables.
This study has attempted to uncover differences in vocal and instrumental music as well as that
of music composition. However, combining many musical instruments into one or more
categories did not delve into the impact that individual instruments may or may not have on
academic achievement, attendance rates, and student conduct.
It is also recommended that research be completed to determine the impact that music
education has on the special education population. With the increase of special education
students in public schools across the United States, music education may play an important role
in bridging the gap between a disability and academic success. Since Howard Gardner has
uncovered eight multiple intelligences, one of which is musical, educators may very well
discover that music courses have far reaching consequences than originally expected.
Furthermore, using music courses as an avenue to strengthen academic success,
attendance rate, and student conduct, additional research should be completed to determine if
gender differences among music students and non music students impact or impair the
educational process. Although this study has confirmed findings of earlier research studies in
regard to gender, the results are not compelling enough to determine what and if music education
can make a difference academically in the public school setting.
Similarly, since this study was not intended to and has not determined cause and effect,
further research studies must be completed to reveal the true impact of music education and its
many variables.
Finally, should this study be replicated, data clearly identifying excused and unexcused
absences, if obtainable, should be investigated to determine if music students are engaged in

315
more field trips than their non music classmates. This determination has an impact on attendance
rates. In addition, types of discipline referrals that music and non music students earn could be of
interest to future researchers.
Research Reflections
As a person who has been involved in many aspects of public school music education as
a student, a teacher, and a music administrator, the researcher has seen a long history of the
benefits of taking a music course. As an educator, I have seen the lives of students turn
completely around academically. In addition, the researcher has seen first hand the power that
music education provides as lives are transformed at home and at school in regard to student-to-
student and student-to-parent relationships. This study has statistically confirmed a gut reaction
as to the power of music education.
In conclusion, this researcher agrees with Jensen in his 2001 book Arts with the brain in
mind in which Jensen suggests that there is no evidence that higher standards “actually produce
better human beings – unless accompanied by better quality teaching, more targeted resources,
greater opportunities for underserved populations, stronger role models, high expectations, and a
dozen other key variables” (Jensen, p. vi).
On the other hand, with a clear and thorough understanding of the brain and the impact
that music has upon it, educators, regardless of content specialty, cannot exclude the possibility
that there may be a link between listening to music, instruction in music, and increased academic
achievement (Jensen, 2001). Additionally, the researcher would add a link between music
courses and increased attendance rates as measured by the number of absences in grade twelve
and decreased poor student conduct as measured by the number of discipline referrals in grade
nine through grade twelve.

316
References
Akin, J. (n.d.). Music makes a difference makes a difference: Resource guide to educational
research. Retrieved July 18, 2006, from http://www.nldline.com/music1.htm
Anderson, T. (2000, Spring). The Mozart effect: a closer look. Retrieved January 23, 2006, from
http://lrs.ed.uiuc.edu/students/lerch1/edpsy/mozart_effect.html
Babo, G. D. (2001). The impact of a formal public school instrumental music instruction
program on an eighth grade middle school student's reading and mathematics
achievement. Retrieved October 20, 2005, from ERIC database.
BBC News (2005, March 7). Schools 'should return to basics'. Retrieved July 18, 2006, from
http://news.bbc.co.uk/go/pr/fr/-/hi/us_politics/4323063.stm
Brogla-Krupke, C. (2003, May). Improving student achievement through the use of music
strategies. Retrieved October 20, 2005, from ERIC database.
Business Week (1996). The changing workplace is changing our view of education. Business
Week, October, 1996.
Campbell, D. (1997). Mozart - A friend for your mind, heart, and body. Music for the Mozart
effect: Unlock the creative spirit, 3, CD recording.
Campbell, D. (2000a). The Mozart effect for children; Awakening your child's mind, health, and
creativity with music. New York, NY: William Morrow, an imprint of HarperCollins
Publishers.
Campbell, D. (2000b, October 13). The "Mozart Effect". Retrieved July 4, 2006, from
http://www.excel-ability.com/Models/MozartEffect.html
Campbell, D. (2005). About Don Campbell. Retrieved July 8, 2006, from
http://www.mozarteffect.com/MoreonTME/AboutDon/AboutDon.html

317
Campbell, D., & Stanley, J. (1963). Experimental and quasi-experimental designs for research.
Chicago, IL: Rand-McNally.
Carter, S. (2002). The impact of parent/family involvement on student outcomes: An annotated
bibliography of research from the past decade. Eugene, Oregon: Consortium for
Appropriate Dispute Resolution in Special Education.
Children's Music Workshop (n.d.a). Instrumental lessons do not harm students' academic
achievement. Retrieved January 8, 2006, from
http://www.childrensmusicworkshop.com/advocacy/researchontherelatioship.html
Children's Music Workshop (n.d.b). Research on the relationship of music and other academic
areas. Retrieved January 8, 2006, from
http://www.childrensmusicworkshop.com/advocacy/researchontherelationship.html
Christensen, T. (2005, March 7). History of music-brain and wellness research. Healing
Drummer, 2005, March, pp. 1 - 5. Retrieved July 5, 2006, from
http://healingdrummer.blogspot.com/2005/03/history-of-music-brain-and-wellness.html
Coff, R. (1998-2002). For the professional music educator the "Mozart Effect" - Research on
music and the developing brain, and more...,. Retrieved July 4, 2006, from
http://parenting-baby.com/Parenting-Baby-Music-Research/Music-Research.html
Corbett, D., Wilson, B., & Morse, D. (2002). The arts are an "R" too. Jackson, MS: Mississippi
ARTS Commission.
Costa-Giomi, E. (2004). Effects of three years of piano instruction on children's academic
achievement, school performance and self-esteem. Psychology of Music, 32 (2), 139-152.
Creswell, J. W. (2003). Research design: Qualitative, quantitative, and mixed method
approaches (2nd ed.). Thousand Oaks, CA: SAGE Publications.
318
Cromie, W. (2000, Oct-Dec). Arts-to-smarts link overblown: Researchers sing a new tune for the
Mozart effect. The Harvard University Gazette, pp. 1- 4. Retrieved May 16, 2006, from
http:///www.new.harvard.edu/gasette/2000/10.12/1-mozart.html
Cromie, W. J. (1999, September 16). Mozart effect hits sour notes. The Harvard University
Gazette, September 19, 1999, pp. 1-3. Retrieved July 10, 2006, from
http://www.hno.harvard.edu/gazette/1999/09.16/mozart.html
Davidson, C. W., & Powell, L. A. (1986, Sept-Oct). The effects of easy-listening background
music on the on-task-performance of fifth grade children. Journal of Educational
Research, 80 (1), 29-33.
Deasy, R. J. (2002). Critical links: Learning in the arts and student academic and social
development. Washington, DC: Arts Education Partnership.
Donlan, D. (1975). Writing to music: A content analysis of eighty spontaneous writings of high
school students. Documents in Psychology, 5, 343-344.
Dryden, S. (1992). The impact of instrumental music instruction on the academic achievement of
fifth grade students. Retrieved October 20, 2005, from ERIC database.
Eady, I., & Wilson, J. D. (2004, Winter). The influence of music on core learning. Education,
125, 243-248. Retrieved January 23, 2006, from ERIC database.
Eisner, E. W. (1998). Does experience in the arts boost academic achievement? National Society
for Education in Art and Design, 51-60.
Fiske, E. B. (2002). Champions of change: The impact of the arts on learning. Seattle,
Washington: New Horizons for Learning.
Flury, J. (2002, November 11). Thy will be done.... Perspective, 11, p. 1-3. Retrieved July 18,
2006, from http://www.educationnews.org/writers/jan/THY_WILL_BE_DONE.htm

319
Foundation for Music Literacy (2003). How music can dramatically affect your child's
development and life-time success: A summary of the current literature concerning music
and the mind. Retrieved July 8, 2006, from
http://www.pianowizard.com/media/pdfs/ChildrenandMusicResearch.pdf
Garson, G. D. (2006). Multiple regression. Retrieved April 22, 2006, from
http://www2.chass.ncsu.edu/garson/PA765/regress.htm
Gilleta, K. S., Vrbancic, M. I., Elias, L. J., & Saucier, D. M. (2003). A Mozart effect for women
on a mental rotations task. Perceptual and Motor Skills, 96, 1086-1092. Retrieved July 6,
2006, from ILLiad database.
Gouzouasis, P., Guhn, M., & Kishor, N. (n.d.). The relationship between achievement and
participation in music and achievement in core grade twelve academic subjects.
Retrieved July 3, 2006, from
http://bcmusiccoalition.homestead.com/Predict_music_pg_mg_v_B40C7.pdf
Haynes, S. E. (2003). The effect of background music on the mathematics test anxiety of college
algebra students. Retrieved October 20, 2005, from ERIC database.
Hetland, L. (2000, Fall/Winter). Listening to music enhances spatial-temporal reasoning:
Evidence of the "Mozart Effect". Retrieved July 5, 2006, from ERIC database.
Hodges, D. A., & O'Connell, D. S. (n.d.). The impact of music education on academic
achievement. Retrieved December 12, 2005, from
http://www.uncg.edu/mus/SoundsOfLearning/AcdemicAchievement.pdf
Hood-Mincey, H. (2005). An analysis of the influence of music on academic achievement in
urban education. Retrieved January 23, 2006, from OCLC FirstSearch database.

320
Horowitz, R. (2005, April). Connections: The arts and cognitive, social and personal
development. Retrieved May 15, 2006, from
http://www.artsconnection.org/sympHorowitz.html
Hui, K. (2004, November 12). Mozart effect in preschool children? Early Child Development
and Care, 176, 411-419. Retrieved July 3, 2006, from
http://www.metapress.com.ezproxy.lib.vt.edu:8080/media/84v16cpkgmcrxwbe1u5m/cont
ributions/l/5/7/0/l570534332165887_html/fulltext.html
Ingram, D., & Reidel, E. (2003). Arts for academic achievement: What does integration do for
students? University of Minnesota: Center for Applied Research and Educational
Improvement, College of Education and Human Development.
Jaffers, S. E. (2006, Spring). The intersection of informal and formal music learning practices.
International Journal of Community Music, pp.1-29. Retrieved October 27, 2006, from
http://www.intljcm.com/articles/Volume%204/Jaffurs%20Files/Jaffurs.pdf
Jensen, E. (2001). Arts with the brain in mind. Alexandria, Virginia: Association for Supervision
and Curriculum Development.
Koppelman, D., & Imig, S. (1995). The effect of music on children's writing content. Retrieved
July 7, 2006, from ERIC database.
LaRussa, T. (2006, Sunday, February 26). Many schools getting back to the basics in education.
Retrieved July 14, 2006, from
http://pittsburglive.com/x/pittsburghtrib/news/specialreports/enterprise2006/print_427041
Levy, Y. (n.d.). The effects of background music on learning: A review of recent literature.
Retrieved July 6, 2006, from
http://edweb.sdsu.edu/Courses/Ed690DRExamples/LitRev/Levy.htm

321
Lichtenstein Creative Media (2002, December 28). The infinite mind: Music and the mind.
Retrieved December 30, 2005, from http://www.lcmedia.com/mind250.htm
Linton, M. (1999, March). The Mozart effect. First Things, 91, 10-13. Retrieved July 10, 2006,
from http://print.firstthings.com/ftissues/ft9903/linton.html
Mason, C., Steedly, K., & Thormann, M. (n.d.). Arts integration: How do the arts impact social,
cognitive, and academic skills? Retrieved December 2005, from ERIC database.
Mavrogenes, N. A., & Bezrucko, N. (1994). A study of the writing of fifth-grade disadvantaged
children. Journal of Educational Research, 87 (4), 228-238.
McLelland, M. J. (2005, January). The impact of instrumental music on student academic
achievement. Retrieved October 20, 2006, from ERIC database.
Morrison, S. J. (1994). Music students and academic growth. Music Educators Journal, 81 (2),
33-36.
Music Educators National Conference (1994a). Fast facts from arts education in public
elementary and secondary schools: A report from the National Center for Education
Statistics. Retrieved January 28, 2006, from
http://www.menc.org/information/advocate/ncesrept.html
Music Educators National Conference (1994b). Music education. Retrieved July 18, 2006, from
http://en.wikipedia.org/wiki/Music_education
Music Educators National Conference (2002, Spring). Benefits of music education in our
schools. Retrieved January 8, 2006, from
http://www.childrensmusicworkshop.com/advocacy/benefits.html
322
Music for All Foundation (2004). The sound of silence - The unprecedented decline of music
education in California public schools: A statistical review. Retrieved September 9,
2006, from http://music-for-all.org/sos.html
Nantais, K. M., & Schellenberg, E. G. (1999, July). The Mozart Effect: An artifact of preference.
Psychological Science, 10, pp. 370-373. Retrieved July 4, 2006, from EJournals database.
National Arts Education Consortium (n.d.). Transforming education through the arts challenge:
Final project report. The Ohio State University, Columbus, OH: The National Arts
Education Consortium.
National Data Resource Center (1992). National education longitudinal study. National
Education Longitudinal Study, 88, second follow-up. Retrieved Virginia Tech, from
ERIC database.
No Child Left Behind (n.d.). No Child Left Behind. Retrieved July 18, 2006, from
http://www.whitehouse.gov/news/reports/no-child-left-behind.html#2
Patten, A. T. (1999, Sept/Oct). The serene sound of success. Priorities, 3. Retrieved July 10,
2006, from www.franklincovey.com
Potosky, A., & Gridley, C. (1986). Testimony to music. Reston, Virginia: Music Educators
National Conference.
PTA (2005). Parent involvement in promoting arts education. Retrieved January 28, 2006, from
http://www.pta.org/archive_artcile_details_1117567150375.html
Quinn, C. L. (2003, November). Anatomy of a budget cut: For boards faced with tough financial
choices, maintaining credibility is critical. School Spending: An Online Anthology from
ASBJ, pp. 1-5. Retrieved July 18, 2006, from
http://www.asbj.com/schoolspending/Quinn.html

323
Rabkin, N., & Redmond, R. (2004). Putting the arts in the picture: Reframing education in the
21st century. Chicago: Columbia College.
Rauscher, F. H. (1997). A cognitive basis for the facilitation of spatial-temporal cognition
through music instruction. In V. Brummett (Ed.), Ithaca conference '96 music as
intelligence: A sourcebook (pp. 31-44). Ithaca: Ithaca College Press.
Rauscher, F. H. (1999, Fall). Music exposure and the development of spatial intelligence in
children. Bulletin of the Council for Research in Music Education, (142), 35-47.
Rauscher, F. H. (2000, August). Is the Mozart effect "debunked"? Poster presented at the bi-
annual meeting of the International Conference on Music Perception and Cognition,
Keele University, Keele, UK.
Rauscher, F. H. (2003a). Effects of piano, rhythm, and singing instruction on the spatial
reasoning of at-risk children. Retrieved July 8, 2006, from Proceeding of the European
Society for the Cognitive Sciences of Music, Hannover, Germany; Hannover University
Press.
Rauscher, F. H. (2003b, September). Can music instruction affect children's cognitive
development? ERIC Digest. Retrieved October 26, 2005, from ERIC database.
Rauscher, F. H., & Shaw, G. L. (1998). Key components of the Mozart effect. Perceptual and
Motor Skills, 83 (3, Part 1), 835-841.
Rauscher, F. H., & Zupan, M. A. (2000). Classroom keyboard instruction improves kindergarten
children's spatial-temporal performance: A field experiment. Early Childhood Research
Quarterly, 15 (2), 215-228.
Rauscher, F. H., Shaw, G. L., & Ky, K. N. (1993, October). Music and spatial task performance.
Nature, 365 (14), 611.

324
Rauscher, F. H., Shaw, G. L., & Ky, K. N. (1994, December). Listening to Mozart enhances
spatial-temporal reasoning: towards a neurophysical basis. Retrieved January 23, 2006,
from ERIC database.
Rauscher, F. H., Shaw, G. L., Levine, L. J., Wright, E. L., Dennis, W. R., & Newcomb, R. L.
(1997, February). Music training causes long-term enhancement of preschool children's
spatial-temporal reasoning. Neurological Research, 19, 2-8.
Sampled School District (2001a). Class Rankings/Grade Point Averages/Honor Graduates.
Policies and Procedures Manual: Sampled School District.
Sampled School District (2001b). Student attendance. Policies and Procedures Manual:
Sampled School District.
Sampled School District (2001c). Student discipline. Policies and Procedures Manual: Sampled
School District.
Sampled School District (2006). Demographics and student achievement profiles at a glance
2005-2006: Sampled School District.
Schmidtlein, J. (1997). Preliminary estimates from the 1996 national household survey on drug
abuse. Retrieved July 25, 2006, from
http://www.marininstitute.org/Youth/alcohol_youth.htm
Schneider, T. W., & Klotz, J. (2000, Fall). The impact of music education and athletic
participation on academic achievement. Retrieved October 20, 2005, from the ERIC
database.
Shaw, G. L. (2004). Keeping Mozart in mind (2nd ed.). San Diego, California: Elsevier
Academic Press.

325
Siribhakdi, K. (2006, April 16). Family matters; Mozart for your toddlers. Retrieved June 30,
2006, from http://global.factiva.com.ezproxy.lib.vt.edu:8080/ha/default.aspx
Solso, R. L., Johnson, H. H., & Beal, K. M. (1998). Experimental psychology: A case approach
(6th ed.). New York: Longman.
Steele, K. M., Bass, K. E., & Crook, M. D. (1999, July 1999). The mystery of the Mozart effect:
Failure to Replicate. Psychological Science, 10, pp. 366-369. Retrieved July 4, 2006,
from EJouranls database.
Texas Commission on Drug and Alcohol Abuse (1998). Secondary student's drug and alcohol
abuse report. Houston, TX: Houston Chronicle.
The College Board (1998a). 1998 College-Bound seniors: State profile report (Virginia ed.).
New York: College Board.
The College Board (1998b). College-Bound Seniors: Total Group Profile Report. New York:
College Board.
The College Board (2000a). 2000 College-Bound Seniors: Total Group Profile Report. New
York: College Board.
The College Board (2000b). 2000 College-Bound seniors: State profile report (Virginia ed.).
New York: College Board.
The College Board (2005a). 2005 College-Bound seniors: State profile report (Virginia ed.).
New York: College Board.
The College Board (2005b). 2005 College-Bound seniors: Total Group profile report (National
Report ed.). New York: College Board.
The College Board (2005c). About PSAT/NMSQT. Retrieved September 21, 2006, from
http://www.collegeboard.com/student/testing/psat/about.html

326
The GRAMMY Foundation: Leonard Bernstein Center for Learning (2004). Artful learning: A
school reform model. Retrieved May 27, 2006, from http://artfullearning.com/index.html
The Partnership for Family Involvement in Education, the U.S. Department of Education, and
the GTE Foundation (n.d.). The study of opportunities for and barriers to family
involvement in education. Retrieved January 28, 2006, from
http://www.projectappleseed.org/barriers.html
Tillmann, J. D., & Ford, L. (1996, March 15). African American family involvement in early
childhood special education programs. Retrieved June 4, 2005, from
http://eric.ed.gov/ERICWebPortal/Home.portal?_nfpb=true&eric_viewStyle=list&N...
University of Newcastle upon Tyne (2002, November 13). How to perform and interpret
regression analysis. Retrieved October 29, 2006, from
http://www.ncl.ac.uk/iss/statistics/docs/regression.html
University of Washington (n.d.). The Musical Brain. Retrieved July 2, 2006, from
http://faculty.washington.edu/chudler/music.html
Vaughn, K. (2000). Music and mathematics: Modest support for the oft-claimed relationship.
Journal of Aesthetic Education, 34 (3-4), 149-166.
Virginia Commission for the Arts (1994, September - December). Arts education means business
[Arts education advocacy information] Resources & talking points: statistics, research,
quotations, economic impact sources & publications. Richmond, Virginia.
Virginia Department of Education (1999, December 9). Virginia Department of Education
September 30, 1999 Student Membership PK-12. Retrieved July 19, 2006, from
http://www.doe.virginia.gov/VDOE/dbpubs/Fall_Membership/1999/fm016.html

327
Virginia Department of Education (2000). Virginia Standards of Learning Assessments: Virginia
Technical Report. Retrieved July 20, 2006, from http://www.pen.k12.us/go/Sols/html
Virginia Department of Education (2006a). Virginia Standards of Learning. Retrieved July 19,
2006, from http://www.doe.virginia.gov/VDOE/Superintendent/Sols/musicartsk-12.pdf
Virginia Department of Education (2006b, February 7). Virginia Department of Education
September 30, 2005 Student Membership PK-12. Retrieved July 19, 2006, from
http://www.doe.virginia.gov/VDOE/dbpubs/Fall_Membership/2005/fm_sch_sum.xls
Virginia Department of Education (2006c, January 23). Virginia Department of Education
September 30, 2005, Student Membership. Retrieved July 19, 2006, from
http://www.pen.k12.va.us/VDOE/dbpubs/Fall_Membership/2005/fm_div_grade.xls
Virginia Department of Education (n.d.a). Division of instruction: High school instructional
services. Retrieved July 25, 2006, from
http://www.doe.virginia.gov/VDOE/Instruction/high.html
Virginia Department of Education (n.d.b). Standards of learning currently in effect for Virginia
public schools. Retrieved July 25, 2006, from
http://www.pen.k12.va.us/VDOE/Superintendent/Sols/home.shtml
Von Zastrow, C. (2004). Academic atrophy: The condition of the liberal arts in America's public
schools. Washington, DC: Council for Basic Education.
Whitaker, V. L. (2005, February 9, 2005). The effects of the advancement via individual
determination on course taking patterns and achievement of high school students.
Retrieved May 30, 2006, from Virginia Tech Electronic Thesis and Dissertation database.
Wikipedia (n.d.). Music education. Retrieved July 18, 2006, from
http://en.wikipedia.org/wiki/Music_education

328
Wikipedia.org. (n.d.). Mozart Effect, History of. Retrieved July 8, 2006, from
http://www.geocities.com/god_bless_america_lyrics/mozart-effect.html
Zdzinski, S. F. (1996, Spring). Parental involvement, selected student attributes, and learning
outcomes in instrumental music. Journal of Research in Music Education, 44, pp. 34-48.

APPENDIX A

330
(1) Institutional Review BoardInitial Review Application
APPENDIX B
I.
Directions Type responses to all questions / requests below. It is recommended that you read through this document before completing. Do not leave a question blank unless directed. If a required question is not applicable to your study, explain why. Do not restrict your responses to the space provided. Provide a thorough response to each question. Be as specific as possible, keeping in mind that you are introducing the study to the IRB. Incomplete applications will result in requests for clarification from researchers and will cause delays in review and final approval.
Type responses in the designated shaded boxes or check the designated check boxes. Use non-technical language throughout your application. Federal regulations require IRB applications to be written in lay language at an 8th grade reading level. Do not use jargon or scientific terms in your explanations/descriptions.
Check for grammatical or typographical errors before submitting. Protocols with substantial errors will be returned for corrections.
This form must be completed and submitted (as a Word document) electronically. Submit all required documents (e.g., Review Form, Initial Review Application, all study forms requested within this application, and bio-sketches) to [email protected]. For questions, contact Carmen Green, IRB Administrator, at [email protected] or (540) 231-4358.
Section 1: General Information What is the Study Title: An Analysis of the Academic Achievement of Grade 12 Music Students and Non-Music Students in One Southeast Virginia Public School Division
[Note: If this protocol has been submitted to a federal agency for funding, the title of that application must match the title of this submission.]
Check this box if this study only involves the collection or study of existing data, documents, records, pathological specimens, or diagnostic specimens and respond only to the following sections within this document: Section 1: General Information; Section 2: Justification; Section 8: Confidentiality / Anonymity; Section 14: Research Involving Existing Data; and Section 15: Additional Information below (Note: Section 15 is optional). 1. Will this research involve collaboration with another institution?
No Yes
If yes,
A. Provide the name of the institution(s):
B. Indicate the status of this research project with the other institution’s IRB: Pending approval Approved [submit approval letter with this IRB application] Other institution does not have a human subject protections review board Other, explain:
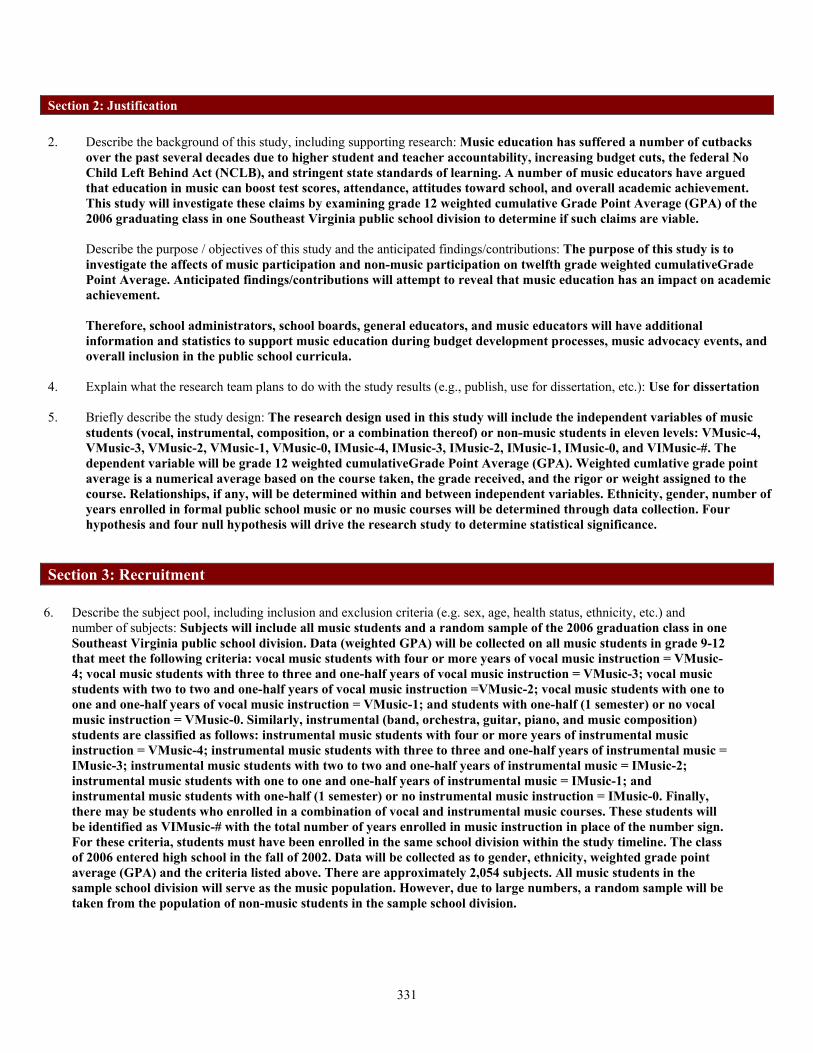
331
Section 2: Justification 2. Describe the background of this study, including supporting research: Music education has suffered a number of cutbacks
over the past several decades due to higher student and teacher accountability, increasing budget cuts, the federal No Child Left Behind Act (NCLB), and stringent state standards of learning. A number of music educators have argued that education in music can boost test scores, attendance, attitudes toward school, and overall academic achievement. This study will investigate these claims by examining grade 12 weighted cumulative Grade Point Average (GPA) of the 2006 graduating class in one Southeast Virginia public school division to determine if such claims are viable.
Describe the purpose / objectives of this study and the anticipated findings/contributions: The purpose of this study is to investigate the affects of music participation and non-music participation on twelfth grade weighted cumulativeGrade Point Average. Anticipated findings/contributions will attempt to reveal that music education has an impact on academic achievement. Therefore, school administrators, school boards, general educators, and music educators will have additional information and statistics to support music education during budget development processes, music advocacy events, and overall inclusion in the public school curricula.
4. Explain what the research team plans to do with the study results (e.g., publish, use for dissertation, etc.): Use for dissertation
5. Briefly describe the study design: The research design used in this study will include the independent variables of music students (vocal, instrumental, composition, or a combination thereof) or non-music students in eleven levels: VMusic-4, VMusic-3, VMusic-2, VMusic-1, VMusic-0, IMusic-4, IMusic-3, IMusic-2, IMusic-1, IMusic-0, and VIMusic-#. The dependent variable will be grade 12 weighted cumulativeGrade Point Average (GPA). Weighted cumlative grade point average is a numerical average based on the course taken, the grade received, and the rigor or weight assigned to the course. Relationships, if any, will be determined within and between independent variables. Ethnicity, gender, number of years enrolled in formal public school music or no music courses will be determined through data collection. Four hypothesis and four null hypothesis will drive the research study to determine statistical significance.
Section 3: Recruitment
6. Describe the subject pool, including inclusion and exclusion criteria (e.g. sex, age, health status, ethnicity, etc.) and number of subjects: Subjects will include all music students and a random sample of the 2006 graduation class in one Southeast Virginia public school division. Data (weighted GPA) will be collected on all music students in grade 9-12 that meet the following criteria: vocal music students with four or more years of vocal music instruction = VMusic-4; vocal music students with three to three and one-half years of vocal music instruction = VMusic-3; vocal music students with two to two and one-half years of vocal music instruction =VMusic-2; vocal music students with one to one and one-half years of vocal music instruction = VMusic-1; and students with one-half (1 semester) or no vocal music instruction = VMusic-0. Similarly, instrumental (band, orchestra, guitar, piano, and music composition) students are classified as follows: instrumental music students with four or more years of instrumental music instruction = VMusic-4; instrumental music students with three to three and one-half years of instrumental music = IMusic-3; instrumental music students with two to two and one-half years of instrumental music = IMusic-2; instrumental music students with one to one and one-half years of instrumental music = IMusic-1; and instrumental music students with one-half (1 semester) or no instrumental music instruction = IMusic-0. Finally, there may be students who enrolled in a combination of vocal and instrumental music courses. These students will be identified as VIMusic-# with the total number of years enrolled in music instruction in place of the number sign. For these criteria, students must have been enrolled in the same school division within the study timeline. The class of 2006 entered high school in the fall of 2002. Data will be collected as to gender, ethnicity, weighted grade point average (GPA) and the criteria listed above. There are approximately 2,054 subjects. All music students in the sample school division will serve as the music population. However, due to large numbers, a random sample will be taken from the population of non-music students in the sample school division.

332
7. How will subjects be identified to participate in this research study (If searching existing records to identify subjects, indicate whether the records are public or private. If private, describe the researcher’s privileges to the data)? Each subject in this research study graduated from the sampled school division in the spring of 2006. Each subject will be assigned a number by the researcher. No sampled school division identification information will be used. Exisiting records from which data will be gathered are public information and will be collected from the sampled school division's electronic student information system with permission of the division superintendent, research/data supervisor, and the technology department.
8. The IRB must ensure that the risks and benefits of participating in a study are distributed equitably among the general population and that a specific population is not targeted because of ease of recruitment. Provide an explanation for choosing this population: Participants in this study have the same chance at academic success in regard to course offerings including music and general curriculum courses within the same school division. The 2006 graduating class will provide adequate data to complete the study.
9. Describe recruitment methods, including how the study will be advertised or introduced to subjects [submit all advertising / recruitment forms (e.g., flyers/posters, invitation letter/e-mail, telephone recruitment script, etc.) with this IRB application]: Since data will be collected from existing (public) information from the sampled school divison's technology and statistical information offices, no recruitment methods or advertisements will be used.
Section 4: Requesting a Waiver for the Requirement to Obtain Signed Consent Forms from Participants This section (Section 4) not required for studies qualifying for exempt review Many minimal risk socio-behavioral research studies qualify for a waiver of the requirement for the investigator(s) to obtain signed consent forms from subjects [i.e., researcher does obtain verbal or implied (i.e., consent implied from the return of completed questionnaire) consent from subjects; however, does not obtain written consent from subjects]. Examples of types of research that typically qualify for this type of waiver are as follows: internet based surveys, anonymous surveys, surveys not requesting sensitive information, and oral history projects. You may request a waiver of signed consent for either some or all of the study’s procedures involving human subjects. 10. Are you requesting a waiver of the requirement to obtain signed consent forms from participants?
No, consent forms will be signed by all research participants prior to participating in all research procedures [submit consent document template(s) with this IRB application]
Yes If yes,
A. Select one of the criteria listed below and describe how your research meets the selected criteria:
Criteria 1: [Typically used for anonymous surveys] The only record linking the subject and the research would be the consent document and the principal risk would be potential harm resulting from a breach of confidentiality. Each subject will be asked whether the subject wants documentation linking the subject with the research, and the subject’s wishes will govern: Or
Criteria 2: The research presents no more than minimal risk of harm to subjects and involves no procedures for which written consent is normally required outside of the research context (e.g., sitting down and talking with someone, calling someone at home and asking everyday questions, mall survey, mail survey, internet survey, etc.):
Either selection of either Criteria 1 or Criteria 2 above, the IRB suggests and may require the investigator to provide subjects with a written or verbal (for telephone interviews) statement regarding the research, which should provide subjects with much of the same information that is required within a consent document. This is typically accomplished by providing subjects with an information sheet (i.e., a document similar to a consent form; however, does not request signatures), supplying the information within the invitation letter, or reading the information sheet to the subject over the phone.
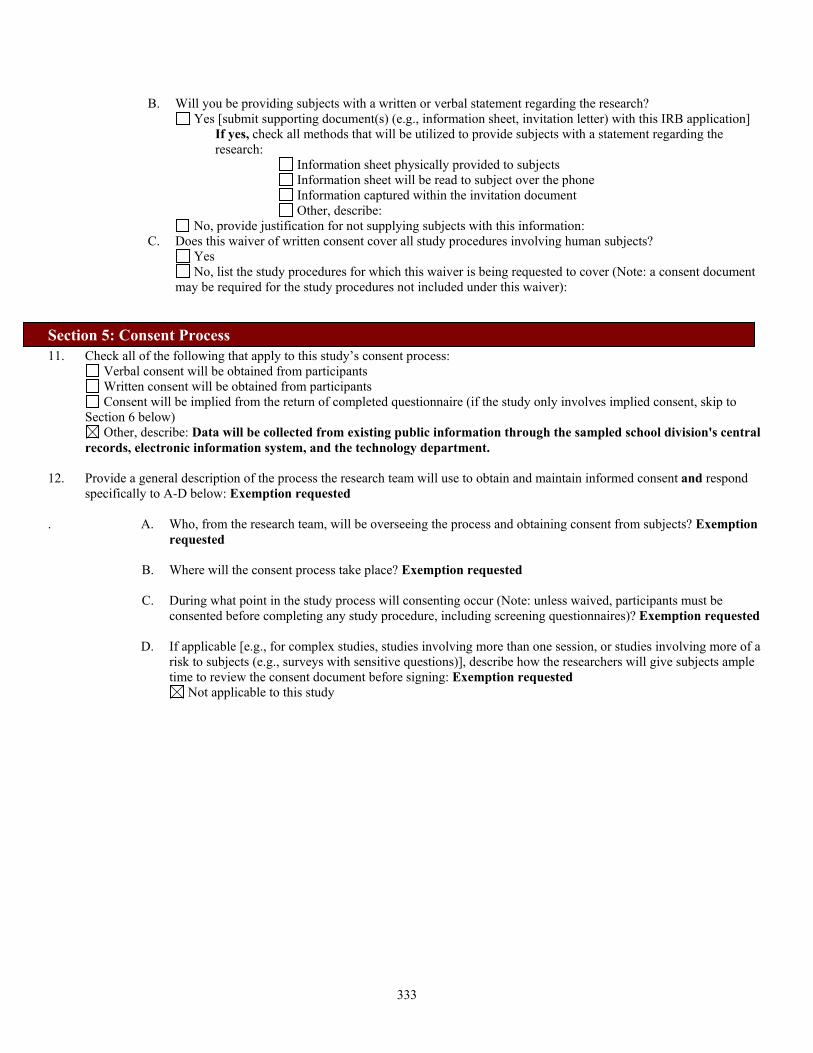
333
B. Will you be providing subjects with a written or verbal statement regarding the research? Yes [submit supporting document(s) (e.g., information sheet, invitation letter) with this IRB application]
If yes, check all methods that will be utilized to provide subjects with a statement regarding the research: Information sheet physically provided to subjects Information sheet will be read to subject over the phone Information captured within the invitation document Other, describe:
No, provide justification for not supplying subjects with this information: C. Does this waiver of written consent cover all study procedures involving human subjects?
Yes No, list the study procedures for which this waiver is being requested to cover (Note: a consent document
may be required for the study procedures not included under this waiver):
Section 5: Consent Process 11. Check all of the following that apply to this study’s consent process:
Verbal consent will be obtained from participants Written consent will be obtained from participants Consent will be implied from the return of completed questionnaire (if the study only involves implied consent, skip to
Section 6 below) Other, describe: Data will be collected from existing public information through the sampled school division's central
records, electronic information system, and the technology department.
12. Provide a general description of the process the research team will use to obtain and maintain informed consent and respond specifically to A-D below: Exemption requested
. A. Who, from the research team, will be overseeing the process and obtaining consent from subjects? Exemption requested
B. Where will the consent process take place? Exemption requested
C. During what point in the study process will consenting occur (Note: unless waived, participants must be consented before completing any study procedure, including screening questionnaires)? Exemption requested
D. If applicable [e.g., for complex studies, studies involving more than one session, or studies involving more of a risk to subjects (e.g., surveys with sensitive questions)], describe how the researchers will give subjects ample time to review the consent document before signing: Exemption requested
Not applicable to this study

334
Section 6: Procedures 13. Provide a step-by-step thorough explanation of all study procedures expected from study participants, including the length of
sessions involved, and total time commitment: Exemption requested
14.
Describe how data will be collected and recorded [submit all data documents (e.g., questionnaire, interview questions, etc.) with this IRB application]: Data will be collected, with permission, from the sampled school division's division Superintendent, research department, and technology department. Data will be recorded through SPSS 13 software and stored on the researcher's personal computer and/or flash drive/disk.
15.
Where will the study procedures take place? Exemption requested
Section 7: Risks and Benefits
Section 8: Confidentiality / Anonymity 20. Will the study release personally identifying study results to anyone outside of the research team (e.g., participants identified in
publications with individual consent)? No Yes
If yes,
To whom will identifying data be released?
16. What are the potential risks (e.g., emotional, physical, social, legal, economic, or dignity) to study participants? (do not state, “There are no risks involved.” Acceptable language = “There are no more than minimal risks involved.”) There are no more than minimal risks involved.
17. Does this study involve (check one box): minimal risk or more than minimal risk to study participants? Minimal risk means that the probability and magnitude of harm or discomfort anticipated in the research are not greater in and of themselves than those ordinarily encountered in daily activities or during the performance of routine physical or psychological examinations or tests.
18. Explain the study’s efforts to reduce the potential risks to subjects? Subjects will not be identified through previous or the sampled school division's indentification numbers. The researcher will assign each subject a new number to provide for anonymity. Therefore, the potential risk to subjects and the sampled school division is reduced to provide no more than minimal risk.
19. What are the direct or indirect anticipated benefits to study participants and/or society? Direct or indirect anticipated benefits/findings/contributions will attempt to reveal that music education has an impact of academic achievement as measured by grade twelve weighted cumulative grade point average. Therefore, school administrators, school boards, general educators, and music educators will have additional statistical information to support music education or not support music education during budget development processes, music advocacy events, and overall inclusion in the public school curricula.
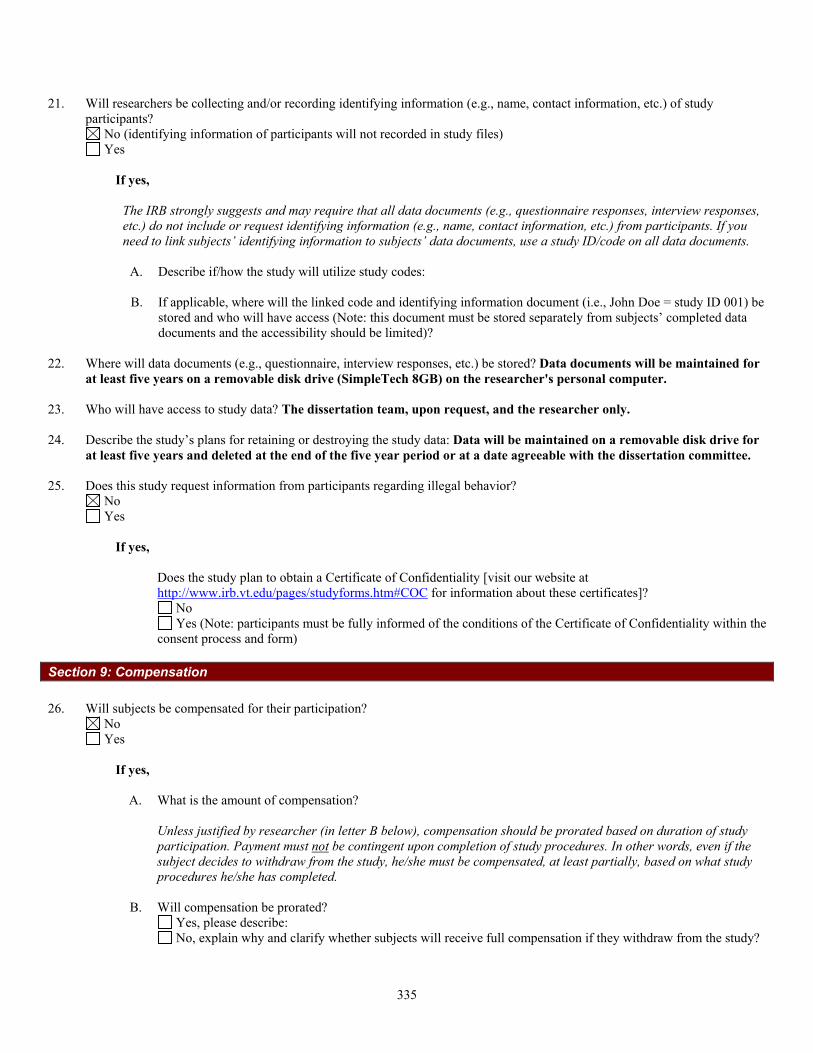
335
21. Will researchers be collecting and/or recording identifying information (e.g., name, contact information, etc.) of study participants?
No (identifying information of participants will not recorded in study files) Yes
If yes,
The IRB strongly suggests and may require that all data documents (e.g., questionnaire responses, interview responses, etc.) do not include or request identifying information (e.g., name, contact information, etc.) from participants. If you need to link subjects’ identifying information to subjects’ data documents, use a study ID/code on all data documents.
A. Describe if/how the study will utilize study codes:
B. If applicable, where will the linked code and identifying information document (i.e., John Doe = study ID 001) be stored and who will have access (Note: this document must be stored separately from subjects’ completed data documents and the accessibility should be limited)?
22. Where will data documents (e.g., questionnaire, interview responses, etc.) be stored? Data documents will be maintained for at least five years on a removable disk drive (SimpleTech 8GB) on the researcher's personal computer.
23. Who will have access to study data? The dissertation team, upon request, and the researcher only.
24. Describe the study’s plans for retaining or destroying the study data: Data will be maintained on a removable disk drive for at least five years and deleted at the end of the five year period or at a date agreeable with the dissertation committee.
25. Does this study request information from participants regarding illegal behavior? No Yes
If yes,
Does the study plan to obtain a Certificate of Confidentiality [visit our website at http://www.irb.vt.edu/pages/studyforms.htm#COC for information about these certificates]?
No Yes (Note: participants must be fully informed of the conditions of the Certificate of Confidentiality within the
consent process and form)
Section 9: Compensation 26. Will subjects be compensated for their participation?
No Yes
If yes,
A. What is the amount of compensation?
Unless justified by researcher (in letter B below), compensation should be prorated based on duration of study participation. Payment must not be contingent upon completion of study procedures. In other words, even if the subject decides to withdraw from the study, he/she must be compensated, at least partially, based on what study procedures he/she has completed.
B. Will compensation be prorated? Yes, please describe: No, explain why and clarify whether subjects will receive full compensation if they withdraw from the study?

336
Section 10: Audio / Video Recording 27. Will your study involve video and/or audio recording?
No Yes
If yes,
A. Select from the drop-down box select one
B. Provide compelling justification for the use of audio/video recording:
C. How will data within the recordings be retrieved / transcribed?
D. Where will tapes be stored?
E. Who will have access to the recordings?
F. Who will transcribe the recordings?
G. When will the tapes be erased / destroyed?
Section 11: Research Involving Students 28. Does your study include students as participants?
No (if no, skip to Section 12 below) Yes
If yes,
A. This study involves (select all that apply): Students in elementary, junior or high school (or equivalent) College students (select all that apply):
College upperclassmen (Juniors, Seniors or Graduate Students) College freshmen – please note that some college freshmen may be minors (under the age of 18). If the study meets the specified criteria, the IRB may grant a waiver of parental permission to include these minors without individual guardian permission [see question 32B for further information]. Select one of the following: These minors will be included in this research Minors will be excluded from this study. Describe how the study will ensure that minors will not be included: NOTE: Data collection includes information (gender, ethnicity, GPA, and number of years enrolled in or not enrolled in formal music education courses) from 2006 graduates of the sampled school division that were enrolled in the fall of 2002 to the spring of 2006.
B. Does this study involve conducting research with students of the researcher? (Note: If it is feasible to use students from a class of students not under the instruction of the researcher, the IRB recommends and may require doing so):
No Yes, describe safeguards the study will implement to protect against coercion or undue influence for
participation:

337
C. Will the study need to access student records (e.g., SAT or GRE scores, or student GPA scores)? No Yes [if yes, a separate signed consent/assent form (for student’s approval) and permission form (for
parent’s approval if subject is a minor) must be obtained and submitted to the Registrar’s office] [submit consent form template(s) with this IRB application]
Section 11A: Students in Elementary, Junior, or High School [Answer questions 29 & 30 below if your study involves students in elementary, junior or high school (or equivalent)] 29. Will study procedures be completed during school hours?
No Yes
If yes,
A. Students not included in the study may view other students’ involvement with the research during school time as unfair. Address this issue and how the study will reduce this outcome:
B. Missing out on regular class time or seeing other students participate may influence a student’s decision to participate. Address how the study will reduce this outcome:
30. You will need to obtain school approval. This is typically granted by the Principal or Assistant Superintendent and classroom teacher. Approval by an individual teacher is insufficient. School approval, in the form of a letter or a memorandum should accompany the approval request to the IRB. Is the approval letter(s) attached to this submission? Yes or No, if no, explain why:
Section 11B: College Students [Answer question 31 below if your study involves college students] 31. Will extra credit be offered to subjects?
No Yes
If yes,
A.
Include a description of the extra credit to be provided in Section 9: Compensation above
B. What will be offered to subjects as an equal alternative to receiving extra credit without participating in this study?
Section 12: Research Involving Minors For more information about involving minors in research, visit our website at http://www.irb.vt.edu/pages/newstudy.htm#Minors 32.
Does your study involve minors (under the age of 18) (Note: age constituting a minor may differ in other States)? No Yes
If yes,
A. The procedure for obtaining assent from these minors and permission from the minor’s guardian(s) should have been described in Section 5 (Consent Process) in this form.
Researchers may request a waiver of parental permission if the study meets the criteria specified under letter B below. Requesting a waiver for the requirement to obtain informed permission from guardians may be helpful when recruiting college students for minimal risk socio/behavioral research. Most studies involving minors must obtain parental permission prior to the recruitment of minors.

338
B. Are you requesting a waiver of parental permission? No, parents/guardians will provide their permission Yes, describe below how your research meets all of the following criteria: A) The research involves no more than minimal risk to the subjects: Subjects will not be identified by
existing sampled school division identification numbers or by name. B) The waiver will not adversely affect the rights and welfare of the subjects: Subjects are 2006 graduates
of the sampled school division. C) The research could not practicably be carried out without the waiver: The 2,054 subjects graduated in
the spring of 2006 from the sampled school division. Many students are currently studying at the university level or have joined the workforce. Gaining parent permission and/or student permission would be virtually impossible. Existing data is public information.
D) (Optional) Subjects will be provided with additional pertinent information after participation: No
C. Does your study reasonably pose a risk of reports of current threats of abuse and/or suicide? No Yes, thoroughly explain how the study will react to these reports (Note: subjects must be fully informed of the
fact that researchers must report reasonable threats of abuse or suicide to the appropriate authorities/persons in the Confidentiality section of the Consent or Permission documents):
Section 13: Research Involving Deception For more information about involving deception in research and for assistance with developing your debriefing form, visit our website at http://www.irb.vt.edu/pages/newstudy.htm#Deception 33. Does your study involve deception?
No Yes
If yes,
A. Describe the deception:
B. Why is the use of deception necessary for this project?
C. Describe the process of debriefing [submit your debriefing form with this IRB application]:
D. By nature, studies involving deception cannot provide subjects with a complete description of the study during the consent process; therefore, the IRB must waive a consent process which does not include, or which alters, some or all of the elements of informed consent. Provide an explanation of how the study meets all the following criteria for an alteration of consent:
A) The research involves no more than minimal risk to the subjects: B) The alteration will not adversely affect the rights and welfare of the subjects: C) The research could not practicably be carried out without the alteration: D) (Optional) Subjects will be provided with additional pertinent information after participation (i.e.,
debriefing for studies involving deception):
The IRB requests that the researcher use the title “Information Sheet” instead of “Consent Form” on the document used to obtain subjects’ signatures to participate in the research. This will adequately reflect the fact that the subject cannot fully consent to the research without the researcher fully disclosing the true intent of the research.

339
Section 14: Research Involving the Collection or Study of Existing Data Documents, Records, Pathological Specimens, or Diagnostic Specimens 34. Will your study involve the collection or study of existing data?
No Yes
If yes,
A. From where does the existing data originate? Existing data originates from the sampled school division's electronic student information system and central records. The technology department will be instrumental in retrieving requested data.
B. Provide a description of the existing data that will be collected: The following data will be collected: gender, ethnicity, grade twelve weighted cumulative grade point average, type (vocal, instrumental, composition or no formal music instruction) and total number of years each subject was enrolled or not enrolled in formal music education courses.
Section 15: Additional Information 35. Provide additional information not captured within this worksheet here [response to this question not required]:

340
APPENDIX C
Directions This form must be typed and submitted (as a Word document) to the IRB office electronically along with the other required documents (e.g., Initial Review Application, all study forms relating to human subjects, and bio-sketches of investigators) to [email protected]. In addition to submitting electronically, this form, signed by all appropriate parties, must be received by the IRB office before the submission is processed. Mail or deliver the original signed copy of this form to: IRB, Virginia Tech, Office of Research Compliance, 1880 Pratt Drive, Suite 2006 (0497), Blacksburg, VA 24061. To speed up the approval process, signed Review Forms may be scanned or faxed [(540) 231-0959] to the IRB office; however, the original signatures must also be mailed or delivered to the IRB office for documentation.
Section 1: Contact Information Principal Investigator [Faculty or Faculty Advisor] (all fields required) HST = Human Subjects Training
Name: Dr. Travis Twiford
PID: ttwiford What is a PID? (scroll over)
HST completed through: VT in-class training
Department: Virginia Tech/ELPS
Email: [email protected] Mail Code:
____ Signature on file______________________________________ __________________ Signature of Principal Investigator Date
Co-Investigator(s) [Faculty or Student] (all fields required for each Co-Investigator) Co-Investigator #1 Name: George Darryl Waller Organization Name: Virgnia Tech/ELPS
PID: gdwaller Email: [email protected]
HST completed through: VT in-class training
____Signature on file______________________________________ __________________ Signature of Co-Investigator #1 Date
Co-Investigator #2 Name: Organization Name:
PID: Email:
HST completed through: select source
___________________________________________ __________________ Signature of Co-Investigator #2 Date
Co-Investigator #3 Name: Organization Name:
PID: Email:
HST completed through: select source
___________________________________________ __________________ Signature of Co-Investigator #3 Date
Co-Investigator #4 Name: Organization Name:
PID: Email:
HST completed through: select source
___________________________________________ __________________
Signature of Co-Investigator #4 Date
Request for Exempt Review
Institutional Review Board

341
Departmental Reviewer: (not required for all departments) Name:
PID:
___________________________________________ Signature of Departmental Reviewer
__________________ Date
Section 2: General Information 1. Project Title: An Analysis Of The Academic Achievement Of Grade 12 Music Students And Non-Music Students In One Southeast Virginia Public School Division
Enter title as you would like it to appear on the official IRB approval letter.
2. Number of Human Subjects: 2,054 (attrition may have occurred) 3. Do any of the investigators on this project have a reportable conflict of interest? No If yes, explain:
All investigators of this project are qualified through completion of human subject protections education. Visit our website at http://www.irb.vt.edu/pages/training.html to view training opportunities accepted by the VT IRB. (Note: Do not submit your IRB application until all investigators are qualified)
All investigators listed on this project, along with the departmental reviewer (if applicable), have reviewed this IRB application and all requested revisions from these parties have been implemented into this submission. (Note: Do not submit your application until all parties have reviewed and signed off on the final draft of the materials)
Section 3: Source of Funding 4. Source of Funding Support (check one box): Departmental Research [if Dept. Research, skip to Section 4] Sponsored Research, including VARIOUS funds & OSP/VT foundation funds [if Sponsored Research, respond to letters A-D below]
A. Name of Sponsor [if NIH, specify department]: B. Title of study as listed on OSP application: C. OSP number: * Proposal # (enter 8 digit number, no dashes/spaces): , OR
* Grant # (enter 6 digit number, no dashes/spaces): , OR * OSP # pending (check box if pending):
D. Is this project receiving federal funds (e.g., DHHS, DOD, etc.)? select one
Section 4: Exemption Criteria Note: To qualify for Exemption, the research must meet all of the following criteria (a – f): (a) Be of minimal risk to the subjects; AND (b) Must not involve pregnant women, prisoners or mentally impaired persons; AND (c) Must not include survey research with minors unless involving standard educational activities (e.g., educational tests) within the particular
education system; AND (d) Must not include observation of a minor’s public behavior unless there is no researcher interaction, AND (e) Research must not involve video or audio recording of subjects; AND (f) must be in one or more of the following categories:

342
5. Please mark/check the appropriate category or categories below which qualify the proposed project for exemption:
1. Research will be conducted in established or commonly accepted educational settings, involving normal educational practices, such as (a) research on regular and special education instructional strategies, or (b) research on the effectiveness or the comparison among instructional techniques, curricula, or classroom management methods.
2. Research will involve the use of educational tests (cognitive, diagnostic, aptitude, achievement), survey procedures, interview procedures or observation of public behavior, unless the subjects can be identified directly or through identifiers linked to the subjects and disclosure of responses could reasonably place the subjects at risk or criminal or civil liability or be damaging to the subjects’ financial standing, employability or reputation.
3. Research will involve the use of educational tests (cognitive, diagnostic, aptitude, achievement), survey procedures, interview procedures, or observation of public behavior that is not exempt under item (2) above, if (a) the subjects are elected or appointed public officials or candidates for public office; or (b) Federal statute(s) require(s) that the confidentiality or other personally identifiable information will be maintained throughout the research and thereafter.
4. Research will involve the collection or study of existing data, documents, records, pathological specimens, or diagnostic specimens, if these sources are publicly available or if the information is recorded by the investigator in such a manner that subjects cannot be identified directly or through identifiers linked to the subjects.
5. Research and demonstration projects which are conducted by or subject to the approval of federal agency sponsoring the research, and which are designed to study, evaluate or otherwise examine (a) public benefit or service programs, (b) procedures for obtaining benefits or services under those programs, (c) possible changes in or alternatives to those programs or procedures, or (d) possible changes in methods or levels of payment for benefits or services under those programs.
6. Taste and food quality evaluation and consumer acceptance studies, if (a) wholesome foods without additives are consumed, or if (b) a food is consumed that contains a food ingredient at or below the level and for a use found to be safe, by the Food and Drug Administration or approved by the Environmental Protection Agency or the Food Safety and Inspection Service of the U.S. Department of Agriculture.

APPENDIX D

344
APPENDIX E
Date: September 20, 2006
SAMPLED SCHOOL DIVISION RESEARCH AND PROGRAM EVALUATION SERVICES
APPLICATION FOR RESEARCH AUTHORIZATION Name of Applicant: George Darryl Waller Mailing Address: 108 Wendy Court Newport News, Virginia Position Supervisor of Music Telephone 757-591-4561 NNPS School or Office Administration Building email [email protected] 1. Title of proposed project: An Analysis of the Academic Achievement of Grade 12 Music Students and Non-Music Students In One Southeast Virginia Public School Division 2. Statement of problem to be researched (simply, what are you trying to find out?):Does music education have an impact on academic achievement? What impact does music or non-music participation have on Grade 12 weighted grade point average, the number of absences, and the number of discipline referrals? 3. School or location where project is proposed to be carried out:All high schools (the 2006 graduating class) 4. List testing or survey instruments being used for this research. Attach a copy of all instrument(s).All data will be entered in SPSS 13 for analysis. No identification of students or the sample school division will be made throughout the project. Three dependent variables will serve as the survey instrument in this study - Grade 12 weighted grade point average, the number of absences, and discipline referrals. Descriptive statistics will be collected to include: gender, ethnicity, total number of years enrolled or not enrolled in formal music education courses in grades 9-12.

345
5. List resources and support being requested (time, participation of groups, etc.):I request the assistance of the technology department in securing requested data. The sample population is 2006 graduates. Data collection through the technology department will be critical. 6. Will you be conducting research requiring an Informed Consent Form?
If yes, attach a copy of your Informed Consent Form. Yes
No XX 7. Estimate of timeframe planned to complete the proposed project: Data collection completed by December 15, 2006. Final defense in March/April 2007. 8. How will participation in this project benefit students or advance the professional knowledge of teachers?This project will benefit students or advance the professional knowledge of teachers through increased awareness of music and music education. If music education is found to benefit students academically, music and arts integration techniques can be fused into curricula and classroom instruction to improve academic test scores for all students. If music education is found not to benefit students academically, a complete music program audit will be proposed.
9. What is the purpose of your research? (Please check all that apply.)
Graduate / Undergraduate Work (College or University) Virginia Tech X Doctoral Dissertation
If this proposal is for a project at the doctoral level, please attach an abstract of the research proposal. Educational Project (Specify Type) Educational Grant (Grant Agency) Publication (Specify Type) Personal Research Other (Specify Type) FOR OFFICE USE ONLY Signature on file Date Received Applicant's Signature 20-Sep-06 Signature on file Authorization Approved X 20-Sep-06 Date 20-Oct-06 Not Approved Date
346
APPENDIX F
_________________________________________________________ Accountability Department Dr. Daniel Curry-Corcoran, Director
November 20, 2006
Mr. George Darryl Waller 108 Wendy Court Newport News, VA Dear Mr. Waller: It is my pleasure to inform you that the Research Authorization Committee has approved your request to study the academic achievement of Grade 12 music and non-music students in Newport News Public Schools. Please remember that your research interests must remain confined to the provisions outlined in your research request form. Authorizations for additional research must first be submitted to the Research Authorization Committee. A copy of your research request form is attached for your reference. Please note that your study is approved to access and utilize relevant data files received from the Technology Department. Please include a copy of this letter to the eSIS help desk along with your eSIS data request form. No identifying student information will be available, e.g. name, student identification number, state testing identification number, or social security number, in the data files. It is important that the confidentiality of all students in your study remain protected as highlighted under the Family Educational Rights and Privacy Act (FERPA). The Research Authorization Committee requires that you use pseudonyms in place of the names of the school division and school in any documentation produced from your study. This precaution is taken to ensure the safety and anonymity of all personnel participating in the study, and add to the rigor and integrity of all reported results. I wish you much success on your dissertation, and look forward to reading the results of your final study. The Research Authorization Committee requests that a final draft of all research proposals be submitted to the chairperson upon completion. Please feel free to contact me at 591-4547 or at [email protected] with any additional questions.
Sincerely,
Daniel Curry-Corcoran, Ph.D. Research Authorization Committee Chair
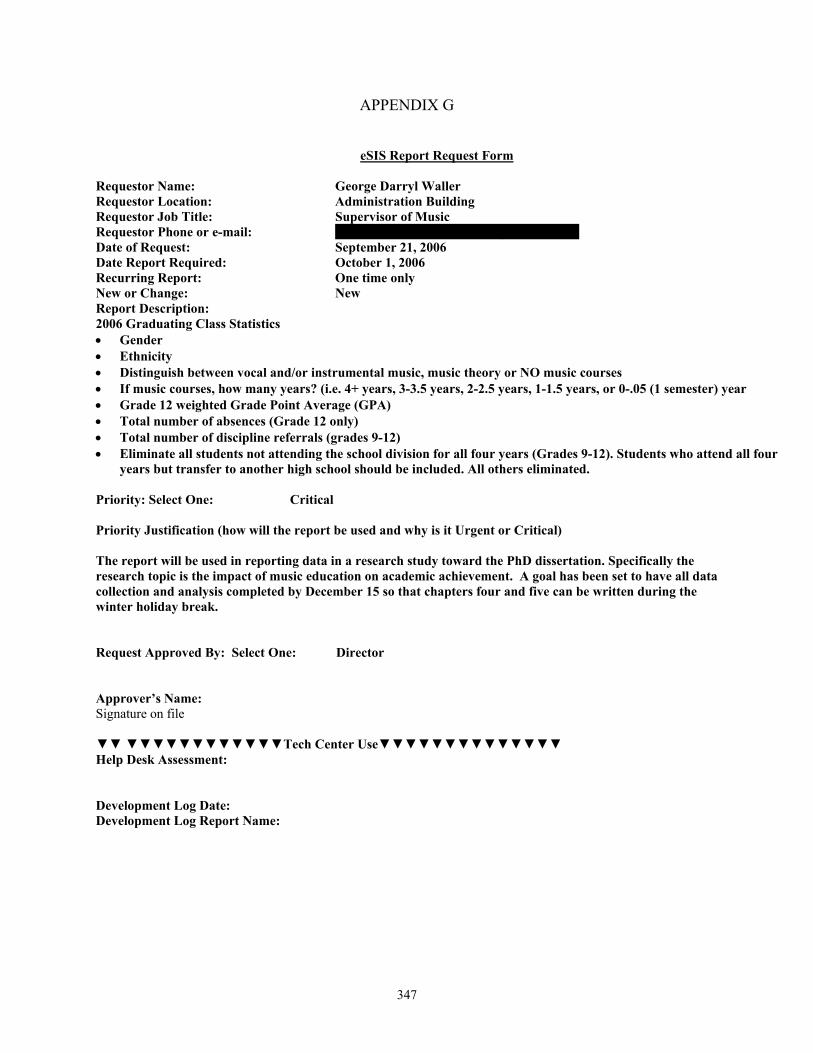
347
APPENDIX G
eSIS Report Request Form
Requestor Name: George Darryl Waller Requestor Location: Administration Building Requestor Job Title: Supervisor of Music Requestor Phone or e-mail: 757-591-4561 [email protected] Date of Request: September 21, 2006 Date Report Required: October 1, 2006 Recurring Report: One time only New or Change: New Report Description: 2006 Graduating Class Statistics • Gender • Ethnicity • Distinguish between vocal and/or instrumental music, music theory or NO music courses • If music courses, how many years? (i.e. 4+ years, 3-3.5 years, 2-2.5 years, 1-1.5 years, or 0-.05 (1 semester) year • Grade 12 weighted Grade Point Average (GPA) • Total number of absences (Grade 12 only) • Total number of discipline referrals (grades 9-12) • Eliminate all students not attending the school division for all four years (Grades 9-12). Students who attend all four
years but transfer to another high school should be included. All others eliminated. Priority: Select One: Critical Priority Justification (how will the report be used and why is it Urgent or Critical) The report will be used in reporting data in a research study toward the PhD dissertation. Specifically the research topic is the impact of music education on academic achievement. A goal has been set to have all data collection and analysis completed by December 15 so that chapters four and five can be written during the winter holiday break. Request Approved By: Select One: Director Approver’s Name: Signature on file ▼▼ ▼▼▼▼▼▼▼▼▼▼▼▼Tech Center Use▼▼▼▼▼▼▼▼▼▼▼▼▼▼ Help Desk Assessment: Development Log Date: Development Log Report Name:

348
APPENDIX H
Figure 16. Scatter Plot.
Regression Standardized Predicted Value (x axis).
Dependent Variable: Grade Twelve Grade Point Average (y axis).
Figure 17. Scatter Plot.
Regression Standardized Residual (x axis).
Dependent Variable: Grade Twelve Grade Point Average (y axis).
420-2-4
Regression Standardized Residual
5.00
4.00
3.00
2.00
1.00
Gra
de 1
2 C
umul
ativ
e W
eigh
ted
Gra
dePo
int A
vera
ge
210-1
Regression Standardized Predicted Value
5.00
4.00
3.00
2.00
1.00
Gra
de 1
2 C
umul
ativ
e W
eigh
ted
Gra
dePo
int A
vera
ge

349
Figure 18. Scatter Plot.
Regression Deleted (Press) Residual (x axis).
Dependent Variable: Grade Twelve Grade Point Average (y axis).
Figure 19. Scatter Plot.
Regression Adjusted (Press) Predicted Value (x axis).
Dependent Variable: Grade Twelve Grade Point Average (y axis).
210-1-2
Regression Deleted (Press) Residual
5.00
4.00
3.00
2.00
1.00
Gra
de 1
2 C
umul
ativ
e W
eigh
ted
Gra
dePo
int A
vera
ge
3.403.203.002.802.602.402.20
Regression Adjusted (Press) Predicted Value
5.00
4.00
3.00
2.00
1.00
Gra
de 1
2 C
umul
ativ
e W
eigh
ted
Gra
dePo
int A
vera
ge
p g g

350
43210-1-2-3
Regression Studentized Residual
5.00
4.00
3.00
2.00
1.00
Gra
de 1
2 C
umul
ativ
e W
eigh
ted
Gra
dePo
int A
vera
ge
43210-1-2-3
Regression Studentized Deleted (Press) Residual
5.00
4.00
3.00
2.00
1.00
Gra
de 1
2 C
umul
ativ
e W
eigh
ted
Gra
dePo
int A
vera
ge
p g g
Figure 20. Scatter Plot.
Regression Studentized Residual (x axis).
Dependent Variable: Grade Twelve Grade Point Average (y axis).
Figure 21. Scatter Plot.
Regression Studentized Deleted (Press) Residual (x axis).
Dependent Variable: Grade Twelve Grade Point Average (y axis).
43210-1-2-3
Regression Studentized Residual
5.00
4.00
3.00
2.00
1.00
Gra
de 1
2 C
umul
ativ
e W
eigh
ted
Gra
dePo
int A
vera
ge
43210-1-2-3
Regression Studentized Deleted (Press) Residual
5.00
4.00
3.00
2.00
1.00
Gra
de 1
2 C
umul
ativ
e W
eigh
ted
Gra
dePo
int A
vera
ge
p g g

351
APPENDIX I
Figure 22. Scatter Plot.
Regression Standardized Predicted Value (x axis).
Dependent Variable: Grade Twelve Grade Point Average (y axis).
Figure 23. Scatter Plot.
Regression Standardized Residual (x axis).
Dependent Variable: Grade Twelve Grade Point Average (y axis).
420-2-4
Regression Standardized Predicted Value
5.00
4.00
3.00
2.00
1.00
Gra
de 1
2 C
umul
ativ
e W
eigh
ted
Gra
dePo
int A
vera
ge
420-2-4
Regression Standardized Residual
5.00
4.00
3.00
2.00
1.00
Gra
de 1
2 C
umul
ativ
e W
eigh
ted
Gra
dePo
int A
vera
ge

352
.
Figure 24. Scatter Plot.
Regression Deleted (Press) Residual (x axis).
Dependent Variable: Grade Twelve Grade Point Average (y axis).
Figure 25. Scatter Plot.
Regression Adjusted (Press) Predicted Value (x axis).
Dependent Variable: Grade Twelve Grade Point Average (y axis).
210-1-2
Regression Deleted (Press) Residual
5.00
4.00
3.00
2.00
1.00
Gra
de 1
2 C
umul
ativ
e W
eigh
ted
Gra
dePo
int A
vera
ge
3.403.203.002.802.602.402.20
Regression Adjusted (Press) Predicted Value
5.00
4.00
3.00
2.00
1.00
Gra
de 1
2 C
umul
ativ
e W
eigh
ted
Gra
dePo
int A
vera
ge

353
Figure 26. Scatter Plot.
Regression Studentized Residual (x axis).
Dependent Variable: Grade Twelve Grade Point Average (y axis).
Figure 27. Scatter Plot.
Regression Studentized Deleted (Press) Residual (x axis).
Dependent Variable: Grade Twelve Grade Point Average (y axis).
3210-1-2-3
Regression Studentized Residual
5.00
4.00
3.00
2.00
1.00
Gra
de 1
2 C
umul
ativ
e W
eigh
ted
Gra
dePo
int A
vera
ge
3210-1-2-3
Regression Studentized Deleted (Press) Residual
5.00
4.00
3.00
2.00
1.00
Gra
de 1
2 C
umul
ativ
e W
eigh
ted
Gra
dePo
int A
vera
ge

354
APPENDIX J
Figure 28. Scatter Plot.
Regression Standardized Predicted Value (x axis).
Dependent Variable: Grade Twelve Grade Point Average (y axis).
Figure 29. Scatter Plot.
Regression Standardized Residual (x axis).
Dependent Variable: Grade Twelve Grade Point Average (y axis).
210-1
Regression Standardized Predicted Value
5.00
4.00
3.00
2.00
1.00Gra
de 1
2 C
umul
ativ
e W
eigh
ted
Gra
dePo
int A
vera
ge
43210-1-2-3
Regression Standardized Residual
5.00
4.00
3.00
2.00
1.00Gra
de 1
2 C
umul
ativ
e W
eigh
ted
Gra
dePo
int A
vera
ge

355
Figure 30. Scatter Plot.
Regression Deleted (Press) Residual (x axis).
Dependent Variable: Grade 12 Grade Point Average (y axis).
Figure 31. Scatter Plot.
Regression Adjusted (Press) Predicted Value (x axis).
Dependent Variable: Grade Twelve Grade Point Average (y axis).
210-1-2
Regression Deleted (Press) Residual
5.00
4.00
3.00
2.00
1.00Gra
de 1
2 C
umul
ativ
e W
eigh
ted
Gra
dePo
int A
vera
ge
3.203.002.802.602.402.20
Regression Adjusted (Press) Predicted Value
5.00
4.00
3.00
2.00
1.00Gra
de 1
2 C
umul
ativ
e W
eigh
ted
Gra
dePo
int A
vera
ge

356
Figure 32. Scatter Plot.
Regression Studentized Residual (x axis).
Dependent Variable: Grade Twelve Grade Point Average (y axis).
Figure 33. Scatter Plot.
Regression Studentized Deleted (Press) Residual (x axis).
Dependent Variable: Grade Twelve Grade Point Average (y axis).
43210-1-2-3
Regression Studentized Residual
5.00
4.00
3.00
2.00
1.00Gra
de 1
2 C
umul
ativ
e W
eigh
ted
Gra
dePo
int A
vera
ge
43210-1-2-3
Regression Studentized Deleted (Press) Residual
5.00
4.00
3.00
2.00
1.00Gra
de 1
2 C
umul
ativ
e W
eigh
ted
Gra
dePo
int A
vera
ge

357
APPENDIX K
Figure 34. Scatter Plot.
Regression Standardized Predicted Value (x axis).
Dependent Variable: Number of Absences in Grade Twelve (y axis).
Figure 35. Scatter Plot.
Regression Standardized Residual (x axis).
Dependent Variable: Number of Absences in Grade Twelve (y axis)
20-2-4-6
Regression Standardized Predicted Value
100
80
60
40
20
0Num
ber o
f Abs
ence
s (1
2th
Gra
de O
nly)
p ( y)
6420-2
Regression Standardized Residual
100
80
60
40
20
0Num
ber o
f Abs
ence
s (1
2th
Gra
de O
nly)
p ( y)
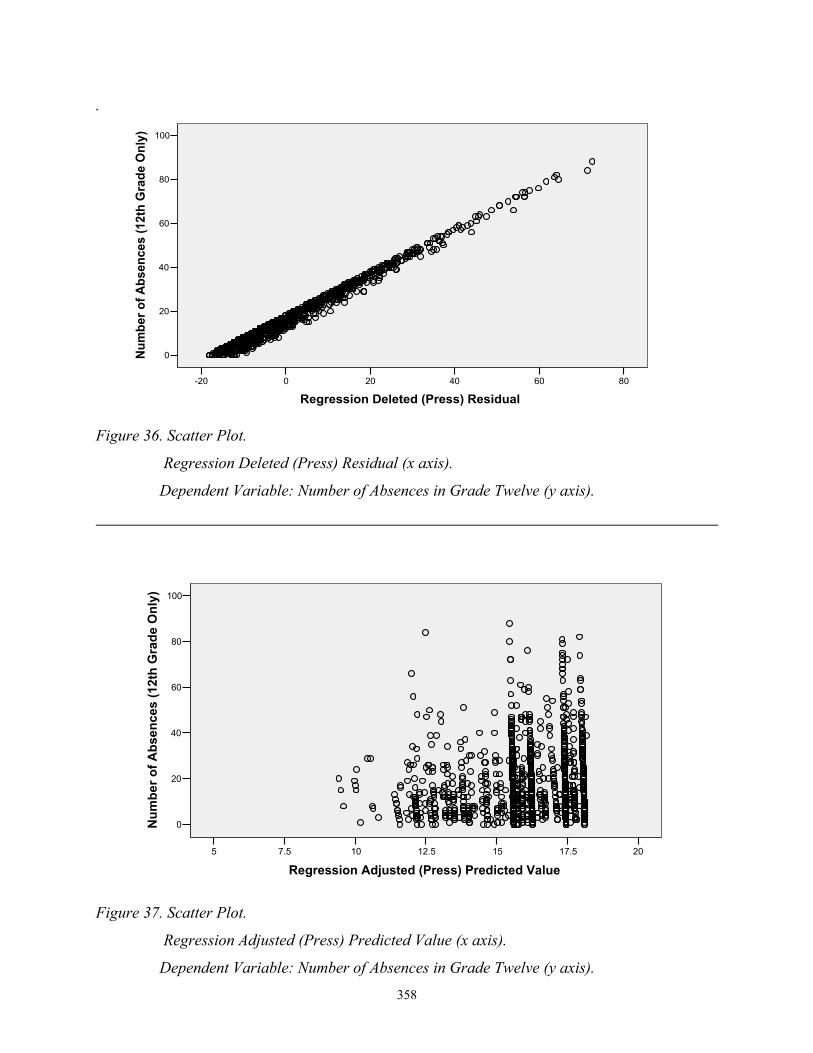
358
.
Figure 36. Scatter Plot.
Regression Deleted (Press) Residual (x axis).
Dependent Variable: Number of Absences in Grade Twelve (y axis).
.
Figure 37. Scatter Plot.
Regression Adjusted (Press) Predicted Value (x axis).
Dependent Variable: Number of Absences in Grade Twelve (y axis).
806040200-20
Regression Deleted (Press) Residual
100
80
60
40
20
0Num
ber o
f Abs
ence
s (1
2th
Gra
de O
nly)
2017.51512.5107.55
Regression Adjusted (Press) Predicted Value
100
80
60
40
20
0Num
ber o
f Abs
ence
s (1
2th
Gra
de O
nly)
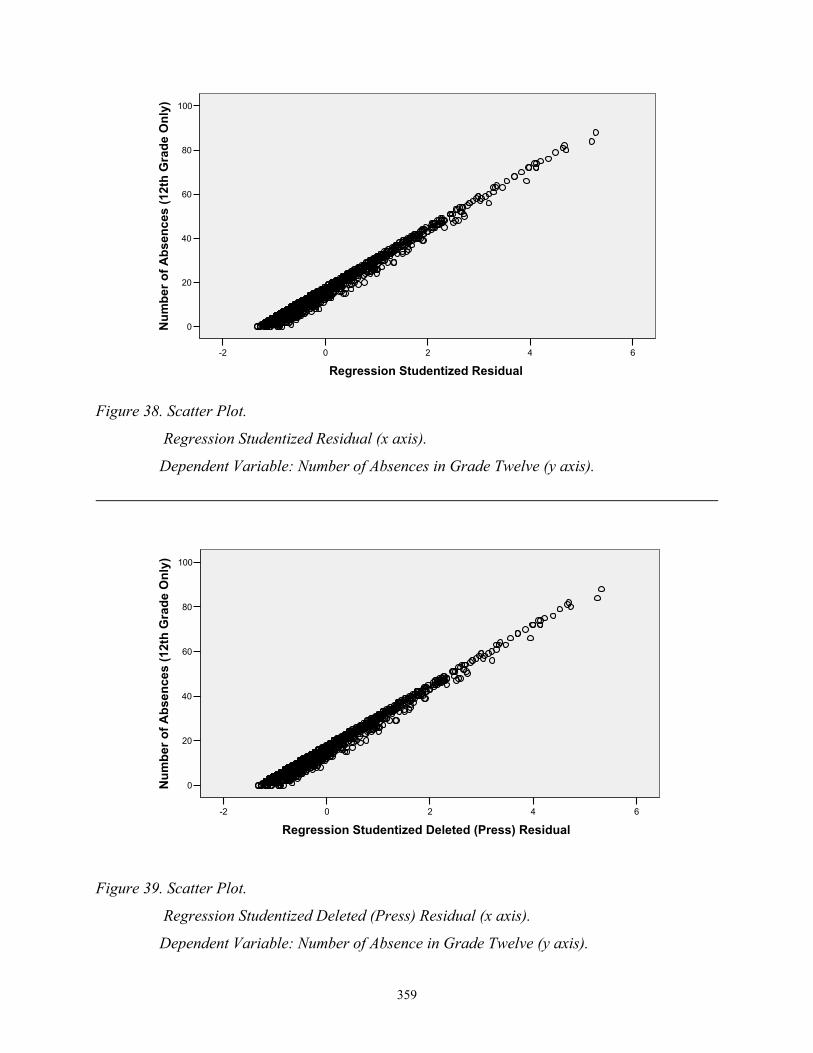
359
Figure 38. Scatter Plot.
Regression Studentized Residual (x axis).
Dependent Variable: Number of Absences in Grade Twelve (y axis).
Figure 39. Scatter Plot.
Regression Studentized Deleted (Press) Residual (x axis).
Dependent Variable: Number of Absence in Grade Twelve (y axis).
6420-2
Regression Studentized Residual
100
80
60
40
20
0Num
ber o
f Abs
ence
s (1
2th
Gra
de O
nly)
6420-2
Regression Studentized Deleted (Press) Residual
100
80
60
40
20
0Num
ber o
f Abs
ence
s (1
2th
Gra
de O
nly)

360
APPENDIX L
Figure 40. Scatter Plot.
Regression Standardized Predicted Value (x axis).
Dependent Variable: Number of Absences in Grade Twelve (y axis).
Figure 41. Scatter Plot.
Regression Standardized Residual (x axis).
Dependent Variable: Number of Absences in Grade Twelve (y axis).
210-1-2-3
Regression Standardized Predicted Value
100
80
60
40
20
0Num
ber o
f Abs
ence
s (1
2th
Gra
de O
nly)
6420-2
Regression Standardized Residual
100
80
60
40
20
0Num
ber o
f Abs
ence
s (1
2th
Gra
de O
nly)

361
Figure 42. Scatter Plot.
Regression Deleted (Press) Residual (x axis).
Dependent Variable: Number of Absences in Grade Twelve (y axis).
Figure 43. Scatter Plot.
Regression Adjusted (Press) Predicted Value (x axis).
Dependent Variable: Number of Absences in Grade Twelve (y axis).
806040200-20
Regression Deleted (Press) Residual
100
80
60
40
20
0Num
ber o
f Abs
ence
s (1
2th
Gra
de O
nly)
1816141210
Regression Adjusted (Press) Predicted Value
100
80
60
40
20
0Num
ber o
f Abs
ence
s (1
2th
Gra
de O
nly)

362
Figure 44. Scatter Plot.
Regression Studentized Residual (x axis).
Dependent Variable: Number of Absences in Grade Twelve (y axis).
Figure 45. Scatter Plot.
Regression Studentized Deleted (Press) Residual (x axis).
Dependent Variable: Number of Absences in Grade Twelve (y axis).
6420-2
Regression Studentized Residual
100
80
60
40
20
0Num
ber o
f Abs
ence
s (1
2th
Gra
de O
nly)
6420-2
Regression Studentized Deleted (Press) Residual
100
80
60
40
20
0Num
ber o
f Abs
ence
s (1
2th
Gra
de O
nly)

363
APPENDIX M
Figure 46. Scatter Plot.
Regression Standardized Predicted Value (x axis).
Dependent Variable: Number of Absences in Grade Twelve (y axis).
Figure 47. Scatter Plot.
Regression Standardized Residual (x axis).
Dependent Variable: Number of Absences in Grade Twelve (y axis).
1.51.00.50.0-0.5-1.0-1.5
Regression Standardized Predicted Value
100
80
60
40
20
0Num
ber o
f Abs
ence
s (1
2th
Gra
de O
nly)
6420-2
Regression Standardized Residual
100
80
60
40
20
0Num
ber o
f Abs
ence
s (1
2th
Gra
de O
nly)
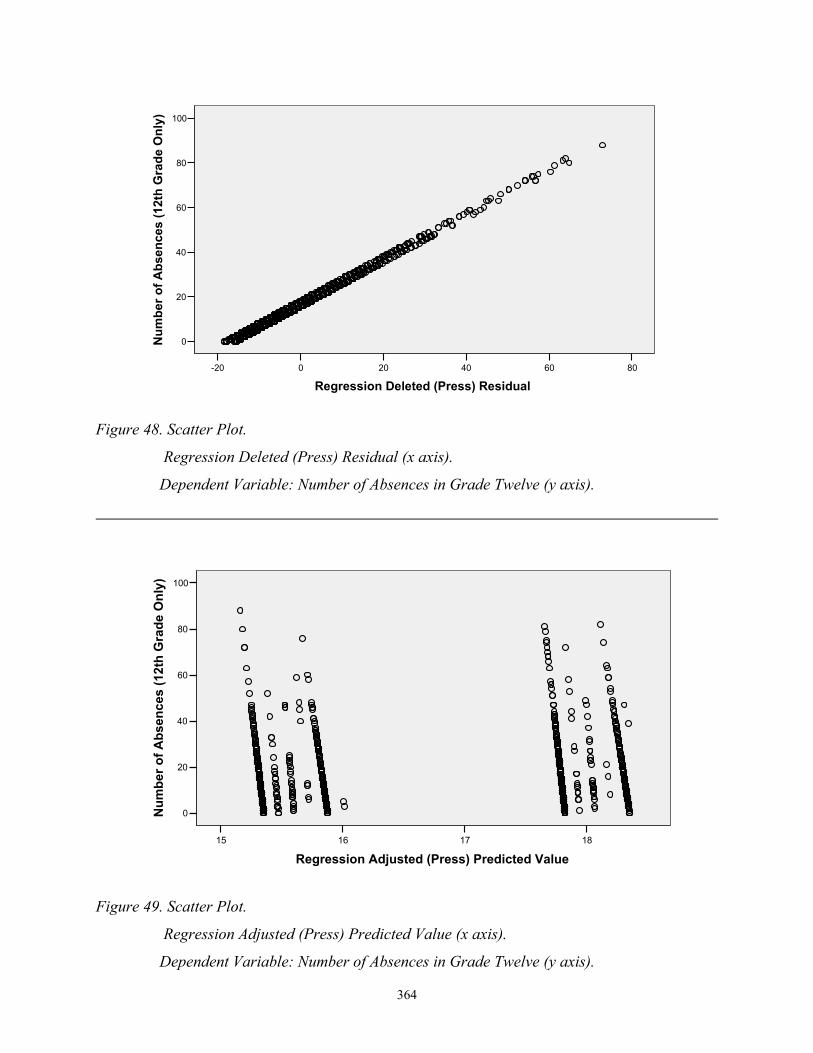
364
Figure 48. Scatter Plot.
Regression Deleted (Press) Residual (x axis).
Dependent Variable: Number of Absences in Grade Twelve (y axis).
Figure 49. Scatter Plot.
Regression Adjusted (Press) Predicted Value (x axis).
Dependent Variable: Number of Absences in Grade Twelve (y axis).
806040200-20
Regression Deleted (Press) Residual
100
80
60
40
20
0Num
ber o
f Abs
ence
s (1
2th
Gra
de O
nly)
18171615
Regression Adjusted (Press) Predicted Value
100
80
60
40
20
0Num
ber o
f Abs
ence
s (1
2th
Gra
de O
nly)

365
Figure 50. Scatter Plot.
Regression Studentized Residual (x axis).
Dependent Variable: Number of Absences in Grade Twelve (y axis).
Figure 51. Scatter Plot.
Regression Studentized Deleted (Press) Residual (x axis).
Dependent Variable: Number of Absences in Grade Twelve (y axis).
6420-2
Regression Studentized Residual
100
80
60
40
20
0Num
ber o
f Abs
ence
s (1
2th
Gra
de O
nly)
6420-2
Regression Studentized Deleted (Press) Residual
100
80
60
40
20
0Num
ber o
f Abs
ence
s (1
2th
Gra
de O
nly)
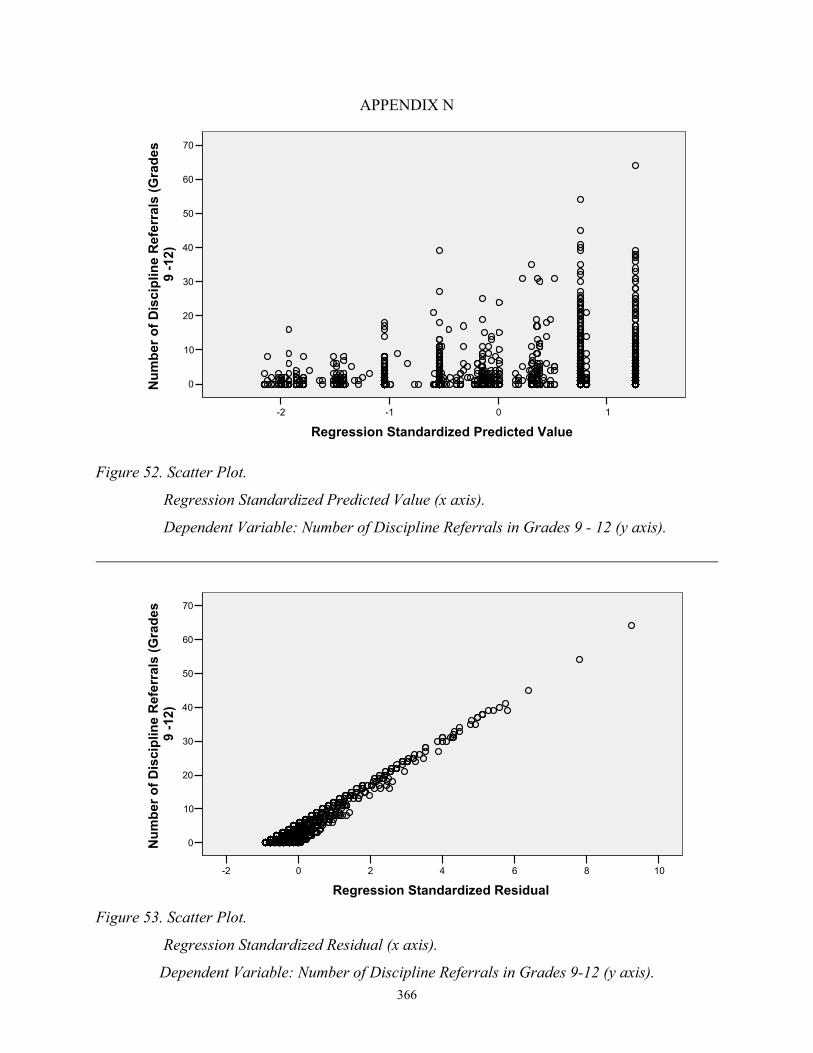
366
APPENDIX N
Figure 52. Scatter Plot.
Regression Standardized Predicted Value (x axis).
Dependent Variable: Number of Discipline Referrals in Grades 9 - 12 (y axis).
Figure 53. Scatter Plot.
Regression Standardized Residual (x axis).
Dependent Variable: Number of Discipline Referrals in Grades 9-12 (y axis).
10-1-2
Regression Standardized Predicted Value
70
60
50
40
30
20
10
0Num
ber o
f Dis
cipl
ine
Ref
erra
ls (G
rade
s9
-12)
1086420-2
Regression Standardized Residual
70
60
50
40
30
20
10
0Num
ber o
f Dis
cipl
ine
Ref
erra
ls (G
rade
s9
-12)

367
Figure 54. Scatter Plot.
Regression Deleted (Press) Residual (x axis).
Dependent Variable: Number of Discipline Referrals in Grades 9-12 (y axis).
Figure 55. Scatter Plot.
Regression Adjusted (Press) Predicted Value (x axis).
Dependent Variable: Number of Discipline Referrals in Grades 9-12 (y axis).
6050403020100-10
Regression Deleted (Press) Residual
70
60
50
40
30
20
10
0Num
ber o
f Dis
cipl
ine
Ref
erra
ls (G
rade
s9
-12)
6543210-1
Regression Adjusted (Press) Predicted Value
70
60
50
40
30
20
10
0Num
ber o
f Dis
cipl
ine
Ref
erra
ls (G
rade
s9
-12)

368
Figure 56. Scatter Plot.
Regression Studentized Residual (x axis).
Dependent Variable: Number of Discipline Referrals in Grades 9-12 (y axis).
Figure 57. Scatter Plot.
Regression Studentized Deleted (Press) Residual (x axis).
Dependent Variable: Number of Discipline Referrals in Grades 9-12 (y axis).
1086420-2
Regression Studentized Residual
70
60
50
40
30
20
10
0Num
ber o
f Dis
cipl
ine
Ref
erra
ls (G
rade
s9
-12)
1086420-2
Regression Studentized Deleted (Press) Residual
70
60
50
40
30
20
10
0Num
ber o
f Dis
cipl
ine
Ref
erra
ls (G
rade
s9
-12)
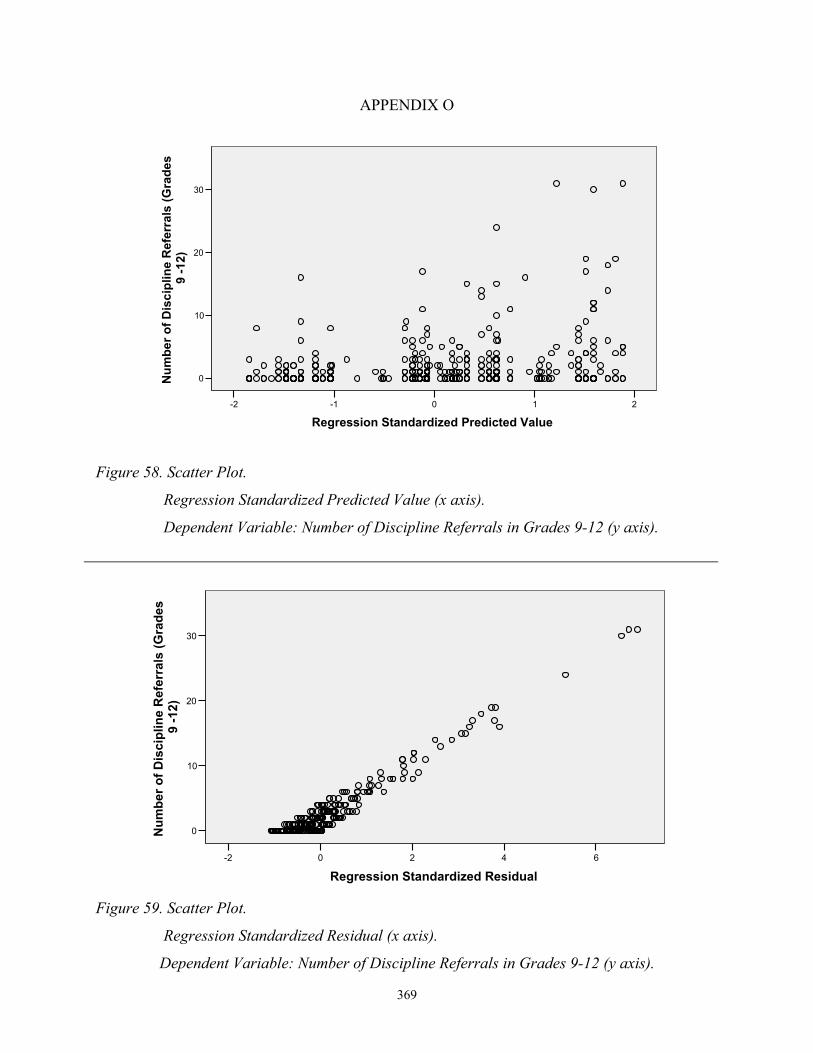
369
APPENDIX O
Figure 58. Scatter Plot.
Regression Standardized Predicted Value (x axis).
Dependent Variable: Number of Discipline Referrals in Grades 9-12 (y axis).
Figure 59. Scatter Plot.
Regression Standardized Residual (x axis).
Dependent Variable: Number of Discipline Referrals in Grades 9-12 (y axis).
6420-2
Regression Standardized Residual
30
20
10
0Num
ber o
f Dis
cipl
ine
Ref
erra
ls (G
rade
s9
-12)
210-1-2
Regression Standardized Predicted Value
30
20
10
0Num
ber o
f Dis
cipl
ine
Ref
erra
ls (G
rade
s9
-12)

370
Figure 60. Scatter Plot.
Regression Deleted (Press) Residual (x axis).
Dependent Variable: Number of Discipline Referrals in Grades 9-12 (y axis).
Figure 61. Scatter Plot.
Regression Adjusted (Press) Predicted Value (x axis).
Dependent Variable: Number of Discipline Referrals in Grades 9-12 (y axis).
3020100-10
Regression Deleted (Press) Residual
30
20
10
0Num
ber o
f Dis
cipl
ine
Ref
erra
ls (G
rade
s9
-12)
6420-2
Regression Adjusted (Press) Predicted Value
30
20
10
0Num
ber
of D
isci
plin
e R
efer
rals
(Gra
des
9 -1
2)
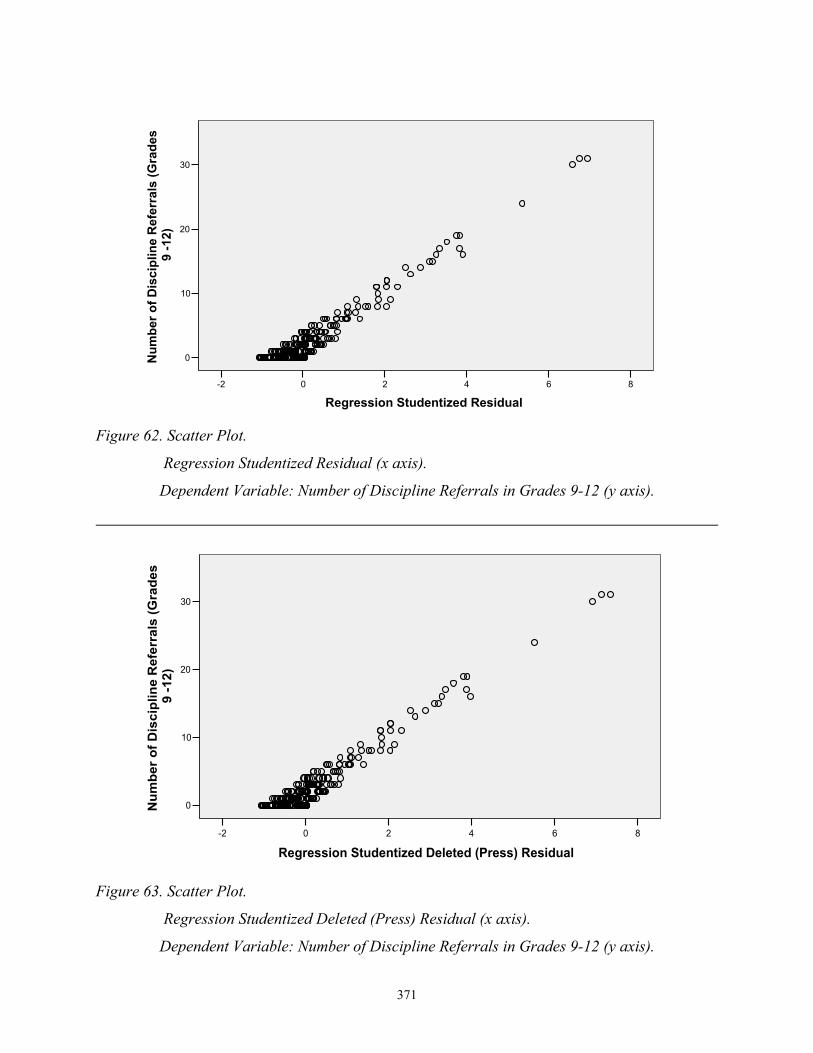
371
Figure 62. Scatter Plot.
Regression Studentized Residual (x axis).
Dependent Variable: Number of Discipline Referrals in Grades 9-12 (y axis).
Figure 63. Scatter Plot.
Regression Studentized Deleted (Press) Residual (x axis).
Dependent Variable: Number of Discipline Referrals in Grades 9-12 (y axis).
86420-2
Regression Studentized Residual
30
20
10
0Num
ber o
f Dis
cipl
ine
Ref
erra
ls (G
rade
s9
-12)
86420-2
Regression Studentized Deleted (Press) Residual
30
20
10
0Num
ber
of D
isci
plin
e R
efer
rals
(Gra
des
9 -1
2)
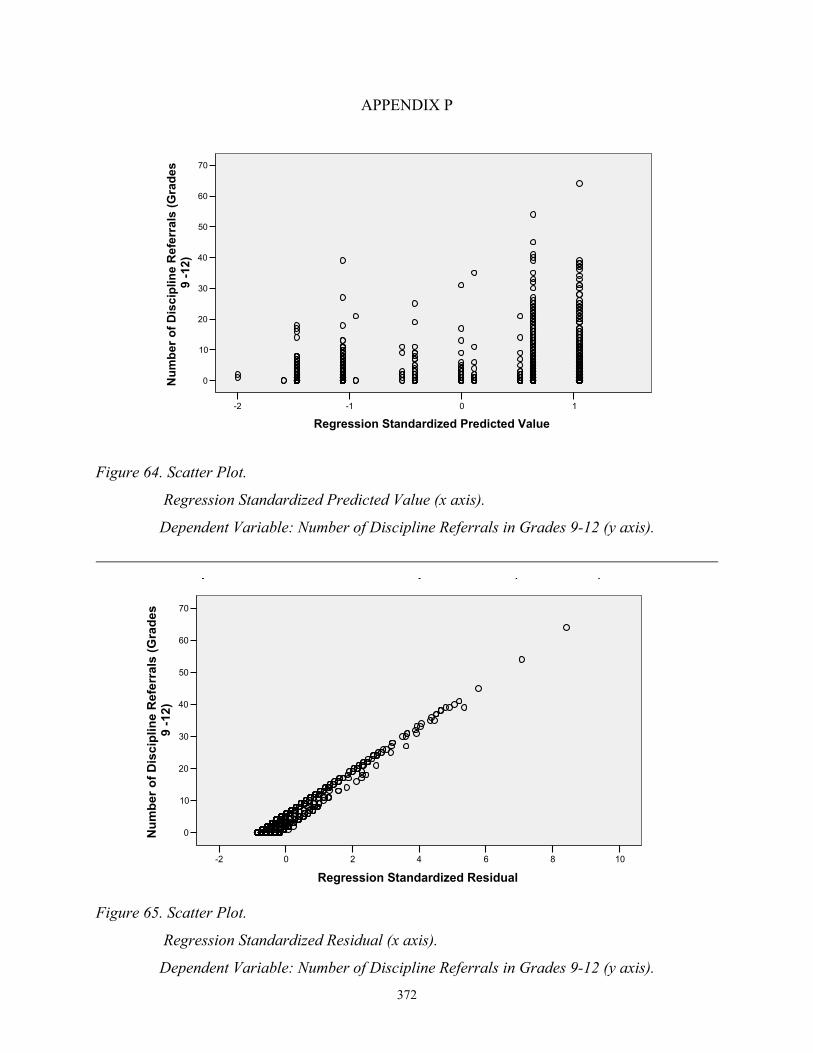
372
APPENDIX P
Figure 64. Scatter Plot.
Regression Standardized Predicted Value (x axis).
Dependent Variable: Number of Discipline Referrals in Grades 9-12 (y axis).
Figure 65. Scatter Plot.
Regression Standardized Residual (x axis).
Dependent Variable: Number of Discipline Referrals in Grades 9-12 (y axis).
10-1-2
Regression Standardized Predicted Value
70
60
50
40
30
20
10
0Num
ber o
f Dis
cipl
ine
Ref
erra
ls (G
rade
s9
-12)
1086420-2
Regression Standardized Residual
70
60
50
40
30
20
10
0Num
ber o
f Dis
cipl
ine
Ref
erra
ls (G
rade
s9
-12)
p p ( )

373
Figure 66. Scatter Plot.
Regression Deleted (Press) Residual (x axis).
Dependent Variable: Number of Discipline Referrals in Grades 9-12 (y axis).
Figure 67. Scatter Plot.
Regression Adjusted (Press) Predicted Value (x axis).
Dependent Variable: Number of Discipline Referrals in Grades 9-12 (y axis).
6050403020100-10
Regression Deleted (Press) Residual
70
60
50
40
30
20
10
0Num
ber o
f Dis
cipl
ine
Ref
erra
ls (G
rade
s9
-12)
6543210
Regression Adjusted (Press) Predicted Value
70
60
50
40
30
20
10
0Num
ber o
f Dis
cipl
ine
Ref
erra
ls (G
rade
s9
-12)
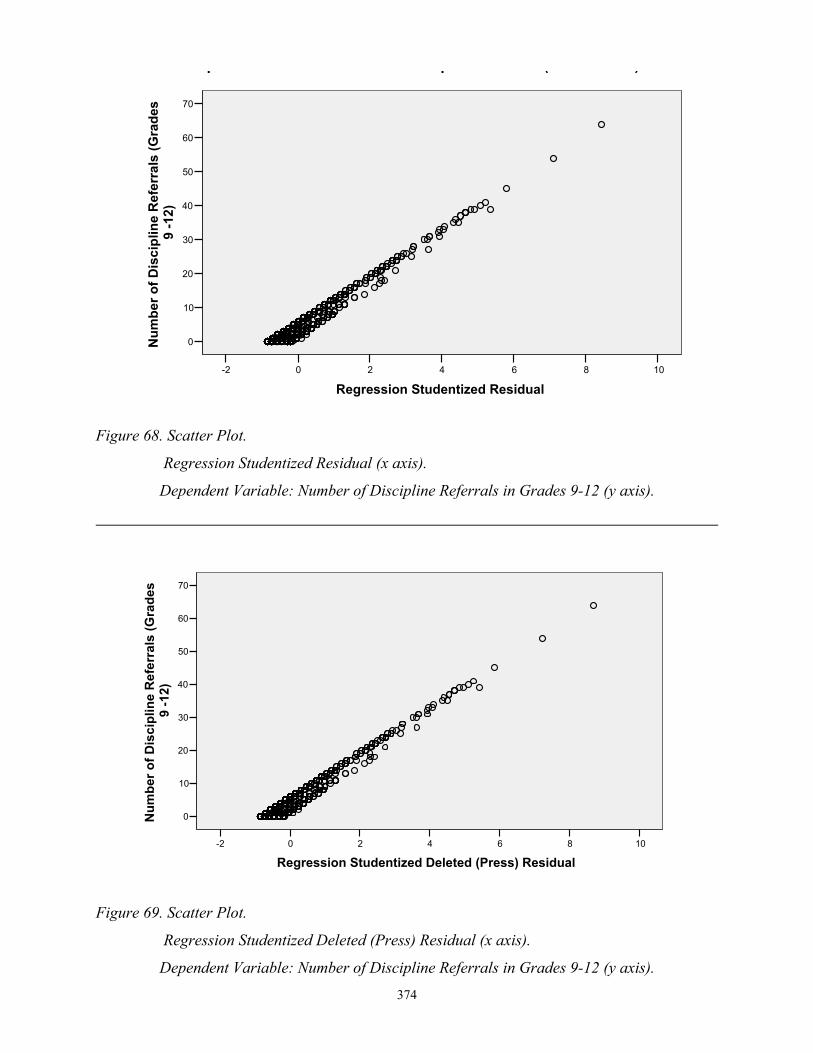
374
Figure 68. Scatter Plot.
Regression Studentized Residual (x axis).
Dependent Variable: Number of Discipline Referrals in Grades 9-12 (y axis).
Figure 69. Scatter Plot.
Regression Studentized Deleted (Press) Residual (x axis).
Dependent Variable: Number of Discipline Referrals in Grades 9-12 (y axis).
1086420-2
Regression Studentized Deleted (Press) Residual
70
60
50
40
30
20
10
0Num
ber o
f Dis
cipl
ine
Ref
erra
ls (G
rade
s9
-12)
1086420-2
Regression Studentized Residual
70
60
50
40
30
20
10
0Num
ber o
f Dis
cipl
ine
Ref
erra
ls (G
rade
s9
-12)
p p ( )

APPENDIX Q
GEORGE DARRYL WALLER
108 Wendy Court Newport News, VA 23601
Telephone: (757) 595-4177 (Home) (757) 725-4177 (Cell)
E-mail: [email protected]
PROFESSIONAL OBJECTIVE
Educational Leadership and Policy Administrator
SUMMARY OF QUALIFICATIONS Offering a strong and focused background acquired through direct professional leadership experience at all levels in an educational environment. Demonstrated ability to determine long and short-range objectives, implement activities which achieve positive results and efficiently utilize resources. Expertise includes:
• Performing as an administrator • Conducting meetings and conferences • Handling multiple tasks simultaneously • Implementing school master schedule and master calendar • Educational and business software • Liaison with school, resources, and community • Professional staff development and in-service conferences • Fast paced/high stress environments • Interviewing/Evaluating/Counseling Personnel • Developing, coordinating, and implementing programs • Developing, coordinating, and implementing budgets
CERTIFICATIONS
Virginia Post Graduate Professional Virginia Superintendent Endorsement
General and Instructional Supervisor Endorsement Elementary, Middle, and High School Administration Endorsement
Music: Vocal/Choral Music PreK-12 Endorsement

376
EDUCATION
Doctor of Philosophy Educational Leadership and Policy Studies
Virginia Polytechnic Institute and State University, Blacksburg, Virginia Final Defense, March 29, 2007
Graduation, May 11, 2007
Master of Arts in Education and Human Development The George Washington University, Washington, D.C., 1996
Bachelor of Music in Voice Greensboro College, Greensboro, North Carolina cum laude, 1983
Professional Teaching Certificate – Music: Vocal/Choral Music PreK-12 Christopher Newport College, Newport News, Virginia
Old Dominion University, Norfolk, Virginia Hampton University, Hampton, Virginia
Thomas Nelson Community College, Hampton, Virginia
Advanced Graduate Work The College of William and Mary, Williamsburg, Virginia
ADMINISTRATOR EXPERIENCE
Supervisor of Music, Newport News Public Schools, Newport News, Virginia, 2001 to present.
Responsible for the creation and maintenance of an organizational and instructional culture in which teachers can be leaders and inventors of quality work for students. The program consists of the leadership, evaluation, and recruitment of 75 full-time music teachers in 49 schools. Duties include: • Supervision of all aspects of the music program including general music, band, chorus, guitar,
piano, orchestra, music theory, and Advanced Placement music theory grades Pre-K through Grade 12.
• Develop and conduct staff development courses for all music teachers PreK through Grade 12. • Develop, implement, and evaluate curriculum for assigned content areas. • Develop, implement, and evaluate on-line curriculum using designated Understanding by Design
format. • Develop, evaluate, and recommend programs, equipment, and related items that have budget
implications. • Develop and make recommendations for annual music department budget. • Using allocated funds, order additional music instruments, equipment, and instructional materials. • Interview potential music candidates and make recommendations to building level principals. • Organize students/teacher transportation and support vehicles for all aspects of the music
program.
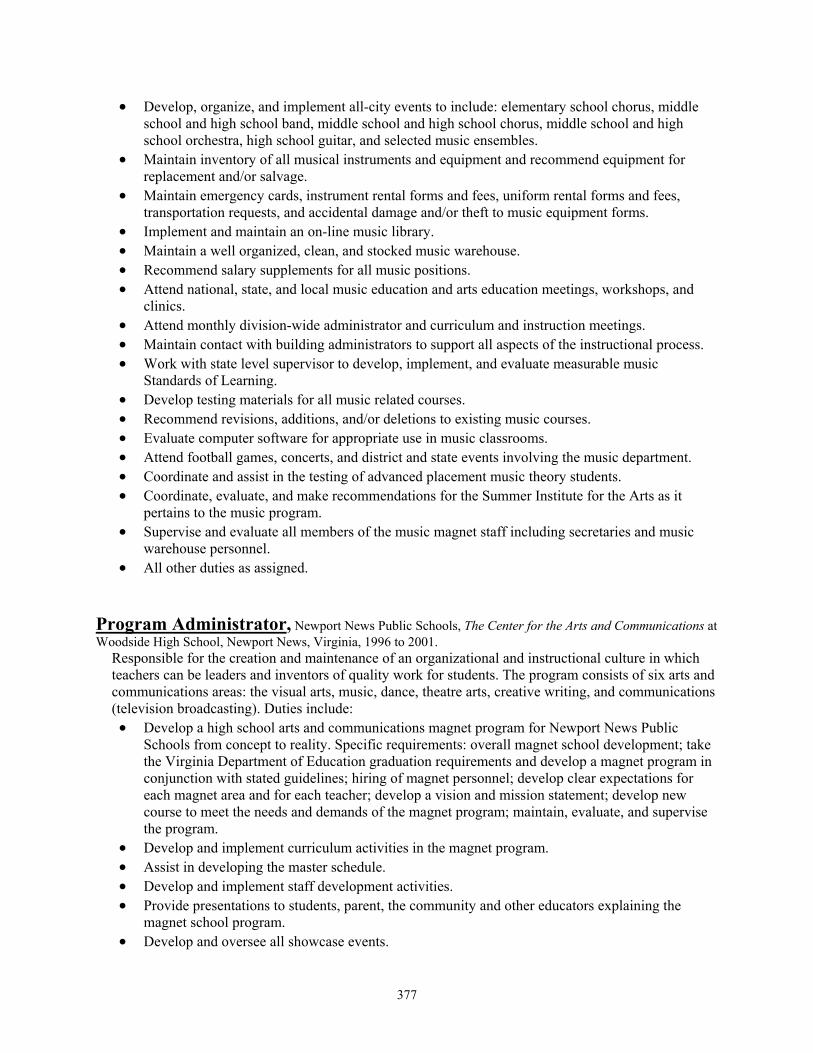
377
• Develop, organize, and implement all-city events to include: elementary school chorus, middle school and high school band, middle school and high school chorus, middle school and high school orchestra, high school guitar, and selected music ensembles.
• Maintain inventory of all musical instruments and equipment and recommend equipment for replacement and/or salvage.
• Maintain emergency cards, instrument rental forms and fees, uniform rental forms and fees, transportation requests, and accidental damage and/or theft to music equipment forms.
• Implement and maintain an on-line music library. • Maintain a well organized, clean, and stocked music warehouse. • Recommend salary supplements for all music positions. • Attend national, state, and local music education and arts education meetings, workshops, and
clinics. • Attend monthly division-wide administrator and curriculum and instruction meetings. • Maintain contact with building administrators to support all aspects of the instructional process. • Work with state level supervisor to develop, implement, and evaluate measurable music
Standards of Learning. • Develop testing materials for all music related courses. • Recommend revisions, additions, and/or deletions to existing music courses. • Evaluate computer software for appropriate use in music classrooms. • Attend football games, concerts, and district and state events involving the music department. • Coordinate and assist in the testing of advanced placement music theory students. • Coordinate, evaluate, and make recommendations for the Summer Institute for the Arts as it
pertains to the music program. • Supervise and evaluate all members of the music magnet staff including secretaries and music
warehouse personnel. • All other duties as assigned.
Program Administrator, Newport News Public Schools, The Center for the Arts and Communications at Woodside High School, Newport News, Virginia, 1996 to 2001.
Responsible for the creation and maintenance of an organizational and instructional culture in which teachers can be leaders and inventors of quality work for students. The program consists of six arts and communications areas: the visual arts, music, dance, theatre arts, creative writing, and communications (television broadcasting). Duties include: • Develop a high school arts and communications magnet program for Newport News Public
Schools from concept to reality. Specific requirements: overall magnet school development; take the Virginia Department of Education graduation requirements and develop a magnet program in conjunction with stated guidelines; hiring of magnet personnel; develop clear expectations for each magnet area and for each teacher; develop a vision and mission statement; develop new course to meet the needs and demands of the magnet program; maintain, evaluate, and supervise the program.
• Develop and implement curriculum activities in the magnet program. • Assist in developing the master schedule. • Develop and implement staff development activities. • Provide presentations to students, parent, the community and other educators explaining the
magnet school program. • Develop and oversee all showcase events.

378
• Recruit all magnet program students. • Communicate with parents of students concerning magnet program status and achievement. • Attend various student activities, departmental meetings, PTA meetings, and faculty meetings. • Schedule special events that include arts programs, quest appearances, workshops, clinics, master
classes, morning announcements, in-school activities, field trips, business partnership activities, school calendar, building volunteers, mentorships, and other activities as requested by the principal.
• Prepare magnet student class schedules. • Develop and maintain a budget as it relates to the magnet school. • Prepare purchase orders and assist in the distribution and inventory of school supplies,
equipment, and instructional materials. • Develop a magnet school improvement plan to serve as the agenda to achieve the vision. • Coordinate and assist in the testing of students. • Assist in the development of emergency evacuation plans, drills, and other school policies as
requested. • Supervise and evaluate a team of teachers within the magnet program. • Supervise and evaluate all members of the magnet staff including guidance counselors,
secretaries, custodians, and security officers. • Perform any other related duties as assigned by the secondary principal.
Choral Director, Fine Arts Department Chair, Newport News Public Schools, Denbigh High School, Newport News, Virginia, 1983 to 1996, 1989 to 1996 respectively.
Coordinate and manage all education related activities of eight high school faculty members and develop an award winning choral department of 200+ members: • Observe and evaluate teachers • Report fine arts activities to principal and music supervisor • Schedule teachers and assist in hiring • Develop fine arts department events calendar • Develop curriculum in the arts • Develop city-wide testing in the arts • Re[resent the arts in the community and at school board meetings • Audition students and assign classes at appropriate levels • Teach voice and vocal performance at various levels in a high school setting • Teach music theory and music history • Establish and execute proper lesson plans • Conduct/Coordinate all vocal performing groups for school and community activities and
concerts • Select and order music within a given budget • Maintain music inventory • Develop and maintain a workable music library • Develop budget, fund raising campaigns, grading policies, and procedures • Conduct field trips, teacher/parent/students conferences, evaluations, and other teaching strategies

379
Music Coordinator and Voice/Choral Instructor, Newport News Public Schools Summer Institute for the Arts, Christopher Newport University, Newport News, Virginia, Summer 1993 and 1994, Summers 1990 to 1994 respectively.
Direct a large city-wide music institute and supervise twenty-two faculty and staff: • Coordinate all music activities • Contact and schedule all clinicians for workshops • Organize teaching materials • Supervise faculty and staff • Maintain positive contacts with students, parents, and community • Distribute student interim reports and report cards • Schedule and maintain effective student recitals • Maintain accurate faculty and staff payroll time sheets • Coordinate field trips • Teach music theory, ear training, sight singing, keyboard skills, conducting, vocal technique, and
large vocal/choral ensemble • Prepare vocal music students to perform on weekly recitals and concerts • Prepare vocal music students to perform at the culminating showcase event at the end of the
Summer Institute for the Arts Music Director, Hilton Christian Church, Newport News, Virginia, July 1993 to present; Deer Park Baptist Church, Newport News, Virginia, January 1988 to March 1991; Hilton Baptist Church, Newport News, Virginia, October 1983 to 1986.
Coordinate and direct all music activities in the church: • Conduct Adult, Youth, Children’s Choirs, and congregation • Conduct handbell choirs • Coordinate a graded choir system • Coordinate activities of the organist and pianist • Supervise children’s choir directors • Supervisor and evaluate all instrumentalists including the organist and pianist • Prepare choirs and ensembles for cantatas and special music events • Select and order all music within a given budget • Select hymns for all worship services • Maintain music inventory • Propose budget request to appropriate committees • Develop and maintain a workable music library • Report to pastor, boards, and committees of music activities

380
RELATED EXPERIENCE
Music Adjudicator, Spectrum of Richmond/Fiesta-Val, Richmond, Virginia; Various music competitions throughout the Commonwealth of Virginia for a variety of district, state, and national events. September 1984 to present.
Music Teacher, Newport News Public Schools, Dozier Middle School, Newport News, Virginia, September 1984 to June 1986.
Teach sixth grade exploratory music in four nine week sessions. Duties include: • Establish and execute proper lesson plans. • Instruction in music theory. • Instruction in music history. • Instruction in piano/keyboard skills. • Instruction in recorder. • Instruction in guitar. • Instruction in vocal. • Curriculum development. • Conduct field trips, teacher/parent/student conferences, evaluations, and other teaching strategies.
Server/Performer/Vocal Coach and Instructor, Spirit of Norfolk, Norfolk, Virginia, July 1995 to April 1996.
Provide customer service and perform for passengers in a cruise ship atmosphere: • Maintain customer service to assigned tables. • Maintain expense account for each assigned table and/or patron. • Perform shows and solos in a professional manner. • Maintain safety for all passengers and crew. • Maintain high energy an enthusiasm throughout the cruise.
President, Virginia Association of Music Education Administrators (VAMEA), elected by the members of VAMEA, June 2002 to June 2006.
• Develop and attend staff development opportunities for state music administrators at the Virginia Music Educators Association (VMEA) Annual In-Service Conference.
• Develop VAMEA Constitution and By-Laws • Submit quarterly articles to state magazine – VMEA Notes • Attend quarterly state meetings. • Develop and attend staff development opportunities for the annual ArtsWorks for Virginia
Conference. • Coordinate with and make recommendations for funding with the VAMEA Treasurer and with the
VMEA Treasurer. • Submit and announce treasurer’s reports to VMEA treasurer, secretary, executive board, and
council of review at all VMEA meetings. • Submit and announce VAMEA activities to VMEA secretary, executive board, and council of
review at all VMEA meetings. • Develop and maintain membership directory. • Develop and maintain an on-line listing of staff development opportunities, guest conductors,
accompanists, and adjudicators database. • Be an advocate for music and music education at all state, district, and local events.

381
Treasurer, Virginia Choral Directors Association (VCDA), appointed by the Virginia Music Educators Association and the Music Educators National Conference, June 1994 to 1996.
• Pay all bills related to the Virginia Choral Directors Association. • Maintain monthly balance of all financial accounts. • Make quarterly reports to membership and to the Treasurer of the Virginia Music Educators
Association. • Scout perspective All-Virginia Chorus sites with the president of the choral director’s organization
to find appropriate and adequate rehearsal and concert space. • Scout perspective All-Virginia Chorus sites with the president of the choral director’s organization
to find appropriate and adequate housing and meal accommodations. Private Voice and Piano Instructor, in my home, Newport News, Virginia, June 1983 to June 1986. Community Music and Fine Arts Department, Greensboro College, Greensboro, North Carolina, Spring semester 1982.
Teach formal voice and/or piano lessons to experienced and inexperienced musicians: • Teach posture and breathing. • Teach music theory. • Teach music history. • Teach performance skills through proper vocal production and/or piano skills. • Teach ear-training and sight-reading/singing skills.
EDUCATION
Doctor of Philosophy, Educational Leadership and Policy Studies, Virginia Polytechnic Institute and State University, (Virginia Tech) Blacksburg, Virginia, Final Defense – March 29, 2007; Graduation - May 11, 2007.
Related course work: • Planning Educational Facilities • Theories of Educational Administration • Administration and Supervision of Special Education • Advanced School Law • Advanced School Finance • Educational Governance and Policy Studies • School Community Partnerships • School Personnel Administration and Instructional Supervision • Quantitative Research Methods • Qualitative Research Methods • Research and Dissertation
Dissertation Title:
The Impact of Music Education on Academic Achievement, Attendance Rate, and Student Conduct on the 2006 Senior Class in One Southeast Virginia Public School Division

382
Master of Arts in Education and Human Development, Administration and Supervision: The George Washington University, Washington, D.C., 1996.
Related course work: • Public Relations for Educational Organizations • School Finance • School Law • Curriculum Development • The Principalship • Observations, conferences, and evaluations for instructional staff
Bachelor of Music, Vocal Production, Greensboro College, Greensboro, North Carolina, cum laude, May 1983.
Related course work: • Voice Lessons • Vocal Pedagogy • Vocal Literature • Concert Choir • Piano Ensemble • Piano Accompanying • Music Theory • Music History • 16th Century Counterpoint • 18th Century Counterpoint • 20th Century Techniques • Orchestra and Form • Ear-Training and Sight-singing • Conducting • Foreign Language – French, German, Italian, English • Junior and Senior Voice Recital
Postgraduate Professional License, Commonwealth of Virginia Effective July 1, 2006 to June 30, 2011
• Elementary School Principal • Secondary Principal • Superintendent • General and Instructional Supervisor and Administration • Music: Vocal/Choral PreK-12 • Music: General

383
Professional Teaching Certificate, Vocal/Choral Music PreK – 12, 1984 – present. Thirty-nine (39) semester hours (graduate and undergraduate) beyond Bachelor of Music to meet Commonwealth of Virginia teaching certificate requirements: • Christopher Newport College, Newport News, Virginia • Old Dominion University, Norfolk, Virginia • Thomas Nelson Community College, Hampton, Virginia • Hampton University, Hampton, Virginia
Course work in education to renew Commonwealth of Virginia Teaching Certificate, 1987 – 1997. • The College of William and Mary, Williamsburg, Virginia • Program for Effective Teaching (PET), Newport News Public Schools, Newport News, Virginia • Leadership Academy for Aspiring Newport News Administrators, Newport News Public Schools, Newport
News, Virginia
PROFESSIONAL AND COMMUNITY ORGANIZATIONS
• Association for Supervision and Curriculum Development • American Choral Directors Association • Virginia Choral Directors Association • Virginia Association of Music Education Administrators • Virginia Music Educators Association • Music Educators National Conference • National Association of Teachers of Singing • National Art Educators Association • Virginia Art Educators Association • Virginia Theatre Association • Southeastern Theatre Conference • Virginia Health, Physical Education, Recreation, and Dance Educators Association • Peninsula Music Teachers Association • The Chamber Singers • Peninsula Youth Orchestra – Board member • Newport News Commission for the Arts – Commissioner

384
SKILLS AND INTERESTS Musical Ability
• Formal training in voice and piano • Experience in performing teaching private and class voice and piano • Periodical performances and recitals • Perform with The Chamber Singers – an a cappella vocal ensemble that performs in Colonial Williamsburg
and the Hampton Roads area • Experience in high school choral music and choral conducting • Experience in middle school choral music and choral conducting • Experience in church music – Handbell choirs, adult, youth, and children’s choirs, congregational hymns,
piano accompaniments, and piano and organ personnel management • Experience in choral conducting at the local, district, and state levels • Experience as a choral music adjudicator at the local, district, state, and national levels • Experience as a vocal and instrumental music adjudicator at the local, district, state, and national levels
REFERENCES
Available upon request

385
ADDENDA
PROFESSIONAL HIGHLIGHTS
• 2007 – Newport News Public Schools selected as “Best 100 School Divisions in America for Music Education” by the American Music Conference.
• 2002 to present – Commissioner on the Newport News Arts Commission for the City of Newport News
• 2001 Guest Conductor for Virginia Music Educators Association District VI Women’s Chorus, Blacksburg
High School, Blacksburg, Virginia
• 2002 Guest Conductor for Lynchburg City Public Schools All-City Chorus, Lynchburg High School, Lynchburg, Virginia
• 2005 Guest Conductor for Virginia Music Educators Association District VIII SATB Chorus, Heritage
High School, Newport News, Virginia
• Spring 2003, 2004, 2005, and 2006 Choral Music Adjudicator for Fiesta-Val, Spectrum of Richmond per invitation
• As per invitation of Dr. Wayne Lett, Superintendent of Newport News Public Schools, soloist for a
presentation at the 2000 Superintendent’s Coalition for Technology Conference sponsored by the National Science Foundation at The Founder’s Inn, Virginia Beach, Virginia
• June 2000 and 2001 – Developed and taught Newport News Public Schools Professional Development
Institute to magnet school teachers at Woodside High School, Newport News, Virginia
• March 1999 - Developed and taught Integrating the Arts in the Classroom to Foster Success for a Diverse Population, Newport News Public Schools Race Relations and Diversity Conference
• 1997 and 1999 Guest Conductor for the Montgomery All-County Chorus, Montgomery County, Virginia
• 1997 soloist for the Newport News Public Schools Technology Expo as per invitation of Dr. Wayne Lett,
Superintendent, Newport News Public Schools
• 1995-2000 developed and maintained The Center for the Arts and Communications at Woodside High School, a public school magnet program consisting of the visual arts, dance, drama, music, creative writing, and communications (radio and television broadcasting).
• 1994 directed the Denbigh High School Troubadours to provide background vocals for WVEC-TV
Channel 13, Norfolk, Virginia documentary on teen violence. The documentary won an Emmy Award
• 1989 Denbigh High School Teacher of the Year
• District Choral Chairman/Representative for Virginia Music Educators Association and Virginia Choral Directors Association, 1989 – 1995
• President for Virginia Association of Music Education Administrators, a division of the Virginia Music
Educators Association, 2002 – 2006
• Conductor of several choral numbers for the 1984, 1985, and 1986 Newport News Public Schools All-City High School Chorus
• 1986 Guest Conductor – Newport News Public Schools Middle School Chorus

386
• December 1986, 1988, 1993 conducted the Denbigh High School Troubadours, chamber/madrigal group, at The White House, Washington, D.C., per invitation from The President of the United States
• November 1988, 1990, and 1993 – Conducted the Denbigh High School Troubadours at the Virginia Music
Educators Association In-Service Conference per invitation
• February 1990 – Conducted the Denbigh High School Troubadours at the National Music Clinic in Philadelphia, Pennsylvania, sponsored by Festivals of Music, Inc. per invitation
• January 1991 – Developed and taught staff development workshop to Newport News high school and
middle school choral directors – Vocal/Choral Music Techniques – A Refresher Course
• February 1991 – guest conductor for the District VIII Festival Chorus – an affiliate of the Virginia Music Educators Association, the Virginia Choral Directors Association, and the Music Educators National Conference
• April 1991 – guest conductor of the Hampton All-City High School Chorus
• April 1992 – guest conductor of the Middle Peninsula and Northern Neck High School Chorus (grades 9-12)
• May 1992 – guest conductor of the Hanover County Public Schools Senior High School Chorus (grades 9-12)
• Soloist, section leader, and chaperone for the 1986 All-Virginia Chorus European Tour
• Guest soloist for the 1987 Newport News All-City High School Chorus performance of Schubert’s Mass in G
• February and March 1992 – soloist and chorus member of the Composer’s Chorus under the direction of
Joel Subin, The College of William and Mary, Williamsburg, Virginia
• January 1993 – 1994 – Tenor soloist and member of The Chamber Singers, a chamber/madrigal group made up of six professional singers that specialize in a cappella performance
• Performed “Pirelli/choral member” in Christopher Newport College production of Sweeney Todd, Newport
News, Virginia
• Performed “Larry/Matt” in Christopher Newport College production of Face on the Barroom Floor, Newport News, Virginia
• 1985 and 1989 – Cooperating teacher for student teachers from Hampton University, Hampton, Virginia
and Christopher Newport College, Newport News, Virginia
• Host of the 1985 and 1992 District VIII Regional/Workshop Chorus held at Denbigh High School, Newport News, Virginia
• 1988 – 1989 served with a select group of educators to recommend Denbigh High School as a school for
the National Excellence Award in Education. Distinction was awarded in 1989 from the United States Department of Education
• Host of the 1992-1994 Virginia Music Educators Association Honors Choir Auditions, Longwood College,
Farmville, Virginia
• Soloist for various weddings, funerals, ceremonies, dedications, and events as needed and as requested
• 1986 – Served on the steering committee to develop the Newport News Public Schools Summer Institute for the Arts, Newport News, Virginia
387
HONORS Professional:
• 2005-2006 and 2006-2007 The Marquis Who’s Who in American Education • 2006 The National Scholars Honor Society • 2000 – Faculty Life Membership induction into the Tri-M Music Honor Society sponsored by the Music
Educators National Conference • 1999 – Former choral music student Crystal Dawn Lewis selected as Miss Virginia 2000 and represented
the Commonwealth of Virginia at the 2000 Miss America Pageant in Atlantic City, New Jersey. Crystal won the preliminary talent competition at the Miss America Pageant
• 1990 – Album dedication and thank you from former choral music student Brian Eggleston, vocal soloist • 1989 Denbigh High School Teacher of the Year • November 1990 – Virginia Music Educators Association Music Educator of the Year nominee • April 1991, 1992, 1993 – Award of Distinction in Recognition of Notable Contribution to Musical
Excellence – Atlanta, Georgia; Lakeland, Florida; and Pigeon Forge, Tennessee – Fiesta-Val, Spectrum of Richmond, Richmond, Virginia
• 1993, 1994, and 1995 – Recognized as an Outstanding Educator by the Governor’s School for the Arts and Humanities, University of Richmond, Richmond, Virginia
• 1994, 1996, 1997, 1998, 1999 – Who’s Who Among America’s Teachers • December 1986, 1988, and 1993 – Denbigh High School Troubadours performed at The White House,
Washington, D.C., as per invitation from The President of the United States • December 1988 and 1990 - Deer Park Baptist Church Handbell Choir performed at The White House,
Washington, D.C., as per invitation from The President of the United States College (Undergraduate):
• Presser Scholar • Fletcher Scholar • Recipient of the A. J. Fletcher Scholarship for musical excellence • 1983 Who’s Who Among Students in American Universities and Colleges • Dean’s List • Junior Marshall – Junior year students with grade point averages of 3.0 or higher • Senior Superlatives – Most Talented • Graduated with honors – cum laude
ADDITIONAL INFORMATION The following items and opportunities for additional information are available upon request:
• Portfolio • Video of choral music classroom instruction • Video of various choral concerts • Vocal music repertoire • Choral conducting repertoire • Interview • Recommendations • Undergraduate and Graduate School transcripts • Dissertation • Other information upon request


