
TEMPERTON FELLOWSHIP
Report No.15
"The Evolution of Genetics, Breeding and
Production"
Ken Laughlin, BSc, PhD, MIBiol, CBiol
Group Vice President Policy and Strategy
Aviagen
2007
HARPER ADAMS UNIVERSITY COLLEGE

2
3
Published by: HARPER ADAMS UNIVERSITY COLLEGE NEWPORT, SHROPSHIRE, TF10 8NB First published 2007 Copyright Harper Adams University College, 2007 All rights reserved. No part of this publication may be reproduced or transmitted in any form or by any means, including photocopying and recording, without written permission of the copyright holder, application for which should be addressed to the publishers. Such written permission must also be obtained before any part of this publication is stored in a retrieval system of any nature. ISBN 1 870 955 897 Copies of this report are available from The Office Services Manager, Harper Adams University College, Newport, Shropshire, TF10 8NB at a cost of £15.00 per copy, including postage.
While every effort has been made to ensure that the information in this report is complete and accurate at the time of publication, neither the Fellowship, the College, nor the author accept liability for any error or omission, nor for any loss, accident or damage which may arise from using the report.

4

5
CONTENTS
Page Acknowledgements 7 Preface 8 Summary 9 Glossary 11 The Poultry Industry Worldwide 13 A Truly Global Industry 18 Genetics 19 Quantitative genetics 20 DNA and Genomics 22 Breeding 24 The genetic development of bird types and products 29 The time frame of genetic selection 30 Breeders and the Breeding Business 32 The UK Industry 39 NFU Data 39 Broiler Data 40 Breeder Data 44 Cost data 45
NFU Summary 48
Discussion 49 Contribution of H.A.A.C. and N.I.P.H 53 The Last Word 54 References 55

6

7
ACKNOWLEDGEMENTS
I would like to thank the Temperton Fellowship for the honour of inviting me to participate in this prestigious series of reports. I appreciate the assistance and enthusiasm of its Chairman, Peel Holroyd. His interest and guidance was vital in delivering this report on time and to the required standard. Many colleagues at Aviagen have assisted in preparing this report and I appreciate all their efforts and comments. I have been fortunate to meet and work with many of the geneticists, company and academic, who have made such enormous contributions to development of the poultry meat industry. They provided me with a privileged insight to their work and also ensured continuous technical challenges.

8
PREFACE
AVIAGEN
The world’s leading poultry breeding company with wholly owned operations in Europe, the United States and Latin America and Joint Ventures in Asia and South Africa. The company has 1500 employees and a distribution network serving over 300 customers in more than 85 countries. Aviagen is owned by the Erich Wesjohann Group, Germany which has worldwide leadership in both the egg layer and the broiler breeder sectors, with an unrivalled product portfolio. EW Group is committed to investment in R&D. Aviagen encompasses the Arbor Acres, L.I.R. and Ross Brands of broiler meat chickens and also owns Nicholas Turkeys and British United Turkeys. Newbridge, Cummings Research Park, Midlothian , 5015 Bradford Drive,
EH28 8SZ Huntsville Scotland Alabama 35805 UK USA
www.aviagen.com
9
Summary In this presentation I shall examine the development of the poultry meat breeding industry
from the beginning of its intensification in UK and Europe until the present. The report
covers genetics [ the basic science and method behind breeding] and the structure and
evolution of the breeding industry. In order to understand some of the drivers and results
of the breeding programmes it is necessary to provide performance and economic
statistics, which will be primarily those of the UK, but where relevant comparisons from
other world regions are presented.
The world’s poultry meat industries have shown phenomenal growth in little over half a
century. The focus of that growth has changed from the developed to the developing
world driven by both changes in local consumption and international trade.
Poultry breeding evolved along with the opportunities provided from the sciences of
genetics, statistics and computing whilst the biological sciences provided the rationale and
measurement tools for including more complex traits into selection programmes.
The breeding companies evolved through specialization to develop complementary lines
which provided hybrid crosses at the commercial level. The increasing complexity of
breeding and selection has resulted in the focusing of poultry breeding activity into
companies having the resources to develop and manage multiple products. All these lines
and their products can benefit from the skills and investment in breeding whilst genetic
diversity is retained and managed.
Data from the UK industry shows continued balanced improvement in biological
performance along with cost reductions.
During the last 50 years the UK industry provided a challenging environment against
which the breeding companies could develop their skills and their products to achieve
worldwide leadership.

10

11
GLOSSARY
AI avian influenza
AFRC Agricultural and Food Research Council
ARC Agricultural Research Council
BLUP Best Linear Unbiased Predictor
DEFRA Department for Environment Food and Rural Affairs
EPEF European Production Efficiency Factor
EU European Union
FAO Food and Agricultural Organisation
FCR Food Conversion Ratio
GGP Great Grand Parent
GP Grand Parent
kg kilogram
KPI key performance indicator
Mt Metric tonne
MLC Meat and Livestock Commission
NFU National Farmers Union (UK)
PEF Production Efficiency Factor
PS Production Score ( rarely used)
PS Parent Stock ( common use)
R&D Research and Development
USDA United States Department of Agriculture
WTO World Trade Organisation

12

13
THE POULTRY INDUSTRY WORLDWIDE The poultry industry has shown phenomenal growth worldwide over the last 50-60 years
and this growth is forecast to continue. The top five producing regions – USA, China,
Brazil, the European Union and Mexico – are predicting steady year on year growth and
together produced over 50 million Mt out of a worldwide total of around 80 million Mt of
broiler meat in 2006. The EU share of this production is however reducing as an
increasing proportion of production moves to developing countries.
The consumption of poultry meat has outstripped the rising trend of animal protein
consumption which in turn was a result of animal protein becoming more universally
affordable. Worldwide pork consumption currently stands at 100 million Mt, poultry at 80
million Mt, beef at a little over 60 million Mt and eggs close to 60 million Mt. There are
significant regional variations in the relative importance of meat types and in absolute
consumption between the developed and developing world. Production is however
increasing rapidly in the developing world to supply both local markets and for
export.
Windhorst (2006) produced a detailed review of changes in poultry production and trade
world wide based on the extensive FAO database which shows significant changes in the
relative importance of the UK and EU poultry meat industries between 1970 and 2005.
Worldwide production of poultry meat increased by 4.36 times in this period. However
whilst the developed world had around 75% of poultry meat production in 1970 this had
fallen to 45% by 2005(Table 1). In this major change of location Asian and South
American countries, particularly China and Brazil, showed the greatest increase with
Europe and North America having a relative decrease. Nevertheless developed countries
still showed an increase of 227% over this time frame.

14
Year World Developed
countries Developing countries
Share% of developing countries
1970 15,101 11,219 3,882 25.7 1975 18,648 13,409 5,275 28.2 1980 25,965 17,986 7,979 30.7 1985 31,206 20,775 10,431 33.4 1990 41,041 25,827 15,214 37.1 1995 54,771 28,392 26,379 48.2 2000 69,191 32,708 36,483 52.7 2005 81,014 36,663 44,351 54.7 Increase % 436.5 227.1 1,042.5
Table 1. Development of poultry meat production in developed and developing countries (1970 to 2005) ; in 1000t (FAO Database) When the time trends of the top ten countries involved in poultry production are examined
(table 2) the USA remains top but its world share has reduced from 30.8% to 22.9%.
China has increased from 6.4% to 18.1% and Brazil from 2.55 to 11.0%. Production in
the UK increased by 2.7 times but its share of the world market reduced from 3.8% to
1.9%.
The four major European producers, France, Spain, Italy and the UK, taken together
declined from 15.4% of world production to around 7% (Italy dropped from the top 10
completely). The EU 25 would now represent around 12% of world total production.
Whilst the top ten countries are responsible for 66% of world production the top three
now produce 52%.
One significant change is that Russia which was in second place in 1970 (with more than
1 million metric tonnes or 7% of world total) is no longer in the top ten producers, having
only around 1% of world production in 2005. Projections for 2007 are for a production of
1.8 million metric tonnes with imports around 1 million. In comparison with other
countries this increase of only 2 to 3 times in production and consumption is very low for
what is potentially a grain and oilseed rich country. Current changes and developments in
that country would suggest that internal production will rise significantly and their
dependence on imports will change in the next 5 to 10 years.

15
Country 1970 Production 1000t
Share (%)
Country 2005 Production 1000t
Share %
USA 4,645 30.8 USA 18,538 22.9 USSR 1,071 7.1 China 14,689 18.1 China 971 6.4 Brazil 8,895 11.0 France 637 4.2 Mexico 2,272 2.8 Italy 626 4.1 France 1,971 2.4 United Kingdom 578 3.8 India 1,965 2.4 Spain 499 3.3 United Kingdom 1,573 1.9 Japan 490 3.2 Spain 1,341 1.7 Canada 447 3.0 Indonesia 1,268 1.6 Brazil 378 2.5 Japan 1,240 1.5 Top 10 10,342 68.4 Top 10 53,752 66.3 World 15,101 100.0 World 81,014 100.0
Table 2. Ten leading countries in poultry meat production in 1970 and 2005 (FAO Database) The FAO data also give a good indication of the relative importance of the various species
of poultrymeat (Table 3). There was little change in the importance of chicken meat at
around 87% whilst Turkey meat declined slightly from 8% to around 6.5% with this small
opportunity being taken up by Duck and Goose meat. This would tend to justify the focus
of this report on chicken meat.
Year Chicken Turkey Duck Goose other TOTAL
1970 87.0 8.1 3.3 1.5 0.1 100
1975 87.8 7.8 3.0 1.3 0.1 100
1980 88.2 7.9 2.7 1.1 0.1 100
1985 88.3 7.8 2.8 1.0 0.1 100
1990 86.4 9.0 3.0 1.5 0.1 100
1995 85.1 8.3 3.8 2.7 0.1 100
2000 85.3 7.4 4.3 2.9 0.1 100
2005 86.4 6.4 4.2 2.9 0.1 100
Table 3. Development of share of Global Poultry Meat Production from Windhorst (2006) and FAO Database

16
Poultrymeat consumption in the UK has increased threefold between 1970 and 2006 (Fig.1)
0
200
400
600
800
1000
1200
1400
1600
1800
2000
1965 1970 1975 1980 1985 1990 1995 2000 2005 2010
Year
'000
met
ric to
nnes
Fig 1 Long term trends in total poultrymeat consumption in the UK (Data from MLC)
More detailed data taken from the DEFRA website shows recent trends for broiler and
turkeys separately, along with imports and total consumption (Fig.2). This covers the last
12 years. http://statistics.defra.gov.uk/esg/datasets/poulpsq.xls
0
200
400
600
800
1,000
1,200
1,400
1,600
1,800
2,000
1992 1994 1996 1998 2000 2002 2004 2006 2008
Year
'000
tonn
es
Broilers Turkeys Imported Total Consumption Fig. 2 Detailed recent data on Poultrymeat consumption in the UK (DEFRA)

17
Against this background we can then consider what the way forward will be for poultry
meat and do this in comparison with other meats in Europe. EU projections indicate
relatively little growth in per capita meat consumption (1.1kg) but most of that increase is
in poultry (0.8kg) (Table 4).
2007 2008 2009 2010 2011 2012 EU-25 Beef and veal 17.9 17.7 17.6 17.5 17.5 17.5 Pork 43.0 43.5 43.5 43.5 43.7 44.0 Poultry 23.6 23.9 24.2 24.3 24.5 24.6 Sheep Goat 2.8 2.8 2.8 2.8 2.8 2.8 Total 87.8 88.0 88.1 88.2 88.5 88.9 http://ec.europa.eu/agriculture/publi/caprep/prospects2005b/tabmeat.pdf
Table 4. Meat per capita consumption projections in the EU, 2007-2012 (kg/head) Breeding All these data sources indicate a slowdown in the previously rapid increase in poultry
meat consumption in the UK and more widely in the EU. The UK data in Fig.2 show the
recent growth in imports which is likely to continue whilst DEFRA data for production
only show a basically level situation since 1998.
Although the EU projections indicate some slight increase is poultrymeat
consumption the table takes no account of or gives any indication of where this
poultry meat will be produced.

18
A Truly Global industry The statistics set out above indicate one aspect of the global nature of the poultry industry.
The real global aspect is that essentially all the elements for a poultry industry can be
purchased and transported to any part of the world which has the basic conditions to allow
the growing of poultry. The breeds and feed raw materials can be purchased or produced
worldwide. More than 90% of the breeding stock used in broiler production come from
only three suppliers. The major raw materials, maize , wheat and sorghum for energy and
oilseeds (with some animal material) for protein are the major components of poultry
diets worldwide . The oilseeds first have the oil extracted and then the resulting meal is
available for feed. Currently 97% of extracted soymeal is fed to livestock. The
environmental control and husbandry equipment is universal and the same suppliers can
be seen at any poultry exposition worldwide. Finally there is a globalization of Food
Service and Retail buyers and therefore customer requirements and standards. To give
some examples Yum (KFC), McDonalds, Tesco and Walmart would specify and source
product on all continents.
Increasingly the poultry production will shift to regions of the world where the raw
materials are available and the climate is favourable for chicken production. Finished
product can then be transported to the international markets.
19
Genetics
The Evolution of the modern broiler from the original Jungle fowl has taken around
5000 years but by far the greatest development in meat birds has taken place in the last
two centuries with massive advances in the last 50 years. These have been closely
linked to advances in science of genetics.
Chicken breeds used today in commercial agriculture are considered to originate from the
Red Jungle Fowl (Gallus gallus). The exact time and place of domestication are unclear,
and this may have occurred more than once during human history. It is believed that the
modern chicken derives from birds kept by the people of the Harappan culture (2500-2100
B.C.), primarily for fighting purposes. Thus the chicken has been domesticated for around
4000 years and it must be assumed that for much of that time some form of selection for
desired characters was taking place. Selection for certain phenotypic characters ( comb
type, feather colour or length etc.) took place by breeding only from individuals which
displayed the desired character long before Mendel’s work on inheritance explained a
possible mechanism.
In recent genetic analysis studies the greatest similarity was found between G.gallus and
the egg type breeds often referred to as Mediterranean. This would suggest that these
groups were developed first from the wild progenitor and led subsequently to the
biodiversity of chicken breeds which had developed across the world by the 19th century.
During the 19th century in USA many specific breeds of chicken were developed for meat
production. The most successful were Plymouth Rock types and the New Hampshires
which along with the breeds of Cornish origin were used by the developers of the modern
broiler lines. All these lines have a natural yellow skin and brown eggs typical of the
modern broiler. The combination of Cornish, Plymouth Rock and New Hampshire shows
that the original broiler breeding programmes were based on genetic sources developed on
both sides of the Atlantic. Albeit most development of the Cornish breed apparently took
place after its relocation to the USA. However this theme of interchange of genetic
20
material between breeding programmes and specific enhancements in both Europe and the
USA can be followed throughout the development of the modern broiler.
Several publications appeared in the 1920’s which laid the foundations of poultry genetic
science and during that same decade some of the originators of the meat chicken breeding
industry began their work.
Following the rediscovery of Mendel’s work some confusion arose in trying to explain the
inheritance of characteristics controlled by multiple genes. Further explanation and
refinement of genetic principles was required and this was provided in the first half of the
20th century with the development of quantitative genetic theory. Thus during this time the
evolution of the science of genetics and commercial poultry production became closely
linked and mutually stimulated as people tried to apply methods for understanding and
utilising the theory in commercial selection programmes
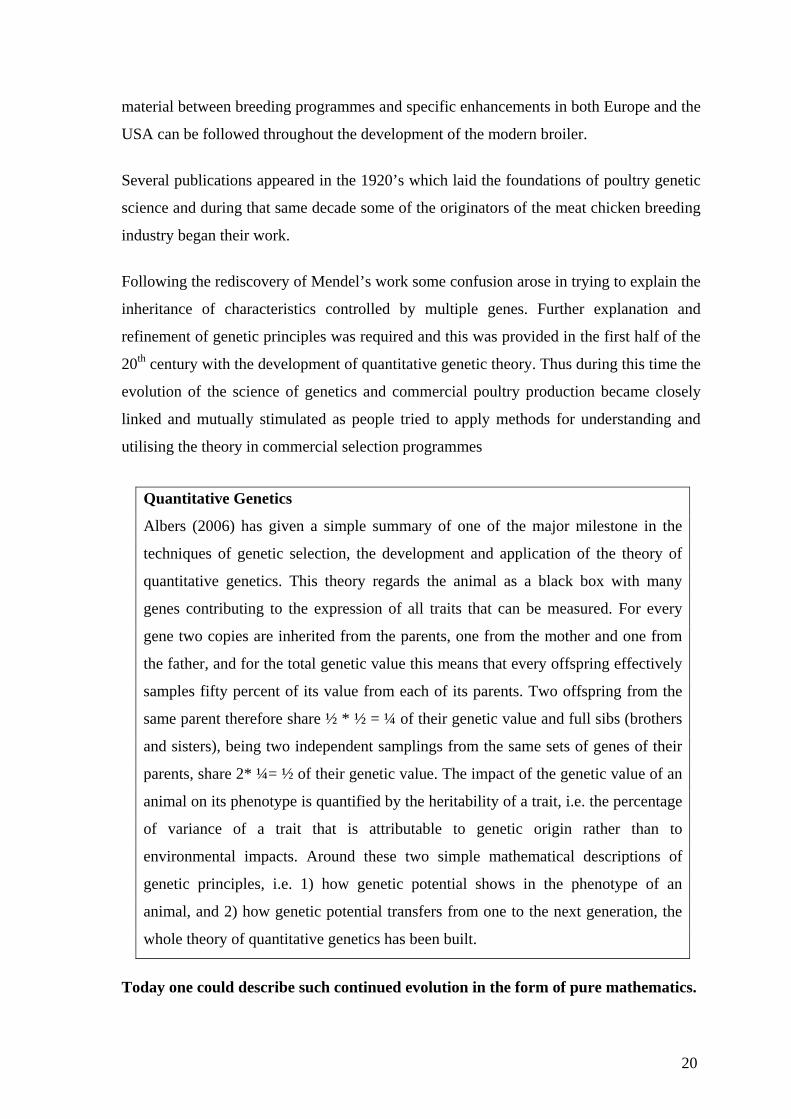
Quantitative Genetics
Albers (2006) has given a simple summary of one of the major milestone in the
techniques of genetic selection, the development and application of the theory of
quantitative genetics. This theory regards the animal as a black box with many
genes contributing to the expression of all traits that can be measured. For every
gene two copies are inherited from the parents, one from the mother and one from
the father, and for the total genetic value this means that every offspring effectively
samples fifty percent of its value from each of its parents. Two offspring from the
same parent therefore share ½ * ½ = ¼ of their genetic value and full sibs (brothers
and sisters), being two independent samplings from the same sets of genes of their
parents, share 2* ¼= ½ of their genetic value. The impact of the genetic value of an
animal on its phenotype is quantified by the heritability of a trait, i.e. the percentage
of variance of a trait that is attributable to genetic origin rather than to
environmental impacts. Around these two simple mathematical descriptions of
genetic principles, i.e. 1) how genetic potential shows in the phenotype of an
animal, and 2) how genetic potential transfers from one to the next generation, the
whole theory of quantitative genetics has been built.
Today one could describe such continued evolution in the form of pure mathematics.
21
It is important to remember that at the same time as the developments in genetic science
were occurring various reproductive technologies e.g. artificial incubation and hatching,
lighting programmes to enable year round production and artificial insemination were
developed. These techniques were also essential to enable the development of poultry
breeding programmes and the production industry.
It is difficult to say precisely when the modern broiler breeding began since there have
been a number of key developments. However, whilst special broiler lines have been
available for almost a century the first “industrial” breeding could be said to have begun
with the hybridization of selected pure breeding lines developed from the original breeds
and continued with further more intense selection of the pure lines. This process then
accelerated as genetic science advanced.
The first steps towards the mathematical-statistical approach to genetics were taken by
R.A. Fisher in 1918. From the early 1950’s Alan Robertson of the ARC Unit of Animal
Genetics provided major contribution to link theoretical population genetics, quantitative
genetics and practical animal breeding. Robertson’s group and others associated with it in
Edinburgh have been a significant factor in the success of the commercial breeding
industry in UK and Europe.
A further critical breakthrough came about through the work of C.R. Henderson who
developed methodology to combine all information about each individual’s breeding
value into a genetic index of merit. In 1953 he introduced what we now know as BLUP
(Best Linear Unbiased Prediction) breeding value estimation. However, it was not until
computers were available having the capacity and speed that was required to do the
extensive matrix calculations, that this technology was put to use in animal breeding.
Today’s poultry breeding programmes all apply full pedigree-ing of all birds and exploit
BLUP-breeding value estimations to obtain the best possible identification of superior
breeding candidates. Obviously, the parents of the next generation have to be identified as
early as possible (to minimize the generation interval) and genetic selection has to be
devoted with the right emphasis to the right traits as demanded by the market. Albers
concluded “Competitive forces have assured that only those breeding programmes that
have done this in the best possible way have survived until today!”

22
A comprehensive summary of the key contributions to the development of modern
breeding programmes has been provided in Arthur and Albers (2003). Table 5.
Technique Decade
Mass selection 1900
Trapnesting 1930
Hybrid crosses 1940
Pedigree 1940
Artificial Insemination 1960
Osborne index 1960
Family feed conversion 1970
Selection Indices 1980
Individual Feed conversion 1980
Physiological measurement – Oximeter 1980
Leg condition measurement -Lixiscope 1980
BLUP Breeding value estimation 1990
Lifetime FCR measurement 2000
Multi environment selection 2000
DNA Markers 2000
Table 5 Milestones in Breeding Technology ( after Arthur and Albers 2003)
DNA and Genomics
Table 5 has brought us to the present century. Current and future developments in poultry
breeding will focus heavily on DNA and Genomics which therefore require a simple
introduction.
Genomics is the study of an organism’s genome and the use of genes. The genome of an
organism is the complete DNA sequence. DNA creates the genetic code for building and
maintaining an organism. Within the DNA sequence are areas called genes and these
genes are templates for protein synthesis. Differences in the sequence may alter the
structure and function of a protein. Differences in DNA make individuals unique and offer

23
the opportunity for selection.
In December 2004, the scientific journal, Nature, published the sequence of the entire
Chicken genome. This was 1,000,000,000 base pairs long ! This knowledge provided the
opportunity for breeders to search for differences between individuals in their DNA
sequence and potentially explain differences in observed phenotypic traits. One type of
difference would be a single base change in the DNA. This is called a single nucleotide
polymorphism (SNP – snip). In the chicken 2.8 million of these SNP markers have been
mapped and are therefore available for evaluation.
Aviagen has established the Genomics Initiative which is a major commitment to identify
SNP’s in our lines which are associated with traits of interest. The core of this Genomics
Initiative is a large scale genotyping project which utilizes data from the existing pedigree
and sib test programme, a DNA or tissue sample bank, other academic research and the
published chicken genome. The Initiative involves collaboration with Iowa State
University, USA; Institute of Animal Health (Compton) UK; Roslin Institute UK,
Wisconsin University, USA, Auburn University, USA and Avian Diseases and Oncology
Laboratory Missouri USA. In addition joint funding has been provided to 7 current PhD
students in UK Universities.
A significant opportunity presented by genomics is the case control study approach which
allows information to be gathered from Aviagen birds under commercial conditions. This
will help identify SNP markers which may help select for traits that are rarely seen in the
pedigree or sib-test environment.
A major challenge of this approach which is additional to the association studies is the
development of implementation tools. Aviagen will develop the tools which will allow us
to capitalize on the findings of the association studies. These capabilities to maximize the
use of genomics in breeding programmes will result in economically viable delivery of
enhancements in genetic progress. Genomics will become part of the ongoing continuous
stock selection and improvement process. The research will also provide opportunities to
deliver enhanced strain security and breed traceability. In a climate of increasing
consumer interest in the total food supply chain, Aviagen recognises the important
part it plays as an integral component at the start of the human food chain.

24
Breeding
The traditional way of describing a breeding system has been to use a pyramid. (Fig 3)
Identifying the pedigree programme as the apex and expanding the levels as they pass
through great grandparents (GGP), grandparents (GP), parents (PS) and commercial
(broiler) production. The scale and timescale of the operation can be added to this to give
an indication of the importance of both. We usually describe a situation where the time
from pedigree selection to commercial broilers is 4-5 years. Each generation has a
reproductive lifetime and this affects whether one refers to shortest time for gene flow or
the average time over which these genes are operating in the commercial population. The
size of the influence depends somewhat on the reproductive characters of each generation
and the final broiler size but a pedigree base unit of 1 male and 10 females will produce
about 50 million broilers or around 70,000 metric tonnes of broiler meat.
Pedigree Pedigree SelectionSelection
Genetic Genetic ImprovementImprovement
GGPGGP
Grandparent StockGrandparent Stock
Parent StockParent Stock
BroilersBroilers
ProcessingProcessing
ConsumersConsumers
Aviagen2007
2008
2009
2011
2010
1 x 10 ♂ ♀
48,750,000 Broilers
68,750 Tonsof Meat
150 GGPs
7500 GPs
375,000 PS
Fig 3. Traditional description of a Breeding Programme applied to the Broiler Industry

25
I believe that Fig. 3 is actually a false description of the modern programmes as it
understates their current importance. This would be better described by two pyramids –
one smaller which supports the larger (inverted) one. The latter contains all the elements
necessary for an agricultural production system and the former all the requirements to
develop and maintain a breeding programme – experimental lines, test lines, pure lines,
and the not inconsiderable support systems of modern genetics (Fig.4).
1
Pedigree Selection
Genetic Improvement
GGPGGP
Grandparent StockGrandparent Stock
Parent StockParent Stock
BroilersBroilers
Processing/Retailers/Food ServiceProcessing/Retailers/Food Service
ConsumersConsumers
4 years
Health&
GenesFeedbackInterest groupsScience
ResourcesRegulation
Research and development
Improved stockBreeding Breeding programmeprogramme
Control lines Development lines
The Production Process
Fig 4. Representation of a modern breeding programme and its relationship to the
production process
Thus the true representation of the primary breeding, genetic sector of the industry would
be this inverted pyramid which “supports” the whole industry. This diagram also
reinforces the fact that the breeding sector, with a lead time of 4 years to production even

26
after the contributory product lines have been developed, is truly leading and enabling the
production sector. Where new products are involved the lead time is actually much longer
than this since the research and development of lines before they can enter the
“production” pedigree system is itself 4-6years. Thus the most likely lead time for a new
product would be around 10 years. Even then this can only take place if the feedback
mechanisms are in place and addressed to have identified the parameters required in the
new product.
In the last forty years the company’s genetic selection programme has become an
increasingly sophisticated tool, achieving rapid balanced progress across the product
range. Since the 1960’s where live-weight was almost the only trait selected for, the
number of traits has greatly increased, covering not only production traits but also traits
related to the physical and metabolic support, livability and health of the selected bird.
This can be represented in simple diagrammatic form (Fig.5)
2
1960
Liveweight
NowSkeletalIntegrity
Eggs
Hatchability
Weight
BreastMeat
MeatQuality
ImmuneResponse
GrowthProfile
FeedConversion
Heart/ Lung
Fitness
Genetic Selection Criteria
Fig. 5 Diagram of the development of Trait inclusion in a modern Breeding programme
(N.B. Each sector would include several traits and sector sizes do NOT represent
relative importance)
27
Unfortunately the basis for much of the criticism of broiler breeding assumes that the
current programmes are still closer to the left side of the diagram than the right!
Some of these perceptions may originate from the fact that early descriptions of the
breeding process often used the ‘apple pie’ analogy in which traits were assigned to slices
of the pie. In this analogy it would be explained that putting more effort (larger slices) into
a particular trait would result in less effort (smaller slices) in some other area – since there
is only one pie. In the early days of mass selection and simple sire linked programmes
relatively few traits were considered (3 to 5) and the technologies available were such that
the analogy was valid.
In the modern programmes in which >40 traits may be considered it might be asked what
happened to the apple pie analogy and the trade off between traits. Continuing the analogy
we can explain that we now know that historically we were effectively dividing the slices
of the pie using the extremely blunt handle of the knife whereas now we are making our
cuts with the precision of a surgical scalpel or even a laser cutting tool. The extra traits
have been acquired from what was previously the unrecognisable debris and crumbs of
the earlier less precise systems.
The evolution of these multiple trait systems has been dependent on the development of
genetic theory, computing power and technologies for more accurate and reliable
measurement which can also be used quickly and easily with large numbers of birds.
Performance improvements in poultry breeding have been quite spectacular over the past
50 years and some of these are shown in the later section of this report which analyses the
data collected by the NFU in UK for more than 30 years.
It is reasonable to ask the question “How much of the performance gains over the past
fifty years have been down to genetics and how much is attributable to improvements in
feed formulation, environmental control and husbandry systems.” Havenstein et.al. have
carried out an elegant series of trials, the latest reported in 2003, in which Modern strains
of broilers were compared with the Athens Canadian Randombred Control Strain

28
established in 1957. By using also 1957 and 2001 feed specifications these studies could
conclude that for growth rate, carcase and parts yield the genetic selection brought about
by commercial breeding companies had contributed 85 to 90% of the change over 45
years whilst nutrition had provided 10 to 15% of the change. For feed conversion and
mortality this estimate was more difficult since age and weight must be allowed for but
the modern strain showed an 18% higher FCR on the 1957 diet. Combining genetic and
nutrition influences the modern strain grew to an identical weight in one third of the time
with a three times better FCR.
In Aviagen we have retained control lines for three of the lines which continued to be
developed and contribute to the current broiler crosses. This is a unique situation since
there is direct evolutionary lineage and the control lines can be used for a direct
comparison with their current form and their crosses. Two recent studies have examined
the impact that selection for growth rate and yield has had on broiler body composition
and on broiler welfare as measured by leg health and mortality. (Fleming et al 2007a,
2007b)
The conclusion of the first study was that Genetic progress has resulted in significant
changes in the body composition of the broiler. The Modern lines were significantly
heavier with a higher proportion of breast meat (almost 54% higher on a weight basis) and
a lower amount of body fat than the Control lines (Modern lines were almost half as fat as
Control lines). In addition, Modern lines were shown to be more responsive to dietary
protein than Control lines.
The second study examined the effects of the dramatically increased growth potential of
broilers. In view of an apparent positive correlation between growth rate and the
occurrence of leg disorders and rapid growth rate, it is widely presumed to be a
fundamental cause of leg ill-health in the modern broiler. However, it has been
previously recognised that the simultaneous improvement of growth rate and reduction in
incidence of leg disorders is possible (Sørensen, 1992). Using data from genetic control
strains grown alongside modern broiler strains it is possible to explore directly the impact
that selection for growth has had on broiler welfare.

29
The differences in performance between the Modern and Control lines were significant.
Despite these differences in performance there was no significant difference in mortality
between the Modern and Control lines, whilst leg health was generally better in the
Modern lines. The Modern lines in this study were selected using a Best Linear Unbiased
prediction (BLUP) of breeding values for a range of traits including growth rate and leg
health. The data from this study show that it possible to select for increased growth rate
with no detriment to welfare as measured by leg health and mortality.
These studies show the considerable benefit of having control lines which allow direct
comparison of genetic lines differing only in the selection pressure which has been
applied to them. Studies which do not rely on extrapolation of data drawn from widely
differing genetic material evaluated in different environments and under different
nutritional regimes.
The genetic development of bird types or products During the 1980’s broiler breeds were often referred to as heavy or light types the former
giving best broiler and Roaster (heavier weight/ older age) performance whilst the latter
was much more reproductive. Birds with these differing attributes fitted the different
markets at the time but it was soon realized that selection for broiler characters and
improvements in reproductive characters could be achieved at the same time. That is, the
relationship between broiler traits and reproductive traits did not have to be negative in
the commercial situation. Therefore since that time strain crosses have been produced and
developed which have much superior reproductive performance with little or no
slowdown in the improvements of broiler characters. The data on broiler and breeder
performance taken from the NFU records over 30 years (presented later in this document)
show that whilst broiler daily gain increased and FCR decreased in line with selection
expectations, the reproductive traits of egg and chick numbers also showed continuous
improvements. Therefore in these data, growth rate and reproductive efficiency would
show a positive relationship. This has been possible by the incorporation of multiple traits
into a balanced selection decision for each line and hence the final commercial cross. It
could now be said that the previously “recognized” negative correlation between broiler
30
and reproductive traits may have resulted from selection programmes which could not or
did not combine the relative effects of traits in these two groups.
I would suggest that the literature is strewn with “well known facts” about the
relationships between various selection parameters showing positive or negative
correlations which may be then perceived to be detrimental to the animal. Many of these
difficult relationships have been addressed by breeding companies for very many years
and there are now different relationships which can be demonstrated. The livestock and
the relationships within them are evolving as are the feeds supplied to them and the
environment and husbandry systems in which they are raised. It would therefore be
surprising if relationships became permanently fixed.
The skill of the commercial geneticists over many years has been to recognize these
difficulties, to react to them and whenever possible change the selection direction
and/or the relationships.
The time frame of genetic selection In order to demonstrate the difficulty and complexity of the selection process this can
partly be described using the example of leg health.
Since the 1970’s leg health has been recognized as a major concern in broiler production.
( in the late 1970’s I personally inherited a breeding programme which already included a
selection process for leg condition based on sire progeny testing – partial pedigree)
Whilst it was clear that some progress in improving leg health could be achieved by
including this as a selection trait it was also recognized that at least fifteen separate
conditions could result in “lameness”. Therefore to make significant improvement in
individual traits which could be shown to have significant heritability would need to be
addressed. In the early 1980’s several breeding companies collaborated in a study of
Tibial Dyschondroplasia (TD) which resulted in the PhD thesis of John Mercer (1983).
This showed that TD was heritable and could be reduced by selection.
It was then necessary to find a way to assess TD which did not involve killing the bird
and dissecting the tibia – which is not useful in a breeding programme ! In the late 1980’s

31
the Lixiscope was identified as a tool to view the Tibia in a field situation and specific
selection against TD could begin.
From the late 1980’s to the present day the Aviagen broiler lines have shown a consistent
reduction in variation and absolute incidence of TD.
A recent study of commercial broilers in Denmark (Petersen 2005) has shown a reduction
from 57% TD in 1999 to 0.7% TD in 2005. Whilst this change did not directly parallel the
genetic changes in the pure lines making the broiler cross it occurred during a time of
changes in nutrition and husbandry recommended by the breeding company in order to
gain from the known genetic improvements.
I believe this is just one good example of the challenges which have been addressed
in identifying traits suitable for selection and developing techniques to address these
and then the importance of linking the genetic developments to correct management
practices.
Timeframes for genetic change may be long and outcomes depend also on changes in
management practice.
One significant feature of the chicken meat industry is the detail and accuracy with which
performance and profitability can be determined. This is particularly so in the United
States where a major Industry reporting service produces monthly reports on all aspects of
the production and slaughter with aggregate costs ranked in tables showing detail to 0.01
cents. With production numbers in tens of millions per month for several major
companies this is not unrealistic. The existence of these data in formal national recording
systems and within individual large companies has been a major driver for the activities of
breeding companies.
The influence of this accuracy of recording should not be underestimated, it
represents one of the many feedback mechanisms to the breeding programmes.
Historically this level of accuracy in performance recording was absent from the
production systems of other species.

32
Breeders and the Breeding Business
As a preamble to this section it is necessary to make some definition of the way that I will
use the terms Breed, Brand, Product since these have evolved along with the development
of the industry.
It could be said that in the beginnings of the commercial broiler industry a breed or brand
or product or company almost always meant the same thing.
However the Breeds/ Brands have developed different products and companies have
acquired other Breeds/Brands. This is an important point in any debate about the dangers
of concentrating breeding into fewer companies. Comparing say twenty-five years ago
with the present time it would be necessary to compare the number of breeds then with
the number of products now. Concentration of breeding into fewer companies has both
assisted and driven the development of multiple products within brands and development
of the gene pools of different breeds to facilitate this.
The Breeding Business The evolution of the breeding business has been from many specialized single line
breeders to a lesser number with multiple lines and sometimes multiple species or types.
During the 80’s (and 90’s) primarily there began a process of rationalization which
resulted in certain companies focusing on certain types or species e.g. layers or broilers or
turkeys. Intellectual and production efforts were focused on the issues and multiple trait
selection broadened.
For a while the remaining successful companies were selling only one product albeit with
the initial aim of it satisfying several “markets”.
Early in the development of the breeding industry companies began to focus on one sector
of the market and develop a product for that sector. In effect we had a relatively large
number of “one product” companies and this was portrayed as strength. There was
however an apparent cycle in the success of a company aligned to that product. With 10-
20 companies and hence 10-20 products a few would be “right” for the market needs at
any point in time. As the market needs changed other companies and products would
become a better match and market shares would change. The industry requirements were
33
always satisfied but breed dominance changed in both time and across world regions.
With the decline in the number of companies, effectively if the “one product” failed to
match the needs of the market the whole company was doomed! The current remaining
companies are those which have developed good anticipatory skills and hence product
portfolios which address several sectors of the market. The “one product fits all” approach
which was very successful for many years and served the industry well has been replaced
with a multi product approach tailored to the specific needs of the markets.
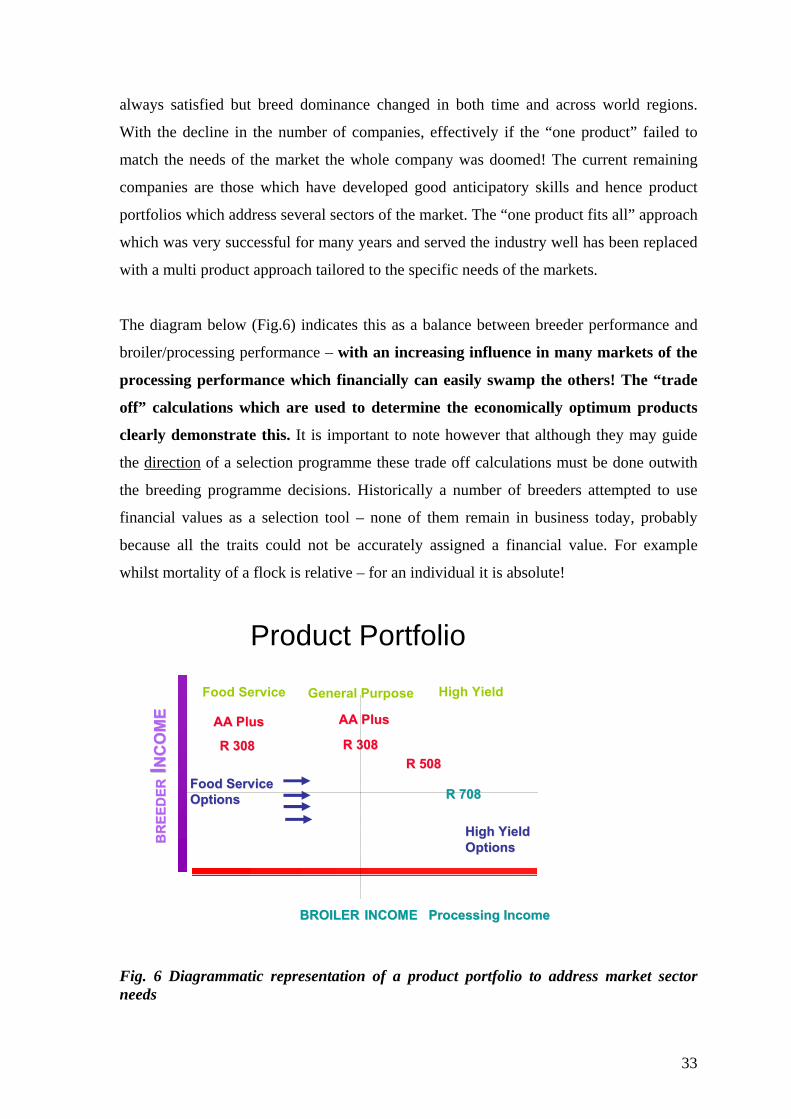
The diagram below (Fig.6) indicates this as a balance between breeder performance and
broiler/processing performance – with an increasing influence in many markets of the
processing performance which financially can easily swamp the others! The “trade
off” calculations which are used to determine the economically optimum products
clearly demonstrate this. It is important to note however that although they may guide
the direction of a selection programme these trade off calculations must be done outwith
the breeding programme decisions. Historically a number of breeders attempted to use
financial values as a selection tool – none of them remain in business today, probably
because all the traits could not be accurately assigned a financial value. For example
whilst mortality of a flock is relative – for an individual it is absolute!
BROILERBROILER INCOME Processing IncomeINCOME Processing Income
BR
EED
ERB
REE
DER
II NC
OM
EN
CO
ME
General Purpose High YieldFood Service
R 308R 308R 508R 508
Product Portfolio
R 708R 708
AA PlusAA PlusAA PlusAA Plus
R 308R 308
Food Service Food Service OptionsOptions
High YieldHigh YieldOptionsOptions
Fig. 6 Diagrammatic representation of a product portfolio to address market sector needs
34
The recent reduction in the number of companies and hence potentially a reduction in
products was associated with the development of specialized lines and crosses for broilers
[Food service , whole bird large and small and heavy yield type birds now used for
complete meat stripping] and Turkeys [ medium and heavy strains]. More recently with
the arrival of molecular genetic technologies and genomics etc. the need for significant
investment in an expensive process which can have applications across chicken types and
even species there has been a certain “aggregation” of brands and products. This has
reintroduced more choice to the overall market. However it is the market which
ultimately determines the successful products which have usually been produced in
response to market indications i.e. in anticipation of demands.
The breeding process has an extremely long time scale, 5 years from pedigree to broiler
production, even after the product specification has been determined and the relevant lines
have been assembled and developed. This latter process may be at least five years if a new
product is not derived from existing lines. It is therefore necessary for the primary
breeding companies to anticipate/ forecast the needs of the industry from a minimum of 5
years to potentially 10 years ahead. This must be a continuous ongoing process.
Conversely it can be said that the production industry can only develop if the necessary
genetic material is available. Thus there is a considerable synergy in the activities of the
primary breeding companies and the future requirements of the industry (and its
legislation). The feedback process indicated on Fig 4 (Page 24) is a very vital part of the
activity of a successful breeding company.
This feedback may now come from any level of production or consumption or
legislation or indeed across the total worldwide food chain.
The development of the modern Broiler breeding industry has been a very dynamic
process. Individual breeders usually had single breeds and these gained success in time
and region according to how well the product matched the needs of the market. A
perception has often been voiced around the industry that breeds/ products have a finite
life. This situation may have existed if a breeder committed excessively to certain traits in
order to satisfy the then market without anticipating the way the market may change or
the fact that markets around the world varied. Although we consider the development of
broiler breeding from the point of view of Europe and USA, markets and broiler

35
industries quickly developed in all continents. Initially these markets “followed fashion”
and took the breeds/ products which were available but gradually over time the breeding
companies recognized different market requirements which required different products.
As I have just indicated the situation with regard to breeders and breeding companies has
been a dynamic one and therefore any attempt to follow exactly the path of all companies
from birth to death – or their present state could be the subject of a whole study. The
following two figures give an indication of the recent evolution of breed/ brand
ownership. Figure 7 shows a point in the late 70’s early 80’s with some of the breeds
which were available from independent companies. This is by no means the complete list
of breeders, simply it contains the major one’s at the time for whom logo’s are still
available. The notable exceptions from this montage would be H&N, Kennebec, Tatum
from USA, Marshall’s (UK) and Tegel and Steggles (Australia). This would lift the
number to around 20 breeders worldwide some 25 to 30 years ago.
Primary Breeders - Historical
Fig. 7 A Snapshot of the major breeds available circa 1980

36
A process of breed/brand acquisition ( and loss) over the last 25 years has resulted in
ownership of the major breeds/brands by only four major breeding companies- Aviagen,
Tyson, Hendrix Genetics and Groupe Grimaud. Three of these four have European
ownership. A similar situation obtains in the Turkey breeding sector with Aviagen and
Hendrix Genetics owning the three main brands.
Primary Breeders - Today
*
Fig. 8 Grouping and ownership of the main chicken breeds/brands in 2007. (NB Groupe Grimaude no longer use the Shaver and ISA Breed names) Depending on ones viewpoint the situation described in the figures above could be seen as
positive or negative for the future of product diversity and opportunity for broiler poultry
production worldwide. However as has already been indicated, new product development
by breeders has run contra to the concentration of breeds in common ownership. In the
historical situation the 14 logos represented no more than 15 products, each of which was
the company’s only available commercial product. Whilst it is somewhat difficult to be
specific to a point in time regarding products which are available, examination of the 4
major company’s current websites in early 2007 indicate that 17 products would be
available at that time. It must therefore be assumed that the concentration of genetic
resources and the loss of diversity often implied may not be as significant as has been
portrayed. Clearly the fundamental strategies of the remaining primary breeding

37
companies have evolved significantly over the past 25 years and this change is closely
aligned to their survival.
We have seen that the techniques and technologies involved in breeding have undergone
continual refinement and development since the beginning of the 20th century. Several of
the changes in the last 50 years have been as a direct result of the development of
computers and the ongoing improvements in their processing capabilities. Nevertheless
many companies remained in business until the 1980’s using the basic mass selection
techniques based on phenotypic measurements, sometimes with a simple sire pedigree
system for the all important male lines.
Interestingly whilst Artificial insemination became the cornerstone of Turkey breeding
and thence the production systems this technique has relatively little relevance in meat
chicken breeding programmes or production. Around twenty years ago several of those
people with experience of A.I. and Turkey breeding counseled the broiler breeders to
avoid developing a dependence on that technique.
Those that heeded the warning survived!
I have already referred to the fact that the breeding industry is often criticized for its focus
on growth rate with an implication that this is to the exclusion of other traits. However
even in the early mass selection programmes traits such as leg condition and body
conformation (the precursor to yield measurement) had a significant influence on the
breeding goals and impact on the final product. These “Yield type or Roaster” birds
capable of growing to heavier weights gained market share in the UK in the 1980’s
compared with the more reproductive types. This was driven in part by the retail need at
the time for whole fresh birds which could be displayed without a label covering any
breast blemishes. Incidentally this development removed a bird welfare issue and led to
the development of higher yielding strains. The breast blemishes had resulted from a
combination of sharp keel bones and poor litter conditions leading to pimples, bruises and
blisters. Changing the shape of the bird effectively removed some of the components
contributing to the damage. The driver for growth rate selection was not only that this is
correlated with profitability but also that bird weight and bird age were the two

38
parameters which all producers could measure and record.
For many years this meant that it was a major feature of decision making by the
producers/buyers of the products.
In many countries even today the critically important parameter of feed conversion is not
measurable in any detailed way.
39
The UK Industry Throughout this presentation some of the evolution of the UK meat industry has been
implied.
This presentation offers the chance for some of the more specific points should be laid
out.
During the 1970’s there were 5 or 6 breeds represented in the UK, the NFU Bulletin
recorded 55 hatcheries supplying broilers and an important consideration there were at
least ten educational establishments providing courses aimed at supporting the Poultry
industry. For comparison the current figures would be 4 breeds (available), <20 broiler
hatcheries and 2 or 3 educational establishments – offering mainly partial courses or
modules.
NFU Data In the United States there are long term records of industry performance and economic
statistics compiled by Agristats and Agrimetrix. In addition to the month by month
management information which these data sets provide to the contributing companies they
also generate a valuable data set on long term trends in the US industry. There has been
no directly comparable data set collected in Europe or the UK with the exception of the
Data collected by the NFU from 1971 to 2003. These data concentrated on the
performance and economic statistics (costings) of the members who were either contract
broiler growers or broiler breeder flock farmers.
I believe it is relevant to include in this document some data which represents a
consistent, independent source of UK performance over a significant period of time. I am
indebted to the NFU and in particular John Parsons (editor 1994 to 2000 [Temperton
Fellow #9 – 2000]) who provided me with a complete set of both the Broiler and Breeder
Bulletins one of which, the 100th issue already contained some summarisation split into 5
year periods. Beginning in 1971 this went through to 1996 and it was possible to add the
2001 figures before the publications ceased in 2003. Where possible I have added some
comparable data for 2006 for completeness. These data cannot of course be taken as
representing actual figures for all production in the UK i.e. the integrations are not

40
included but its value is its consistency, as evidenced by the growth and FCR data. ( By
coincidence these data cover exactly my own involvement with the poultry industry which
began in the UK at the AFRC Poultry Research Centre in April 1971.)
In his 100th edition review the Editor noted that the annual figures used are not totally
comparable, as data were collected in different ways for different periods of time but the
trends are clear and well defined. I have re-examined the original data in order to
determine which sets I am comfortable to reproduce. It is important to remember that
these data represent the breeds used across the industry at any point in time but the major
two featured in all years though in varying proportions.
Broiler Data The production data reflect a remarkably consistent linear improvement in both Daily gain
and FCR. Daily gain expressed as grammes per day of life (Fig. 9) removes the need to
specify ages and until the last few years when average killing weight increased slightly
was not affected by this. The regression indicates an annual improvement (in the field) of
0.89g per day per year – equivalent to 37.5 g per day to 42 days. This has an R2 value of
0.989- a remarkably good fit for field data over this time
y = 0.829x + 30.474R2 = 0.9893
0.00
10.00
20.00
30.00
40.00
50.00
60.00
70.00
1971
1973
1975
1977
1979
1981
1983
1985
1987
1989
1991
1993
1995
1997
1999
2001
2003
Year
Dai
ly G
ain
(g/d
ay)
Fig. 9 Long term trend broiler daily gain (g/day) from UK industry data set (NFU Broiler Bulletins)

41
A linear regression has been fitted to the FCR data (Fig 10) which shows a reasonable fit
(R2 = 0.942) and an annual improvement of 0.016. This represents a major contribution
to the profitability of the industry in terms of reduced feed inputs. Additionally it is a
major reduction in waste outputs which are having an increasing relevance in the light of
IPPC regulations.
Close examination of the data plot might suggest an acceleration in the rate of
improvement. A simple calculation between 1971 and 1987 gives an improvement of only
0.0118 per year whereas the same calculation over the remaining period to 2001 gives
0.0214. Almost double the rate of improvement. This acceleration in the rate of FCR
improvement would be expected from the increasing sophistication of the selection
procedures for Feed efficiency over the last 20 years and hence field performance over the
last 15 years. The further recent development by Aviagen of the “lifetime FCR”
techniques should result in further acceleration of improvements in this trait (see page 50).
y = -0.0155x + 2.3077R2 = 0.942
1.50
1.60
1.70
1.80
1.90
2.00
2.10
2.20
2.30
2.40
1971
1973
1975
1977
1979
1981
1983
1985
1987
1989
1991
1993
1995
1997
1999
2001
2003
Year
FCR
Fig. 10 Long term trend in FCR (kg feed per kg liveweight) from UK industry data set (NFU Broiler Bulletins) As explained these data cover all breeds used over the data collection period but the fact
that they show a good linear fit and a steady improvement in performance implies that
over this extended time frame the breeds had to match each others performance. Though
42
having said this at certain times the then current leader would have a significant market
share.
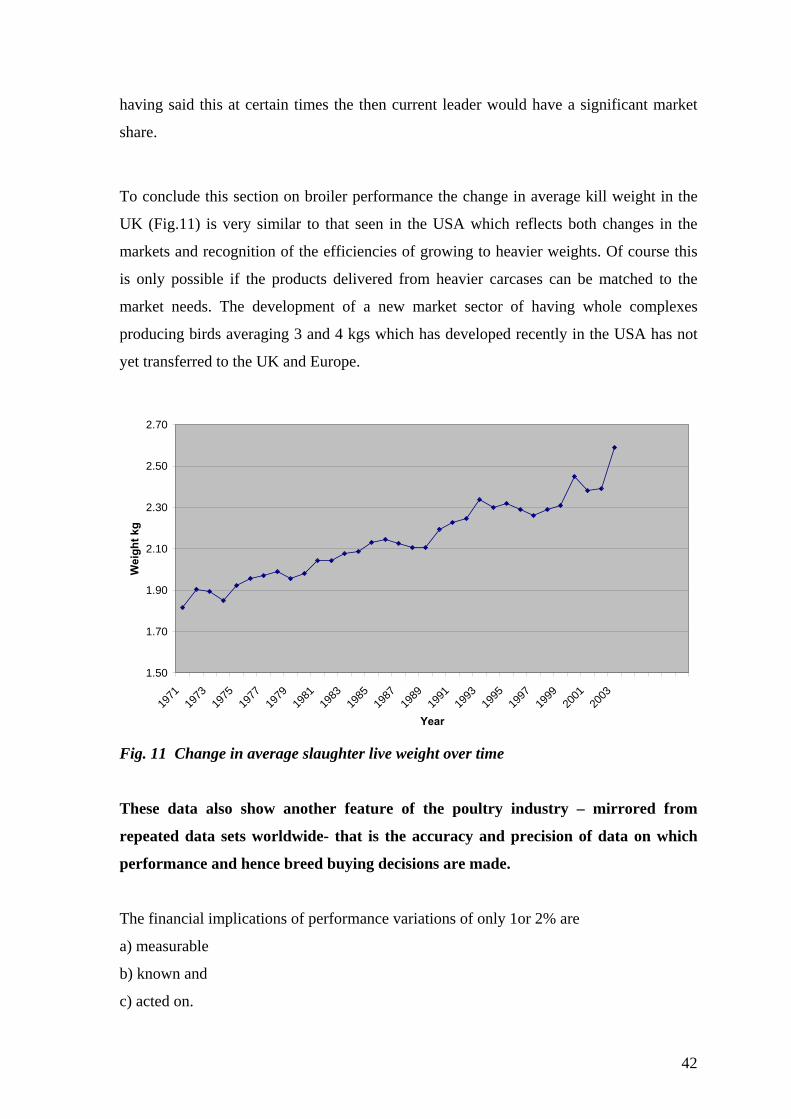
To conclude this section on broiler performance the change in average kill weight in the
UK (Fig.11) is very similar to that seen in the USA which reflects both changes in the
markets and recognition of the efficiencies of growing to heavier weights. Of course this
is only possible if the products delivered from heavier carcases can be matched to the
market needs. The development of a new market sector of having whole complexes
producing birds averaging 3 and 4 kgs which has developed recently in the USA has not
yet transferred to the UK and Europe.
1.50
1.70
1.90
2.10
2.30
2.50
2.70
1971
1973
1975
1977
1979
1981
1983
1985
1987
1989
1991
1993
1995
1997
1999
2001
2003
Year
Wei
ght k
g
Fig. 11 Change in average slaughter live weight over time These data also show another feature of the poultry industry – mirrored from
repeated data sets worldwide- that is the accuracy and precision of data on which
performance and hence breed buying decisions are made.
The financial implications of performance variations of only 1or 2% are
a) measurable
b) known and
c) acted on.

43
In this respect I believe the Poultry industry is significantly ahead of other agricultural
livestock sectors although their sensitivity is fast improving. To return to the comments at
the introduction of this section the comparative data collection systems which are
available in the USA are much more detailed and more comprehensively used than
anywhere else in UK or Europe. This willingness to supply and share data – anonymously
– for benchmarking can be of considerable value to cost reduction in the industry. It
allows realistic goals to be identified and pursued. I believe the European industry has
been particularly slow to see the value of such cross company data collection –
concentrating rather on the perceived disadvantages of such a system and apparent
advantages of confidentiality (secrecy) of data release. A further argument has often been
promoted that the various countries and companies have no standardisation of data
collection and therefore any attempt at comparison is invalid. A main feature of the main
system used in the USA is its focus on direct collection of data and standardisation before
any analysis. To repeat I believe that over many years European producers have
missed a significant opportunity by failing to have any routine accurate
benchmarking system. Furthermore using a system of production efficiency
measurement (EPEF, PS) which ignores direct cost information may have focussed
attention on the wrong drivers.

44
Breeder data Unfortunately the NFU breeder data is not such a clean and consistent data set as that for
broilers and I have therefore been unable to collate as reliable and useful analyses as for
the broilers. The data for flock farmers on breeder performance has significant gaps and
therefore Aviagen company data was used for additional comparison over the latter
period. (Fig. 12) Of course this added data relates to only one breed but the broad trend of
improving performance is still evident. The data supports the breeding company aims of
providing an improvement of 1 chick per breeder per year which represents a 25 to 30%
improvement over the last 25 years. Over the same time period we have seen broiler daily
gains and FCR showing considerable improvements. Although the data does not extend
far into the 1970’s I believe we can see some indication of the higher breeder performance
at that time which would have been when the breeds were often the lighter, higher egg
producing types before the serious introduction of higher yielding-lower reproductive
strains. This transition is probably the point at which some critics of broiler breeding were
persuaded that growth and meat yield were negatively correlated with reproductive
performance. I believe the long term trends show that the breeding companies and
their geneticists recognised this problem and have for over 20 years delivered stock
with positively correlated outputs for both broiler characters and reproduction.
80
90
100
110
120
130
140
150
160
170
180
1970 1975 1980 1985 1990 1995 2000 2005 2010
Year
Num
ber
Total eggs NFUTotal eggs companyHatching eggs NFUHatching eggs companyChicks NFUChicks company
Fig. 12 Long term trends in breeder performance – Total eggs, hatching eggs and chicks. Data from two sources combined

45
Cost Data The NFU bulletins also contain data on costs as they apply to certain sectors of the Uk
industry over time. Whilst they do not represent costs for the integrated companies they
can demonstrate long term trends and hence relative changes over time. The major inputs
to the breeder operation are feed and parent chick cost. The following graph (Fig.13)
shows changes in breeder feed cost in pence per bird (lifetime to 60 weeks) and the day
old parent cost over the last 30 years.
0
200
400
600
800
1000
1200
1970 1975 1980 1985 1990 1995 2000 2005
Year
Cos
t (p)
Breeder female cost Feed cost
Fig. 13 Changes in major input costs over time –Day old breeder female and total feed cost to 60 weeks. For the breeder sector we can also follow the change in first input cost – the parent
breeder chick – over time. Fig. 14 shows the relative change in price of a one day old
parent chick for each five year interval from 1973 to 2004. In the initial five years of this
period breeder price increased by over 80%. Over time this % increase has steadily
declined. As the quality of the genetic potential delivered to the start of the chain
increased its relative cost decreased significantly.

46
0.00
10.00
20.00
30.00
40.00
50.00
60.00
70.00
80.00
90.00
1975 1980 1985 1990 1995 2000 2005
Year(5 year increments)
% in
crea
se o
ver 5
yea
rs
Fig. 14 Relative increment in breeder price for each five year period The data on returns to the contact egg producers in the NFU data are quite incomplete but
the graph (Fig. 15) covering the early period shows a significant change in the prices paid
per hatching egg or per chick in the early 1980’s. After this point rates of increase slowed
probably linked to the levelling of feed costs (Fig 13)
0
200
400
600
800
1000
1200
1400
1600
1970 1975 1980 1985 1990 1995 2000 2005
Year
Pric
e (p
)
price/100he price/100ch Fig. 15 Prices paid to the flock farmer per 100 chicks or 100 hatching eggs

47
Moving on to the costings data from the Broiler Bulletins which are much more complete
it is possible to plot changes in the major input costs over time (Fig. 16), feed prices have
clearly fluctuated considerably. Chick costs have increased but the rate of that increase
has slowed. Energy and labour and catching cost have remained quite steady over the last
15years which presumably reflects the increasing farm and house sizes which lead to
efficiencies and hence savings in both these costs.
0.00
10.00
20.00
30.00
40.00
50.00
60.00
70.00
80.00
90.00
100.00
1970 1975 1980 1985 1990 1995 2000 2005
Year
Cos
t p/b
ird
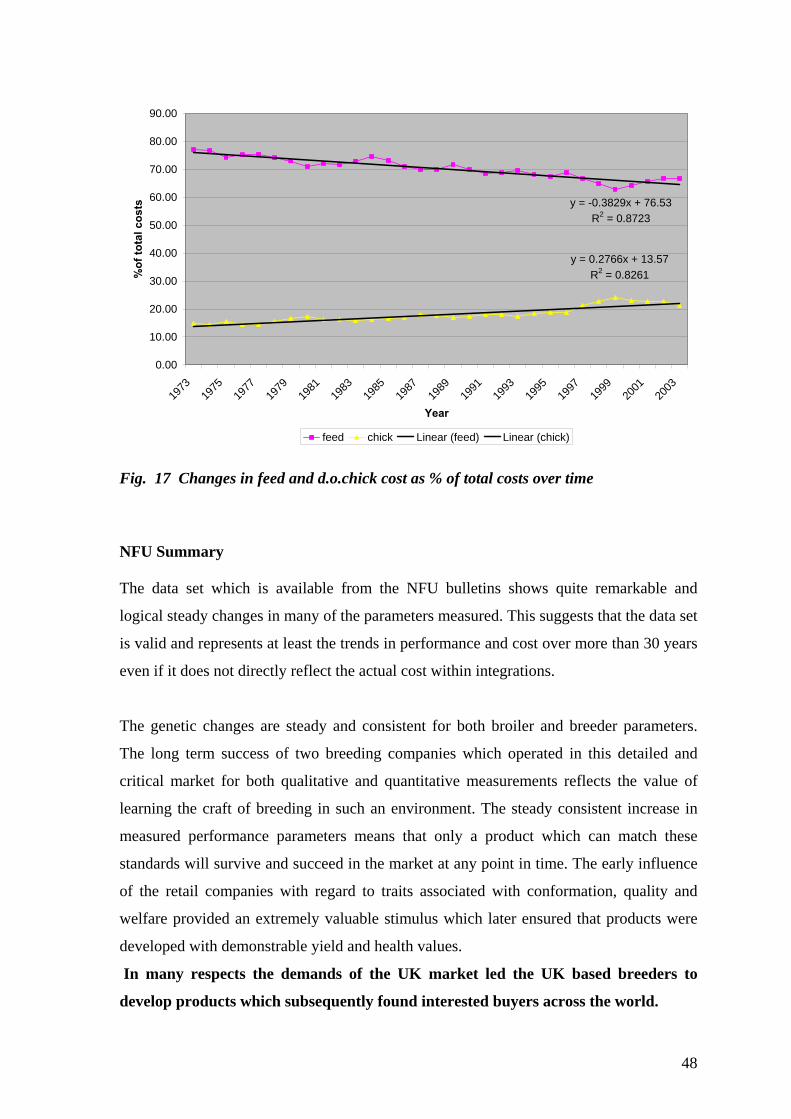
Chick Feed Energy Labour and Catching Other costs Fig. 16 Major input costs to produce a broiler chicken to slaughter weight If we examine the two major costs as a percentage of the total over time we see a slight
fall in feed cost which in addition to the absolute cost of feed must be reflecting the
significant fall in FCR. There is then a relative rise in % chick cost. Interestingly the
change in both these relative costs is almost perfectly linear over a thirty year period.
However close examination of the data over the latter years might suggest that the linear
trends were not continuing leading to a question of what any forward projection should
be.
48
y = -0.3829x + 76.53R2 = 0.8723
y = 0.2766x + 13.57R2 = 0.8261
0.00
10.00
20.00
30.00
40.00
50.00
60.00
70.00
80.00
90.00
1973
1975
1977
1979
1981
1983
1985
1987
1989
1991
1993
1995
1997
1999
2001
2003
Year
%of
tota
l cos
ts
feed chick Linear (feed) Linear (chick) Fig. 17 Changes in feed and d.o.chick cost as % of total costs over time NFU Summary The data set which is available from the NFU bulletins shows quite remarkable and
logical steady changes in many of the parameters measured. This suggests that the data set
is valid and represents at least the trends in performance and cost over more than 30 years
even if it does not directly reflect the actual cost within integrations.
The genetic changes are steady and consistent for both broiler and breeder parameters.
The long term success of two breeding companies which operated in this detailed and
critical market for both qualitative and quantitative measurements reflects the value of
learning the craft of breeding in such an environment. The steady consistent increase in
measured performance parameters means that only a product which can match these
standards will survive and succeed in the market at any point in time. The early influence
of the retail companies with regard to traits associated with conformation, quality and
welfare provided an extremely valuable stimulus which later ensured that products were
developed with demonstrable yield and health values.
In many respects the demands of the UK market led the UK based breeders to
develop products which subsequently found interested buyers across the world.
49
Discussion Throughout the factual part of this report I have added relevant comments and views in
order that they could be read alongside the information to which they related. This
discussion section will therefore simply attempt to review the main points of the report
and look to some of the future opportunities and responsibilities for a breeding company
as part of the World wide poultry production industry.
The main message of the review of global production is that poultry meat continues to see
significant increases in consumption and hence production. This is predominantly in the
chicken sector. The trend is towards more production in the developing world for
consumption both in developing countries and for export to the developed countries. It
can be expected that as the interest in and influence of climate change accelerates we will
see further concentration of production in the regions producing the major feed raw
materials, Brazil, USA, Southern Russia and eventually Southern Africa.
The essential theme of the genetics section is the close parallel of advances in science of
genetics and practical breeding. For almost a century commercial breeding companies
have maintained close contact with the science and were quick to utilise the new
techniques. This situation continues with the new science of genomics where the massive
commercial data sets on phenotypic traits are being made available along with genotype
information to develop the next generation of computer analysis.
It is of concern that the aims, methods, objectives and achievements of commercial
breeding programmes have often been misunderstood, even by many people close to the
industry, but specifically by consumers and society. This highlights the need for an
industry such as ours to make a greater effort to explain its position, aims and
objectives. This must be seen as one of the aims of this report.
The skill of the commercial geneticists over many years has been to recognize the
difficulties of selecting for apparently incompatible traits, to react to them and whenever
possible change the selection direction and/or the relationships. Closely related to this is
the challenge, which has been successfully addressed, of identifying traits suitable for
selection (those which are heritable) and then developing techniques to correctly measure

50
these. The timeframes for genetic change may be long and the final outcome may depend
also on changes in management practice. Recognizing the importance of linking the
genetic developments to correct management practices has had to be addressed by the
successful breeding companies. However correct the DNA is in the livestock supplied,
support must also be given to ensuring development of the correct HUSBANDRY and
stockmanship skills by the end users. The technical support and service teams for any
breeding company has been integral to its success.
The essential synergy of a successful breeding company is that the geneticists ensure the
correct genetic content of the livestock supplied and the technicians ensure that it is
correctly expressed in the customers enterprise.
The technical teams and ultimately the geneticists can only respond to objective accurate
information. The influence and therefore importance of this accuracy of recording should
not be underestimated; it represents one of the most important of many feedback
mechanisms to the breeding programmes. It is worth restating that historically this level
of accuracy in performance recording was absent from the production systems of other
species and is one of many reasons why poultry breeding and production has achieved its
leading position in animal agriculture.
Throughout the development of broilers we have seen an increasing influence in many
markets of the processing performance which, financially, can easily swamp the others!
The “trade off” calculations which are used to determine the economically optimum
products clearly demonstrate this. Many companies saw the opportunities of this and
included it as part of a balanced breeding programme. Equally, some companies either
failed to recognize the true significance of yield: by either under or overestimating its
importance. Economic evaluation must give broad direction to breeding strategy but
cannot be applied within the selection decisions.
The essential role of feedback in developing strategy in a breeding programme has
already been mentioned in regard to data collection. However this feedback has to be
much broader and must now come from all levels of production or consumption and
anticipate legislation. In view of the global nature of this industry all aspects of the
worldwide food chain must be considered with a view to potential needs and
51
developments. In view of the long term nature of breeding and product development
which I have described the most useful feedback is visionary and anticipatory (if this is
not contradictory to the concept of feedback!)
I have highlighted the absence of comparative objective measurement systems in some
markets, however most individual companies would have their own detailed data sets. The
accuracy and precision of data on which performance and hence breed buying decisions
are made is unique to the poultry industry and mirrored in repeated data sets worldwide.
This meant that for many years this was a major feature of decision making by the
producers/buyers of the products. The consistency of the overall improvements seen in the
NFU data set would indicate that unless a product could lead or match this trend it would
not feature in the market.
This does not detract from my earlier statement that I believe that over many years
European producers have missed a significant opportunity by failing to have any routine
accurate benchmarking system.
Looking to the future I can only draw on the information available from my current
employers and the evidence from their past. Throughout the development of the breeding
and selection process innovation has been sought and utilized at Aviagen, we have many
examples.
From the field of human medicine the oximeter, which measures oxygen carrying
capacity of the blood, has been adapted and applied to ensure animals have strong hearts
and healthy lungs.
Aviagen was the first primary breeding company to utilise the lixiscope, a hand held, real
time x-ray device, in selecting for skeletal leg strength.
More recently the company has successfully adapted radio transponder and weighing
technology to monitor feeding behaviour and feed conversion rates. This unique system of
“Lifetime Feed Conversion” recording allows assessment of the behavioural drivers of
feeding, meal frequency, meal amounts etc. which may have significant impact on the
overall efficiency of feed utilization. At a time when the Global Warming Potential of
various agricultural sectors is under close scrutiny (Williams et al 2006) this new
52
technique should further accelerate the improvements in FCR and reinforce the leading
position of broiler production in this regard.
Ultrasound measurement of muscle development has been routinely used for many years
as one of the strategies to improve meat yield. The new generation of these devices allows
improved visualisation of the anatomical structure of the bird to ensure the correct balance
of meat deposition.
In an increasingly competitive market, Aviagen has continued to invest in research and
development techniques and the company’s focus is now on efficient progress across
more traits. The sequencing of the chicken genome and its public release during 2004,
coupled with successes in initial studies and a reduction in the cost of typing markers, has
led Aviagen with the assistance of the Scottish Enterprise Research and Development
Plus programme, to make a multi-million pound investment in their Genomics Initiative.
An extension of the company’s existing technologies, genomics, provides additional
information about the products’ existing natural variation and provides a new tool for
further stock improvement through selective breeding. The uptake of genomic
approaches in breeding programmes of other livestock species is growing, and Aviagen is
confident of the potential for genetic markers in poultry breeding. The development of
the research will lead to further identification of genetic markers for improving selection
accuracy in current and new traits, including disease resistance.
In conclusion
I would say that I believe the long term trends show that the breeding companies and
their geneticists recognised the problem of conflicting biological and performance traits
and have for over 20 years delivered stock with positively correlated outputs for both
broiler characters and reproduction and have addressed many aspects of the health and
welfare debate successfully.
In many respects it has been the demands of the UK market over the last 50 years that led
the UK based breeding companies to develop the genetic skills and from those, the
superior products which subsequently found interested buyers across the world.
53
Significant Contributions of H.A.A.C. and N.I.P.H. to the Evolution of Poultry Meat Breeding in the UK. A Temperton Fellowship presentation would not be complete if it did not acknowledge
the contribution which Harper Adams and the National Institute for Poultry Husbandry
has made to the topic of the fellowship.
Following my observations earlier that much of broiler development was a synergy of
inputs from USA and Europe we should note that the establishment of N.I.P.H. at Harper
Adams was a result of the sabbatical visit of Professor Willard C .Thompson of New
Jersey College of Agriculture in 1924.
Since the creation of the Institute the list of students is a testimony to the contribution
which has been made to the UK poultry industry by their education. The list of activities
of the College and Institute also demonstrate the fundamental place that they have had in
developing the Poultry industry in the UK.
Finally I should specifically acknowledge the education by the college of two of my
current colleagues David Butler (1963) and Ian Panton (1966). I have enjoyed and
benefited from my interactions with both over many years as competitors and colleagues.
David is the longest serving and world respected member of the Ross and later Aviagen
technical teams. David’s contribution to the management of broiler breeders and broilers
has been immense and many hundreds of technicians and company managers worldwide
have benefited from his knowledge and wisdom.
Ian held many positions during his career at Ross Breeders and then Aviagen culminating
in his role as CEO of Aviagen Group which he has led to be the world’s largest and most
successful poultry meat breeding company.

54
The last word
The last words in any report on Evolution should be those of Charles Darwin. I am
indebted to Dr Trefor Campbell (Temperton Fellow 13, 2005) for using the following
quote which I believe could summarise my report.
“It is not the strongest of the species that survives, but the ones most responsive to change.”
Charles Darwin
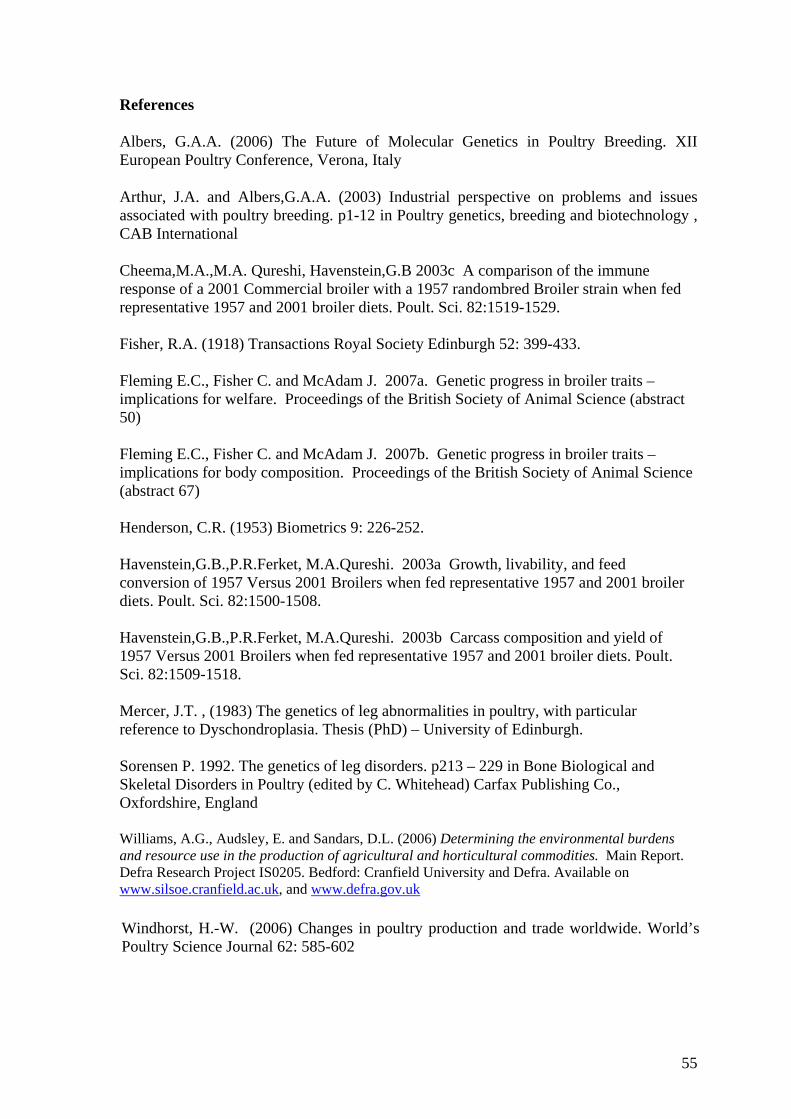
55
References
Albers, G.A.A. (2006) The Future of Molecular Genetics in Poultry Breeding. XII European Poultry Conference, Verona, Italy
Arthur, J.A. and Albers,G.A.A. (2003) Industrial perspective on problems and issues associated with poultry breeding. p1-12 in Poultry genetics, breeding and biotechnology , CAB International
Cheema,M.A.,M.A. Qureshi, Havenstein,G.B 2003c A comparison of the immune response of a 2001 Commercial broiler with a 1957 randombred Broiler strain when fed representative 1957 and 2001 broiler diets. Poult. Sci. 82:1519-1529. Fisher, R.A. (1918) Transactions Royal Society Edinburgh 52: 399-433. Fleming E.C., Fisher C. and McAdam J. 2007a. Genetic progress in broiler traits – implications for welfare. Proceedings of the British Society of Animal Science (abstract 50) Fleming E.C., Fisher C. and McAdam J. 2007b. Genetic progress in broiler traits – implications for body composition. Proceedings of the British Society of Animal Science (abstract 67) Henderson, C.R. (1953) Biometrics 9: 226-252. Havenstein,G.B.,P.R.Ferket, M.A.Qureshi. 2003a Growth, livability, and feed conversion of 1957 Versus 2001 Broilers when fed representative 1957 and 2001 broiler diets. Poult. Sci. 82:1500-1508. Havenstein,G.B.,P.R.Ferket, M.A.Qureshi. 2003b Carcass composition and yield of 1957 Versus 2001 Broilers when fed representative 1957 and 2001 broiler diets. Poult. Sci. 82:1509-1518. Mercer, J.T. , (1983) The genetics of leg abnormalities in poultry, with particular reference to Dyschondroplasia. Thesis (PhD) – University of Edinburgh. Sorensen P. 1992. The genetics of leg disorders. p213 – 229 in Bone Biological and Skeletal Disorders in Poultry (edited by C. Whitehead) Carfax Publishing Co., Oxfordshire, England Williams, A.G., Audsley, E. and Sandars, D.L. (2006) Determining the environmental burdens and resource use in the production of agricultural and horticultural commodities. Main Report. Defra Research Project IS0205. Bedford: Cranfield University and Defra. Available on www.silsoe.cranfield.ac.uk, and www.defra.gov.uk Windhorst, H.-W. (2006) Changes in poultry production and trade worldwide. World’s Poultry Science Journal 62: 585-602


![· PDF fileMiss Celie's Blues Mark Steering [from The Color Purple (1985), music by Quincy Jones and Rod Temperton, Lyrics by Jones, Temperton and Lionel Richie] Sisters](https://cdn.vdocuments.site/doc/165x107/5a7cdd257f8b9a66798d29fb/celies-blues-mark-steering-from-the-color-purple-1985-music-by-quincy-jones.jpg)


