The Effectiveness of Countercyclical Fiscal Policy in
Turkey during the Recent Economic Crisis:
Evidence from a Natural Experiment1
Florian Mischa
Atılım Seymenb
March 2012
- preliminary draft -
Abstract
During the recent economic crisis, Turkey was one of the countries experiencing the sharpest
contraction in GDP. Yet, the subsequent recovery was stronger and faster compared to the
OECD average with GDP growth rates of around 10%. Given that Turkey implemented a range of
countercyclical fiscal measures that were fairly large relative to other developing countries and
to previous crises, the question that immediately arises is whether these measures helped to
stabilize the economy. This paper evaluates the effectiveness of a particular measure of the
Turkish fiscal response package to the recent global financial crisis, namely a temporary cut in
the value added tax (VAT) and special consumption tax (SCT) on a range of durable goods which
according to estimates provided a stimulus to the Turkish economy of 0.27% of GDP excluding
any multiplier effects. From a theoretical perspective, contrary to other measures such as a
decrease of income taxes or an increase in public investment, it is much more likely that a cut of
1 We wish to thank Fatih Özatay for extensive comments. This work is supported by the Economic Research Forum
(ERF). The contents and recommendations do not necessarily reflect ERF’s views, and the authors bear the sole
responsibility for all errors.
a Address: Centre for European Economic Research (ZEW), P.O. Box 103443, D-68304 Mannheim, Germany. E-mail:
b Address: Centre for European Economic Research (ZEW), P.O. Box 103443, D-68304 Mannheim, Germany. E-mail:
1
indirect taxes on durable goods helps to stabilize the economy as consumers shift expenditure
to exploit temporarily lower prices.
This paper contributes to the long-standing debate in economics about whether governments
should engage in Keynesian-style countercyclical fiscal policy based on a novel and innovative
approach: from the World Bank Financial Crisis Survey for Turkey, we have firm-level data for
the periods during and after the tax cuts and for firms that benefited from the tax cut and those
which did not or benefited less. This allows us to consider the temporary VAT and SCT cuts as a
natural experiment where the treatment effect is the tax cut and the control group consists of
firms not benefiting or benefiting less from the tax cut according to their product portfolio. The
advantage of this approach is that we avoid well-known caveats of empirical analyses of
countercyclical fiscal policy at the macroeconomic level, in particular the simultaneity between
fiscal aggregates and output, and are able to evaluate a specific fiscal measure that was recently
implemented which could not have been done using macroeconomic data.
We show that once the effects of the tax cuts are properly identified temporary VAT and SCT
cuts appear to have a strong effect on the change of firm sales. In particular, depending on the
specification, the tax cuts appear to increase the change of firm sales by around 30 percentage
points. While we are aware that notably the definitions of treatment and control groups are
subject to a number of problems, we try to address these issues in a number of ways using
various alternative specifications. The treatment effect remains significant and robust across all
specifications when controlling for unobserved shocks at the region and industry level; our
results are consistent with theoretical predictions. While from our evidence it is difficult to
derive the magnitude of the fiscal multiplier of these tax cuts, we conjecture that it was above
one and therefore contributed to stabilizing output by stimulating domestic demand.
JEL codes: E32, E62, H20
Keywords: Countercyclical fiscal policy, consumption tax cuts, firm-level data

2
1 Introduction
There is a long-standing debate in economics about whether governments should engage in
Keynesian-style countercyclical fiscal policy. During the recent global financial crisis, this debate
has gained new momentum as many countries implemented fiscal stimulus packages. A prime
reason for this was the fact that conventional monetary policy as an instrument for stabilization
was no longer part of the feasible policy set as interest rates hit historically low levels in many
countries. Given that the crisis was preceded by years of strong growth which increased fiscal
space, even developing countries which traditionally rather pursue pro-cyclical policies were
able to implement fiscal response packages. The objective of this paper is to re-visit the
effectiveness of such stabilization policies, in particular of a reduction of indirect taxes,
exploiting a natural experiment in with Turkish data from the recent crisis that comes from a
unique firm-level dataset.
Countercyclical fiscal policy can in general comprise a variety of measures including spending on
infrastructure and on goods and services, income transfers and tax cuts, which were
implemented in over a quarter of the countries within a group of 22 advanced and developing
economies surveyed by ILO (2009) in response to the global financial crisis. There is a large
empirical macroeconomic literature that addresses the question of whether fiscal shocks, in
particular a debt-financed increase of public spending or debt-financed tax cuts, can have a
positive impact on output over the short run. In general, this literature mostly applies vector
autoregressions (VARs) comprising quarterly series of output, fiscal variables and various other
inputs to private sector production. Most papers and empirical specifications find positive
output effects as a result of tax cuts (see Hebous, 2011, and Kneller and Misch, 2011, for
surveys of the literature).
Because of the simultaneity thought to exist between output and fiscal aggregates, the
identification strategy in the VAR framework is however critical. Recent papers including Romer
and Romer (2010) and Mertens and Ravn (2009) use narrative evidence such as speeches by
politicians to single out those tax changes that were implemented for reasons not related to
output or the state of the economy and only estimate the effects of those based on the U.S.
data. While this type of identification provides credible evidence on the effects of tax shocks, it
may be difficult to collect similar evidence for other countries. In addition, whether the results
of studies using the narrative approach also apply to the effects of fiscal anti-crisis measures
which these studies essentially omit from their analysis is unclear. More generally, even other
identification strategies cannot be used to evaluate the effectiveness of the specific measures
taken during the recent economic crisis: the crisis is likely to represent a structural break in the
series implying that there are not sufficient post-crisis observations of macroeconomic variables
available yet. From a policy perspective, another disadvantage of this literature relates to the

3
fact that – apart from few exceptions – it estimates the effects of broader fiscal shocks, but not
the specific effects that result from the change in a particular tax. This makes it difficult to ‘use’
these results for fiscal policy design in practice. Macro evidence also remains silent with respect
to the specific transmission channels, e.g., in case it stabilizes output, through what aspect of
the firm behavior this is achieved. More detailed knowledge about this aspect is, however,
crucial for the design of countercyclical fiscal policy packages.
An obvious remedy for the simultaneity bias thought to exist between fiscal aggregates and GDP
including its main components and other issues relating to macroeconomic evidence is the use
of micro data. Dating back to Shapiro and Slemrod (1995), there are several papers that
examine the effects of mostly income tax rebates or cuts on household expenditure using
mostly U.S. data coming from several different sources of household data. The micro-level
results imply a (modest) rise in aggregate consumption as a result of such tax changes, although
to varying degrees. Auerbach and Gale (2009) and Jappelli and Pistaferri (2010) survey this
literature in detail, and we provide a short summary of various papers in the next section.2
In contrast to the existing empirical literature, this paper takes a novel approach and estimates
the effects of one particular measure of countercyclical fiscal policy, namely a temporary cut of
indirect taxes, on firm sales using firm-level data. So far, firm-level data has rarely if ever been
used in this context.3 While temporary cuts in indirect taxes can be quickly implemented and
are therefore a fairly popular measure aimed at stimulating demand, theoretically, the effects
are ambiguous.4 One the one hand, a temporary value added tax (VAT) cut on durable and/or
luxury goods induces intertemporal substitution effects which policy makers wish to exploit,
namely that unconstrained households change the timing of their purchasing pattern to take
advantage of temporarily lower prices. This becomes possible because the expenditure on
luxury/durable goods does not have to coincide with the timing of their consumption making
them highly responsive to intertemporal price differences induced by temporary VAT cuts
(Crossley et al., 2010). By contrast, temporary tax cuts are unlikely to affect the timing of
consumption of necessity and perishable goods because the timing of purchasing and
consumption often have to coincide (Browning and Crossley, 2000).
2 There is also a branch of the literature that examines the effects of tax changes on firm-level investment which is
reviewed in detail by Auerbach and Gale (2009) and Hassett and Hubbard (2002). However, as Auerbach and Gale
(2009) argue, the results of this literature are not relevant in the context of evaluating the effects of tax changes to
stimulate the private investment over the short run.
3 As Heady (2011) points out, a VAT cut instead of a cut of income taxes, is however inconsistent with the desire to
promote long-run growth.
4 See Crossley et al. (2009), Barrell and Weale (2009) and Blundell (2009) for details.

4
On the other hand, a temporary VAT cut induces a temporary income effect. As a result
forward-looking consumers that are not credit-constrained will save the additional income as
parts of efforts to smooth incomes intertemporally. The reason is that Ricardian equivalence
dictates that future tax increases will be necessary to offset the cuts. As a further complication,
it is unclear whether the substitution and income effects will arise at all because VAT tax cuts do
not necessarily change consumer prices. The reason is that the degree of the pass-through, i.e.
the extent to which producers pass on the reduction to consumers, matters, which depends on
market structure and menu costs. A low pass-through leaves prices and therefore consumption
expenditure by consumers almost unchanged. Whether the pass-through is sufficiently high so
that VAT cuts induce significant price changes and whether the intertemporal substitution effect
exceeds the income effect are ultimately empirical issues. Theoretically, it may be expected that
the pass-through significantly differs from zero, and that the changes induced by the
substitution effect exceed the ones of the income effect.5 This makes it more likely that
temporary indirect tax cuts stimulate demand compared to other potential countercyclical fiscal
measures such as cuts of direct taxes which do not entail intertemporal substitution effects and
public investment programs which are often subject to implementation lags and sometimes
lead to outright waste of public resources.
For the purpose of empirical research, it is therefore most interesting to evaluate the effects of
temporary indirect tax changes where substitution effects can be expected. This is the case
when temporary consumption tax changes occur for durable and luxury goods rather than for
necessity and non-durable goods. At the same time, to be able to construct a control group as a
counterfactual, it is desirable that the VAT cut is not universal but covers some goods only.
Turkey is one of the few countries that have recently implemented such a change as part of
their fiscal response package to the global economic crisis, namely a cut of VAT and the special
consumption tax (SCT) at the peak of the financial crisis in 2009, making it an ideal case for our
investigation.6 The measures introduced by the Turkish government covered exclusively some
but not all durable goods.
In this paper, we use this policy change as a natural experiment to estimate the effects of these
tax changes: our firm level data includes company sales shortly prior to, during and after the tax
change, allowing us to implement a difference-in-difference approach where those firms
primarily relying on goods covered by the tax cuts are the treatment group and firms which
primarily sell goods not covered by the tax cuts are represent the control group. Contrary to the
existing literature and in the absence of detailed and higher frequency household data, we use 5 Blundell (2009) argues that at least for developed countries and most sectors, the pass-through is between 50%
and 100% with the distribution tilting towards the upper limit.
6 In the context of this paper, SCT and VAT cuts can expected to have identical effects and are therefore not
discussed separately.

5
the change in firm sales as an endogenous variable which, in aggregate, are likely to be closely
correlated with the change of aggregate private demand.
The comparability of the treatment and the control group is a crucial aspect in our specification
because firms are likely to have been affected differently by the financial crisis. Some non-
treated firms (i.e. firms that did not directly benefit from the fiscal stimulus) might have
performed better than treated firms (firms that were targeted by the fiscal stimulus measures)
simply because the former were less affected by the financial crisis. The control-group does
therefore not offer a perfect counterfactual because firms in different sectors may have been
subject to different time-specific shocks. In order to control for differences in exposure to
shocks induced by the global financial crisis across the treatment and control groups, we include
time-variant industry effects. Given that few (but not all) of the sectors are entirely part of the
control group, as a robustness check, we also exploit differences in the effects of the tax cuts
within the treatment group based on the export ratio of firms. Here, the underlying rationale is
that the more firms export, the less they are affected by domestic consumption taxes. The use
of this type of methodology and of firm-level data to evaluate countercyclical fiscal policy is the
first contribution of our paper.
The second contribution of the paper is to provide much needed firm-level evidence on the
effects of countercyclical fiscal policies in Turkey, an important emerging market economy, from
the recent crisis. By contrast, most of the existing literature focuses on the U.S. or other
advanced countries and uses macro methods. Given that during the global financial crisis,
Turkey was among those countries that experienced the sharpest contractions in GDP, anti-
crisis measures, and their evaluation, are arguably more relevant compared to advanced market
economies. This holds especially in the light of increased fiscal space that enabled emerging
market economies to implement countercyclical fiscal measures for the first time in many cases.
However, given that time series of developing countries are often too short and that other
econometric problems are likely to arise, our type of micro evidence is a more promising
approach to evaluate the effects of such policies in Turkey and other emerging market
economies. Our results indicate that the VAT and SCT cuts indeed boosted firm sales suggesting
that this measure helped to stabilize the Turkish economy by stimulating private demand. While
the data we use has limitations, our results appear nevertheless to be robust when we address a
number of possible concerns about their reliability. We conjecture that such temporary cuts of
indirect taxes are a suitable measure of countercyclical policy if stabilization is the prime policy
objective.
The paper is organized as follows. Section 2 provides a review of microeconomic evidence on
the effects of tax cuts at the household level and Section 3 some background information on the
crisis and countercyclical policies implemented during the crisis in Turkey. Section 4 presents
6
the data and provides descriptive statistics. Section 5 develops the specification to be tested
and presents the results. Section 6 concludes and discusses possible policy implications.
2 Literature
This section reviews the empirical literature on the effects of income tax cuts that were often
implemented as part of fiscal response packages at the household level which is probably the
closest related strand of literature. Shapiro and Slemrod (1995, 2003, 2009) investigate the
issue extensively. In particular, Shapiro and Slemrod (2003, 2009) conduct a household survey
and find that only a fifth of the households increased spending as a result of the 2001 and 2008
tax rebates. In other studies, the results are somewhat more nuanced. Broda and Parker (2008)
use weekly expenditures of a large number of households and estimate that the average
household increased spending on non-durables by 3.5% as a result of the 2008 tax rebate which
they argue had significant effects on non-durable consumption expenditure. Johnson et al.
(2006) use data from the consumer expenditure survey to examine the 2001 tax rebate and find
that households spent 20 to 40 percent of their rebates on non-durables which would imply
significant aggregate consumption effects. Finally, Agarwal et al. (2007) use credit card account
data to estimate the household response to the 2001 rebate. They find that while initially some
of the rebate was saved, spending increased subsequently. Watanabe et al. (2001) seems to be
one of the few papers that examine similar issues for other countries. They estimate the effects
of various changes to income and consumption taxes that were mostly meant to stimulate the
economy between 1975 and 1998. They find that the effects of temporary and permanent, as
well as anticipated and unanticipated, tax changes on consumer expenditure significantly differ.
Hori and Shimizutani (2007) likewise use Japanese micro data to estimate the effects of the
1995 and 1997 income tax cuts on household consumption. They also find differences between
both tax shocks.
3 Crisis and Countercyclical Cyclical Policy in Turkey
3.1 Macroeconomic Background The 2008-2009 recession was preceded by an average and fairly constant annual GDP growth
rate of 6.8% over the period 2002-2007 in Turkey, exceeding the ones of many other developing
economies (see Uygur, 2010). Yet, Turkey experienced one of the largest declines in GDP growth
during the crisis period in 2008-2009, and its performance was characterized by significant
volatility. Figure 1 compares the year-on-year growth of GDP and industrial production in Turkey
with the average of the OECD countries. At the deepest point of the crisis, the first quarter of
2009, the y-o-y GDP decline was registered 13% in Turkey, while it amounted to only 5.47% in
the OECD as a whole. However, Turkish GDP recovered from this deep point more strongly than

7
many other economies starting in the last quarter of 2009. The growth rates of both the GDP
and the industrial production in Turkey were much higher than in many other economies
following that period.
Figure 1: Macroeconomic indicators of Turkey and the OECD in comparison
The foregoing strong performance in the aftermath of the crisis was also reflected in the
unemployment rate numbers. As Figure 1 shows, the y-o-y percent change in the
unemployment rate was slightly higher than the OECD average during the worst periods of the
crisis, but the change in the unemployment rate turned negative earlier and stronger in Turkey
than in many other economies. In line with the hitherto picture, the consumption growth of
Turkey has been above the OECD average following the crisis.
3.2 Background on the Fiscal and Monetary Response The period of strong GDP growth between 2002 and 2007 witnessed at the same time declining
levels of public net debt stock: as percent of GDP, it gradually declined from 61.5% in 2002 to
28.2% in 2008 according to the Turkish Treasury. Strong GDP growth coupled with debt
reductions prior to the crisis and fairly low budget deficits of 0.6 to 1.8% of GDP between 2005
8
and 2008 provided fiscal space for relatively large fiscal response packages to counteract the
crisis. According to the estimates of SPO (2009), the total costs of the direct fiscal measures
taken in response to the global crisis amounted to (and were expected to amount to) 0.83%,
2.25% and 2.22% of the GDP in 2008, 2009 and 2010, respectively.
In addition, there were strong anti-crisis measures taken by the Turkish Central Bank (CBRT).
After the beginning of the recession, the overnight lending rate of CBRT had reached a peak of
20.25% in June 2008 and decline thereafter gradually to 8.75% in November 2010. As the first
wave of the consumption tax measures were announced in mid-March 2009, the rate was 13%,
and it had gradually declined to 9.75% by the time the second wave of the measures were
reaching an end in September 2009. Alp and Elekdağ (2011), who focus on the role played by
monetary policy in Turkey during the global financial crisis, argue that the recession would have
been much more severe without the interest rate cuts of CBRT. While in this paper, we do not
focus on the effects of monetary policy, the time effects that we include in the regressions
should pick up most of the impact of interest rate cuts.
The natural question that arises in this context is whether and to what extent the anti-crisis
measures contributed to the superior growth and unemployment performance of Turkey
following the lowest point of the crisis. SPO (2009) classifies the direct fiscal measures into two
groups: revenue and expenditure measures. The expenditure measures cover the extraordinary
government consumption and investments, social security contributions as well as transfers to
households and business. Under the revenue measures fall particularly changes in taxes on
individual income as well as business and consumption taxes.
3.3 VAT and SCT Cuts In Turkey, there are two main indirect taxes imposed on sales: the VAT and the SCT. Both taxes
are imposed on the same value. A VAT is applied to all goods and services sold, yet in three
different groups subject to a rate of 1%, 8% or 18%, respectively. The VAT and SCT cuts which
we focus on in this paper and which were an important element of the fiscal response to the
crisis amounted to an estimated GDP share of approximately 0.27% which is significant. Adding
to this number the reduction from 15% to 10% in the Resource Utilization Support Fund
deduction on consumer loans, an estimated 0.36% of GDP was used to boost consumption
directly by the State Planning Organization. Note that these numbers reflect the fiscal costs of
the undertaken measures, while their impact on GDP may have been much larger due to
multiplier effects. A number of VAT and SCT tax rate changes were aimed at the automobile
industry, amounting to about 40% of entire consumption tax measures.
The Turkish government decreased either the VAT or the SCT for some product groups in the
period between March and September 2009. These anti-crisis measures were implemented
using four different government decrees, see Table 1. The first three decrees numbered 14802,
14812 and 14881 referred to the period March/April-June, the last decree, numbered 15081, to

9
the period June/July-September 2009. All products that were the subject of the last decree were
included also in one of the previous decrees corresponding to the first period of the measures.
Yet, not all products that were mentioned in the first-period decrees were also subject to
reductions in the second period. The decrees numbered 14802, 14812, 14881 and 15081 were
announced and approved by the government only a short time before they entered into force,
namely on March 13, March 25, April 4 and June 12, respectively. Thus, there was generally a
short time period between announcement and implementation.
Table 1: Indirect tax reductions during the crisis
Types of products covered
Decree Period of tax cut
2nd
quarter
2009
3rd
quarter
2009
2nd
quarter
2009
3rd
quarter
2009
SCT reduction in white goods
and electronic household goods
as well as car industry
2009/14802 2009/15081a 17.03-
15.06
16.06-
30.09
VAT reduction furniture,
information, communication,
industrial and office equipment
2009/14812 2009/15081b 30.03-
30.06
01.07-
30.09
The list of products covered by
2009/14812 further extended 2009/14881 2009/15081b
15.04-
30.06
01.07-
30.09
An important characteristic of the foregoing cabinet decrees is that they reduce the VAT or the
SCT for different product groups at different rates. Therefore, there is a large heterogeneity in
this respect. The decree 14802 covers, among others, an SCT reduction from 6.7% to 0% for
various white and electronic goods and different levels of SCT reductions on different types of
products the car industry. The reduction in less-than-1600 cc passenger cars is, for example
from 37% to 18%, whereas it is from 1% to 0% for buses. Thus, when the VAT is also taken into
account, the total consumption tax declines from 55% to 37% for small passenger cars and from
19% to 18% for buses. The decrees 14812 and 14881 cover VAT reductions in new offices,
furniture, and some information, communication and bureau equipment. One part of the
decree 15081, that contains the measures for the second period, is called 15081a in Table 1 and
refers to a sub-group of goods in the decree 14802. The rest of the same decree, called 15081b
in the table is related to the decrees 14812 and 14881.

10
4 Data
Our firm level data comes primarily from the Financial Crisis Surveys (FCS) provided by the
World Bank, a specialized firm-level dataset to study firm behavior and performance during the
global economic crisis. Firms were surveyed during three periods: during June and July 2009
(wave 1), during February and March 2010 (wave 2), and during June and July 2010 (wave 3).
The resulting panel is unbalanced with 802 different firms surveyed and 1484 observations; the
average number of observations per firm is 1.83. All firms surveyed as part of the FCS are also
included in the 2008 round of the Enterprise Survey of Turkey (ES) carried out at the onset of
the crisis. This allows us to use additional variables on firm characteristics not included in the
FCS that can be considered as quasi time-invariant over the short run.
4.1 Assignment of Treatment and Control Groups We assign all firms in the data to either the treatment group (i.e., firms most affected by the tax
cut) and the control group (i.e., firms less or not at all affected by the tax cut). To do this, we use
firm-level information on the sector included in the FSC and on the main product which is the
product that represented the largest share of firm sales in 2008 from the ES. We then match
this information with detailed information on which product types were covered in the
government decrees implementing the tax cuts.
We recognize that this way of assigning firms to control and treatment groups may be subject to
different types of concerns which we address in several ways. First, and most obviously, even if
the main product is not subject to tax cuts, the firm may still have benefited from tax cuts if
secondary products that it sells but which we do not observe are subject to tax cuts. The
(unobserved) secondary products are likely to include close substitutes as in many cases as firms
specialize in certain areas. The tax cuts are designed such that they typically include most
substitutes. However, we cannot completely rule out that secondary goods of firms in the
control group may have been affected by tax cuts, but we argue that they are affected relatively
less compared to the treatment group.
Second, given that the product-level information comes from 2008, it is possible that firms
discontinued a particular product line, or that changes in demand led to changes in the product
mix so that firms started a new product line possibly changing their main product and thereby
the classification in treatment / control groups. In turn, demand changes may have been the
result of tax changes. For instance, firms that did previously not produce or sold a particular
product may have deliberately changed their strategy and increased the share of goods subject
to tax cuts in their overall sales through increased production for instance. To take these
problems into account, in some specifications, we exclude firms where sector information in the

11
FCS is contradictory and does not coincide with the 2008 information.7 While this may simply
indicate data problems or simply mistakes in the coding of the sector as part of the ES, it may
also possibly indicate a change in the product line. We find that the coefficient estimates are
only robust once we exclude these firms from the treatment group suggesting that this problem
is indeed important.
However, given that the decrees which led to the tax cuts were announced only few days prior
to implementation and that the duration of the tax cuts was only relatively short, it is unlikely
that, with adjustment costs, firms deliberately changed their product mix in response to the tax
cuts themselves. Adjustment costs make it also unlikely that firms which were subject to tax
cuts according to their main product in 2008 changed their product mix to the extent that their
classification as either firms of the treatment or control group changes. Even if they
discontinued the main product of 2008, it still seems likely that the remaining products are
substitutes and are affected by the tax cuts in the same way.
Third, sales of firms of which products are not covered by the tax cuts may still increase if their
products are complements with the products covered by the tax cut. This is typically the case for
intermediate inputs. For instance, sales for automobile parts used in the production of
automobiles may increase as well if taxes for automobiles are lowered thereby triggering an
increase in demand. As a robustness check, we therefore also include those firms in the
treatment group that produce goods which we believe are complementary with those goods
subject to tax cuts. In particular, in this specification, we include firms in the treatment group
that produce parts exclusively used by car producers.
Fourth, sales of firms that are exporting a large share of their output are not affected by tax cuts
as VAT and SCT are only levied on domestic sales, but not on exports. However, many firms
export only some share of their output thereby simply benefiting to a lesser extent from the tax
cut. As a robustness check, we only include non-exporters which we define as firms where
exports amounted to no more than 30% of total sales prior to the crisis. Given that demand in
export markets contracted as a result of the crisis, it is unlikely that firms were able to increase
their exports share to compensate for a decline in demand in the domestic market. In turn, this
implies that the share is likely to have remained constant or may have declined, rather than
increased, during the financial crisis.
Fifth, while the decrees to implement the tax cuts contain detailed product descriptions, the
product descriptions in our firm data are sometimes imprecise in the sense that there may still
7 As an exception, we do not exclude firms reported to operate in the retail or wholesale sectors in the ES or in the
FCS from our sample in most cases as these sectors do not have any implications for the types of goods sold. In
other words, sector switches involving these sectors do not necessarily imply changes in the product mix and may
rather have occurred due to mistakes made in the survey.

12
be uncertainty as to whether a particular product is covered by the decrees or not. In particular,
the terms used for the same product in the decrees and the firm dataset may be different. In a
robustness check, we therefore include all those firms in the treatment group for which this
type of uncertainty arises, but where we assume that the product was covered by the tax cut.
In essence, depending on which of these factors we take into account, we are able to construct
several distinct treatment groups that only partially overlap in terms of the firms they cover (see
Table 2). The treatment groups differ by whether we include firms in the treatment group with
recorded sector changes, firms that export over 30% of their output, firms that produce
intermediate inputs for the production of goods covered by the tax cuts and firms where we
assume that their main product was subject to the tax cut but where ultimately we cannot be
sure as the firm-level product description is not fully clear. We combine these dimensions to
construct seven treatment groups that only partially overlap and differ in terms of the number
of observations included. We use all of these treatment groups as a robustness check.
Table 2: Number observations by treatment group
Treatment
group
Only non-
exporters
Reliable
industry
classification
Intermediate
goods
included
Unclear
product
classification
Number
of obs. in
wave 1
Number
of obs.
across all
waves
1 no no no no 14 61
2 yes no no no
3 no yes no no 8 36
4 yes yes no no
5 no yes yes no 15 57
6 yes yes yes no 13 53
7 no yes yes yes
Finally, the products covered by the tax cuts are likely to not have been randomly selected. In
particular, the government may have selected those products with projected significant falls in
demand. If this leads to systematic differences in demand between the products included in the
treatment and control groups, this would result in underestimating the effects of the tax cuts
because the demand for goods in the treatment group declined more sharply compared to the
demand for goods in the control group. This would imply that the magnitude of the estimated
coefficients is rather at the lower bound. However, while we cannot control for unobserved

13
time- and product-specific effects with our data, we are able to control for time-varying sector-
specific effects as there are no sectors exclusively in the treatment group.
4.2 Dependent Variable As dependent variable in our baseline specification, we use the change of sales compared to the
same month in the previous year, which we label as SALES_CHANGE. The corresponding
question asked in the interview of the first round of the FCS (wave 1) was “If you compare this
establishment’s sales for the last completed month in 2009 with the same month in 2008, how
did they change?”. For the subsequent rounds carried out in 2010, the question was identical
but referred to 2009. We refer to the same month in the previous year as the ‘reference’ period,
and ‘last month’ as the ‘comparator’ period; for wave 1 SALES_CHANGE is the difference in sales
between May / June 2009 (comparator period) and May / June 2008 (base period), for wave 2
SALES_CHANGE is the difference between January / February 2010 (comparator period) and
January / February 2009 (base period) and for wave 3 SALES_CHANGE denotes the difference
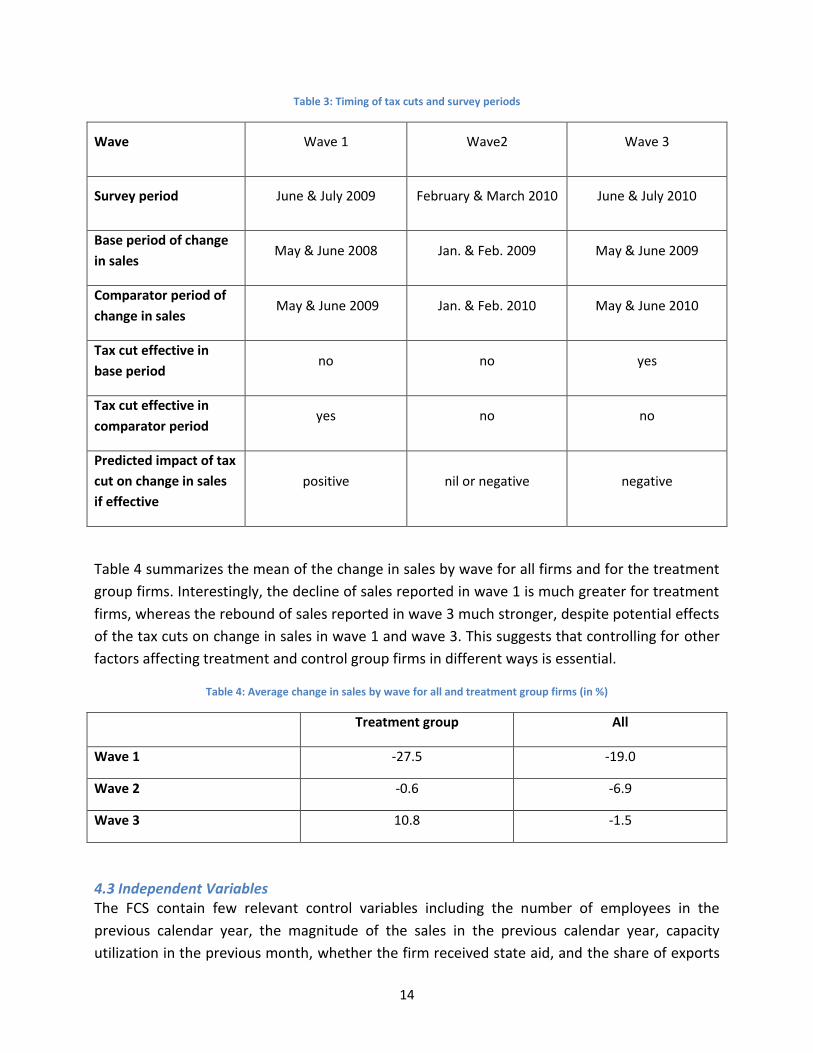
between May / June 2010 (comparator period) and May / June 2009 (base period). Table 3
summarizes this information.
The timing of the interviews together with the framing of the question in the survey are crucial
for our estimation strategy. Supposing that the tax cuts have measurable effects, we would
expect them to affect the change in sales if they were effective either in the base period or in
the comparator period. In the first (second) case, holding all other factors constant, they raise
the levels of sales in the comparator (base) period leaving sales in the base (comparator) period
unaffected and thereby increasing (decreasing) the change in sales. By contrast, if both base and
comparator periods are affected by the tax cut or unaffected by the tax cut, we do not expect to
observe any effects of the tax cuts on the change in sales.
With respect to wave 1, the tax cut was in effect in the comparator period but not in the base
period suggesting that we would observe a positive effect of tax cuts on the change in sales of
those firms selling relevant goods if tax cuts indeed boost firm sales. With respect to wave 2, the
tax cut was in effect neither in the comparator period nor in the base period suggesting that we
do not observe any direct treatment effects. However, it is possible that if intertemporal
substitution effects were present, demand for products under the tax cut were reduced in the
period following the tax cut, i.e., in the months following the expiry of the tax cuts in September
2009. As a result, it may be possible to observe either nil or indirect negative treatment effects
in wave 2, i.e., the firms in the treatment group may have a experienced a greater fall in sales in
comparison to the control group holding other factors constant. Finally, with respect to wave 3,
the tax cut was in effect in the base period but not in the comparator period which would imply
negative treatment effects on the change of sales if tax cuts indeed helped stabilize private
consumption. Table 3 summarizes this information.
14
Table 3: Timing of tax cuts and survey periods
Wave Wave 1 Wave2 Wave 3
Survey period June & July 2009 February & March 2010 June & July 2010
Base period of change
in sales May & June 2008 Jan. & Feb. 2009 May & June 2009
Comparator period of
change in sales May & June 2009 Jan. & Feb. 2010 May & June 2010
Tax cut effective in
base period no no yes
Tax cut effective in
comparator period yes no no
Predicted impact of tax
cut on change in sales
if effective
positive nil or negative negative
Table 4 summarizes the mean of the change in sales by wave for all firms and for the treatment
group firms. Interestingly, the decline of sales reported in wave 1 is much greater for treatment
firms, whereas the rebound of sales reported in wave 3 much stronger, despite potential effects
of the tax cuts on change in sales in wave 1 and wave 3. This suggests that controlling for other
factors affecting treatment and control group firms in different ways is essential.
Table 4: Average change in sales by wave for all and treatment group firms (in %)
Treatment group All
Wave 1 -27.5 -19.0
Wave 2 -0.6 -6.9
Wave 3 10.8 -1.5
4.3 Independent Variables The FCS contain few relevant control variables including the number of employees in the
previous calendar year, the magnitude of the sales in the previous calendar year, capacity
utilization in the previous month, whether the firm received state aid, and the share of exports

15
prior to the crisis from the 2008 Enterprise Survey. Both whether the firm received state aid and
the magnitude of sales contains many missing observations reducing our sample so that we
decided not to use these variables. However, as a robustness check, we re-ran all of our
specifications with the magnitude of sales as an explanatory variable and find that the results
hardly change and remain robust qualitatively. While capacity utilization is certainly driven by
the level of sales, the link to the change of sales which is our dependent variable is less direct.
Again, as a robustness check, we re-run all specifications with capacity utilization omitted and
the results remain robust and do not change qualitatively. Table 5 provides descriptive statistics
of all variables used.
Table 5: Descriptive statistics
variable min p25 p50 mean p75 max sd
sales_change -100 -30 0 -9.714483 10 100 34.23311
labour 1 13 35 132.5868 103 3590 326.0394
capacity 0 20 60 50.77314 75 100 31.50077
non_exporter 0 1 1 0.8140162 1 1 0.3892248
5 Empirical Specification and Results
5.1 Identification We start out by estimating a simple difference-in-difference estimation with the treatment
group 1 which corresponds to specification 1 in Table 2:
SALES_CHANGE = const. + treat.group + wave1 + wave2 + treat.group x wave1 + controls
Treat.group is a dummy for the treatment group 1, wave1 and wave2 are time dummies for the
respective waves and the interaction term treat.group x wave1 measures the treatment effect.
We also include three control variables including the number of employees last year
(represented by labour), capacity utilization, and a dummy with indicates whether the firm is a
an exporter (i.e., according to our definition whether it exports more than 30% of its sales).
With respect to the control variables, the signs of the coefficients are generally plausible: size as
measured by the number of employees has a positive and significant effect on the change of
firm sales; this may suggest that larger firms are more diversified so that their sales declined less
during the crisis. The sign of capacity utilization is likewise positive mirroring probably the
correlation with the level of sales. Firms with higher levels of capacity utilization, which hence
showed a higher efficiency in production, experienced thereby a less steep decline of sales or
conversely a stronger increase, but we acknowledged above that there may also be a problem
of reverse causality; however, our results remain robust to the exclusion of this variable. Finally,
firms that relied less heavily on foreign markets at the onset of the crisis as measured by the

16
time-invariant non_exporter variable taken from the ES from 2008 also experienced less steep
declines of sales or conversely stronger sales increases. Given that the origin of the crisis was
abroad, this may be somewhat intuitive. In this specification, we also include unobserved time
effects and a dummy indicating whether the firm is part of the treatment group. The interaction
term of the dummy indicating whether the firm is part of the treatment group with the time
dummy for wave 1 is the treatment effect and therefore the variable of interest. Here the
coefficient is negative and not significant. This would indicate that the tax cut had no effects on
firm sales, or alternatively, that the effects of the tax cuts are poorly identified, especially given
that there may be additional unobserved effects that we do not control for in specification (1).
In the remaining specifications of Table 5, we successively control for additional unobserved
effects to examine whether identification is indeed an important issue. In specification (2), we
add unobserved region and industry effects. In specification (3), we instead add firm fixed
effects which are likely to capture most of the unobserved region and industry effects given that
most firms do not move between regions and do not switch industries. In the first two cases,
the coefficient of the treatment effects remains negative, but changes sign in the third case.
Given that the treatment group dummy and the non-exporter dummy are time-invariant, we
omit these variables from all specifications with firm fixed effects.
In specifications (4) and (5), we control for unobserved and time-variant industry effects. This
appears to be critical: the coefficient of the treatment group increases in size and becomes
significant. Time-industry effects are especially important to explain the change in firm sales
during an economic crisis as different industries are likely to be subject to different shocks, for
instance due to a decrease in demand for durables relative to the demand of necessity goods. It
is these type of effects that industry-time effects account for in the regression. In specification
(5), we only include non-exporters in treatment group (i.e., we use treatment group 2) and add
also unobserved time-variant region-specific effects. The coefficient estimates indicates that
treatment effect (i.e., the tax cut) increases the change in sales by between 16 and 18
percentage points.
5.2 Alternative Treatment Groups Following our discussion above, we now test the robustness of our results using the remaining
treatment groups as defined in Table 2. All of the specifications are based only on those firms
for which no sector change is recorded which reduces the number of observations and notably
those in the treatment group. However, in specifications (3) to (5), we enlarge the treatment
group by including firms producing intermediate goods and in specification (5) by also including
firms where we believe that they benefited from the tax cut but where we cannot be fully sure
due to a poor description of the main product. In all specifications, we control for unobserved
industry-time and region-time effects.

17
Table 6: Results I
(1) (2) (3) (4) (5)
VARIABLES sales_change sales_change sales_change sales_change sales_change
labour (last year) 0.00952*** 0.0108*** 0.0161 0.0174 0.0172 (0.00286) (0.00299) (0.0116) (0.0115) (0.0113) capacity utilization 0.259*** 0.275*** 0.207*** 0.219*** 0.224*** (0.0312) (0.0325) (0.0528) (0.0534) (0.0529) non_exporter 5.536** 3.956 (2.344) (2.534) treat. group 13.80** 12.24* (6.109) (6.528) wave1 x treat. group -7.163 -8.794 1.292 16.82* (11.39) (11.59) (12.83) (10.09) wave1 x non-exporter x treat. group
17.99*
(10.81) Constant -37.95*** -38.84*** -29.95*** -27.46*** -27.02*** (3.080) (4.355) (3.517) (7.358) (7.461) Observations 1,379 1,379 1,379 1,379 1,379 R-squared (within) 0.087 0.195 0.201 Number of firms 774 774 774 774 774 time effects yes yes yes No no industry effects no yes no No no region effects no yes no No no firm effects no no yes yes yes ind.-time effects no no no yes yes reg.-time effects No no no No yes
In all specifications, the coefficient of the treatment group is highly significant and increases in
size compared to the one in Table 7 but does not change sign. Our results therefore appear to
be robust when we attempt to address the issues related to the classification of the firms in
treatment and control groups described in Section 4.1.
18
Table 7: Results II
(1) (2) (3) (4) (5) VARIABLES sales_change sales_change sales_change sales_change sales_change
labour (last year) 0.0114 0.0114 0.0114 0.0114 0.0116 (0.0121) (0.0121) (0.0121) (0.0121) (0.0121) capacity utilization 0.246*** 0.246*** 0.252*** 0.252*** 0.246*** (0.0673) (0.0673) (0.0673) (0.0673) (0.0674) wave1 x treat. group 32.82*** 37.38*** 43.87*** (8.468) (9.546) (8.360) wave1 x non-exporter x treat. group
32.82*** (8.468)
37.38*** (9.546)
wave1 x treat. group Constant -12.45* -12.45* -18.00*** -18.00*** -27.69*** (6.358) (6.358) (6.427) (6.427) (6.226) Observations 953 953 953 953 953 R-squared 0.200 0.200 0.202 0.202 0.203 Number of firms 591 591 591 591 591 time effects no No no no no industry effects no No no no no region effects no No no no no firm effects yes Yes yes yes yes ind.-time effects yes Yes yes yes yes reg.-time effects yes Yes yes yes yes
Robust standard errors in parentheses *** p<0.01, ** p<0.05, * p<0.1
(1): treatment group 3 used; (2): treatment group 4 used (3): treatment group 5 used; (4): treatment group 6 used
(5): treatment group 7 used
6 Conclusions
We have estimated the effects of temporary indirect tax cuts on firm sales using a difference-in-
difference approach. Our first contribution is a methodological one: we have argued that in
combination with our firm-level data, the VAT and SCT cuts can be considered as a natural
experiment. We have therefore further argued that using firm-level information is a suitable
and feasible way to evaluate the effectiveness of fiscal response packages implemented during
the recent crisis which is difficult or even impossible using macro data. We have then shown
that controlling for time-varying industry-specific effects is critical to properly identify the

19
effects of the tax cuts. This is critical in times of the recent economic crisis where different
sectors and regions in Turkey were likely to be subject to a range of different shocks affecting
firm sales.
The second contribution is to shed more light on the long-standing debate about the
effectiveness of countercyclical fiscal policy and to provide evidence that the tax cuts in Turkey
appeared to have boosted firm sales. We recognize that the data we use have limitations which
we addressed to the extent possible in a number of robustness checks. The coefficients of
interest are remarkably stable. So far, the literature has predominantly been limited to
advanced economies, and it is questionable if those results apply to developing countries as
well. We worked with data from Turkey, an important emerging market economy, where the
recovery from the crisis was fairly quick. Our results indicate that the contribution of a specific
aspect of the fiscal response package played a role in this context.
However, from a policy perspective, the implications to be drawn are limited. Using micro data,
it is difficult to calculate the fiscal multiplier, although from the size of the coefficients, we
would expect the fiscal multiplier is likely to exceed one. From this perspective, temporary VAT
cuts seem to be a suitable measure to stabilize the economy, and our results shed novel type of
evidence on the long-standing debate between advocates and adversaries of Keynesian-style
fiscal policy. Yet, while according to our evidence temporary VAT cuts may attain the objective
of output stabilization, they may conflict with other objectives of policy makers in developing
countries including the protection of the most vulnerable groups in times of recession that by
definition consume less than other parts of the population. Other measures that simultaneously
protect the poor, such as targeted transfers, may be more suitable if this is an important
concern for policy makers. In addition, from a long-run growth perspective, increases of
productive spending financed by indirect taxes or income tax cuts financed by increases of
indirect taxes are growth-enhancing as shown by various papers. VAT and SCT cuts are
therefore not compatible with this.
7 References
Aghion, P., Hemous, D. and Kharroubi, E., 2009. Financial Constraints, Cyclical Macroeconomic Policy and Industry Growth. ZEW Lecture on December, 18., 2010
Aghion, P., Hemous, D. and Kharroubi, E., 2009. Credit constraints, cyclical fiscal policy and industry growth, NBER Working Paper No. 15119

20
Agarwal, S., Liu, C. and Souleles, N. 2007. The Reaction of Consumer Spending and Debt to Tax Rebates—Evidence from Consumer Credit Data. Journal of Political Economy, 115(6), pp. 986-1019.
Auerbach, A. J. and William G. Gale, 2009. Activist Fiscal Policy to Stabilize Economic Activity. Unpublished Conference Paper,
Auerbach, A. J., William G. Gale, and Benjamin H. Harris. 2010. Activist Fiscal
Barrell, R. and Weale, M., 2009. The Economics of a Reduction in VAT. Fiscal Studies, 30(1), pp.17-30.
Blundell, R., 2009. Assessing the Temporary VAT Cut Policy in the UK. Fiscal Studies, 30(1), pp.31-38.
Broda, C. & Parker, J., 2008. The Impact of the 2008 Tax Rebates on Consumer Spending: Preliminary Evidence 1. Unpublished Paper.
Chari, A., 2011. Identifying the aggregate productivity effects of entry and size restrictions: An empirical analysis of license reform in India. American Economic Journal: Economic, 3(May), pp.66-96.
Crossley, T. F., Low, H. & Wakefield, M., 2009. The Economics of a Temporary VAT Cut. Fiscal Studies, 30(1), pp.3-16.
El-Ganainy, A., 2006. Essays on Value-Added Taxation. Economic Dissertation at GSU
Heady, C., 2011. Tax Policy to Aid Recovery And Growth. Article on VOX
Hori, M., and Shimizutani, S., 2007. Are Tax Cuts Effective Even in Anticipation of a Future Tax Increase? Evidence from Japan`s Unique Episodes in the 1990s. The Singapore Economic Review, 52 (2), pp. 167-177.
Hebous, S., 2011. The effects of discretionary fiscal policy on macroeconomic aggregates: A reappraisal. Journal of Economic Surveys, 25 (4), 674 - 707.
Kneller, R. and Misch, F., 2011. What Does Ex-post Evidence Tell us About the Output Effects of Future Tax Reforms? ZEW Discussion Paper No. 11-029.
Jappelli, T., and Pistaferri, L., 2010. The Consumption Response to Income Changes. Working Paper 15739, NBER
Johnson, D.S., Parker, J. a & Souleles, N.S., 2006. Household Expenditure and the Income Tax Rebates of 2001. American Economic Review, 96(5), pp.1589-1610.

21
Rajan, R. G., and Zingales, L., 1998. Financial Dependence and Growth. The American Economic Review, 88 (3), pp. 559-586.
Shapiro, M.D. and Slemrod, J., 1995. Consumer response to the timing of income: Evidence from a change in tax withholding. Change, 85(1), pp.274-283.
Shapiro, M.D. and Slemrod, J., 2003. Consumer Response to Tax Rebates. American Economic Review, 93(1), pp.381-396.
Shapiro, M.D. and Slemrod, J., 2009. Did the 2008 Tax Rebates Stimulate Spending? American Economic Review, 99(2), pp.374-379.
Souleles, N., 2002. Consumer response to the Reagan tax cuts. Journal of Public Economics, 85(1), pp.99-120.
SPO (State Planning Organization of Turkey), 2009, Pre-Accession Economic Programme.
Uygur, E., 2010, The Global Crisis and the Turkish Economy, TWN Global Economy Series Working Paper, No. 2010/3.
Watanabe, K., Watanabe, Takayuki & Watanabe, Tsutomu, 2001. Tax policy and consumer spending: evidence from Japanese fiscal experiments. Journal of International Economics, 53(2), pp.261-281.


