
THE EFFECT OF IMPLEMENTING GAMIFICATION PRINCIPLES IN A MIDDLE
AND HIGH SCHOOL SCIENCE CLASSROOM
by
Joseph D. Day Rider
A professional paper submitted in partial fulfillment
of the requirements for the degree
of
Masters in Science
in
Science Education
MONTANA STATE UNIVERSITY
Bozeman, Montana
July 2017

ii
©COPYRIGHT
by
Joseph David Day Rider
2017
All Rights Reserved

iii
TABLE OF CONTENTS
1. INTRODUCTION AND BACKGROUND ...................................................................1
2. CONCEPTUAL FRAMEWORK ...................................................................................2
3. METHODOLOGY .........................................................................................................7
4. DATA AND ANALYSIS .............................................................................................13
5. INTERPRETATION AND CONCLUSION ................................................................34
6. VALUE .........................................................................................................................39
REFERENCES CITED ......................................................................................................42
APPENDICES ...................................................................................................................44
APPENDIX A: Attitude Towards Science and Technology
Pre-Treatment Survey .................................................................45
APPENDIX B: Attitude Towards Gamification Post-Treatment
Survey .........................................................................................47
APPENDIX C: Pre-Treatment Interview Questions.............................................49
APPENDIX D: Post-Treatment Interview Questions ...........................................51
APPENDIX E: Excerpts from Teacher Reflective Journal ..................................53
APPENDIX F: Institutional Review Board Exemption Letter .............................55
iv
LIST OF TABLES
1. Research Design Schedule for AR Project ...................................................................10
2. Data Collection Matrix .................................................................................................11
3. Frequency of Responses to Pre-Treatment Likert Survey Questions ...........................13
4. Average Score for Pre-Treatment Likert Survey by Gender ........................................15
5. Average Score for Pre-Treatment Likert Survey by Grade ..........................................16
6. Average Scores to Pre-Treatment Likert Survey Separated by
Middle School and High School ...................................................................................18
7. Summarized Responses to Post-Treatment Likert Survey............................................26
8. Average Score for Post-Treatment Likert Survey by Gender .......................................28
9. Average Score for Post-Treatment Likert Survey by Grade .........................................30

v
LIST OF FIGURES
1. Breakdown of Responses to Pre-Treatment Survey Question 3 ...................................14
2. Breakdown of Responses to Pre-Treatment Survey Question 3 by Gender .................15
3. Breakdown of Pre-Treatment Survey Responses to Question 3 by Grade ...................17
4. Breakdown of Responses to Pre-Treatment Question 3, Middle School vs.
High School ...................................................................................................................18
5. Comparison of Test Scores for 9th Grade Class, Treatment Quarter vs.
Non-treatment Quarter ..................................................................................................22
6. Comparison of Test Scores for 8th Grade Class, Treatment Quarter vs.
Non-treatment Quarter ..................................................................................................23
7. Comparison of Test Scores for 7th Grade Class, Treatment Quarter vs.
Non-treatment Quarter ..................................................................................................25
8. Breakdown of Responses to Question 3 from Post-Treatment Likert
Survey ...........................................................................................................................27
9. Breakdown of Responses to Question 5 from Post-Treatment Likert
Survey ...........................................................................................................................27
10. Breakdown of Responses to Question 3 of Post-Treatment Likert
Survey by Gender ........................................................................................................29
11. Breakdown of Responses to Question 5 of Post-Treatment Survey
by Gender .....................................................................................................................29
12. Breakdown of Responses to Question 3 of Post-Treatment Survey
by Grade .......................................................................................................................30
13. Breakdown of Responses to Question 5 of Post-Treatment Survey
by Grade .......................................................................................................................31

vi
ABSTRACT
Gamification is the application of principles commonly found in games and
applying them to a non-gaming setting. The purpose of this study was to determine to
what extent the effect of incorporating gamification principles had on a middle and high
school science classroom. The effect on retention of material, the students’ attitude
towards science, and the impact these principles had on the teacher were included in this
study. Results from this study suggest that while there was no discernable relationship
between gamification and the retention of material by students, gamification principles
did have a positive effect on the attitudes of the students regarding coming to class and
participating in class. It was also determined that these principles had a greater impact on
a middle school classroom and that for gamification to work, there needs to be a more
thorough implementation of the principles which requires more commitment from the
teacher.
1
INTRODUCTION AND BACKGROUND
Project Background
Video games are not a new development, by any stretch of the imagination. The
first commercial arcade game was released in the early 1970s and ever since then video
games have been ever present in society. They have even become incorporated into the
educational system. Video games have been present in schools since the 1980s. Games
such as Oregon Trail, Reader Rabbit, and Math Blasters were staples of my early
childhood. Games like these taught us the fundamentals in an engaging way while at the
same time, showing us that learning can be a fun and enjoyable experience. While these
were a great use at the time, they soon faded into the background. Video games went
from learning what hardships the pioneers met on the Oregon Trail to what button
combination does it take to make a ninja throw a fireball or perform a series of spinning
kicks (yes, I am looking at you Mortal Kombat and Street Fighter.) Now this is in no
way an outcry against video games; I myself spend any spare time I have leading the
New England Patriots to the Super Bowl on the latest rendition of Madden. The one
question that has seemed to stick with me in my journey through my career in education
is how can I apply video games, which seem to be present in all my students’ lives, to my
science classes to enhance their education? A possible answer was presented to me in the
form of gamification. To put it simply, gamification is applying principles found in
gaming into a non-gaming context. These would include principles such as gaining XP
(experience points) through completing missions and side missions (assignments and

2
tests), “gaining new abilities” (lab activities), earning badges, and the use of “special
abilities” (homework passes or receiving a free answer on a test).
Focus Questions
For my action research (AR) project, the ultimate question I hope to answer is:
“does incorporating gamification principles influence students in a middle and high
school science classroom?” This main question will be supplemented further by
examining the following sub-questions:
What effect does gamification have on a student’s retention of the material?
What impact does gamification have on a student’s attitude towards science class?
How does gamification compare in its effect on students in a middle school
classroom versus a high school classroom?
How has gamification modified my teaching habits?
CONCEPTUAL FRAMEWORK
Introduction
The definition of gamification itself offers a wide variety of applications.
Sheldon (2012) defines gamification as “the application of game mechanics to non-game
activities” (p. 75). As stated earlier, video games have been ever present since the 1980s.
They seem to be even more mainstream today, with titles like Candy Crush, Angry Birds,
and Color Jump burning up my students’ batteries on their phones. Not only do these
phone apps provide hours of entertainment, and frustration for some of my students, they
also provide new methods for learning problem solving skills. Farber (2015) refers to
this as “The Edutainment Era” (p. 16).

3
The idea of bringing games into the classroom has not had its detractors. Farber
(2015) states that, “Educational games have a reputation of poor design. Many games
were rushed to market and placed educational content ahead of game mechanics” (p. 16).
The biggest negative remarks seem to come from those that believe that games, whether
educational or not, do not really belong in the classroom. Bogost stated that “play and
fun are often not associated with learning, and can be seen by some as not serious enough
for effective teaching (as cited in Brull & Finlayson, 2016, p. 372). With the
implementation of new concepts, there is bound to be some resistance. Hopefully this
project will wade through the resistance and result in some positive outcomes.
Designing Gamification
Gamification is a relatively new concept. Because of this, a lot of the benefits
that can come from gamification are more hypothetical than actual. Still, there has been
some thought into how gamification should be implemented. Brull and Finlayson state
that, “In order for gamification to work […] specific game mechanics need to be in
place” (p. 373). In the same article, McGonigal states that “game mechanics need to be
combined with achievable goals, rules, voluntary participation, and feedback to work (as
cited in Brull & Finlayson, 2016, p. 373). This statement helped with the development of
the methodology used in my treatment.
To make gamification work, the concept of setting goals and proper planning is a
key issue. Kim (2015) states that, “considering various outcomes from a gamification
project in advance and determining which outcome should be given the highest priority

4
can greatly facilitate the evaluation and improvement process of a gamification project”
(p. 29).
When a goal has been clarified and the proper plan is put in motion, the last thing
that should come into play is a student’s motivation. Kim offers the following advice on
that front:
In designing gamification, we need to remember that gamification itself
does not automatically generate motivation or engagement. For any
gamification to succeed, it needs people’s buy-in because they should care
enough to play along. It is for this reason that the more closely the goal of
gamification aligns with the goal of a player, the more successful the
gamification will be (pp. 33-34).
Useful Mechanics
Once specified goals and thorough planning have been put into place, the last
thing that is vital to a gamified classroom is what gaming mechanics will be implemented
into the experience. A few of these mechanics that I have chosen to implement into my
project is a leaderboard, badges, and avatars.
In gaming, leaderboards are meant to show how a player compares to the larger
gaming community creating a sense of competitiveness. Of course, not all of us are
competitive. Farber cautions that, “when misused, the leaderboard can discourage
children from trying” (p. 123). To combat this, Farber suggests that, “it is important to
emphasize to students that game scores are not grades” (p. 123). Driving this point home
could help find that competitive balance.
In the gaming world, badges carry a little bit more to them than say a badge you
would get from the boy scouts. Badges help not only show the level a player has reached
in the game but also help show various achievements the player has achieved through
5
gameplay. Farber suggests that these can “promote a feedback loop of social
participation” (p. 124).
Avatars are just the digital representation of the player inside the game. The good
thing about avatar is that they allow students to be represented as a way that is completely
different from what they are in real life. They also allow a little bit of silliness to enter
play as most avatars allow players to be as creative as they want.
Gamification in the Classroom
Previous investigations into the use of gamification principles in a classroom have
yielded a variety of results. The next few paragraphs will examine the results of some of
these investigations.
The first study looked at what effect gamification had on a student achievement,
mastery, and motivation in a science classroom (Reichelt, 2015). In this study, students
were required to master 80% of the learning objectives to progress through a levelled set
up for a general and dual enrollment anatomy & physiology courses. If mastery was not
acquired, students could retest until they had mastered the needed material. Reichelt
determined that for achievement, “although the model increases achievement for honors
and non-honors students, non-honors benefited from implementation more than honor
students” (p. 20-21). Reichelt also pointed out that there was a significant change in the
students’ motivation pretreatment vs. post-treatment. She goes on to state that her setup
of the model “allowed students to be both intrinsically and extrinsically motivated” (p.
21).

6
The next study examined the impact of digital game-based learning (DGBL) on
educational effectiveness and student motivation (Papastergiou, 2009). In this study, a
sample of 88 students (46 boys and 42 girls) were separated randomly into two study
groups: one that used the gaming application and one that didn’t. This study found that,
“the DGBL approach was both more effective in promoting students’ knowledge of
computer memory concepts and more motivational for students than the non-gaming
approach” (p. 10). The study also found that, “the learning gains that boys and girls
achieved through the use of the game did not differ significantly” (p. 10).
The next study looked at the practical implications and outcomes of a gamified
experience (Dominguez et al., 2013). This study focused on first and second year college
students from varying majors that were separated into two sections of a spring semester
course. One section was used as the control group where no gamification was used and
the other section was considered the experimental group and were exposed to a gamified
course. At the end of their research, Dominguez et al. determined that students in the
experimental group, “performed better on all items that were concerned with practical
application of concepts” (p. 386). They go on to say that these same students “performed
lower than the control group on the written examination and perception” (p. 386). They
also found that “gamification can have a great emotional and social impact on students,
as reward systems and competitive social mechanisms seem to be motivating for them”
(p. 391).
In their 2015 study, Hanus & Fox tested students across two courses in a 16-week
semester. They measured the students for their motivation, social comparison, effort,
7
satisfaction, and academic performance at four different points throughout the 16-week
study. As the study progressed, Hanus & Fox noted that students in the gamified course,
“tended to decrease in motivation, satisfaction, and empowerment relative to the non-
gamified course” (p. 159). They also noted that students in the gamified course were,
“less intrinsically motivated and in turn lower exam scores than those in the non-gamified
classroom” (p. 159).
METHODOLOGY
Description of Treatment
The implementation of the gaming principles covered an entire quarter of the
school year which, in the past, has usually averaged about three to four chapters per class.
This allowed the students full exposure to gamification. The content covered during this
research varied with grade range and is explained in detail in a later section.
This research project was done in conjunction with an online gamified tracking
platform called Class Craft. This platform allows the players (students) to create an
avatar that they can then use to obtain experience points (XP), utilize powers using their
avatar’s action points (AP), and obtain gold pieces (GP) which can then be used to
purchase new accessories for their avatar or powers. Players could also fall in battle if
their health points (HP) dropped to zero. For example, if a student failed to turn in an
assignment on time, he/she would lose health points depending on how many days the
assignment was late (up to 10 HP). If he/she failed to turn in the assignment at all, he/she
would lose 20 HP and fall in battle (die). This platform also allowed me as a teacher to

8
take content from some of my lessons and apply the gaming principles mentioned above
to it.
As the class progressed through a chapter or unit, players were given various tasks
to obtain XP. These tasks include coming to class prepared, participating in class by
answering questions or partaking in random events, turning in assignments early or on
time, and completing “side quests.” Players could also receive XP based on the grade
they obtained on an assignment or a test. As players garnered more and more XP, their
avatar increased in level, which resulted in the availability of higher level powers and
accessories.
Gold pieces (GP) could also be obtained through several different ways. If a
player came to class ready and before the bell rings or handed in an assignment a day
early, they would receive a set number of gold pieces. These could also be obtained if
players volunteered to clean the lab area or lab equipment. These pieces could then be
used to “purchase” new accessories for their avatars or obtain pets that they can then train
to gain more gold pieces.
As the players progressed through a chapter or unit, they would inevitably run
into some pitfalls. These included turning in assignments late or not at all, handing in
assignments that were incomplete, or misbehaving in lab. This resulted in the player’s
avatar losing health points (HP) which served basically as the player’s health. If their
health fell to zero, the player would fall in battle and must perform a random sentence to
resume the game. These included anything from copying a section of text to bringing a
treat for the class.

9
Sample
Most of the students, grades 7th-12th, that were enrolled in a science class during
the 3rd quarter of the school year were included in this study. Since there was no non-
treatment group, this AR project is considered more like a descriptive study. This gave
me a sample number of roughly 34. The classes included were my 7th grade life science
class (NL = 4), 8th grade physical science (NP = 9), 9th grade earth science (NE = 5), 10th
grade biology (NB = 8), and my 11th/12th grade chemistry (NC = 8). As the treatment
progressed, a lack of interest and several setbacks schedule-wise forced me to abandon
the treatment with the 10th grade biology and 11th/12th grade chemistry classes. As such,
no post-treatment data was obtained from them, but observational data will be noted in
the Data and Analysis section of this paper.
Richey is in the middle of a highly agriculturally active area and most students
come from families that farm or ranch in the area. The students are predominantly of
Caucasian descent with English as their first language. The students are high achievers in
school with an average GPA of 3.72 in the junior high (7th/8th grade) and an average GPA
of 3.66 in the high school (9th-12th grade). The gender ratio at Richey Schools for grades
seven through twelve is 16 males to 21 females. The school offers a free and reduced
lunch rate, but there are very few students who utilize the program.
Timeline
As stated previously, the timeline for this project ran the length of the 3rd quarter
in the 2nd semester. A more thorough breakdown can be found in Table 1. The length of
time in which the project ran, allowed for a wide range of content to exposed to

10
gamification principles. For the seventh-grade life science class, this included the
remainder of our vertebrate biology lessons and an examination of the integumentary,
muscular, and skeletal systems for humans. For the eight-grade physical science, this
included examining the basics of physics, Newton’s three laws of motion, the physics
associated with fluids, and the physics of machines and work. For the ninth-grade earth
science class, this included studying the principles of meteorology such as the
composition of the atmosphere, weather systems and maps, severe weather, and the
principle of climatology.
Table 1
Research Design Schedule for AR Project
Activity Instruments Used? Dates
Informational letter and
permission slip sent home
to parents/guardians.
N/A Jan. 2, 2017 (Return date
set for Jan. 11, 2017)
Collect pre-project data Likert Survey and Sample
Interviews
Jan. 12th, 2017
Introduction of Project to
students
N/A Jan. 13th, 2017
Implementation of
gamification principles
Daily journal observations
of classes involved in
project
Jan. 13th, 2017 through end
of project (3/21/2017)
Completion of Project Likert Survey and Sample
Interviews
Mar. 21st, 2017
Data Collection
Table 2 shows a data matrix of the instruments that were used during the AR
project and what questions (focus and sub) that each instrument would help answer.

11
Table 2
Data Collection Matrix
Research Matrix Likert
Surveys
Sample
Interviews
Teacher
Reflective
Journal
Summative
Assessments
Main Question X X X X
Sub-Question 1
X
Sub-Question 2 X X
Sub-Question 3 X X X X
Sub-Question 4
X X
The Likert survey was given twice in the treatment process: once as a pre-
treatment survey (Appendix A) and after the project (Appendix B). The sample
interviews (Appendices C and D) were conducted at the beginning of the project and after
the project. The teacher reflective journal (Appendix E) was kept throughout the course
of the project.
The Likert survey was administered to all students involved in the treatment
process and was designed to allow students to answer an open-ended question after their
Likert responses. The questions used on the pre-treatment Likert survey were designed to
focus on three areas: a student’s attitude towards science class, the use of technology in a
classroom, and their exposure to video games and gamification. The post-treatment
Likert survey focused on any changes in a student’s attitude when gamification principles
were instituted and their general feeling about the gamification process overall. Most of
the questions for both the pre-treatment and post-treatment surveys contained a numerical
scale that ranged from one to ten, in addition to an open-ended question. The numerical
responses the students answered on the scale were averaged and compared per the steps
described below in the Data and Analysis section. Any qualitative responses from the
12
Likert survey that stand out (positively or negatively) were singled out and included in
the Data and Analysis section.
The interviews were conducted individually with a random selection of students
involved in the treatment process and were conducted in conjuncture with both the pre-
treatment and post-treatment Likert survey. A random name generator was used to select
the students and the interviews were conducted separately from the rest of the class. Both
the Likert and interview questions gave an insight into how the students felt about
gamification and technology being used in the science classroom. Both the surveys and
the interview questions were examined by colleagues and professors to ensure they fit the
goals of my study and the results of these would help to insure validity. The Class Craft
platform itself also helped to ensure validity.
A student’s performance on summative assessments were used to show any
impact that the implementation of gamification principles had on a student’s performance
during assessments and the student’s retention of the material in the classroom. By
examining a student’s test scores on units from a previous quarter to a student’s test
scores on a treatment unit or chapter, a comparison was made on the effect gamification
had on a student’s test scores. By triangulating these summative test scores with the
responses to the Likert surveys and the responses from the sample interviews, I could
determine, both from a quantitative and qualitative standpoint, what effect gamification
had on a high school and middle school science classroom.
The reflective journal was the only instrument that was ongoing throughout the
duration of the treatment. As the treatment progressed, entries were made based on my
13
observations of students’ attitudes and their responses to what was going on in class. I
also made entries on other observations that I made throughout the course, such as
comments made by students and performance on other aspects of class. By looking at
these entries, I could determine to what effect gamification had on myself as a teacher.
Before and during the project, students were reminded that participation in this
research is voluntary and participation or non-participation will not affect a student’s
grades or class standing in any way. The research methodology for this project received
an exemption by Montana State University’s Institutional Review Board (Appendix F)
and compliance for working with human subjects was maintained.
DATA AND ANALYSIS
Pre-Treatment Likert Analysis
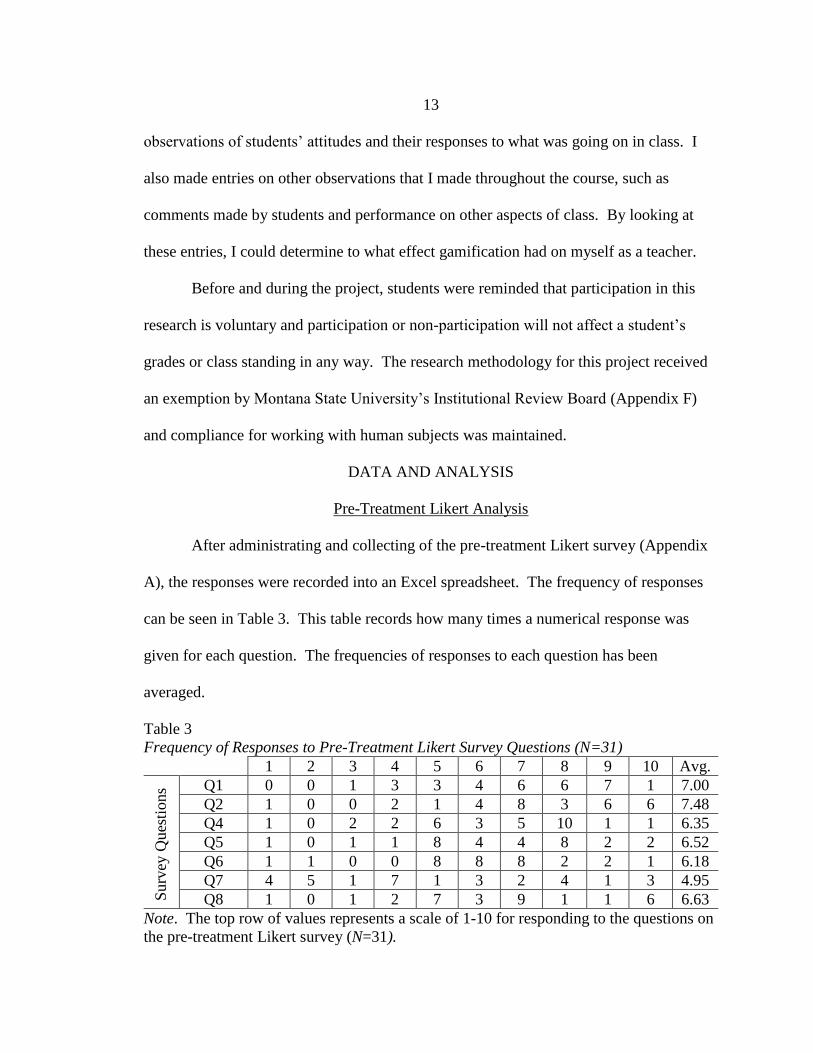
After administrating and collecting of the pre-treatment Likert survey (Appendix
A), the responses were recorded into an Excel spreadsheet. The frequency of responses
can be seen in Table 3. This table records how many times a numerical response was
given for each question. The frequencies of responses to each question has been
averaged.
Table 3
Frequency of Responses to Pre-Treatment Likert Survey Questions (N=31)
1 2 3 4 5 6 7 8 9 10 Avg.
Surv
ey Q
ues
tions Q1 0 0 1 3 3 4 6 6 7 1 7.00
Q2 1 0 0 2 1 4 8 3 6 6 7.48
Q4 1 0 2 2 6 3 5 10 1 1 6.35
Q5 1 0 1 1 8 4 4 8 2 2 6.52
Q6 1 1 0 0 8 8 8 2 2 1 6.18
Q7 4 5 1 7 1 3 2 4 1 3 4.95
Q8 1 0 1 2 7 3 9 1 1 6 6.63
Note. The top row of values represents a scale of 1-10 for responding to the questions on
the pre-treatment Likert survey (N=31).

14
From the table above, it can be shown that the two questions that dealt with
students’ attitude towards science (Q1 and Q2) had the two highest averages and had the
most frequent responses in the higher end of the 1-10 scale on the Likert survey.
Questions that dealt with technology in the classroom (Q4, 5, and 6) showed an average
that was slightly above the mid-range value of five and were all within about 0.34 points
of each other. Questions regarding video games showed the greatest difference in values.
The average value for responses on a student’s experience with video games was slightly
below the mid-range value of five whereas the average value for responses to the set-up
of a classroom like a video game was above the mid-range value of five. From the data,
students already enjoyed coming to class and were highly motivated to do well in it. The
use of technology in the classroom intrigued the students, as did the aspect of having a
classroom set up as a video game, even though not all students involved in the study had
been exposed to video games.
Figure 1 shows a breakdown of the responses for question three since this was the
only question not to have a numerical response attached to it.
Figure 1. Breakdown of responses to Pre-Treatment Survey question 3, (N = 31).
0
1
24
6
Don't Enjoy
Slightly Enjoy
Enjoy
High Enjoy

15
Of the 31 responses, zero responded as saying they don’t enjoy science class, one
responded by saying that he/she slightly enjoys science class, 24 responded by saying that
they enjoy science class and six responded as saying they highly enjoy science class.
Breakdown of Data by Gender
Table 4 and Figure 2 shows a breakdown of the data obtained by the pre-treatment
Likert survey by gender.
Table 4
Average Score for Pre-Treatment Likert Survey by Gender
Survey
Question
Q1 Q2 Q4 Q5 Q6 Q7 Q8
Average Score
for Males
7.14 6.71 6.79 6.64 6.43 6.75 7.39
Average Score
for Females
6.88 8.12 6.00 6.41 5.97 3.47 6.00
Note. Average score is based off number of responses by each gender. For males, this
number is 14 (N=14) while for females this number is 17 (N=17).
Figure 2. Breakdown of responses to Pre-Treatment Survey question 3 by gender.
A breakdown of the gender data from Table 4 shows that both males and females
were nearly even in value for the question on how much they enjoyed coming to class
(Q1). This can also be seen from Figure 2, which shows that regardless of gender,
0
2
4
6
8
10
12
14
Don't Enjoy Slightly Enjoy Enjoy Highly Enjoy
NU
MB
ER
OF
RE
SP
ON
SE
S
Males Females

16
students enjoyed coming to class. The genders were also very similar in value for the
questions that relates technology to the student’s attitude towards science (Q4, 5, and 6).
The biggest gaps were in questions two and seven. While both genders showed a similar
value for how much they enjoyed coming to class, the average value for females was
higher than the males for wanting to do well in science (Q2). In terms of experience with
video games (Q7), males had a higher value, and therefore a higher experience level, than
females did.
Breakdown of Data by Grade Level. Table 5 and Figure 3 shows a breakdown of
the data obtained by the pre-treatment Likert survey by grade level.
Table 5
Average Score for Pre-Treatment Likert Survey by Grade
Survey
Question
Q1 Q2 Q4 Q5 Q6 Q7 Q8
Average Score
for Grade 7
4.75 8.00 5.25 5.25 6.50 5.50 7.00
Average Score
for Grade 8
5.86 7.14 6.14 5.71 5.43 5.21 5.79
Average Score
for Grade 9
8.50 6.25 7.50 7.75 6.50 5.50 7.75
Average Score
for Grade 10
8.00 8.38 6.25 6.75 6.00 4.00 6.00
Average Score
for Grade 11
7.20 6.80 6.60 6.20 5.70 5.20 6.80
Average Score
for Grade 12
7.67 8.00 6.67 8.33 8.33 5.00 8.00
Note. Average scores are based off the number of responses received in each grade. The
numbers for each grade are 7th = 4 (N7=4), 7 for 8th (N8=7), four for 9th (N9=4), eight for
10th (N10=8), five for 11th (N11=5), and three for 12th (N12=3).

17
Figure 3. Breakdown of Pre-Treatment Survey responses to question 3 by grade level.
A breakdown of the grade level data from Table 5 shows a wide variety of values.
For example, when asked about how much the students enjoyed coming to class, the
values for grades seven and eight were close to mid-value while the values for grades 9-
12 had a high average. Regardless of the differences in average value, all students in
grades 7-12 responded that they enjoyed the current set up of class, as seen in Figure 3.
When asked about their motivation for doing well in science class, grade 9 had the lowest
average value while the other classes had high average response values. There was one
average value that stands out from the data in Table 5 related to technology use in class.
When asked about the impact technology could have on changing their attitudes towards
class, the senior class had the highest values for questions 5 and 6. Overall, the deduction
made from the grade level data is that while all students involved in this study enjoyed
the set-up of class and wanted to do well, the junior high students did not enjoy coming to
class as much as the high school students did. It can also be deduced that high school
students were more open to using technology in class than the junior high students. A
0.0%
20.0%
40.0%
60.0%
80.0%
100.0%
120.0%
Don't Enjoy Slightly Enjoy Enjoy Highly Enjoy
PE
RC
EN
TA
GE
OF
ST
UD
EN
TS
TH
AT
RE
SP
ON
DE
D F
OR
EA
CH
GR
AD
E
Grade 7 Grade 8 Grade 9 Grade 10 Grade 11 Grade 12

18
more thorough examination of the two schools (middle and high) is explored in the next
section.
Breakdown of Data by School (Middle vs. High). The following table (Table 6)
and figure (Figure 4) shows a breakdown of the data when compared between middle
school students (those in grades 7 and 8) and high school students (those in grades 9-12).
Table 6
Average Scores to Pre-Treatment Likert Survey Separated by Middle School and High
School. Survey Question Q1 Q2 Q4 Q5 Q6 Q7 Q8
Average Score
for Middle
School
5.45 7.45 5.82 5.55 5.82 5.32 6.23
Average Score
for High School
7.85 7.50 6.65 7.05 6.38 4.75 6.85
Note. Average scores are based off responses from middle school students (Nm=11) and
high school students (Nh=20).
Figure 4. Breakdown of responses to Pre-Treatment question 3, middle school vs. high
school.
0
2
4
6
8
10
12
14
16
Don't Enjoy Slightly Enjoy Enjoy Highly Enjoy
NU
MB
ER
OF
RE
SP
ON
SE
S
Middle School High School

19
The breakdown of data by schools (middle vs. high) offers a more generalized
look at how the different grades responded to the Likert survey. While high school
students had a higher average value when questioned about their enjoyment of class (Q1),
they had a similar value as the middle school students when questioned about their
motivation to perform well in science. This is also apparent from Figure 4, which shows
that most students, regardless of school, either enjoyed or highly enjoyed science class.
This echoes what was seen in the data from the breakdown by grade level in a previous
section and shows that junior high students did not enjoy coming to science class as much
as high school students, but wanted to do just as well in class as the high school did.
When questioned about the use of technology in class and the effect it could have
on a student’s attitude towards class, high school students tended to have higher averages
than middle school students. This echoes what was seen in the grade level data from
above and shows that high school students are more interested in using technology in
class than junior high students are.
The one question where the middle school students had a higher average value
then the high school students was their exposure to video games. Although not
significantly higher, the middle school students had an average value that was 0.57 points
higher than the high school students. Both schools were close (0.42 points) when
questioned on their interest in a gamified classroom, with the high school students having
the higher value. Based on this data, it can be deduced that while exposure to video
games occurred more at the junior high level, the high school was more interested in a
gamified classroom experience than the junior high was.

20
Pre-Treatment Interview
Through a random selection process, I selected a small sample size of students (2-
3) from all the classes to participate in the interview part of the pre-treatment process. A
copy of the questions used during the survey can be found in Appendix C. Half of the
questions that were asked during the interview pertained to the students’ attitudes towards
science, while the other half pertained to gamification and gaming exposure.
Of the students interviewed, the overwhelming consensus was that students were
learning in class. Another question that garnered an overwhelming response was what
aspects or activities did they enjoy. Overwhelmingly, students responded that they
enjoyed labs or hands-on activities the most. One student said, “the presentations,
because it helps me on the test.” This echoes what was seen in the pre-treatment Likert
survey data mentioned above, when it was determined that on average, students were
highly motivated to do well in science. When questioned about if they find science
interesting, the responses varied slightly. Almost half of the students that were
interviewed said that they found science interesting. The remaining students’ responses
were along the lines of, “it depends on what we are learning” or “I find certain aspects
interesting.” One student responded that she found it interesting, “when I know what we
are talking about or enjoy the subject.”
Of the students interviewed, an overwhelming consensus was given for whether
they had heard of gamification before. The overwhelming consensus was that students
had not heard of gamification before. When questioned about their exposure to video
games, most students had very little to no exposure. One student responded with a no,
21
“unless you count competitive family Wii sword fishing. Also, Panda Pop clutch.” I
told her that was a yes. A few students responded that they had had some exposure either
through “various consoles” or “flash games on the computer that we aren’t supposed to
be on in school.” One student responded that he had “six years [of experience], across
various platforms.” He went on to say that he “built his own PC geared towards
gaming.” When questioned about their interest in a class that incorporated gaming
principles, most students responded that they would. When probed to explain their
response, some students responded that “it would be fun to participate in,” or that “it
would be cool to try something different in class.” One student responded that it might,
“add a whole new aspect to learning and school.” A couple students responded that they
were “unsure but willing to try.” A couple of students responded with a no and when
asked to elaborate, one student said that she, “didn’t like video games, but wouldn’t care
if we did unless it affected her understanding [of the subject].” The other student
responded that she thought that, “high school students should have the ability to learn
from a textbook.” This was echoed in her Likert survey responses that were low for
using technology in the classroom and gamification questions.
Summative Assessment Data
To measure any impact that gamification had on a student’s retention of the
material, test scores from a quarter where the treatment was not used were compared to
test scores from the quarter in which the treatment was used. As stated previously, lack
of interest and scheduling conflicts limited the number of students to pull a random
sampling from. Because of this development in the treatment process, I compared the

22
test score for all students that were involved in the treatment. The following figures show
a comparison of the test grade from the treatment quarter to a quarter in which the
treatment was not used for the 9th (Figure 5), 8th (Figure 6), and 7th (Figure 7) grade
classes.
9th Grade Test Scores
Figure 5. Comparison of test scores for 9th grade class, treatment quarter vs. non-
treatment quarter (N = 5).
The figure above compares the test scores for the quarter in which gamification
was used (Treatment) and a quarter in which gamification was not used (Non-Treatment).
The test scores for each quarter had almost the exact same median score. The range of
scores were also similar between the two quarters (21 for treatment vs. 23 for non-
treatment).
One way in which the plots differ in scores is the distribution of scores in the top
half of the treatment quarter. During the quarter in which gamification was used, the
distribution of scores in the top half were not as spread out as they were for the quarter in
80
85
90
95
100
105
110
Treatment Non-Treatment
Tes
t S
core
s fo
r G
rad
e 9

23
which gamification was not used. This means that there were more students receiving
those higher test scores during the time that gamification was in use. However, it is
unclear on whether this is directly related to the use of gamification or not.
It is noteworthy to point out that the content between the two quarters did differ.
As stated earlier, the area of study during the quarter in which the project was in progress
dealt primarily with concepts related to meteorology. During the quarter in which test
grades were pulled for comparison, the focus of study was on the differences processes
that shape the Earth’s surface, such as landslides and surface water movement. Since
neither of these were more difficult than the other, and the method of reviewing and
taking tests did not differ between the two quarters, it is unlikely that this difference
played a role in the difference in scores seen in the ninth-grade.
8th Grade Test Scores
Figure 6. Comparison of test scores for 8th grade class, treatment quarter vs. non-
treatment quarter (N=9).
24
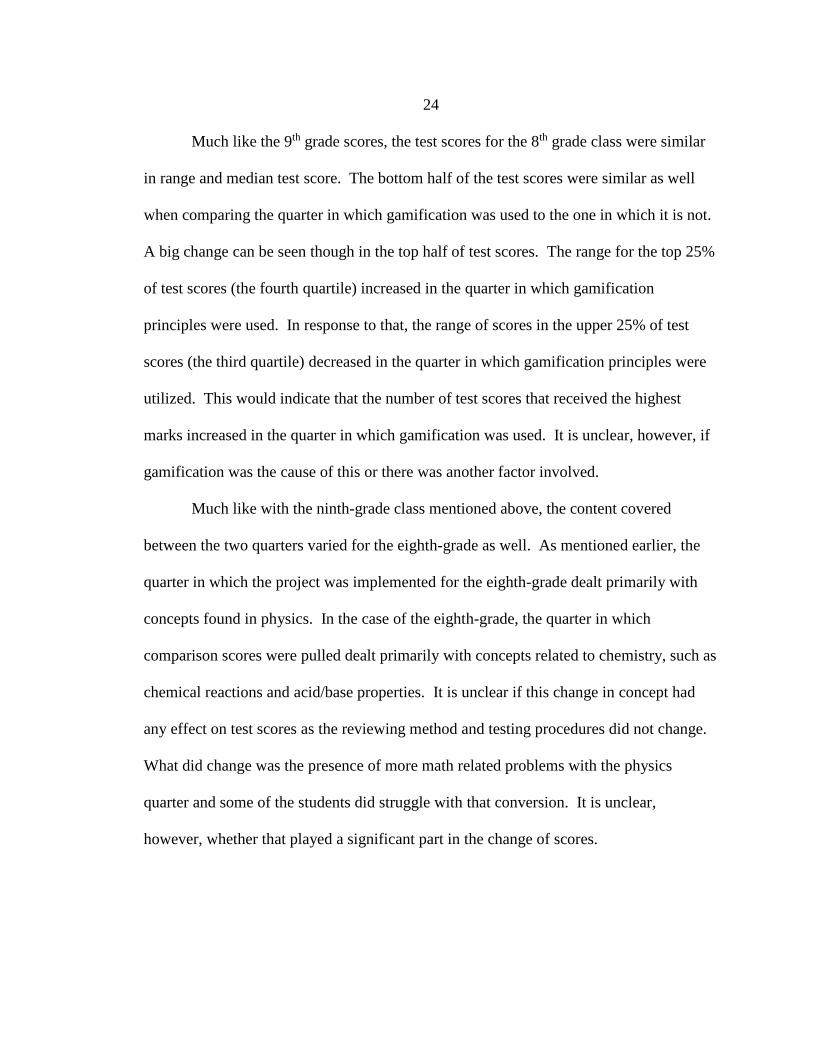
Much like the 9th grade scores, the test scores for the 8th grade class were similar
in range and median test score. The bottom half of the test scores were similar as well
when comparing the quarter in which gamification was used to the one in which it is not.
A big change can be seen though in the top half of test scores. The range for the top 25%
of test scores (the fourth quartile) increased in the quarter in which gamification
principles were used. In response to that, the range of scores in the upper 25% of test
scores (the third quartile) decreased in the quarter in which gamification principles were
utilized. This would indicate that the number of test scores that received the highest
marks increased in the quarter in which gamification was used. It is unclear, however, if
gamification was the cause of this or there was another factor involved.
Much like with the ninth-grade class mentioned above, the content covered
between the two quarters varied for the eighth-grade as well. As mentioned earlier, the
quarter in which the project was implemented for the eighth-grade dealt primarily with
concepts found in physics. In the case of the eighth-grade, the quarter in which
comparison scores were pulled dealt primarily with concepts related to chemistry, such as
chemical reactions and acid/base properties. It is unclear if this change in concept had
any effect on test scores as the reviewing method and testing procedures did not change.
What did change was the presence of more math related problems with the physics
quarter and some of the students did struggle with that conversion. It is unclear,
however, whether that played a significant part in the change of scores.

25
7th Grade Test Scores
Figure 7. Comparison of test scores for 7th grade class, treatment quarter vs. non-
treatment quarter (N=4).
The 7th grade test scores show the greatest change in going from a quarter in
which no gamification was used to a quarter in which gamification was used. The first
major change was the median test scores went from the low 90s in the non-treatment
quarter to 100 in the treatment quarter. The range of values also decreased significantly
in the treatment quarter. The test score ranges for the first two quartiles increased in the
treatment quarter. This could either be an increase in test scores for those lower earners
or those that were receiving high test scores in the non-treatment quarter were now
receiving slightly lower test scores during the treatment quarter. While it is unclear
whether this can be attributed directly to gamification, it is promising to see an increase
in the lower half of the test scores.
80
85
90
95
100
105
110
Treatment Non-Treatment
Tes
t S
core
s fo
r G
rad
e 7

26
Unlike with the ninth and eighth-grade classes, the concept that were being
covered between the two quarters for the seventh-grade class did not change, as the class
was exploring organismal biology over the course of the two quarters. One difference
however, was the during the non-treatment quarter, the primary focus of study was on
invertebrates and not vertebrates as was the case in the treatment quarter. The
unfamiliarity with invertebrates may have played a part in the change in test scores, but it
is unclear to what extent, if any, it had on test scores.
Post-Treatment Likert Survey Analysis
After the treatment process, a post-treatment Likert Survey (Appendix B) was
given to those students who finished the treatment and the results were tabulated in an
Excel sheet much like the pre-treatment survey was done. Table 7 shows the students’
response to the question on the survey and how many times that response was recorded,
as well as the average value for responses to each question.
Table 7
Summarized Responses to Post-Treatment Likert Survey
1 2 3 4 5 6 7 8 9 10 Avg.
Su
rvey
Qu
esti
ons
Q1 0 0 0 1 2 1 4 4 5 1 7.50
Q2 2 4 2 3 4 0 1 1 1 0 4.00
Q4 0 0 2 4 0 2 3 4 2 1 6.39
Note. The top row of values represents a scale of 1-10 for responding to the questions on
the pre-treatment survey (N=18).
Table 7 shows that once we started using Class Craft, students that were surveyed
responded highly on the scale that they enjoyed coming to class but responded in the low
to mid-range on the scale when questioned on whether Class Craft influenced their
motivation to come to class. The average values reflect this with question one having an

27
average that would be on the high end of the scale, while question two has an average
below the mid-value range. Responses were in the mid-range to high end when asked if
they enjoyed a class that utilized gamification principles which is also reflected in the
average for question four. This indicates that while students still seemed to enjoy coming
to class, the use of a gamification platform like Class Craft was not the driving force for
that enjoyment. I examined the responses to the open-ended questions on the Likert
survey, but found most of those responses blank or left with an IDK (I don’t know).
Figures 8 and 9 shows a breakdown of the responses to Questions 3 and 5 since
those did not have any numerical value to them.
Figure 8. Breakdown of responses to question 5 from Post-Treatment Likert Survey
(N=18).
Figure 9. Breakdown of responses to question 3 from Post-Treatment Likert Survey
(N=18).
104
4
Y N M
0
5
12
1
Don't Enjoy Slightly Enjoy Enjoy Highly Enjoy

28
Figure 8 shows that while a good portion (72.2%) of the students enjoyed or
highly enjoyed the changes to class, 27.8% of the students answered that they only
slightly enjoyed changes made in class. When examining the responses for question five,
it was found that 77.8% of the students said that they might enjoy a class that utilized
gaming principles more in depth in the future, while 22.2% of the students would not.
What these values indicate is that while the amount of gamification that was used had no
significant impact on a student’s enjoyment of class, enough of it was used to intrigue the
students enough that they might be open to doing a more in-depth use of gamification in
the future.
Much like the pre-treatment data, this data is further broken down by gender and
grade level. Unlike the pre-treatment data, however, the post-treatment data will not be
broken down by middle school vs. high school as the number of students in the high
school dropped due to the reasons mentioned before.
Breakdown of Data by Gender
Table 8 and Figures 10 and 11 show a breakdown of the post-treatment Likert
survey by gender.
Table 8
Average Score for Post-Treatment Likert Survey by Gender
Survey
Question
Q1 Q2 Q4
Average Score
for Males
7.60 4.10 6.90
Average Score
for Females
7.38 3.88 5.75
Note. Average scores were based off the number of males (Nm=10) and females (Nf=8)
that completed the treatment.

29
Figure 10. Breakdown of responses to question 3 of Post-Treatment Survey by gender
(N=18).
Figure 11. Breakdown of responses to question 5 of Post-Treatment Survey by gender
(N=18).
The breakdown of the post-treatment data by gender shows very similar answers
to the Likert survey by both males and females. The average values for both questions
one and two were only 0.22 points away from each other. The biggest difference was in
question four in which males responded with a higher average value when asked whether
they enjoyed the inclusion of gamification principles. This can further be seen from the
0
1
2
3
4
5
6
7
8
Don't Enjoy Slightly Enjoy Enjoy Highly Enjoy
NU
MB
ER
OF
RE
SP
ON
SE
S
Male Female
0
1
2
3
4
5
6
Yes No Maybe
NU
MB
ER
OF
RE
SP
ON
SE
S
Male Female
30
data in Figures 10 and 11 which show that 80% of the males enjoyed or highly enjoyed
the changes to class and 70% would or might enjoy the use of these principles in the
future.
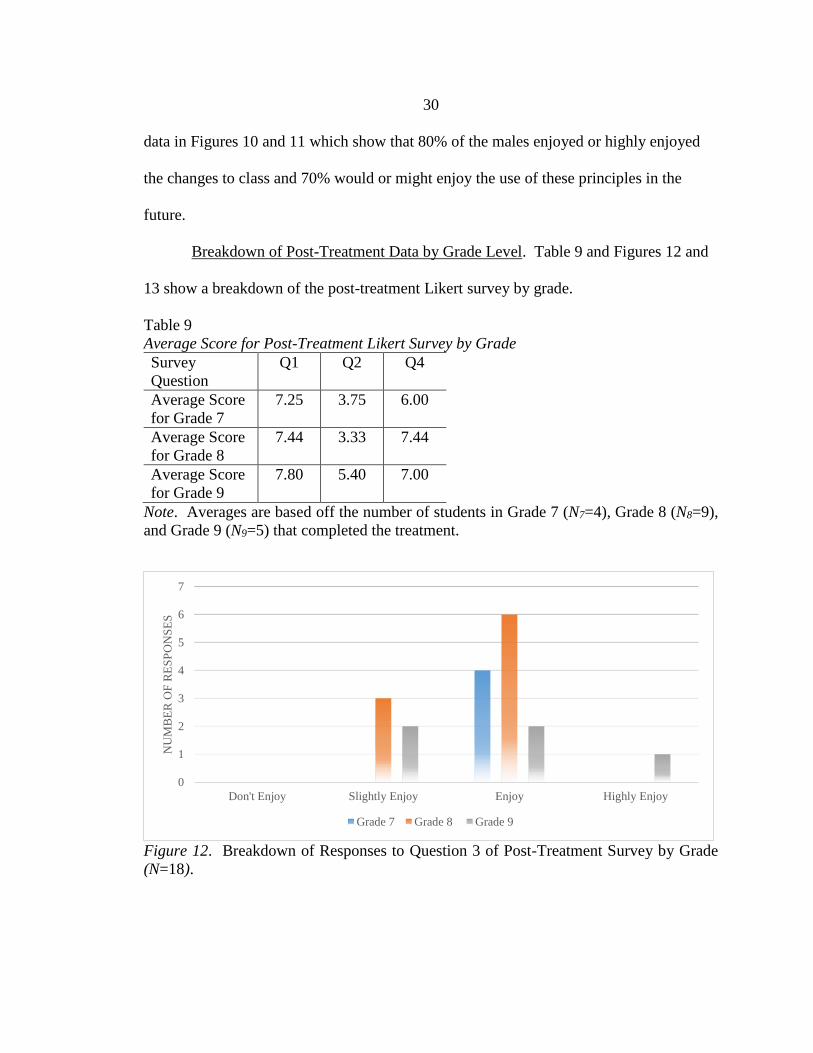
Breakdown of Post-Treatment Data by Grade Level. Table 9 and Figures 12 and
13 show a breakdown of the post-treatment Likert survey by grade.
Table 9
Average Score for Post-Treatment Likert Survey by Grade
Survey
Question
Q1 Q2 Q4
Average Score
for Grade 7
7.25 3.75 6.00
Average Score
for Grade 8
7.44 3.33 7.44
Average Score
for Grade 9
7.80 5.40 7.00
Note. Averages are based off the number of students in Grade 7 (N7=4), Grade 8 (N8=9),
and Grade 9 (N9=5) that completed the treatment.
Figure 12. Breakdown of Responses to Question 3 of Post-Treatment Survey by Grade
(N=18).
0
1
2
3
4
5
6
7
Don't Enjoy Slightly Enjoy Enjoy Highly Enjoy
NU
MB
ER
OF
RE
SP
ON
SE
S
Grade 7 Grade 8 Grade 9

31
Figure 13. Breakdown of Responses to Question 5 of Post-Treatment Survey by Grade
(N=18).
The data breakdown for the post-treatment survey by grade level shows a wide
range of results. While all grades had very similar responses when questioned about how
much they enjoyed coming to class once Class Craft started, the other questions showed
striking differences. When questioned on Class Craft’s effect on a student’s motivation,
grades 7 and 8 had a very low average, while grade 9 had an average that was in the
middle. This indicates that using Class Craft motivated those students more than grades
7 and 8. The average responses for the question dealing with enjoying a class that used
gamification principles had the widest range of responses. Grade 8 had the highest
average, while grade 7 had the lowest average.
Post-Treatment Interview
After the treatment process, a few random students were chosen to complete the
interview questions found in Appendix D. Much like with the pre-treatment, there were
some similar responses to the questions and some differences to others.
0
0.5
1
1.5
2
2.5
3
3.5
4
4.5
Yes No Maybe
NU
MB
ER
OF
RE
PS
ON
SE
S
Grade 7 Grade 8 Grade 9

32
Of the students interviewed there were a few common aspects of the treatment
that were brought up that the students seemed to enjoy. One of these aspects was the use
of powers in class. Powers would allow students to either turn in assignments that were
late with no consequence or skip over an assignment entirely. One student interviewed
said that this “made it seem like there was less pressure on him and he didn’t have to
worry about too much about a late grade.” Another student responded that she enjoyed
having the option of skipping an assignment because she was involved “in a bunch of
different things” and it lessened the pressure of getting something done. One student said
that he just liked the idea of “skipping an assignment that he didn’t want to do.” Another
aspect that was brought up during the interviews that students seemed to enjoy was the
Random Event activities. These were usually done at the beginning of class and varied
from tasks that needed to be down or random activities for XP. One of the students
interviewed said that this made the class more enjoyable and made it feel more like a
random event that you might find while playing a game. I just think she enjoyed the ones
that made me do things like end sentences with a meow or sing the chorus to a song that
the class chose.
Another question where similar responses were given, was the question on if the
gamification principles helped the students throughout class. The general thought was
that the gamification process had no effect on their retention of the material or didn’t help
them because it wasn’t utilized enough to have an impact on the student’s performance in
class. One student commented that even while using Class Craft, she relied more on the
Quizizz reviews and her study guide to study for tests. One student claimed that he

33
remembered more about a topic because of the lab that was done over it then what was
done through Class Craft.
The other question where I saw a split in the responses is the question on their
interest in a class that was set up like an RPG game like Class Craft. While the
overwhelming consensus was that there was some interest in a class set up like an RPG
game, it would depend on how it was set up and how much in depth it went. One student
even commented that it seemed like we only “scratched the surface with something like
this.”
Impact on the Teacher
As the treatment progressed, I kept a journal of my observations for the classes
involved. Excerpts from this journal can be found in Appendix E. There are a few areas
of emphasis that can be taken from these excerpts. The first aspect is that student interest
started out strong but soon waned. Even in the students that finished the treatments (7th-
9th grade) there was some waning in interest. As noted in the March 10th entry, one
student has said that she, “doesn’t care anymore” since she “has all the things I can get
for my character.
Another area during the treatment that I did notice and make note of was the
number of assignments turned in. As mentioned in the March 10th entry, I noted that one
student had not had a missing assignment grade since February 10th. This was true for a
few other students who had had a history of not turning in assignments. This could be
influenced by the gamification principles as students would lose health points and fall in
battle if they missed an assignment.
34
The last area I am going to address was the time commitment the treatment
required to keep up with the student’s avatars. As we progressed through the units, side
quests were created to ensure students could gain as much XP for their avatars as
possible. While this only ended up being for three of the classes I started out with, I
found most of my prep time (about 56 minutes) and any free time in my other classes to
try and find adequate side quests that could be applied to the content being covered. This
is noted in the March 1st entry found in Appendix E. This would take time away from
planning for my other classes as well as the grading that needed to occur, since that was
another area that students could gain XP in. This may have seemed more like it was
pulling time away from other classes because it was the first time that these concepts
were being used. In subsequent years of use, practice and familiarity could turn this into
a time saver and not seem like its pulling vital time away from other areas.
INTERPRETATION AND CONCLUSION
Re-addressing the Focus Questions
At the onset of my project, the ultimate question I hoped to answer was, “Does
incorporating gamification principles influence a middle and high school science
classroom?” The following sub-questions were meant to help supplement my focus
question and provide a more in-depth analysis of my research:
What effect does gamification have on a student’s retention of the material?
What impact does gamification have on a student’s attitude towards science?
Does gamification benefit a middle school classroom or high school classroom
more?

35
How has gamification modified my teaching habits?
Student’s Retention of Material
The question on what effect gamification has on a student’s retention of the
material can be seen in the summative assessment data. The timing between teaching and
assessment varied with the classes used during the treatment process, but a review session
was always done the day before the test. On average, this occurred within a week of
when the lesson was given, not including days where students missed for extracurricular
activities and labs. From the box and whisker plots found in the summative data section
above, test scores changed during the quarter in which gamification principles were
utilized. Unfortunately, the results of these test scores cannot be directly linked to the se
of gamification principles, as the review processes used from previous quarter were still
used during the treatment. However, there may have been an indirect influence that can
be attributed to gamification. As mentioned in the “Impact on Teacher” section, through
my daily observations, I noticed that one student had a decrease in the number of missed
assignments. This could be linked to the loss of health points (HP) mentioned in the
treatment section. An increase in the amount of homework assignments turned in could
correlate to an increase in the material that the student remembers writing about which
could indicate that the gamification influenced the retention of material, albeit indirectly.
Further study would need to be done where gamification is used solely as a review
process before a test is taken.
36
Student’s Attitude towards Science Class
To determine if gamification had any impact on a student’s attitude towards
science, we must compare the responses of the students to the Likert surveys given both
pre-treatment and post-treatment. Per Table 3, questions pertaining to a student’s attitude
towards science and class in general (Q1 and Q2) had a relatively high average value for
responses (7.00 and 7.48 respectively). These values can indicate that students were
already motivated to come to class and had a high drive to do well in science class. This
is mimicked in Figure 1 which shows that of the 31 students that completed the pre-
treatment Likert survey, roughly 77% enjoyed the current set up of class while roughly
19% highly enjoyed the current set up. Of the students that completed the treatment this
number, 100% of the students responded that they enjoyed the current class set up.
Per Table 7, questions pertaining to a student’s attitude toward class since the
implementation of the treatment (Q1 and Q2) had an average score of 7.50 for Q1 and
4.00 for Q2. These values indicate that students still enjoyed coming to class but only
increased slightly, while their motivation to come to class only increased slightly. The
responses to Q3 (as shown in Figure 9) show that students’ enjoyment of class changed
during the treatment process. Of the students that finished the treatment, the number of
students that enjoyed the class dropped from 100% to 67%, while 28% of the students
responded as only slightly enjoying the changes in class. This could be a combination of
the changes to class, as well as the general dreariness that all students feel by the time 3rd
quarter rolls around. I did notice that towards the end of the treatment process, the

37
number of log-ins by students started to decrease and comments such as “I don’t care
anymore,” started to increase.
High School vs. Middle School
As mentioned before, initial excitement for the project in the higher grade was
soon replaced by a lack of interest. The number of log-ins by students in the higher grade
drastically decreased in the first week. After setting up their avatars, these students rarely
participated in the other aspects of class. Some of this could be a lack of interest, but
some of it also could be attributed to scheduling conflicts. In the future, this might only
be used for a single unit instead of fully integrated.
Most of the students at RHS are heavily active in extracurricular activities such as
sports or FFA and in a small school like Richey, this usually means that when a
competition is occurring, classes rarely take place. The timeframe that the treatment took
place during also happened to fall in the middle of basketball season and towards the
main FFA competitions. These things did not affect the junior high kids and lower grade
high school kids which I believe contributed to the upper level high school students’ loss
of interest and not finishing the treatment.
Effect on the Teacher
As the treatment progress, I saw very little change in my teaching habits. The
way that I implemented the gaming principles allowed me to continue teaching the
information as I had normally done in the past. The one area there was a major impact on
was the planning phase of my teaching. The way that I implemented the gaming
principles, as well as the Class Craft program itself, required me to do a lot more

38
planning to relate any side quests back to the lessons at hand. I also found myself setting
a lot more time aside for grading to keep up with the changes that needed to occur with
the players’ avatars.
Conclusion
Based on the data gathered, there are a couple of conclusions that I can draw that
help to answer my focus question. For one, there can be no discernable conclusion on to
what affect gamification has on the retention of the material for a student. While there
was an increase in test scores for one of the classes involved, there was a decrease in test
scores in the other two. As mentioned earlier, this could have been influenced by the
difficulty level of the material covered from class to class. This could have also been
influenced by the academic level of the students involved in the classes.
Based on the data, it can also be concluded that gamification has a positive effect
on a students’ attitude towards science class as there was a slight increase in the values
for both attitude and motivation to come to class. The slight change in the number of
students that only slightly enjoyed the class after the changes were made can be attributed
to the general feeling that every student gets as the school year progresses.
Another piece of evidence that leads to my conclusion is that while both groups
(middle and high school) showed initial excitement over the treatment, it was the middle
school and lower high school class that maintained this excitement throughout the
treatment. As stated earlier, I attribute this to the discontinuity of schedules that is
common in small schools were everyone seems to be involved in extracurricular
activities. If this was done at the beginning of the school year or used sparingly

39
throughout, that could compensate for the discontinuity that I experienced. Making the
experience more optional to students could also have an effect.
Based on these statements, it is reasonable to conclude that gamification can
influence a student’s attitude towards science classes and seems to have a greater impact
on a middle school science class than a high school science class. From the data
gathered, it is also safe to conclude that for gamification to work, there needs to be a
more in-depth implementation of the principles and they need to be implemented earlier
in the year. This could not only help avoid the pitfalls of scheduling that I ran into with
my own research project, but also start the students out with topics that you would
normally start a school year out with and the gaming can grow as you progress through
the curriculum with your students.
VALUE
The goal of this project was to see what effect incorporating gamification
principles has on both a high school and middle school setting. There are a couple
outcomes that arose from this project. The first outcome is that the students became
exposed to a learning style that they may have never seen before in a science classroom
setting. Gamification has the potential to hit on all the various learning styles out there.
It may also lessen the burden that a lot of students feel when they lose points on an
assignment or test. Programs like Class Craft can allow students to receive some partial
XP points for assignments they may not have done that great on. This might still give the
student a sense of accomplishment, because as any gamer will tell you, leveling up is one
great satisfaction for a game.

40
The second outcome affects me and my teaching abilities. I am always trying to
find a way to enhance the way my students learn the material. I have become
accustomed to using Power Point or notes on the board to help convey the material, but
this has the potential to seem like I am in a rut. Gamification offers another way to
convey the information from lessons to my students. By giving students optional
objectives to meet in side quests, I can reach those students that are ahead of their
classmates, while also not losing those students who tend to struggle.
Moving Forward
My current plan has been to use gamification principles in conjunction with what
I am currently doing in middle school. There a few areas where I think this concept can
move forward in. Instead of using this in conjunction with how classes are usually run,
this could be done in place of the norm entirely. Instead of teaching a chapter the way
that I have always done so (lecture/lab/review/assess), students are given the overall
mission that must be accomplished and then a series of tasks that will build up to the
conclusion of that mission, much like what happens during a regular video game.
Another area that I think this concept could explore is how students would respond to
where their grades are determined not by the score obtained on an assignment or test, but
by how much XP they have achieved. The better a student does on an assignment, the
more XP he/she can earn. Failing an assignment could result in gaining no XP or even
losing XP, much like what would happen in a video game if you fail a mission.
There are aspects of gamification that were used in this study that can be
replicated in the future. The use of powers and abilities gave the students an element of

41
control that they might not get from the normal class routine. The power to skip over an
assignment would have to change, as I believe it made the students more complacent and
more prone to “abuse” the power as some started to do in this study. Based on the
conclusions discussed above, any future use of gamification would be focused primarily
on the middle school classes initially. As these students continued, the option of using
gamification could be given to the students as they progress through their high school
careers.

42
REFERENCES CITED

43
Bogost, I. (2008). The Rhetoric of Video Games. The Ecology of Games: Connecting
Youth, Games, and Learning. Cambridge, MA: The MIT Press.
Brull, S., & Finlayson, S. (2016). Importance of Gamification in Increasing Learning.
The Journal of Continuing Education in Nursing, 47(8), 372-375.
Dominguez, A., Saenz-de-Navarrete, J., de-Marcos, L., Fernandez-Sanz, L., Pages, C.,
Martinez-Herraiz, J-J. (2013). Gamifying learning experiences: Practical
implications and outcomes. Computers & Education, 63, 380-392.
Farber, M. (2015). Gamify Your Classroom: A Field Guide to Game-Based Learning (p.
117-140). New York, NY: Peter Lang Publishing, Inc.
Hanus, M.D., & Fox, J. (2015). Assessing the effects of gamification in the classroom:
A longitudinal study on intrinsic motivation, social comparison, satisfaction,
effort, and academic performance. Computers and Education, 80, 152-161.
Kim, B. (2015). Understanding Gamification. American Library Association, 51(2), 29.
Koivisto, J., & Hamari, J. (2014). Demographic differences in perceived benefits from
gamification. Computers in Human Behavior, 35, 179-188.
McGonigal, J. (2011). Reality is Broken: Why games make us better and how they can
change the world. New York, NY: Penguin.
Papastergiou, M. (2009). Digital Game-Based Learning in high school Computer
Science Education: Impact on educational effectiveness and student motivation.
Computers and Education, 52(1), 1-12.
Reichelt, A.L. (2015). Effects of Gamification: Analyzing Student Achievement,
Mastery, and Motivation in Science Classrooms. (Unpublished professional
paper). Montana State University, Bozeman, Montana.
Sheldon, L. (2012). The Multiplayer Classroom: Designing Coursework as a Game.
Boston, MA: Cengage Learning

44
APPENDICES

45
APPENDIX A
ATTITUDE TOWARDS SCIENCE AND TECHNOLOGY PRETREATMENT
SURVEY
46
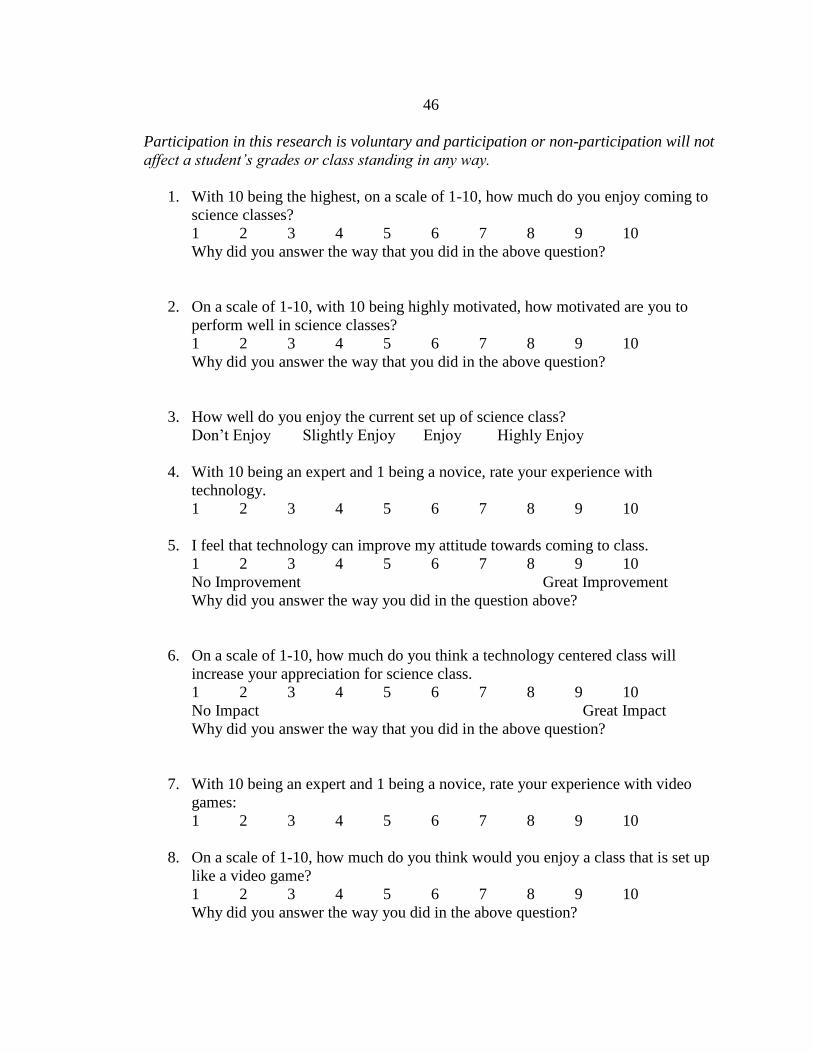
Participation in this research is voluntary and participation or non-participation will not
affect a student’s grades or class standing in any way.
1. With 10 being the highest, on a scale of 1-10, how much do you enjoy coming to
science classes?
1 2 3 4 5 6 7 8 9 10
Why did you answer the way that you did in the above question?
2. On a scale of 1-10, with 10 being highly motivated, how motivated are you to
perform well in science classes?
1 2 3 4 5 6 7 8 9 10
Why did you answer the way that you did in the above question?
3. How well do you enjoy the current set up of science class?
Don’t Enjoy Slightly Enjoy Enjoy Highly Enjoy
4. With 10 being an expert and 1 being a novice, rate your experience with
technology.
1 2 3 4 5 6 7 8 9 10
5. I feel that technology can improve my attitude towards coming to class.
1 2 3 4 5 6 7 8 9 10
No Improvement Great Improvement
Why did you answer the way you did in the question above?
6. On a scale of 1-10, how much do you think a technology centered class will
increase your appreciation for science class.
1 2 3 4 5 6 7 8 9 10
No Impact Great Impact
Why did you answer the way that you did in the above question?
7. With 10 being an expert and 1 being a novice, rate your experience with video
games:
1 2 3 4 5 6 7 8 9 10
8. On a scale of 1-10, how much do you think would you enjoy a class that is set up
like a video game?
1 2 3 4 5 6 7 8 9 10
Why did you answer the way you did in the above question?

47
APPENDIX B
ATTITUDE TOWARDS GAMIFICATION POST-TREATMENT SURVEY

48
Participation in this research is voluntary and participation or non-participation will not
affect a student’s grades or class standing in any way.
1. With 10 being the highest, on a scale of 1-10, how much did you enjoy coming to
class once we started using Class Craft?
1 2 3 4 5 6 7 8 9 10
Why did you answer the way that you did in the above question?
2. Rate, on a scale of 1-10 with 1 being no change, how much do you think your
motivation to come to class change once we started using Class Craft?
1 2 3 4 5 6 7 8 9 10
Why did you answer the way that you did in the above question?
3. How well have you enjoy the changes to science class?
Don’t Enjoy Slightly Enjoy Enjoy Highly Enjoy
4. On a scale of 1-10, how much have you enjoyed a class that included gamification
principles?
1 2 3 4 5 6 7 8 9 10
Why did you answer the way you did in the above question?
5. Would you enjoy a class that used gamification principles more in depth in the
future? Y N

49
APPENDIX C
PRE-TREATMENT INTERVIEW QUESTIONS

50
Participation in this research is voluntary and participation or non-participation will not
affect a student’s grades or class standing in any way.
1. Do you find science interesting?
2. What activities or aspects of class do you enjoy?
3. Do you feel like you are learning in science class?
4. Have you heard of gamification before?
5. What has been your exposure to gaming in the past?
6. Would you be interested in a class that was set up to incorporate gaming aspects, such
as leveling up, experience points, quests, and badges? Why or why not?

51
APPENDIX D
POST-TREATMENT INTERVIEW QUESTIONS

52
Participation in this research is voluntary and participation or non-participation will not
affect a student’s grades or class standing in any way.
1. What aspects of the gamification process did you enjoy? What aspects did you not
enjoy?
2. What are some things you would have changed about the process?
3. Do you feel like gamification helped you in class?
4. After your exposure to gamification, how interested would you be in a class that was
set up exactly like a role-playing game like Class Craft?

53
APPENDIX E
EXCERPTS FROM TEACHER REFLECTIVE JOURNAL

54
Jan. 13th, 2017 – Introduced AR project to students. Interest seems high and kids are
excited.
Jan. 20th, 2017 – All students have created their avatars and some are already asking how
to get gold pieces to upgrade their character. A couple of students have opted out of the
treatment not surprisingly.
Jan. 27th, 2017 – Most classes have logged in frequently in the first couple of weeks.
Couple of classes have not.
Feb. 6th, 2017 – Most kids are gone for FFA so no quests for today. Those that are here
are a bit bummed but it’s something that might become more frequent with districts
coming up.
Feb. 10th, 2017 – Some people have not logged in for a while. Wonder if something is
up? On a positive note, the first review test using Class Craft’s boss battle option worked
wonders with the 8th graders.
Mar. 1st, 2017 – Most junior high students have logged in daily and have pretty much
gained all their avatars armor. Treatment has been abandoned for sophomores and
chemistry class as they seem the most uninterested and have rarely logged in. Basketball
schedule may have been a factor. Really struggling with keeping up on side quests
related to the topics at hand.
Mar. 10th, 2017 – I think we have hit the high point in the experience with some of them.
Some of the 8th graders have commented that they don’t really care anymore since they
have all their characters’ armor. Student A has not had a missing grade since February
10th. Third chapter review assignment that students have used powers to not skip…kind
of frustrating but it’s their choice.
Mar. 16th, 2017 – End of quarter is next week, so I informed the students we will no
longer be using Class Craft once the quarter is over. Some are bummed but I think
mainly it is because they must do chapter reviews now. Might have to forego chapter
reviews in the future.
Mar. 21st, 2017 – Last day using Class Craft…don’t know if I am relieved or not.

55
APPENDIX F
INSTITUTIONAL REVIEW BOARD EXEMPTION LETTER
56


