
The effect of dimple error on the horizontal launch angle and side spin of the golf ball during putting
Richardson, Ashley K., Mitchel, Andrew C. S. and Hughes, Gerwyn 2016 This is the accepted manuscript of an article published by Taylor & Francis in the Journal of Sports Sciences on 16 March 2016 available online: http://dx.doi.org/10.1080/02640414.2016.1161213

1
The effect of dimple error on the horizontal launch angle and side spin 1
of the golf ball during putting 2
3
Abstract 4
This study aimed to examine the effect of the impact point on the golf ball on 5
the horizontal launch angle and side spin during putting with a mechanical 6
putting arm and human participants. Putts of 3.2 m were completed with a 7
mechanical putting arm (four putter-ball combinations, total of 160 trials) and 8
human participants (two putter-ball combinations, total of 337 trials). The 9
centre of the dimple pattern (centroid) was located and the following 10
variables were measured; distance and angle of the impact point from the 11
centroid and surface area of the impact zone. Multiple regression analysis 12
was conducted to identify whether impact variables had significant 13
associations with ball roll variables; horizontal launch angle and side spin. 14
Significant associations were identified between impact variables and 15
horizontal launch angle with the mechanical putting arm but this was not 16
replicated with human participants. The variability caused by ‘dimple error’ 17
was minimal with the mechanical putting arm and not evident with human 18
participants. Differences between the mechanical putting arm and human 19
participants may be due to the way impulse is imparted on the ball. Therefore 20
it is concluded that variability of impact point on the golf ball has a minimal 21
effect on putting performance. 22
Words: 199 23
24
25
2
Introduction 26
Based on Professional Golf Association (PGA) Tour statistics during 2014, 27
the putting stroke accounted for approximately 40% of all strokes during 28
tournament rounds (PGA Tour, 2015a; 2015b). This is in accordance with 29
Dorsel & Rotunda (2001) and Alexander and Kern (2005), who identified that 30
putting average was a key contributor to determining earnings on the PGA 31
Tour. A number of factors are considered to influence the success rate of a 32
golf putt, namely, green reading, aim, stroke and ball roll (Karlsen, Smith & 33
Nilsson, 2008). Regarding the putting stroke, Pelz (2000) considered two 34
variables that account for direction variability, face angle at impact (83%) and 35
the putter path (17%). Karlsen et al. (2008) accounted 80% of direction 36
consistency to face angle at impact (0.50° effective variability), 17% to putter 37
path (0.18° effective variability) and 3% to horizontal impact point on the 38
putter (0.09° effective variability). One variable that has not been considered 39
at length within the literature considering direction variability is the impact 40
point on the golf ball. 41
42
Golf balls are designed with dimples to reduce the drag of the golf ball when 43
in flight (Aoki, Nakayama, Hayasida, Yamaguti & Sugiura, 1998; Goff, 2013). 44
These dimples, however, may also be a detriment to putting performance. 45
Due to the dimples a golf ball is not perfectly spherical with potential for the 46
golf ball to rebound off the putter during impact at an unexpected angle 47
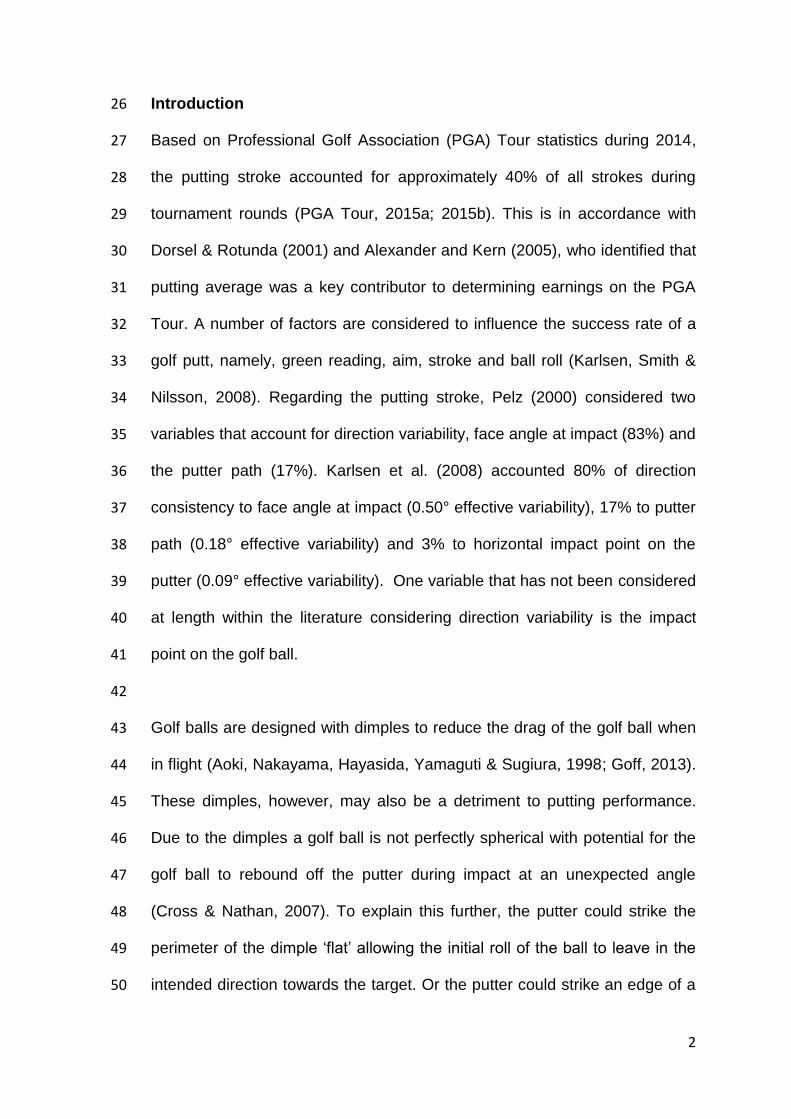
(Cross & Nathan, 2007). To explain this further, the putter could strike the 48
perimeter of the dimple ‘flat’ allowing the initial roll of the ball to leave in the 49
intended direction towards the target. Or the putter could strike an edge of a 50

3
dimple causing a deflection of direction off the intended target line (Figure 1). 51
Research has acknowledged that dimples do affect the direction variability 52
during a golf putt, however; only limited data is presented through a simple 53
analysis of the distance that putts have rolled off line (Pelz, 2000). The 54
authors of the current study propose that the direction variability away from 55
the intended target line accountable to the impact point on the golf is termed 56
dimple error. In addition to the horizontal launch angle another variable 57
relatively unexplored is the side spin imparted on the golf ball. Hurrion and 58
Mackay (2012) have identified that side spin imparted on the ball (> 20 rpm) 59
has potential to cause the ball travelling off the intended target line; this is 60
accountable to resultant angle differences between the putter path and face 61
angle. Therefore, could potentially be a contributing factor to missed putts 62
along with the horizontal launch angle. 63
64
FIGURE ONE ABOUT HERE 65
66
Dimple error will be more prominent when executing shorter golf putts, this is 67
due to greater compression of the golf ball during longer golf putts (Pelz, 68
2000). Dimple error is likely to have an inverse relationship with the 69
compression of the golf ball, therefore may only be applicable during a 70
shorter golf putt. Cross (2006) demonstrated in a non-golf environment that 71
the golf ball can deflect off at a random angle, whereas a ball bearing 72
bounced symmetrically and vertically. It was suggested that the dimples 73
caused the random deflection (Cross, 2006). This was tested dropping the 74
balls onto a marble surface from a height of 80 cm. There are limitations 75

4
associated with this experiment, as in a golf situation the ball is the stationary 76
object and the club the moving object. Therefore, Cross (2006) does not 77
accurately replicate the putter-ball impact as it occurs on the putting green. 78
With the initial direction of the golf ball predominantly being determined by 79
the putter face angle (Karlsen et al., 2008), the random deflection will be less 80
significant than observed by Cross (2006). Therefore research is needed to 81
determine whether this mechanism is apparent to any extent in a golf 82
environment. 83
84
Different types of putter face have previously been compared (Hurrion & 85
Hurrion, 2002; Brouillette, 2010), however, putting remains to date an under 86
researched area. Additionally, focus has predominantly been on the effect of 87
topspin imparted on the golf ball rather than the initial direction of the golf 88
ball, which is clearly an important factor of whether a putt is successful or 89
not. Contrasting results were however observed, whereby Hurrion and 90
Hurrion (2002) observed improved topspin in trials completed with a grooved 91
faced putter whereas Brouillette (2010) did not report improved topspin 92
between a grooved faced and traditional faced putter. This provides rationale 93
to test putters with different face inserts however, neither considered the 94
effect of the variability of the impact point on the golf ball. 95
96
The aim of this study was to investigate the effects of impact point on the golf 97
ball on the resulting horizontal launch angle (initial direction) and side spin of 98
the golf ball. This will be investigated using a mechanical putting arm and 99
human participants. It was hypothesised that significant associations 100

5
between the variance of the kinematic variables (horizontal launch angle and 101
side spin) and the impact point on the golf ball would exist. 102
103
Methods 104
105
Participants 106
A total of 22 right handed golfers participated in the study (age 42 ± 12 107
years; handicap 13.6 ± 7.4 (handicap range 0 – 24); height 1.76 ± 0.21 108
metres; mass 88.6 ± 23.8 kg). All golfers were free of musculoskeletal injury 109
for the previous three months and played a minimum of once a week. During 110
testing participants wore their own personal golfing attire and golf shoes. All 111
participants provided written informed consent and the study was approved 112
by the institutional ethics committee of University of Hertfordshire. 113
114
Experimental set-up 115
Two testing sessions were completed to establish the association between 116
the impact point on the golf ball and the initial direction of the golf putt. 117
Firstly, with a mechanical putting arm where the putting stroke parameters 118
putter face angle, putter path and impact point on the putter were 119
standardised and secondly with human participants to determine whether 120
results are applicable in a practical setting. 121
122
A mechanical putting arm was setup to reproduce a putt of 3.2 metres on an 123
artificial putting surface registering 12 on the stimpmeter (The United States 124
Golf Association, Far Hills, NJ, USA). A square to square swing path was 125

6
selected to ensure a square club face at impact, referring to a single 126
horizontal axis that was perpendicular to the putting line. Human participants 127
completed a level straight 3.2 metre putt on a Huxley Golf (Huxley Golf, 128
Hampshire, UK) artificial putting green (3.66 x 4.27 metres) registering 11 on 129
the stimpmeter. 130
131
The putters used for both testing sessions were the grooved faced GEL® 132
Vicis (GEL GOLF., Wan Chai, Hong Kong) and traditional faced Odyssey 133
White Hot #3 (Callaway Golf Europe Ltd., Surrey, UK). Both putters had a 134
standardised 69° lie and 2.5° loft. Srixon Z-STAR golf balls (Srixon Sports 135
Europe LTD., Hampshire, UK) and Titleist Pro V1 golf balls (Acushnet 136
Europe Ltd., Cambridgeshire, UK) were aligned using two Superline 2D line 137
lasers (Property Perspective Ltd., Warwick, UK). Ball placement during 138
testing with the mechanical putting arm was standardised by placing one 139
laser directly behind the golf ball and the second 90° perpendicular to the 140
path of the golf ball. Dimples were then orientated by ensuring the visual aid 141
printed on the golf ball was intersected with both lasers. Participants testing 142
were completed with only the Srixon golf ball; these were aligned in the 143
manner as the mechanical putting arm to ensure the same placement of the 144
golf ball across trials. 145
146
To record the horizontal launch angle (degree to which the ball deviates (°) 147
from the original putting line) and side spin (the amount of side spin (rpm) 148
placed on the ball at impact) of the golf ball, a Quintic (Quintic Consultancy 149
Ltd., Coventry, UK) high speed camera (UI-5220RE) sampling at 220 Hz was 150

7
positioned perpendicular to the putting line. The Quintic Ball Roll v2.4 launch 151
monitor software was used to analyse the recorded videos. A Quintic GigE 152
high speed camera sampling at 220 Hz was positioned vertically (1.8 m 153
above putting surface) to validate the horizontal launch angle values during 154
testing with the mechanical putting arm. A Canon (Canon Europe Ltd, Tokyo, 155
Japan) EOS 1000d camera was placed on a tripod away from the putting line 156
where it did not disturb the view of the participant during the trial or impede 157
the mechanical putting arm. This camera took images of the impact point of 158
the golf ball post trial. 159
160
Procedure 161
During testing with the mechanical putting arm, each putter was held 162
securely within a clamping mechanism. A putting arm block was placed at an 163
appropriate distance behind the golf putter to produce the desired length of 164
putt, and the putting arm was released by deactivating an electromagnet. 165
Before each trial a thin layer of pigmented emollient was applied to the putter 166
face and smoothed. The golf ball was then aligned using the Superline lasers 167
dissecting the ball into four equal sections, ensuring the same position for 168
each trial. Forty trials were completed with each putter-ball combination 169
(GEL®-Srixon, GEL®-Titleist, Odyssey-Srixon and Odyssey-Titleist). Trials 170
were filmed with the Quintic Ball Roll software. Additionally, after each trial a 171
picture was taken of the golf ball placed in a pre identified position (50 cm 172
away from the camera) (identifying the pigmented emollient imprint on the 173
ball) with the Canon EOS 1000d camera. 174
175

8
During testing with human participants, an initial period of habituation was 176
allowed with the first putter that had been randomly selected. This 177
habituation period was repeated for the second putter when swapped during 178
the protocol. During both habituation periods the participant was informed of 179
the initial ball velocity threshold (2.10 – 2.28 m/s). This was to ensure a 180
similar pace of putt between participants and during habituation subjects 181
found it relatively easy to satisfy this criteria. After habituation, the 182
investigator lined up the putt with the Superline lasers. This process was 183
completed until six successful (holed) putts had been completed with each 184
putter; however, missed putts were included within the analysis. Six 185
successful putts were selected as criteria, due to procedural limitations (time 186
of analysis) whilst still giving a suitable number of trials. 187
188
Data Processing 189
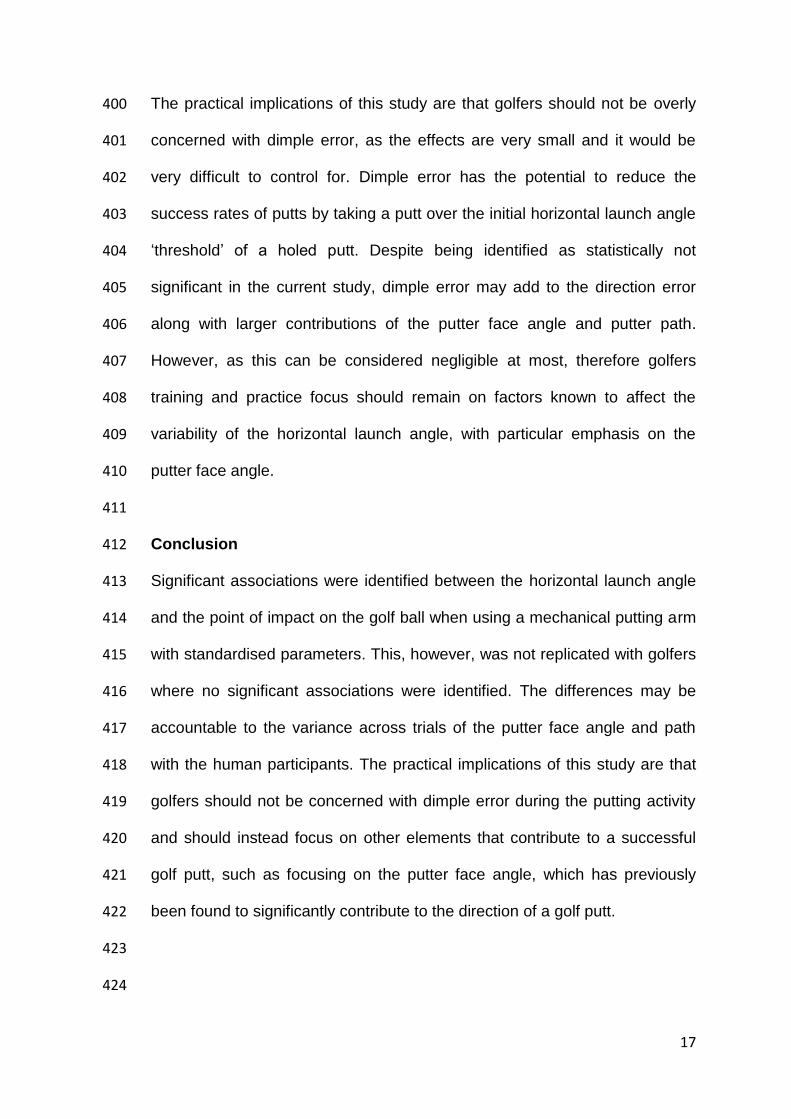
Using Adobe Photoshop CS5 (Adobe Systems Incorporated., CA, USA) a 0, 190
0 coordinate was identified as the centre of the dimple pattern. This was 191
defined as the centroid location (Figure 2; centre of the pentagon and where 192
lines A) and B) join). All impact measurements were then made from this 0, 0 193
coordinate. For the Srixon golf ball an equilateral triangle drawing was 194
overlaid on the image identifying the centroid location of three dimples. The 195
Titleist ball had two different sized dimples; therefore a pentagon drawing 196
was placed on the image identifying the centroid location of one smaller 197
dimple surrounded by five larger dimples. 198
199

9
The contact made between the putter and ball during the impact was termed 200
the impact zone. To determine the length (mm) and angle (direction of 201
impact from the centroid location (°)) the centre of the impact zone had to be 202
calculated. To complete this a polygon was drawn at the outermost edges of 203
the impact zone and intersected from the four corners, giving a centre point 204
(Figure 2; end of line A) away from centroid location). From this, differences 205
in length (Figure 2; of line A)) and angle (Figure 2; angle between line A) and 206
B) between the standardised centroid location and impact point were 207
measured. The surface area of the impact zone (area of contact between the 208
putter and ball) was measured using ImageJ (National Institutes of Health, 209
Bethesda, Maryland, USA). Using the polygon selection tool the edges of the 210
impact zone were connected giving an output (mm2) of surface area (Figure 211
2; area of grey shading within white outline). A more detailed explanation of 212
how the data were processed is presented in Richardson, Mitchell and 213
Hughes (2015). 214
215
FIGURE TWO ABOUT HERE 216
217
Data Analysis 218
The impact variables measured were the length of the impact point from the 219
centroid location, angle of the impact point from the centroid location and 220
surface area of the impact zone, which was used for the multiple regression 221
analysis. The dependent variables were the horizontal launch angle (the 222
degree to which the ball deviates from the original putting line) measured in 223
degrees and side spin (the amount of cut or hook spin (rpm) placed on the 224

10
ball during impact). Data were exported to statistical software packages 225
SPSS v21 (SPSS Inc, Chicago, USA) for analysis. 226
227
The linearity of the data was first assessed by examining residual plots 228
(standardised residuals as a function of standardised predicted values) 229
(Pedhazur, 1997). Then the data were analysed for normality by assessing 230
histogram and box-plot graphs, kurtosis and skewness values. If kurtosis or 231
skewness values were found to be > ± 1, the data set was identified as highly 232
skewed or kurtosed, between ± 0.5 and ± 1 the data set was identified as 233
moderately skewed or kurtosed, and between 0 and ± 0.5 the data was 234
considered to be approximately symmetrical (Bulmer, 1979) and therefore 235
displaying normality. Any data sets that were found to be highly skewed or 236
displaying high kurtosis was transformed logarithmically (log) in order to 237
increase uniformity to a normal distribution curve (Atkinson & Nevill, 1998; 238
Hopkins, Marshall, Batterham & Hanin, 2009). The only data set that 239
required log transforming was the Odyssey-Titleist group (tested with the 240
mechanical putting arm). Descriptive data of the log-transformed data sets 241
are presented in their absolute form. Box-plots were used to identify outliers 242
within the data set; if an outlier was identified for one impact variable the 243
entire trial was removed from analysis. 244
245
Bivariate analysis was undertaken for the independent and dependent 246
variables to ensure multicollinearity was avoided. Correlations were 247
identified as very high if r ≥ 0.90 (Ntoumanis, 2001). Additionaly, collinearity 248
diagnostics, variance inflation factor (VIF) and the tolerance statistic were 249

11
used to assess multicollinearity. A VIF greater than 10, was identified as a 250
cause of concern (Bowerman & O’Connell, 1990; Myers, 1990) and a 251
tolerance below 0.2 indicated a problem (Menard, 1995). Multiple regression 252
analysis was then completed. The independent variables length from the 253
centroid location (mm), angle from the centroid location (°) and surface area 254
(mm2) were the predictors used to assess whether the impact point on the 255
golf ball effected side spin and horizontal launch angle. Level of significance 256
was set at α < 0.05. 257
258
Results 259
Horizontal Launch Angle with the mechanical putting arm 260
Mean and standard deviations for the independent variables length, angle 261
and surface area are presented in Table 1. The multiple regression model 262
was found to be a significant predictor of horizontal launch angle for the 263
GEL®-Titleist (p = 0.001), GEL®-Srixon (p = 0.001) and Odyssey-Srixon (p = 264
0.03) groups, but not for the Odyssey-Titleist group (p = 0.18) (Table 2). The 265
impact variables accounted for 34% of the variability of horizontal launch 266
angle for the GEL®-Titleist group, 44% for the GEL®-Srixon group and 21% 267
of the variability for the Odyssey-Srixon group. The range of results 268
observed for the horizontal launch angle were -1.00 to 0.71°. 269
270
TABLE ONE ABOUT HERE 271
272
TABLE TWO ABOUT HERE 273
274

12
Horizontal Launch Angle with human participants 275
The multiple regression model was not a significant predictor of horizontal 276
launch angle for either the GEL®-Srixon (p = 0.52) or Odyssey-Srixon (p = 277
0.49) combinations (Table 3). Although not significant, the variability 278
accountable to the impact (predictor) variables would have been negligible at 279
2% (0.03°) and 1% (0.02°) for the GEL®-Srixon and Odyssey-Srixon groups 280
respectively. Figure 3 demonstrates the different variance in the impact 281
points on the golf ball between the mechanical putting arm and human 282
participants, where increased variance is observed in the latter. 283
284
TABLE TWO ABOUT HERE 285
286
Side spin with the mechanical putting arm 287
Significant association was found between side spin with all predictors 288
(length, angle and surface area) coupled for the Odyssey-Srixon combination 289
(p = 0.04). The impact variables accounted for 20% (2.8 rpm) of the variation 290
within this group (Table 4). There were no significant associations between 291
the impact variables and kinematic variables for the other three putter-ball 292
combinations. 293
294
TABLE THREE ABOUT HERE 295
296
Side spin with human participants 297
The multiple regression model was found to be a significant predictor of side 298
spin (Table 5) for the GEL® putter (p = 0.04) but not for the Odyssey putter (p 299

13
= 0.93). The impact variables accounted for 6% of variation observed in side 300
spin (1.54 rpm) for the GEL® putter 301
302
TABLE FOUR ABOUT HERE 303
304
Discussion 305
This is the first study to have measured and analysed the effects of the 306
impact point on the golf ball on subsequent ball roll kinematics. It was 307
hypothesised that significant associations would exist between the variance 308
of the horizontal launch angle and impact point variables. This were 309
accepted with the mechanical putting arm but rejected with human 310
participants. Regarding side spin, the hypothesis can be rejected with the 311
mechanical putting arm and partially accepted with human participants. The 312
variance of the horizontal launch angle with the mechanical putting arm was 313
minimal. This however can be attributed to dimple error during putting, with 314
the dimple orientation, putter face angle and path being controlled during the 315
experiment. With no significant associations identified with human 316
participants, dimple error is unlikely to have any implications on putting 317
performance. This is also apparent with side spin where only 20% of 318
variance was accountable for one putter-ball combination. 319
320
Pelz (2000) states that the larger the golf ball dimples, the more likely contact 321
made on the edge of a dimple will affect the horizontal launch angle, as each 322
dimple is covering a larger surface area. However, the smaller the dimple, 323
the increased number of dimples there will be covering the ball, therefore 324

14
increasing the chance of making contact with the edge of a dimple. Although 325
a golf ball with larger dimples has less chance of contact being made to a 326
dimple edge, the horizontal deviation caused by impact may increase. This 327
was not observed in the current study. Dimple circumferences of 12.4 mm 328
(Titleist Pro V1) and 12.9 mm (Srixon Z-STAR) were measured, indicating 329
more variability was expected for the Srixon golf ball. More variance was 330
however observed for the Titleist ball (GEL®-Titleist = 0.15°, Odyssey-Titleist 331
= 0.06°) in comparison to the Srixon (GEL®-Srixon = 0.13°, Odyssey-Srixon 332
= 0.04°). Differences are marginal between each group, however, based on 333
these results, it seems the different putters used in testing had more 334
influence on the horizontal launch angle (and therefore success rate of a 335
putt), rather than the impact point on the golf ball when using a mechanical 336
putting arm with standardised stroke kinematics. This is based on the 337
differences in variance of the horizontal launch angle being observed 338
between putters rather than golf balls. 339
340
During testing with the mechanical putting arm, all 160 trials would have 341
resulted in a successful putt (holed), even with the variation observed with 342
the horizontal launch angle and side spin. Therefore, the variation 343
accountable to the impact variables can be considered negligible for a 344
simulated putt. This is in accordance with Karlsen et al. (2008) who stated 345
that variables of the putting stroke including the putter face angle, putter path 346
and horizontal impact point on the putter face (standardised in mechanical 347
putting arm protocol) only have a minor influence on the direction 348
consistency in golf putting in elite players. Karlsen et al. (2008) accounted 349

15
3% of direction consistency to the impact point on the putter face. This 350
variability may not just be due to the variability on the putter face but also the 351
impact point on the golf ball, as demonstrated by the results in the current 352
study with the mechanical putting arm. This minor variation will not affect 353
success rate from 12 feet. As Hurrion and Mackay (2012) state that for a putt 354
to be successful from this distance a horizontal launch angle threshold of 355
0.75° would need to be exceeded. Results in the current study were within 356
this threshold whilst using the mechanical putting arm. 357
358
Along with the mechanical putting arm, dimple error can additionally be 359
considered inconsequential for golfers, with no significant associations 360
identified (Table 3). Differences in significant associations between the 361
mechanical putting arm and human participants may be due to human 362
participants’ differences in stroke kinematics such as the face angle and 363
putter path trial to trial as previously identified within the literature (Karlsen et 364
al., 2008; Pelz, 2000). Whilst no measurements were made of the putter face 365
angle and putter path the authors consider this to be a reasonable 366
assumption. The magnitude of the effects of the variation in putter face angle 367
and putter path may render the effects of dimple error statistically negligible. 368
For example, if the left hand side of a dimple was struck by the putter, for 369
dimple error to potentially affect the horizontal launch angle the putter face 370
would also have to be slightly open. However, natural variation will occur in 371
clubface angle at impact which may have contributed to the larger variation 372
observed in golfers in comparison to the mechanical putting arm (Figure 3). 373
Additionally, with a large range of handicaps observed in the current study 374

16
(handicap: 13.6 ± 7.4), golfers with a higher handicap will demonstrate a 375
wider range of natural variation in the face angle and putter path. Therefore, 376
these factors will have an increased effect, rendering dimple error even less 377
important regarding putting performance. 378
379
For a putt of 12 feet, Hurrion and Mackay (2012) state a putt with an initial 380
horizontal launch angle of within 0.75° would be successful which would be 381
produced with a putter face angle of 0.69° based on the putter face angle 382
determining 92% of the direction of the putt. Based on results with the 383
mechanical putting arm (Table 2), the addition of dimple error could reduce 384
the chance of a successful putt. However, with results not being reproduced 385
with golfers it can be considered that dimple error is not a problem a golfer 386
should be concerned about, particularly considering the difficulty in 387
controlling for it. 388
389
No literature to date has explored the initial phase of skid and side spin and 390
has focused on when the ball enters a state of pure rolling (Alessandri, 1995; 391
Hurrion & Hurrion, 2002; Lorensen & Yamrom, 1992; Penner, 2002). It has 392
been stated that friction between the ball and the green removes all spin in 393
approximately the first 20% of the roll (Pelz, 2000), therefore it may be 394
possible that friction between the stationary ball and green contributes 395
towards the side spin initially along with the small amounts of rotation during 396
impact. Potentially explaining a portion of the large variability observed in 397
human participants (Table 5). 398
399
17
The practical implications of this study are that golfers should not be overly 400
concerned with dimple error, as the effects are very small and it would be 401
very difficult to control for. Dimple error has the potential to reduce the 402
success rates of putts by taking a putt over the initial horizontal launch angle 403
‘threshold’ of a holed putt. Despite being identified as statistically not 404
significant in the current study, dimple error may add to the direction error 405
along with larger contributions of the putter face angle and putter path. 406
However, as this can be considered negligible at most, therefore golfers 407
training and practice focus should remain on factors known to affect the 408
variability of the horizontal launch angle, with particular emphasis on the 409
putter face angle. 410
411
Conclusion 412
Significant associations were identified between the horizontal launch angle 413
and the point of impact on the golf ball when using a mechanical putting arm 414
with standardised parameters. This, however, was not replicated with golfers 415
where no significant associations were identified. The differences may be 416
accountable to the variance across trials of the putter face angle and path 417
with the human participants. The practical implications of this study are that 418
golfers should not be concerned with dimple error during the putting activity 419
and should instead focus on other elements that contribute to a successful 420
golf putt, such as focusing on the putter face angle, which has previously 421
been found to significantly contribute to the direction of a golf putt. 422
423
424

18
References 425
Alessandrini, S. M. (1995). A motivational example for the numerical solution 426
of two-point boundary-value problems. SIAM review, 37(3), 423-427. 427
Alexander, D. L., & Kern, W. (2005). Drive for show and putt for dough? An 428
analysis of the earnings of PGA Tour golfers. Journal of Sports 429
Economics, 6(1), 46-60. 430
Aoki, K., Nakayama, Y., Hayasida, T., Yamaguti, N., & Sugiura, M. (1998). 431
Flow Characteristics of a Golf Ball Using Visualization Techniques. 432
In: Farrally, M. R., & Cochran, A. J., editors. Science & Golf III: 433
Proceedings of the World Scientific Congress of Golf. Human 434
Kinetics; pp. 446-456. 435
Atkinson, G., & Nevill, A. M. (1998). Statistical methods for assessing 436
measurement error (reliability) in variables relevant to sports 437
medicine. Sports Medicine, 26(4), 217-238. 438
Bowerman, B. L., & O’Connell, R. T. (1990). Linear Statistical Models: An 439
Applied Approach. Belmont California: Duxbury Press. 440
Brouillette, M. (2010). Putter features that influence the rolling motion of a 441
golf ball. Procedia Engineering, 2(2), 3223-3229. 442
Bulmer, M. G. (1979). Principles of Statistics. Courier Corporation. 443
Cross, R., & Nathan, A. M. (2007). Experimental study of the gear effect in 444
ball collisions. American Journal of Physics, 75, 658-664. 445
Cross, R. (2006). Physics of golf. Retrieved Jan 14 2015, from, 446
http://www.physics.usyd.edu.au/~cross/GOLF/GOLF.htm 447

19
Debicki, D. B., & Gribble, P. L. (2004). Inter-joint coupling strategy during 448
adaptation to novel viscous loads in human arm movement. Journal of 449
Neurophysiology, 92(2), 754-765. 450
Dorsel, T. N., & Rotunda, R. J. (2001). Low scores, top 10 finishes, and big 451
money: An analysis of professional golf association tour statistics and 452
how these relate to overall performance. Perceptual and Motor Skills, 453
92(2), 575-585. 454
Goff, J. E. (2013). A review of recent research into aerodynamics of sport 455
projectiles. Sports Engineering, 16(3), 137-154. 456
Hirashima, M., Kudo, K., & Ohtsuki, T. (2003). Utilization and compensation 457
of interaction torques during ball-throwing movements. Journal of 458
Neurophysiology, 89(4), 1784-1796. 459
Hopkins, W. G., Marshall, S. W., Batterham, A. M., & Hanin, J. (2009). 460
Progressive statistics for studies in sports medicine and exercise 461
science. Medicine and Science in Sports and Exercise, 41(1), 3-12. 462
Hurrion, P. D., & Hurrion, R. D. (2002). An investigation into the effect of the 463
roll of a golf ball using the C-groove putter. In: Thain, E., editor. 464
Science and Golf IV: Proceedings of the World Scientific Congress of 465
Golf. London: Routledge; pp. 531-538. 466
Hurrion, P. D., & MacKay, J. (2012). A Rolling Brief: Golf International, 111, 467
107 – 111. 468
Karlsen, J., Smith, G., & Nilsson, J. (2008). The stroke has only a minor 469
influence on direction consistency in golf putting among elite players. 470
Journal of Sports Sciences, 26(3), 243-250. 471

20
Lorensen, W. E., & Yamrom, B. (1992). Golf green visualization. IEEE 472
Computer Graphics and Applications, 12(4), 35-44. 473
Menard, S. (1995). Applied logistic regression analysis. Sage University 474
Paper Series on Quantitative Applications in the Social Sciences, 07-475
106. Thousand Oaks, California: Sage. 476
Myers, R. (1990). Classical and Modern Regression with Applications. 477
Boston: Duxbury Press. 478
Ntoumanis, N. (2001). A step-by-step guide to SPSS for sport and exercise 479
studies. London: Routledge. 480
Osis, S. T., & Stefanyshyn, D. J. (2012). Golf players exhibit changes to grip 481
speed parameters during club release in response to changes in club 482
stiffness. Human Movement Science, 31(1), 91-100. 483
Pedhazur, E. J. (1997). Multiple regression in behavioral research: 484
Explanation and prediction. Belmont, California: Wadsworth 485
Publishing Company. 486
Pelz, D. T. (2000). Dave Pelz’s Putting Bible. New York: Random House. 487
Penner, A. R. (2002). The physics of putting. Canadian Journal of Physics, 488
80(3), 83-96. 489
PGA Tour (2015a). 2014 PGA TOUR scoring average (actual). Retrieved 490
June 28 2015, from, http://www.pgatour.com/stats/stat.120.2014.html. 491
PGA Tour (2015b). 2014 PGA TOUR putts per round. Retrieved June 28 492
2015, from, http://www.pgatour.com/stats/stat.119.html 493
Richardson, A. K., Mitchell, A. C., & Hughes, G. (2015). Reliability of an 494
experimental method to analyse the impact point on a golf ball during 495
putting. Sports Biomechanics, (ahead-of-print), 1-10. 496

21
Tables 497
Table 1. Mean ± SD for the independent variables used in regression (HP) 498
refers to testing completed by human participants. 499
Length: Mean ±
SD
(mm)
Angle: Mean ±
SD
(°)
Surface Area:
Mean ± SD
(mm2)
GEL®-Titleist 2.82 ± 0.85 140.94 ± 12.38 18.88 ± 4.34
GEL®-Srixon 1.49 ± 0.59 122.60 ± 41.06 21.36 ± 4.04
Odyssey-Titleist 3.09 ± 0.74 145.37 ± 11.57 21.83 ± 4.63
Odyssey-Srixon 1.59 ± 0.70 131.77 ± 54.73 23.95 ± 4.72
GEL®-Srixon
(HP) 4.54 ± 2.45 152.87 ± 110.41 24.86 ± 4.78
Odyssey-Srixon
(HP) 4.46 ± 2.25 119.53 ± 82.04 26.71 ± 4.98
500
501
502
503
504
505
506
507
508
509

22
Table 2. Linear regression model, between predictors and the kinematic 510
variable horizontal launch angle, R2 (± standard error normalised as a 511
percentage of the mean (SE%)) and standardised coefficients. 512
GEL®-
Titleist
GEL®-
Srixon
Odyssey-
Titleist
Odyssey-
Srixon
Mean ± SD
(Right (+),
Left (-), °)
0.47 ± 0.43 0.31 ± 0.30 0.12 ± 0.44 0.34 ± 0.18
R2 ± SE% 0.34 ± 78.7 0.44 ± 74.2 0.13 ± 350.0 0.21 ± 47.1
F-ratio,
(p-value)
6.17
(<0.01)*
9.58
(<0.01)* 1.71 (0.18) 3.23 (0.03)*
Length (β),
(p-value)
-0.43
(0.02)*
-0.60
(<0.01)* -0.22 (0.29) -0.41 (0.04)*
Angle (β),
(p-value)
0.76
(<0.01)* -0.14 (0.30) 0.21 (0.45) 0.23 (0.22)
Surface Area (β),
(p-value) -0.07 (0.72)
0.42
(<0.01)* 0.21 (0.36) -0.23 (0.17)
*Denotes significance. 513
514
515
516
517
518
519

23
Table 3. Linear regression model, between predictors and the kinematic 520
variable horizontal launch angle, R2 and standardised coefficients with 521
human participants 522
GEL®-Srixon Odyssey-Srixon
Mean ± SD (Right (+), Left (-), °) -0.07 ± 1.57 -0.22 ± 1.50
R2 ± SE 0.02 (1.58) 0.01 ± 1.50
F-ratio, (p-value) 0.76 (0.52) 0.81 (0.49)
Length (β), (p-value) -0.04 (0.65) -0.09 (0.28)
Angle (β), (p-value) -0.12 (0.23) 0.03 (0.67)
Surface Area (β), (p-value) 0.02 (0.88) -0.04 (0.66)
523
524
525
526
527
528
529
530
531
532
533
534
535
536
537
538
539
540
541

24
Table 4. Linear regression model, between predictors and the kinematic 542
variable side spin, R2 and standardised coefficients are reported. 543
GEL®-Titleist GEL®-
Srixon
Odyssey-
Titleist
Odyssey-
Srixon
Mean ± SD
(Cut (+), Hook
(-), rpm)
-12.62 ±
18.35
1.64 ±
15.25
-13.36 ±
13.76 0.86 ± 14.32
R2 ± SE 0.20 ± 16.50 0.17 ±
14.47 0.16 ± 13.16 0.20 ± 13.31
F-ratio,
(p-value) 2.84 (0.052) 2.43 (0.08) 2.21 (0.10) 3.04 (0.04)*
Length (β),
(p-value) -0.31 (0.10)
-0.32
(0.07) -0.29 (0.16) -0.02 (0.93)
Angle (β),
(p-value) -0.26 (0.24)
-0.14
(0.39) -0.07 (0.79) -0.37 (0.052)
Surface Area
(β), (p-value) 0.10 (0.62) 0.27 (0.11) -0.13 (0.56) -0.16 (0.35)
*Denotes significance. 544
545
546
547
548
549
550
551
552

25
Table 5. Linear regression model, between predictors and the kinematic ball 553
roll variable side spin, R2 and standardised coefficients are reported with 554
human participants. 555
GEL®-Srixon Odyssey-Srixon
Mean ± SD (Cut (+), Hook (-), rpm) -10.90 ± 25.69 -8.00 ± 24.87
R2 ± SE 0.06 (20.74) 0.003 ± 25.04
F-ratio, (p-value) 2.87 (0.04)* 0.15 (0.93)
Length (β), (p-value) -0.10 (0.26) -0.05 (0.52)
Angle (β), (p-value) -0.04 (0.69) -0.002 (0.98)
Surface Area (β), (p-value) 0.21 (0.03)* 0.007 (0.94)
*Denotes significance. 556
557
558

26
Figure titles 559
Figure 1. Examples of the two types of contact possible during impact 560
between the putter face and golf ball. Image A) highlighted area shows the 561
square contact with a dimple and Image B) highlighted area shows the 562
contact where an edge of a dimple is struck. 563
564
Figure 2. Diagram demonstrating the 2D structure identifying the centroid, 565
the polygon used to identify the centre of impact and impact variables; A) 566
length of the impact point from the centroid, B) line representing 90° 567
(normalised to each image) the angle is represented by the degrees between 568
line A and B and the area surrounded by the solid white line was the surface 569
area of the impact zone. 570
571
Figure 3. X, Y scatterplot graphs demonstrating the variability in the impact 572
point, axes have been adjusted for clarity (a large black circle represents the 573
0, 0 coordinate). Graphs A – D were completed with the mechanical putting 574
arm and E – F were completed with human participants (HP). 575
Figure 1
Figure 2

Figure 3


