For comments, suggestions or further inquiries please contact:
Philippine Institute for Development StudiesSurian sa mga Pag-aaral Pangkaunlaran ng Pilipinas
The PIDS Discussion Paper Seriesconstitutes studies that are preliminary andsubject to further revisions. They are be-ing circulated in a limited number of cop-ies only for purposes of soliciting com-ments and suggestions for further refine-ments. The studies under the Series areunedited and unreviewed.
The views and opinions expressedare those of the author(s) and do not neces-sarily reflect those of the Institute.
Not for quotation without permissionfrom the author(s) and the Institute.
The Research Information Staff, Philippine Institute for Development Studies5th Floor, NEDA sa Makati Building, 106 Amorsolo Street, Legaspi Village, Makati City, PhilippinesTel Nos: (63-2) 8942584 and 8935705; Fax No: (63-2) 8939589; E-mail: [email protected]
Or visit our website at http://www.pids.gov.ph
December 2007
DISCUSSION PAPER SERIES NO. 2007-20
Danilo C. Israel
The Current State of Aquaculturein Laguna de Bay

The Current State of Aquaculture in Laguna de Bay
by
Danilo C. Israel
ABSTRACT
This paper presents some of the preliminary results and findings of an ongoing study,
jointly conducted by the Southeast Asian Fisheries Development Center (SEAFDEC AQD) and Philippine Institute for Development Studies (PIDS), which assesses the current state of aquaculture in Laguna de Bay.
The study uses primary and secondary data. The primary data were gathered through
interviews with key informants and a cross-section survey of fishpen and fishcage operators and their operations in Laguna de Bay conducted in 2007. The secondary data were gathered from the published statistical indices of institutional sources and other relevant literature.
The results of the study indicate that aquaculture in Laguna de Bay is a vibrant
industry that includes not only fishpen and fishcage operators but also various participants in its input and product markets. Furthermore, they show that aquaculture contributes significantly to fish production in the lake as well as to national aquaculture and fisheries production.
The results of the study also indicate that while aquaculture in Laguna de Bay has
been an important economic contributor locally and nationally, it has been facing numerous problems over time that constrain its development. Of these, environment-related problems, lack of access to cheap capital, obstruction of navigational lanes by fishpens, existence of illegal fishpens, poaching and overall limited support from the government were considered very serious by aquaculture operators. These problems, therefore, may be the ones needing the most attention.
Key Words
Laguna de Bay, Aquaculture, Fishpens, Aquaculture Problems Environment-Related Problems, Fishcages
The Current State of Aquaculture in Laguna de Bay
Danilo C. Israel*
I. Introduction
Laguna de Bay, also known as Laguna Lake, is the largest lake in the Philippines and among the largest in Southeast Asia. It is a significant natural resource, being the catchment of an expansive and environmentally important watershed. Furthermore, the broader Laguna de Bay Region surrounding it is inhabited by a fast growing population, many of whom are highly dependent on the natural resources of the lake for their livelihoods and daily needs.
Laguna de Bay has various economic uses to the surrounding population, one of
which is aquaculture. Since the discovery that some fish species can be grown in controlled environments in the lake, including those that are not native to its waters, rapid aquaculture development has occurred within the lake area.
A review of relevant literature on aquaculture in Laguna de Bay reveals a couple of
important research gaps. Firstly, aquaculture in the lake has not been economically assessed for a long time as the last study of this kind was done many years ago. Secondly, although some of the problems facing aquaculture in Laguna de Bay may be well known, the relative severity of these problems has not been considered in any past study. An updated economic analysis of aquaculture in Laguna de Bay and the relative severity of the problems it is facing would be useful in planning for its future development.
This paper presents some of the preliminary results and findings of an ongoing study
which economically assesses the current state of aquaculture in Laguna de Bay. The objectives of the paper are to a) review the relevant literature on aquaculture in Laguna de Bay; b) profile the lake and the major government and government-funded institutions involved in aquaculture there; d) review the aquaculture and fisheries sectors of the Philippines and the lake; e) provide a socioeconomic and demographic profile of fishpen and fishcage operators and the different aspects of their aquaculture operations in the lake; f) analyse the severity of the different aquaculture-related problems facing fishpen and fishcage operators; and g) generate some conclusions and recommendations based on the results and findings.
II. Methodology
The ongoing study on which this paper is based uses primary and secondary data. The primary data were gathered through interviews with key informants from the private and public sectors of aquaculture in Laguna de Bay and the conduct of a cross-section survey of fishpen and fishcage operators and their operations in the lake. The secondary data were gathered from the published statistical indices of institutional sources and other relevant literature. *Senior Research Fellow of PIDS and Affiliate Research Specialist of SEAFDEC AQD. Research assistance was provided by Melani C. Boni-Cortez and Maria Ellaine Patambang of SEAFDEC AQD and Leilani Bolong of PIDS.
2
The survey covered selected fishpen and fishcage operators and their operations in Laguna de Bay. Fishpen and fishcage operators were chosen as the focus of the study because they are the dominant practitioners of aquaculture in the lake. A fishpen was defined as an artificial and stationary water enclosure for the culture of fish and other aquatic animal species made up bamboo poles, wood, screen and other construction materials intentionally arranged to prevent the escape of fish. A fishcage was defined as an artificial and stationary or floating water enclosure smaller than a fishpen but made up of similar construction materials. A fishpen was further described as having a water surface area of more than one hectare while a fishcage has a water surface area of one hectare or less.
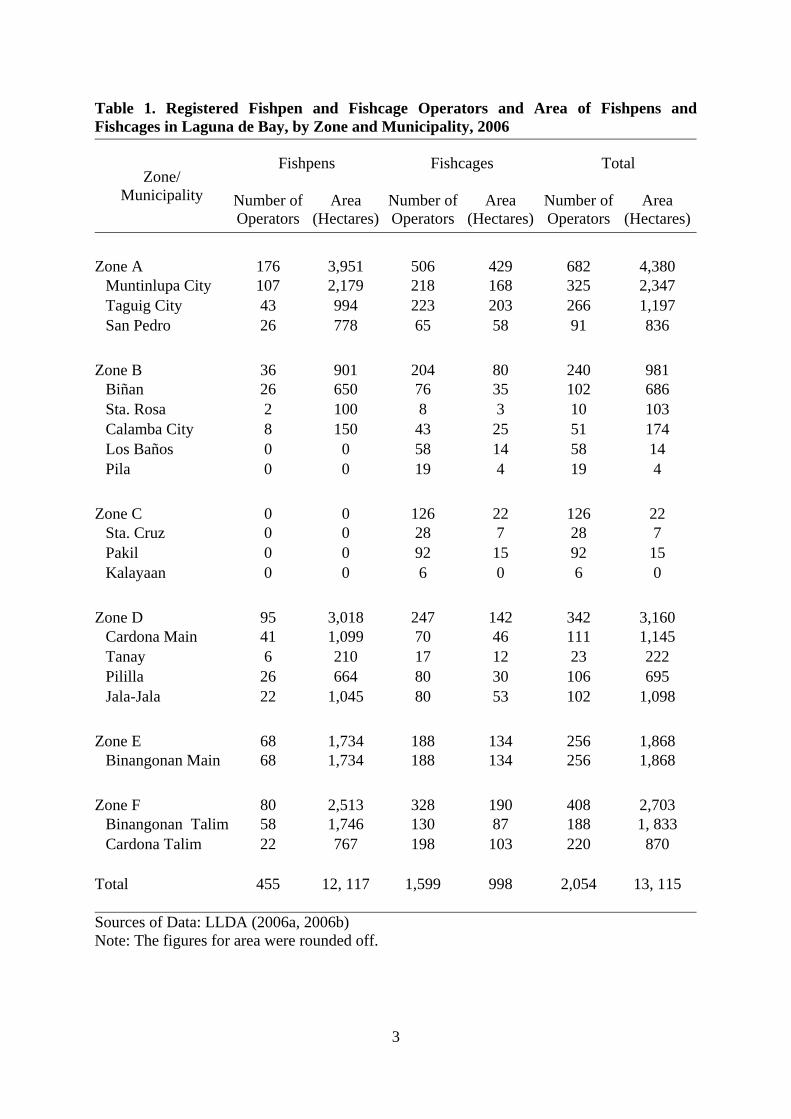
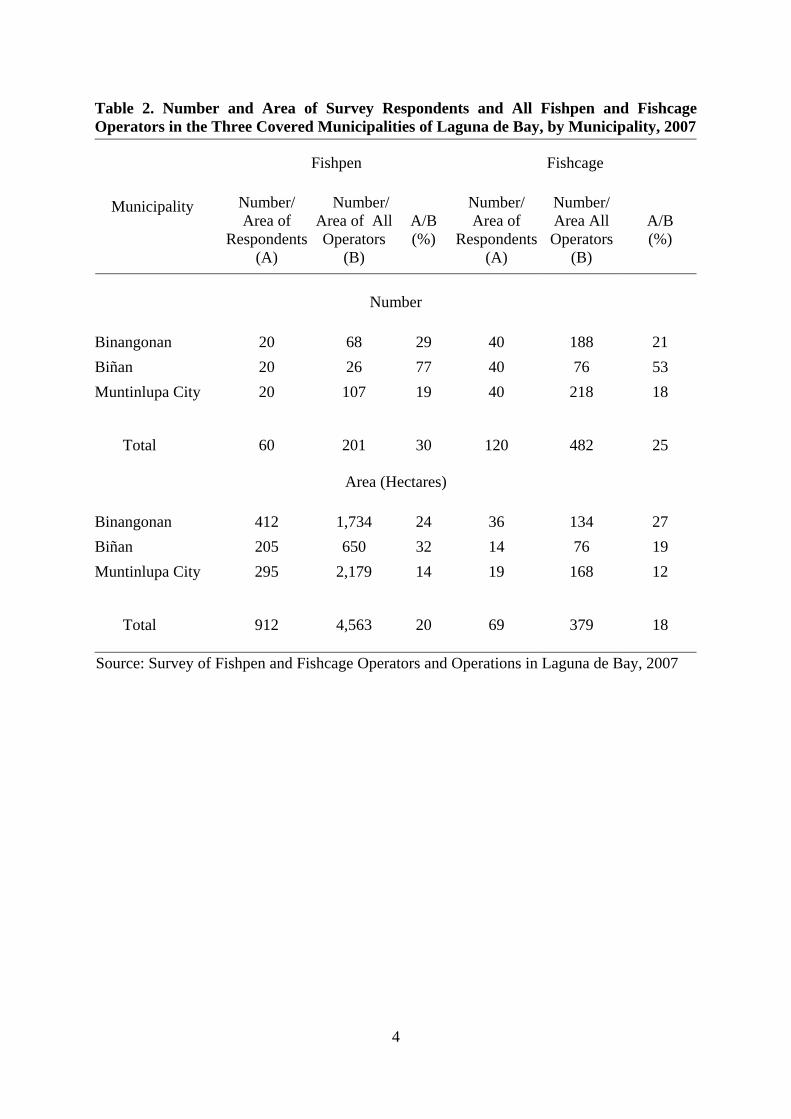
The survey covered three municipalities in Laguna de Bay which had fishpen and fishcage operations in 2006 and 2007. These municipalities were Binangonan in Rizal, Binan in Laguna, and Muntinlupa City in Metro Manila. The municipalities were selected so that each of the two provinces and Metro Manila were represented in the survey. Furthermore, they were chosen because they were among the municipalities in Laguna de Bay with the most fishpen and fishcage operations, specifically in terms of number of operators and area covered (Table 1). The three selected municipalities formed 18.75 percent of the total number of 16 municipalities which had fishpen and fishcage operations in the lake. Twenty fishpen operators and 40 fishcage operators each from Binangonan, Biñan and Muntinlupa City were selected for coverage in the survey. A total of 60 fishpen operators and 120 fishcage operators from the three municipalities, therefore, were covered. A list of registered fishpen and fishcage operators was generated from which the sampling frame of operators was established. The survey sample was then selected from the sampling frame based on random sampling. The sample of 60 fishpen operators comprised 30 percent of the total number of fishpen operators in the three covered municipalities (Table 2). The sample of 120 fishcage operators represented 25 percent of the total number of fishcage operators in the covered municipalities. The total area covered by the fishpen sample formed 20 percent of the total area of fishpen operations in the three municipalities. The total area covered by the fishcage sample represented 18 percent of the total area of fishcage operations in the three municipalities.
A questionnaire was prepared, pre-tested and used as the main instrument of the survey. It gathered background socioeconomic and demographic data and information on fishpen and fishcage respondents and their households and technical, production, economic, social, environmental, institutional and other related data and information on their fishpen and fishcage operations. The questionnaire was administered through personal interviews with respondent fishpen and fishcage operators. The interviews were conducted by members of the study team during the first quarter of 2007. The background socioeconomic and demographic data and information on respondents and their households were for 2007 while the data and information on their operations were for 2006.
The study was funded by SEAFDEC AQD and jointly conducted with PIDS. The
study leader is a senior research fellow of PIDS while the two members of the study team are technical assistants of SEAFDEC AQD.
3
Table 1. Registered Fishpen and Fishcage Operators and Area of Fishpens andFishcages in Laguna de Bay, by Zone and Municipality, 2006
Fishpens Fishcages Total Zone/
Municipality Number of Operators
Area (Hectares)
Number ofOperators
Area (Hectares)
Number of Operators
Area (Hectares)
Zone A 176 3,951 506 429 682 4,380
Muntinlupa City 107 2,179 218 168 325 2,347 Taguig City 43 994 223 203 266 1,197 San Pedro 26 778 65 58 91 836
Zone B 36 901 204 80 240 981 Biñan 26 650 76 35 102 686 Sta. Rosa 2 100 8 3 10 103 Calamba City 8 150 43 25 51 174 Los Baños 0 0 58 14 58 14 Pila 0 0 19 4 19 4
Zone C 0 0 126 22 126 22 Sta. Cruz 0 0 28 7 28 7 Pakil 0 0 92 15 92 15 Kalayaan 0 0 6 0 6 0
Zone D 95 3,018 247 142 342 3,160 Cardona Main 41 1,099 70 46 111 1,145 Tanay 6 210 17 12 23 222 Pililla 26 664 80 30 106 695 Jala-Jala 22 1,045 80 53 102 1,098
Zone E 68 1,734 188 134 256 1,868 Binangonan Main 68 1,734 188 134 256 1,868
Zone F 80 2,513 328 190 408 2,703 Binangonan Talim 58 1,746 130 87 188 1, 833 Cardona Talim 22 767 198 103 220 870
Total 455 12, 117 1,599 998 2,054 13, 115 Sources of Data: LLDA (2006a, 2006b) Note: The figures for area were rounded off.
4
Table 2. Number and Area of Survey Respondents and All Fishpen and Fishcage Operators in the Three Covered Municipalities of Laguna de Bay, by Municipality, 2007
Fishpen Fishcage
Municipality Number/ Area of
Respondents (A)
Number/ Area of AllOperators
(B)
A/B (%)
Number/ Area of
Respondents(A)
Number/ Area All Operators
(B)
A/B (%)
Number
Binangonan 20 68 29 40 188 21 Biñan 20 26 77 40 76 53 Muntinlupa City 20 107 19 40 218 18
Total 60 201 30 120 482 25
Area (Hectares)
Binangonan 412 1,734 24 36 134 27 Biñan 205 650 32 14 76 19 Muntinlupa City 295 2,179 14 19 168 12
Total 912 4,563 20 69 379 18
Source: Survey of Fishpen and Fishcage Operators and Operations in Laguna de Bay, 2007

5
III. Review of Related Literature Over the years, several studies have been conducted on aquaculture development in
Laguna de Bay. Some of these works specifically looked into the financial viability of fishpen and fishcage operations. Delmendo and Gedney (1976), citing the results of a pilot activity in Cardona, Rizal, reported that milkfish could be raised entirely using the natural food supply of the lake which suggested that aquaculture there was possible. In a survey of fishpen operators covering the years 1974 and 1975, Nicolas and Librero (1977) and Librero and Nicolas (1981) indicated that fishpen operations in the lake were highly profitable. In another study, Delmendo (1982) likewise reported that the raising of milkfish in fishpens in the lake generated substantial profits for its operators.
Delmendo (1987) cited some socioeconomic benefits from fishpen operations in
Laguna de Bay. Among these were the increased incomes of fry and fingerling producers due to the higher demand brought about by fishpen operations, increased business activities for the manufacturers of netting materials, ropes, twines, sinkers, bamboos, and other inputs in fishpen construction, higher demand for labor used in fishpen construction and operations, more employment of labor involved in the various marketing and transporting activities for fish produced in fishpens, and increased overall economic activity in the fishpen areas.
In a study on fishcage culture in Laguna de Bay, Garcia and Medina (1987) pointed
out that like fishpen culture, fishcage culture was a highly profitable operation. It explained that on a per hectare basis, fishcage culture may even be more productive and profitable compared to fishpen culture. The study suggested that for fishcage culture to be developed further, improvement in the technology has to be done particularly related to cage construction, operation and management.
In another study on fishcage culture done in two villages in Laguna de Bay, Gonzales
(1984) found that both the incomes and savings of families with fishcages had increased significantly. This result was supported by a succeeding study by Basiao (1989) which indicated that fishcage culture of tilapia in particular, even without supplemental feeding, can be conducted successfully in the lake. In still another study that surveyed two towns in the lake, however, Lazaga and Roa (1985) found low economic viability of tilapia fishcage culture which was attributed to the overcrowding of cages, poaching and typhoon damage.
Studies have been conducted investigating the various problems of aquaculture in
Laguna de Bay. Davies et al. (n.d.) cited that while fishpen development contributed to fish production in the lake, it also resulted to the proliferation of fishpens which disregarded and altered the lake ecology. The study further argued that fishpens caused socioeconomic problems among lakeshore inhabitants including the displacement of fishermen and difficulty in navigation due to the narrowing of waterways, clogging of water hyacinths and detours.
Nicolas and Librero (1977) and Librero and Nicolas (1981) also identified numerous
problems faced by fishpen operators in Laguna de Bay. These included the occurrence of typhoons, poaching, insufficient technical support from government, irregular supply of seed stock, exorbitant price of seed, and unavailability of credit for pen construction. Delmendo (1982) furthermore pointed out that fishpen culture in Laguna de Bay was hampered by several problems including the occurrence of fortuitous events like typhoons and floods, ecological and environmental problems like algal blooms, and social and economic problems like the displacement of local fishermen because of the expansion of fishpen culture.

6
De La Cruz (1981) likewise listed the problems faced by fishpen and fishcage operators in Laguna de Bay. These included typhoons and strong winds, periodic fish kill, pesticides contributing to fish mortality, clogging of water hyacinths, limited durability of fishpen and fishcage building materials, poaching, and existence of illegal fishpens. Mane (1982) highlighted the importance of poaching as a problem of aquaculture in the lake and suggested that constant night patrols must be done by the fishpen operators to address it. Mane (1987) also mentioned other problems related to aquaculture cited by earlier authors including harsh weather conditions, rapid changes in ecological conditions, poor technology, rising prices of inputs, scarcity of fish seeds, lack of financing, fish pilferage and overcrowding of fishpens.
Nepomuceno (2004) also cited some problems of aquaculture in Laguna de Bay. It
explained that while the area of fishpens and fishcages has already been set at 10,000 hectares and 5,000 hectares respectively, various stakeholders continue to debate on the optimum size, ideal location and the socioeconomic benefits of fishpens and fishcages. The study argued that there has been weak enforcement of fishery laws in the lake that compounded the existing problems. Still another important problem in Laguna de Bay was mentioned by Santos-Borja and Nepomuceno (2003) and Nepomuceno (2004, 2004a). These studies explained that aquaculture development in the lake not only raised both efficiency concerns on the use of lake resources but also equity concerns in terms of access to resources and distribution of benefits.
Further studies went beyond aquaculture and delved into the overall development of
the fisheries sector in Laguna de Bay. In a survey conducted in 1979 and 1980 on open fisheries in the lake, Mercene (1987) estimated the annual fish production at 25,672 metric tons for four major gills used in fishing, namely: gill net, fish corral, motorized push net and long line. The study also estimated that there were 5,128 fishermen in the lake using 4,487 boats and 47,602 units of a variety of fishing gears. In another study, Delmendo (1977) evaluated the fishery resources of the lake and indicated that the aggregate annual fish production in the bay averaged 82,882 tons annually.
Looking into the socio-cultural aspects of the fishing industry in Laguna de Bay,
Rivera (1987) stated that fishermen families in the lake had an average household size that was higher than the national average. It also argued that only a small minority of fishermen actually operated fishpens and fishcages but the majority of those who had none would like to operate their own fishpens and fishcages if given the chance to do so. It further mentioned that the fishermen thought that operating fishpens and fishcages was the only way for them to give their children a better future.
The Technology Resource Center (2004) suggested that a way of allowing fishermen
to practice fishpens and fishcages and partake in the benefits of aquaculture development was the creation of fishpen and fishcage estates. It proposed that these estates would be operated by a group of about five individual fishermen who would get credit assistance for their operations. It further recommended that the operation of the group may eventually be transformed into a fishermen’s cooperative which is an integrated system involved not only in purely fishpen or fishcage production but in hatchery and fish processing operations as well.

7
Outside of aquaculture and fisheries, studies have been conducted looking into the broader watershed management issues in Laguna de Bay. Lee (1997) pointed out that water pollution has been a major problem in the lake caused partly by effluents and discharges coming from many of the 1,500 industrial operations in the area. Bacallan (1997) explained that pollution loading in the lake was fairly divided between agricultural, domestic and industrial wastes each of which contributed between 30 to 40 percent of the total. Centeno (1987) identified the various sources of pollution including industrial effluents, sanitary wastes, effluents from agri-business, run-off from agriculture, and inflows from the Pasig river.
LLDA (2005) emphasized the problems of poor water quality, fish kills, and the
invasion of janitor fish in Laguna de Bay. It stated that industrial pollution was one of the major contributors of stress in the lake and helped reduce water quality. It further explained that mass fish kills occasionally occurred in the lake because of algal bloom, existence of fish parasites, river flushing, and increased salinity particularly during the El Nino episode. Likewise, it argued that there has been an increasing population of janitor fish in the lake, a factor that impacts on both aquaculture and open fisheries. Barril (1992) added that the deteriorating water quality in Laguna de Bay have resulted to declining fish productivity, occurrence of fish kills, water habitat destruction, loss of endemic water species, sedimentation and increased turbidity, and increased levels of asthogenic organisms and hazardous substances posing health risks.
In summary, the above review of relevant literature on Laguna de Bay shows that
many studies have already been done over the years looking into the development of aquaculture there. However, as earlier mentioned, the last study that economically surveyed and assessed the aquaculture sector in the lake was done many years ago (Nicolas and Librero 1977 and Librero and Nicolas 1981). Furthermore, the review indicated that although some studies have identified problems affecting aquaculture in the lake, the relative severity of these problems has not been analyzed.
IV. Profile of Laguna de Bay
Pre-historic Filipinos called Laguna de Bay “Lawa ng Bai” or Mother Lake (LLDA n.d.). With the coming of the Spaniards, the name became Laguna de Bay or Lake of Bay. There are a number of versions about how the lake originally started. Among the earlier suggestions were that the lake was formerly a volcanic crater or that it originated through a subsidence volcano. The most accepted theory, however, is that Laguna de Bay was once part of Manila Bay as remnants of almost identical species of marine shells were found in some parts of both water bodies.
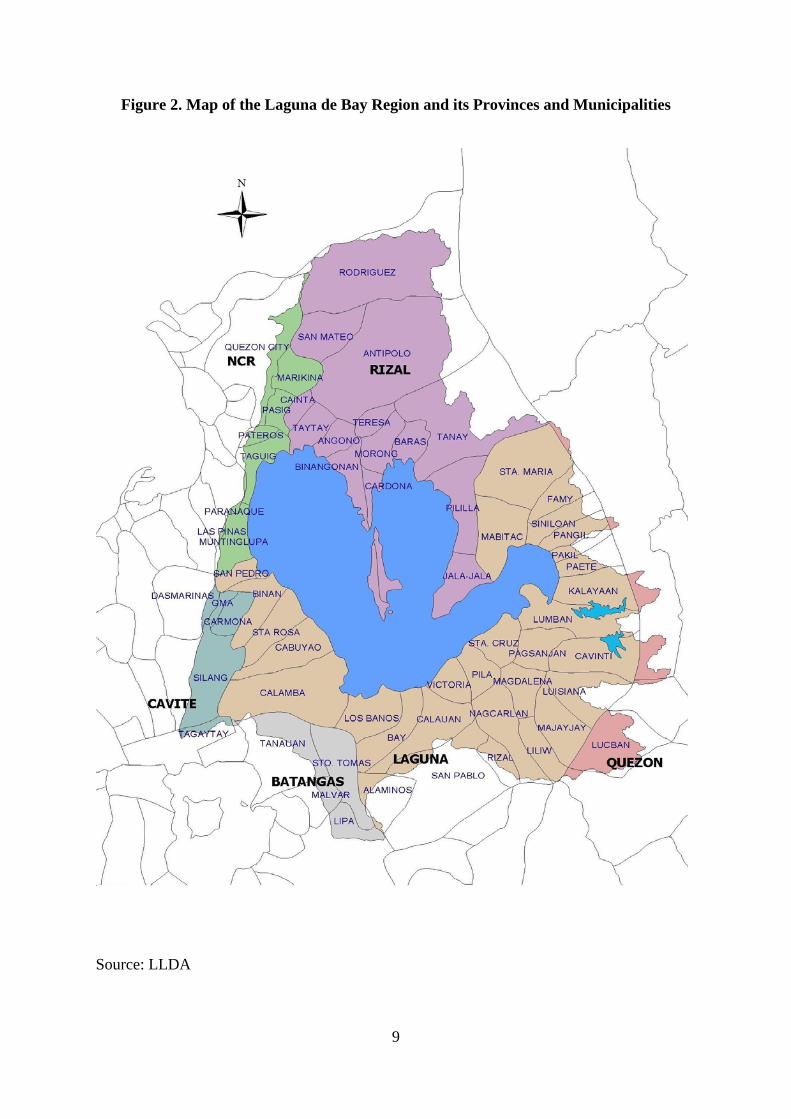
Laguna de Bay is located in the middle part of Luzon bordering the capital region of Metro Manila and the provinces of Rizal and Laguna. Its total watershed area, also known as the Laguna de Bay region, is 292,000 hectares with around 100 rivers and streams draining into the lake (Figure 1). The entire watershed spans 14 cities and 47 municipalities located in the provinces of Rizal, Laguna, Cavite, Batangas, Quezon, and Metro Manila and has a total population of 13.2 million as of 2005 (Figure 2). Laguna de Bay itself is comprised of four bays: east bay, central bay, west bay and south bay. These bays converge towards the south carving out what resembles a bird’s foot (LLDA 2004). The Laguna de Bay flows and discharges its water into Manila Bay through the Pasig River.

8
Figure 1. Map of the Laguna de Bay Watershed and its Sub-basins
Source: LLDA
9
Figure 2. Map of the Laguna de Bay Region and its Provinces and Municipalities
Source: LLDA

10
Laguna de Bay has a total water surface area of about 90,000 hectares, average depth of 2.5 meters, maximum depth of 20 meters located in Diablo Pass, average water volume of 2.25 billion cubic meters and length of coastline of 285 kilometers. The numerous biological resources found in the lake include fish, mollusks, crustaceans, and other animal and plant organisms. Furthermore, Laguna de bay has various economic uses to its surrounding population and municipalities including for business, transportation, electricity, industrial cooling, agriculture, recreation and as floodwater reservoir (LLDA 2006). V. Government and Government-Funded Aquaculture Institutions in Laguna de Bay
The major national government and government-funded institutions involved in the development of aquaculture in Laguna de Bay are the Laguna Lake Development Authority (LLDA), Bureau of Fisheries and Aquatic Resources (BFAR), SEAFDEC AQD and the Philippine Council for Aquatic and Marine Research and Development (PCAMRD). The LLDA was created in 1966 through Republic Act 4850. The Authority is a quasi-government agency which has the function of promoting and accelerating the development and balanced growth of the Laguna de Bay Region with due regard for environmental management (LLDA 2005). Structurally, LLDA is directed by a Board of Directors which sets the policies for the operational level and exercises the corporate powers vested in the Authority. To carry out its activities, LLDA is organized into divisions under the direct supervision of a General Manager. Among its functions, LLDA has the authority to issue permit for the use of the waters of Laguna de Bay for any activity including the construction and operation of fishpens, fishcages, fish enclosures, fish corrals and the like.
The LLDA formulated the Laguna de Bay Fishery Zoning and Management Plan (ZOMAP) in 1983 to rationalize the management and regulate the utilization of the fishery resources of the lake and resolve equity problems among large-scale fishpen operators and small-scale fishermen. The ZOMAP was later revised as a fundamental component of the Master Plan for the Laguna de Bay Region which was approved in 1996. The revised ZOMAP was further modified in 1999 and placed under the Lake Management Division (LMD) of LLDA for implementation.
The ZOMAP specifies a fishpen belt located in the west and central bays of Laguna
de Bay and a fishcage belt located in all areas of the bay, where fishpen and fishcage culture can be conducted (Figure 3). It also allocates areas for fish sanctuaries and open fishing. Furthermore, it identifies navigational lanes and barangay access lanes to facilitate the movement of people, goods, and services within the lake. The selection of the west bay for the concentration of fish culture in Laguna de Bay was due to important considerations (LLDA n.d.). Firstly, the west bay is believed to be the most productive in terms of primary productivity and existence of nutrients. Secondary, it is more protected from the elements like strong wind velocity and wave action. Lastly, the bottom sediments of the west bay are more desirable compared to the southwest portion which has rocky bottom sediments. The ZOMAP allocates a total of 10,000 hectares for fishpen culture and 5,000 hectares for fishcage culture. This fishpen area is shared per municipality on a pro-rated basis taking into consideration the area of individual municipal waters. Fishpen areas are allocated to individual operators through public bidding. Furthermore, fishpen operators are classified into corporations with maximum fishpen area coverage of 50 hectares, fishermen cooperatives with a maximum of 25 hectares, and individuals with a maximum of 5 hectares.

11
Figure 3. Zoning and Management Plan (ZOMAP) of Laguna de Bay, 1999
Source: LLDA

12
The BFAR is the government agency responsible for the development, improvement, management and conservation of the fisheries and aquatic resources of the country. It is a line agency under the Department of Agriculture (DA). Among the numerous functions of the bureau is the conduct of the training of local extension workers and small-scale fisherfolk, organizations and cooperatives. The BFAR has several divisions including the Inland Fisheries and Aquaculture Division (IFAD) which covers inland fisheries and aquaculture concerns, including those in Laguna de Bay. Furthermore, the bureau operates the National Freshwater Fisheries Technology Center (NFFTC) and the National Inland Fisheries Technology Center (NIFTC) which are in charge of conducting technology generation, field testing, training and extension, and demonstration in inland fisheries.
The BFAR has a regional office in Region IV-A which covers five provinces
including Cavite, Laguna, Batangas, Rizal and Quezon and the capital region of Metro Manila. Therefore, Laguna de Bay is under the regional supervision of BFAR Region IV-A. In addition to the regional office, BFAR Region IV-A has two fishery stations in Laguna: the Freshwater Fisheries Research Station (FFRS) in the municipality of Los Baños and the Freshwater Demonstration Fish Farm (FDFF) in the municipality of Bay. These stations are the conduits of the regional office of BFAR in the conduct of its research, demonstration and related activities in the Laguna de Bay Region.
The SEAFDEC AQD is a national government-funded international research and development (R&D) institution involved in aquaculture in Laguna de Bay. This institution is one of the departments under the umbrella of SEAFDEC which is a regional treaty organization established in 1967 to promote fisheries development in the Southeast Asian region. The SEAFDEC AQD is located in the Philippines and mandated to conduct research in aquaculture and disseminate the outputs of its research to its clientele including the private sector aquaculture practitioners. It operates the Binangonan Freshwater Station (BFS) in Tapao Point along the north shore of the Laguna de Bay in Binangonan, Rizal. This station conducts various research and training activities in hatchery and grow-out of various freshwater fish and other aquatic animal species, including those that are cultured in Laguna de Bay.
The PCAMRD is the sectoral council for fisheries of the Department of Science and
Technology (DOST) with main office located in Los Banos, Laguna. The functions of the agency are the formulation of strategies, policies, plans, programs and projects for science and technology development, programming and allocation of government and external funds for aquatic resource research and development, monitoring of aquatic resources research and development, and generation of external funds. Therefore, PCAMRD primarily does not conduct research but the planning, funding, and monitoring of research and development activities in the fisheries sector of the country, including those that deal on aquaculture in Laguna de Bay. VI. Aquaculture and Fisheries of the Philippines and Laguna de Bay
Aquaculture and Fisheries of the Philippines The fishery resources of the Philippines include marine and inland resources (BFAR
2006). The marine resources encompass the Exclusive Economic Zone (EEZ) of 2.2 million square kilometers of which 266,000 square kilometers are coastal and 1.9 million kilometers are oceanic, shelf area of 184,600 square kilometers, coral reef area of 27,000 square

13
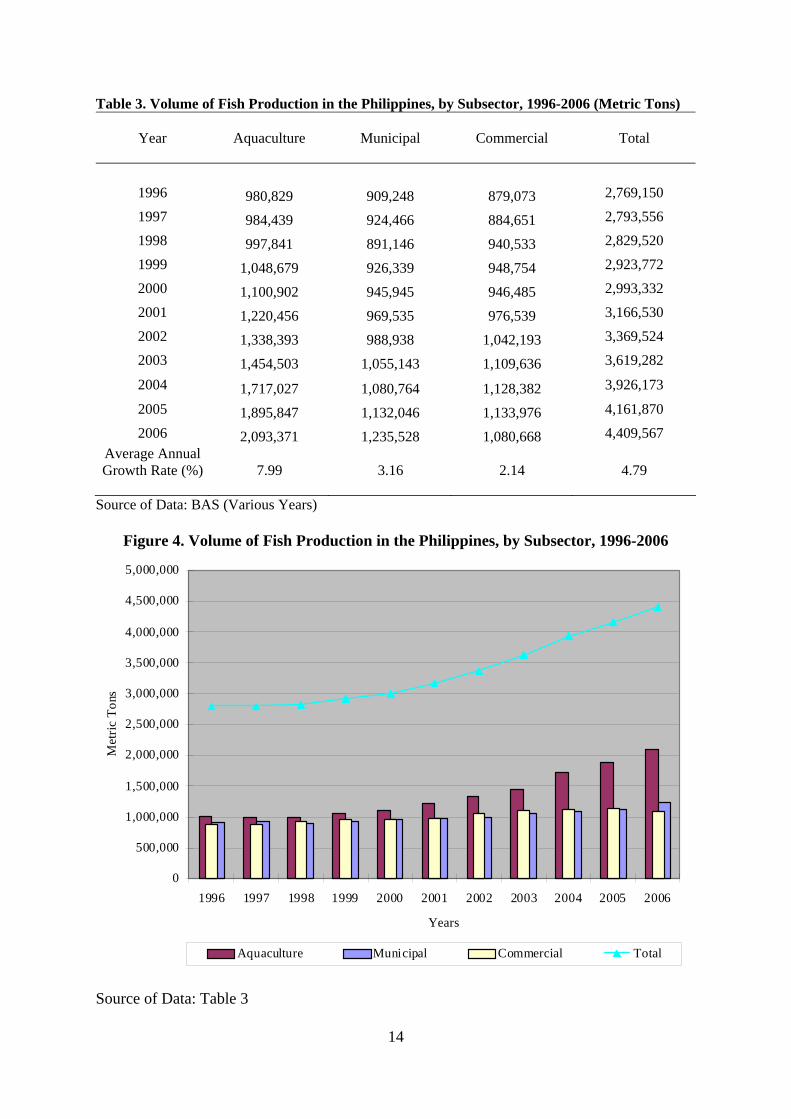
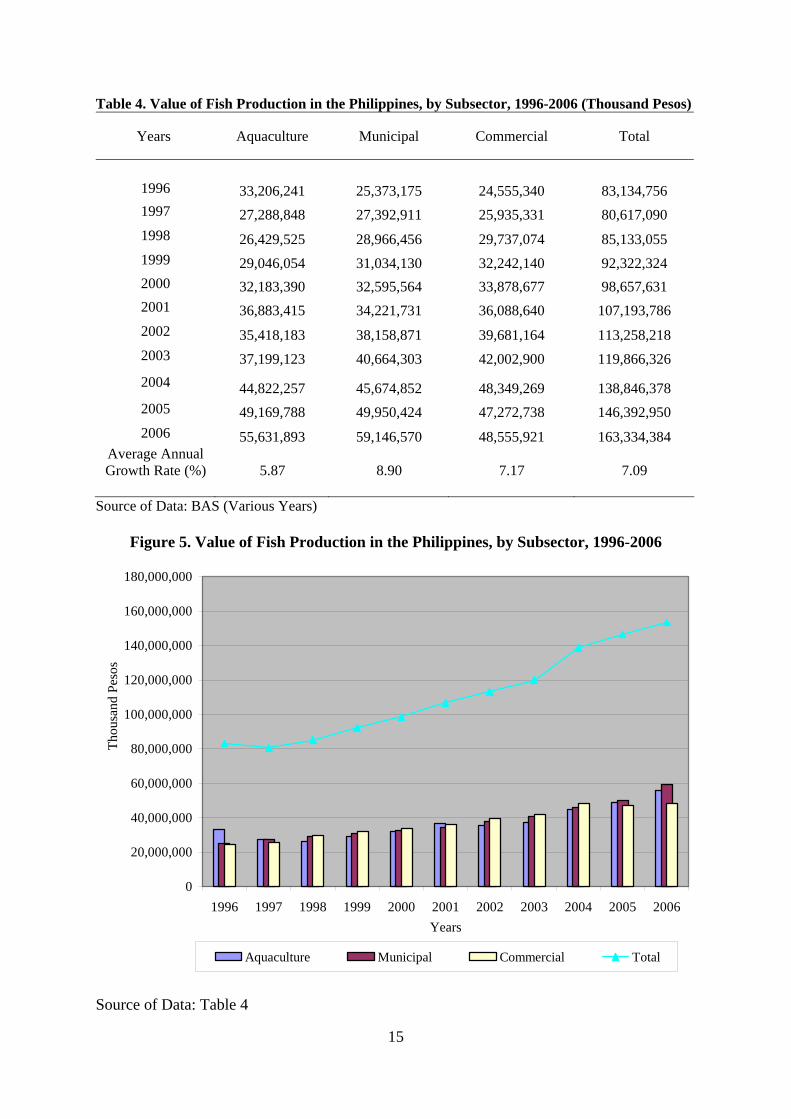
kilometers and coastline of 17,460 kilometers. The inland resources cover swamplands of 246,063 hectares, existing fishponds of 253,854 hectares, and other inland resources of 250,000 hectares including lakes, rivers and reservoirs. The Philippine fisheries sector is composed of aquaculture, commercial fisheries and municipal fisheries. From 1996 to 2006, in terms of volume, aquaculture production has been increasing while commercial fisheries production and municipal fisheries production have leveled off (Table 3 and Figure 4). Furthermore, aquaculture has the highest average annual growth rate in volume of production followed by municipal fisheries and commercial fisheries. In terms of value, aquaculture, commercial fisheries and municipal fisheries production levels have been increasing (Table 4 and Figure 5). Of the three subsectors, the municipal fisheries sector has the highest average annual growth rate in value of production followed by commercial fisheries and aquaculture.
In 2005, Fisheries contributed 15 percent in current prices and 22.4 percent in constant prices to gross value added (GVA) in agriculture, fisheries and forestry of the country (BFAR 2006). In the same year, fisheries shared 2 percent in current prices and 4 percent in constant prices of the gross domestic product (GDP). In 2002, fisheries directly employed 1.6 million people with the highest employment in municipal fisheries with 85 percent followed by aquaculture with 14 percent and commercial fisheries with one percent.
Aquaculture and Fisheries of Laguna de Bay Fishpen culture in Laguna de Bay was first attempted by the Philippine Fisheries
Commission in 1965 using various freshwater species. The project, however, did not make much headway and was later abandoned (Mane 1987). Then in 1970, LLDA demonstrated successfully the commercial culture of milkfish in fishpens in its pilot project in Cardona, Rizal. As a result, fishpen milkfish production grew by leaps and bounds in the following years and proliferated in many municipalities bordering the lake. From only 38 hectares in the 1970s, fishpens in Laguna de Bay increased to more than 30,000 hectares in 1983, greatly reducing the areas available for open fishing and navigation (Nepomuceno 2004, Santos-Borja and Nepomuceno 2003).
Fishcage culture was first attempted in the early 1970s in Laguna de Bay also inside the LLDA fishpen pilot project in Cardona, Rizal (Garcia and Medina (1987). In 1977, the cage culture of Nile tilapia started to develop as a commercial enterprise in the lake. The tilapia fishcage industry noticeably grew in 1981 particularly along the Binangonan and Cardona side of Talim Island in Rizal and greatly expanded elsewhere in the lake in the succeeding years.
Of the 445 fishpen operators in Laguna de Bay in 2006, 258 operators or 57 percent
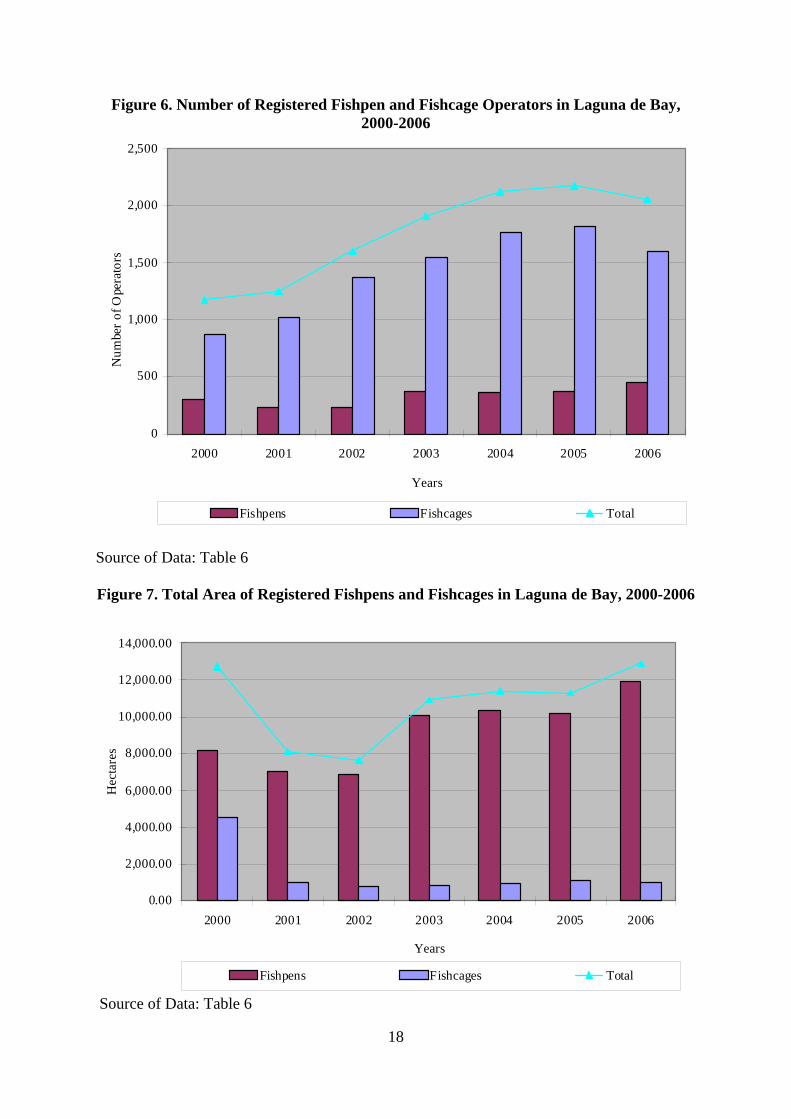
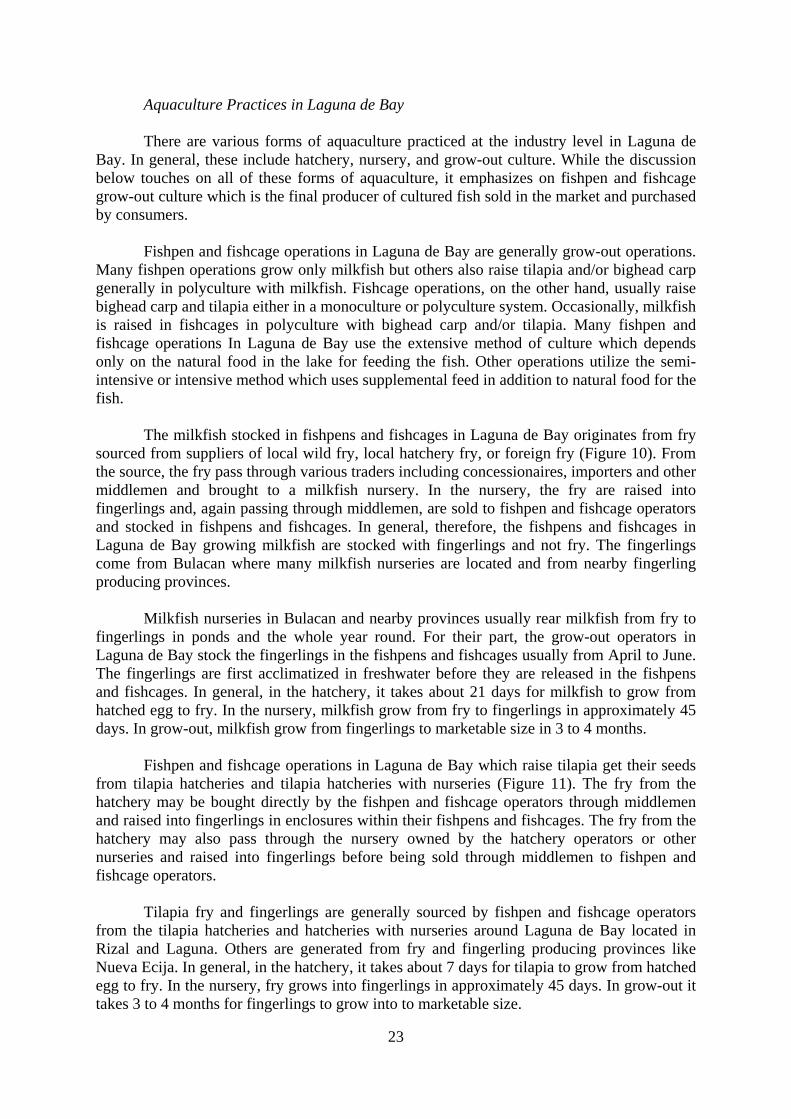
were corporations, 164 operators or 36 percent were sole proprietorships and 33 operators or 7 percent were cooperatives (Table 5). The corporations covered a total of 10,795 hectares or 89 percent of the total area used for fishpens in Laguna de Bay. On the other hand, the sole proprietorships covered 823 hectares or 7 percent while the cooperatives covered 499 hectares or 4 percent. From 2001 to 2006, the number of fishpen operators and area of fishpens had generally increased (Table 6 and Figures 6 and 7). On the other hand, the number of fishcage operators had increased but the area of fishcages had decreased. The average annual growth rate in the number of operators was higher for fishcages compared to that for fishpens.
14
Table 3. Volume of Fish Production in the Philippines, by Subsector, 1996-2006 (Metric Tons)
Year
Aquaculture Municipal Commercial Total
1996 980,829 909,248 879,073 2,769,150 1997 984,439 924,466 884,651 2,793,556 1998 997,841 891,146 940,533 2,829,520 1999 1,048,679 926,339 948,754 2,923,772 2000 1,100,902 945,945 946,485 2,993,332 2001 1,220,456 969,535 976,539 3,166,530 2002 1,338,393 988,938 1,042,193 3,369,524 2003 1,454,503 1,055,143 1,109,636 3,619,282
2004 1,717,027 1,080,764 1,128,382 3,926,173
2005 1,895,847 1,132,046 1,133,976 4,161,870 2006 2,093,371 1,235,528 1,080,668 4,409,567
Average Annual Growth Rate (%) 7.99 3.16 2.14
4.79
Source of Data: BAS (Various Years)
Figure 4. Volume of Fish Production in the Philippines, by Subsector, 1996-2006
0
500,000
1,000,000
1,500,000
2,000,000
2,500,000
3,000,000
3,500,000
4,000,000
4,500,000
5,000,000
1996 1997 1998 1999 2000 2001 2002 2003 2004 2005 2006
Years
Met
ric T
ons
Aquaculture Municipal Commercial Total
Source of Data: Table 3
15
Table 4. Value of Fish Production in the Philippines, by Subsector, 1996-2006 (Thousand Pesos)
Years Aquaculture Municipal Commercial Total
1996 33,206,241 25,373,175 24,555,340 83,134,756 1997 27,288,848 27,392,911 25,935,331 80,617,090 1998 26,429,525 28,966,456 29,737,074 85,133,055 1999 29,046,054 31,034,130 32,242,140 92,322,324 2000 32,183,390 32,595,564 33,878,677 98,657,631 2001 36,883,415 34,221,731 36,088,640 107,193,786 2002 35,418,183 38,158,871 39,681,164 113,258,218 2003 37,199,123 40,664,303 42,002,900 119,866,326 2004 44,822,257 45,674,852 48,349,269 138,846,378 2005 49,169,788 49,950,424 47,272,738 146,392,950 2006 55,631,893 59,146,570 48,555,921 163,334,384
Average Annual Growth Rate (%) 5.87 8.90 7.17 7.09
Source of Data: BAS (Various Years)
Figure 5. Value of Fish Production in the Philippines, by Subsector, 1996-2006
0
20,000,000
40,000,000
60,000,000
80,000,000
100,000,000
120,000,000
140,000,000
160,000,000
180,000,000
1996 1997 1998 1999 2000 2001 2002 2003 2004 2005 2006Years
Thou
sand
Pes
os
Aquaculture Municipal Commercial Total
Source of Data: Table 4

16
Table 5. Registered Fishpen Operators and Area of Fishpens in Laguna de Bay, by Zone and Type of Ownership 2006
Fishpen Operators and Fishpen Area Zone/
Type of Ownership Number of Operators
Percent to Total
Area (Hectares)
Percent to Total
Zone A 176 39 3,951 33
Corporation 83 19 3,321 28 Cooperative 10 2 215 2 Sole Proprietorship 83 19 416 3 Zone B 36 8 901 7
Corporation 22 5 821 7 Cooperative 1 0 13 0 Sole Proprietorship 13 3 66 1 Zone D 95 21 3,018 25
Corporation 64 14 2,844 24 Cooperative 1 0 26 0 Sole Proprietorship 30 7 149 1 Zone E 68 15 1,734 14
Corporation 39 9 1,554 13 Cooperative 7 2 69 1 Sole Proprietorship 22 5 111 1 Zone F 80 18 2,513 21
Corporation 50 11 2,256 19 Cooperative 14 3 177 1 Sole Proprietorship 16 4 81 1
Total 455 100 12, 117 100
Corporation 258 57 10,795 89 Cooperative 33 7 499 4 Sole Proprietorship 164 36 823 7
Source of Data: LLDA (2006a) Note: The figures for percent are rounded off.

17
Table 6. Number of Registered Fishpen and Fishcage Operators and Area of Fishpensand Fishcages in Laguna de Bay, 2000 – 2006
Fishpen
Fishcage Total
Year
Number of Operators
Area (Hectares)
Number of Operators
Area (Hectares)
Number of Operators
Area (Hectares)
2000 299 8,180 871 4,556 1,170 12,736 2001 230 7,051 1,018 1,050 1,248 8,101 2002 232 6,870 1,370 770 1,602 7,639 2003 363 10,064 1,546 854 1,909 10,918 2004 362 10,393 1,758 986 2,120 11,378 2005 365 10,174 1,808 1,111 2,173 11,286 2006 455 12, 117 1,599 998 2,054 13,115
Average Annual Growth Rate (%) 9.91 8.40 11.55 -12.46 10.38 3.41
Source of Data: LLDA
18
Figure 6. Number of Registered Fishpen and Fishcage Operators in Laguna de Bay, 2000-2006
0
500
1,000
1,500
2,000
2,500
2000 2001 2002 2003 2004 2005 2006
Years
Num
ber o
f Ope
rato
rs
Fishpens Fishcages Total
Source of Data: Table 6 Figure 7. Total Area of Registered Fishpens and Fishcages in Laguna de Bay, 2000-2006
0.00
2,000.00
4,000.00
6,000.00
8,000.00
10,000.00
12,000.00
14,000.00
2000 2001 2002 2003 2004 2005 2006
Years
Hec
tare
s
Fishpens Fishcages Total
Source of Data: Table 6

19
In general, the areas of Laguna de Bay which are not covered by aquaculture are intended for capture fisheries where they do not interfere with navigational and other economic uses. In 2005, there were 35,514 fishermen in Laguna de Bay, of which 71.08 percent were in Rizal, 21.40 percent were in Laguna and 7.52 percent were in Metro Manila (Table 7).
Traditionally, the main fish species commercially cultured in Laguna de Bay are
milkfish and tilapia. In recent years, bighead carp has been cultured also while catfish production was recorded in 2006 (Table 8 and Figure 8). For the period 1996 to 2006, the production of milkfish in fishpens and fishcages had fluctuated with the highest production occurring in 2004 and the lowest happening in 2001. Production noticeably decreased from 2005 to 2006. For the entire period, however, production had been on a generally upward trend.
Like milkfish, the production of tilapia had fluctuated during the 1996 to 2006 period
with production highest in 2005 and lowest in 1996. Production also decreased from 2005 and 2006. In general, however, production had been increasing during the entire period.
Although the production of carp had been fluctuating like the production of milkfish
and tilapia, it had grown significantly over the years. From just 1,795 metric tons in 1996, production leaped to 16,050 metric tons in 2006. Production was highest in 2001, the year the production of milkfish was lowest, and lowest in 1997.
Overall, the production in fishpens and fishcages in Laguna de Bay had more than
doubled during the 1996 to 2006 period. In 2006, milkfish contributed more to production but was closely followed by tilapia and carp. Total production of cultured fish was highest in 2005 and lowest in 1996. Production had been generally increasing over the 1996 to 2006 period except in 2001 and 2006 when production fell from previous year levels. Of the species, carp registered the highest average annual growth rate from 1996 to 2006 followed by milkfish and tilapia.
By province, fish production in fishpens and fishcages of Laguna de Bay was
dominated by Rizal followed by Laguna and Metro Manila (Table 9 and Figure 9). From 1996 to 2006, the production of Rizal had fluctuated but was generally increasing and more than doubled during the entire period. The output of Laguna had also fluctuated but was generally rising and more than tripled during the period. The production of Metro Manila had likewise fluctuated but was increasing overall and multiplied more than 10 times during the period. Of the three areas, Laguna registered the highest average annual growth rate in production in fishpens and fishcages followed by Rizal and Metro Manila from 1996 to 2006.
In 2006, the total volume of fish produced in fishpens and fishcages of Laguna de Bay
totaled 48,767 metric tons. There were no data available that estimated the corresponding monetary values of these levels of production. It should be noted, however, that the production figure in fishpens and fishcages of 48,767 metric tons in 2006 was significantly lower than the highest aquaculture production of 85,000 metric tons which occurred in 1985 (LLDA 2005).

20
Table 7. Number of Fishermen in Laguna de Bay, 2005
Fishermen Province/ Municipality Number Percent to Total
Rizal 25,245 71.08
Angono 275 0.77 Baras 652 1.84 Binangonan 6,875 19.36 Cainta - Cardona 10,000 28.16 Jalajala 2,270 6.39 Morong 793 2.23 Pililla 2,129 5.99 Tanay 1,720 4.84 Taytay 531 1.50
Laguna 7,600 21.40
Bay 460 1.30 Biñan 440 1.24 Cabuyao 560 1.58 Calamba City 590 1.66 Calauan - Kalayaan 340 0.96 Los Baños 460 1.30 Lumban 327 0.92 Mabitac 310 0.87 Paete 360 1.01 Pakil 540 1.52 Pangil 400 1.13 Pila 510 1.44 San Pedro 410 1.15 Sta. Cruz 613 1.73 Sta. Rosa 480 1.35 Siniloan 440 1.24 Victoria 360 1.01
Metro Manila 2,669 7.52
Muntinlupa City 680 1.91 Taguig City 1,989 5.60
Total 35,514 100
Source of Data: LLDA

21
Table 8. Production in Fishpens and Fishcages of Laguna de Bay, by Species, 1996-2006 (Metric Tons)
Year Milkfish Tilapia Carp Catfish All
1996 10,779 6,990 1,795 0 19,564
1997 14,151 7,661 1,570 0 23,382
1998 13,729 7,480 4,440 0 25,649
1999 15,973 7,979 10,136 0 34,088
2000 13,605 10,632 10,284 0 34,521
2001 2,835 8,121 19,271 0 30,227
2002 8,274 8,733 17,933 0 34,940
2003 16,015 12,019 8,629 0 36,663
2004 20,679 13,274 13,424 0 47,378
2005 18,971 15,915 16,926 0 51,812
2006 16,997 15,716 16,050 4 48,767 Average Annual Growth Rate (%) 24.65 9.78 40.51 - 10.42
Source of Data: BFAR Region IV-A (2007)
Figure 8. Volume of Aquaculture Milkfish, Tilapia, Carp and Catfish Production in Laguna de Bay, 1996-2006 (Metric Tons)
0
10,000
20,000
30,000
40,000
50,000
60,000
1996 1997 1998 1999 2000 2001 2002 2003 2004 2005 2006Years
Met
ric T
ons
Milkfish Tilapia Carp Catfish All
Source: Table 8

22
Table 9. Production in Fishpens and Fishcages of Laguna de Bay, by Province, 1996-2006 (Metric Tons)
Year Metro Manila Rizal Laguna All
1996 205 16,639 2,720 19,564
1997 339 20,008 3,035 23,382
1998 400 22,146 3,103 25,649
1999 754 30,176 3,158 34,088
2000 678 27,323 6,520 34,521
2001 753 23,459 6,015 30,227
2002 4,228 24,184 6,528 34,940 2003 2,955 26,095 7,613 36,663
2004 3,344 35,992 8,042 47,378
2005 3,118 39,041 9,653 51,812
2006 2,183 37,274 9,309 48,767 Average Annual Growth Rate (%) 5.81 9.65 16.16 10.42
Source of Data: BFAR Region IV-A (2007) Figure 9. Production in Fishpens and Fishcages of Laguna de Bay, by Province, 1996-2006 (Metric Tons)
0
10000
20000
30000
40000
50000
60000
1996 1997 1998 1999 2000 2001 2002 2003 2004 2005 2006
Years
Met
ric T
ons
Metro Manila Rizal Laguna All
SoSource of Data: Table 9
23
Aquaculture Practices in Laguna de Bay There are various forms of aquaculture practiced at the industry level in Laguna de Bay. In general, these include hatchery, nursery, and grow-out culture. While the discussion below touches on all of these forms of aquaculture, it emphasizes on fishpen and fishcage grow-out culture which is the final producer of cultured fish sold in the market and purchased by consumers.
Fishpen and fishcage operations in Laguna de Bay are generally grow-out operations.
Many fishpen operations grow only milkfish but others also raise tilapia and/or bighead carp generally in polyculture with milkfish. Fishcage operations, on the other hand, usually raise bighead carp and tilapia either in a monoculture or polyculture system. Occasionally, milkfish is raised in fishcages in polyculture with bighead carp and/or tilapia. Many fishpen and fishcage operations In Laguna de Bay use the extensive method of culture which depends only on the natural food in the lake for feeding the fish. Other operations utilize the semi-intensive or intensive method which uses supplemental feed in addition to natural food for the fish.
The milkfish stocked in fishpens and fishcages in Laguna de Bay originates from fry
sourced from suppliers of local wild fry, local hatchery fry, or foreign fry (Figure 10). From the source, the fry pass through various traders including concessionaires, importers and other middlemen and brought to a milkfish nursery. In the nursery, the fry are raised into fingerlings and, again passing through middlemen, are sold to fishpen and fishcage operators and stocked in fishpens and fishcages. In general, therefore, the fishpens and fishcages in Laguna de Bay growing milkfish are stocked with fingerlings and not fry. The fingerlings come from Bulacan where many milkfish nurseries are located and from nearby fingerling producing provinces.
Milkfish nurseries in Bulacan and nearby provinces usually rear milkfish from fry to
fingerlings in ponds and the whole year round. For their part, the grow-out operators in Laguna de Bay stock the fingerlings in the fishpens and fishcages usually from April to June. The fingerlings are first acclimatized in freshwater before they are released in the fishpens and fishcages. In general, in the hatchery, it takes about 21 days for milkfish to grow from hatched egg to fry. In the nursery, milkfish grow from fry to fingerlings in approximately 45 days. In grow-out, milkfish grow from fingerlings to marketable size in 3 to 4 months.
Fishpen and fishcage operations in Laguna de Bay which raise tilapia get their seeds
from tilapia hatcheries and tilapia hatcheries with nurseries (Figure 11). The fry from the hatchery may be bought directly by the fishpen and fishcage operators through middlemen and raised into fingerlings in enclosures within their fishpens and fishcages. The fry from the hatchery may also pass through the nursery owned by the hatchery operators or other nurseries and raised into fingerlings before being sold through middlemen to fishpen and fishcage operators.
Tilapia fry and fingerlings are generally sourced by fishpen and fishcage operators
from the tilapia hatcheries and hatcheries with nurseries around Laguna de Bay located in Rizal and Laguna. Others are generated from fry and fingerling producing provinces like Nueva Ecija. In general, in the hatchery, it takes about 7 days for tilapia to grow from hatched egg to fry. In the nursery, fry grows into fingerlings in approximately 45 days. In grow-out it takes 3 to 4 months for fingerlings to grow into to marketable size.

24
Figure 10. Marketing Channels for Milkfish Fry and Fingerlings in Laguna de Bay, 2007
Source of Data: Interviews with Key Informants, 2007
Local Fry Gatherers
Foreign Producers
Local Hatcheries
Wild Fry
Concessionaires
Middlemen
Importers
Nurseries
Middlemen
Fishpen/Fishcage Operators
Hatchery Fry Foreign Fry
Fingerlings
Fishpens/Fishcages

25
Figure 11. Marketing Channels for Tilapia Fry and Fingerlings in Laguna de Bay, 2007
Source of Data: Interviews with Key Informants, 2007
Hatcheries
Fry
Other Nurseries
Fingerlings
Middlemen
Middlemen
Hatcheries With Nurseries
Fry
Own Nurseries
Fingerlings
Middlemen
Other Nurseries
Fishpen/ Fishcage Operators
Fishpens
Fishcages
Fishpen/ Fishcage Operators
Fishpens
Fishcages

26
In 2007, there are 269 land-based tilapia hatcheries around Laguna de Bay covering a total area of about 179 hectares (Table 10). Most of these hatcheries, about 91 percent, are located in Laguna, while a few, about 9 percent, are in Rizal. There are no tilapia hatcheries in Metro Manila. There are no available data on the number of tilapia hatcheries, hatcheries with nurseries, lake-based hatcheries and land based-hatcheries in Laguna de Bay.
Bighead carp stocked in fishpens and fishcages of Laguna de Bay are sourced from
the few carp hatcheries around Laguna de Bay. At present, the municipality of Binangonan in Rizal where 9 bighead carp hatcheries operate is the main bighead carp fry and fingerling producer. The marketing chain for bighead carp fry and fingerling is similar to that for tilapia. In general, it takes about 3 days for bighead carp to grow from hatched egg to fry in the hatchery, 30 days for the fry to grow to fingerlings in the nursery and 4 to 6 months for the fingerlings to grow to marketable size in grow-out.
Supplemental fish feeds are used by fishpen and fishcage operators to augment the food supply for fish when natural food is not enough. Supplemental feeds include trash fish which are sourced from the municipal fishermen in the lake and trash food such as stale bread which are sourced from bakeries, groceries and other sources. Other types of supplemental feeds are rice bran and similar feeds as well as formulated feeds which are sourced from the dealers of agricultural input products in municipalities around the lake.
Formulated feeds cost money so many fishpen and fishcage operators in Laguna de
Bay do not use them in fish culture. Instead, they just depend on natural foods until the fish grow naturally into marketable size. Those who use formulated feeds to supplement the fish food supply in rhe fishpens and fishcages use different brands. The common brands are B-Meg, Vitarich, Tateh Aqua Feeds, Fish Feeds, Purina Feeds, Star Feeds 555, Tyson Feeds and others.
Formulated feeds contain nutrients and minerals needed for fish to grow. The actual
formulation of each type of feed is a trade secret of their manufacturers. In general, animal and plant materials are the most common feed ingredients while waste and by-products of the food industry are also utilized as ingredients. Some feed ingredients are indigenous and locally available in commercial quantities while others are only seasonally available. Other ingredients like fish meal and soybean meal are imported and hence are relatively expensive.
Fuel in the form of gasoline is used in fishpen and fishcage operations in Laguna de
Bay to operate the motorized boats used in hauling people, inputs, fish and other materials to and from the fishpens and fishcages. It is also used to operate the boats during stocking and harvest and in guarding the fishpen and fishcage surroundings. Gasoline is generally available from the numerous gas stations and dealers in municipalities around the lake.
Labor used in fishpen and fishcage operations includes regular workers like caretakers
and security guards and hired labor employed during fish stocking and harvesting and in fishpen and fishcage construction. The caretakers and security guards are generally permanent employees who earn fixed salaries and sometimes allowances and other benefits. These people are usually trained and highly knowledgeable in their respective areas of work. On the other hand, the hired laborers provide either skilled or unskilled labor and hired for a limited period of time only. The caretakers, security guards and hired laborers employed in fishpen and fishcage operations come from the municipalities around Laguna de Bay and more distant areas.

27
Table 10. Number and Area of Tilapia Hatcheries in Laguna de Bay, 2007
Province/Municipality
Number
Area
((Hectares)
Laguna Bay 124 54.00 Cabuyao 4 1.40 Calauan 114 100.00 Sta. Cruz 3 1.35 Sub-Total 245 156.75 Rizal Jalajala 1 8.00 Pililla 22 10.40 Tanay 1 0.24 Sub-Total 24 18.64 Total 269 175.39
Sources of Data: BFAR Region IV-A and Municipal Agriculture Offices (MAOs) of Pertinent Municipalities of Laguna and Rizal
28
Aside from seeds, feeds, gasoline, and labor used in fishpen and fishcage operations in Laguna de Bay, few other inputs are used. Ice and salt are often used during harvest to preserve the freshness of the fish. Fertilizers are generally not used as the lake bottom is too deep for sunlight to penetrate and thus for fertilizer to be effective. Other material inputs like perticides and other chemicals are also not used because the free flow of water in and out of fishpens and fishcages makes them ineffective and even dangerous to both fish and the environment.
In the construction of fishpens and fishcages, caretaker’s huts, guard posts and other
structures used for fishpen and fishcage operations in Laguna de Bay, several materials are used. These include lumber, bamboo poles, anahaw poles, nets, ropes and other miscellaneous materials like nails and the like. The lumber used in the construction of fishpens, fishcages, caretaker’s huts, and related structures are sourced from lumber yards and other lumber suppliers in municipalities around the lake. These establishments get the timber from which they produce the lumber from the logging companies operating in neighboring and distant provinces.
The bamboo poles used for fishpen and fishcage construction in Laguna de Bay are usually sourced from the municipalities around Laguna de Bay where bamboos are plenty, such as Binangonan and Cardona in Rizal, and other municipalities in nearby provinces particularly Batangas and Quezon. The fishpen and fishcage operators order directly from the seller or indirectly through middlemen who would deliver the bamboos at an agreed place and price. Poles from palm tree, popularly called Anahaw, are also used particularly in fish pen construction to enclose a large area durably and protect it from strong typhoon and big waves. These poles are ordered from contract dealers in Quezon and the Bicol Region where Anahaws are in abundance. The dealers transport these poles by a trailer truck to agreed points in Laguna de Bay.
The brand new nets used in fishpen and fishcage construction in Laguna de Bay are
sourced by operators either directly from the net manufacturers or through the net distributors. Second hand nets are also used by them and availed from fellow fishpen and fishcage operators or from sellers of second hand nets who buy damaged nets and then fix them for resale. Other construction materials like nails and the like are bought by operators from the various hardware stores operating in the municipalities around the lake.
Fish Marketing in Laguna de Bay Fishpen and fishcage operations in Laguna de Bay differ to some degree in the
marketing of their product. Most fishpen operators in Laguna de Bay sell their fish through the consignacions located in fish landings and markets in some municipalities around the lake. Consignacions are fish brokers who assist for a fee the fishpen operators and other fish producers in selling their fish to wholesalers, retailers and other buyers.
In 2007, there are 13 fish landing areas located in 9 municipalities in Laguna de Bay
(Table 11). Operating in some of these fish landing areas are 19 consignacions. The most number of consignacions are located in Cardona with 8 consignacions and Taguig City with 4 consignacions. The fish landings in Binan, Los Banos, Pila and Santa Cruz have no operating consignacions.

29
Table 11. Number of Fish Landings and Consignacions in Laguna de Bay, 2007
Area/Municipality
Number of Fish Landings Number of Consignacions
Zone A
Muntinlupa City 2 3
Taguig City 4 4
Zone B
Binan 1 0 Calamba 1 1
Los Banos 1 0 Pila 1 0
Zone C
Sta. Cruz 1 0
Zone D
Cardona 1 8
Zone E
Binangonan 1 3
TOTAL 13 19
Source of Data: Interviews with Key Informants, 2007

30
There are two systems used by consignacions in the Philippines in brokering fish: the Tabang system and the Bulong system. In the Tabang system, the fish producer first informs the consignacion that the fish harvest will occur at a given date. The fish producer then provides the consignacion the size and quantity of the fish to be harvested and other relevant information related to the harvest. After that, the consignacion tells the wholesalers and other potential buyers to come to the designated fish port or fish landing area where the harvested fish comes in. Once the fish arrives, the consignacion and the producer grade the product. Another person who represents the owner of the fish port or fish landing is also usually present. After grading, the fish is then sold at an agreed price to the wholesalers and other fish buyers.
In the Bulong system, bidding of fish is done by the consignacion among the wholesalers and other potential buyers. In this system, the highest bidder wins the bid and gets to buy the fish. The consignacion seeks the highest possible price for the fish, unlike in the Tabang system where the price is agreed without bidding. Furthermore, in the Bulong system, the wholesalers and other buyers of the fish have to be physically present at the right time in the fish port or landing in order to make a bid.
In both Tabang and Bulong systems, payment for the sold fish is usually on cash
basis. There are times, however, when checks and credits are allowed especially when the participants have been doing business with each other for a long time. The commission that the consignacion receives for brokering the sale varies but generally ranges from 5 to 10 percent of the sale price. The fish port or fish landing owner receives a payment for the use of the port which is usually computed based per kilo of fish sold.
In the fish landing areas around Laguna de Bay, the Tabang system is used by the consignacions in brokering harvested fish from the fish producers to the wholesalers and other fish buyers. On the other hand, the Bulong system is used in the consignacions located in the larger fish markets such as the Navotas and Malabon fish markets which are the two biggest in the country.
Most of the fish passing through the consignacions in Laguna de Bay are bought by wholesalers and retailers while a small portion is brought to consignacions in Navotas and markets in other areas (Figure 12). The fish brought to the consignacions in Navotas and markets in other areas are sold to wholesalers, retailers and final consumers in these markets. The wholesalers who bought the fish from the consignacions in Laguna de Bay resell them to retailers and final consumers mainly around Laguna de Bay. The retailers who purchase the fish from the consignacions in Laguna de Bay also resell it to final consumers around the lake.
The small portion of the total fish harvested by fish producers in Laguna de Bay
which does not pass through consignacions are directly sold by them to wholesalers who in turn resell it to food processors and retailers. The food processors sell their processed fish products to retailers such as supermarkets, fast food chains and restaurants. In turn, these establishments, as well as those retailers who bought milkfish directly from the wholesalers, sell their products to the final consumer.

31
Figure 12. Flow Chart for Fish Marketing by Fishpen Operators in Laguna de Bay, 2007
Source of Data: Interviews with Key Informants, 2007
Fishpen Operators
Consignations in Laguna de Bay
Wholesalers
Consignations in Other Areas
Wholesalers Retailers Food Processors Retailers
Wholesalers Retailers Final Consumers
Retailers Final Consumers
Final Consumers
Final Consumers
Retailers Fast Food Chains/ Restaurants
Final Consumers Final Consumers
32
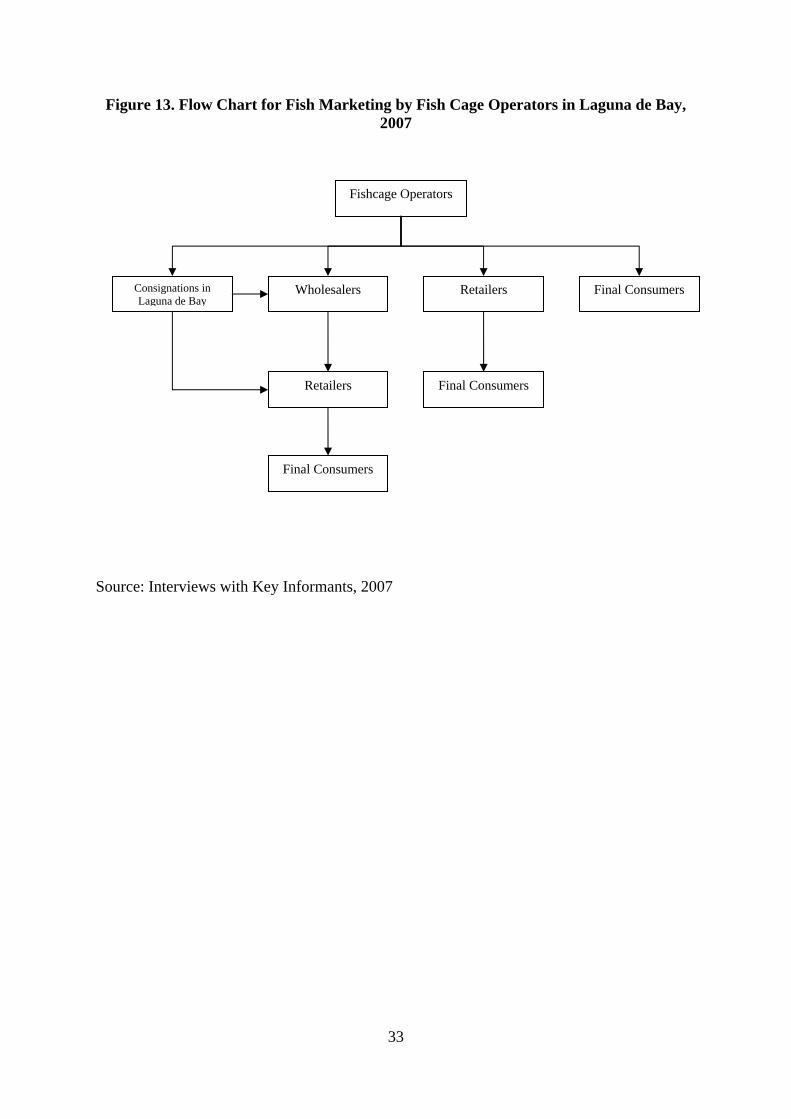
The marketing of fish by fishcage operators in Laguna de Bay differ from that of their fishpen counterparts in that most of them bypass the consignacions. Because of their much smaller volume of harvest, fishcage operators usually sell directly to wholesalers, retailers, and final consumers while only a few sell through consignacions (Figure 13). Fishcage operators who pass through consignacions usually do so when their volume of harvest is one ton or more. When harvest is below one ton, the operator sells directly to the wholesalers, retailers and final consumers.
Prices of Fish in Laguna de Bay There are some data available on the wholesale prices of milkfish and tilapia in Metro
Manila from 1996 to 2006 which, to some extent, reflect the prices received by fishpen and fishcage operators for mikfish and tilapia cultured in Laguna de Bay (Table 12 and Figure 14). There are also data available on the retail prices of milkfish and tilapia which could partially reflect the prices paid by consumers for fish cultured in the lake. The wholesale and retail prices of milkfish in Metro Manila had fluctuated during the 1996 to 2006 period. Wholesale price was highest in 2006 and lowest in 2003 while retail price was highest in 2000 and lowest in 2003. As in the case of milkfish, the wholesale and retail prices of tilapia in Metro Manila had fluctuated also during the 1996 to 2006 period. Wholesale price was highest in 1999 and lowest in 2001 while retail price was highest in 1999 and lowest in 2002.
The average annual growth rates of the wholesale and retail prices of milkfish and
tilapia for the period 1996 to 2006 were computed and found relatively low when compared to the wholesale price index and retail price index for food items in Metro Manila and Luzon (NSCB 2006). This suggests that the prices of milkfish and tilapia, including those produced in Laguna de Bay, received by producers and paid by consumers in Metro Manila had risen slower than those received by producers and paid by consumers for all food items on average.
Production Contribution of Aquaculture in Laguna de Bay There are no available data on total fisheries output, including capture fisheries and
aquaculture, in Laguna de Bay in recent years. These figures would have been useful for measuring the relative contributions of capture fisheries and aquaculture to total fish production in the lake. However, LLDA (2005) reported that the catch from open or capture fishing in the lake has been falling over the years and was 38,000 metric tons in 1996. Hence, even just assuming that this production figure remains the same in 2006, the total fisheries output in the lake was then 86,767 metric tons in than year with production of 48,767 metric tons coming from aquaculture. Aquaculture therefore, contributed 56 percent to total fisheries output of Laguna de Bay, which was more than half the contribution of capture fisheries.
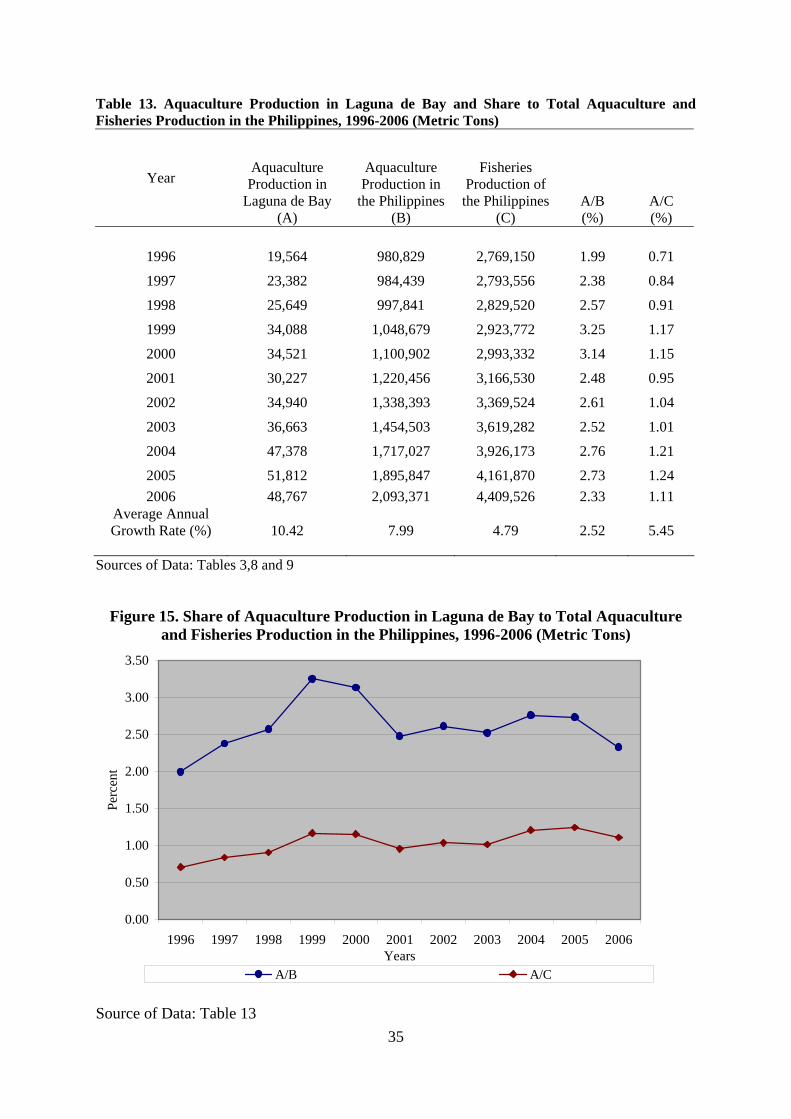
The contribution of aquaculture in Laguna de Bay to national aquaculture and
fisheries production can be estimated based on data presented earlier (Tables 13 and Figure 15). The aquaculture production of Laguna de bay of 48,767 metric tons in 2006 contributed 2.33 percent to the total aquaculture production of the Philippines of 2,093,371 metric tons in the same year. In the same year, aquaculture production in the lake contributed 1.11 percent to the total fisheries production of the country of 4,409,526 metric tons. Over the 1996 to 2006 period, the share of aquaculture in the lake to national aquaculture production had fluctuated and was highest in 1999 and lowest in 1996. Over the same period, the contribution of aquaculture in the lake to national fisheries production also fluctuated and was highest in 2005 and lowest in 1996.
33
Figure 13. Flow Chart for Fish Marketing by Fish Cage Operators in Laguna de Bay, 2007
Source: Interviews with Key Informants, 2007
Fishcage Operators
Consignations in Laguna de Bay
Wholesalers Retailers Final Consumers
Retailers
Final Consumers
Final Consumers

34
Table 12. Wholesale and Retail Prices of Milkfish and Tilapia in Metro Manila, 1996-2006 (peso per kilogram).
Wholesale Retail Year
Milkfish Tilapia Milkfish Tilapia
1996 62.33 53.38 77.70 63.84
1997 59.05 51.64 76.60 65.03
1998 55.21 53.99 70.65 66.54
1999 64.17 59.75 79.75 75.11
2000 65.39 50.11 81.84 61.62
2001 63.72 50.02 79.73 60.56
2002 57.33 51.91 72.89 59.54
2003 51.99 51.72 69.66 60.88
2004 62.22 59.60 81.03 69.97
2005 65.73 58.74 80.68 68.40
2006 66.79 58.94 79.35 69.02 Average Annual Growth Rate (%) 1.14 1.32 0.50 1.15
Sources of Data: BAS Files
Figure 14. Wholesale and Retail Prices of Milkfish and Tilapia in Metro Manila, 1996-2006 (Pesos Per kilogram).
0
10
20
30
40
50
60
70
80
90
1996 1997 1998 1999 2000 2001 2002 2003 2004 2005 2006
Years
Peso
s
Wholesale Milkfish Wholesale Tilapia Retail Milkfish Retail Tilapia
Source: Table 12
35
Table 13. Aquaculture Production in Laguna de Bay and Share to Total Aquaculture and Fisheries Production in the Philippines, 1996-2006 (Metric Tons)
Year Aquaculture Production in
Laguna de Bay (A)
Aquaculture Production in
the Philippines (B)
Fisheries Production of
the Philippines (C)
A/B (%)
A/C (%)
1996 19,564 980,829 2,769,150 1.99 0.71
1997 23,382 984,439 2,793,556 2.38 0.84
1998 25,649 997,841 2,829,520 2.57 0.91
1999 34,088 1,048,679 2,923,772 3.25 1.17
2000 34,521 1,100,902 2,993,332 3.14 1.15
2001 30,227 1,220,456 3,166,530 2.48 0.95
2002 34,940 1,338,393 3,369,524 2.61 1.04
2003 36,663 1,454,503 3,619,282 2.52 1.01
2004 47,378 1,717,027 3,926,173 2.76 1.21
2005 51,812 1,895,847 4,161,870 2.73 1.24 2006 48,767 2,093,371 4,409,526 2.33 1.11
Average Annual Growth Rate (%)
10.42
7.99
4.79
2.52
5.45
Sources of Data: Tables 3,8 and 9
Figure 15. Share of Aquaculture Production in Laguna de Bay to Total Aquaculture
and Fisheries Production in the Philippines, 1996-2006 (Metric Tons)
0.00
0.50
1.00
1.50
2.00
2.50
3.00
3.50
1996 1997 1998 1999 2000 2001 2002 2003 2004 2005 2006Years
Perc
ent
A/B A/C
Source of Data: Table 13
36
Other Economic Contributions of Aquaculture in Laguna de Bay In addition to output generation, aquaculture in Laguna de Bay contributes to income
generation. Although the annual values of aquaculture production in the lake cannot be measured due to lack of data, these figures represent the incomes of the direct participants of aquaculture in the lake, particularly the fishpen and fishcage operators. In addition to these, the conduct of aquaculture in the lake also generates incomes to the numerous indirect participants of the aquaculture industry including those involved in its input and product markets.
There are also no available data that can be used to directly estimate the employment
contribution of aquaculture in Laguna de Bay. However, it was estimated earlier that aquaculture in Laguna de bay contributed 2.33 percent to the total aquaculture production of the Philippines in 2006 (Table 13 and Figure 15). It was also cited beforehand that of the 1.6 million people employed in fisheries in 2002, 14 percent or 224,000 people, were in aquaculture. Using these figures, aquaculture in Laguna de Bay is estimated to employ 5,219 people. This figure represents only direct employment. Added to this should be the members of the population who were in one way of another dependent on aquaculture for their employment and livelihood through backward linkages in the input markets and forward linkages in the product markets.
In addition to the output, income and employment effects, aquaculture in Laguna de
Bay contributes to public revenue generation of the national and local governments. The public revenues include the bid price paid by the fishpen and fishcage operators for the right to operate and the annual registration fees paid by them as well. These also include the different national and local taxes and fees that are paid by the fishpen and fishcage operators, sellers of production inputs and the sellers of cultured fish and fish products produced in Laguna de Bay.
VII. Problems of Aquaculture in Laguna de Bay
Interviews with key informants and the review of related literature done by the study showed that although aquaculture in Laguna de Bay contributes to local and national economic development, it is currently facing numerous problems that hinder its full development. For this purpose, these problems are classified as mainly technical, production, economic, social, environmental and institutional problems. However, it should be noted that while the problems are grouped as such, they are not mutually exclusive but are actually interrelated to each other. The problems of aquaculture in Laguna de Bay are summarized as follow:
Technical Problems a. Poorly sited fishpens and fishcages – Although located in designated aquaculture belts, some fishpens and fishcages in Laguna de Bay are poorly sited and not conducive for the practice of fish culture. b. Inappropriate culture practices - Some fish culture practices used in Laguna de Bay are inappropriate. For instance, the practice of monoculture in fishpens does not utilize all the available natural food for fish in the water.
37
Production Problems a. Occasional low supply of seeds - Fry and fingerlings for stocking are not always available, resulting to the occasional late stocking, low stocking or non-stocking of fishpens and fishcages. . b. Poor quality of production inputs - Some or the production inputs used in aquaculture operations are of low quality resulting to low harvest performance or higher production costs. c. High prices of production inputs - Over the years, the prices of production inputs have increased because of the generally inflationary trend in the economy and the rising cost of fuel, among others.
Economic Problems a. Poor quality and low price of fish - The fish produced in Laguna de Bay is perceived to be of low quality. As a result, the market price of the fish is relatively low compared to fish produced in other areas. b. Low level of fish processing - Most of the fish produced in Laguna de Bay are sold in fresh or frozen form. Fishpen and fishcage operators have not benefited from value addition due to processing. c. Lack of foreign markets for fish – The fish from Laguna de Bay is generally sold only in the domestic market. Fishpen and fishcage operators have not benefited from international trade. d. Lack of access to cheap capital - Limited financial capital is a perennial constraint as traditional institutional sources like banks lend only at high interest rates and stiff collateral requirements. e. Too many middlemen - The presence of several middlemen including consignacions, wholesalers, retailers and other middlemen have diluted the income that aquaculture operators get from their operations.
Social Problems a. Poaching - Poaching reduces the harvest of fishpen and fishcage operators and increases the chance of conflict as well as forces operators to spend on security measures to prevent it. b. Reduction in fishing areas - Because of the construction of fishpens and fishcages, municipal fishermen fish in smaller areas causing enmity between them and the aquaculture operators. c. Obstruction of navigational lanes - Some fishpens and fishcages obstruct navigational lanes used by other sectors and this has caused problems between them and the aquaculture operators. d. Overcrowding of fishpens and fishcages - Some fishpen and fishcage operations are highly overcrowded in aquaculture belts and this causes conflicts between aquaculture operators. e. Existence of illegal fishpens and fishcages - Unregistered and illegally constructed fishpens and fishcages exist in Laguna de Bay including those located within and outside the aquaculture belts. f. Presence of squatters - The presence of settlers in the coastal areas has caused problems particularly to fishcage operators near these areas as some squatters steal the property of operators.

38
g. Shoreline conversion - Some coastal areas are already converted for residential, commercial and industrial uses which hinder the movement of people and materials for aquaculture operations.
Environmental Problems a. Occurrence of algal bloom - Algal bloom causes fish mortality or fish kill as stocks die of asphyxiation due to oxygen depletion. Furthermore, the fish that survives has a tainted flesh and mud-like taste. b. Proliferation of water hyacinth - Water hyacinths crowd fishpen and fishcages and cause various problems including fish mortality, destruction of pen and cage structures and obstruction of navigation. c. Invasion of alien species - The proliferation of alien fish species, particularly janitor fish of late, has caused problems among aquaculture operators. This fish destroys river banks and nets and competes for natural food and living space with cultured species. d. Occurrence of fish diseases - Cultured fish in Laguna de Bay is infected by various diseases that cause fish mortality or fish kill which in turn reduce the viability of aquaculture operations. e. Deterioration of water quality - The worsening water quality in Laguna de Bay, which is caused mainly by water pollution, results to fish mortality, fish kill, and reduced fish quality. f. Siltation and Sedimentation - Siltation and sedimentation have made Laguna de Bay shallow and reduced the living space for the fish and other aquatic animals as well as navigational space for man.
Institutional Problems
a. Obstructed saltwater inflow – Aquaculture operators argue that the backflow of saltwater from Manila Bay into Laguna de Bay through the Pasig river is obstructed. Among others, this reduces the growth of natural food and contributes to the proliferation of water hyacinth. b. Poor access to training and extension – Aquaculture operators have limited access to training and extension and operate mainly based on practical experience. This has contributed to the practice of traditional and less innovative aquaculture practices among them. c. Difficult registration process - The registration process for fishpen and fishcage operations is considered difficult and long by fishpen and fishcage operators thereby increasing the time and financial costs of registration. d. Overall limited government support - Overall technical, financial, economic, market support and law enforcement by the government is inadequate. Government agencies are perceived as not doing enough to sustainably develop aquaculture in Laguna de Bay.
Other Problems
a. Occurrence of typhoons and floods.
Weather-related events like typhoons and floods destroy fishpens and fishcages causing the escape of fish stock, destruction of property and economic losses to the aquaculture industry in the lake.
39
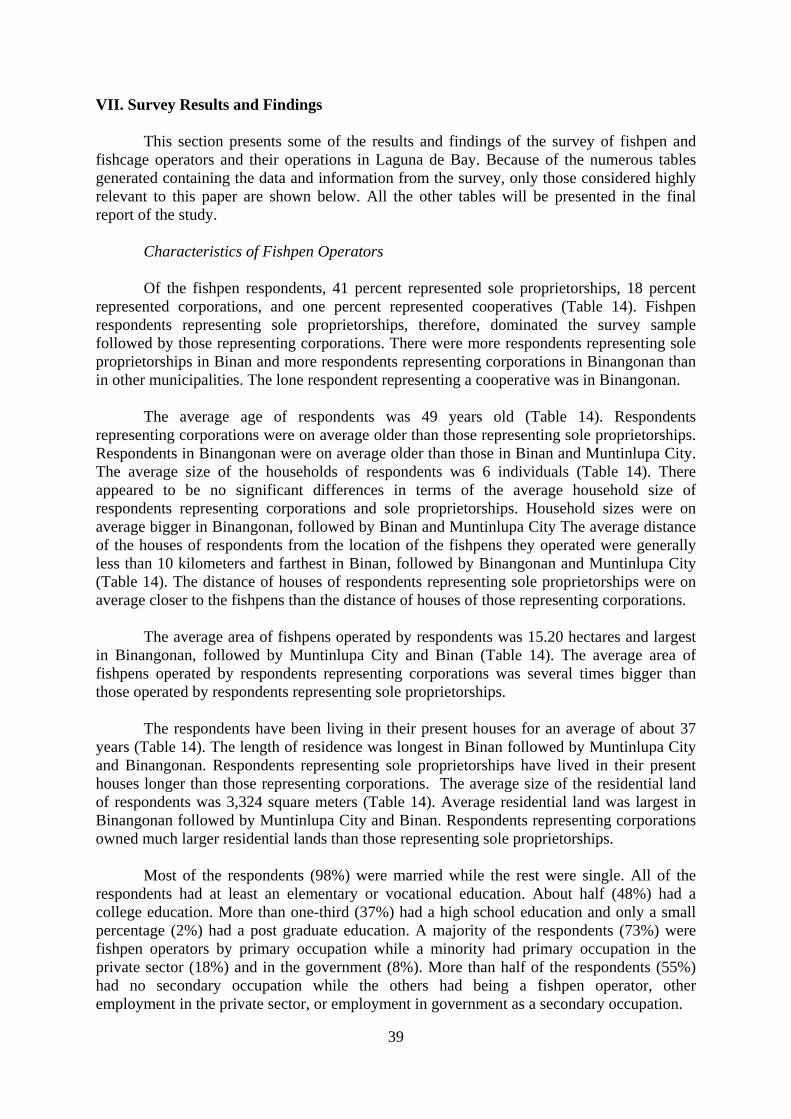
VII. Survey Results and Findings This section presents some of the results and findings of the survey of fishpen and fishcage operators and their operations in Laguna de Bay. Because of the numerous tables generated containing the data and information from the survey, only those considered highly relevant to this paper are shown below. All the other tables will be presented in the final report of the study. Characteristics of Fishpen Operators Of the fishpen respondents, 41 percent represented sole proprietorships, 18 percent represented corporations, and one percent represented cooperatives (Table 14). Fishpen respondents representing sole proprietorships, therefore, dominated the survey sample followed by those representing corporations. There were more respondents representing sole proprietorships in Binan and more respondents representing corporations in Binangonan than in other municipalities. The lone respondent representing a cooperative was in Binangonan.
The average age of respondents was 49 years old (Table 14). Respondents representing corporations were on average older than those representing sole proprietorships. Respondents in Binangonan were on average older than those in Binan and Muntinlupa City. The average size of the households of respondents was 6 individuals (Table 14). There appeared to be no significant differences in terms of the average household size of respondents representing corporations and sole proprietorships. Household sizes were on average bigger in Binangonan, followed by Binan and Muntinlupa City The average distance of the houses of respondents from the location of the fishpens they operated were generally less than 10 kilometers and farthest in Binan, followed by Binangonan and Muntinlupa City (Table 14). The distance of houses of respondents representing sole proprietorships were on average closer to the fishpens than the distance of houses of those representing corporations.
The average area of fishpens operated by respondents was 15.20 hectares and largest
in Binangonan, followed by Muntinlupa City and Binan (Table 14). The average area of fishpens operated by respondents representing corporations was several times bigger than those operated by respondents representing sole proprietorships.
The respondents have been living in their present houses for an average of about 37
years (Table 14). The length of residence was longest in Binan followed by Muntinlupa City and Binangonan. Respondents representing sole proprietorships have lived in their present houses longer than those representing corporations. The average size of the residential land of respondents was 3,324 square meters (Table 14). Average residential land was largest in Binangonan followed by Muntinlupa City and Binan. Respondents representing corporations owned much larger residential lands than those representing sole proprietorships.
Most of the respondents (98%) were married while the rest were single. All of the respondents had at least an elementary or vocational education. About half (48%) had a college education. More than one-third (37%) had a high school education and only a small percentage (2%) had a post graduate education. A majority of the respondents (73%) were fishpen operators by primary occupation while a minority had primary occupation in the private sector (18%) and in the government (8%). More than half of the respondents (55%) had no secondary occupation while the others had being a fishpen operator, other employment in the private sector, or employment in government as a secondary occupation.
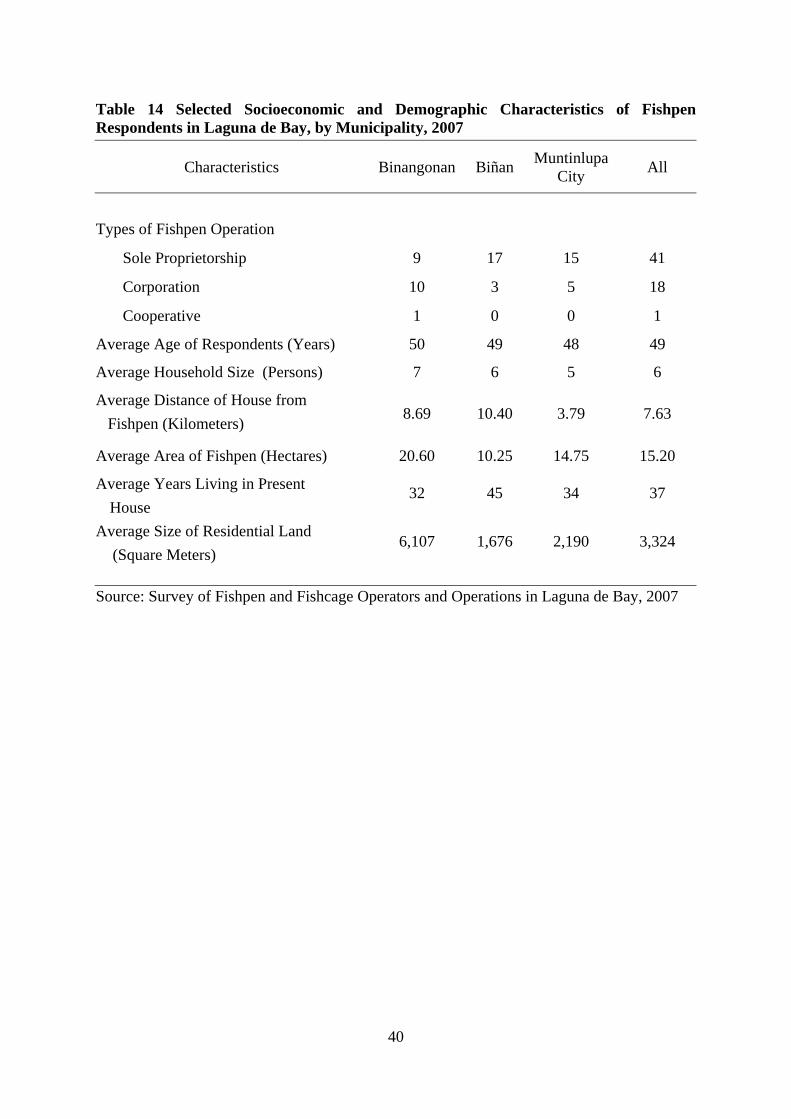
40
Table 14 Selected Socioeconomic and Demographic Characteristics of Fishpen Respondents in Laguna de Bay, by Municipality, 2007
Characteristics Binangonan Biñan Muntinlupa City All
Types of Fishpen Operation
Sole Proprietorship 9 17 15 41
Corporation 10 3 5 18
Cooperative 1 0 0 1
Average Age of Respondents (Years) 50 49 48 49
Average Household Size (Persons) 7 6 5 6
Average Distance of House from Fishpen (Kilometers) 8.69 10.40 3.79 7.63
Average Area of Fishpen (Hectares) 20.60 10.25 14.75 15.20
Average Years Living in Present House
32 45 34 37
Average Size of Residential Land (Square Meters)
6,107 1,676 2,190 3,324
Source: Survey of Fishpen and Fishcage Operators and Operations in Laguna de Bay, 2007

41
Most of the respondents (87%) owned no agricultural and aquacultural land while the rest owned either an agricultural land, aquacultural land, or both. The average agricultural land owned was one hectare and larger in Binangonan and Binan than in Muntinlupa City. The average aquacultural land owned was 1.45 hectares and larger in Binangonan than in Muntinlupa City. Respondents in Binan owned no aquacultural land.
Most of the respondents (75%) had no formal degree and training in aquaculture
(Table 15). About a quarter (23%) only had formal training in aquaculture while one (2%) only had formal degree in aquaculture. More respondents in Binangonan and Muntinlupa City had training in aquaculture than in Binan. More of those who had training got it from BFAR and the private sector while the rest sourced it from SEAFDEC AQD and LLDA.
Characteristics of Fish Pen Operations
Most of the fishpen operations of respondents (63%) grew milkfish only (Table 16).
The rest raised either bighead carp only, both milkfish and bighead carp, milkfish and tilapia, tilapia and bighead carp, or milkfish, tilapia and bighead carp. The most number of milkfish only growers were in Muntinlupa City, followed by Binan, and Binangonan. Most of the fishpen operations of the respondents (80%) were grow-out operations only. A minority were hatchery and grow-out operations while the rest were nursery and grow-out or hatchery operations. The most number of grow-out only operations were in Binan, followed by Muntinlupa City, and Binangonan. Of the fishpen operations growing milkfish, most (94%) did grow-out culture only while the rest did nursery and grow-out. Most of those that did grow-out only were in Binan and Muntinlupa City followed by Binan. A majority of those growing milkfish (78%) did monoculture while the rest did polyculture. More of those who did monoculture were in Muntinlupa City followed by Binan and Binangonan. A majority of the operations growing milkfish (86%) did the extensive system while the rest did the semi-intensive system and intensive system. More of those that conducted the extensive system were in Muntinlupa City and Binan followed by Binangonan. All the respondents sourced their fry and fingerlings from commercial suppliers. Most of the commercial suppliers (97%) were in the Philippines but outside Rizal, Laguna and Metro Manila while the rest were from outside the Philippines. Of the fishpen operations raising tilapia, less than half (43%) practiced grow-out culture only while the rest did hatchery and grow-out, nursery and grow-or hatchery only. All of the fishpen operations raising tilapia employed the polyculture system. Less than half (43%) used the extensive system or semi-intensive system while the rest did the intensive system. Most of the tilapia fry (67%) came from commercial suppliers while the rest (33% came from BFAR. All the tilapia fingerlings came from commercial suppliers. The commercial sources of fry and fingerlings were all located in the Rizal, Laguna and Metro Manila area.
Of the fishpen operations growing bighead carp, majority (65%) did grow-out only while the rest conducted hatchery only or hatchery and grow-out. Majority of the operations (55%) conducted polyculture while the rest did monoculture. Majority of the operations (65%) used the extensive system while the rest conducted the semi-intensive system or the intensive system. All the seeds used by the fishpen operations growing bighead carp were sourced from commercial suppliers. All of these commercial suppliers were located in Rizal, Laguna and Metro Manila area.

42
Table 15. Formal Degree and Training in Aquaculture and Source of Formal Training of Fishpen Respondents in Laguna de Bay, by Municipality, 2007
Binangonan Biñan Muntinlupa City All Formal Degree and Training/ Source of
Formal Training Number % Number % Number % Number %
Formal Degree and Training
With Formal Degree Only
1 5 0 0 0 0 1 2
With Formal Training Only
6 30 2 10 6 30 14 23
With Formal Degree and Training 0 0 0 0 0 0 0 0
No Formal Degree and Training
13 65 18 90 14 70 45 75
Total 20 100 20 100 20 100 60 100 Source of Formal Training
BFAR 1 5 0 0 5 25 6 10 LLDA 0 0 1 5 0 0 1 2 SEAFDEC-AQD 1 5 0 0 0 0 1 2 Private Sector 4 20 1 5 1 5 6 10 None 14 70 18 90 14 70 46 76
Total 20 100 20 100 20 100 60 100
Source: Survey of Fishpen and Fishcage Operators and Operations in Laguna de Bay 2007

43
Table 16. Fish Species Grown in Fishpen Operations in Laguna de Bay, by Municipality, 2006
Binangonan Biñan Muntinlupa City All Species
Number % Number % Number % Number % Milkfish Only 4 20 16 80 18 90 38 63 Tilapia Only 0 0 0 0 0 0 0 0 Bighead Carp Only 6 30 2 10 0 0 8 13
Milkfish and Tilapia 1 5 0 0 1 5 2 3
Milkfish and Bighead Carp 5 25 1 5 1 5 7 12
Tilapia and Bighead Carp 2 10 1 5 0 0 3 5
Milkfish, Tilapia and Bighead Carp 2 10 0 0 0 0 2 3
Total 20 100 20 100 20 100 60 100
Source: Survey of Fishpen and Fishcage Operators and Operations in Laguna de Bay, 2007

44
Most fishpen operations (88%) sold their milkfish to consignacions while the rest sold to wholesalers and retailers. More than half of the fishpen operations (55%) sold their tilapia to consignacions while the rest sold to wholesalers, retailers and direct consumers. Half of operations producing bighead carps sold to consignacions while the rest sold to wholesalers, retailers, direct consumers and other buyers. The fish produced in fishpen operations were generally consumed domestically. The market destination of a majority of the milkfish produced (96%) was Rizal, Laguna and Metro Manila while the rest were brought to other parts of the Philippines. Most of the tilapia produced (71%) was brought to Rizal, Laguna and Metro Manila while the rest were sold to other parts of the country. Most of the fish produced (95%) were sold in Rizal, Laguna and Metro Manila while the rest were brought to other parts of the country. The financial capital used in fishpen operations by respondents were mostly taken from their own funds only (48%) or both from their own funds and borrowed funds (40%) while the rest were generated from other sources (Table 17). When funds were borrowed, about half (52%) of the respondents sourced them from friends and relatives (52%). The other sources of borrowed funds of respondents were commercial banks, private lenders and rural banks. The financial profitability of the operations of fishpen respondents in Laguna de Bay was evaluated. In the analysis, the monoculture of milkfish in a five hectare fishpen which was more commonly practiced by respondents was considered. The results of the computations show that this type of fishpen operation on average generated annual total revenues of P1,400,000, annual total costs of P1,113,780 and annual net revenues of P286,220 (Table 18). Furthermore, this type of fishpen operation required a total capital investment of P694,181 and an annual depreciation of P103,477 (Table 19).
The analysis of financial profitability indicates that fishpen operations in Laguna de Bay are profitable ventures generating positive net incomes for fishpen operators. The results further show that substantial financial capital is needed to operate a fishpen as it take thousands of pesos to establish the fixed assets needed even for a 5-hectare operation. In addition, the operating capital required to run a fishpen operation whole year round is substantial.
Severity of Problems Facing Fishpen Respondents The severity of the problems affecting aquaculture in Laguna Bay were analysed based on the perceptions of fishpen respondents (Table 20). Again, the problems were grouped into technical, production, economic, social, environmental, institutional and other problems. In general, in Laguna de Bay as a whole as well as in each of the individual municipalities, the problems which were considered very serious as a group by more fishpen respondents were the environment-related problems. On the other hand, those which were considered moderately or lightly serious as a group by more respondents were the technical, production economic, social, institutional and other problems.
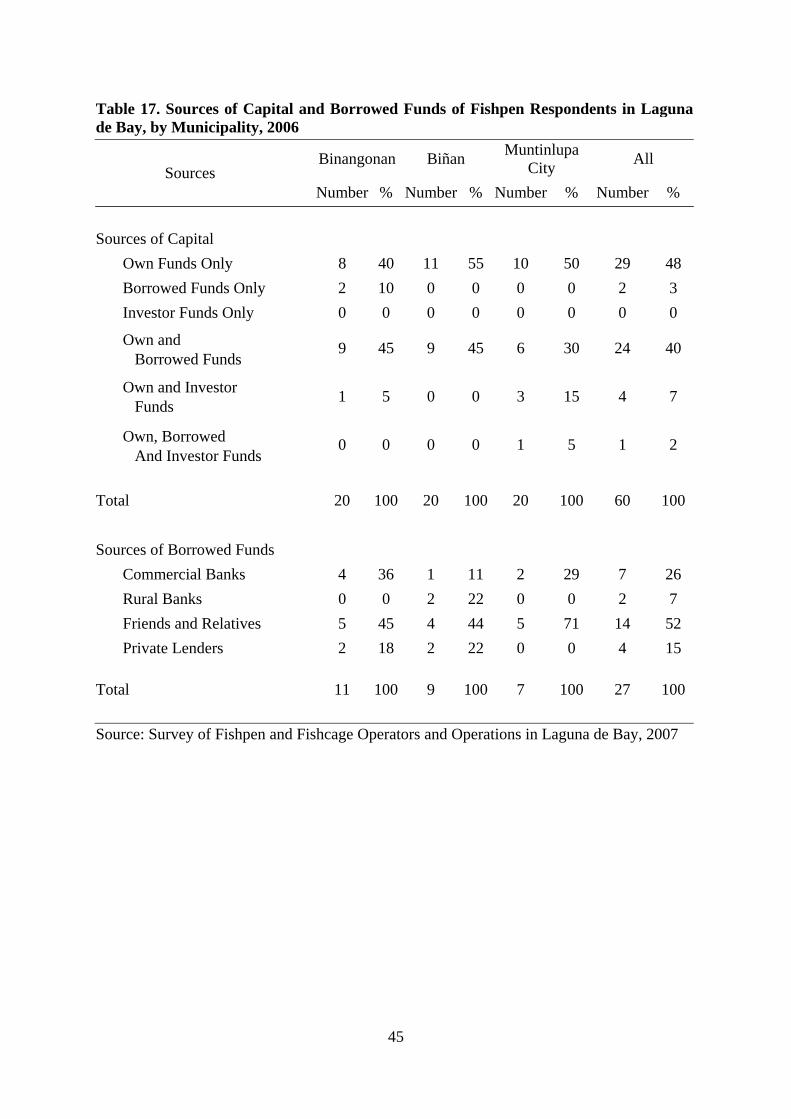
45
Table 17. Sources of Capital and Borrowed Funds of Fishpen Respondents in Laguna de Bay, by Municipality, 2006
Binangonan Biñan Muntinlupa City All
Sources Number % Number % Number % Number %
Sources of Capital
Own Funds Only 8 40 11 55 10 50 29 48 Borrowed Funds Only 2 10 0 0 0 0 2 3 Investor Funds Only 0 0 0 0 0 0 0 0
Own and Borrowed Funds
9 45 9 45 6 30 24 40
Own and Investor Funds
1 5 0 0 3 15 4 7
Own, Borrowed And Investor Funds
0 0 0 0 1 5 1 2
Total 20 100 20 100 20 100 60 100 Sources of Borrowed Funds
Commercial Banks 4 36 1 11 2 29 7 26 Rural Banks 0 0 2 22 0 0 2 7 Friends and Relatives 5 45 4 44 5 71 14 52 Private Lenders 2 18 2 22 0 0 4 15
Total 11 100 9 100 7 100 27 100
Source: Survey of Fishpen and Fishcage Operators and Operations in Laguna de Bay, 2007
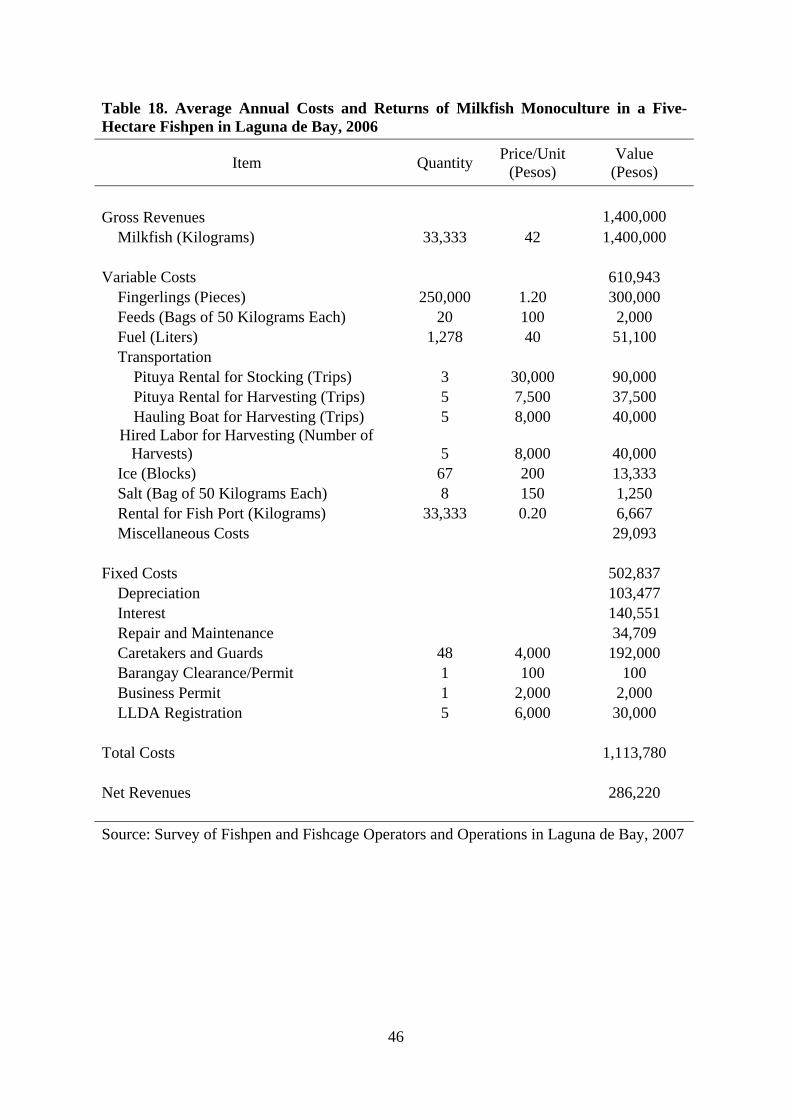
46
Table 18. Average Annual Costs and Returns of Milkfish Monoculture in a Five-Hectare Fishpen in Laguna de Bay, 2006
Item Quantity Price/Unit (Pesos)
Value (Pesos)
Gross Revenues 1,400,000
Milkfish (Kilograms) 33,333 42 1,400,000 Variable Costs 610,943
Fingerlings (Pieces) 250,000 1.20 300,000 Feeds (Bags of 50 Kilograms Each) 20 100 2,000 Fuel (Liters) 1,278 40 51,100 Transportation
Pituya Rental for Stocking (Trips) 3 30,000 90,000 Pituya Rental for Harvesting (Trips) 5 7,500 37,500 Hauling Boat for Harvesting (Trips) 5 8,000 40,000
Hired Labor for Harvesting (Number of Harvests) 5 8,000 40,000
Ice (Blocks) 67 200 13,333 Salt (Bag of 50 Kilograms Each) 8 150 1,250 Rental for Fish Port (Kilograms) 33,333 0.20 6,667 Miscellaneous Costs 29,093
Fixed Costs 502,837
Depreciation 103,477 Interest 140,551 Repair and Maintenance 34,709 Caretakers and Guards 48 4,000 192,000 Barangay Clearance/Permit 1 100 100 Business Permit 1 2,000 2,000 LLDA Registration 5 6,000 30,000
Total Costs 1,113,780 Net Revenues 286,220 Source: Survey of Fishpen and Fishcage Operators and Operations in Laguna de Bay, 2007
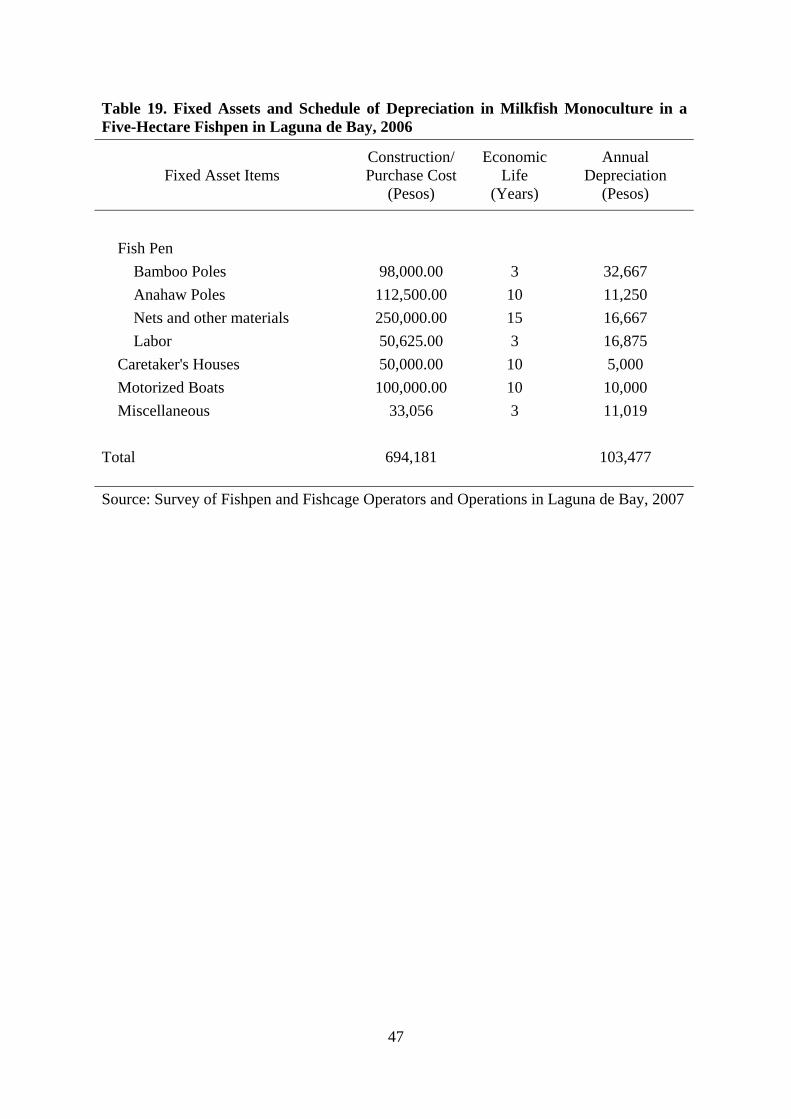
47
Table 19. Fixed Assets and Schedule of Depreciation in Milkfish Monoculture in a Five-Hectare Fishpen in Laguna de Bay, 2006
Fixed Asset Items Construction/ Purchase Cost
(Pesos)
Economic Life
(Years)
Annual Depreciation
(Pesos)
Fish Pen
Bamboo Poles 98,000.00 3 32,667 Anahaw Poles 112,500.00 10 11,250 Nets and other materials 250,000.00 15 16,667 Labor 50,625.00 3 16,875
Caretaker's Houses 50,000.00 10 5,000 Motorized Boats 100,000.00 10 10,000
Miscellaneous 33,056 3 11,019 Total 694,181 103,477 Source: Survey of Fishpen and Fishcage Operators and Operations in Laguna de Bay, 2007

48
Table 20. Severity of Aquaculture Problems Facing Fishpen Respondents in Laguna de Bay, 2006 Severity of the Problems
Problems Very Serious
Moderately Serious
Lightly Serious
Not a problem No opinion Total
Technical Problems Poorly sited fishpens 12 40 7 0 1 60 Inappropriate culture practices 6 37 15 0 2 60 Production Problems Occasional low supply of seeds 8 26 20 2 4 60 Poor quality of production inputs 8 22 24 2 4 60 High prices of production inputs 8 25 21 2 4 60 Economic Problems Poor quality and low price of fish 9 37 11 2 1 60 Low level of fish processing 6 34 15 3 2 60 Lack of foreign markets for fish 5 37 12 3 2 60 Lack of access to cheap capital 32 20 5 2 1 60 Too many middlemen 9 37 11 2 1 60 Social Problems Poaching 35 18 5 1 1 60 Reduction in fishing areas 12 37 10 0 1 60 Obstruction of navigational lanes 26 23 9 0 2 60 Overcrowding of fishpens 12 40 7 0 1 60 Existence of illegal fishpens 26 26 6 0 2 60 Presence of squatters 5 42 6 0 7 60 Shoreline conversion 12 37 10 0 1 60 Environmental Problems Occurrence of algal bloom 32 16 10 0 2 60 Proliferation of water hyacinth 32 19 7 0 2 60 Invasion of alien species 46 12 0 1 1 60 Occurrence of fish diseases 32 18 9 0 1 60 Deterioration of water quality 44 12 4 0 0 60 Siltation and sedimentation 44 15 1 0 0 60 Institutional Problems Obstructed saltwater inflow 7 33 18 0 2 60 Poor access to training & extension 7 36 15 0 2 60 Difficult registration process 19 28 10 1 2 60 Overall limited government support 34 19 6 1 0 60 Other problems Occurrence of typhoons & floods 7 33 18 0 2 60 Source: Survey of Fishpen and Fishcage Operators and Operations in Laguna de Bay, 2007
49
Of the environment related problems, invasion of alien species, deterioration of water quality and siltation and sedimentation were considered by more fishpen respondents very serious followed by occurrence of algal bloom, proliferation of water hyacinth, and occurrence of fish diseases. Outside of environmental problems, the economic problem of lack of access to cheap capital, social problems of poaching, obstruction of navigational lanes and existence of illegal fishpens and the institutional problem of overall limited support from the government were also considered very serious by more fishpen respondents.
The individual problems which were considered moderately serious by more respondents were the technical problems of poor site selection of fishpens and inappropriate culture schemes, the production problems of occasional low supply of seeds and high prices of production inputs, all the economic problems except lack of access to cheap capital, all the social problems except poaching and obstruction of navigational lanes, all the institutional problems except overall limited support from the government and other problems.
The individual problem which was considered lightly serious by more fishpen
respondents were the production problem of poor quality of inputs. Few fishpen respondents considered any of the problems affecting aquaculture in Laguna de Bay as not a problem at all. A large number of respondents, however, had no opinion on the severity of the problems. Characteristics of Fishcage Operators All the fishcage respondents surveyed in the three municipalities in Laguna de Bay represented sole proprietorship operations. The average age of respondents was 48 years old (Table 21). Respondents in Muntinlupa City were on average older than those in Binan and Binangonan. The average size of households of respondents was six individuals and larger in Muntinlupa City and Binangonan than in Binan. The average distance of the houses of respondents from the fishcages was about three and a half kilometers and farthest in Muntinlupa City followed by Binangonan and Binan.
The average area of fishcages operated by respondents was about half a hectare and was bigger in Binangonan, followed by Muntinlupa City and Binan (Table 21). The respondents have been living in their present houses for an average of 32 years and length of residence was longest in Binan than in Muntinlupa City and Binangonan. The average size of residential land of respondents was 566 square meters and largest in Binangonan followed by Muntinlupa City and Binan.
Most of the respondents were married (94%) while the rest were single or widowed.
All had at least an elementary or vocational education. About a third (35%) had elementary education while less than half (44%) had high school education. A small percentage (10%) had college education and vocational education (10%). A majority of the respondents (92%) were fishcage operators by primary occupation while a minority had other employment in the private sector (6%) and employment in the government (2%). A majority of the respondents (73%) had no secondary occupation while others had being a fishcage operator, other employment in the private sector, and employment in government as secondary occupation.
Most of the respondents (90%) owned no agricultural land and none owned
aquacultural land. Of the few who owned agricultural land, the average land owned was one hectare and larger in Binangonan than in Muntinlupa City. Respondents in Binan owned no agricultural land.
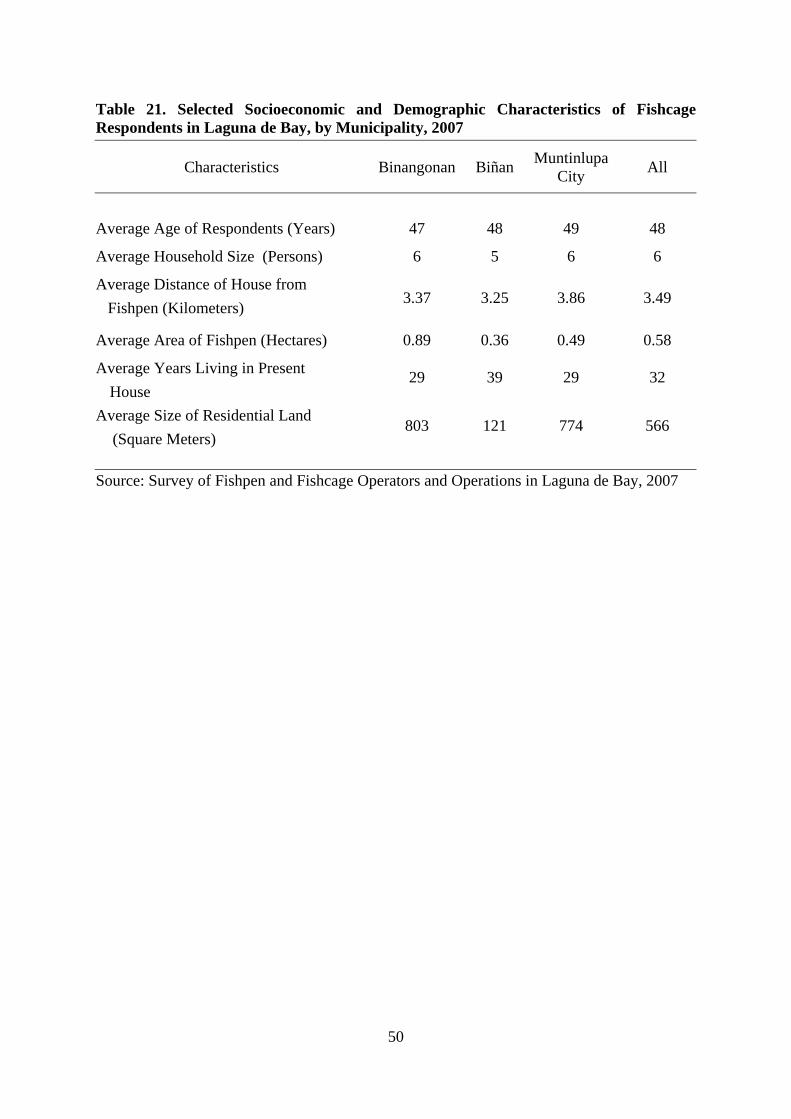
50
Table 21. Selected Socioeconomic and Demographic Characteristics of Fishcage Respondents in Laguna de Bay, by Municipality, 2007
Characteristics Binangonan Biñan Muntinlupa City All
Average Age of Respondents (Years) 47 48 49 48
Average Household Size (Persons) 6 5 6 6
Average Distance of House from Fishpen (Kilometers) 3.37 3.25 3.86 3.49
Average Area of Fishpen (Hectares) 0.89 0.36 0.49 0.58
Average Years Living in Present House
29 39 29 32
Average Size of Residential Land (Square Meters)
803 121 774 566
Source: Survey of Fishpen and Fishcage Operators and Operations in Laguna de Bay, 2007
51
Most of the respondents (74%) had no formal degree and training in aquaculture (Table 22). A minority (13%) had both formal degree and training in aquaculture. Others (12%) had formal training only while one respondent from Binangonan had a formal degree only. More of the respondents with formal training were trained by BFAR while the rest were trained by LLDA, SEAFDEC AQD and the private sector. Characteristics of Fishcage Operations
More than half of the fishcage operations of the respondents (53%) grew big head carp only (Table 23). The rest grew tilapia and bighead carp, tilapia only, milkfish, tilapia and bighead carps, milkfish and tilapia, milkfish and bighead carp, catfish only, and milkfish only operations.
The most number of bighead carp only growers were in Binan followed by
Muntinlupa City and Binangonan. Most of the fishcage operations of the respondents (81%) were grow-out operations only. A minority were hatchery and grow-out operations and nursery and grow-out operations while even fewer were hatchery only, nursery only, and hatchery, nursery and grow-out operations. The most number of grow-out only operations were in Binan, followed by Muntinlupa City, and Binangonan. Of the respondents growing milkfish, most (75%) did grow-out culture only while the others had nursery and grow-out, or hatchery and grow-out operations. Most of those who did grow-out only were in Binangonan followed by Muntinlupa City and Binangonan. A majority of those growing milkfish (92%) practiced polyculture while the rest did monoculture. A majority of those growing milkfish (86%) used the extensive system while the rest did semi-intensive system and intensive system. More of those who conducted the extensive system were in Binangonan than in Muntinlupa City. All the seeds used by the respondent fishcage operators were sourced from commercial suppliers. All the commercial suppliers were within Rizal, Laguna and Metro Manila.
Of the respondents raising tilapia, a majority (65%) practiced grow-out culture only while the rest did hatchery and grow-out, nursery and grow-out, hatchery only, nursery only, or hatchery and nursery and grow-out operations. More employed the polyculture system (65%) while the rest used the monoculture system. Half used the extensive system while the rest employed the intensive and semi-intensive systems. Most of the fry used by respondent fishcage operators growing tilapia (89%) were sourced from commercial suppliers while the rest came from BFAR. Most of the fingerlings used (75%) came from commercial suppliers while the rest came from BFAR. The sources of tilapia seeds were all located in the Rizal, Laguna and Metro Manila area. Of the respondents growing bighead carp, majority (87%) did grow-out only while the rest conducted nursery and grow-out, hatchery and grow-out, nursery only, hatchery only, and hatchery, nursery and grow-out operations. A majority (65%) conducted monoculture while the rest did monoculture. A majority (74%) employed the extensive system while the rest conducted the semi-intensive system or the intensive system. A majority of the fry used by respondents (75%) were sourced from commercial suppliers while the rest came from BFAR. Practically all (99%) of the fingerlings used came from commercial suppliers. All the suppliers of bighead carp seeds were from the Rizal, Laguna and Metro Manila area.
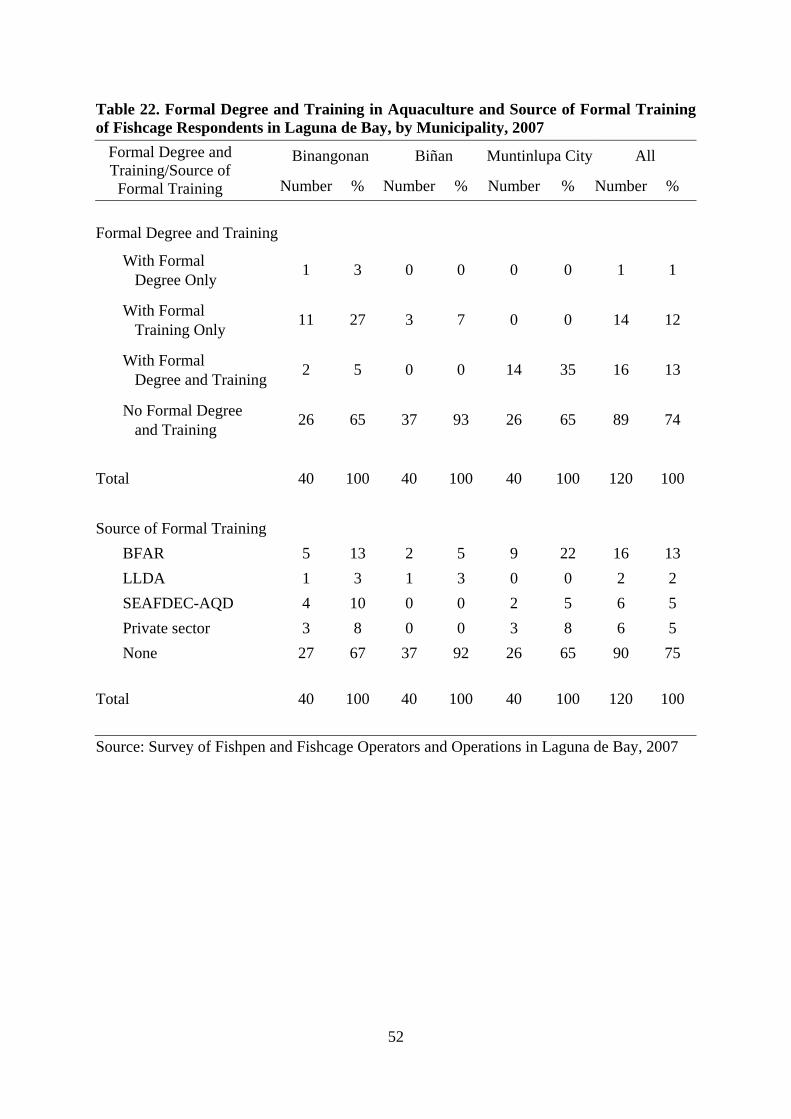
52
Table 22. Formal Degree and Training in Aquaculture and Source of Formal Training of Fishcage Respondents in Laguna de Bay, by Municipality, 2007
Binangonan Biñan Muntinlupa City All Formal Degree and Training/Source of Formal Training Number % Number % Number % Number %
Formal Degree and Training
With Formal Degree Only
1 3 0 0 0 0 1 1
With Formal Training Only
11 27 3 7 0 0 14 12
With Formal Degree and Training 2 5 0 0 14 35 16 13
No Formal Degree and Training
26 65 37 93 26 65 89 74
Total 40 100 40 100 40 100 120 100 Source of Formal Training
BFAR 5 13 2 5 9 22 16 13 LLDA 1 3 1 3 0 0 2 2 SEAFDEC-AQD 4 10 0 0 2 5 6 5 Private sector 3 8 0 0 3 8 6 5 None 27 67 37 92 26 65 90 75
Total 40 100 40 100 40 100 120 100
Source: Survey of Fishpen and Fishcage Operators and Operations in Laguna de Bay, 2007

53
Table 23. Fish Species Grown by Fishcage Respondents in Laguna de Bay, by Municipality, 2006
Binangonan Biñan Muntinlupa City All Species
Number % Number % Number % Number % Milkfish Only 0 0 1 3 0 0 1 1 Tilapia Only 3 8 0 0 15 37 18 15 Bighead Carp Only 16 40 39 97 9 22 64 53 Catfish Only 1 3 0 0 0 0 1 1
Milkfish and Tilapia 0 0 0 0 3 8 3 3
Milkfish and Bighead Carp 2 5 0 0 0 0 2 2
Tilapia and Bighead Carp 13 32 0 0 12 30 25 21
Milkfish, Tilapia and Bighead Carp 5 12 0 0 1 3 6 5
Total 40 100 40 100 40 100 120 100
Source: Survey of Fishpen and Fishcage Operators and Operations in Laguna de Bay, 2007
54
Half of the respondents producing milkfish sold to wholesalers while the rest sold consignacions (25%) and retailers (25%). More than half of the respondents producing tilapia sold to wholesalers (58%) went to wholesalers while the rest sold to consignacions (13%), retailers (23%) and other outlets. Less than half of the respondents producing bighead carps (47%) sold to wholesalers while the rest sold to consignacions (26%), retailers (17%) and othero outlets. The market destination of a majority of the milkfish produced (58%) was Rizal, laguna and Metro Manila while the rest were brought to other parts of the Philippines. A majority of the tilapia produced (63%) was brought to Rizal, Laguna and Metro Manila while the rest were sold to other parts of the country. The market destination of the big head carp produced (79%) was Rizal, Laguna and Metro Manila while the rest were brought to other parts of the country. More than half of the respondents (58%) generated the capital used in the operation of fishcages from own funds only while the rest were taken from borrowed funds and other sources (Table 24). When funds were borrowed, the main sources of the respondents were commercial banks (44%) and friends and relatives (50%) while the rest comes from other sources. The financial profitability of operations of fishcage respondents in Laguna de Bay was estimated. In the analysis, the monoculture of bighead carp in a one hectare fishcage more commonly practiced by fishcage respondents was considered. The results indicate that an average one-hectare fishcage in Laguna de Bay conducting bighead carp monoculture generated annual total revenues of P157,500, annual total costs of P124,218 and annual net revenues of P33,282 (Table 25). Furthermore, this type of fishcage venture required a total fixed asset investment of about P129,413 and annual depreciation of P25,604 (Table 26).
The analysis of financial profitability therefore indicate that, like fishpen operations, fishcage operations in Laguna de Bay were profitable ventures generating net incomes for its operators. The results further show that, unlike fishpen operations, fishcage operations require less financial capital to operate since they have relatively lower fixed assets and operating capital requirements. Severity of Problems Facing Fishcage Respondents The problems affecting aquaculture in Laguna de Bay were also evaluated based on the perceptions of the fishcage respondents (Table 27). Again, the problems were grouped into technical, production, economic, social, environmental, and institutional problems. The results of the evaluation mirrored those from fishpen respondents. In the three municipalities as whole and in the individual municipalities, the aquaculture problems which were considered very serious as a group by more respondents were the environment-related problems. Those considered moderately or lightly serious were the technical, production, economic, social, and institutional problems.
As in the case of fishpens, of the environmental problems, deterioration of water quality, siltation and sedimentation and invasion of alien species were considered very serious by more fishcage respondents. The environmental problems which were considered very serious by fewer respondents were the algal bloom, proliferation of water hyacinth, and occurrence of fish diseases.

55
Table 24. Sources of Capital and Borrowed Funds of Fishcage Respondents in Laguna de Bay, by Municipality, 2006
Binangonan Biñan Muntinlupa City All
Sources Number % Number % Number % Number %
Sources of Capital
Own Funds Only 18 45 29 73 23 58 70 58 Borrowed Funds Only 12 30 3 8 9 23 24 20 Investor Funds Only 1 3 2 5 1 3 4 3 Own and Borrowed Funds
7
18
6
15
7
18
20
17
Own and Investor Funds
1
3
0
0
0
0
1
1
Own, Borrowed And Investor Funds
1
3
0
0
0
0
1
1
Total 40 100 40 100 40 100 120 100 Sources of Borrowed Funds
Commercial Banks 11 55 3 33 7 44 21 47 Rural Banks 1 5 0 0 0 0 1 2 Friends and Relatives 7 35 6 67 9 56 22 49 Private Lenders 1 5 0 0 0 1 1 2
Total 20 100 9 100 16 100 45 100 Source: Survey of Fishpen and Fishcage Operators and Operations in Laguna de Bay, 2007
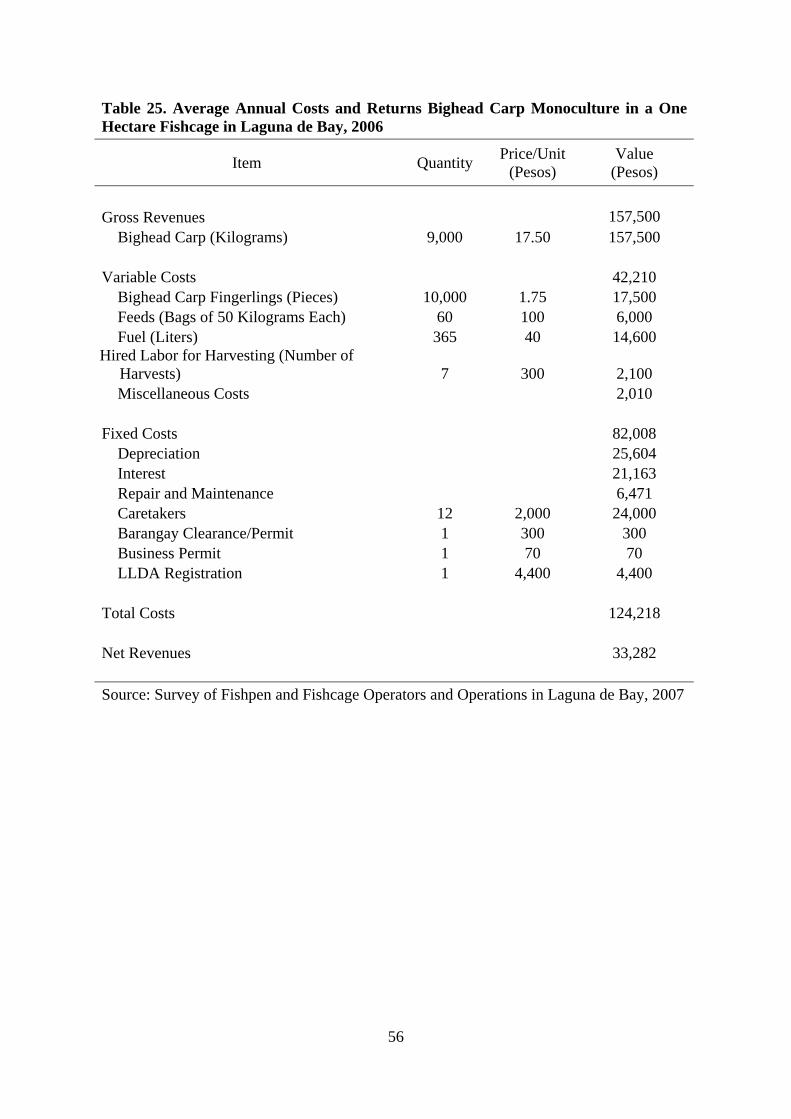
56
Table 25. Average Annual Costs and Returns Bighead Carp Monoculture in a One Hectare Fishcage in Laguna de Bay, 2006
Item Quantity Price/Unit (Pesos)
Value (Pesos)
Gross Revenues 157,500
Bighead Carp (Kilograms) 9,000 17.50 157,500 Variable Costs 42,210
Bighead Carp Fingerlings (Pieces) 10,000 1.75 17,500 Feeds (Bags of 50 Kilograms Each) 60 100 6,000 Fuel (Liters) 365 40 14,600
Hired Labor for Harvesting (Number of Harvests) 7 300 2,100 Miscellaneous Costs 2,010
Fixed Costs 82,008
Depreciation 25,604 Interest 21,163 Repair and Maintenance 6,471 Caretakers 12 2,000 24,000 Barangay Clearance/Permit 1 300 300 Business Permit 1 70 70 LLDA Registration 1 4,400 4,400
Total Costs 124,218 Net Revenues 33,282 Source: Survey of Fishpen and Fishcage Operators and Operations in Laguna de Bay, 2007

57
Table 26. Fixed Assets and Schedule of Depreciation in Bighead Carp Monoculture in a One Hectare Fishcage in Laguna de Bay, 2006
Fixed Asset Items Construction/ Purchase Cost
(Pesos)
Economic Life
(Years)
Annual Depreciation
(Pesos)
Fish Cage
Bamboo Poles 35,000 3 11,667 Nets and other materials 32,000 15 2,133 Labor 11,250 3 3,750
Caretaker's Houses 15,000 5 3,000 Motorized Boats 30,000 10 3,000
Miscellaneous 6,163 3 2,054 Total 129,413 25,604 Source: Survey of Fishpen and Fishcage Operators and Operations in Laguna de Bay, 2007
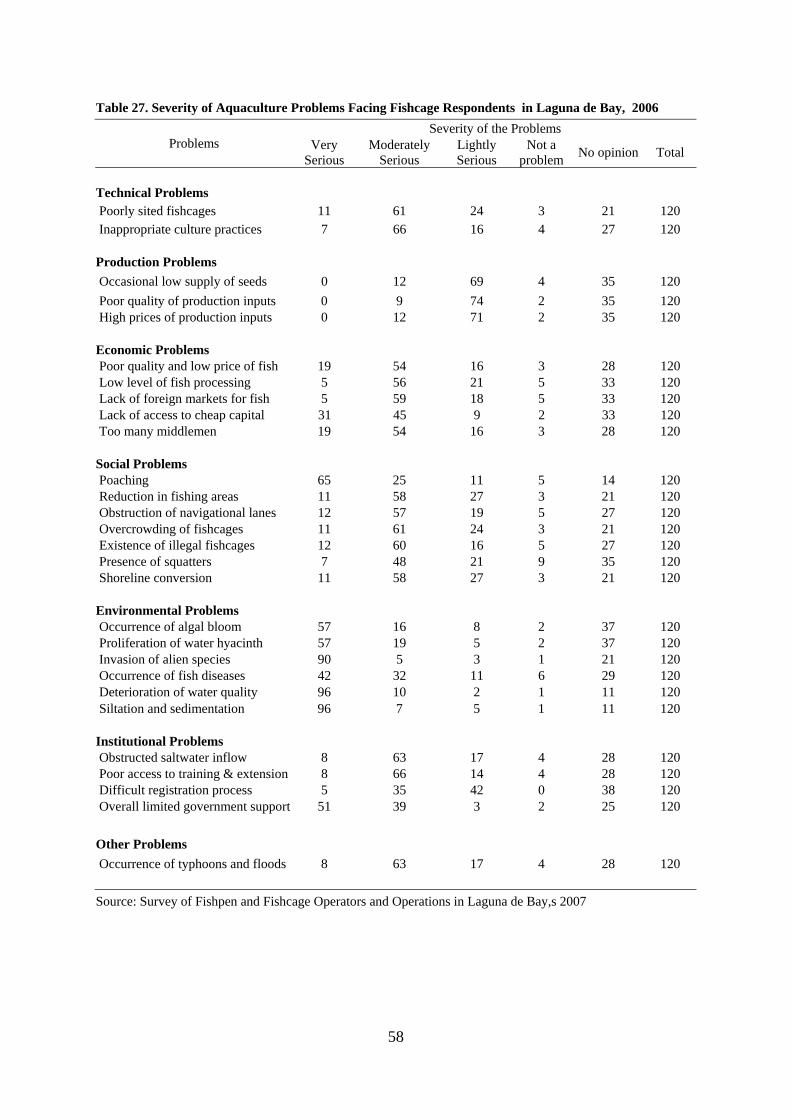
58
Table 27. Severity of Aquaculture Problems Facing Fishcage Respondents in Laguna de Bay, 2006 Severity of the Problems
Problems Very Serious
Moderately Serious
Lightly Serious
Not a problem No opinion Total
Technical Problems Poorly sited fishcages 11 61 24 3 21 120 Inappropriate culture practices 7 66 16 4 27 120 Production Problems Occasional low supply of seeds 0 12 69 4 35 120 Poor quality of production inputs 0 9 74 2 35 120 High prices of production inputs 0 12 71 2 35 120 Economic Problems Poor quality and low price of fish 19 54 16 3 28 120 Low level of fish processing 5 56 21 5 33 120 Lack of foreign markets for fish 5 59 18 5 33 120 Lack of access to cheap capital 31 45 9 2 33 120 Too many middlemen 19 54 16 3 28 120 Social Problems Poaching 65 25 11 5 14 120 Reduction in fishing areas 11 58 27 3 21 120 Obstruction of navigational lanes 12 57 19 5 27 120 Overcrowding of fishcages 11 61 24 3 21 120 Existence of illegal fishcages 12 60 16 5 27 120 Presence of squatters 7 48 21 9 35 120 Shoreline conversion 11 58 27 3 21 120 Environmental Problems Occurrence of algal bloom 57 16 8 2 37 120 Proliferation of water hyacinth 57 19 5 2 37 120 Invasion of alien species 90 5 3 1 21 120 Occurrence of fish diseases 42 32 11 6 29 120 Deterioration of water quality 96 10 2 1 11 120 Siltation and sedimentation 96 7 5 1 11 120 Institutional Problems Obstructed saltwater inflow 8 63 17 4 28 120 Poor access to training & extension 8 66 14 4 28 120 Difficult registration process 5 35 42 0 38 120 Overall limited government support 51 39 3 2 25 120 Other Problems Occurrence of typhoons and floods 8 63 17 4 28 120 Source: Survey of Fishpen and Fishcage Operators and Operations in Laguna de Bay,s 2007

59
Other than the environmental problems, more fishcage respondents considered the social problem of poaching and the institutional problem of overall limited support from the government very serious. The individual problems which were considered moderately serious by more respondents were all the two technical problems, all the economic problems, all the social problems except poaching, all the institutional problems except overall limited support from the government and other problems.
The individual problems which were considered lightly serious by more fishcage
respondents were all the production problems and the institutional problem of difficult registration process. As in the case of fishpens, few fishcage respondents considered the problems affecting aquaculture in Laguna de Bay as not a problem at all. However, a substantial number of the fishcage respondents also have no opinion on the severity of the problems impacting aquaculture. VIII. Conclusions and Recommendations
The above analysis of the state aquaculture in Laguna de Bay de bay generated the following major findings. Firstly, aquaculture in the lake is a vibrant industry. This industry includes not only the fishpen and fishcage operators who grow fish but also various participants in its input and product markets. The input market participants are the seed, feed and other input suppliers and middlemen while the product market participants are the consignacions, wholesalers, retailers and other middlemen involved in fish marketing and trading.
Secondly, while the actual area allotted for fishpen and fishcage culture in Laguna de Bay is relatively small, it has contributed significantly to local and national fish production. Specifically, aquaculture output in Laguna de Bay contributed more than 50 percent to total fish production in the lake, more than two percent to national aquaculture production and more than one percent to national fisheries production. In addition to fish production, aquaculture in the lake has contributed to income, employment, and public revenue generation. Thirdly, although aquaculture in Laguna de Bay has been an important contributor to the economy at both the local and national levels, it has been facing numerous problems over time. These problems include technical, production, economic, social, environmental, institutional and other problems which hinder its full development. At the least, therefore, the most important of these problems have to be addressed for aquaculture in the lake to move forward. Lastly, of the various problems facing aquaculture in Laguna de Bay, environment-related problems, particularly deterioration of water quality, siltation and sedimentation and invasion of alien species, and the individual problems of lack of access to cheap capital, poaching, obstruction of navigational lanes by fishpens, existence of illegal fishpens and overall limited support from the government are the ones considered very serious by more aquaculture operators. In light of this and the limited public resources available, it may be prudent to prioritize these problems as the ones needing the most attention.
Although specific solutions to the various problems confronting aquaculture in
Laguna de Bay are outside the realm of this paper, some general recommendations are put forward. First and foremost, since environment-related problems generally cut across sectors,
60
effectively addressing them requires a multi-sectoral effort. It is important, therefore, that all the relevant agencies of government, and not just those involved in aquaculture, will work together and see that these problems are adequately addressed.
Secondly, even in the absence of new efforts, much can be done already by the
government by way of improving monitoring and enforcement in Laguna de Bay. Pertinent agencies must be aggressive in the implementation of laws and regulations, particularly relating to the water environment, navigational lanes, illegal fishpens and poaching in the lake. As often suggested, many of the problems of the country are not a result of the absence of laws and regulations but in the inability of the government to effectively implement the existing ones.
Thirdly, much can also be achieved by the government if it promotes the formation of
efficient and effective producers’ organizations or cooperatives that will assist fishpen and fishcage operators in Laguna de Bay in the conduct of the various aspects of their operations. If and when operators are effectively organized, they can act as one in dealing with their input and product markets and subsequently derive maximum benefits from trade. Furthermore, they would have a much better chance of accessing cheap capital and other forms of assistance for their operations when they are organized.
Lastly, the overall limited support of the government to fisheries and aquaculture in the country is probably understandable, the sector being only a small contributor to national output. On the other hand, the same limited support specifically to aquaculture in Laguna de Bay is quite perplexing given that it is an important supplier of fish locally and nationally. If aquaculture in the lake fails, for instance, the supply of fish to Metro Manila and surrounding areas would be greatly affected. The national government, therefore, should support the continued practice of fishpen and fishcage culture in Laguna de Bay as long as it is conducted in a sustainable manner. Among others, it should pursue an integrated development of the lake where aquaculture plays an integral but supportive part to the overall development goals in the lake and the Laguna de Bay region. Furthermore, it should integrate all of its various programs, projects and activities in the lake so that a concerted and streamlined program of action for aquaculture development can be pursued. References Bacallan, J. J. 1997. The race to protect the Laguna de Bay region. Business and
Environment, World Bank, January-February Issue. Barril, C. R. 1992. Sustainable development of Laguna de Bay prospects and problems.
Philippine Technology Journal, Volume XVII, Number 2, April-June 1992. Basiao, Z. U. 1989. Effects of initial stocking size on the growth of Nile Tilapia fingerings in
cages without supplemental feed in Laguna Lake, Philippines. Natural and Applied Science Bulletin 40(3): 171-175.
Bureau of Agricultural Statistics. Various Years. Philippine Fisheries Statistics.

61
Bureau of Fisheries and Aquatic Resources. No Date. Laguna de Bay Profile. Bureau of Fisheries and Aquatic Resources Regional Office No. 4-A.
____________________2006. 2005 Philippine Fisheries Profile Bureau of Fisheries and Aquatic Resources, Region IV-A. 2007. CALABARZON Production
Profile. Draft. Centeno, J. D., Jr. 1987. Pollution sources and control. p. 30-33. In Philippine Council for
Agriculture and Resources Research and Development. State of development of the Laguna de Bay area. Proceedings of the Seminar-Workshop on State of Development of the Laguna de Bay area, Los Banos, Laguna, Philippines.
Contado, C. and S. C. Suigi. 2002. Extension work of DA attached agencies and bureaus.
Study Report, A Comprehensive Assessment of the Philippine Agricultural Extension System (Phase I), Philippine Institute for Development Studies, NEDA sa Makati Bldg., Makati City.
David, D. C., A. Mascarinas, R. F. D. Hondrade, E. Saz, D. Vargas and N. Carambas. 2006.
Integrative report: the structure and conduct of local government units (LGUs) agricultural extension services. A Comprehensive Assessment of the Philippine Agricultural Extension System (Phase I), Philippine Institute for Development Studies, NEDA sa Makati Bldg., Makati City.
Davies, J., F. Lacanilao and A. Santiago. No Date. Laguna de Bay: problems and options.
Haribon While Paper No. 2. 29 p. De La Cruz, C. R. 1981. Fish pen and cage culture development project, laguna de Bay,
Republic of the Philippines. Paper Presented in Field Level Workshops for the Fish Pen/Cage Development in Laguna de Bay, FAO/TCP South China Fisheries Development and Coordinating Programme, October 1981. http://www.fao.org/docrep/field/003/ab755e/ab755e00.htm
Delmendo, M. D. 1987. Milkfish culture in pens: an assessment of its contribution to overall
fishery production of Laguna de Bay. Lecture Given in the SEAFDEC Aquaculture Training Course, Tapao, Binangonan, Rizal, 30 September 1987.
____________________1982. Fish-pen aquaculture development on Laguna de Bay,
Philippines. In A. G. Coche (Ed.). In Coastal Aquaculture: Development Perspectives in Africa and Case Studies from Other Regions, Vol. CIFA Technical Paper No. 9, Food and Agriculture Organization, Rome.
____________________. 1977. An evaluation of the fisheries resources of Laguna de Bay.
Philipp. J. Fish., 14(2): 213-231. Delmendo, M. N. and R. H. Gedney. 1976. Laguna de Bay fish pen aquaculture
development-Philippines, In Proc. Annu. Meet. World Aquaculture Soc., 7(1974): 257-65.

62
Garcia, A. M. and R. T. Medina. 1987. The state of development program of cage culture in Laguna Lake. p. 17-24. In Philippine Council for Agriculture and Resources Research and Development. State of development of the Laguna de Bay area. Proceedings of the Seminar-Workshop on State of Development of the Laguna de Bay area, Los Banos, Laguna, Philippines.
Gonzales, E. R. 1984. Small scale tilapia technology adopted in fishing villages in Laguna
Lake, Philippines. In Aquaculture 41:167-179 Laguna Lake Development Authority. 2006. Laguna de Bay environmental monitor 2006.
Published by the Laguna Lake Development Authority and the Federation of River Basin Councils in the Laguna de Bay Region, 30 p.
____________________ 2006a. Masterlist of Fishpen Operators. ____________________ 2006b. Inventory of Registered Fishcages in Laguna de bay. ____________________ 2005. Laguna de Bay environmental monitor 2005. Published by
the Laguna Lake Development Authority and the Federation of River Basin Councils in the Laguna de Bay Region, 34 p.
____________________ 2004. Laguna de Ba’i the Living Lake. Published by the Laguna
Lake Development Authority, 37 p. ____________________ 1995. The Laguna de Bay masterplan. final report.
http://www.llda.gov.ph/masterplan.htm ____________________ No Date. Laguna de Bay the Living Lake. Laguna Lake
Development Authority Brochure. Lazaga, J. F. and L. L. Roa. 1985. Financial and economic analysis of grow-out tilapia cage
farming in Laguna de Bay, Philippines. p. 107-114. In Smith, I. R., Torres, E. B., and E. O. Tan (eds.) Philippine Tilapia Economics. ICLARM Conference Proceedings 12, 261 p., Philippine Council for Agriculture and Resources Research and Development, Los, Banos, Laguna, and International Center for Living Aquatic Resources, Management, Manila, Philippines.
Lee, M. D. 1997. An overview of important watershed management issues in rapidly
urbanizing metropolitan areas with reference to the Laguna de Bay region. Presented at the Workshop on Water, Energy and Environmental technologies, Manila, Philippines, 10-11 November 1997.
Librero, A. R. and E. Nicholas. 1981. The economics of fishpen farming in Laguna de Bay,
Philippines. SCS/PCC/WP-9, Laguna, Philippines. Mane, A. M. 1987. Fishpen culture in Laguna de Bay. p. 25-29. In Philippine Council for
Agriculture and Resources Research and Development. State of development of the Laguna de Bay area. Proceedings of the Seminar-Workshop on State of Development of the Laguna de Bay area, Los Banos, Laguna, Philippines.
63
____________________. 1982. Management and maintenance of fishpens in Laguna de Bay. Report: Training Course on Small-Scale Pen and Cage Culture in Laguna, Philippines. pp. 57-63 http://www.fao.org/cgi_bin/faobib.exe
Mercene, E. C. 1987. A survey of Laguna de Bay open water fishery. In Fish res. Philipp.,
Volume 12, Nos. 1-2, p 17-27. National Statistical Coordination Board. 2006. 2006 Philippine statistical yearbook. Nepomuceno, D. 2004. Addressing freshwater conflicts: The LLDA experience in Laguna de
Bay. Presented in the Workshop on Natural Resource-Based Conflicts in the Philippines Sponsored by the United States Agency for International Development (USAID) and the Department of Environment and Natural Resources (DENR), May 13-14, 2004, Westin Philippine Plaza, Psay City, Philippines.
____________________. 2004a. Development challenges and response strategies: the
Laguna de Bay experience. Laguna Lake Development Authority, Pasig City, Philippines. 21 p.
Nicholas, E. S. and A. R. Librero. 1977. A socio-economic study of fish pen aquaculture in
Laguna Lake, Philippines. Paper presented at the Second Biennial Meeting of the Agricultural Economics Society of Southeast Asia held on 3-6 November, 1977 at Tigbauan, Iloilo, Philippines. 16 p.
Rivera, F. T. 1987. Socio-cultural aspects of the fish industry around Laguna de Bay. p. 60-
62. In Philippine Council for Agriculture and Resources Research and Development. State of development of the Laguna de Bay area. Proceedings of the Seminar-Workshop on State of Development of the Laguna de Bay area, Los Banos, Laguna, Philippines.
Santos-Borja, A. and D. N. Nepomuceno. 2003. Laguna de Bay: experience and lessons in
brief. Laguna lake Development Authority, Pasig City, Philippines. http://www.worldlakes.org/uploads/laguna_1.13.04.pdf
Technology Resource Center. 1987. Fishery resources of Laguna de Bay, problems and
expectations. p. 6-9. In Philippine Council for Agriculture and Resources Research and Development. State of development of the Laguna de Bay area. Proceedings of the Seminar-Workshop on State of Development of the Laguna de Bay area, Los Banos, Laguna, Philippines.


