
Comparative Political Systems in Canada and the US
Don Alper
Professor Emeritus of Political ScienceResearch Fellow, Border Policy Research Institute
Western Washington University
Presented at the 2016 STUDY CANADA Summer InstituteVictoria, BC
June 28, 2016

Two Democracies, Different Forms of Government
• Canada: Parliamentary Democracy & Constitutional Monarchy– Gov General (representative of Queen) is head of state– Prime Minister is head of government (as leader of largest party in
Parliament)– “Fusion of powers”: majority party controls government
• US: Presidential-Congressional System based on Separation of Powers- a Republican System– President is head of state– President is elected independently of Congress– “Separation of powers” means competition to control government

Both Canada & US are Federal Systems
CANADA:10 provinces, 3 territories
US:50 states andseveral offshore territories
INDIGENOUS GOVTS:Both nations contain numeroustribes and First Nations with
autonomous govts
*Both nations also contain numerous Tribal & First Nations’ governments
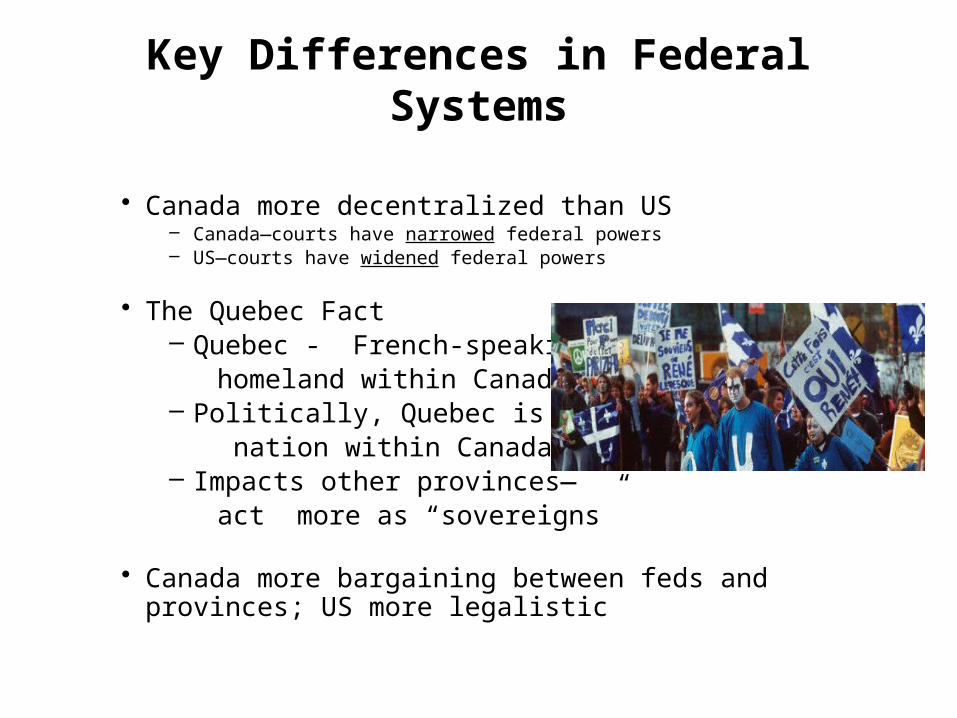
Key Differences in Federal Systems
• Canada more decentralized than US– Canada—courts have narrowed federal powers– US—courts have widened federal powers
• The Quebec Fact– Quebec - French-speaking homeland within Canada– Politically, Quebec is a nation within Canada– Impacts other provinces—
act more as “sovereigns”
• Canada more bargaining between feds and provinces; US more legalistic

Basic Differences -- Legislative Bodies
US Congress(House and Senate)
• House and Senate – equal powers to legislate
• House terms 2 years
• Senate terms 6 years (1/3) every 2 years)
Canadian Parliament(Commons and Senate)
• House of Commons focus of power; controlled by largest party
• Unelected Senate, mostly advisory
• Opposition principle built into House of Commons
• Question Period

Parliamentary v. Presidential-Congressional Systems:
A Comparative Framework
United States - Separation of Powers Canada - Fusion of Powers

Party Seats Popular Vote
Liberal 184 39%
Conservative 99 32%
New Democratic Party 44 20%
Bloc Québécois 10 5%
Green Party 1 3%
Independent/Other 0 1%
TOTAL 338
A Minority Government 2008 A Majority Government 2015
Majority & Minority Governments
TEACHING TIP: Have students work out the numbers and likely partners in a possible coalition government
Party Seats Popular Vote
Conservative 143 38%
Liberal 77 26%
Bloc Québécois 49 10%
New Democratic Party 37 18%
Green Party 0 7%
Independent/Other 2 1%
TOTAL 308
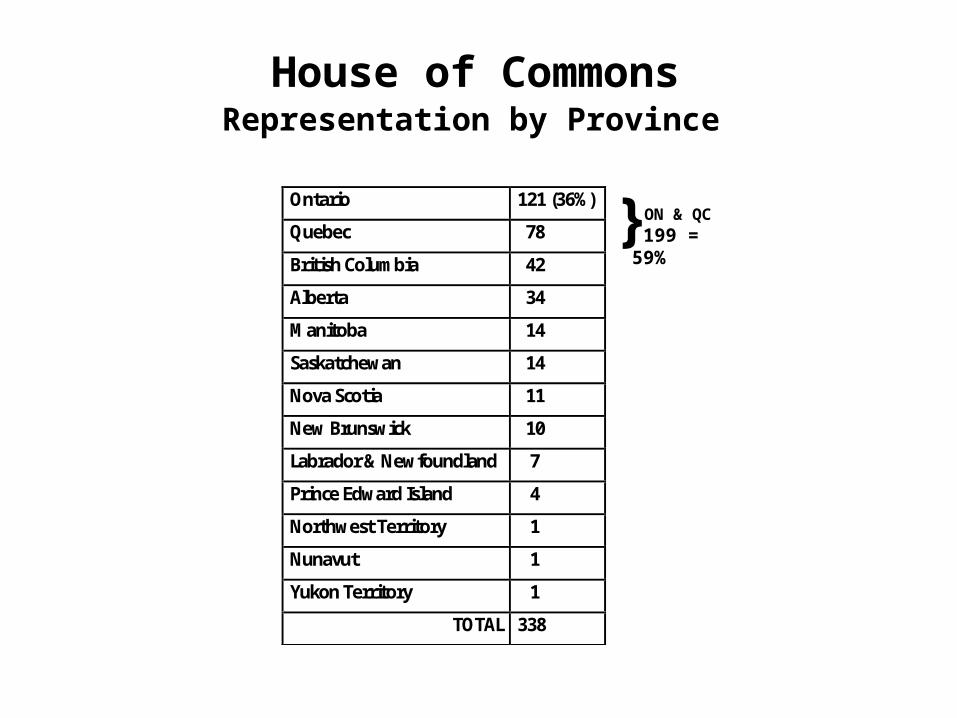
House of Commons Representation by Province
ON & QC 199 = 59%}Ontario 121 (36%)
Quebec 78
British Columbia 42
Alberta 34
Manitoba 14
Saskatchewan 14
Nova Scotia 11
New Brunswick 10
Labrador & Newfoundland 7
Prince Edward Island 4
Northwest Territory 1
Nunavut 1
Yukon Territory 1
TOTAL 338

Government and Opposition
Note the “face-off” architecture of the House of Commons

Question Period: A Unique Parliamentary Institution
See: Model Parliamentary Unit Teaching Filehttp://www.parl.gc.ca/information/about/education/mpu/index_e.asp
TEACHING TIPHave students simulate question period.
Assign roles such as PM, Leaders of Opposition parties, cabinet ministers, etc.

The Right Honourable Justin Trudeau
Ms. Rona Ambrose Interim Leader –
Conservative Party
Political Party LeadersWith Representation in the House of Commons
M. Rheal FortínInterim Leader - Bloc Québécois
Mrs. Elizabeth MayThe Honourable Thomas Mulcair

Province or Territory Number of Senators
British Columbia 6Alberta 6Ontario 24Quebec 24Manitoba 6Saskatchewan 6Nova Scotia 10Newfoundland and Labrador 6New Brunswick 10Northwest Territories 1Prince Edward Island 4Yukon 1Nunavut 1Total 105
Canadian SenateDistribution of Seats (2015)
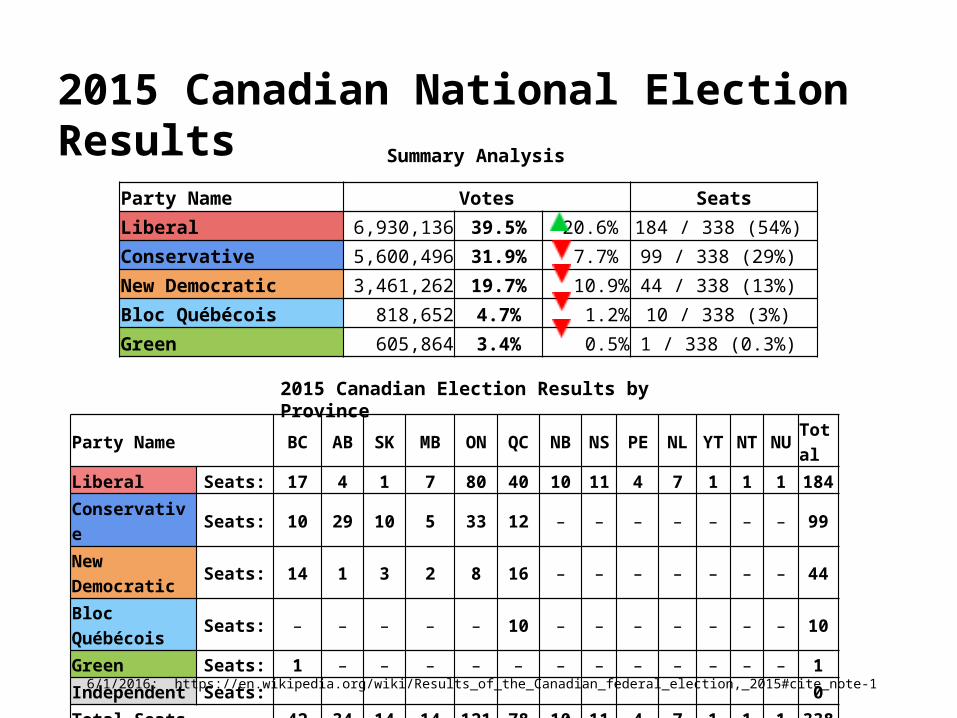
Party Name Votes SeatsLiberal 6,930,136 39.5% 20.6% 184 / 338 (54%) Conservative 5,600,496 31.9% 7.7% 99 / 338 (29%) New Democratic 3,461,262 19.7% 10.9% 44 / 338 (13%) Bloc Québécois 818,652 4.7% 1.2% 10 / 338 (3%) Green 605,864 3.4% 0.5% 1 / 338 (0.3%)
Party Name BC AB SK MB ON QC NB NS PE NL YT NT NU TotalLiberal Seats: 17 4 1 7 80 40 10 11 4 7 1 1 1 184Conservative Seats: 10 29 10 5 33 12 – – – – – – – 99New Democratic Seats: 14 1 3 2 8 16 – – – – – – – 44Bloc Québécois Seats: – – – – – 10 – – – – – – – 10Green Seats: 1 – – – – – – – – – – – – 1Independent Seats: 0Total Seats 42 34 14 14 121 78 10 11 4 7 1 1 1 338
Summary Analysis
6/1/2016: https://en.wikipedia.org/wiki/Results_of_the_Canadian_federal_election,_2015#cite_note-1
2015 Canadian National Election Results
2015 Canadian Election Results by Province

My Recommended Reference for Students and Teachers
Discover,How Canadians Govern Themselves
http://www.lop.parl.gc.ca/About/Parliament/senatoreugeneforsey/inside_view/canada_usa-e.html


