Animal Genomics and Biotechnology Education
The California Commercial Beef Cattle Ranch Project
Alison Van Eenennaam Animal Genomics and Biotechnology
Cooperative Extension Specialist Department of Animal Science
University of California, Davis, CA, USA
Kristina L. Weber, PhD student
Daniel Drake, Extension agent
AAABG 21/10/2013
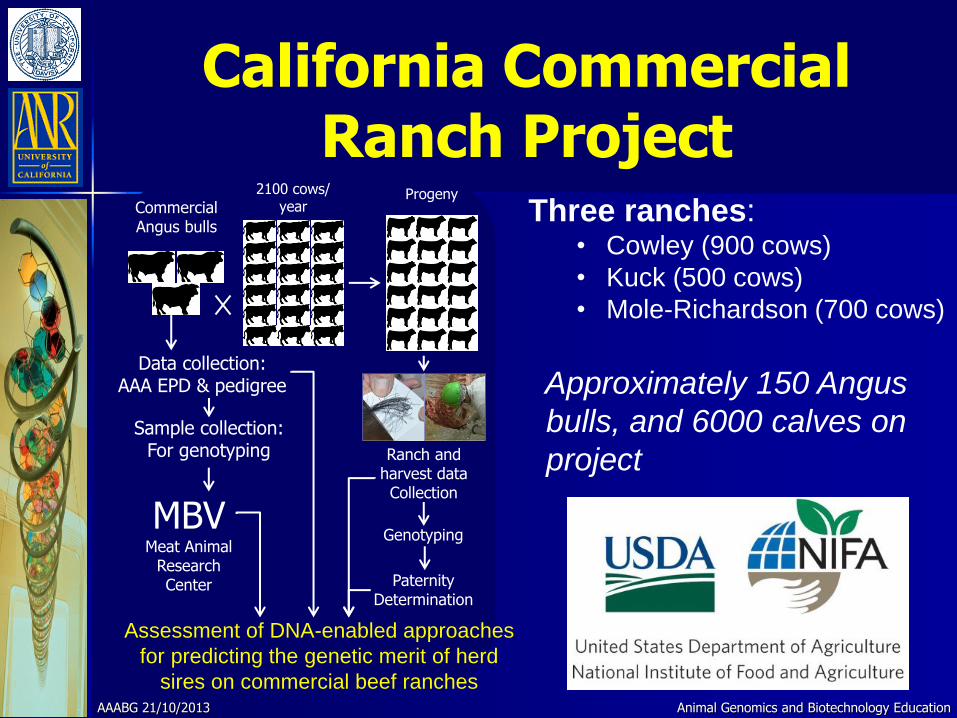
California Commercial Ranch Project
Commercial Angus bulls
Genotyping
2100 cows/ year
Progeny
Paternity Determination
Ranch and harvest data Collection
Data collection: AAA EPD & pedigree
Sample collection: For genotyping
MBV Meat Animal
Research Center
Assessment of DNA-enabled approaches
for predicting the genetic merit of herd
sires on commercial beef ranches
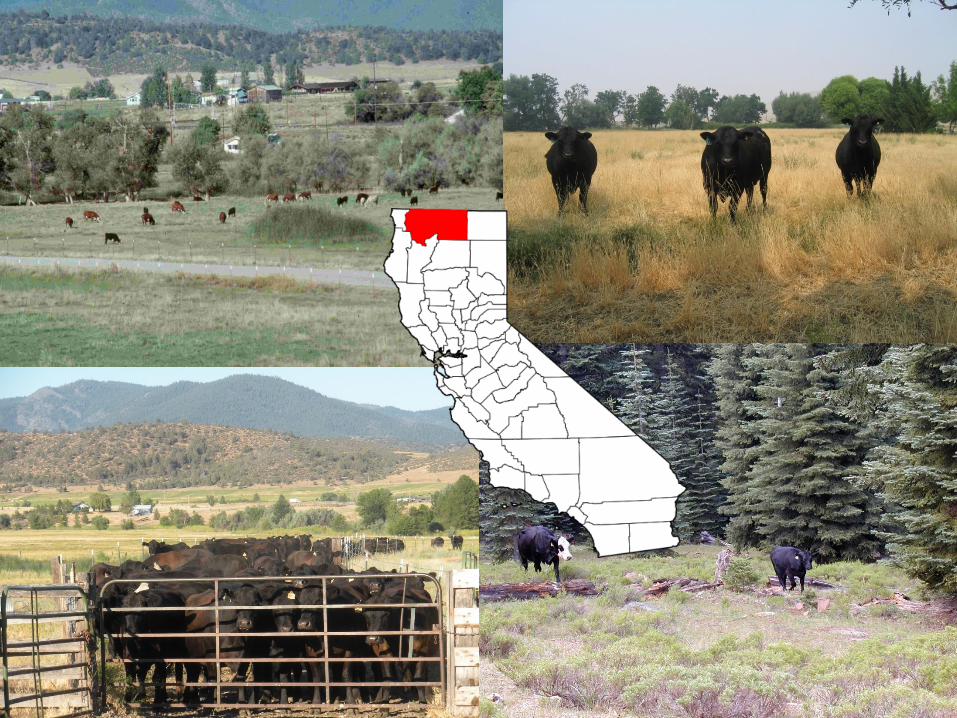
Three ranches: • Cowley (900 cows)
• Kuck (500 cows)
• Mole-Richardson (700 cows)
Approximately 150 Angus
bulls, and 6000 calves on
project
Animal Genomics and Biotechnology Education AAABG 21/10/2013
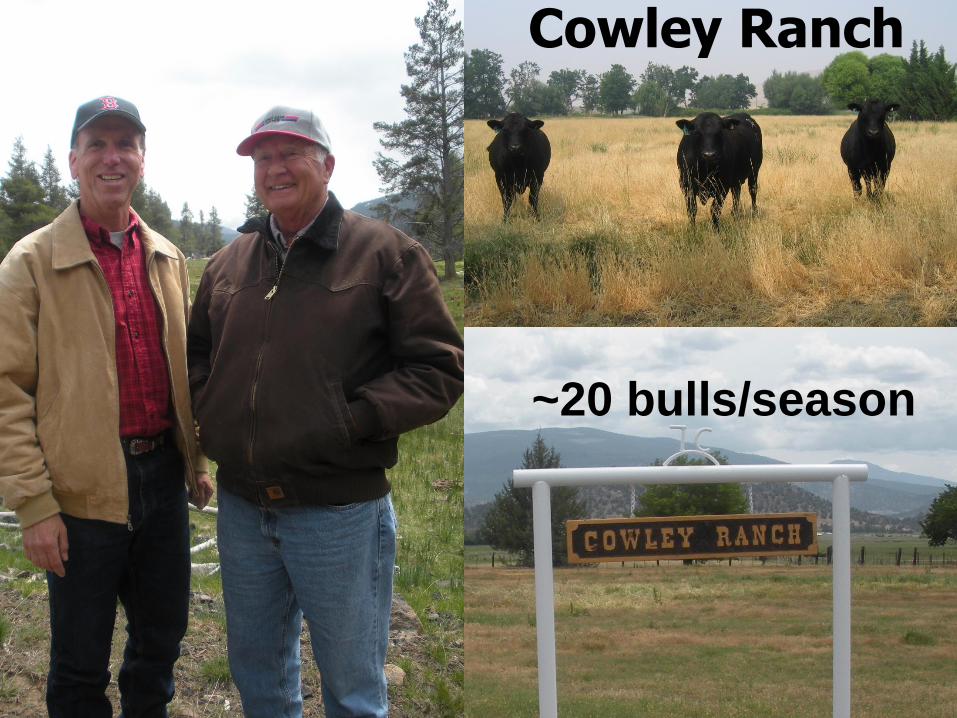
Cowley Ranch
~20 bulls/season
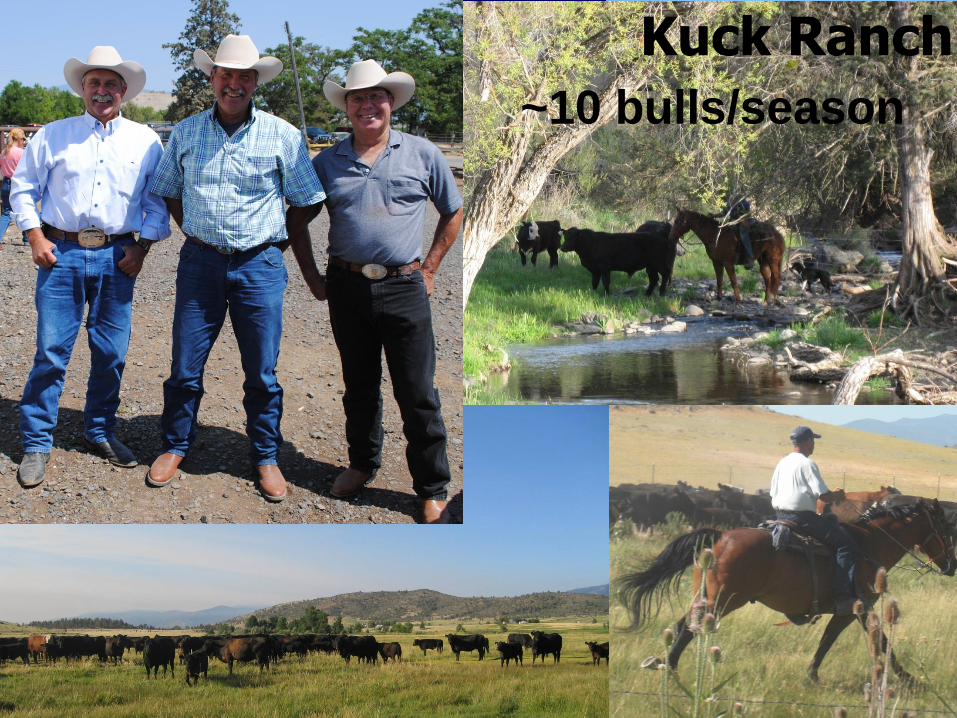
Kuck Ranch
~10 bulls/season
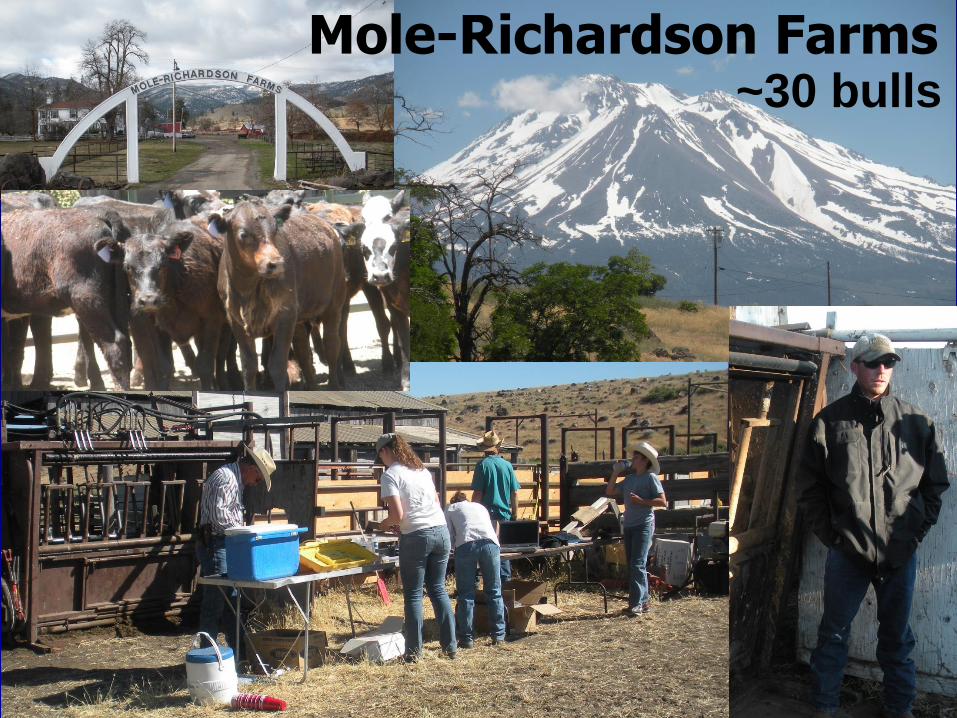
~30 bulls Mole-Richardson Farms
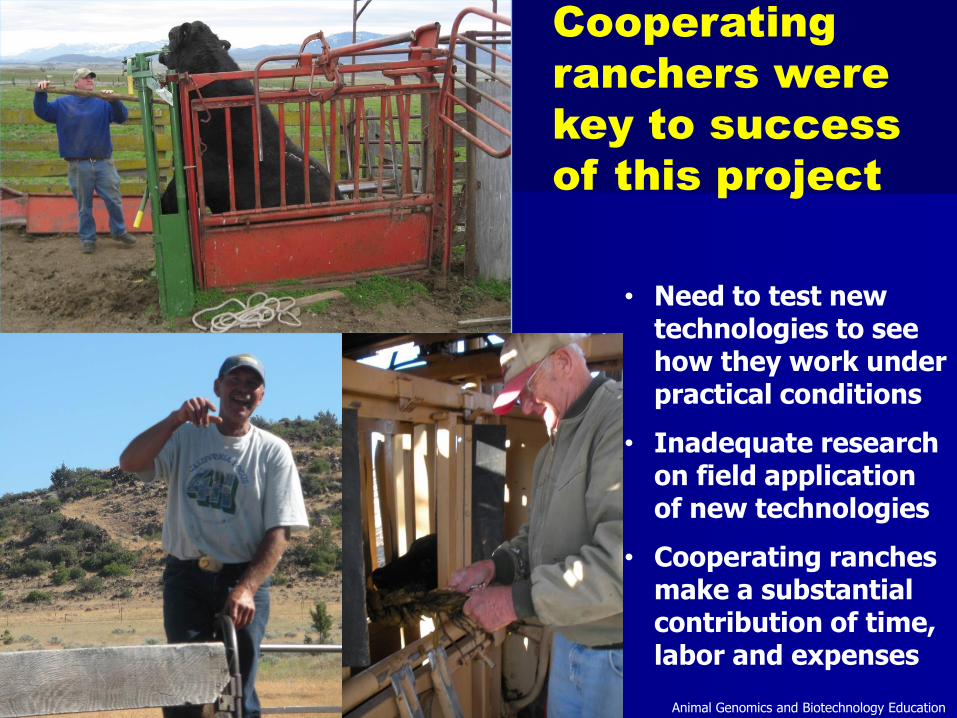
• Need to test new
technologies to see how they work under practical conditions
• Inadequate research on field application of new technologies
• Cooperating ranches make a substantial contribution of time, labor and expenses
Cooperating
ranchers were
key to success
of this project
Animal Genomics and Biotechnology Education

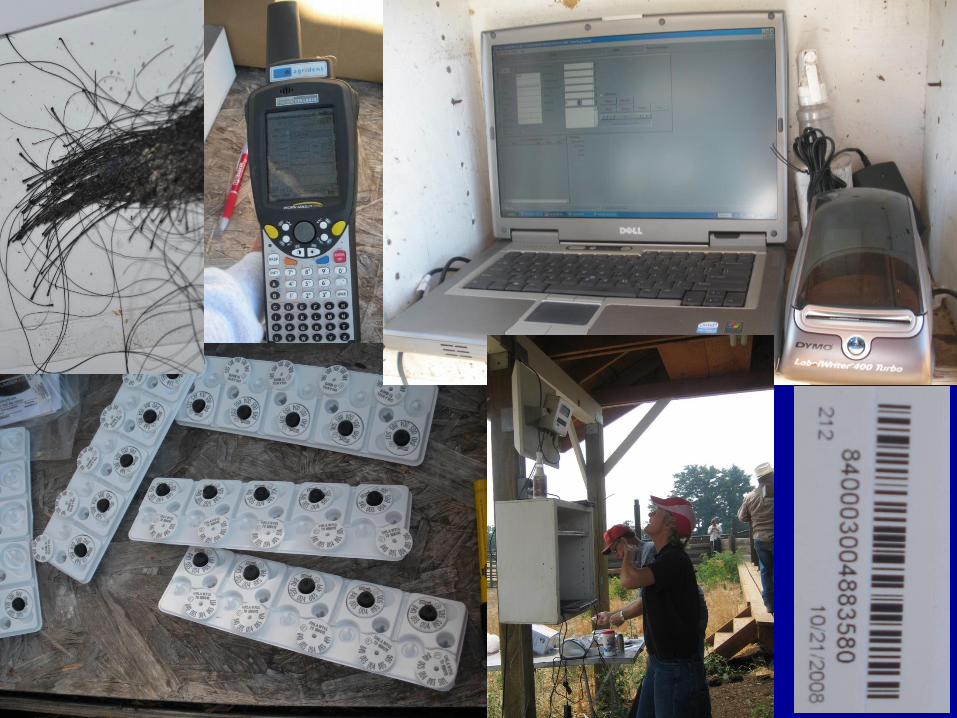
We had occasional trouble capturing electronic weights
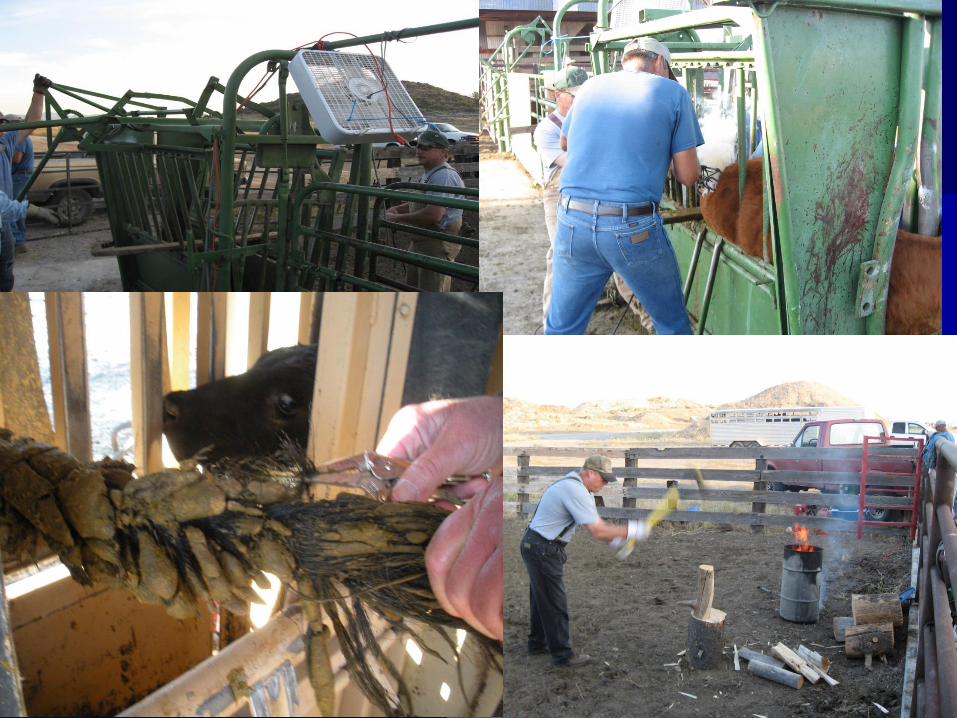
Technology problems were constant but
declined as we obtained experience
Each additional piece of equipment exponentially increased problems
Background knowledge and expertise in computing level for troubleshooting was very high
Electronics were remarkably durable
Record keeping was an important attribute to make this project work
Technology Tools Learnings EIDs, electronic scales, computers, handhelds, DNA sampling, genotyping
AAABG 21/10/2013 Animal Genomics and Biotechnology Education
Animal Genomics and Biotechnology Education AAABG 21/10/2013
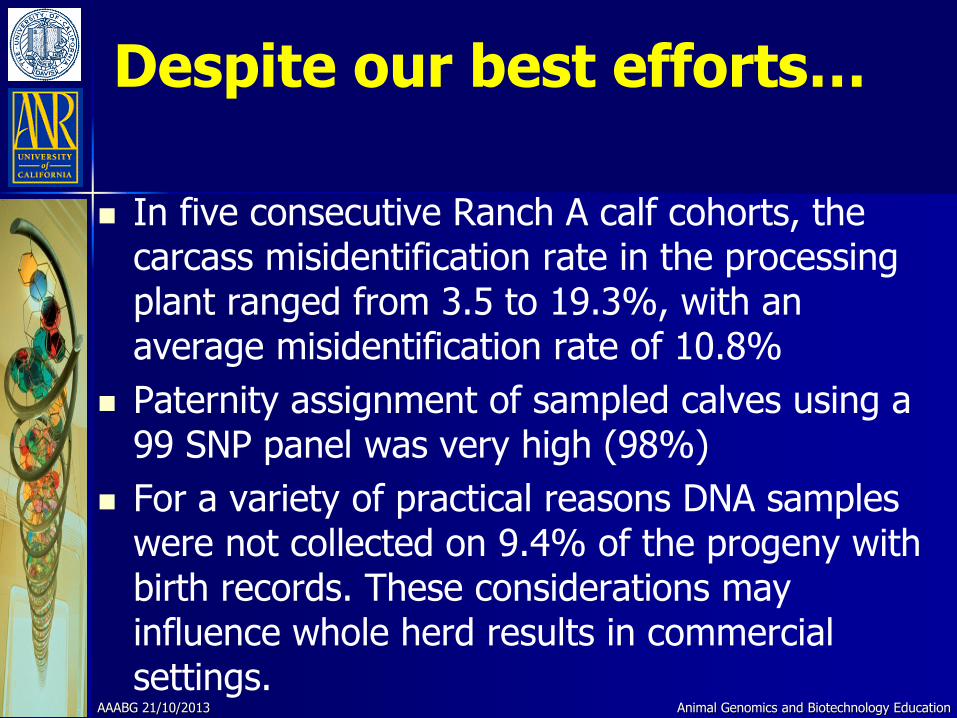
Despite our best efforts…
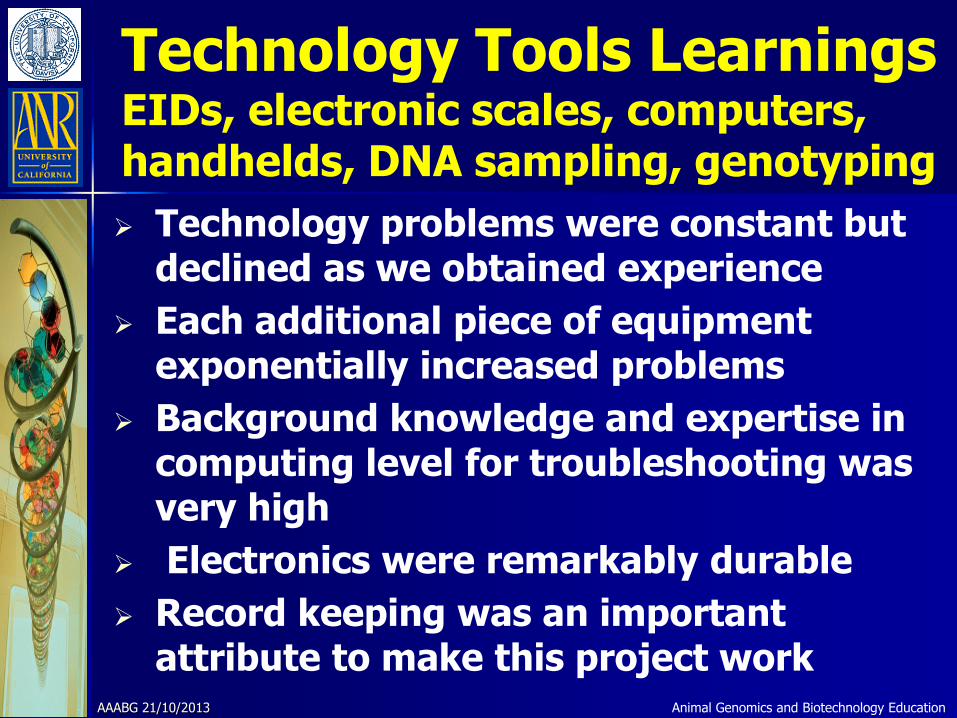
In five consecutive Ranch A calf cohorts, the carcass misidentification rate in the processing plant ranged from 3.5 to 19.3%, with an average misidentification rate of 10.8%
Paternity assignment of sampled calves using a 99 SNP panel was very high (98%)
For a variety of practical reasons DNA samples were not collected on 9.4% of the progeny with birth records. These considerations may influence whole herd results in commercial settings.
AAABG 21/10/2013 Animal Genomics and Biotechnology Education
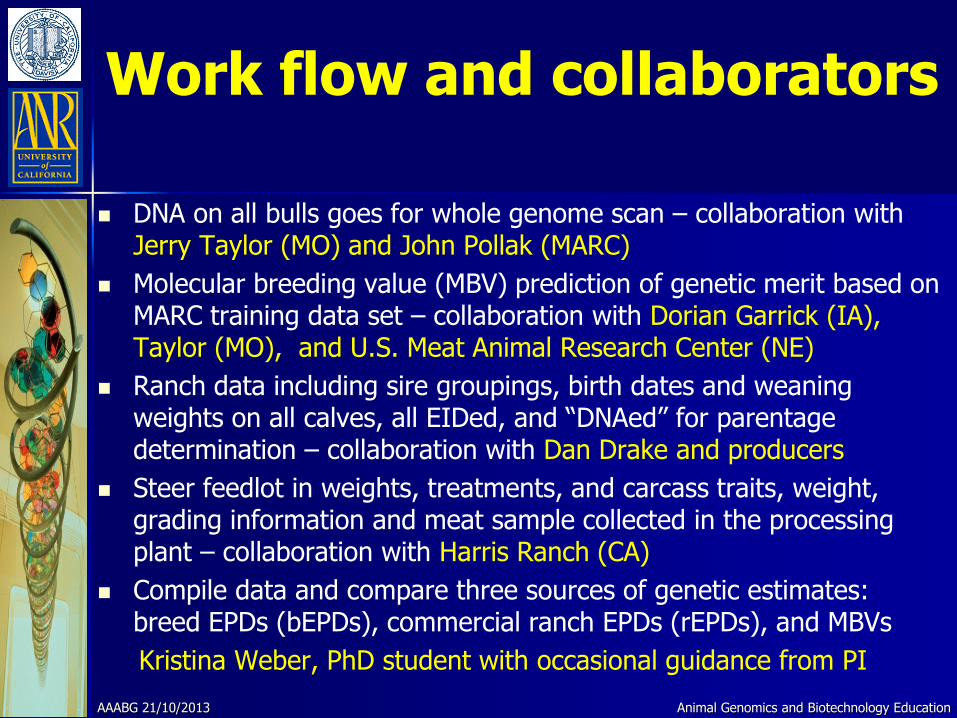
Work flow and collaborators
DNA on all bulls goes for whole genome scan – collaboration with Jerry Taylor (MO) and John Pollak (MARC)
Molecular breeding value (MBV) prediction of genetic merit based on MARC training data set – collaboration with Dorian Garrick (IA), Taylor (MO), and U.S. Meat Animal Research Center (NE)
Ranch data including sire groupings, birth dates and weaning weights on all calves, all EIDed, and “DNAed” for parentage determination – collaboration with Dan Drake and producers
Steer feedlot in weights, treatments, and carcass traits, weight, grading information and meat sample collected in the processing plant – collaboration with Harris Ranch (CA)
Compile data and compare three sources of genetic estimates: breed EPDs (bEPDs), commercial ranch EPDs (rEPDs), and MBVs
Kristina Weber, PhD student with occasional guidance from PI
Animal Genomics and Biotechnology Education AAABG 21/10/2013
Animal Genomics and Biotechnology Education
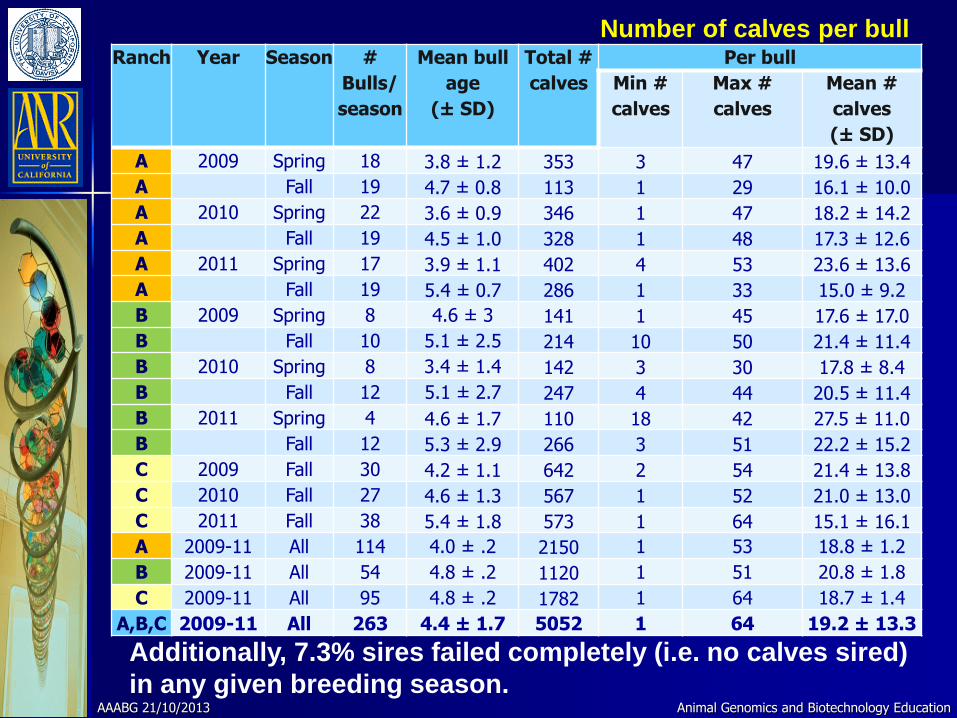
Additionally, 7.3% sires failed completely (i.e. no calves sired)
in any given breeding season. AAABG 21/10/2013
Ranch Year Season #
Bulls/
season
Mean bull
age
(± SD)
Total #
calves
Per bull
Min #
calves
Max #
calves
Mean #
calves
(± SD)
A 2009 Spring 18 3.8 ± 1.2 353 3 47 19.6 ± 13.4
A Fall 19 4.7 ± 0.8 113 1 29 16.1 ± 10.0
A 2010 Spring 22 3.6 ± 0.9 346 1 47 18.2 ± 14.2
A Fall 19 4.5 ± 1.0 328 1 48 17.3 ± 12.6
A 2011 Spring 17 3.9 ± 1.1 402 4 53 23.6 ± 13.6
A Fall 19 5.4 ± 0.7 286 1 33 15.0 ± 9.2
B 2009 Spring 8 4.6 ± 3 141 1 45 17.6 ± 17.0
B Fall 10 5.1 ± 2.5 214 10 50 21.4 ± 11.4
B 2010 Spring 8 3.4 ± 1.4 142 3 30 17.8 ± 8.4
B Fall 12 5.1 ± 2.7 247 4 44 20.5 ± 11.4
B 2011 Spring 4 4.6 ± 1.7 110 18 42 27.5 ± 11.0
B Fall 12 5.3 ± 2.9 266 3 51 22.2 ± 15.2
C 2009 Fall 30 4.2 ± 1.1 642 2 54 21.4 ± 13.8
C 2010 Fall 27 4.6 ± 1.3 567 1 52 21.0 ± 13.0
C 2011 Fall 38 5.4 ± 1.8 573 1 64 15.1 ± 16.1
A 2009-11 All 114 4.0 ± .2 2150 1 53 18.8 ± 1.2
B 2009-11 All 54 4.8 ± .2 1120 1 51 20.8 ± 1.8
C 2009-11 All 95 4.8 ± .2 1782 1 64 18.7 ± 1.4
A,B,C 2009-11 All 263 4.4 ± 1.7 5052 1 64 19.2 ± 13.3
Number of calves per bull
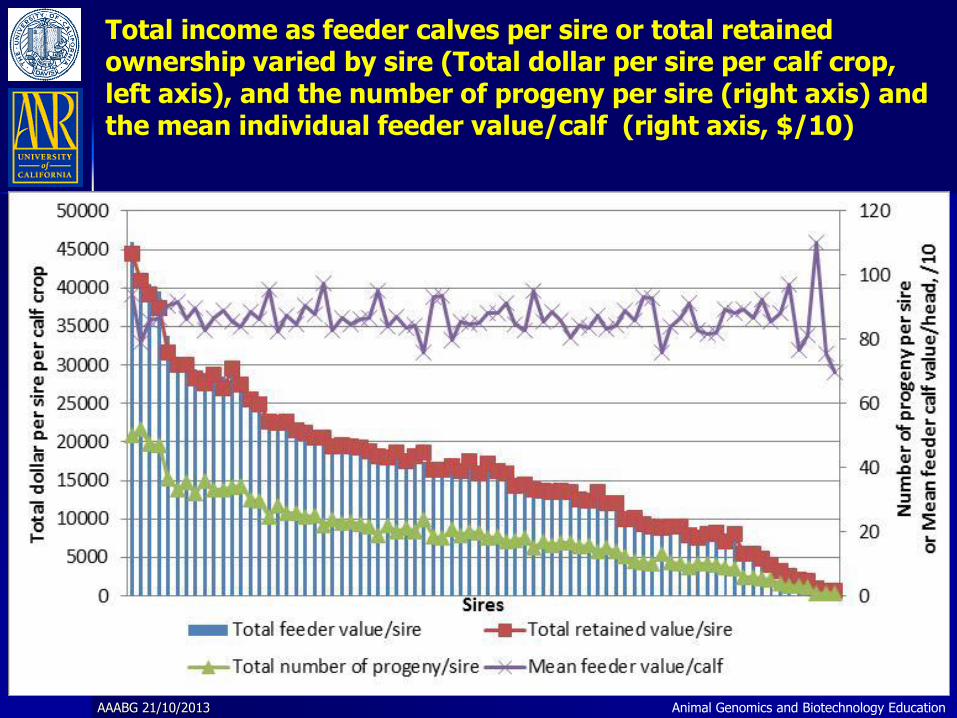
Total income as feeder calves per sire or total retained ownership varied by sire (Total dollar per sire per calf crop, left axis), and the number of progeny per sire (right axis) and the mean individual feeder value/calf (right axis, $/10)
AAABG 21/10/2013 Animal Genomics and Biotechnology Education
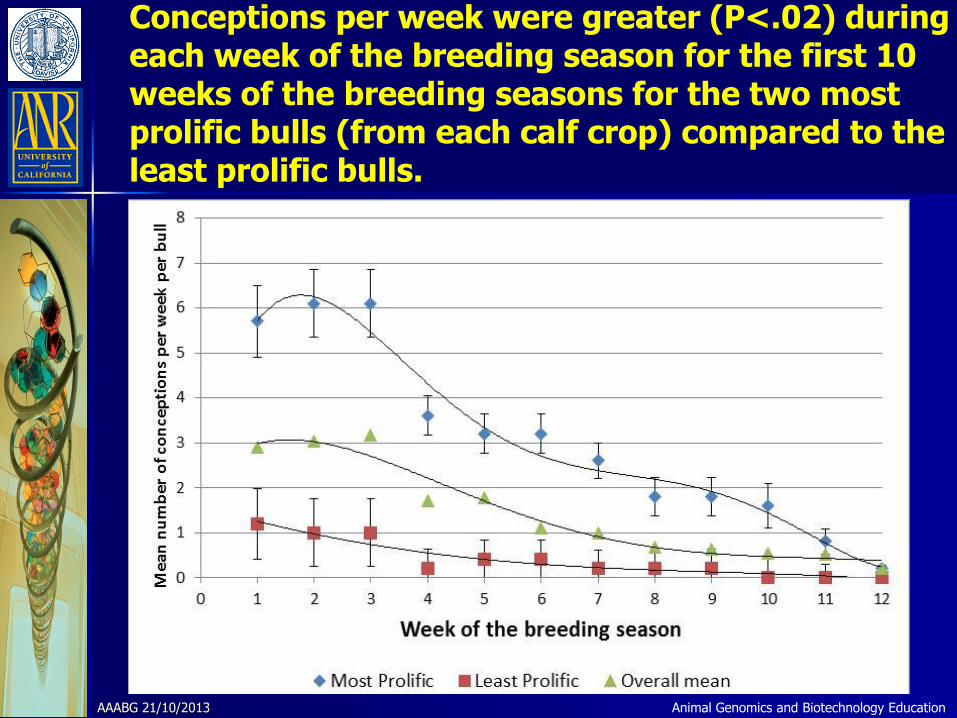
Conceptions per week were greater (P<.02) during each week of the breeding season for the first 10 weeks of the breeding seasons for the two most prolific bulls (from each calf crop) compared to the least prolific bulls.
AAABG 21/10/2013 Animal Genomics and Biotechnology Education
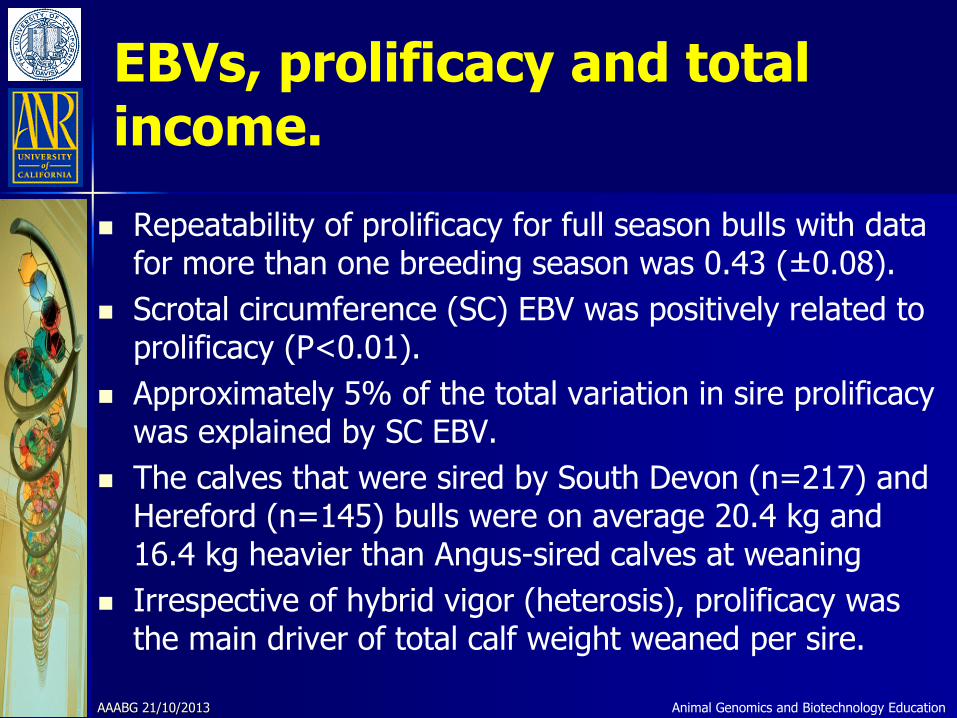
EBVs, prolificacy and total income.
Repeatability of prolificacy for full season bulls with data for more than one breeding season was 0.43 (±0.08).
Scrotal circumference (SC) EBV was positively related to prolificacy (P<0.01).
Approximately 5% of the total variation in sire prolificacy was explained by SC EBV.
The calves that were sired by South Devon (n=217) and Hereford (n=145) bulls were on average 20.4 kg and 16.4 kg heavier than Angus-sired calves at weaning
Irrespective of hybrid vigor (heterosis), prolificacy was the main driver of total calf weight weaned per sire.
AAABG 21/10/2013 Animal Genomics and Biotechnology Education
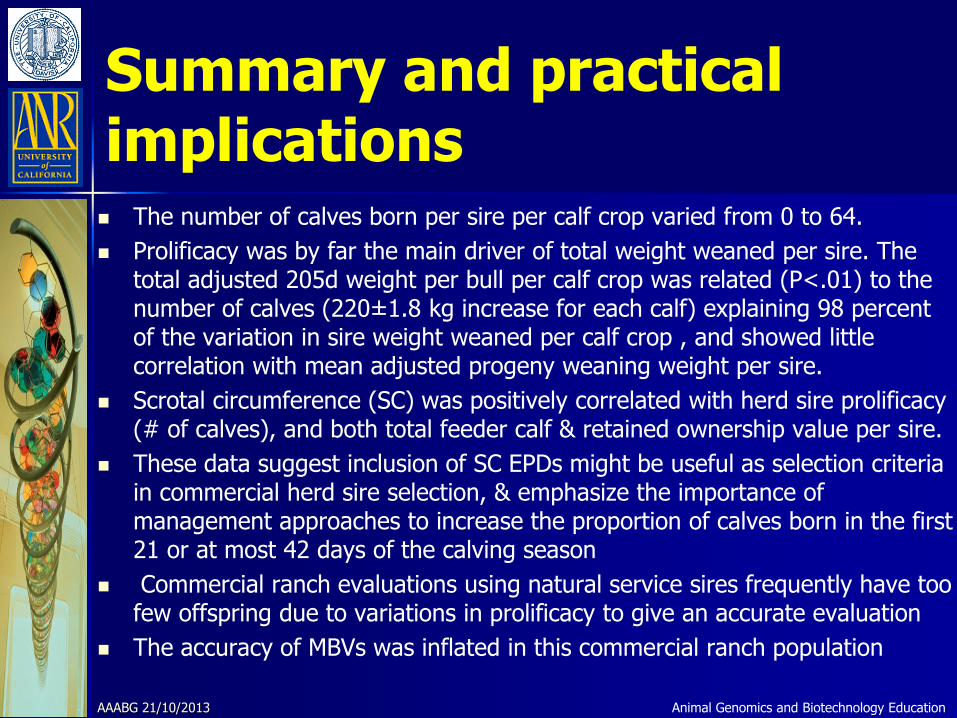
Summary and practical implications The number of calves born per sire per calf crop varied from 0 to 64.
Prolificacy was by far the main driver of total weight weaned per sire. The total adjusted 205d weight per bull per calf crop was related (P<.01) to the number of calves (220±1.8 kg increase for each calf) explaining 98 percent of the variation in sire weight weaned per calf crop , and showed little correlation with mean adjusted progeny weaning weight per sire.
Scrotal circumference (SC) was positively correlated with herd sire prolificacy (# of calves), and both total feeder calf & retained ownership value per sire.
These data suggest inclusion of SC EPDs might be useful as selection criteria in commercial herd sire selection, & emphasize the importance of management approaches to increase the proportion of calves born in the first 21 or at most 42 days of the calving season
Commercial ranch evaluations using natural service sires frequently have too few offspring due to variations in prolificacy to give an accurate evaluation
The accuracy of MBVs was inflated in this commercial ranch population
AAABG 21/10/2013 Animal Genomics and Biotechnology Education
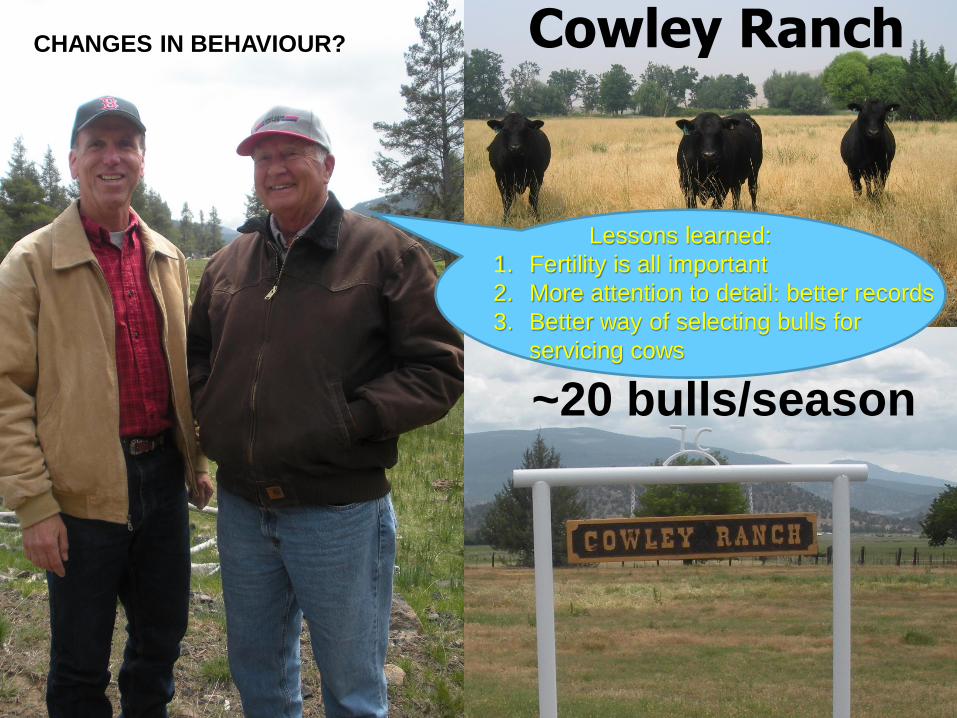
Cowley Ranch
~20 bulls/season
Lessons learned:
1. Fertility is all important
2. More attention to detail: better records
3. Better way of selecting bulls for
servicing cows
CHANGES IN BEHAVIOUR?
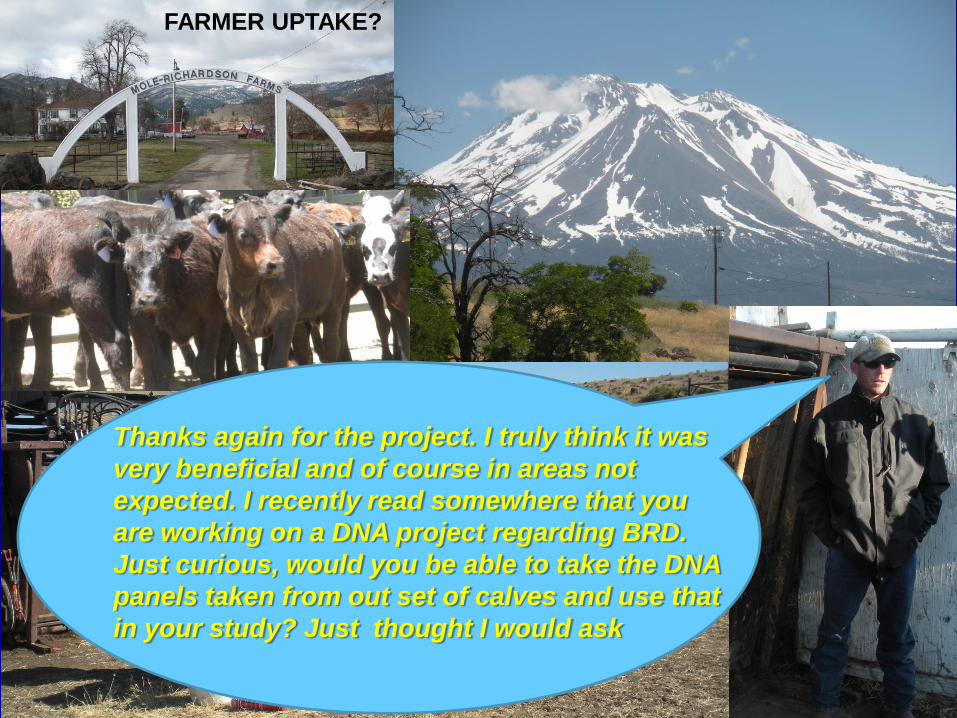
Thanks again for the project. I truly think it was
very beneficial and of course in areas not
expected. I recently read somewhere that you
are working on a DNA project regarding BRD.
Just curious, would you be able to take the DNA
panels taken from out set of calves and use that
in your study? Just thought I would ask
FARMER UPTAKE?
Animal Biotechnology and Genomics Education
Happy
California
Cow
“This project was supported by National Research Initiative Grant no. 2009-
55205-05057 to AVE from the USDA National Institute of Food and Agriculture.”
AAABG 21/10/2013 Animal Genomics and Biotechnology Education
Questions?


