1
Texture and Shape for Image Retrieval– Multimedia Analysis and Indexing
Winston H. HsuNational Taiwan University, Taipei
October 23, 2007
Office: R512, CSIE BuildingCommunication and Multimedia Lab (通訊與多媒體實驗室)http://www.csie.ntu.edu.tw/~winston
-2-MMAI, Fall 07 - Winston Hsu, NTU
Outline Texture
Statistical features Spectral features
Edge Shape

2
-3-MMAI, Fall 07 - Winston Hsu, NTU
Reminder Homework #2
Due: TA@501 (noon, Tuesday, November 13) Rule – “deliver quality work on time with integrity!!”
Midterm A small recap of what we mentioned (major literatures) High-level concepts mentioned in the course Open book (no computer) but requiring no print-out
Mailing list http://cmlmail.csie.ntu.edu.tw/mailman/listinfo/mmai
-4-MMAI, Fall 07 - Winston Hsu, NTU
1 9/25/07 holiday
2 10/02/07 introduction
3 10/09/07 mpeg; shot detection
4 10/16/07 cbr overview; color
5 10/23/07 texture+shape; relevance feedback
6 10/30/07 multidimensional indexing; feature reduction
7 11/06/07 midterm
8 11/13/07 gmm+cbir; svm+cbir (graphical/discriminative models)
9 11/20/07 structure discovery (sports; story)
10 11/27/07 TRECVID; concept detection; image annotation
11 12/04/07 concept detection; image annotation
12 12/11/07 un-/supervised clustering (clustering)
13 12/18/07 video retrieval
14 12/25/07 intro audio/music
15 01/01/08 holiday
16 01/08/08 project presentation #1, #2
17 01/15/08 final (no course)
18 01/22/08 project report due
Syllabus (tentative)
3
-5-MMAI, Fall 07 - Winston Hsu, NTU
Scenario of Content-Based Image Retrieval
Image Database
feature (vector) space
featureextraction
query image retrieved images
distancemetric
-6-MMAI, Fall 07 - Winston Hsu, NTU
NNormalised Results
0
0
0
1
1
1
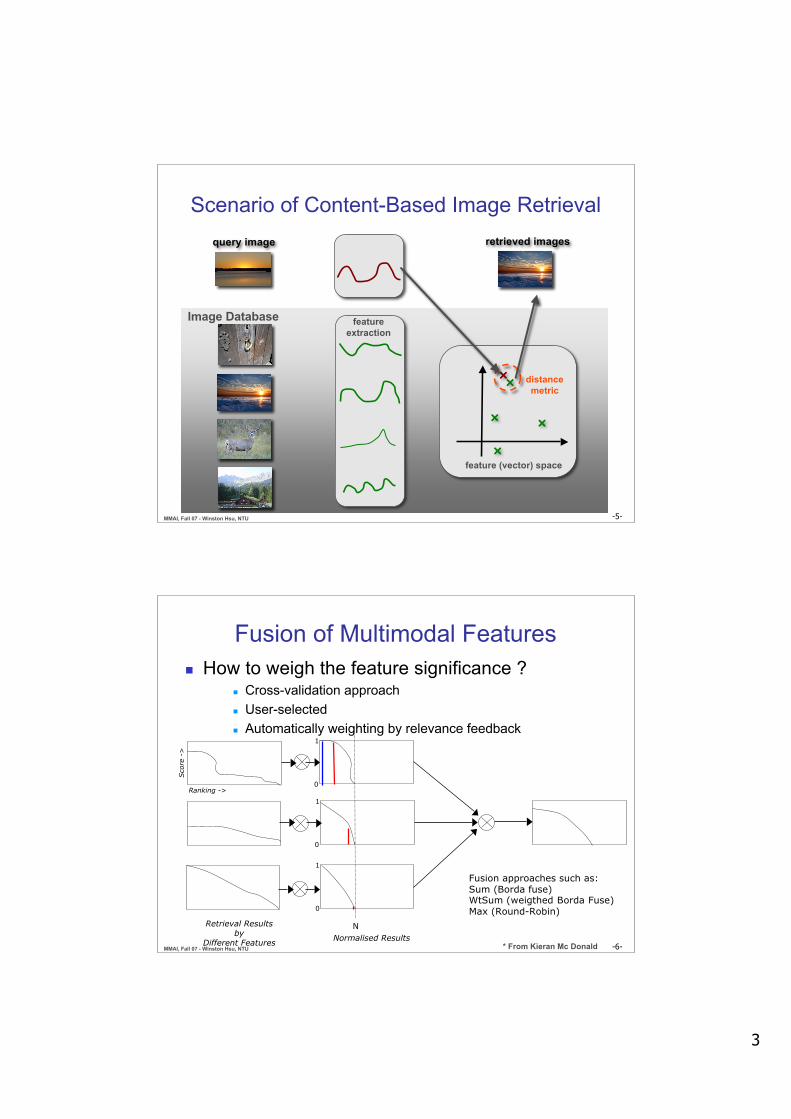
Fusion of Multimodal Features How to weigh the feature significance ?
Cross-validation approach User-selected Automatically weighting by relevance feedback
Retrieval Resultsby
Different Features
Ranking ->
Sco
re -
>
Fusion approaches such as:Sum (Borda fuse)WtSum (weigthed Borda Fuse)Max (Round-Robin)
* From Kieran Mc Donald
4
-7-MMAI, Fall 07 - Winston Hsu, NTU
-8-MMAI, Fall 07 - Winston Hsu, NTU
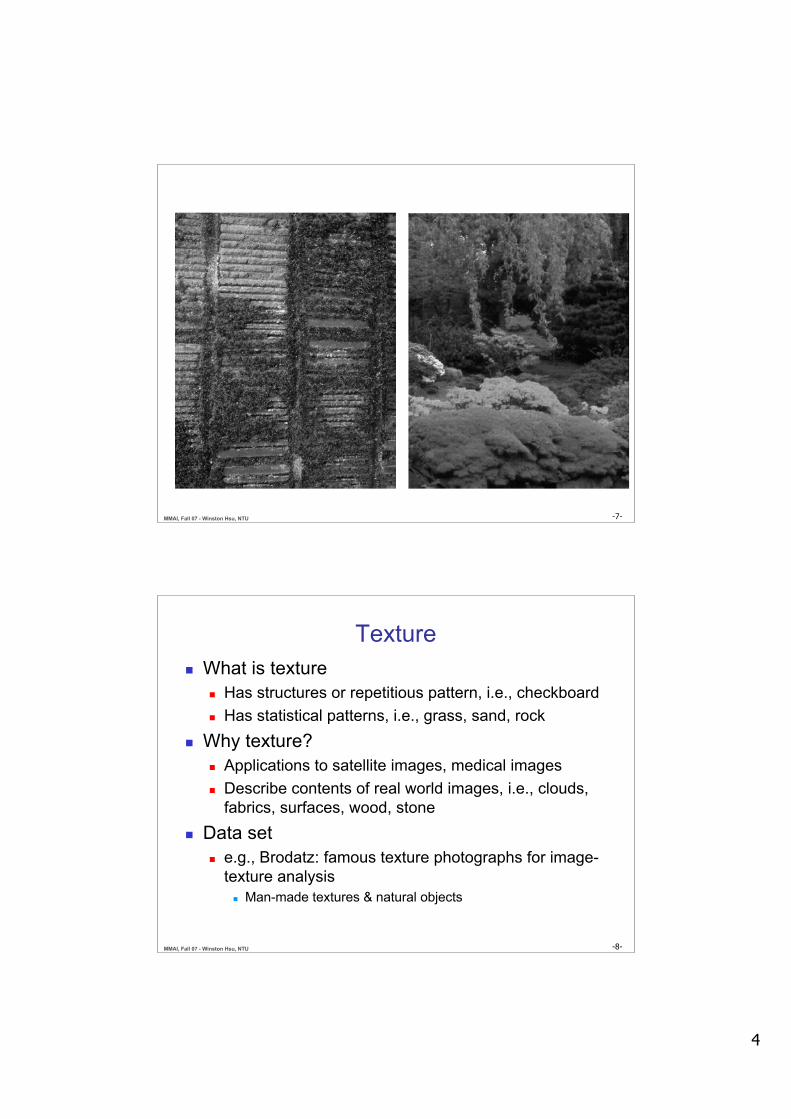
Texture What is texture
Has structures or repetitious pattern, i.e., checkboard Has statistical patterns, i.e., grass, sand, rock
Why texture? Applications to satellite images, medical images Describe contents of real world images, i.e., clouds,
fabrics, surfaces, wood, stone Data set
e.g., Brodatz: famous texture photographs for image-texture analysis
Man-made textures & natural objects
5
-9-MMAI, Fall 07 - Winston Hsu, NTU
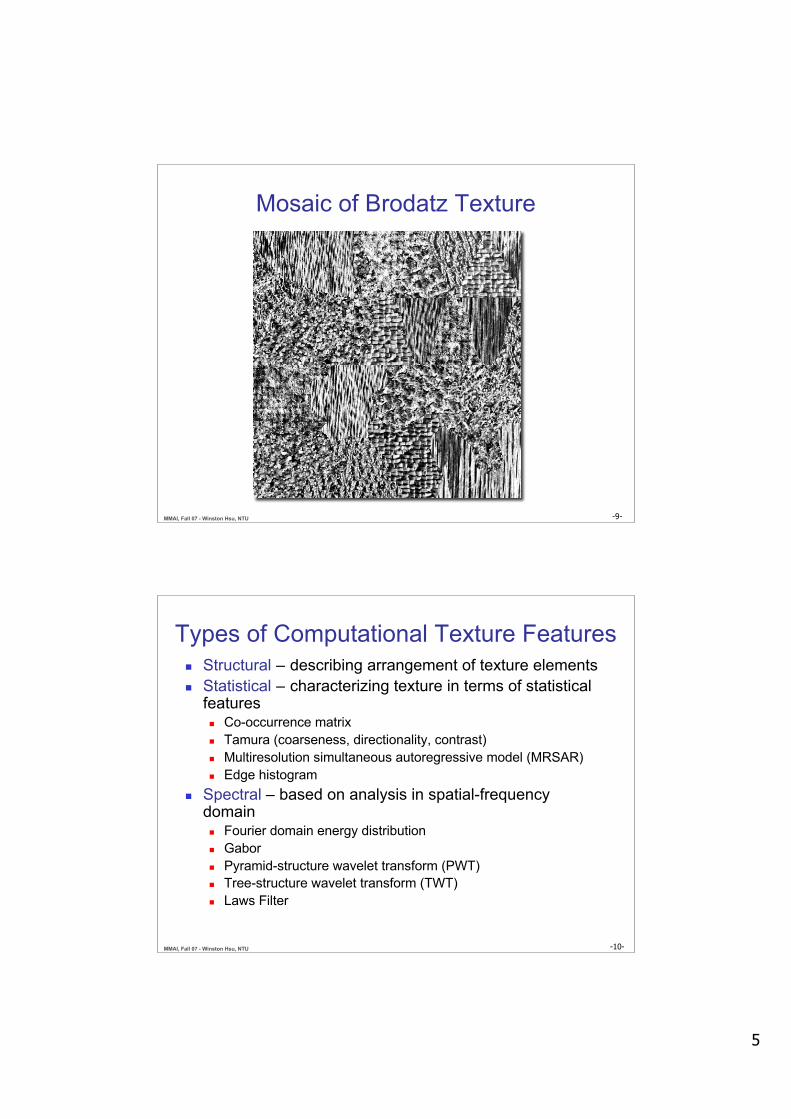
Mosaic of Brodatz Texture
-10-MMAI, Fall 07 - Winston Hsu, NTU
Types of Computational Texture Features Structural – describing arrangement of texture elements Statistical – characterizing texture in terms of statistical
features Co-occurrence matrix Tamura (coarseness, directionality, contrast) Multiresolution simultaneous autoregressive model (MRSAR) Edge histogram
Spectral – based on analysis in spatial-frequencydomain Fourier domain energy distribution Gabor Pyramid-structure wavelet transform (PWT) Tree-structure wavelet transform (TWT) Laws Filter

6
-11-MMAI, Fall 07 - Winston Hsu, NTU
Co-occurrence Matrix Co-occurrence matrix Cd
Specified with a displacement vector d = {(row, column)} Entry Cd(i, j) indicates how many times a pixel with gray
level i is separated from a pixel of gray level j by thedisplacement vector d
Usually use normalized version of Cd
Sometimes use symmetric version of Cd
d = (1, 1) physical meaning?
-12-MMAI, Fall 07 - Winston Hsu, NTU
Co-occurrence Matrix (cont.) Examples
* From Prof. Leow Wee Kheng, NUS
7
-13-MMAI, Fall 07 - Winston Hsu, NTU
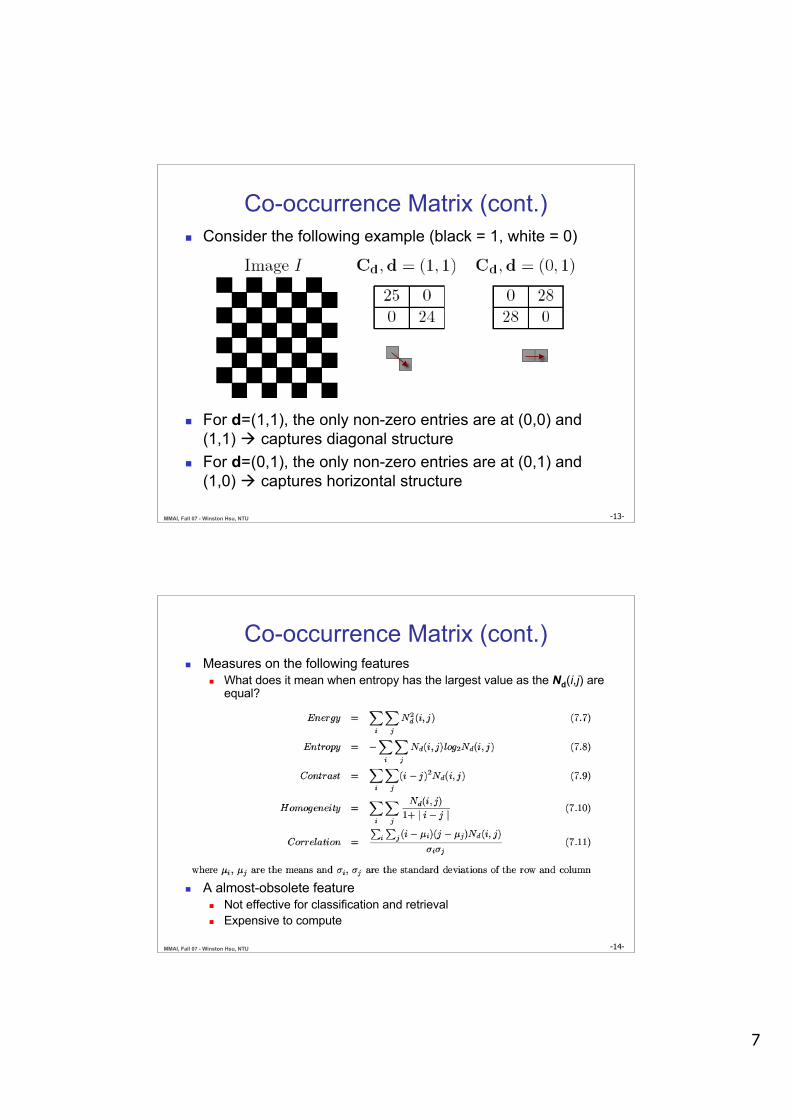
Co-occurrence Matrix (cont.) Consider the following example (black = 1, white = 0)
For d=(1,1), the only non-zero entries are at (0,0) and(1,1) captures diagonal structure
For d=(0,1), the only non-zero entries are at (0,1) and(1,0) captures horizontal structure
-14-MMAI, Fall 07 - Winston Hsu, NTU
Measures on the following features What does it mean when entropy has the largest value as the Nd(i,j) are
equal?
A almost-obsolete feature Not effective for classification and retrieval Expensive to compute
Co-occurrence Matrix (cont.)
8
-15-MMAI, Fall 07 - Winston Hsu, NTU
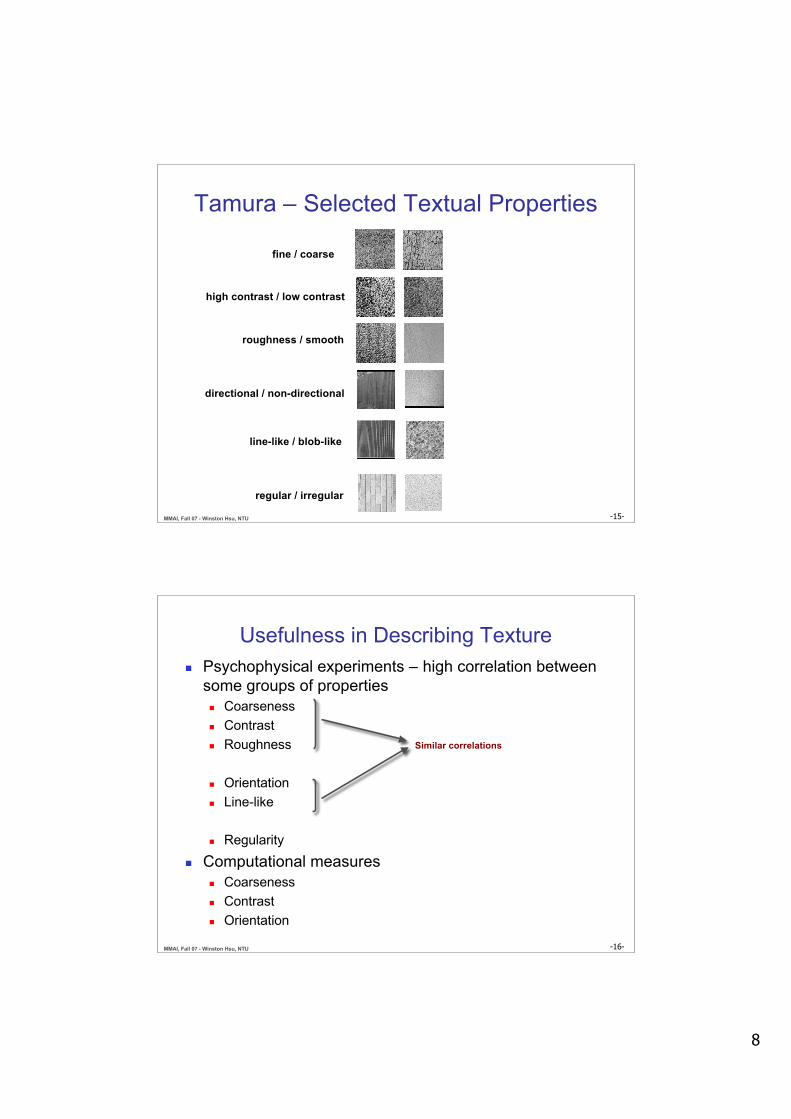
Tamura – Selected Textual Properties
fine / coarse
high contrast / low contrast
roughness / smooth
directional / non-directional
line-like / blob-like
regular / irregular
-16-MMAI, Fall 07 - Winston Hsu, NTU
Psychophysical experiments – high correlation betweensome groups of properties Coarseness Contrast Roughness
Orientation Line-like
Regularity
Computational measures Coarseness Contrast Orientation
Usefulness in Describing Texture
Similar correlations
9
-17-MMAI, Fall 07 - Winston Hsu, NTU
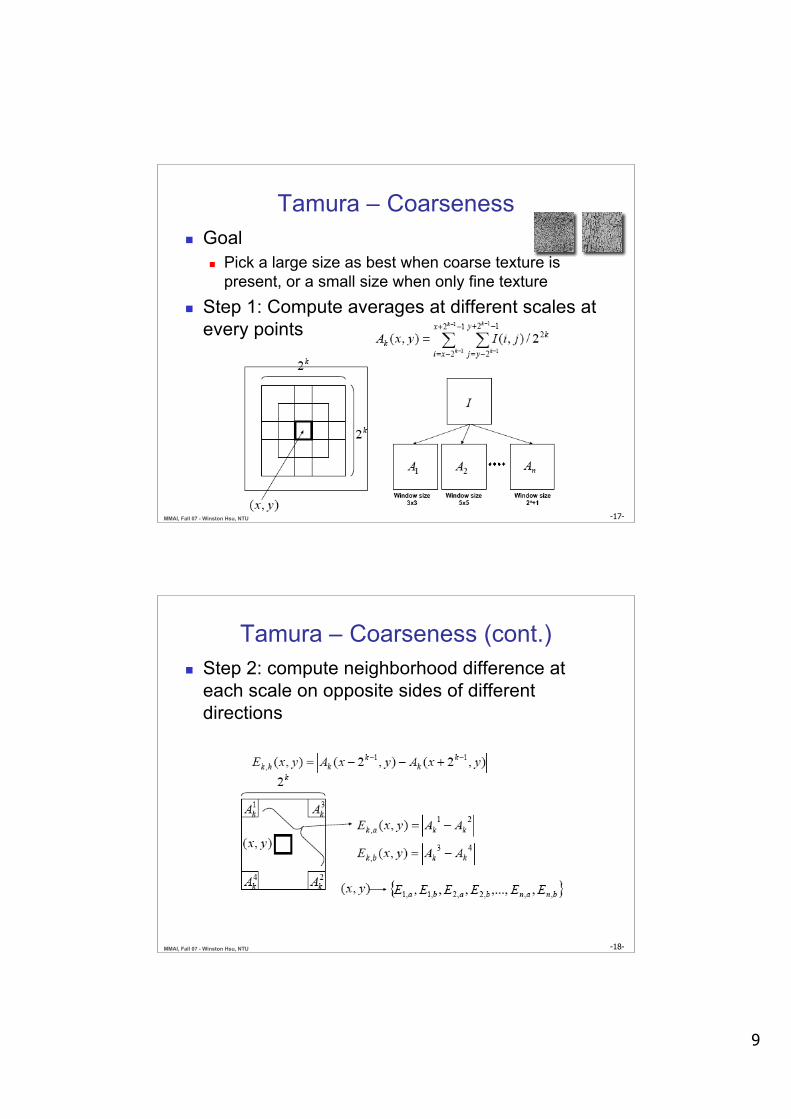
Tamura – Coarseness Goal
Pick a large size as best when coarse texture ispresent, or a small size when only fine texture
Step 1: Compute averages at different scales atevery points
-18-MMAI, Fall 07 - Winston Hsu, NTU
Tamura – Coarseness (cont.) Step 2: compute neighborhood difference at
each scale on opposite sides of differentdirections
10
-19-MMAI, Fall 07 - Winston Hsu, NTU
Tamura – Coarseness (cont.) Step 3: select the scale with the largest variation
Step 4: compute the coarseness
crs
-20-MMAI, Fall 07 - Winston Hsu, NTU
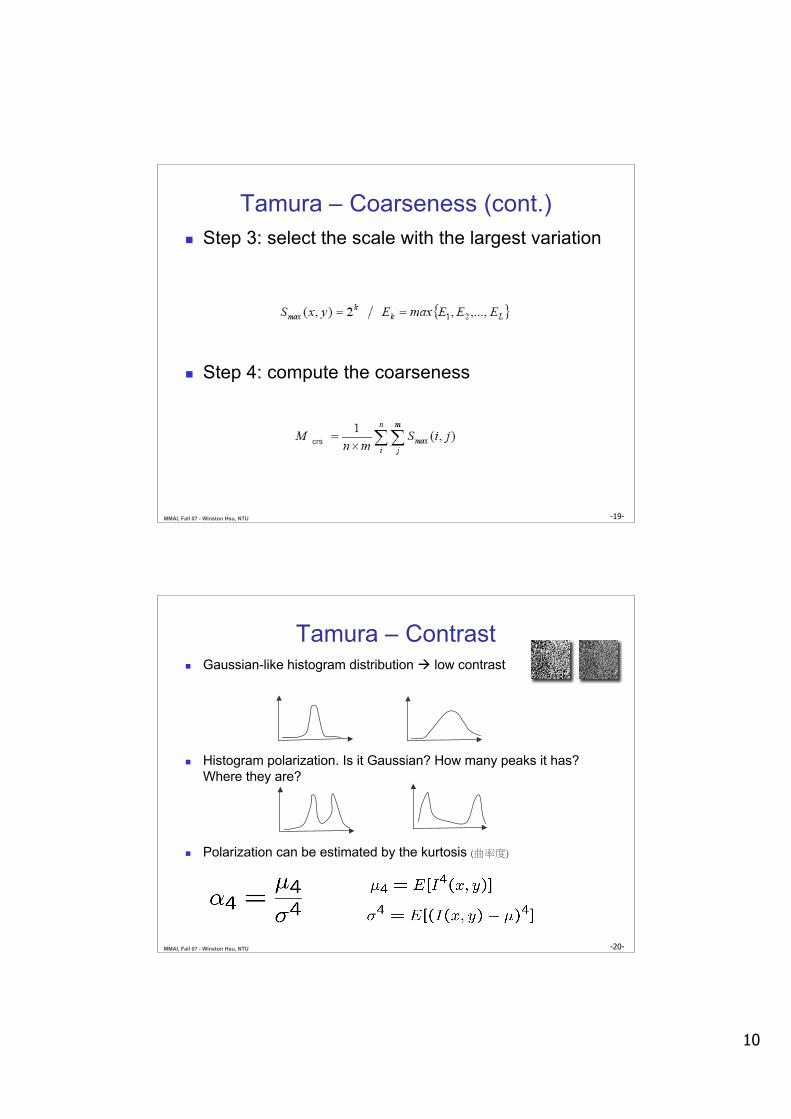
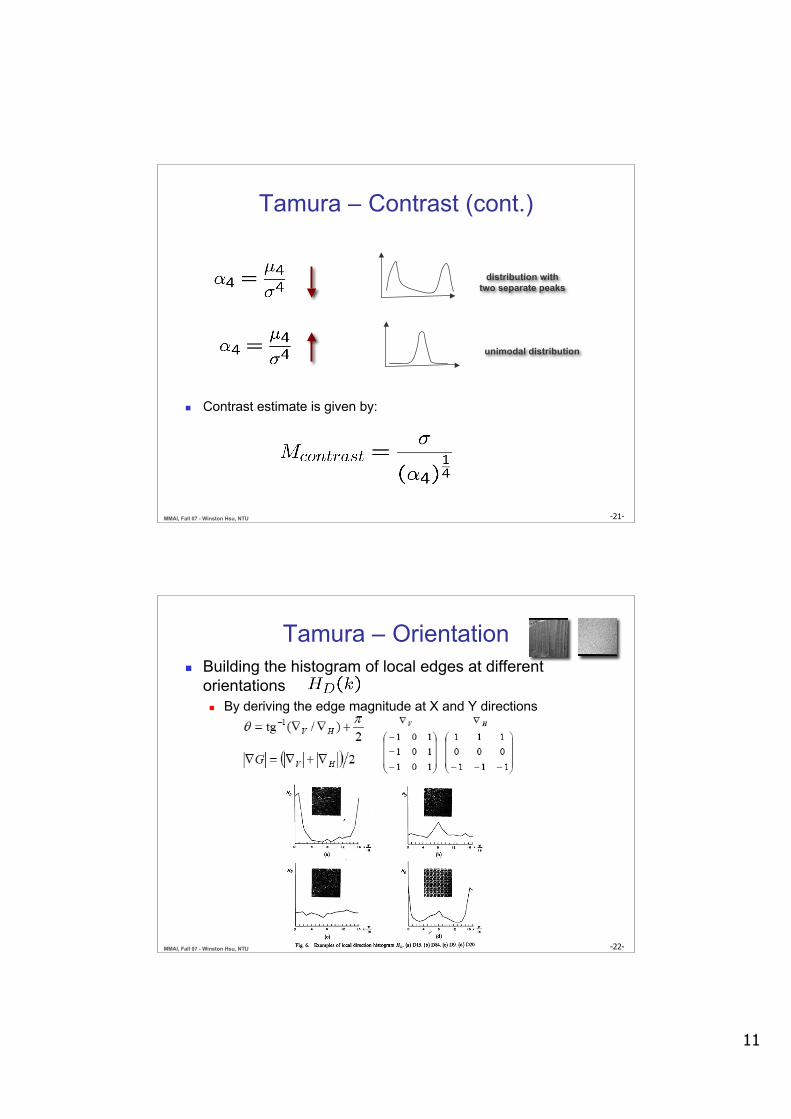
Tamura – Contrast Gaussian-like histogram distribution low contrast
Histogram polarization. Is it Gaussian? How many peaks it has?Where they are?
Polarization can be estimated by the kurtosis (曲率度)
11
-21-MMAI, Fall 07 - Winston Hsu, NTU
Tamura – Contrast (cont.)
Contrast estimate is given by:
unimodal distribution
distribution withtwo separate peaks
-22-MMAI, Fall 07 - Winston Hsu, NTU
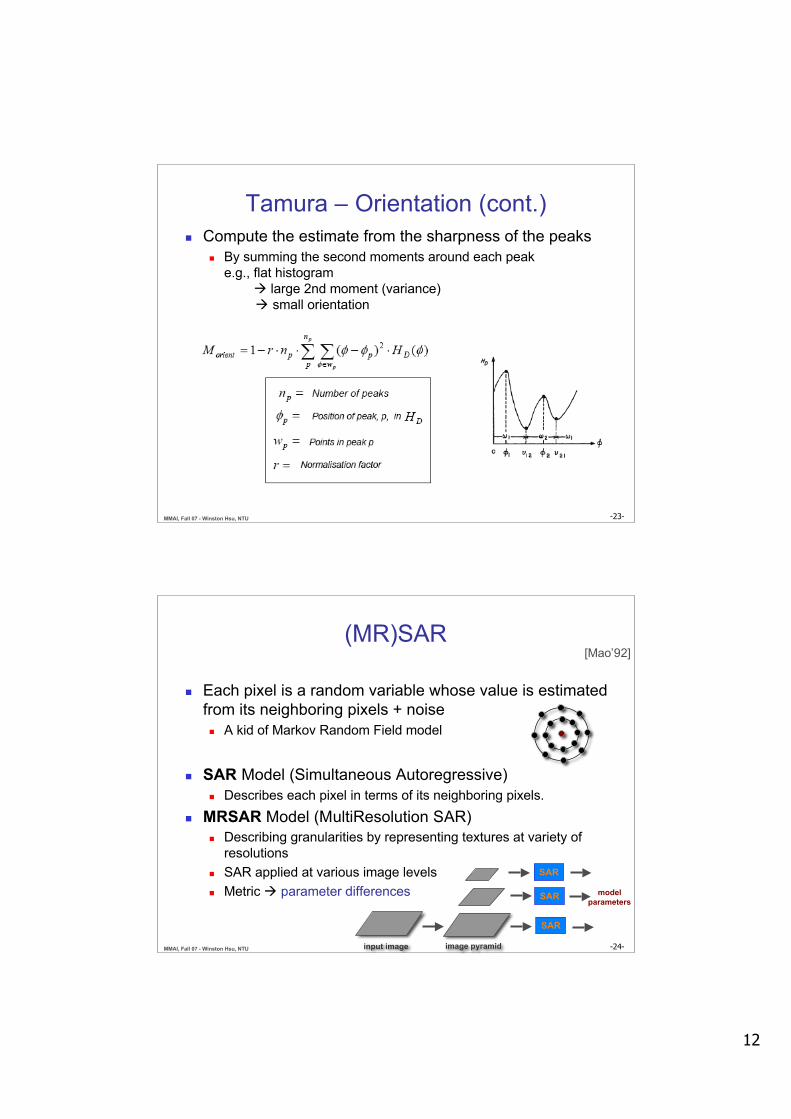
Tamura – Orientation Building the histogram of local edges at different
orientations By deriving the edge magnitude at X and Y directions
12
-23-MMAI, Fall 07 - Winston Hsu, NTU
Tamura – Orientation (cont.) Compute the estimate from the sharpness of the peaks
By summing the second moments around each peake.g., flat histogram large 2nd moment (variance) small orientation
-24-MMAI, Fall 07 - Winston Hsu, NTU
(MR)SAR
Each pixel is a random variable whose value is estimatedfrom its neighboring pixels + noise A kid of Markov Random Field model
SAR Model (Simultaneous Autoregressive) Describes each pixel in terms of its neighboring pixels.
MRSAR Model (MultiResolution SAR) Describing granularities by representing textures at variety of
resolutions SAR applied at various image levels Metric parameter differences
[Mao’92]
SAR
SAR
SAR
input image image pyramid
modelparameters
13
-25-MMAI, Fall 07 - Winston Hsu, NTU
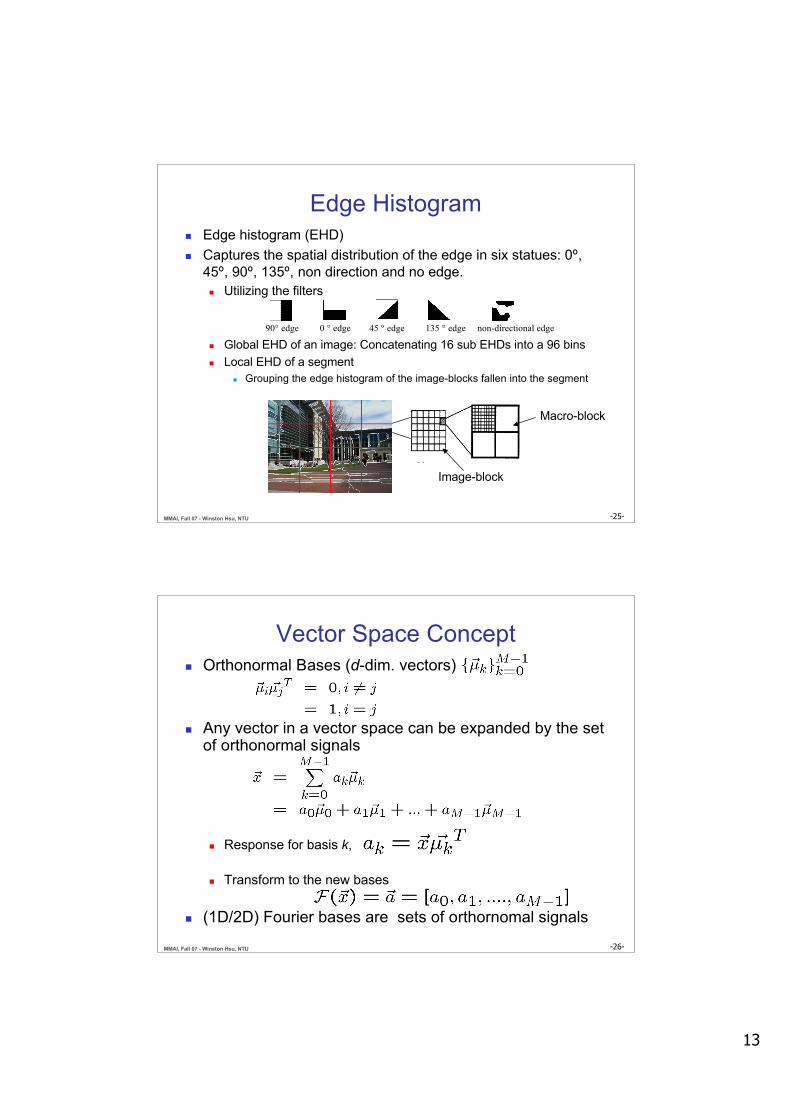
Edge Histogram Edge histogram (EHD) Captures the spatial distribution of the edge in six statues: 0º,
45º, 90º, 135º, non direction and no edge. Utilizing the filters
Global EHD of an image: Concatenating 16 sub EHDs into a 96 bins Local EHD of a segment
Grouping the edge histogram of the image-blocks fallen into the segment
Macro-block
Image-block
90° edge 0 ° edge 45 ° edge 135 ° edge non-directional edge
-26-MMAI, Fall 07 - Winston Hsu, NTU
Vector Space Concept Orthonormal Bases (d-dim. vectors)
Any vector in a vector space can be expanded by the setof orthonormal signals
Response for basis k,
Transform to the new bases
(1D/2D) Fourier bases are sets of orthornomal signals
14
-27-MMAI, Fall 07 - Winston Hsu, NTU
�
F g x, y( )( ) u,v( ) = g x, y( )e! i2" ux+vy( )dxdy
R2
##
The Fourier Transform Represent function on a
new basis Think of functions as
vectors, with manycomponents
We now apply a lineartransformation to transformthe basis
dot product with eachbasis element
In the expression, u and vselect the basis element,so a function of x and ybecomes a function of uand v
basis elements have theform
�
e!i2" ux+vy( )
-28-MMAI, Fall 07 - Winston Hsu, NTU
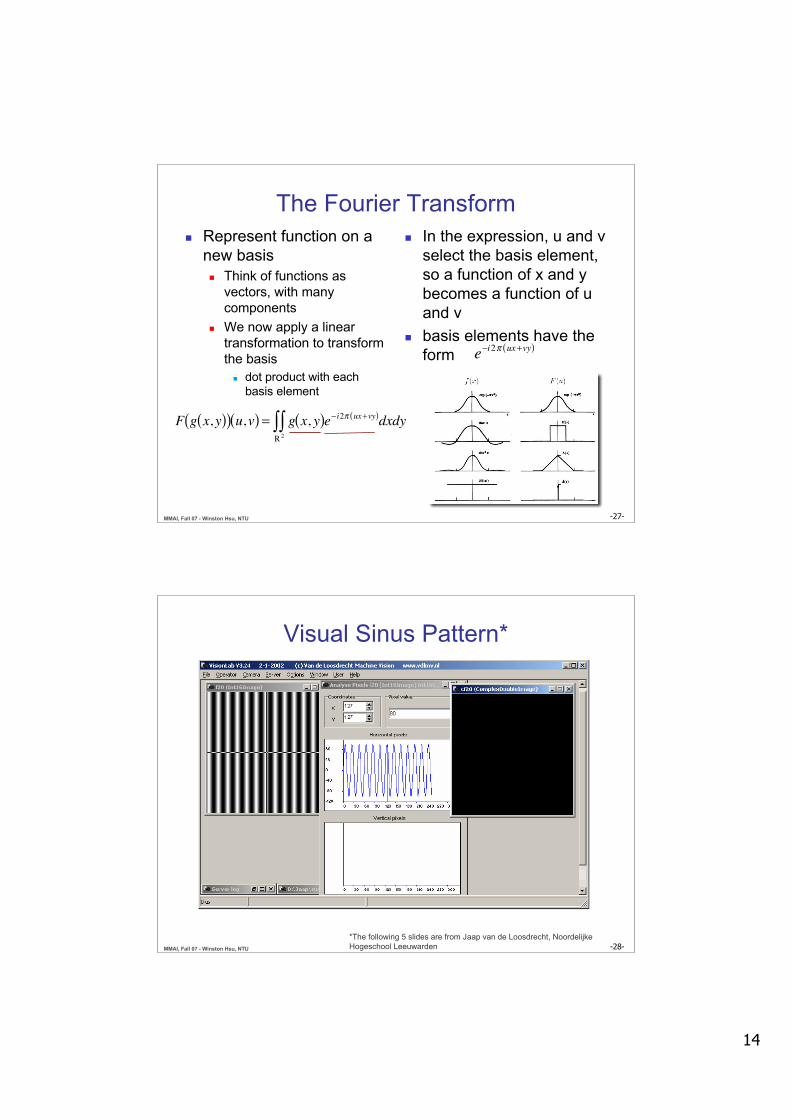
Visual Sinus Pattern*
*The following 5 slides are from Jaap van de Loosdrecht, NoordelijkeHogeschool Leeuwarden
15
-29-MMAI, Fall 07 - Winston Hsu, NTU
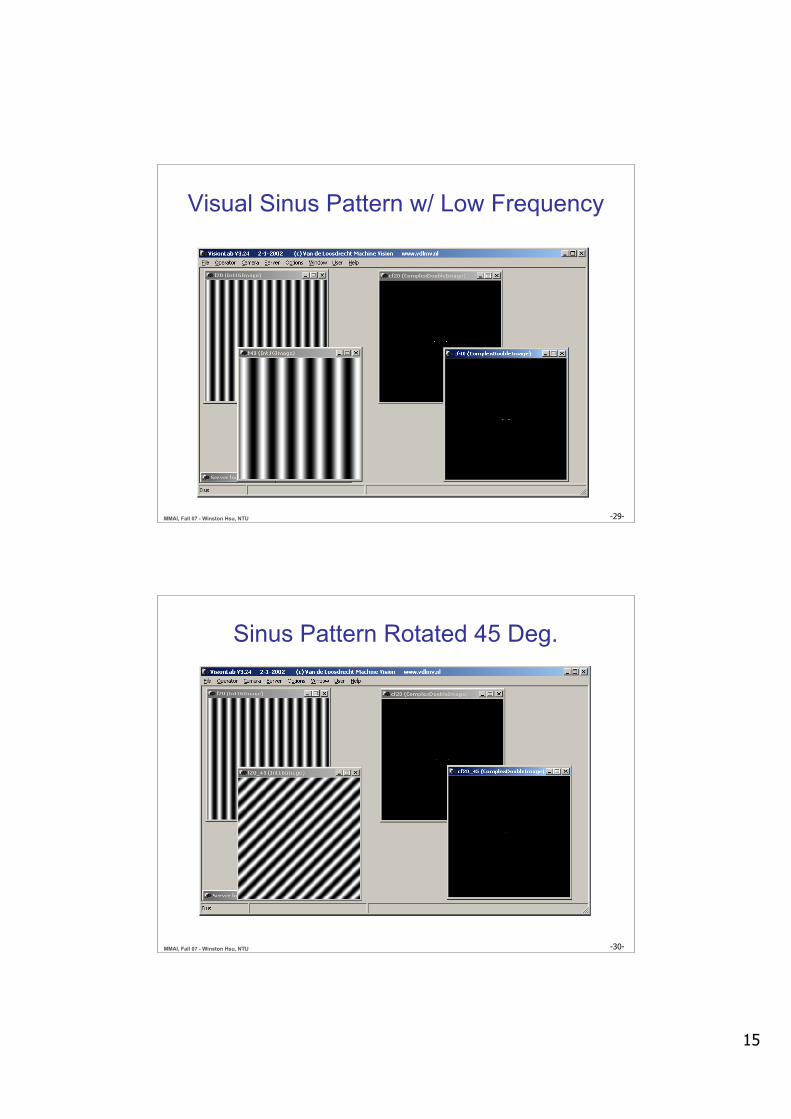
Visual Sinus Pattern w/ Low Frequency
-30-MMAI, Fall 07 - Winston Hsu, NTU
Sinus Pattern Rotated 45 Deg.
16
-31-MMAI, Fall 07 - Winston Hsu, NTU
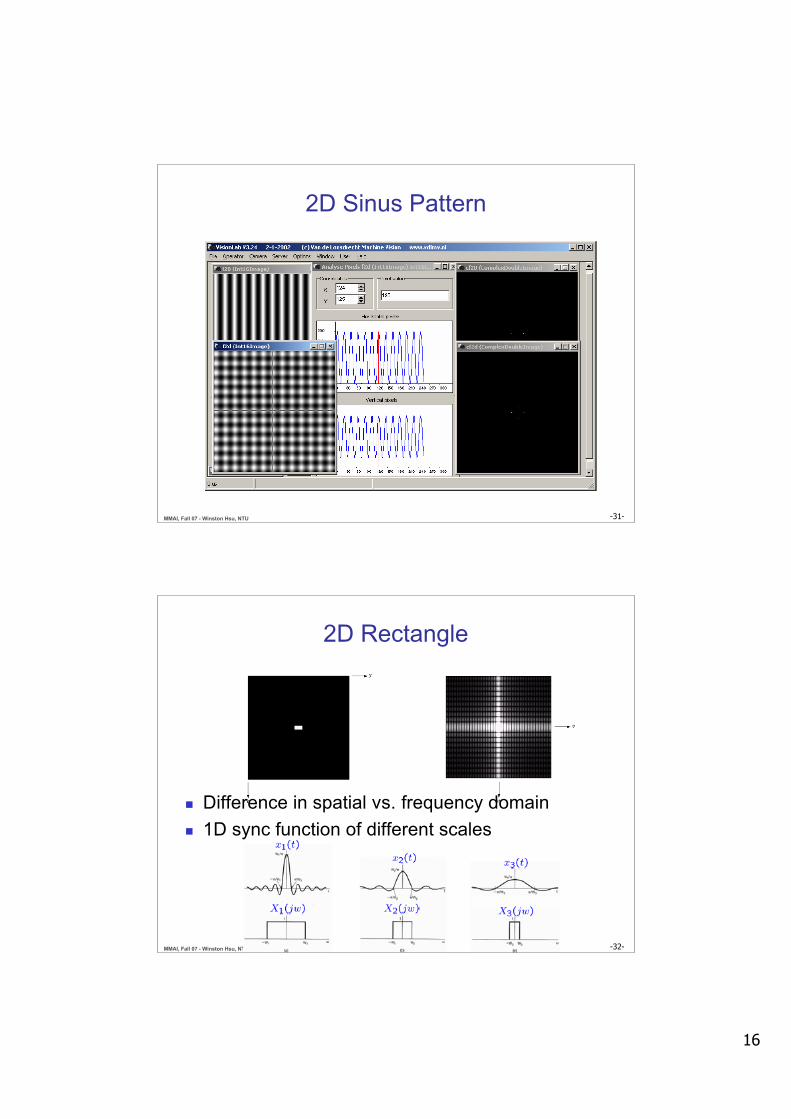
2D Sinus Pattern
-32-MMAI, Fall 07 - Winston Hsu, NTU
Difference in spatial vs. frequency domain 1D sync function of different scales
2D Rectangle
17
-33-MMAI, Fall 07 - Winston Hsu, NTU
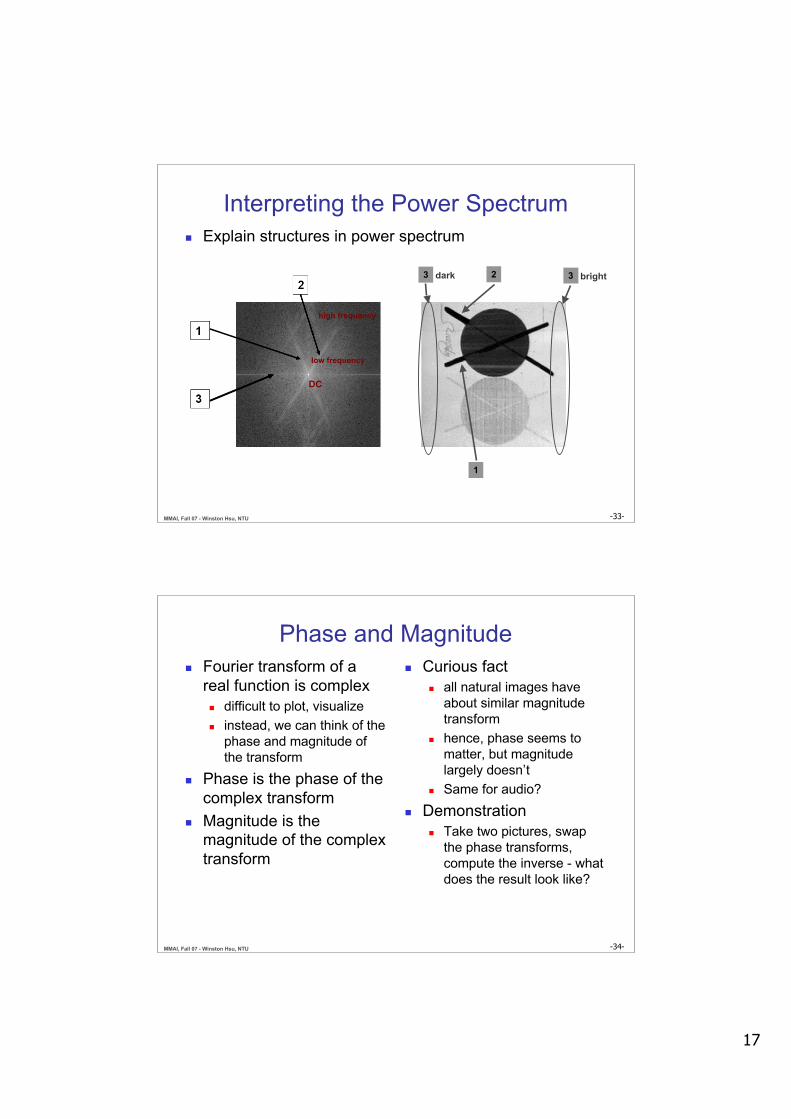
Interpreting the Power Spectrum Explain structures in power spectrum
DC
high frequency
low frequency
1
23 3 brightdark
-34-MMAI, Fall 07 - Winston Hsu, NTU
Phase and Magnitude Fourier transform of a
real function is complex difficult to plot, visualize instead, we can think of the
phase and magnitude ofthe transform
Phase is the phase of thecomplex transform
Magnitude is themagnitude of the complextransform
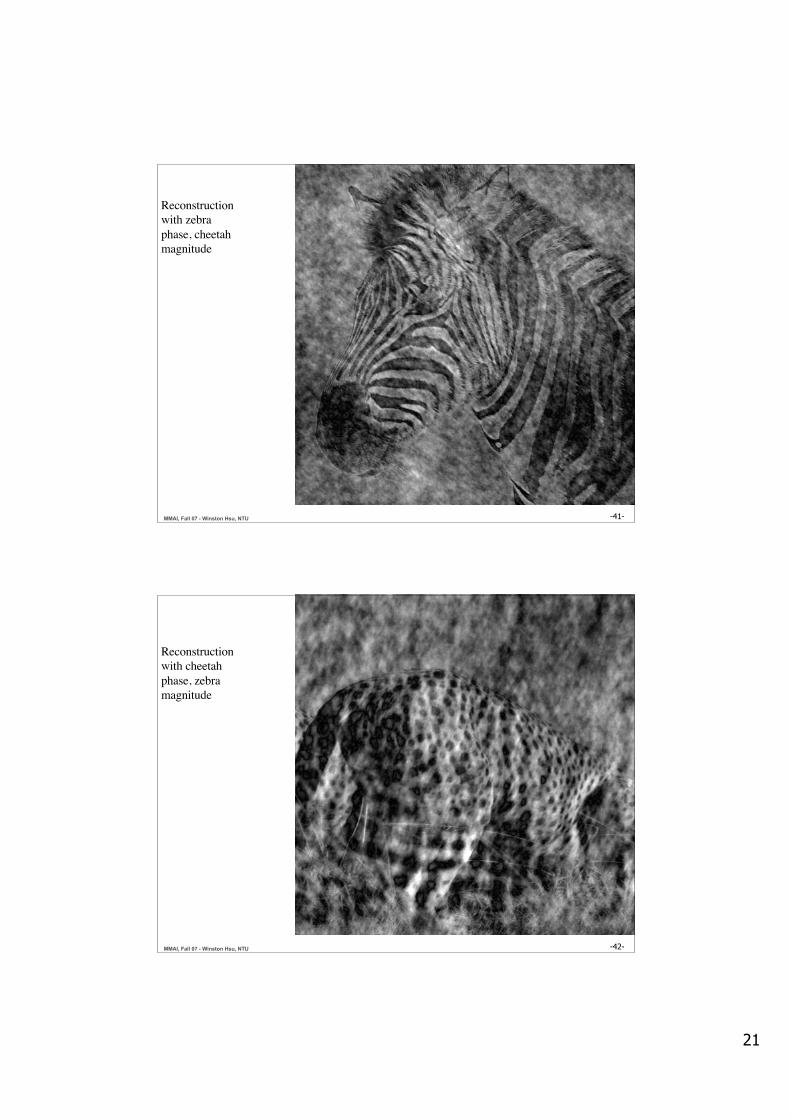
Curious fact all natural images have
about similar magnitudetransform
hence, phase seems tomatter, but magnitudelargely doesn’t
Same for audio?
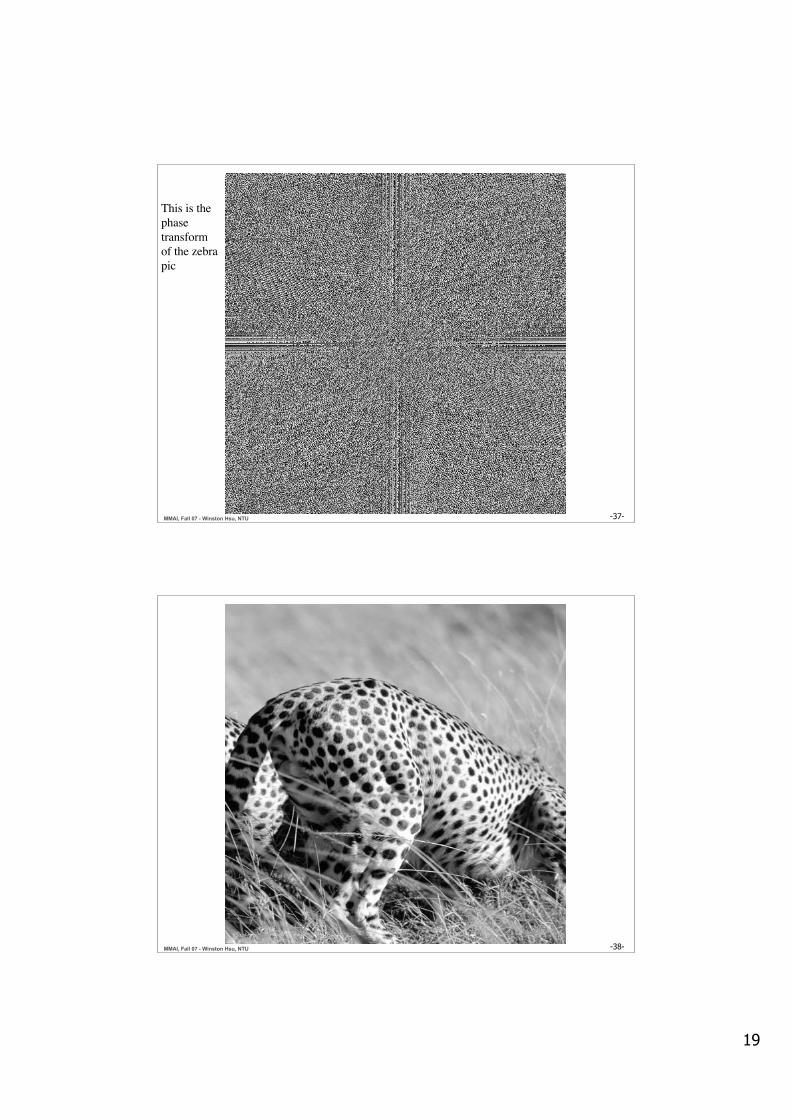
Demonstration Take two pictures, swap
the phase transforms,compute the inverse - whatdoes the result look like?
18
-35-MMAI, Fall 07 - Winston Hsu, NTU
-36-MMAI, Fall 07 - Winston Hsu, NTU
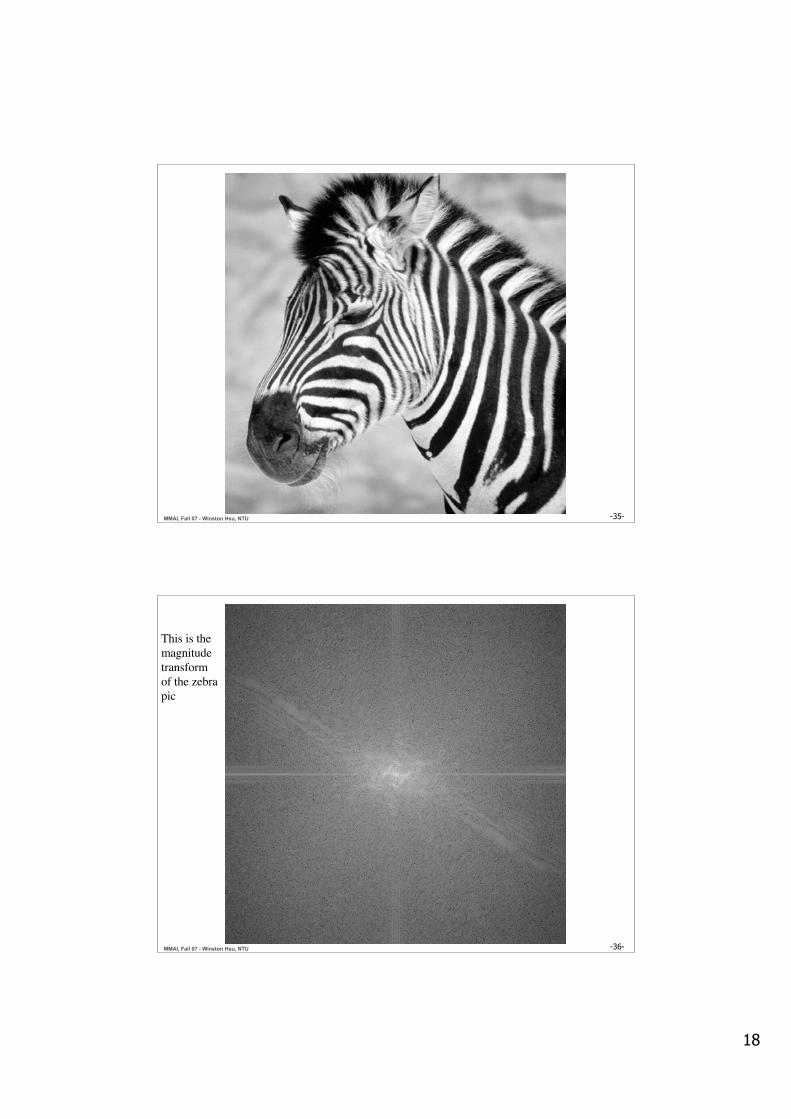
This is themagnitudetransformof the zebrapic
19
-37-MMAI, Fall 07 - Winston Hsu, NTU
This is thephasetransformof the zebrapic
-38-MMAI, Fall 07 - Winston Hsu, NTU
20
-39-MMAI, Fall 07 - Winston Hsu, NTU
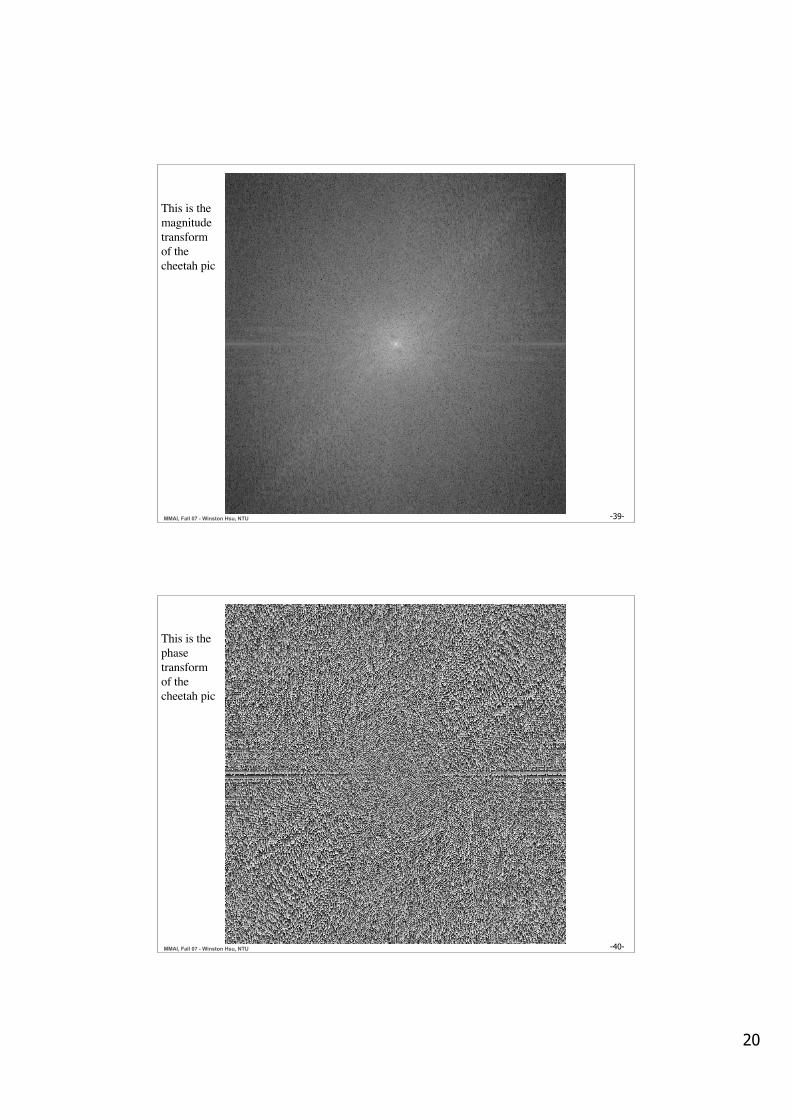
This is themagnitudetransformof thecheetah pic
-40-MMAI, Fall 07 - Winston Hsu, NTU
This is thephasetransformof thecheetah pic
21
-41-MMAI, Fall 07 - Winston Hsu, NTU
Reconstructionwith zebraphase, cheetahmagnitude
-42-MMAI, Fall 07 - Winston Hsu, NTU
Reconstructionwith cheetahphase, zebramagnitude
22
-43-MMAI, Fall 07 - Winston Hsu, NTU
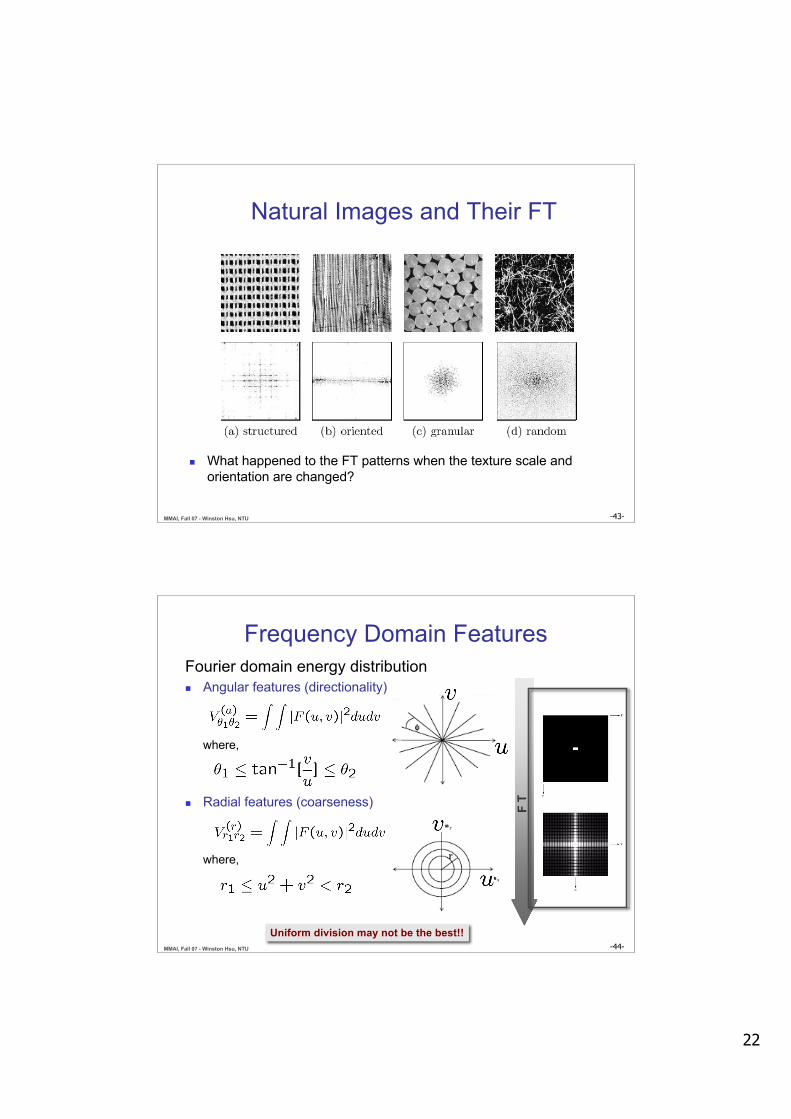
Natural Images and Their FT
What happened to the FT patterns when the texture scale andorientation are changed?
-44-MMAI, Fall 07 - Winston Hsu, NTU
Frequency Domain FeaturesFourier domain energy distribution Angular features (directionality)
where,
Radial features (coarseness)
where,
Uniform division may not be the best!!
F T
23
-45-MMAI, Fall 07 - Winston Hsu, NTU
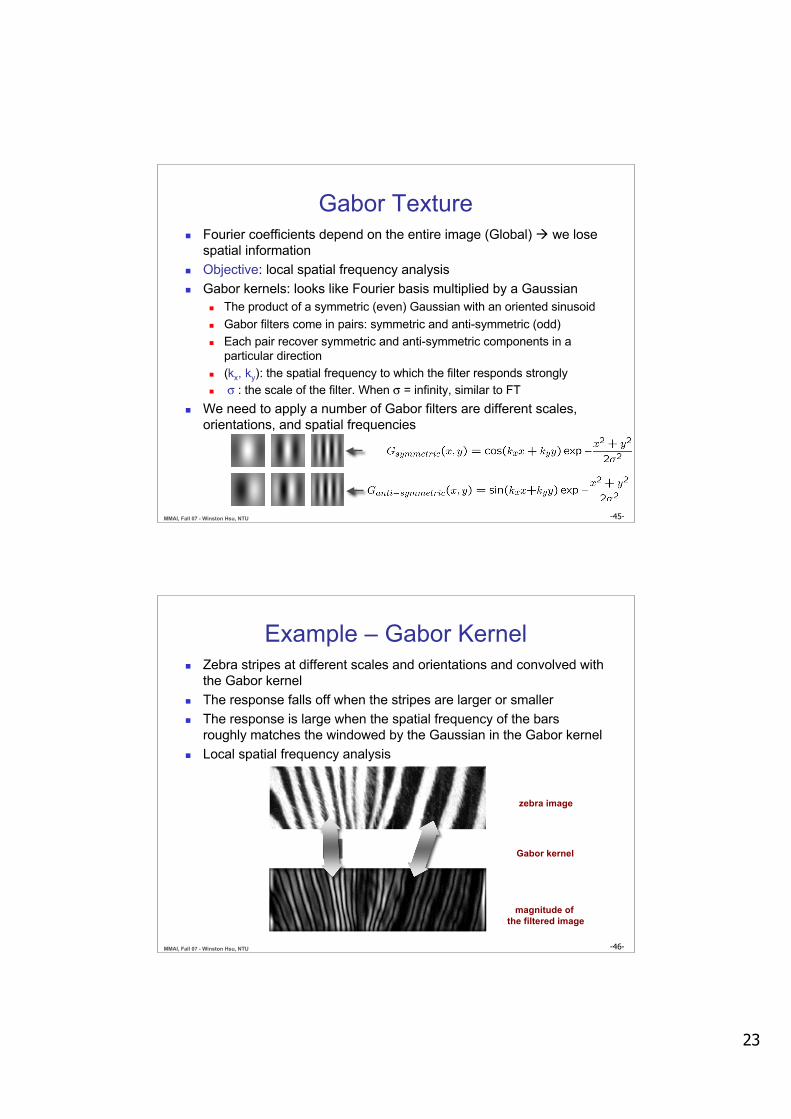
Gabor Texture Fourier coefficients depend on the entire image (Global) we lose
spatial information Objective: local spatial frequency analysis Gabor kernels: looks like Fourier basis multiplied by a Gaussian
The product of a symmetric (even) Gaussian with an oriented sinusoid Gabor filters come in pairs: symmetric and anti-symmetric (odd) Each pair recover symmetric and anti-symmetric components in a
particular direction (kx, ky): the spatial frequency to which the filter responds strongly σ : the scale of the filter. When σ = infinity, similar to FT
We need to apply a number of Gabor filters are different scales,orientations, and spatial frequencies
-46-MMAI, Fall 07 - Winston Hsu, NTU
Example – Gabor Kernel
Gabor kernel
zebra image
magnitude of the filtered image
Zebra stripes at different scales and orientations and convolved withthe Gabor kernel
The response falls off when the stripes are larger or smaller The response is large when the spatial frequency of the bars
roughly matches the windowed by the Gaussian in the Gabor kernel Local spatial frequency analysis
24
-47-MMAI, Fall 07 - Winston Hsu, NTU
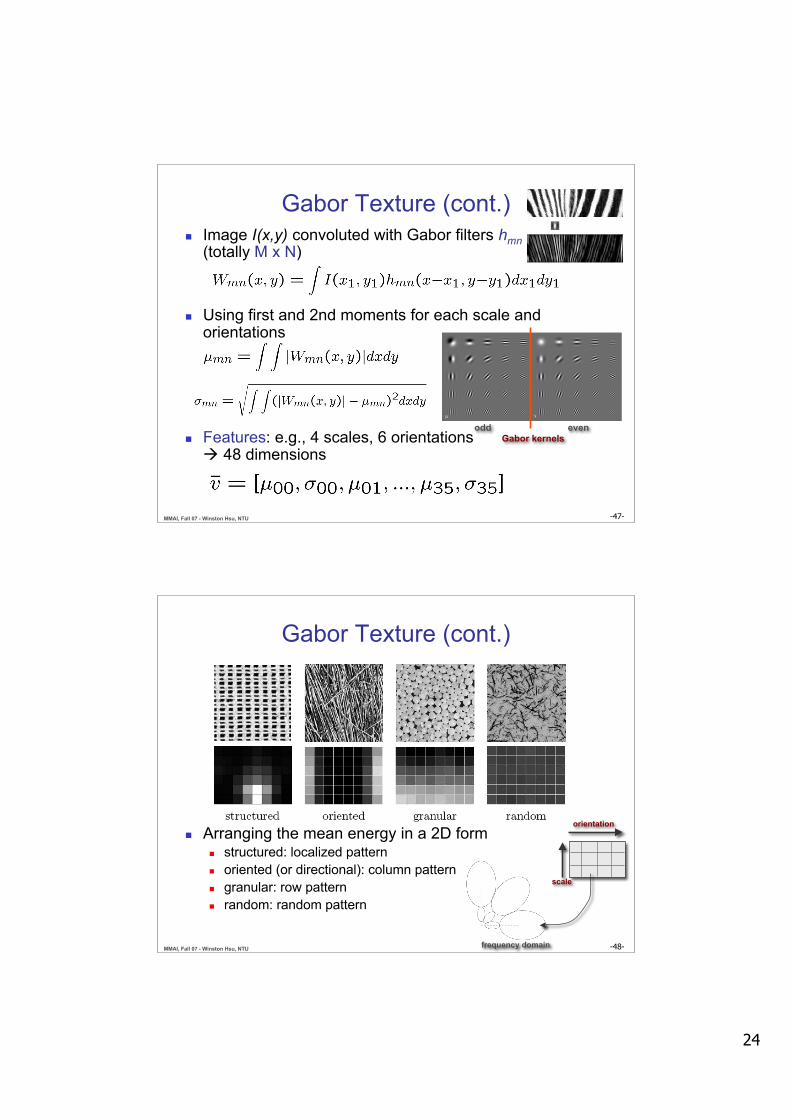
Gabor Texture (cont.) Image I(x,y) convoluted with Gabor filters hmn
(totally M x N)
Using first and 2nd moments for each scale andorientations
Features: e.g., 4 scales, 6 orientations 48 dimensions
odd evenGabor kernels
-48-MMAI, Fall 07 - Winston Hsu, NTU
Gabor Texture (cont.)
Arranging the mean energy in a 2D form structured: localized pattern oriented (or directional): column pattern granular: row pattern random: random pattern
orientation
scale
frequency domain
25
-49-MMAI, Fall 07 - Winston Hsu, NTU
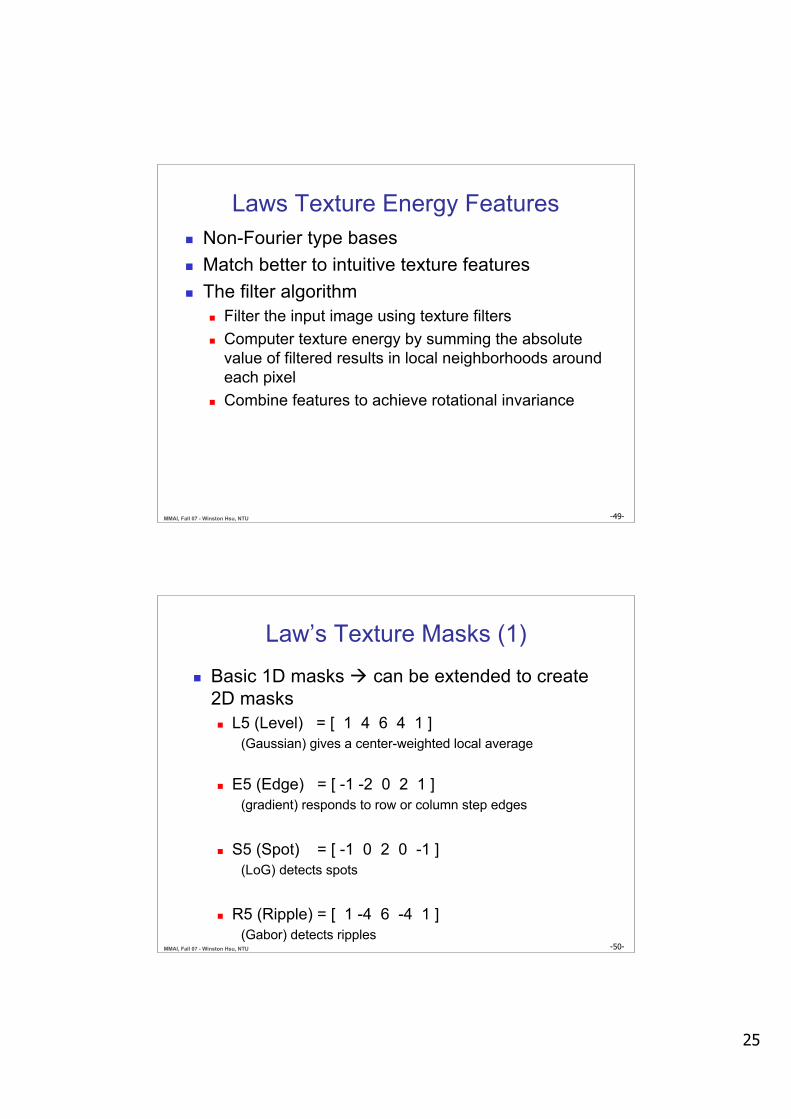
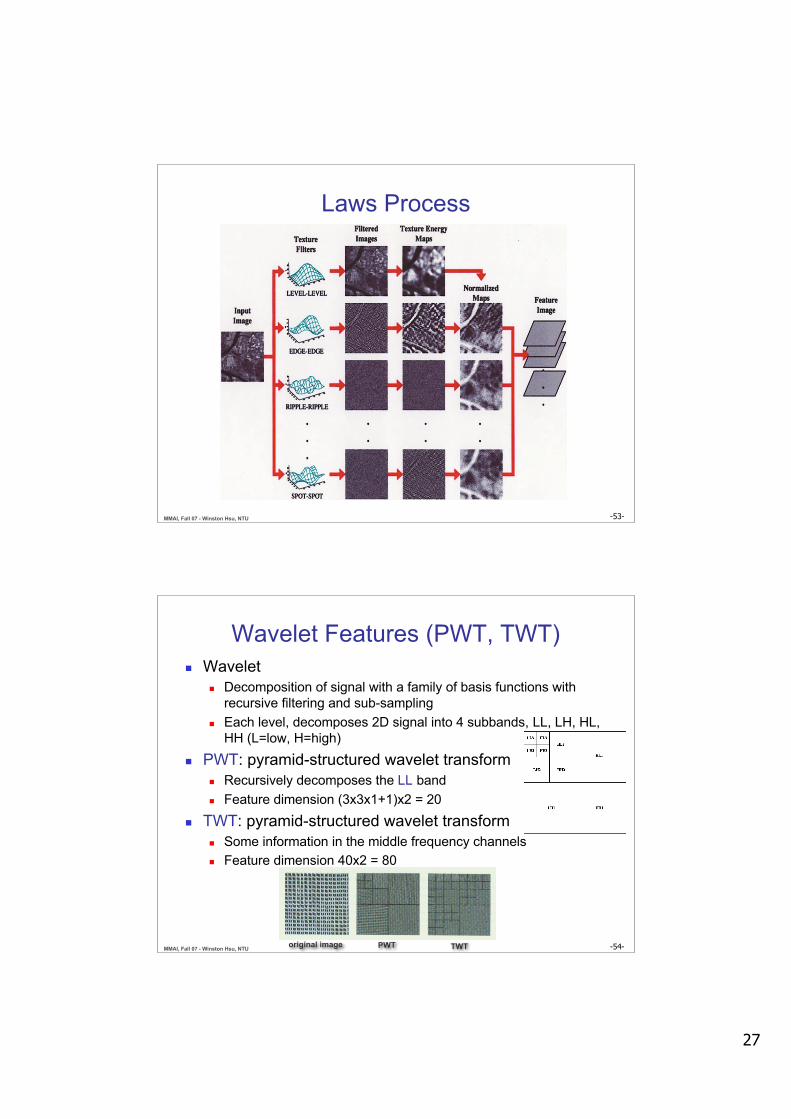
Laws Texture Energy Features Non-Fourier type bases Match better to intuitive texture features The filter algorithm
Filter the input image using texture filters Computer texture energy by summing the absolute
value of filtered results in local neighborhoods aroundeach pixel
Combine features to achieve rotational invariance
-50-MMAI, Fall 07 - Winston Hsu, NTU
Law’s Texture Masks (1)
Basic 1D masks can be extended to create2D masks L5 (Level) = [ 1 4 6 4 1 ]
(Gaussian) gives a center-weighted local average
E5 (Edge) = [ -1 -2 0 2 1 ](gradient) responds to row or column step edges
S5 (Spot) = [ -1 0 2 0 -1 ](LoG) detects spots
R5 (Ripple) = [ 1 -4 6 -4 1 ](Gabor) detects ripples
26
-51-MMAI, Fall 07 - Winston Hsu, NTU
E5L5
E5L5
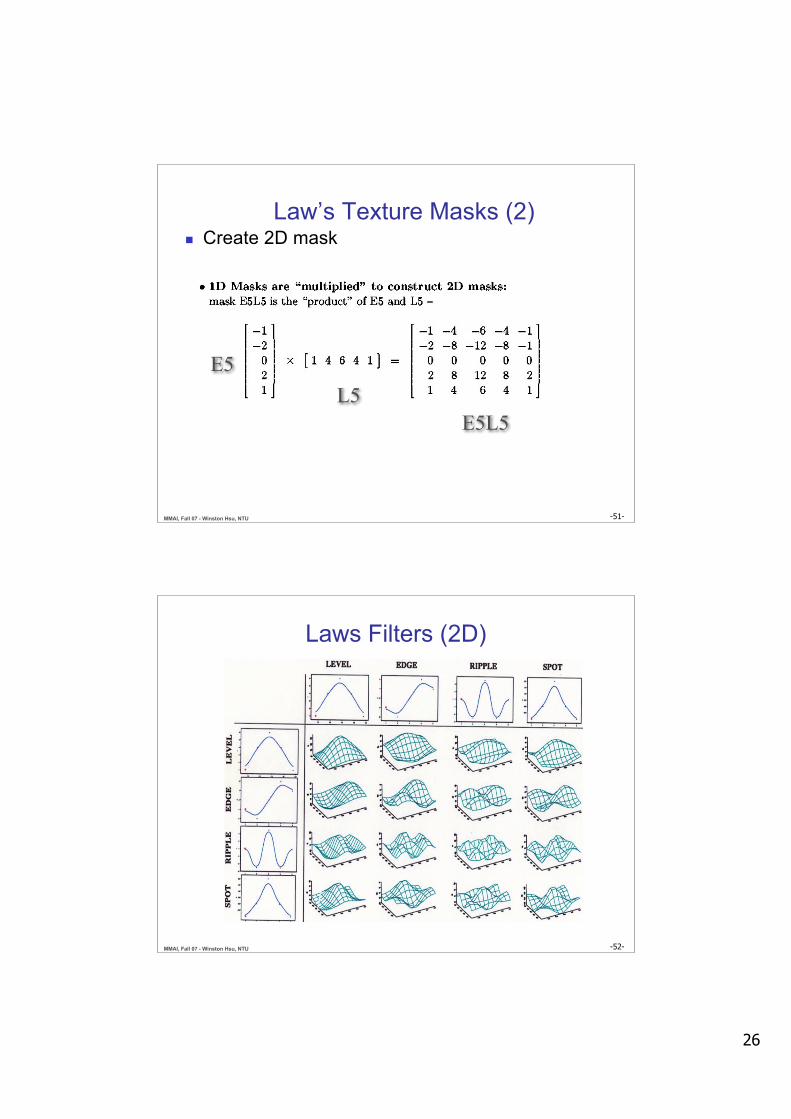
Law’s Texture Masks (2) Create 2D mask
-52-MMAI, Fall 07 - Winston Hsu, NTU
Laws Filters (2D)
27
-53-MMAI, Fall 07 - Winston Hsu, NTU
Laws Process
-54-MMAI, Fall 07 - Winston Hsu, NTU
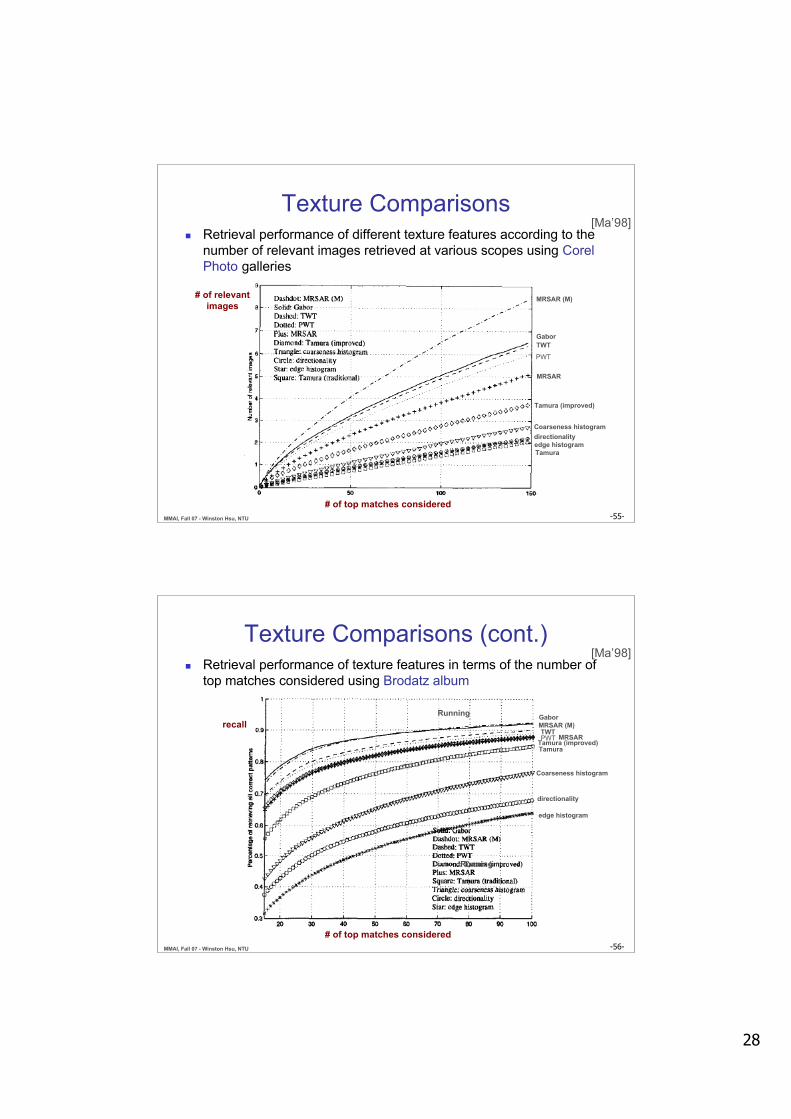
Wavelet Features (PWT, TWT) Wavelet
Decomposition of signal with a family of basis functions withrecursive filtering and sub-sampling
Each level, decomposes 2D signal into 4 subbands, LL, LH, HL,HH (L=low, H=high)
PWT: pyramid-structured wavelet transform Recursively decomposes the LL band Feature dimension (3x3x1+1)x2 = 20
TWT: pyramid-structured wavelet transform Some information in the middle frequency channels Feature dimension 40x2 = 80
original image PWT TWT
28
-55-MMAI, Fall 07 - Winston Hsu, NTU
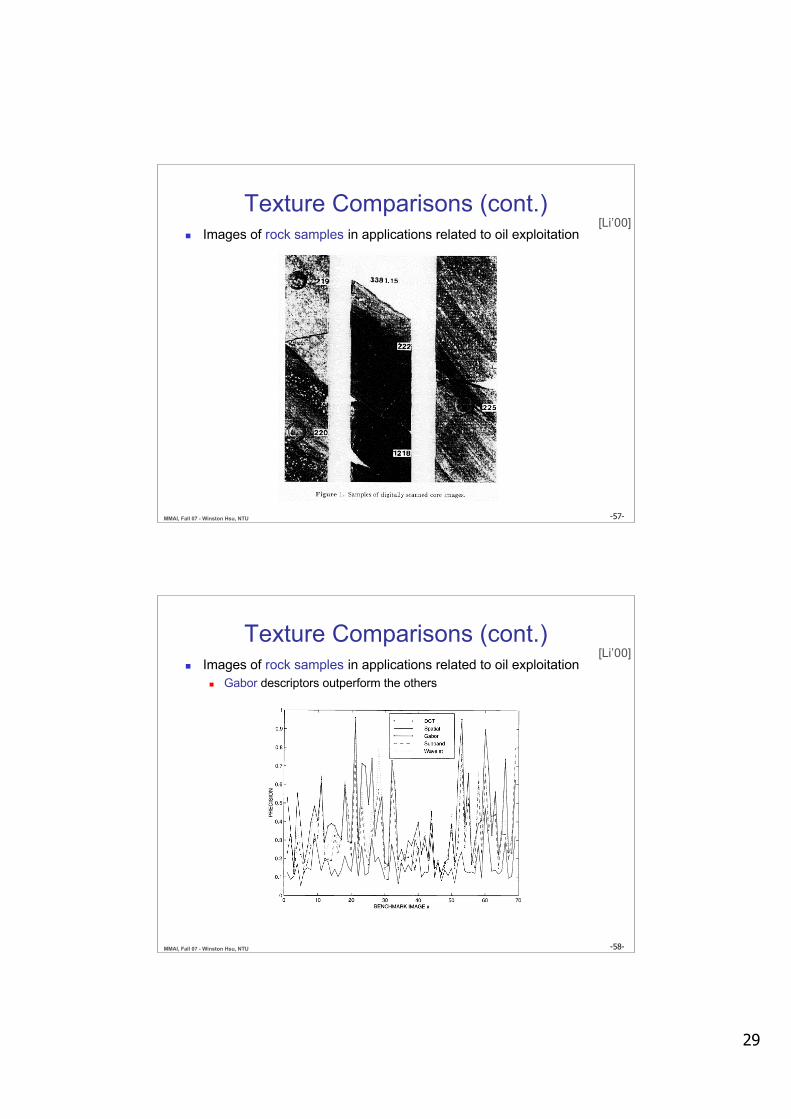
Texture Comparisons Retrieval performance of different texture features according to the
number of relevant images retrieved at various scopes using CorelPhoto galleries
# of top matches considered
# of relevantimages
[Ma’98]
MRSAR (M)
GaborTWT
PWT
MRSAR
Tamura (improved)
Coarseness histogramdirectionalityedge histogramTamura
-56-MMAI, Fall 07 - Winston Hsu, NTU
Texture Comparisons (cont.) Retrieval performance of texture features in terms of the number of
top matches considered using Brodatz album
# of top matches considered
recall
[Ma’98]
Running
RunningMRSAR (M)Gabor
TWTPWT MRSAR
Tamura (improved)
Coarseness histogram
directionality
edge histogram
Tamura
29
-57-MMAI, Fall 07 - Winston Hsu, NTU
Texture Comparisons (cont.) Images of rock samples in applications related to oil exploitation
[Li’00]
-58-MMAI, Fall 07 - Winston Hsu, NTU
Texture Comparisons (cont.) Images of rock samples in applications related to oil exploitation
Gabor descriptors outperform the others
[Li’00]
30
-59-MMAI, Fall 07 - Winston Hsu, NTU
Learned Similarity Distance metrics DO matter
All based onGabor features
Euclidean vs.learned (supervised)distance metric
The later wasmaintained withtexture thesaurus
[Ma’96]
Euclideandistance
learned (supervised)distance
-60-MMAI, Fall 07 - Winston Hsu, NTU
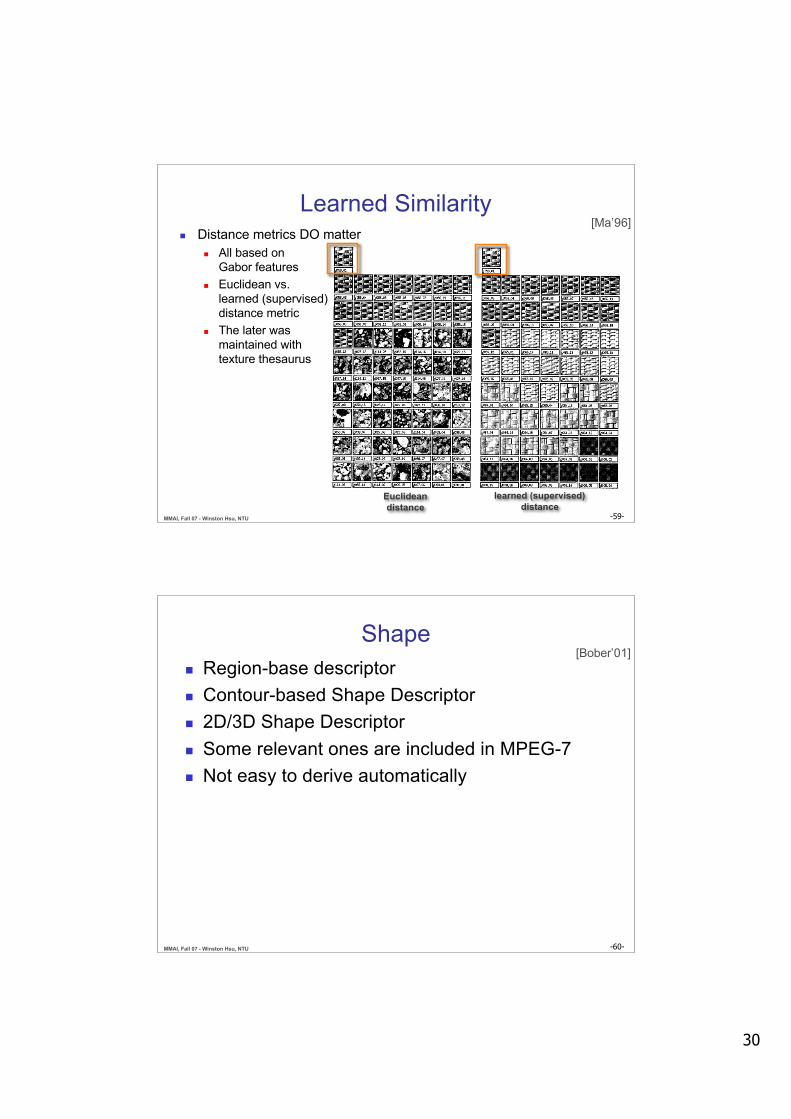
Shape Region-base descriptor Contour-based Shape Descriptor 2D/3D Shape Descriptor Some relevant ones are included in MPEG-7 Not easy to derive automatically
[Bober’01]
31
-61-MMAI, Fall 07 - Winston Hsu, NTU
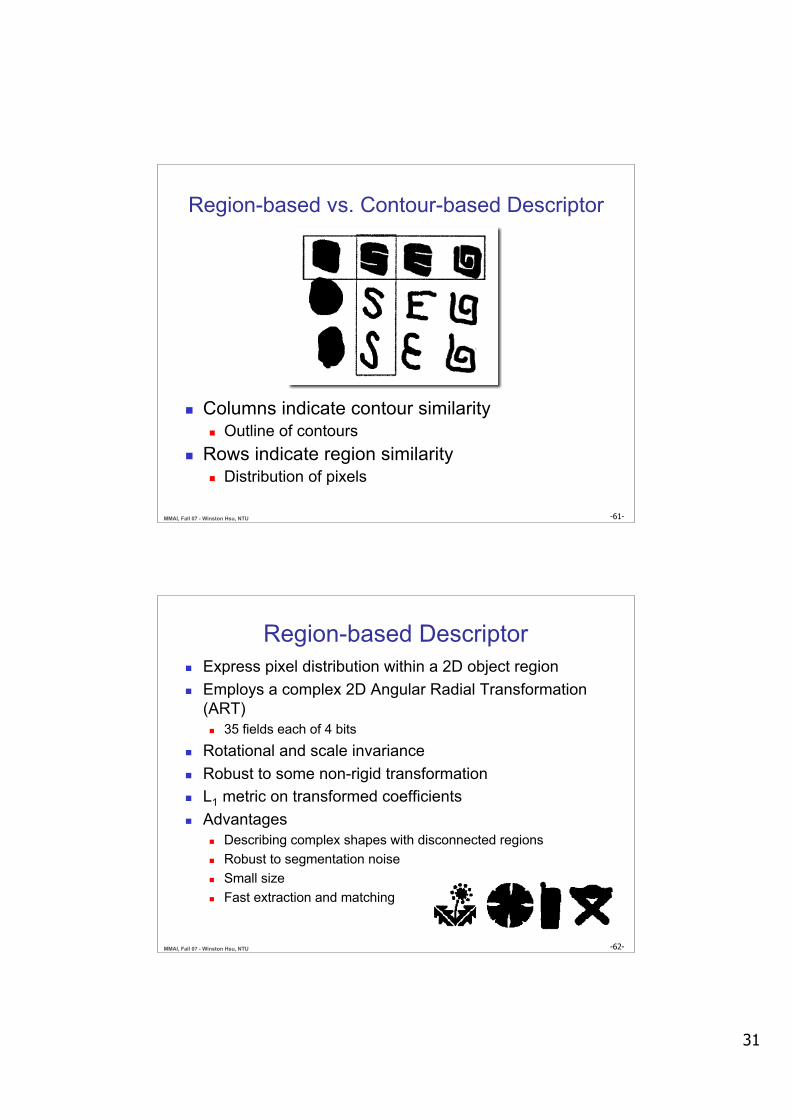
Region-based vs. Contour-based Descriptor
Columns indicate contour similarity Outline of contours
Rows indicate region similarity Distribution of pixels
-62-MMAI, Fall 07 - Winston Hsu, NTU
Region-based Descriptor Express pixel distribution within a 2D object region Employs a complex 2D Angular Radial Transformation
(ART) 35 fields each of 4 bits
Rotational and scale invariance Robust to some non-rigid transformation L1 metric on transformed coefficients Advantages
Describing complex shapes with disconnected regions Robust to segmentation noise Small size Fast extraction and matching
32
-63-MMAI, Fall 07 - Winston Hsu, NTU
(a)
(b)
(c)
(d)
(e)
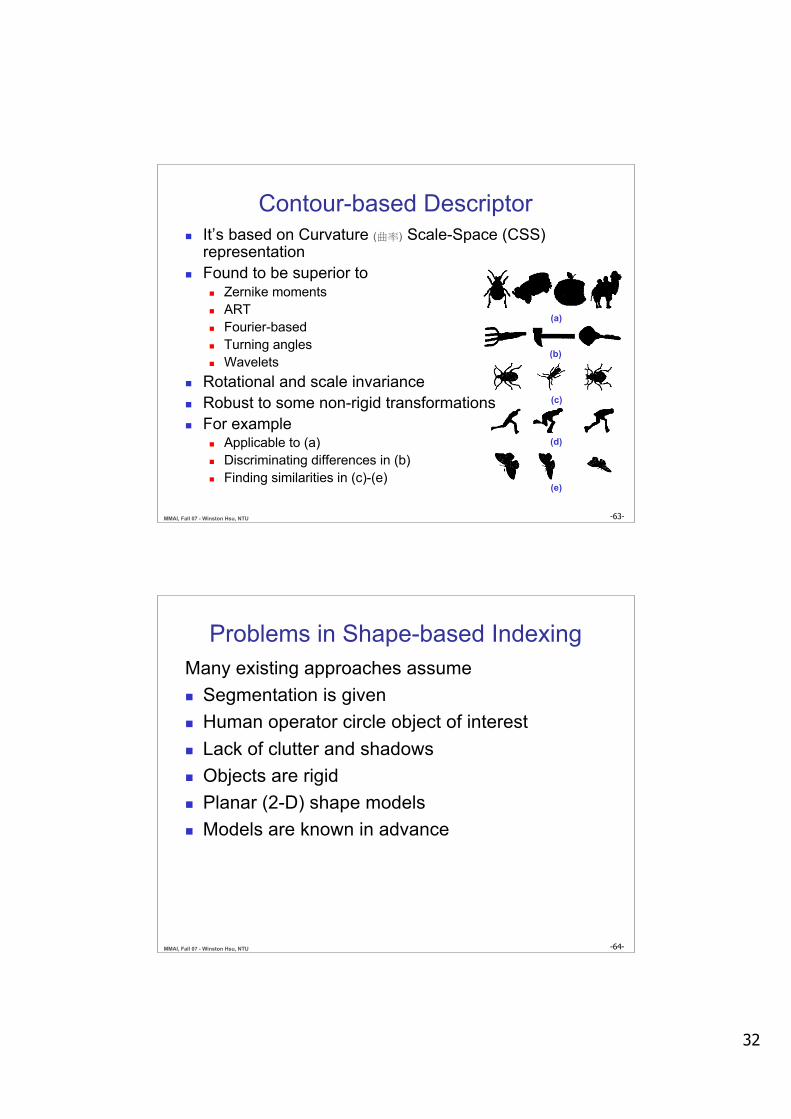
Contour-based Descriptor It’s based on Curvature (曲率) Scale-Space (CSS)
representation Found to be superior to
Zernike moments ART Fourier-based Turning angles Wavelets
Rotational and scale invariance Robust to some non-rigid transformations For example
Applicable to (a) Discriminating differences in (b) Finding similarities in (c)-(e)
-64-MMAI, Fall 07 - Winston Hsu, NTU
Problems in Shape-based IndexingMany existing approaches assume Segmentation is given Human operator circle object of interest Lack of clutter and shadows Objects are rigid Planar (2-D) shape models Models are known in advance
33
-65-MMAI, Fall 07 - Winston Hsu, NTU
Summary Texture features
Statistical Spectral
Texture computation are time-consuming compressed domain features?
Shape features Multimodal fusion are quite helpful Next week
Efficient indexing on high-dimensional data Feature reduction


