
300 S. Riverside Plaza Chicago, Illinois 60606 312 876 0004 (F) 312 876 1158
Analysis of Tea in the Foodservice Industry
Presented to:
The Tea Association of the USA, Inc.
New York, New York
By:
Technomic, Inc.
Report Number 11959 October 2005

300 S. Riverside Plaza Chicago, Illinois 60606 312 876 0004 (F) 312 876 1158
For Questions, Comments or Additional Information, Contact:
David J. Henkes Senior Principal
Technomic, Inc. 300 South Riverside Plaza
Suite 1940 South Chicago, IL 60606
www.technomic.com
312/876 0004 (fax: 312/876 1158)

Tea Association of the USA
Table of Contents
Page
Introduction 1
Background 1
Objectives 1
Segment Scope 1
Methodologies 2
Category Growth and Dynamics 2
Tea Defined 2
Overall Hot Beverage Category Snapshot 3
Overall Tea Sales by Operator Type 5
Segmentation by Tea Types 5
Format/Shares of RSE 6
Consumer Attitudes and Practices 7
Consumer Tea Purchasing Trends/Consumption 7
Beverage Applications 8
Consumer Beverage Purchasing Factor Importance 8
Beverage Daypart Associations 9
Beverage Venue Associations 10
Consumer Health Associations Regarding Beverages 10
Operator Attitudes and Practices 11
Tea Gross Margins 11
Tea Products Penetration 11
Variety of Tea Products Offered 12
Sizes of Dispensed/Poured Tea Products 12
Tea Volume Status 12
Hot and Cold Beverage Selection Criteria 13
Beverage Distribution 14
Single Sourcing of Beverages 14
Healthy Option Perspective 15
Operator Beverage Associations 15
Preferred Iced Tea Format 16

Tea Association of the USA
Conclusions and Implications 17

Tea Association of the USA
1
Introduction Background
Technomic has been retained by the Tea Association of the USA to prepare this white paper on the category dynamics, trends and outlook of tea products in the foodservice channel. Objectives
This report includes foodservice information on the following:
Total volume of tea sold in foodservice (both pounds and consumer dollars).
Historic and projected growth
Consumer attitudes/practices relative to tea
Operator attitudes/practices relative to tea
Key implications to the Tea Association
Segment Scope
The following table lists the operator segments and relevant sub-segments that were included in the scope of the engagement, relating to volumetrics.
Segment Sub-segments/Examples Segment Sub-segments/Examples
Traditional Limited Service Restaurants (LSR)
Burger
Pizza
Mexican
Chicken
Ice cream/yogurt
Sandwich
Business & Industry (B&I)
Plant/office dining
Excludes any vending
LSR Coffee Café E.g., Starbucks, Caribou Coffee, Tully’s
Education College/University
K-12 Schools
Excludes any vending
LSR Specialty Smoothie, other specialty beverage shops
Donut shops
Healthcare Hospitals
Nursing homes
Continuous care retirement centers
Excludes any vending
Full Service Restaurants (FSR)
Midscale
Casual dining
Fine dining
Other Supermarket foodservice
Retailers
Military
Miscellaneous facilities
Tea Association of the USA
2
Travel & Leisure Recreation
Lodging
Airlines

Tea Association of the USA
3
Methodologies
Technomic used a number of methods to collect its data. All major players in the channel were incorporated, which include consumers, operators, distributors and manufacturers. The specifics of the sample are listed in the table.
Research Target and Type Number of Completes
Description
Consumer Focus Groups 51 Chicago, Boston and Orange County, CA Three groups of 4-5 for 45 minutes Minimum household income of $30k Represented proportionally by gender and race
Operator Focus Groups 51 51 participants (Chicago, Boston, Orange County CA) Three groups of 4-6 for 45 minutes Must have beverage purchasing authority to qualify Annual purchases exceeded $250,000. “Appropriate” representation of all segments
Structured Internet Consumer Survey
1,562 Consumers must have ordered a beverage AFH at least six times in the last eight weeks.
Demographics:
– Gender: 46% male, 54% male – Race: 73% White/Caucasian, 11% Black, 9% Hispanic, 4% other, 3%
declined to answer – Region: 21% East, 23% Midwest, 20% West, 35% South
Structured Internet Operator Survey
498 Sample represented both restaurant and beyond restaurant segments.
102 Traditional LSR, 35 LSR Coffee Cafe, and Specialty, 119 FSR, 65 Hospitals, 58 Schools, 46 Colleges, 30 B&I, 43 Recreation
Qualitative Operator Interviews 100 Focused on major chains and high volume independents. Both in-person and phone interviews were conducted
Qualitative Channel Interviews 50 Included interviews with distributors, DSD suppliers, and manufacturers of targeted beverages
Total 2,210
Category Growth and Dynamics
Tea Defined
The term “tea” will be used extensively throughout this report and it therefore becomes important to understand how it is defined for purposes of this White Paper. Tea will include hot and cold teas, as well as various formats common to foodservice. The table outlines the scope and definitions of each of these products.

Tea Association of the USA
4
Category Tea Definitions
Hot Tea Brewed hot tea, including bulk, single-serve bag, instant soluble and liquid concentrate.
Dispensed/Brewed Iced Tea Includes brewed and dispensed/fountain iced or cold tea.
Packaged Iced Tea Includes both single serve and bulk in bottles, cans, cartons, etc.

Tea Association of the USA
5
Overall Beverage Category Snapshot
In total, consumers spent over $26 billion on hot beverages in the foodservice channel in 2004. Regular coffee dominates hot beverage foodservice operator sales, its $18.8 billion representing more than 71% of the total volume. Specialty coffees sales of $5.6 billion account for the second largest share of hot beverages at 21%. The remaining 8% of the category is made up of hot tea ($1.5 billion) and hot cocoa ($630 million). In contrast, consumers spent over $52 billion on cold beverages in foodservice. Carbonated soft drinks (CSDs) accounted for over half, with milk and juice according for 12% and 14%, respectively. Iced tea represented 9% of total consumer dollars spent on cold beverages. Foodservice Hot Beverage Market (RSE)* Foodservice Cold Beverage Market (RSE) 2004 Total = $26.6MM 2004 = $52.4B
*Retail Sales Equivalent Source: Technomic, Inc.
When compared with all hot and cold beverages in foodservice, tea (both hot and cold) accounts for 8% or nearly $6.2 billion of the $79 billion foodservice beverage category in 2004 terms. As noted, the amount of consumer dollars spent on tea in the foodservice channel is approximately $6.2 billion. Dispensed cold iced tea has the largest share of the total category, representing 61%, or more than $3.7 billion in consumer purchases annually.
Hot Cocoa $630MM
3%
Hot Tea $1,460MM
5%
Regular Coffee
$18,880MM71%
Specialty Coffee
$5,610MM21%
Tea $4,735MM
9%
Bottled Water
$3,750MM7%
CSD $27,150MM
52%
Milk $6,825MM
12%
All Other $2,940MM
6%
Juices $7,435MM
14%

Tea Association of the USA
6
Over the past three years, the highest growth in consumer expenditures has been among the iced teas (both single serve and dispensed.) Hot tea has grown only slightly less over that same time frame.
Category Category Size (RSE - $MM)
Dollar Share
Gallons (Millions)
2001-2004 Growth
2005-2008 Growth*
Hot Tea $1,460 24% 320 4.0% 6.0%
Dispensed/Brewed Iced Tea 3,780 61 1,200 5.0 7.0
Packaged/Cold/Iced Tea 955 15 750 5.0 6.0
Total Tea Market $6,195 100% 2,467 4.8% 6.6%
*Nominal compound annual growth rate
Going forward, Technomic expects tea growth to accelerate somewhat. Through 2008, growth of both hot and cold tea should average 6-7% per year (in sales dollars, not volume). This compares very favorably with many other beverage types, as shown in the chart below.
Projected Annual Nominal Growth 2005-2008
Hot Beverage Cold Beverage
Many of the factors impacting growth will be discussed in the next several sections, but key trends in each category include the following:
Category Key Trends/Drivers of Growth
Hot Tea
Emerging as a specialty hot beverage, with numerous varieties being offered by operators. Cha and green teas are particularly popular.
Hot tea growth being strengthened by perceived health benefits – lowering blood pressure, reducing cancer risk, increasing metabolism.
g
1.3%
8%
7%
1%
CSD Smoothie's Iced Tea Milk
g
2.5%
6.0%
12%
1%
Regular Coffee Hot Tea SpecialtyCoffee
Hot Cocoa

Tea Association of the USA
7
Dispensed/Brewed Iced Tea
Often only one head dedicated to iced tea product; limited in number of varieties that can be offered at an operation due to limited number of dispensers.
Often an acceptable consumer alternative to carbonated soft drinks
Highly profitable to the operator.
Packaged/Cold/Iced Tea Higher-end, boutique brands thriving (i.e. SoBe, Snapple, China Mist, Arizona, etc.)
Flavor and variety proliferation

Tea Association of the USA
8
Overall Tea Sales by Operator Type
Technomic defines the foodservice channel to include both restaurants (both full service and limited service) and “beyond restaurant” segments such as business & industry, recreation, education, healthcare and other segments where foodservice is not the primary focus of the host site. In terms of tea consumption and sales, tea is heavily concentrated in the restaurant channel. Approximately 69% of consumer dollars spent on tea come from the restaurants segments. Full-service restaurants (FSRs) account for 51% and limited service (LSR) for 18% of this total. While the share of limited-service usage is much lower than full service restaurants, sales still total over $1.1 billion. at 18%, it is still a significant share for overall foodservice usage. The beyond restaurant (BR) channel represents 31% of tea sales in the industry, with travel and leisure (which includes hotels) representing about half of this channel’s usage at 15% of total tea sales. The remaining usage is dispersed relatively evenly across the beyond restaurant channel.
Segment Tea*
$MM (Sales) % Share
Restaurants
LSR 1,120 18%
FSR 3,140 51
Total Restaurants 4,260 69
Beyond Restaurants
Travel and Leisure 950 15
Business and Industry 350 6
Education 325 5
Healthcare 225 4
Other 85 1
Total Beyond Restaurants 1,935 31
Total $6,195 100%
*Includes hot tea, dispensed iced tea and packaged iced tea
Segmentation by Tea Types
The table below separates the three major categories of tea to highlight segment-usage differences. Both hot tea and dispensed iced tea are highly concentrated in the restaurant segments – particularly in FSRs. In the dispensed iced tea category, 78% of sales come from restaurants, with full-service restaurants accounting for 63% of the total usage compared to 15% of LSRs. Packaged ice teas, however, shift more toward the beyond restaurant channel. Approximately 66% of packaged/single serve tea is found in various BR segments, compared to only 34% of sales in restaurants. The grab-and-go nature of these beverages, along with the concession and

Tea Association of the USA
9
cafeteria style of BRs account for this large gap in sales relative to restaurants. It does also indicate several opportunities for further penetration in both restaurants and beyond restaurants based upon different product formats.

Tea Association of the USA
10
Segment Hot Tea
Dispensed/Brewed
Iced Tea
Packaged
Iced Tea
$MM % share $MM % share $MM % share
Restaurants
LSR $380 26% $555 15% $185 $19
FSR 600 41 2,400 63 140 15
Total Restaurants 980 67 2,955 78 325 34
Beyond Restaurants
Travel and Leisure 250 17 400 11 300 31
Business and Industry 50 3 150 4 150 16
Education 50 3 200 5 75 8
Healthcare 100 7 50 1 75 8
Other 30 2 25 1 30 3
Total Beyond Restaurants 480 33 825 22 630 66
Total $1,460 100% $3,780 100% $955 100%
Format/Shares of RSE
From a format share perspective, hot tea is almost exclusively purchased/used in foodservice in small, individual bags. There are differences between dispensed and packaged formats, however. Dispensed tea is the most common format, accounting for 65% of RSE. Bag-in-box accounts for a third of RSE share, and liquid concentrate usage is minimal. Single serve is the most common format for packaged iced tea at 98%.
Format Share of RSE - Dispensed Format Share of RSE - Packaged
Bulk2%
Single Serve98%
Bag-in-Box30%
Brewed Liquid
Concentrate5%
Brewed65%

Tea Association of the USA
11
Consumer Attitudes and Practices Foodservice consumers are more likely to purchase tea products as part of a meal, instead of purchasing it separately, which is typical with all beverages. The coffee/café LSR sub-segment departs from this trend, as more consumers tend to purchase hot tea and packaged ice tea without a meal. From an overall foodservice view, which includes restaurants and beyond restaurants, dispensed iced tea, on average, is ordered the most frequently by consumers. Packaged iced teas are purchased more frequently in the beyond restaurant segment, with a meal, than in the restaurant segment.
Consumer Purchasing Frequency % Consumers Purchasing Tea in Foodservice in the Last Two Months
Segment
Hot Tea Dispensed /Brewed Iced Tea Packaged Iced Tea
With Meal
Beverage Only With Meal
Beverage Only With Meal
Beverage Only
LSR Traditional 3 1 21 4 2 0
Quick Casual 12 1 33 2 5 1
Coffee Café 4 8 3 5 2 3
Specialty LSR 5 5 3 1 3 3
FSR 13 1 41 1 2 0
B&I 9 4 13 4 13 8
Education 12 4 21 3 15 3
Hospitals 7 5 13 3 8 6
Consumer Tea Purchasing Trends/Consumption
Consumers were asked if they are consuming “more,” “less” or “about the same amount” of tea compared to two years ago. Data suggests that consumers believe they are actually drinking about the same amount as in the past. Using Technomic’s “net” analysis, consumers believe that their consumption of hot tea is down and iced tea is up.
Beverage Have Purchased in
Last 2 Years More Less “Net”
Hot Tea 47 16 33 -17

Tea Association of the USA
12
Iced Tea 71 24 20 +4

Tea Association of the USA
13
Beverage Applications
From its landmark Beverage study, Technomic identified four individual consumer beverage purchase “applications” for tea and other beverages in foodservice. While these applications are not mutually exclusive, it provides a framework upon which penetration strategies can be based.
In terms of tea, consumers tend to view it as a good choice as a meal complement, with iced tea being the number one beverage most associated with being a meal complement. Hot tea is also seen as a meal complement, although not to the same extent as iced tea. Iced tea is also rated fairly highly as a thirst quencher, with 36% of consumers naming it as one of the top three best beverages to fit this description. Areas where tea (both iced and hot) does not fare as well include as a social companion and as a “treat.”
Statement Application Iced Tea Hot Tea Top Choice
“Goes well with food” Meal Complement 38% 10% Iced Tea 38%
“Is fun to drink” Social Companion 14 3 Regular CSD (28%)
“Is a special treat” Snack 4 4 Hot Specialty Coffee (44%)
“Most thirst quenching” Thirst Quencher 36 2 Bottled Water (59%)
Consumer Beverage Purchasing Factor Importance
From an all-beverage perspective, consumers select beverages primarily based upon their preference or “taste” for a particular beverage at the time of purchase. In the consumer survey, price, in most cases was the second most important reason for choosing a beverage. In the
Meal Complement
Social Companion
Thirst Quencher
Snack

Tea Association of the USA
14
traditional and quick casual LSR sub-segments, free refills and bundling show increasing levels of importance.

Tea Association of the USA
15
Factor Traditional
LSR
Quick
Casual
Coffee
Café
Donut
Snack FSR B&I
School/
College Hospital
Have a taste for a
particular beverage 54% 62% 81% 70% 65% 58%% 56 59%
Price 28 25 41 38 24 38 31 35
Beverage is bundled/
included with a meal 33 14 4 10 6 15 14 13
Beverage goes well with food
being eaten 23 32 14 28 39 21 32 22
Free refills are provided 18 26 5 7 31 13 18 20
Brand name of beverage 15 16 9 8 15 21 13 20
Portability/transportation
of beverage 12 5 21 22 1 13 11 20
Health benefits of beverage 8 13 5 7 11 13 18 9
Large sizes are available 6 4 5 5 3 7 5 9
Beverage looks new or
interesting 1 4 13 4 3 1 0 1
Beverage is being promoted <1 1 4 2 0 0 1 1
Beverage Daypart Associations
Tea products have a relatively high association with all dayparts. The table below shows the percentage of consumers who associate tea products with the daypart choices in the survey. Iced tea, at 39%, was the top associated beverage for dinner, and the second top consumer association for lunch (38%). While associations do not necessarily follow purchasing behaviors, the findings are still positive for tea products
What Beverages Do You Associate with the Following? (% Associating)
Daypart Choice Hot Tea Iced Tea Top Three Associations
Breakfast 19% 4%
Regular Hot Coffee 60%
Fruit Juice 42%
Hot Tea 19%
Lunch 7 38
Regular CSD 40%
Iced Tea 38%
Diet CSD 32%
Dinner 14 39
Iced Tea 39%
Regular CSD 35%
Regular Hot Coffee 34%

Tea Association of the USA
16
All Dayparts 20 20
Regular Hot Coffee 42%
White Milk 39%
Bottled Water 38%

Tea Association of the USA
17
Beverage Venue Associations
From a venue perspective, consumers associate iced tea with a sit-down meal, which is second only to regular hot coffee. A fifth of consumers associate hot tea with a sit-down meal. And about a quarter of consumers associate hot and iced tea with company and school cafeterias.
Which Beverages Do You Associate with the Following Venues? (% Associating)
“Best For…” Hot Tea Iced Tea Top Three Associations
Drive-Thru 1% 20%
Regular CSD 61%
Diet CSD 47%
Regular Hot Coffee 21%
Sit-Down Meal 20 37
Regular Hot Coffee 48%
Iced Tea 37%
Regular CSD 28%
Company or School Cafeteria 26 25
White Milk 35%
Regular Hot Coffee 34%
Regular CSD 30%
Consumer Health Associations Regarding Beverages
While tea products are not necessarily associated as among the top three healthiest beverages, they are also not perceived as unhealthy. It is encouraging to learn that 13% of consumers report they should be drinking more iced tea, particularly when more than half of consumers report they should be drinking less regular carbonated soft drinks. In focus groups, consumers generally perceived iced tea as a healthy option to other beverage choices, along with water, milk and fruit juice. Opportunities exist to build awareness around the viability of iced tea as a “healthier” option to carbonated soft drinks, and a substitute for bottled water. And with regard to hot tea, opportunities exist to position it as a replacement for regular hot coffee, considering that 26% of consumers believe they should be drinking less coffee.
Which Beverages Do You Associate with the Following? (% Associating)
Statement Hot Tea Iced Tea Top Three Associations
“Healthy” 14% 1%
Vegetable Juice 56%
White Milk 46%
Fruit Juice 42%
“I should be drinking more of this.” 9 13 Bottled Water 58%
White Milk 29%

Tea Association of the USA
18
Fruit Juice 30%
“I should be drinking less of this.” 2 2
Regular CSD 54%
Diet CSD 29%
Regular Hot Coffee 26%
Tea Association of the USA
19
Operator Attitudes and Practices
This section outlines the findings from in-depth interviews conducted with operators from each of the segments included in the scope of the study.
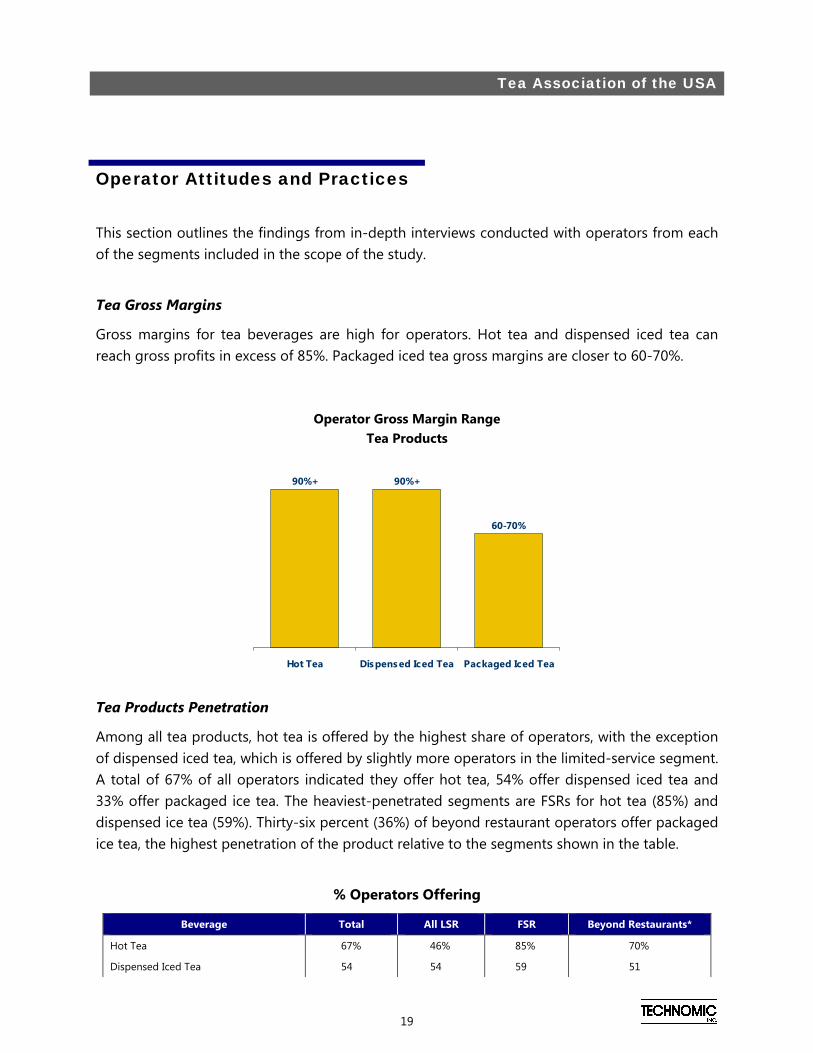
Tea Gross Margins
Gross margins for tea beverages are high for operators. Hot tea and dispensed iced tea can reach gross profits in excess of 85%. Packaged iced tea gross margins are closer to 60-70%.
Operator Gross Margin Range Tea Products
Tea Products Penetration
Among all tea products, hot tea is offered by the highest share of operators, with the exception of dispensed iced tea, which is offered by slightly more operators in the limited-service segment. A total of 67% of all operators indicated they offer hot tea, 54% offer dispensed iced tea and 33% offer packaged ice tea. The heaviest-penetrated segments are FSRs for hot tea (85%) and dispensed ice tea (59%). Thirty-six percent (36%) of beyond restaurant operators offer packaged ice tea, the highest penetration of the product relative to the segments shown in the table.
% Operators Offering
Beverage Total All LSR FSR Beyond Restaurants*
Hot Tea 67% 46% 85% 70%
Dispensed Iced Tea 54 54 59 51
90%+90%+
60-70%
Hot Tea Dispensed Iced Tea Packaged Iced Tea

Tea Association of the USA
20
Packaged Iced Tea 33 28 30 36
*Recreation, B&I, Education, Hospitals

Tea Association of the USA
21
Variety of Tea Products Offered
When offered, operators provide the greatest varieties of hot tea. From an all-segment perspective, operators, on average, offer 3.2 varieties/flavors of hot tea, 2 of packaged iced tea and 1.5 of dispensed iced tea. The most varieties of any tea product is offered in Beyond restaurants, where typically 3.9 types of hot tea are purchased/sold by operators.
Average Number of Varieties/Flavors Offered
Beverage Total All LSR FSR Beyond Restaurants*
Hot Tea 3.2 1.4 2.7 3.9
Dispensed Iced Tea 1.5 1.0 1.0 1.0
Packaged Iced Tea 2.0 2.5 1.0 2.0
*Recreation, B&I, Education, Hospitals
Sizes of Dispensed/Poured Tea Products
There are some notable differences between the most common sizes of hot and cold dispensed tea beverages. Operators typically sell the 8 ounce cup for hot tea and the 16 ounce cup for cold tea. The second most common size sold is 12 ounces for both products. The third most common sizes tend to become smaller for hot tea (less than 8 ounces) and larger for dispensed iced tea (20 ounces).
% Operators Offering Size
Beverage Most Common Size Second Common Size Third Common Size
Hot Tea 8 oz. 12 oz. <8 oz.
Dispensed Iced Tea 16 oz. 12 oz. 20 oz.
Tea Volume Status
As a whole, operators who carry tea products have reported that volume, for the most part, has held steady over the last two years. Technomic has analyzed each beverage based on net responses to whether volume has increased, decreased or stayed the same over the past two years. Overall, all tea beverage have experienced positive “nets.” Packaged iced tea has the greatest number of operators that have noted an increase, with 30% of operators reporting an increase. Dispensed iced tea has also seen volume increases, according to 28% of operators, while only 20% report an increase in hot tea volume. The largest

Tea Association of the USA
22
“net” of operators (difference between those reporting an increase and a decrease) is highest in both iced tea categories.

Tea Association of the USA
23
% Operators Indicating Beverage Volume Has….
Tea Product Increased Decreased “Net”
Hot Tea 20% 6% +14%
Dispensed Iced Tea 28% 4% +24%
Packaged Iced Tea 30% 7% +23%
Base: Operators offering a specific beverage
Hot and Cold Beverage Selection Criteria
The table below shows the selection criteria for hot and cold beverages in general. This criteria has been further broken down into three tiers of importance: Critical, important and tertiary. The most critical selection criteria for beverages is that the product taste great. Other critical factors (according to more than 80% of operators) include the ability to sell the product at a reasonable price, appropriate foodservice packaging, high consumer demand and high profitability potential.
Selection Criteria Top 2 Box
Comments
Critical
Is Great Tasting 93% “The products have to taste good for it to sell –
that’s obvious.”
Can Be Sold at a Reasonable Price 85 “Otherwise you set the price too high and they
are too expensive.”
Has Appropriate Packaging 85 “Beverages need to stay hot or cold and
be transportable.”
Has High Patron Demand 84 “If customers don’t ask for it, we just replace it with
something else.”
Offer High Profit Margins 82 “We’re always looking for products that are low
maintenance but are very profitable.”
Important
Has a Strong Consumer Brand Name 78 “You can charge a higher price if customers know
the brand.”
Company Offers Strong Manufacturer Support
77 “Not just promotional programs, but placement
ideas.”
Company Offers Strong, Reasonable Equipment Programs.
77 “If we have a broken fountain system, we want it
fixed fast and the first time.”
Offered in a Variety of Flavors 75 “You want to offer a variety of products to
customers. Otherwise, they may not come back.”
Tertiary
Is Rated Healthy by Consumers 61 “Consumers will pay a premium if they think it is
good for them.”
Meets Consumer Nutritional Requirements 61 “With the obesity issue hovering, it’s important
that
we offer healthy options.”

Tea Association of the USA
24
Contains Vitamins and Minerals 52
“Enhanced smoothies with vitamins added allow
us to differentiate our products. We can also
charge higher prices.”
Is “Trendy” 51 “Red Bull is popular with 20-somethings. It’s on-
trend.”

Tea Association of the USA
25
Beverage Distribution
With cold beverages, broadliners and systems distributors play a large role in distribution, with over half of volume going through this channel. Likewise, approximately 55% of all hot beverage volume in foodservice is sourced through broadline and systems distributors. However, secondary distribution channels for hot and cold beverages begin to diverge from there. Direct-store delivery represents more than a third of all volume for hot beverages, while bottlers represent a quarter of all cold beverage volume.
Beverage Sourcing Cold Beverage Distribution Hot Beverage Distribution
Single Sourcing of Beverages
Using multiple sources adds significant complexity to an operator’s business. More than half of all operators are looking for ways to reduce purchasing complexity. Fifty five percent (55%) indicate they would prefer to purchase all beverages from a single source.
“We’d like to be able to purchase all beverages from a single source”
Top 3 Box Bottom 3 Box
Total 55% 33%
LSR 60 29
FSR 58 31
Beyond Restaurants 52 44
Base: Top 3 box of a 1 to 7 scale ranging from 1=do not agree at all to 7=completely agree
Direct Route Delivery
35%
Broadliners / Sys tems
55%
All Other Sources
10%All Other Sources
13%
Specialty Beverage
Dis tributors7%
Bottlers25%
Broadliners / Systems
55%

Tea Association of the USA
26

Tea Association of the USA
27
Healthy Option Perspective
Operators indicate that patrons are looking for healthier options in away-from-home occasions. Half of operators report their customers are looking for “better for you” beverage options. This is good news for tea products. Operators were asked in focus group sessions how they are addressing customer desires for “healthy” beverage options, and teas were mentioned as possibilities.
“Our Patrons Increasingly are Looking for “Better for You Beverage Options”
Operator Beverage Associations
Operators were asked to indicate which beverages they believed are associated with a number of statements to beverage offering criteria. All tea products have been included. In nearly all cases, dispensed CSDs were selected by more than 50% of operators. Coffee was generally selected by about a third of operators, but beyond coffee, association percentages tended to fall in the teens to the single digits.
Statement Hot Tea Packaged Iced Tea
Dispensed Iced Tea Top 2 Choices
Easiest to Sell 7% 4% 13% Dispensed CSD 54% Regular hot coffee 32%
Most Profitable 9 5 5 Dispensed CSD 58 Regular hot coffee 31
Most Demanded by Consumers 6 3 13 Dispensed CSD 55 Regular hot coffee 32
Highest Sales 6 4 4 Dispensed CSD 58 Regular hot coffee 32
Best Promotional Programs 4 2 5 Dispensed CSD 37 Regular hot coffee 16
Trendiest Beverage Today 6 4 8 Dispensed CSD 22 Regular hot coffee 18
57%
31%
Top 3 Box Bottom 3 Box

Tea Association of the USA
28
Biggest Headaches to Manage 6 2 4 Dispensed CSD 16 Regular hot coffee 13
Most Difficult Programs to Manage 7 1 4 Dispensed CSD 10 Regular hot coffee 11
Best Manufacturer 5 5 2 Dispensed CSD 46 Regular hot coffee 25
*Percent indicating each beverage was in top 3 choices

Tea Association of the USA
29
Preferred Iced Tea Format
Operators prefer dispensed or “scratch” more than three to one over bottled iced tea. Canned iced tea is preferred by only 3% of operators, and 6% have no preference. The high preference for dispensed iced tea is the perceived higher profitability of this format over packaged.
Preferred Beverage Format – Iced Tea
Bottled19%
Dispensed or "Scratch"
72%
No Preference
6%Can3%

Tea Association of the USA
30
Conclusions and Implications
Key Findings Implications
Tea products in this study represent almost $6.2 billion in consumer dollars spent away from home.
Conditions favor the overall growth in tea, but additional work will be necessary from a marketing and new product development perspective.
Dispensed/brewed iced tea is the major tea beverage consumed in foodservice, and it is also expected to grow at the most accelerated rate.
Iced tea is the most frequently purchased tea product by consumers, and consumers have reported they are consuming more of this beverage.
The outlook is positive for brewed iced tea. Developing marketing campaigns touting its major benefits will only enhance its usage.
Dispensed tea will be somewhat harder to grow, given the operational limitations at many operators (number of heads on the soft drink fountain, etc.)
Hot tea is expected to grow above the beverage category as a whole. However, there are still a large number of consumers and operators that are reporting tea usage.
There is a tremendous opportunity to grow the category by increasing penetration among the operator community.
Consumers associate beverage purchases with various applications and occasions, such as “snacking,” “meal complement,” “ meal replacement,” etc.
Understanding where tea can take advantage of its applications can provide incremental growth opportunities.
A total of 14% of consumers associate hot tea with “healthy,” and 13% indicate they should be drinking more iced tea.
Marketing efforts should tout the health benefits of tea.
Coffee appears vulnerable, given the large number of consumers that believe that “they should be drinking less.”
Operator gross margins for tea are the highest for hot tea and dispensed ice tea, both at or above 85%. Packaged iced tea margins are approximately 60-70%.
Tea products are highly profitable to operators. This factor should be incorporated into every marketing and sales story to foodservice operators.
Operators offer the most varieties of hot tea at 3.2, and iced tea varieties number from 1.5 to 2.
There may be opportunity for additional tea varieties and product innovation.
Space constraints may limit the number of new varieties taken on by operators in some instances, but there appears room for some increase.
Operators use multiple sources for beverages, however, there is a desire to rationalize suppliers.
Broadline distributors will become more involved in beverage distribution as operators demand more products be purchased from their primary source.
Operators are realizing the increasing role placed on health and nutrition by consumers. Technomic believes that health and wellness will be a driving force going forward in the foodservice industry.
Tea is viewed by many as a “healthy” alternative to other hot beverages, especially coffee.
More focus on this theme, including nutritional

Tea Association of the USA
31
benefits of tea products, should be communicated.


